Geological and Geochemical Characteristics of the Archean Basement-Hosted Gold Deposit in Pinglidian, Jiaodong Peninsula, Eastern China: Constraints on Auriferous Quartz-Vein Exploration

Abstract
1. Introduction
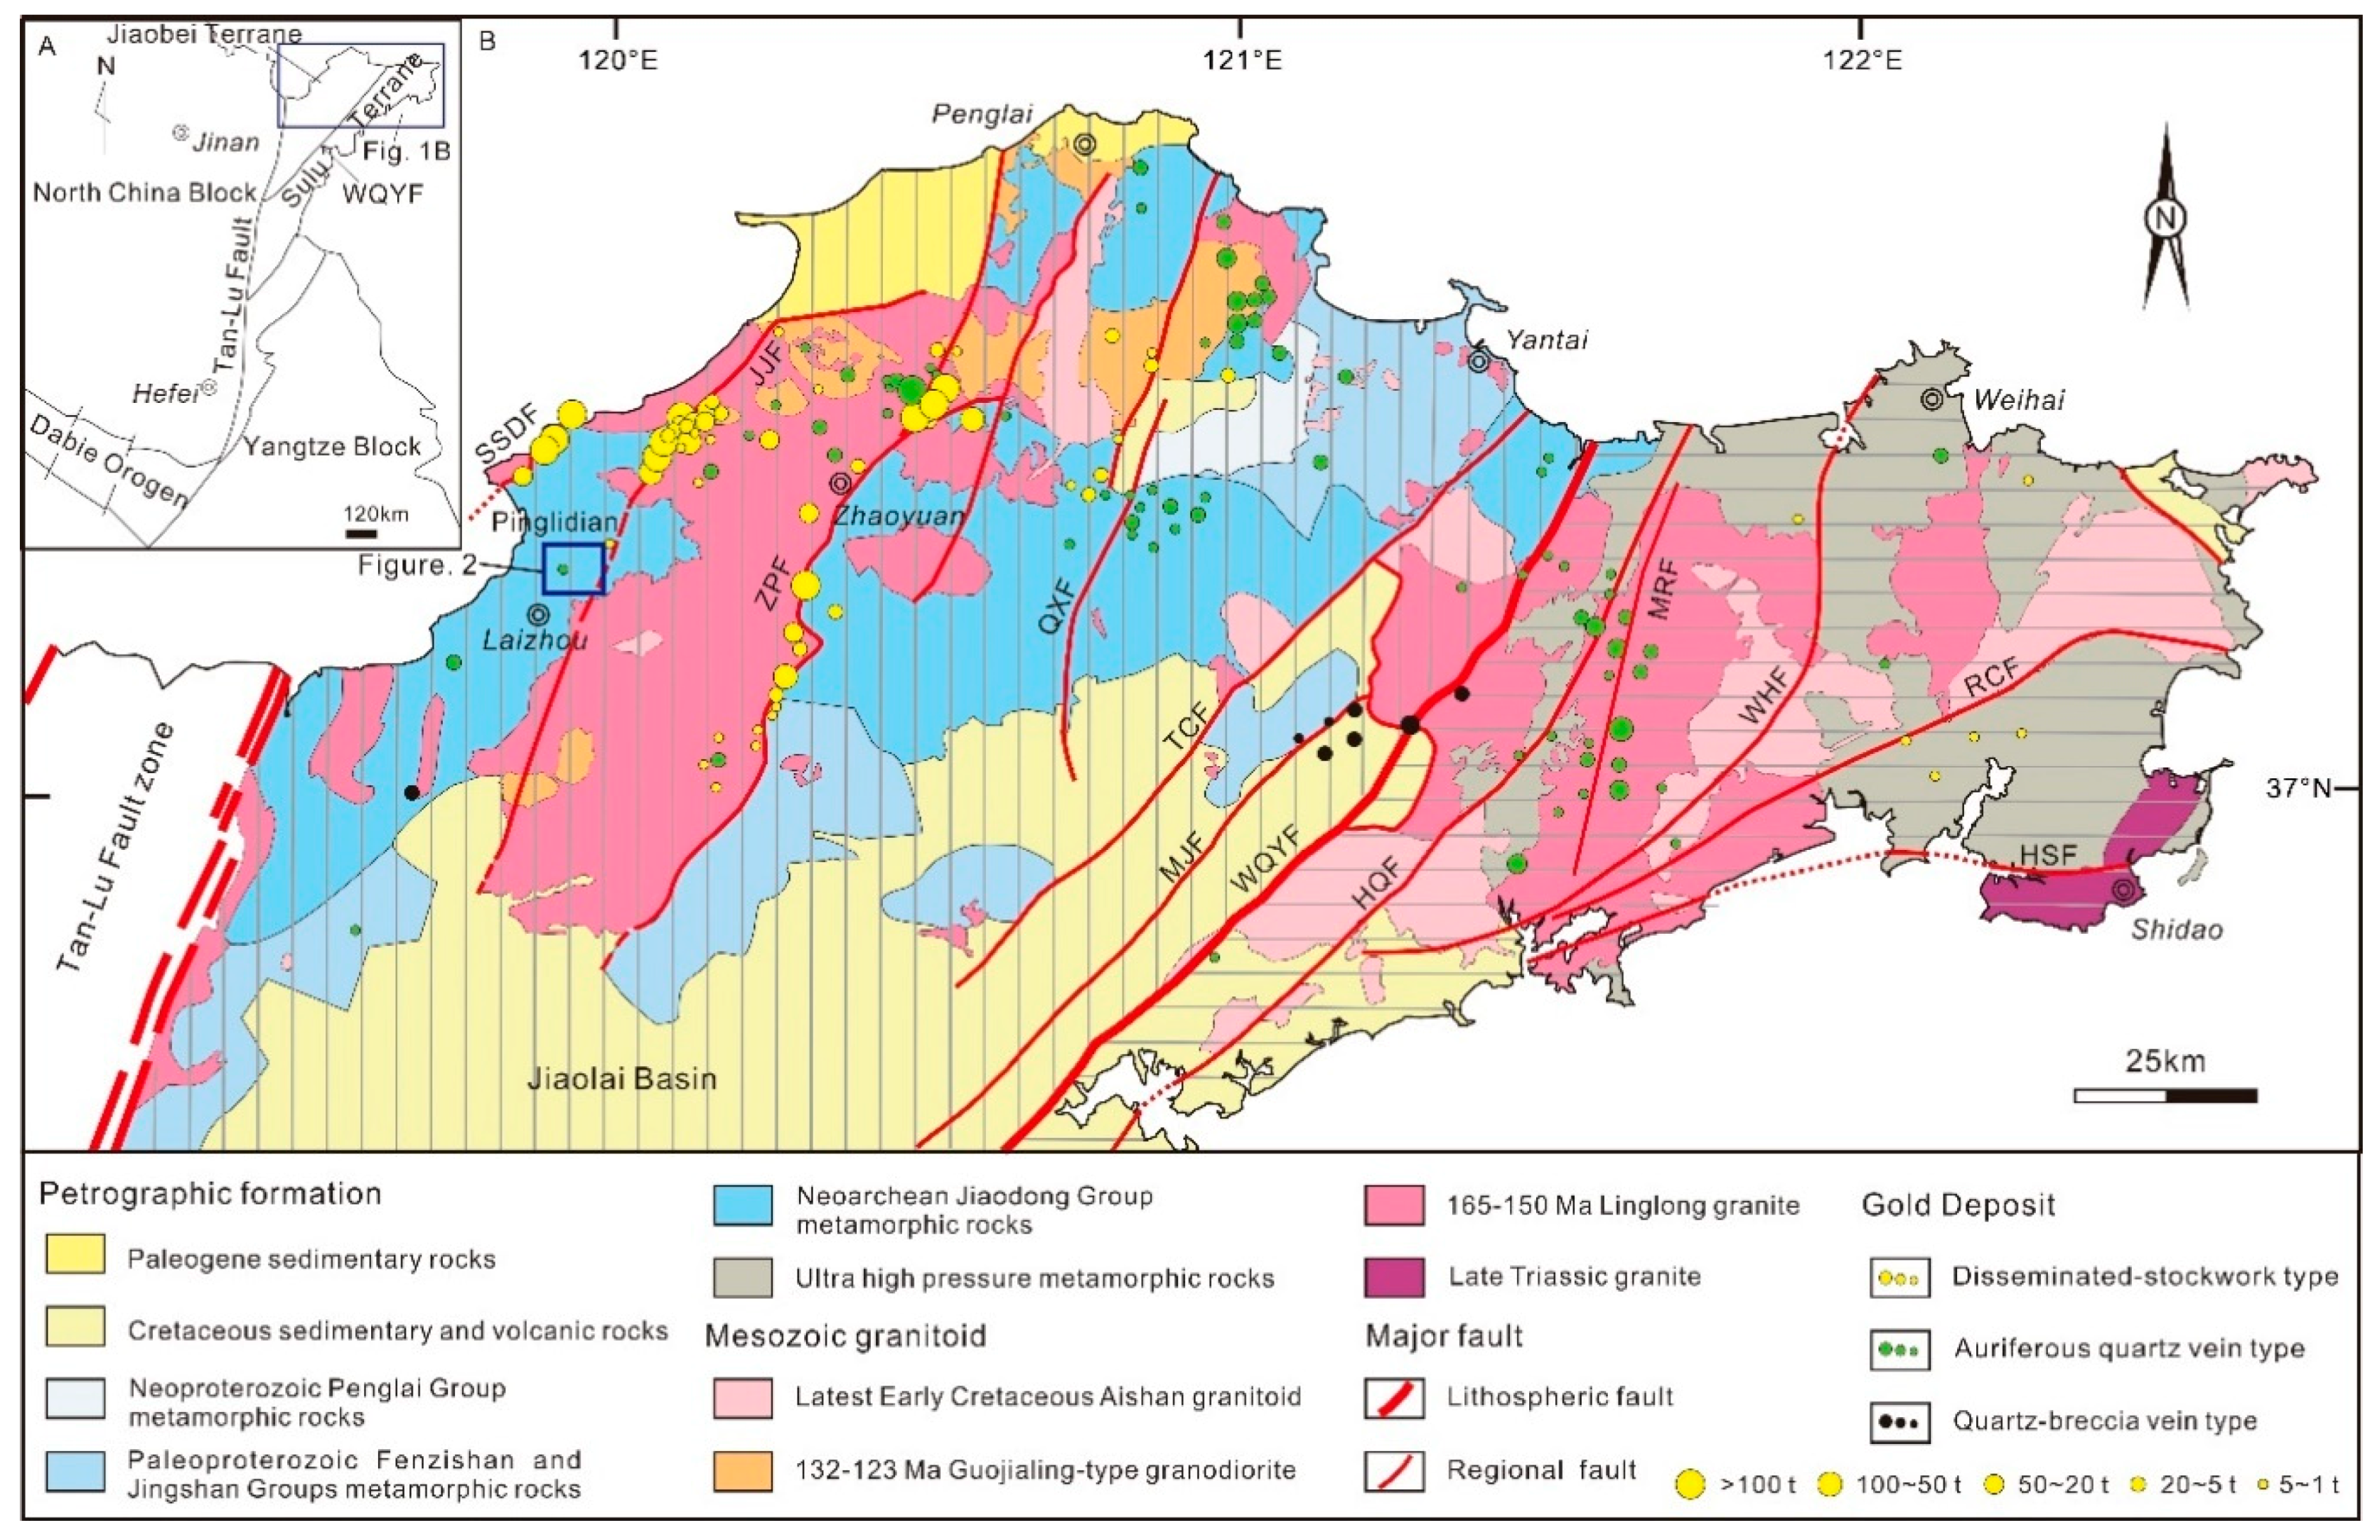
2. Regional Geology
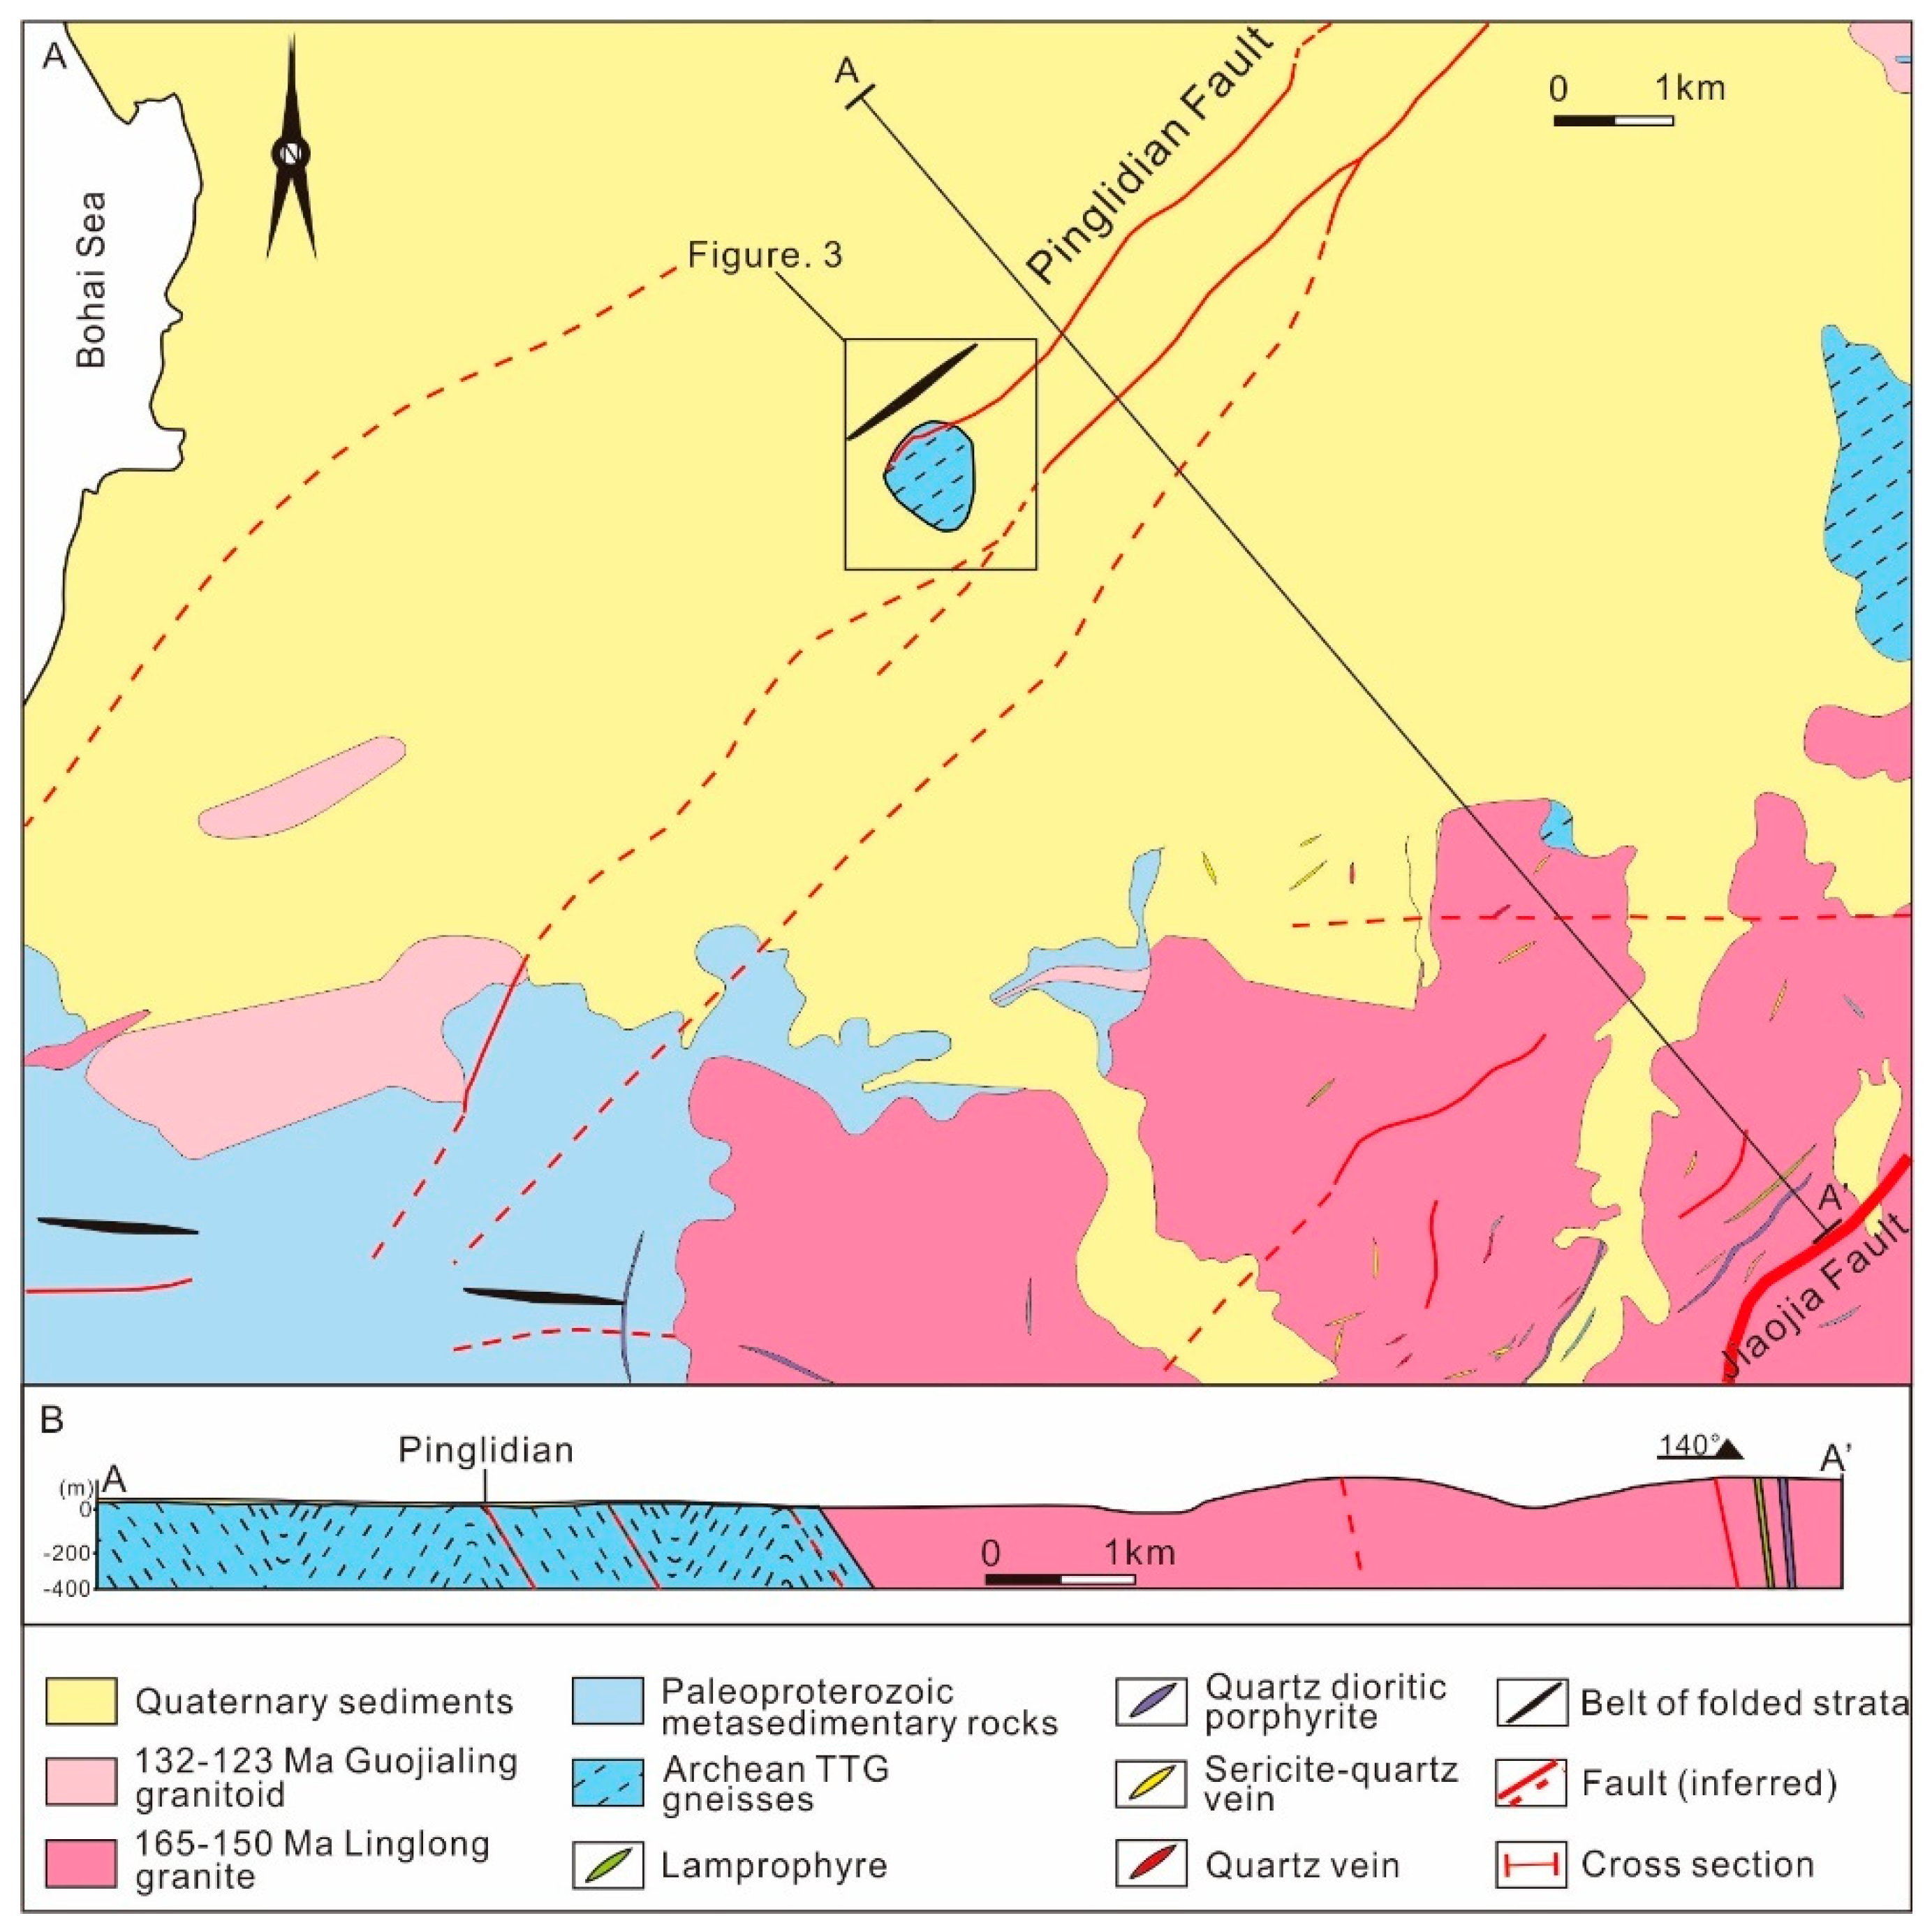
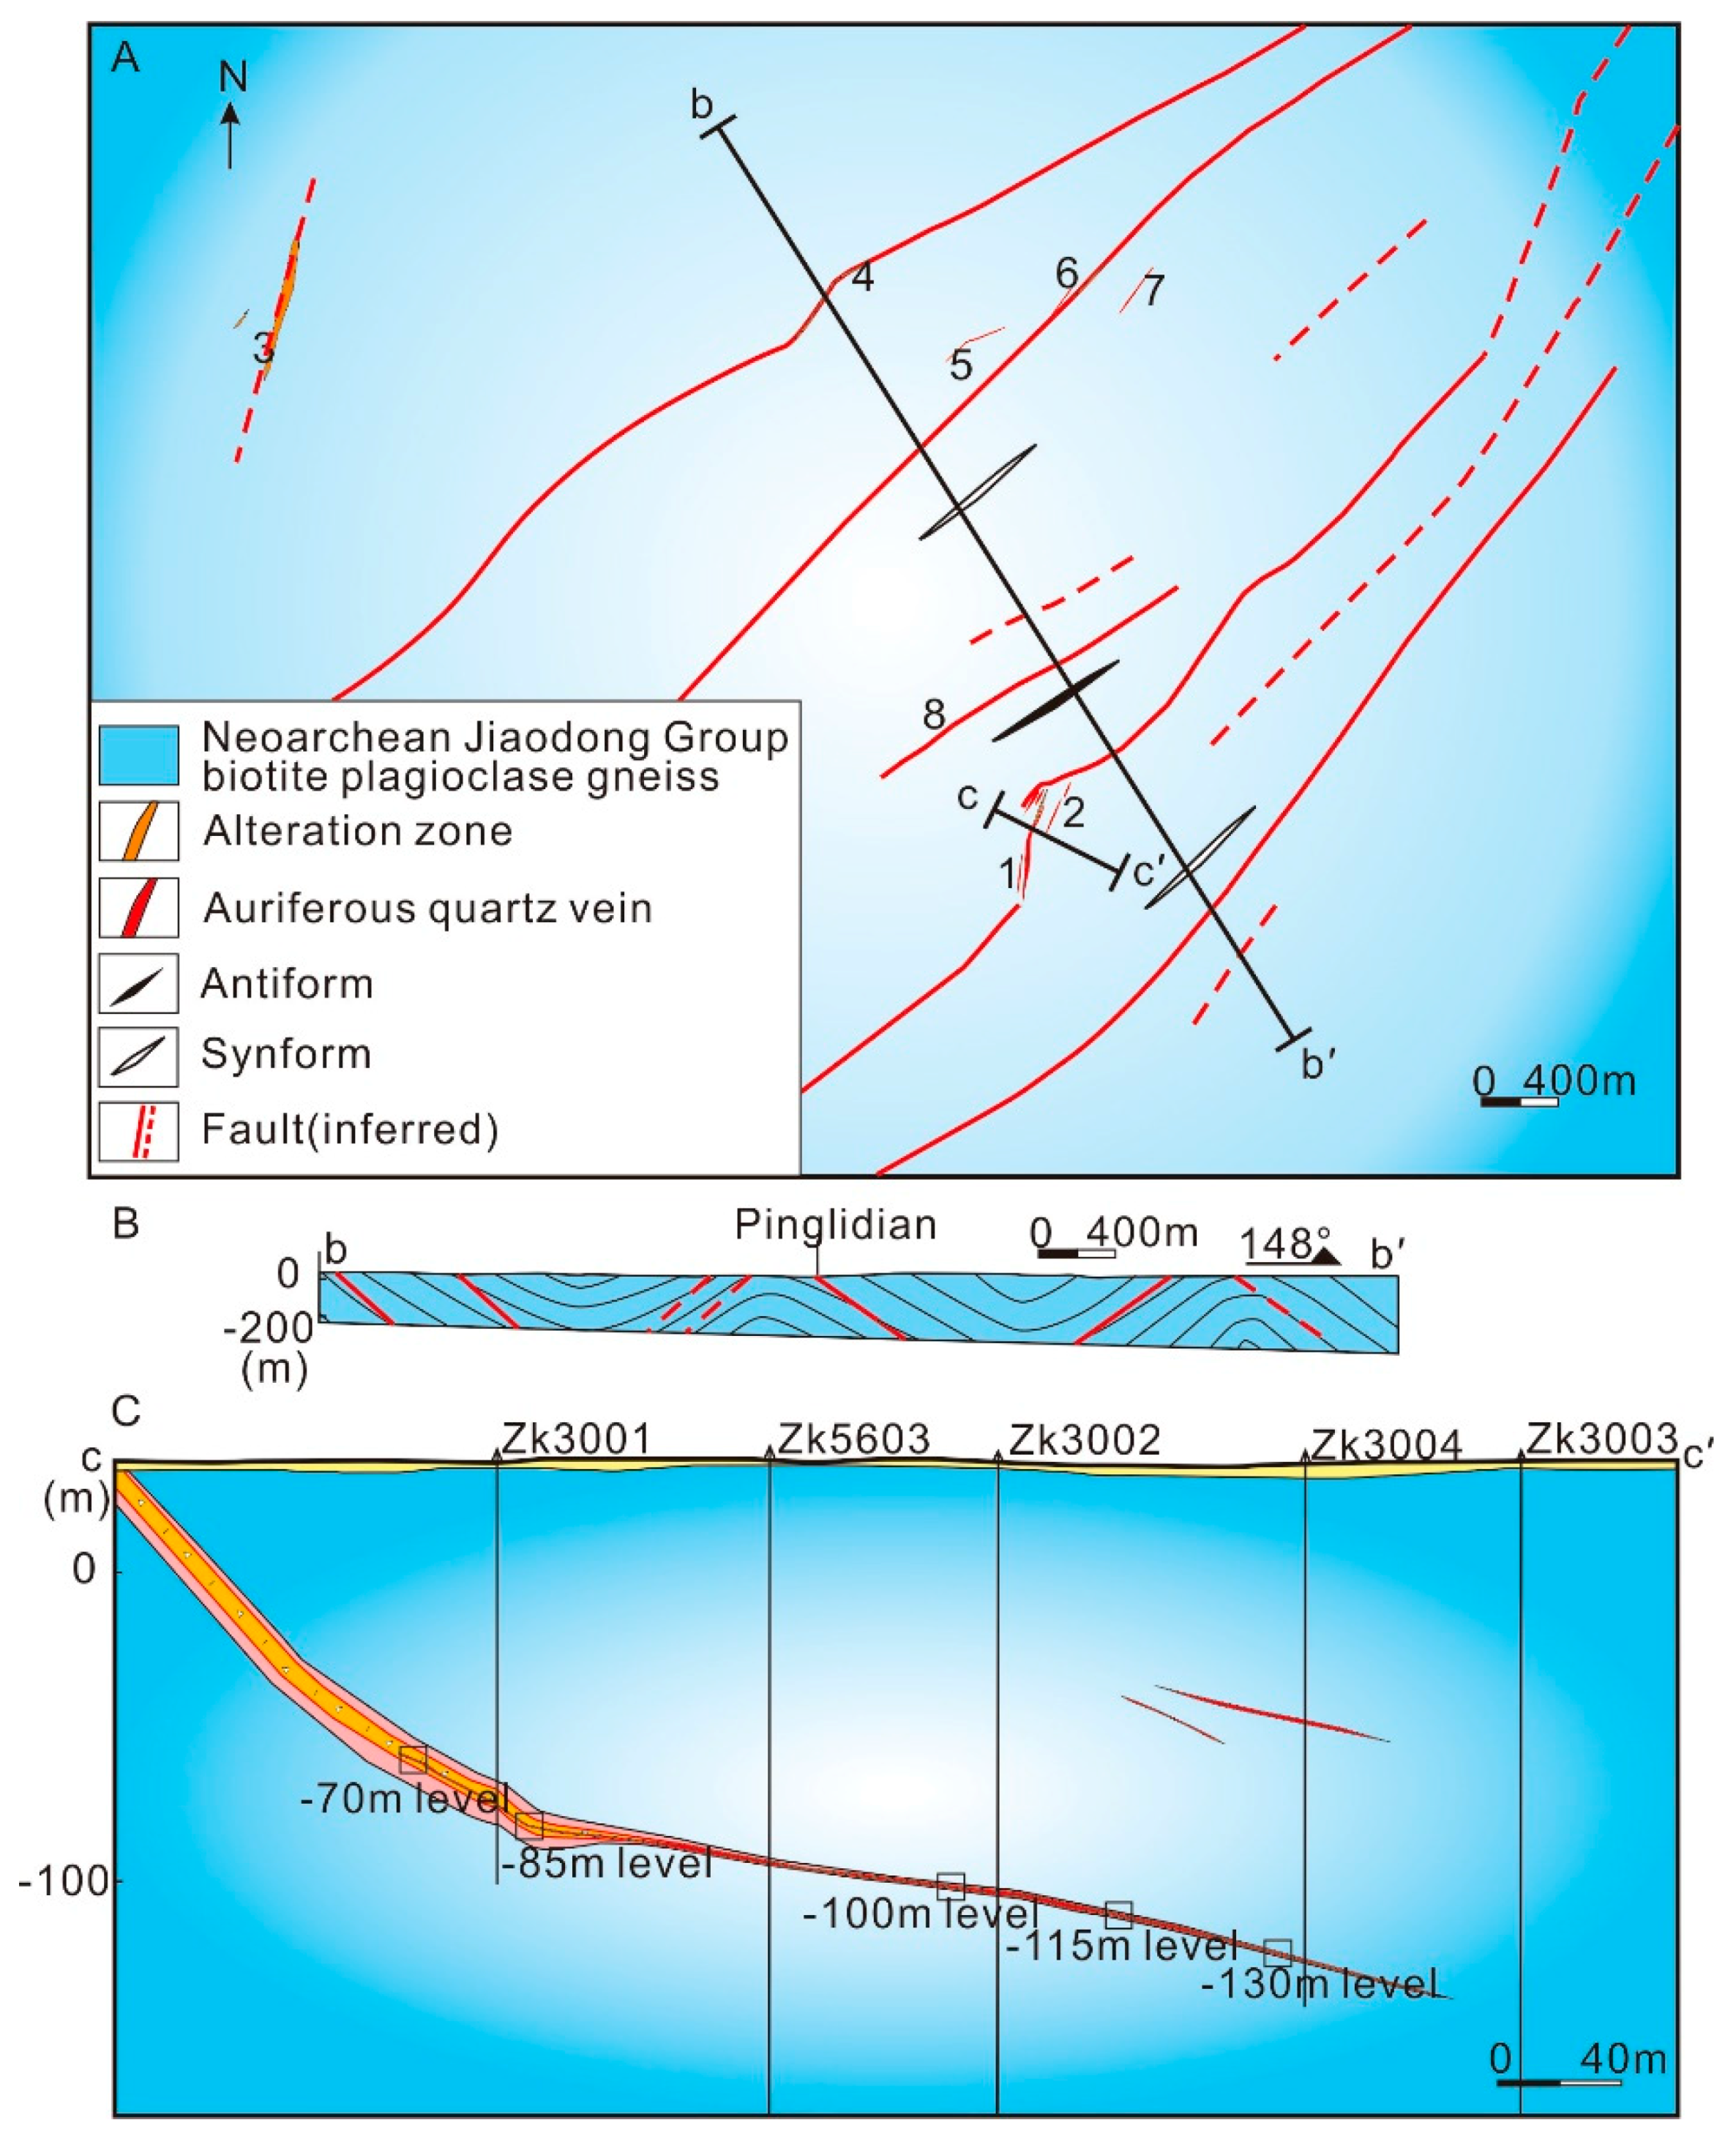
3. Geology of the Pinglidian Gold Deposit
3.1. Ore Geology
3.2. Characteristic of the Orebodies
3.3. Wall-Rock Alteration and Gold Mineralization
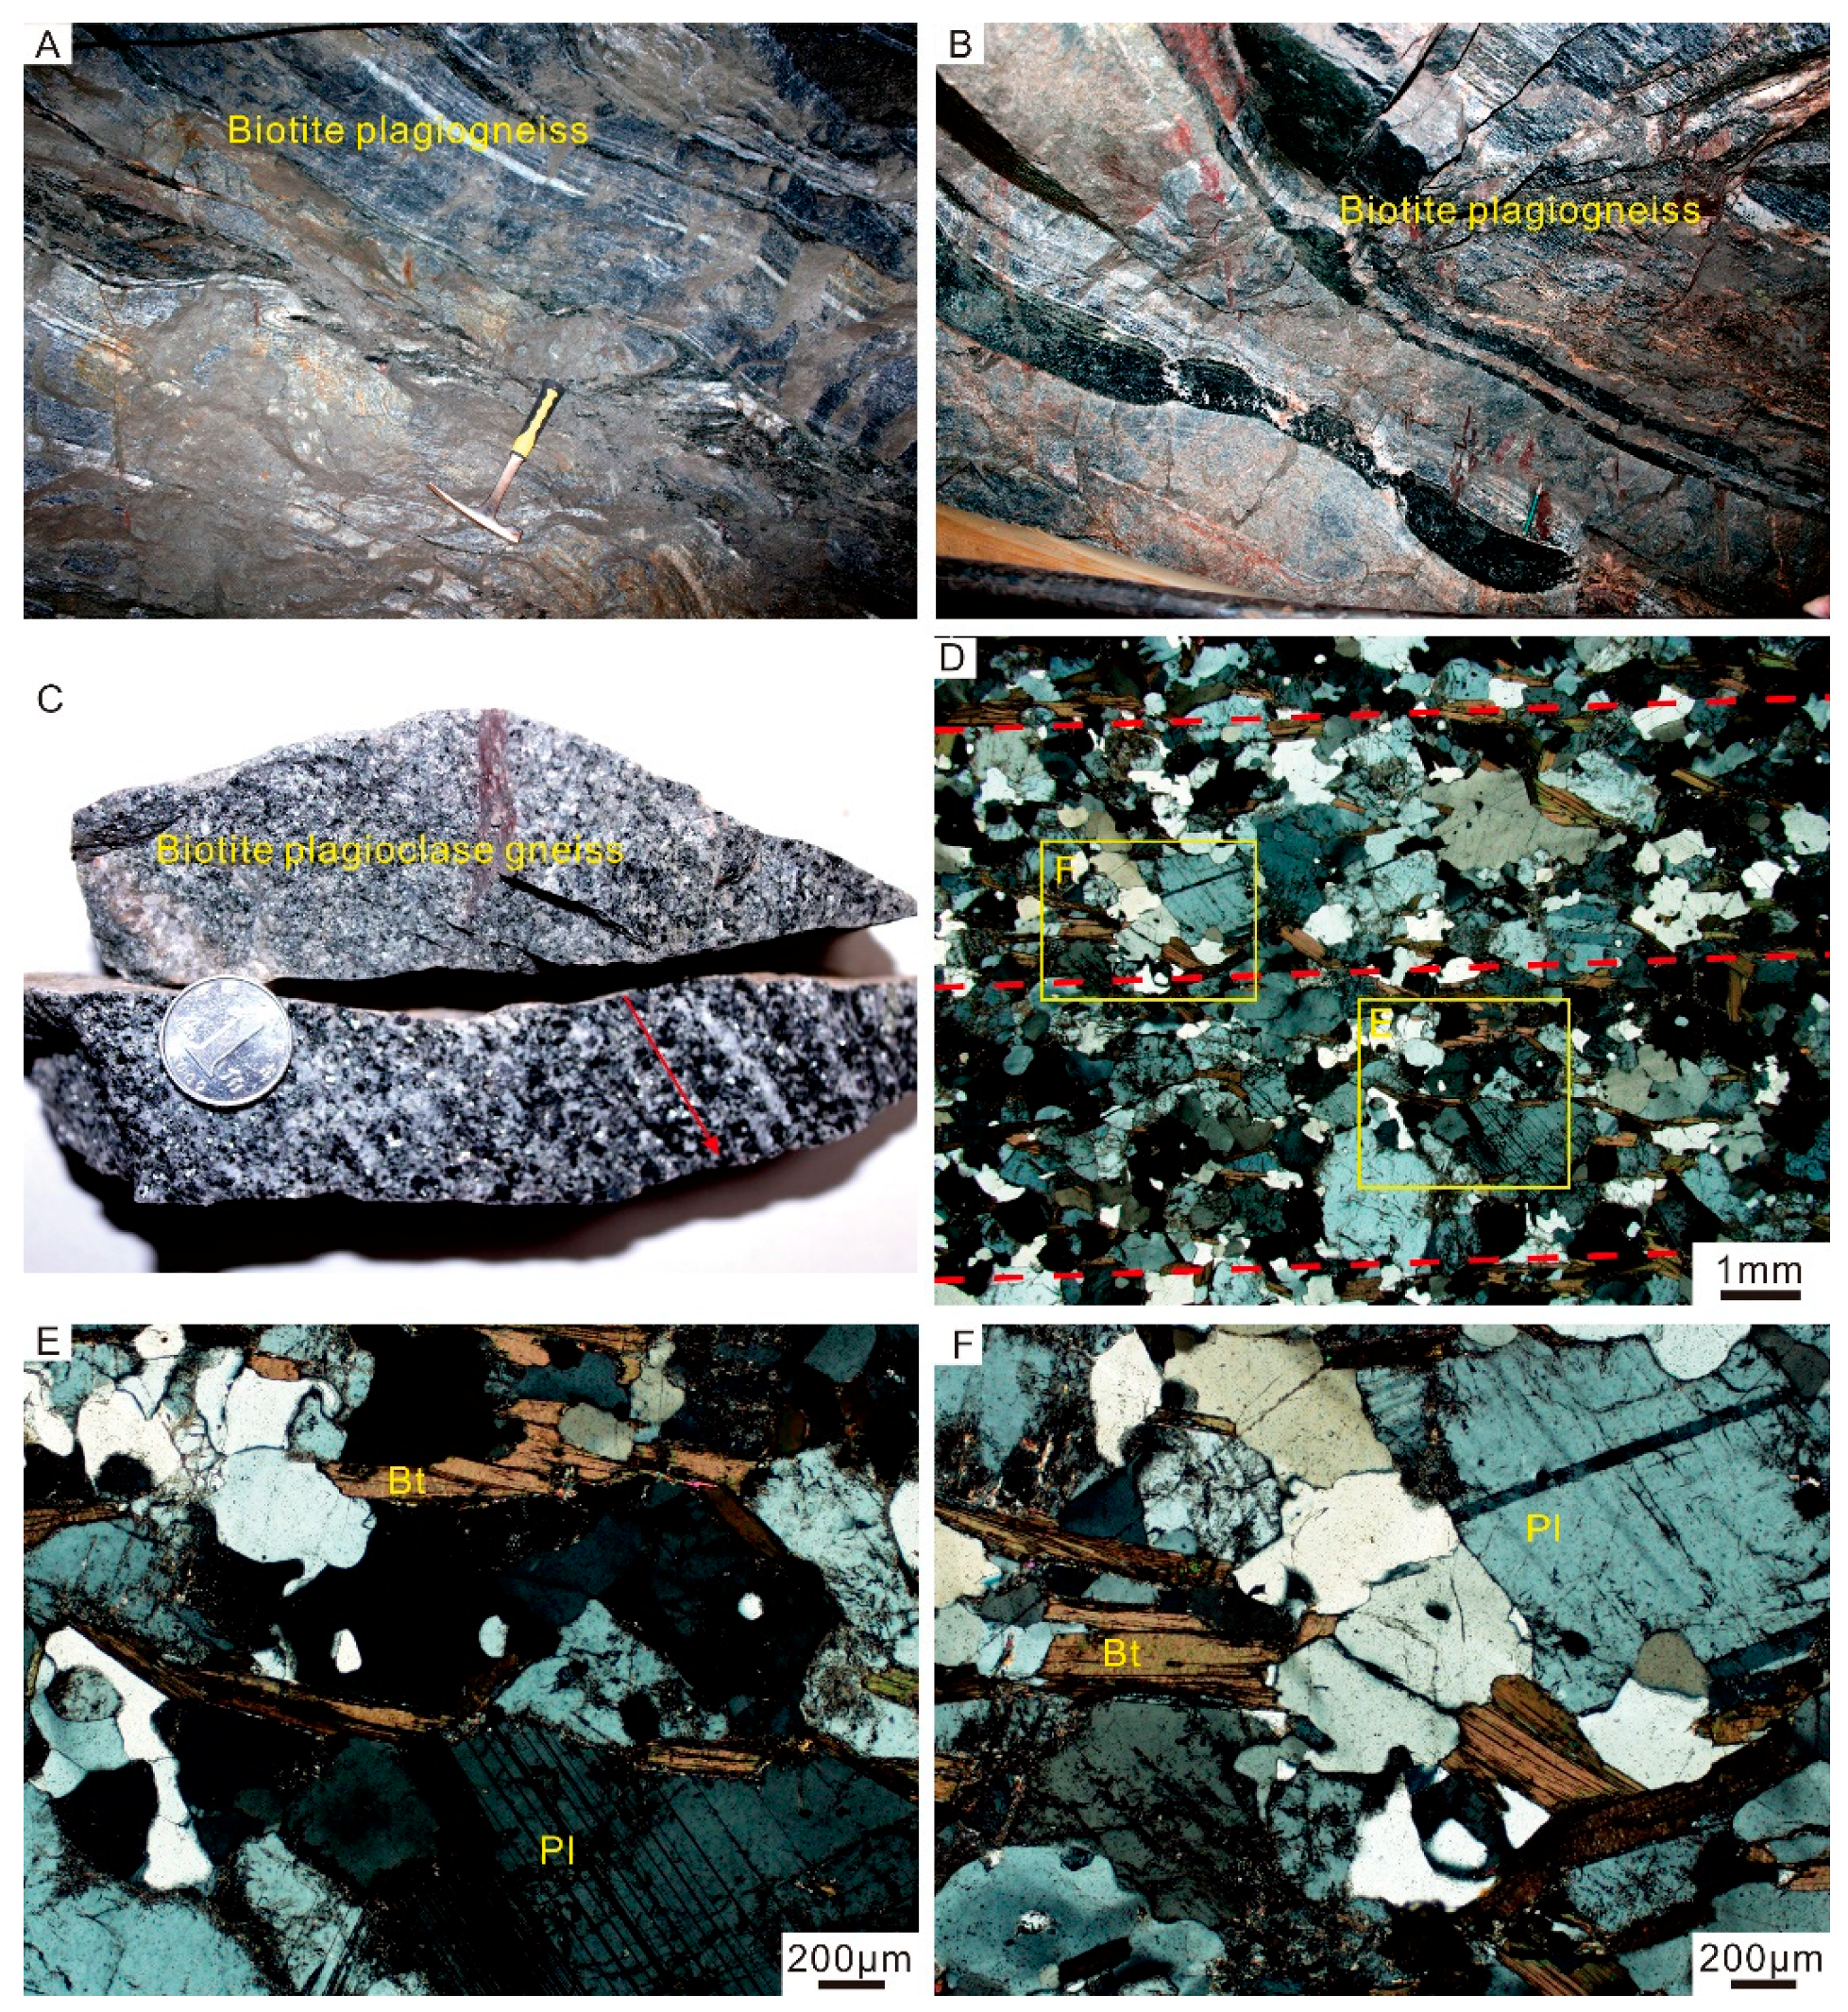
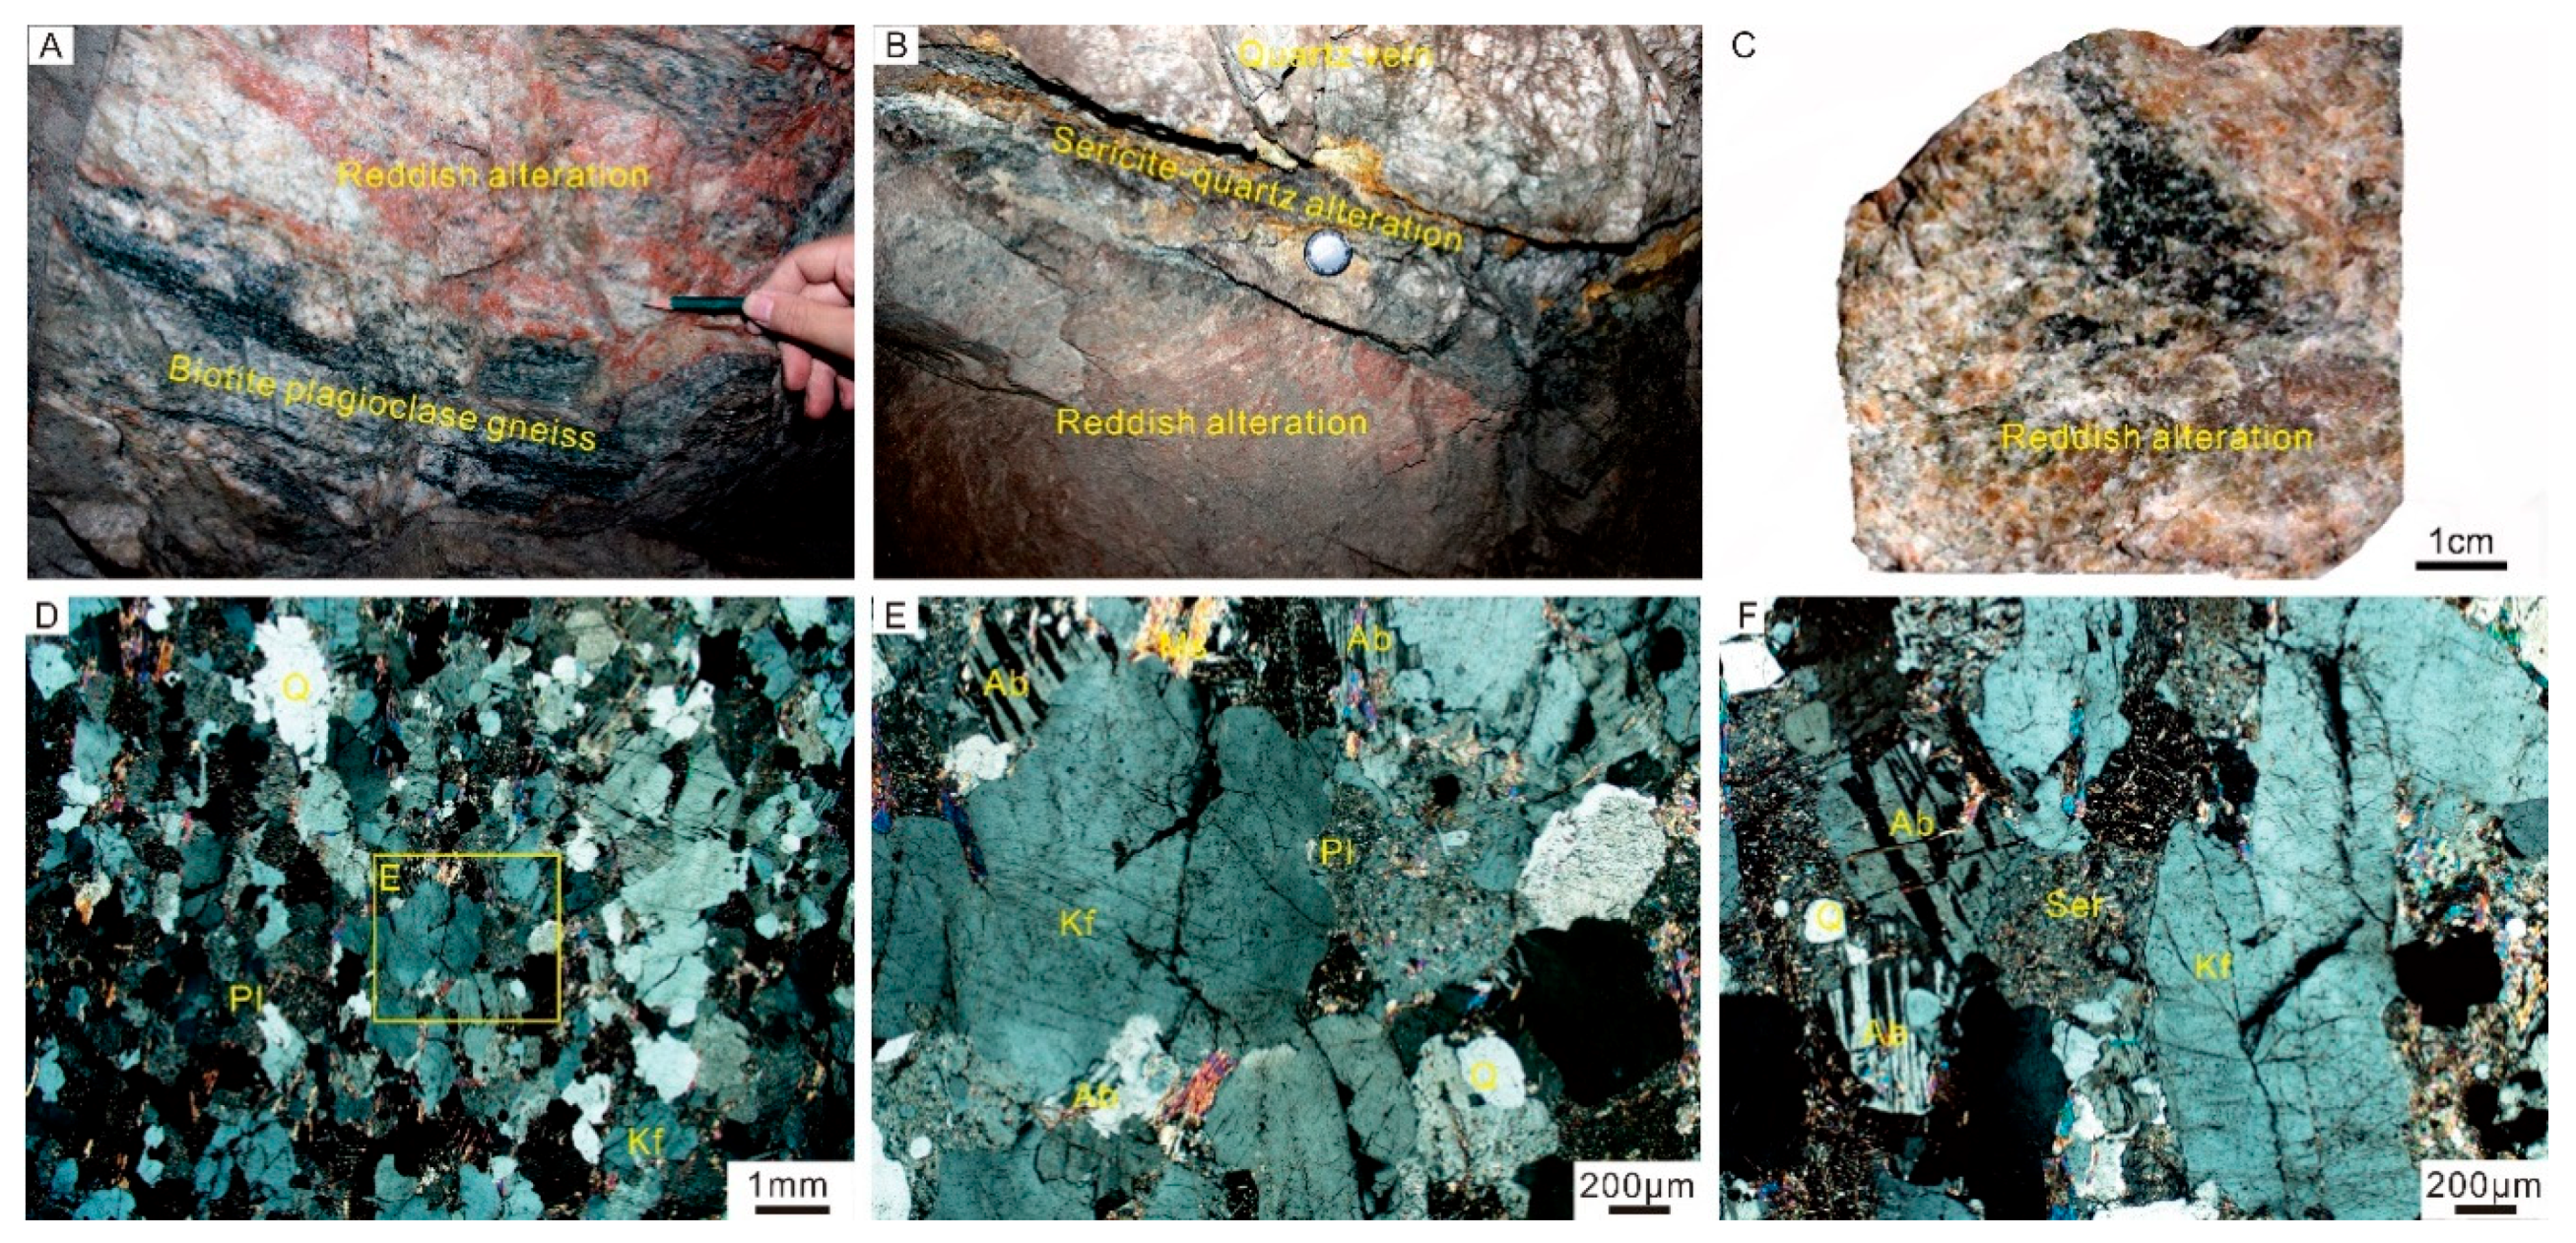
3.3.1. Protolith Rock and Reddish Alteration
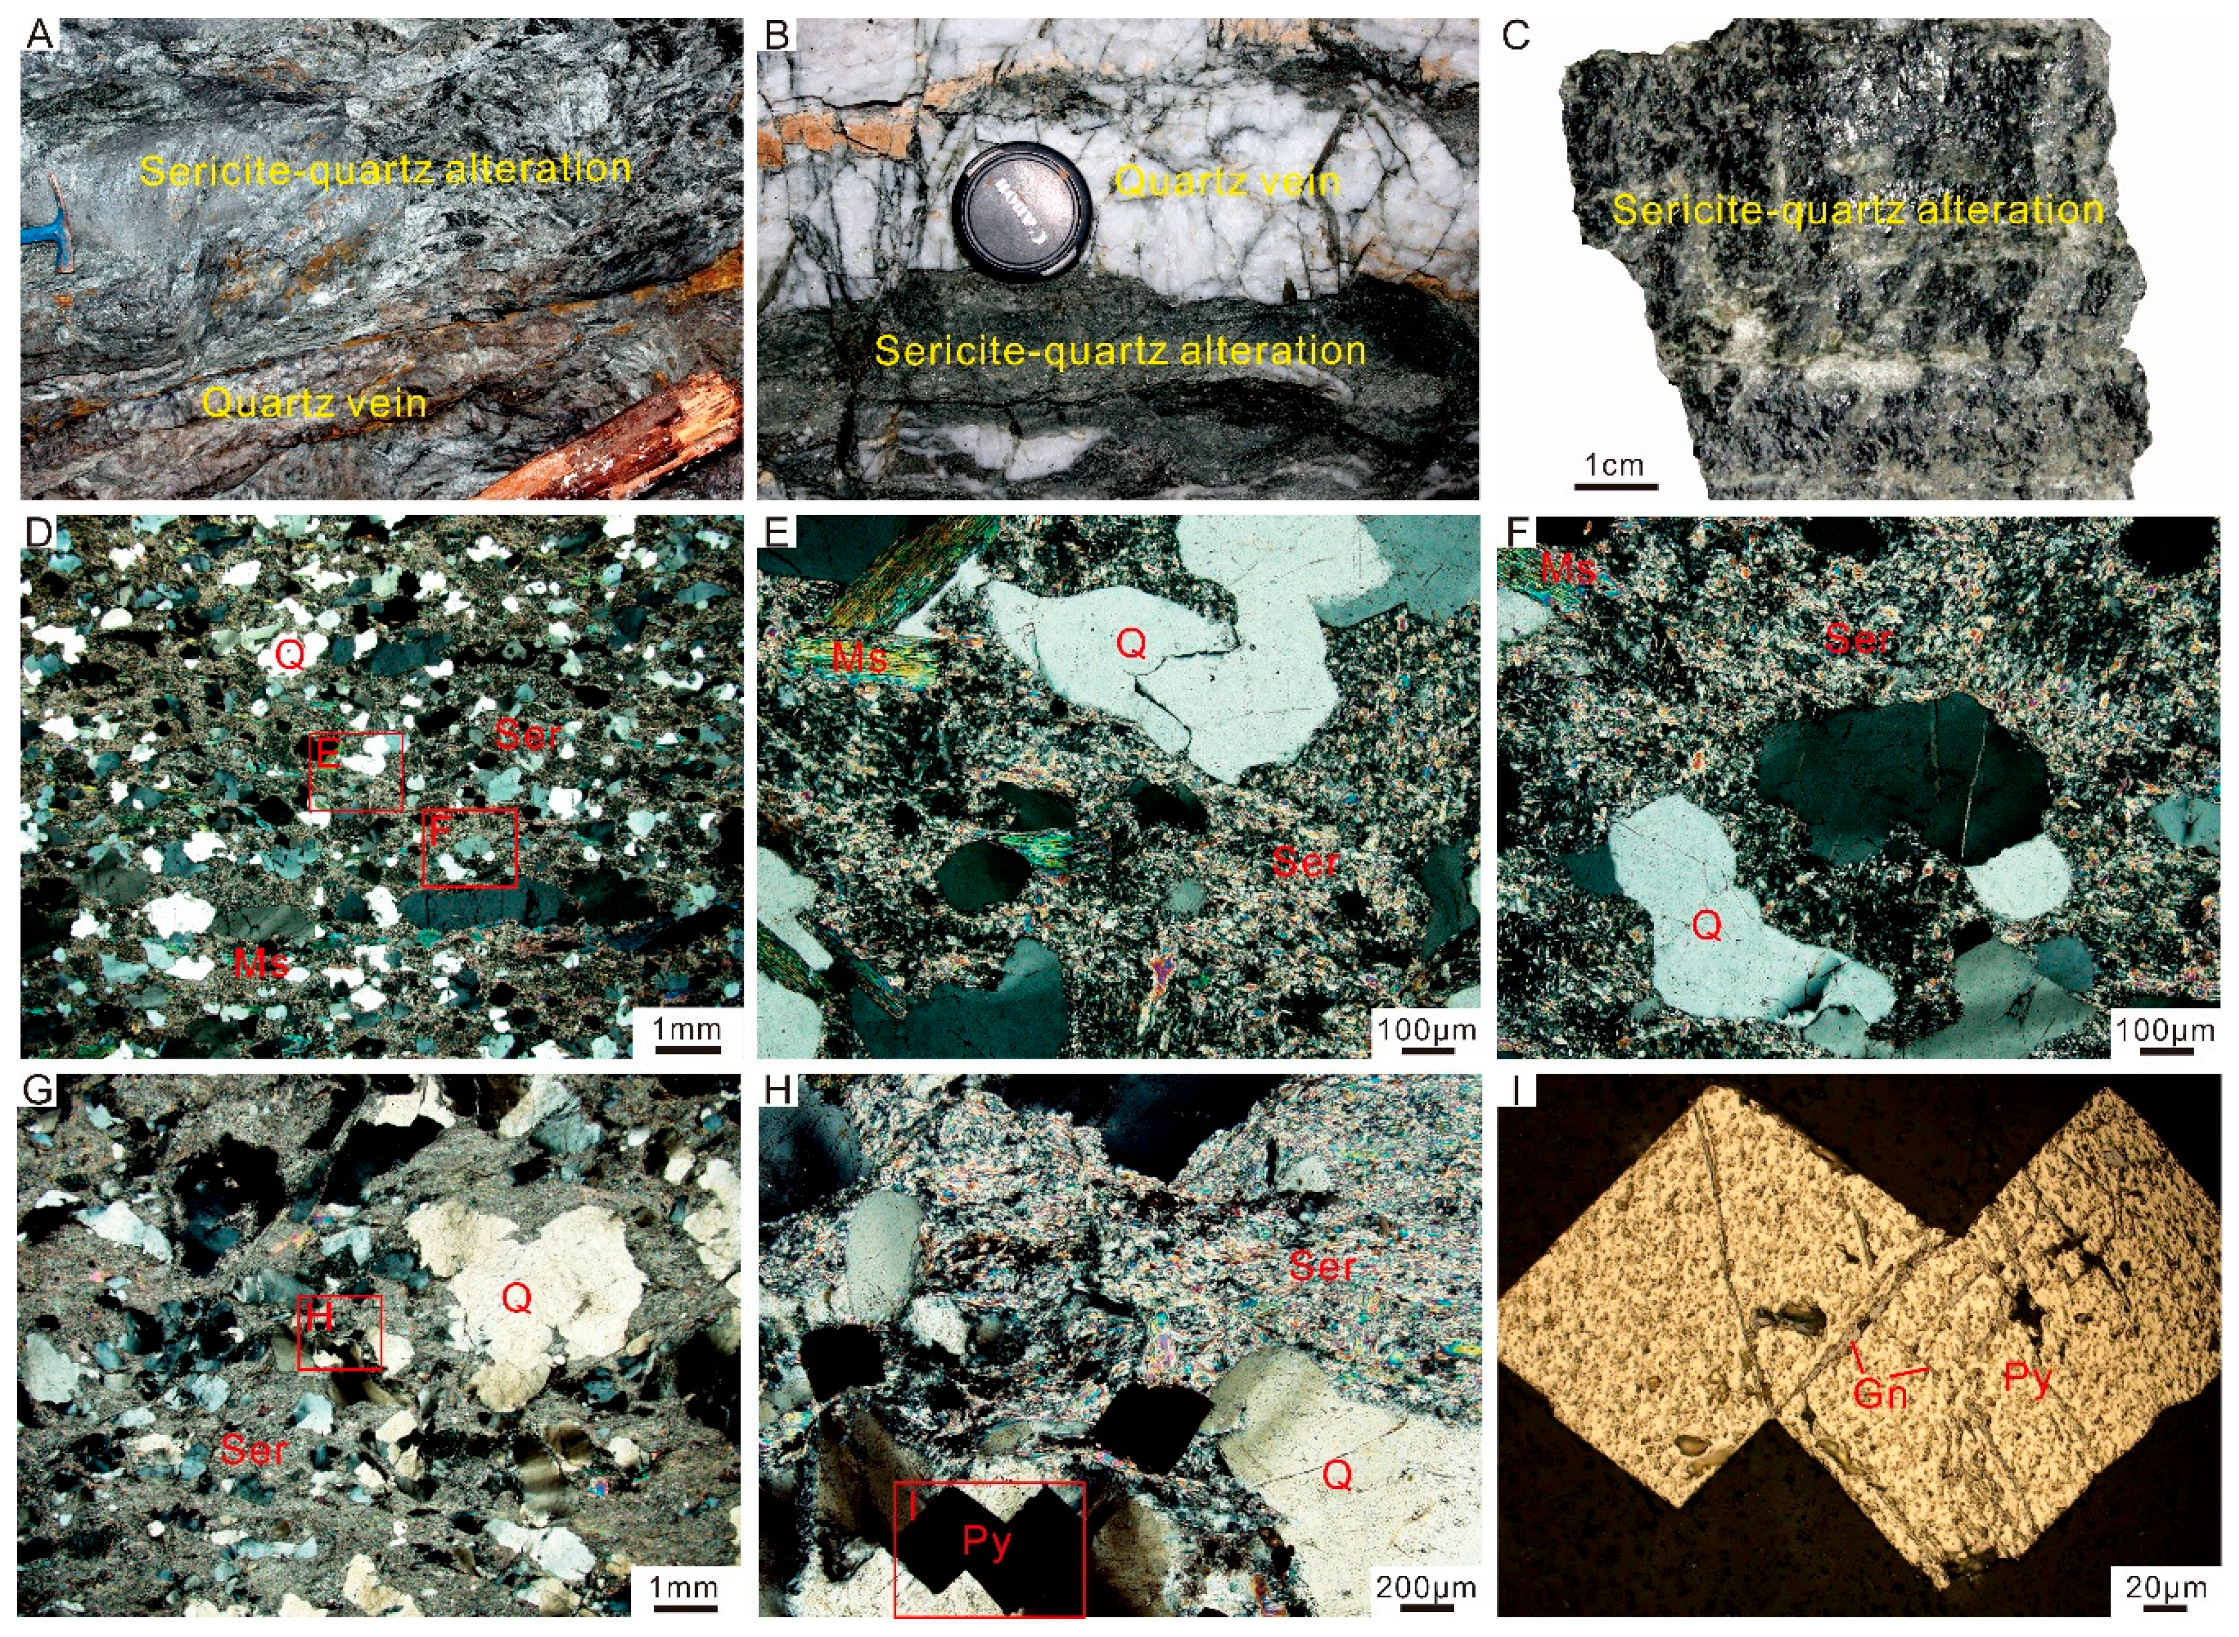
3.3.2. Sericite-Quartz Alteration
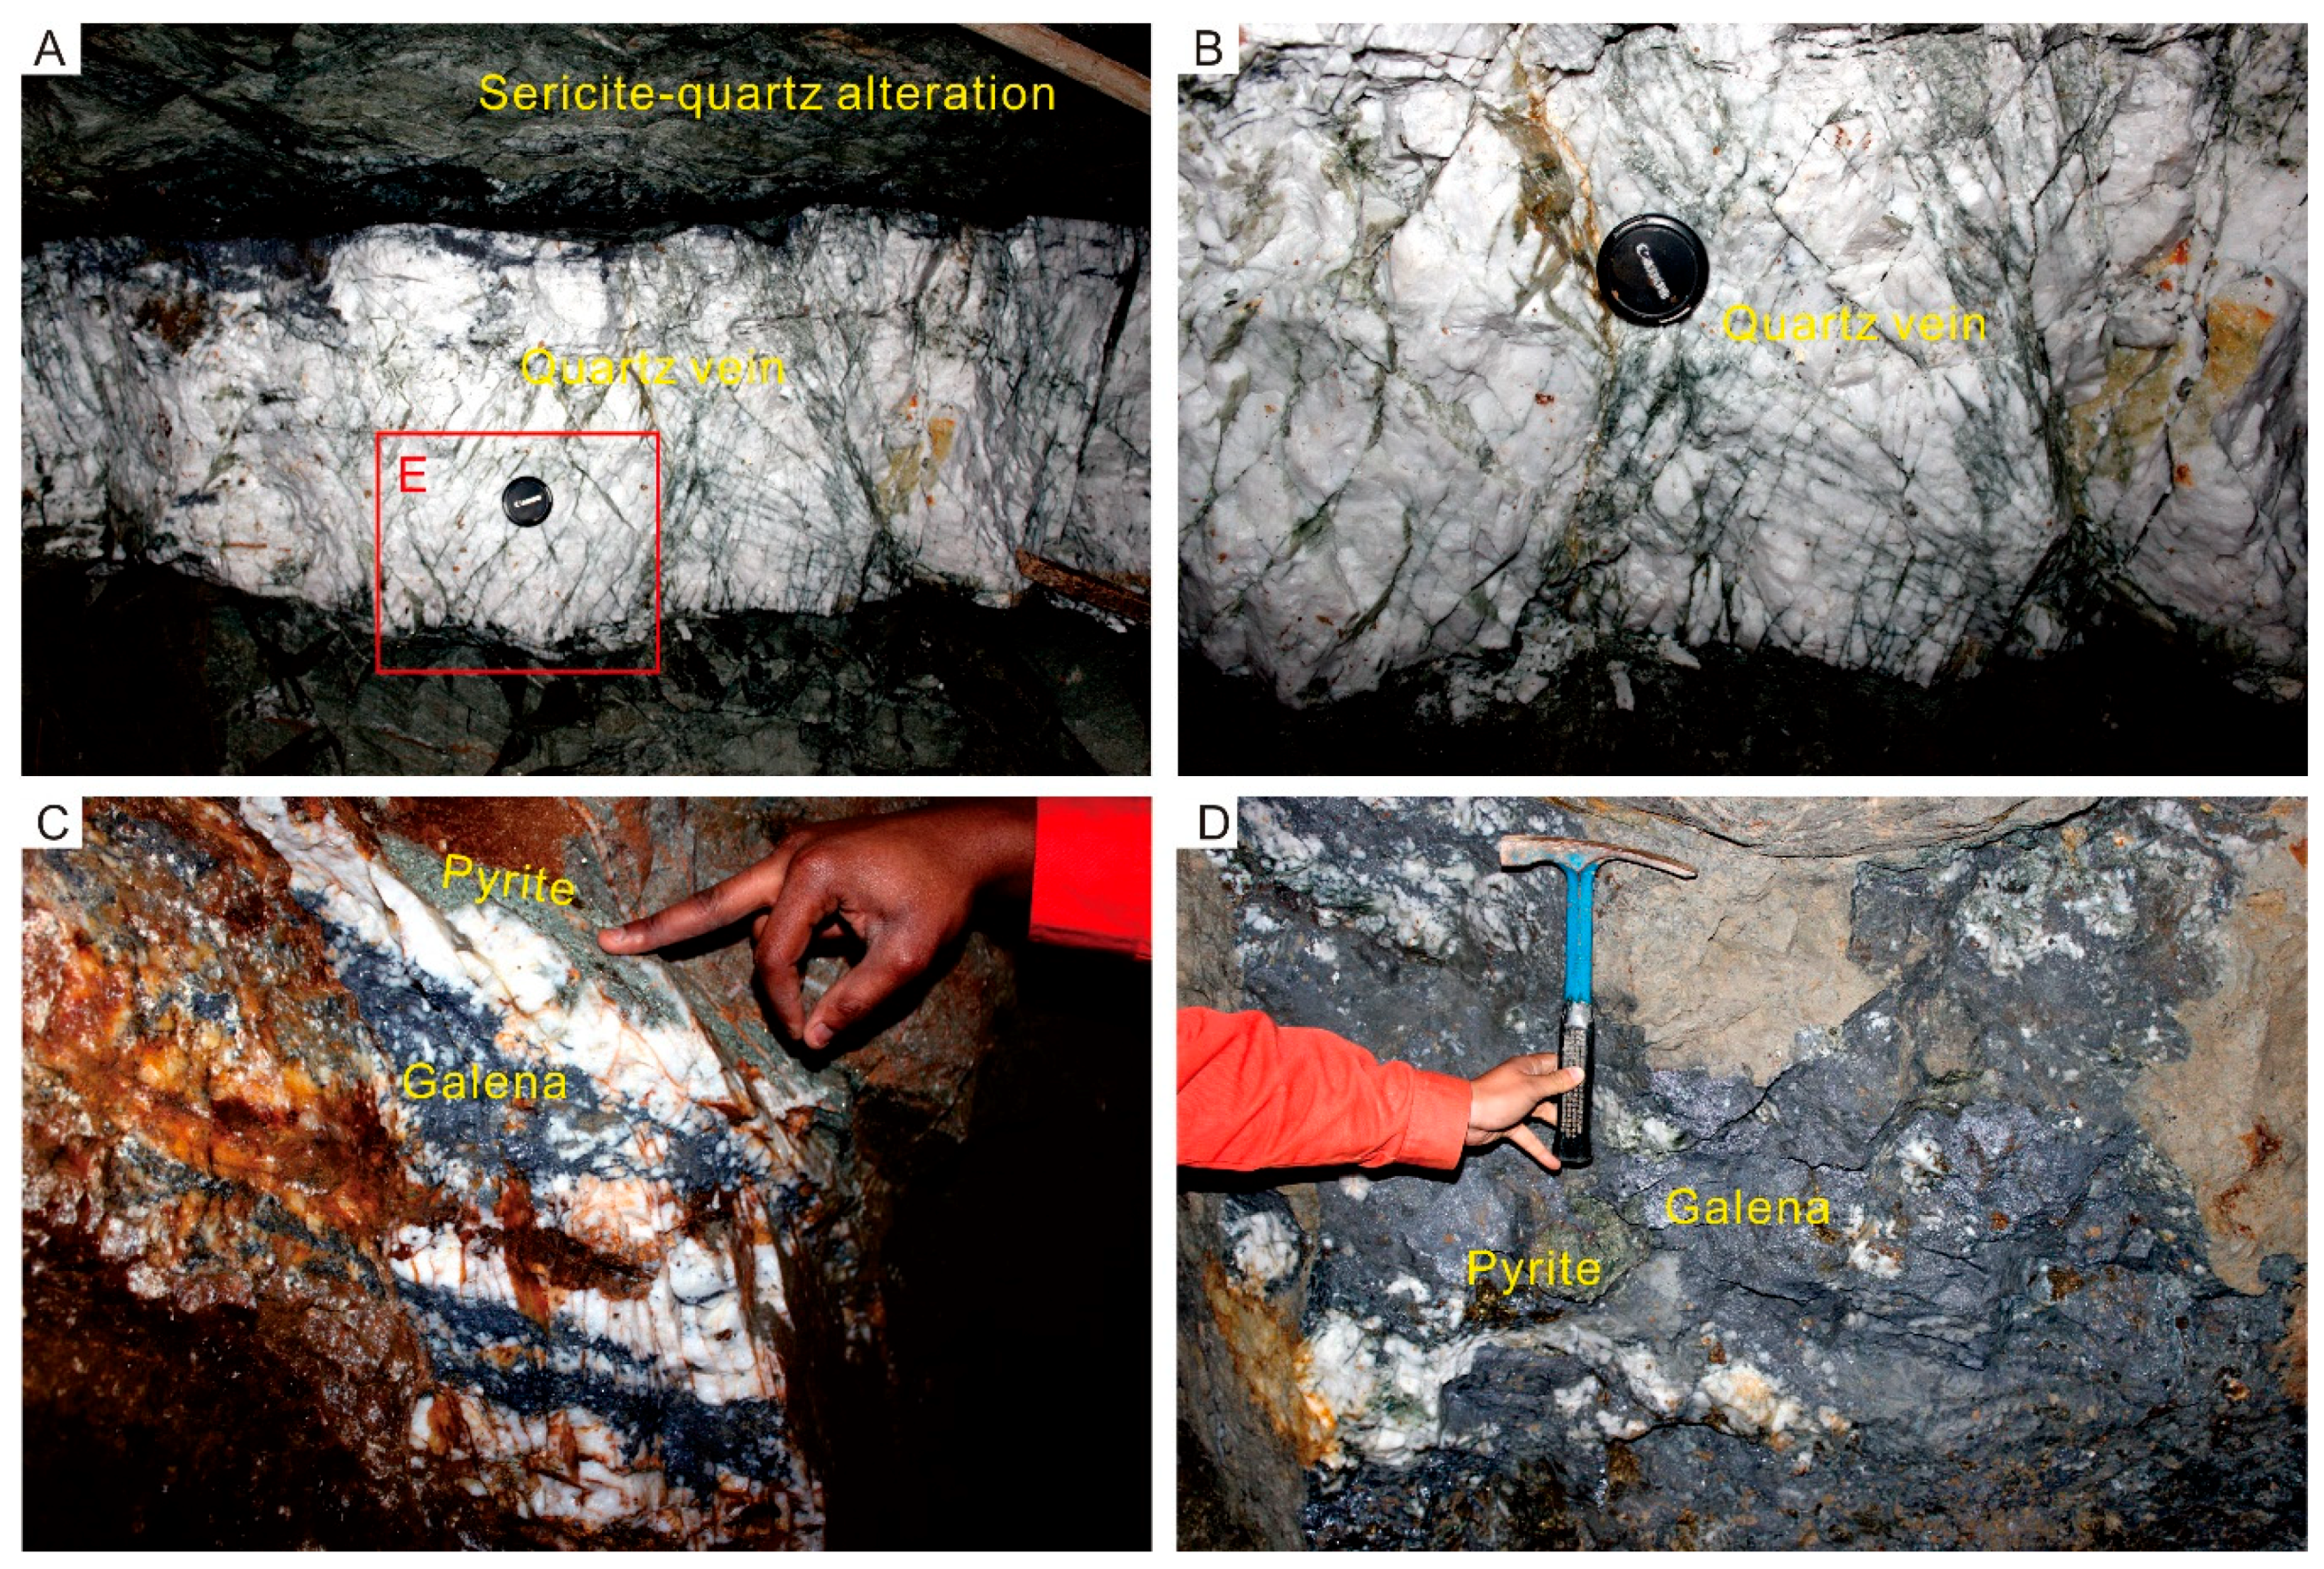
3.3.3. Quartz Veins and Gold Mineralization
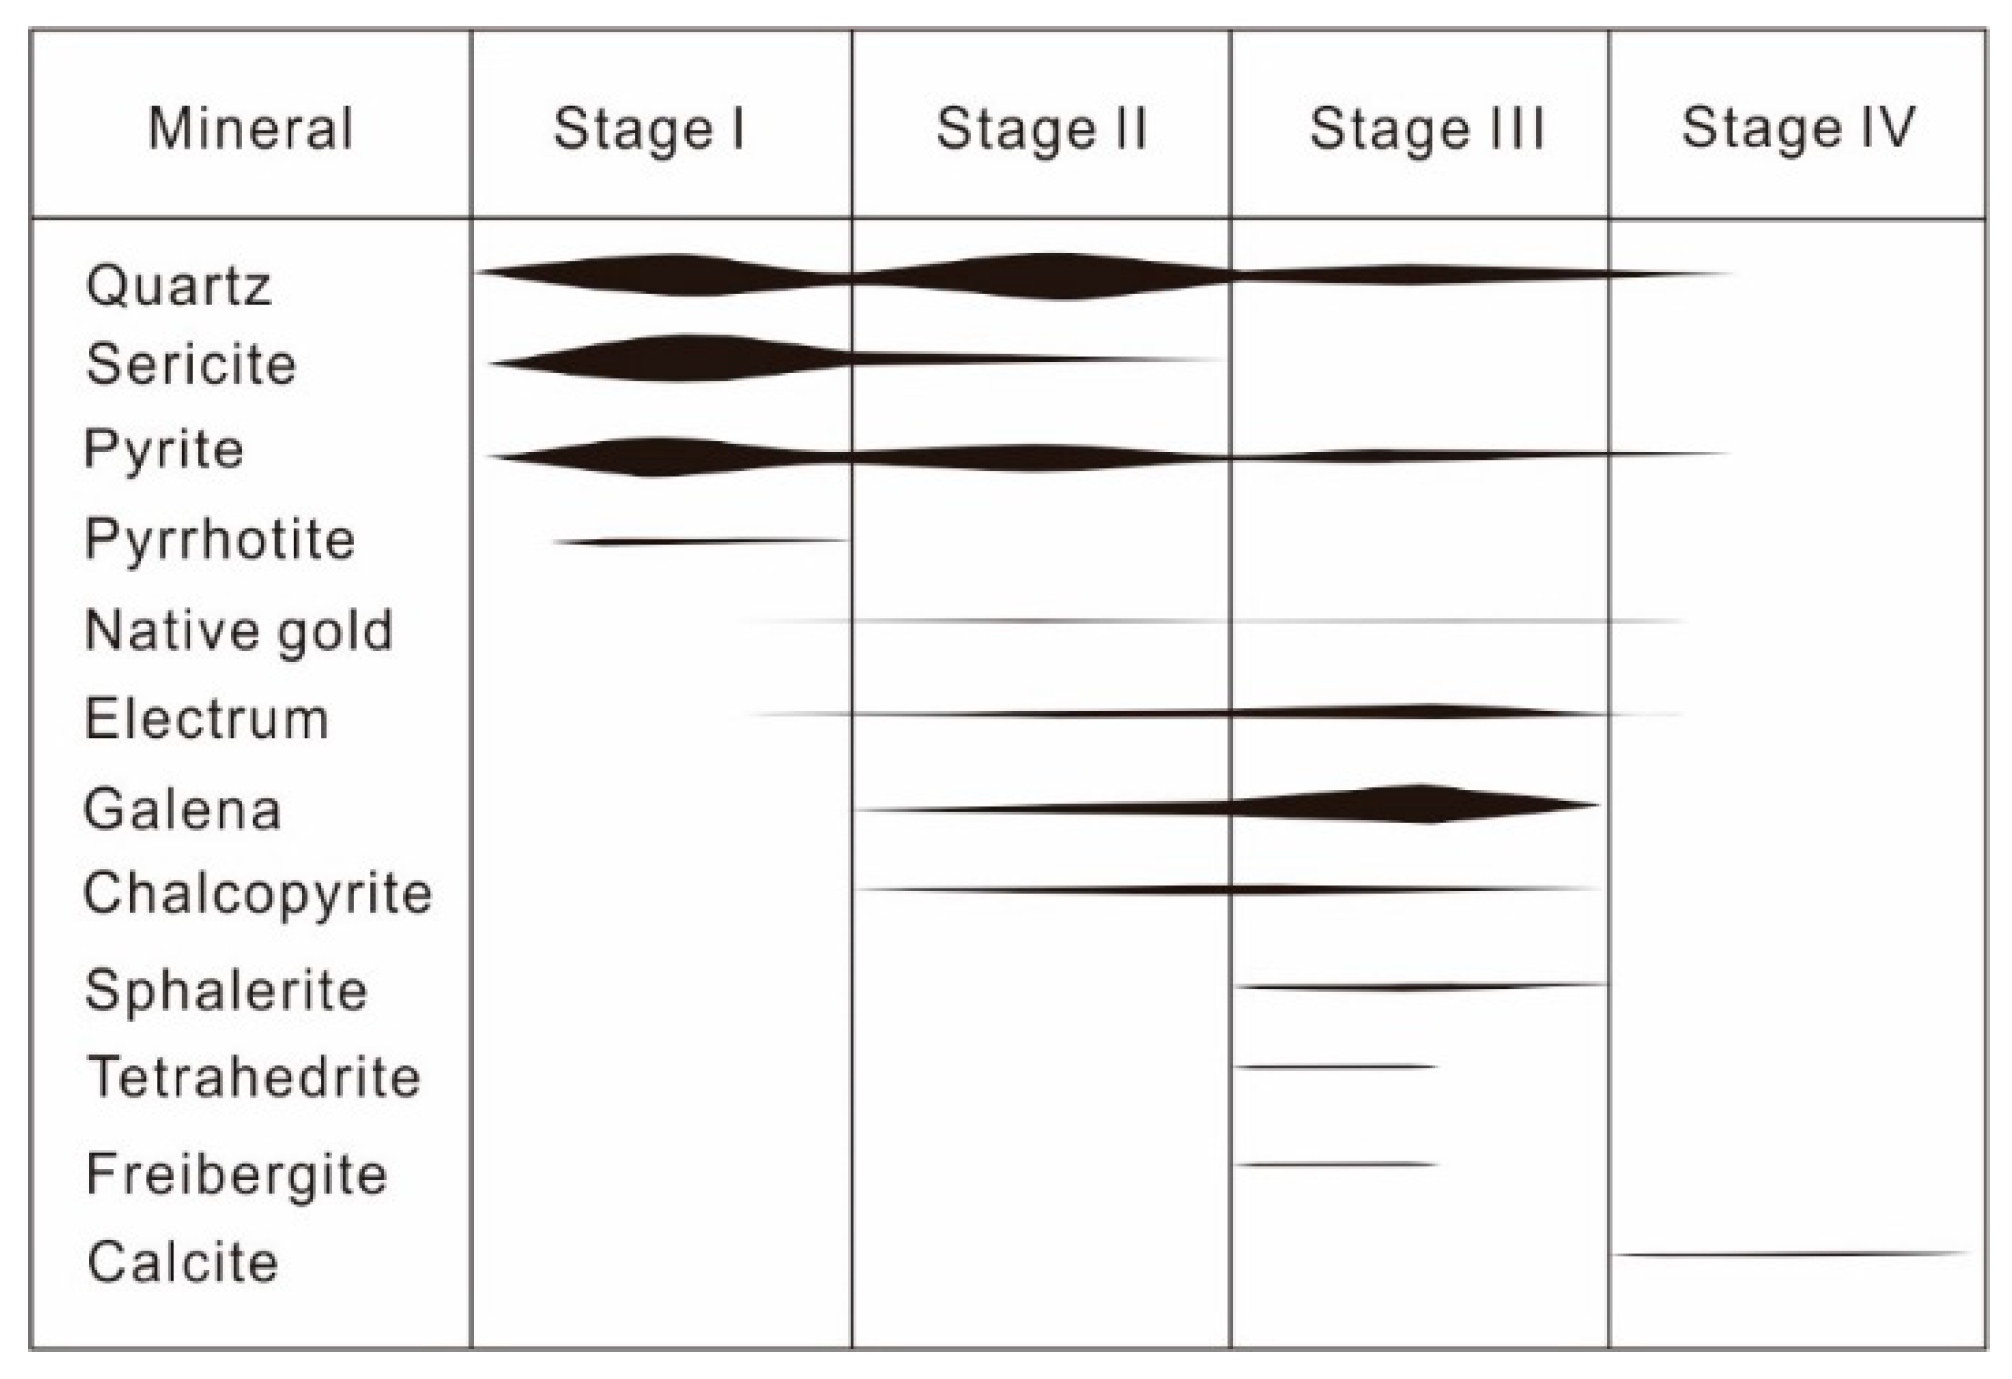
3.3.4. Paragenetic Sequences
4. Analysis Methods and Results
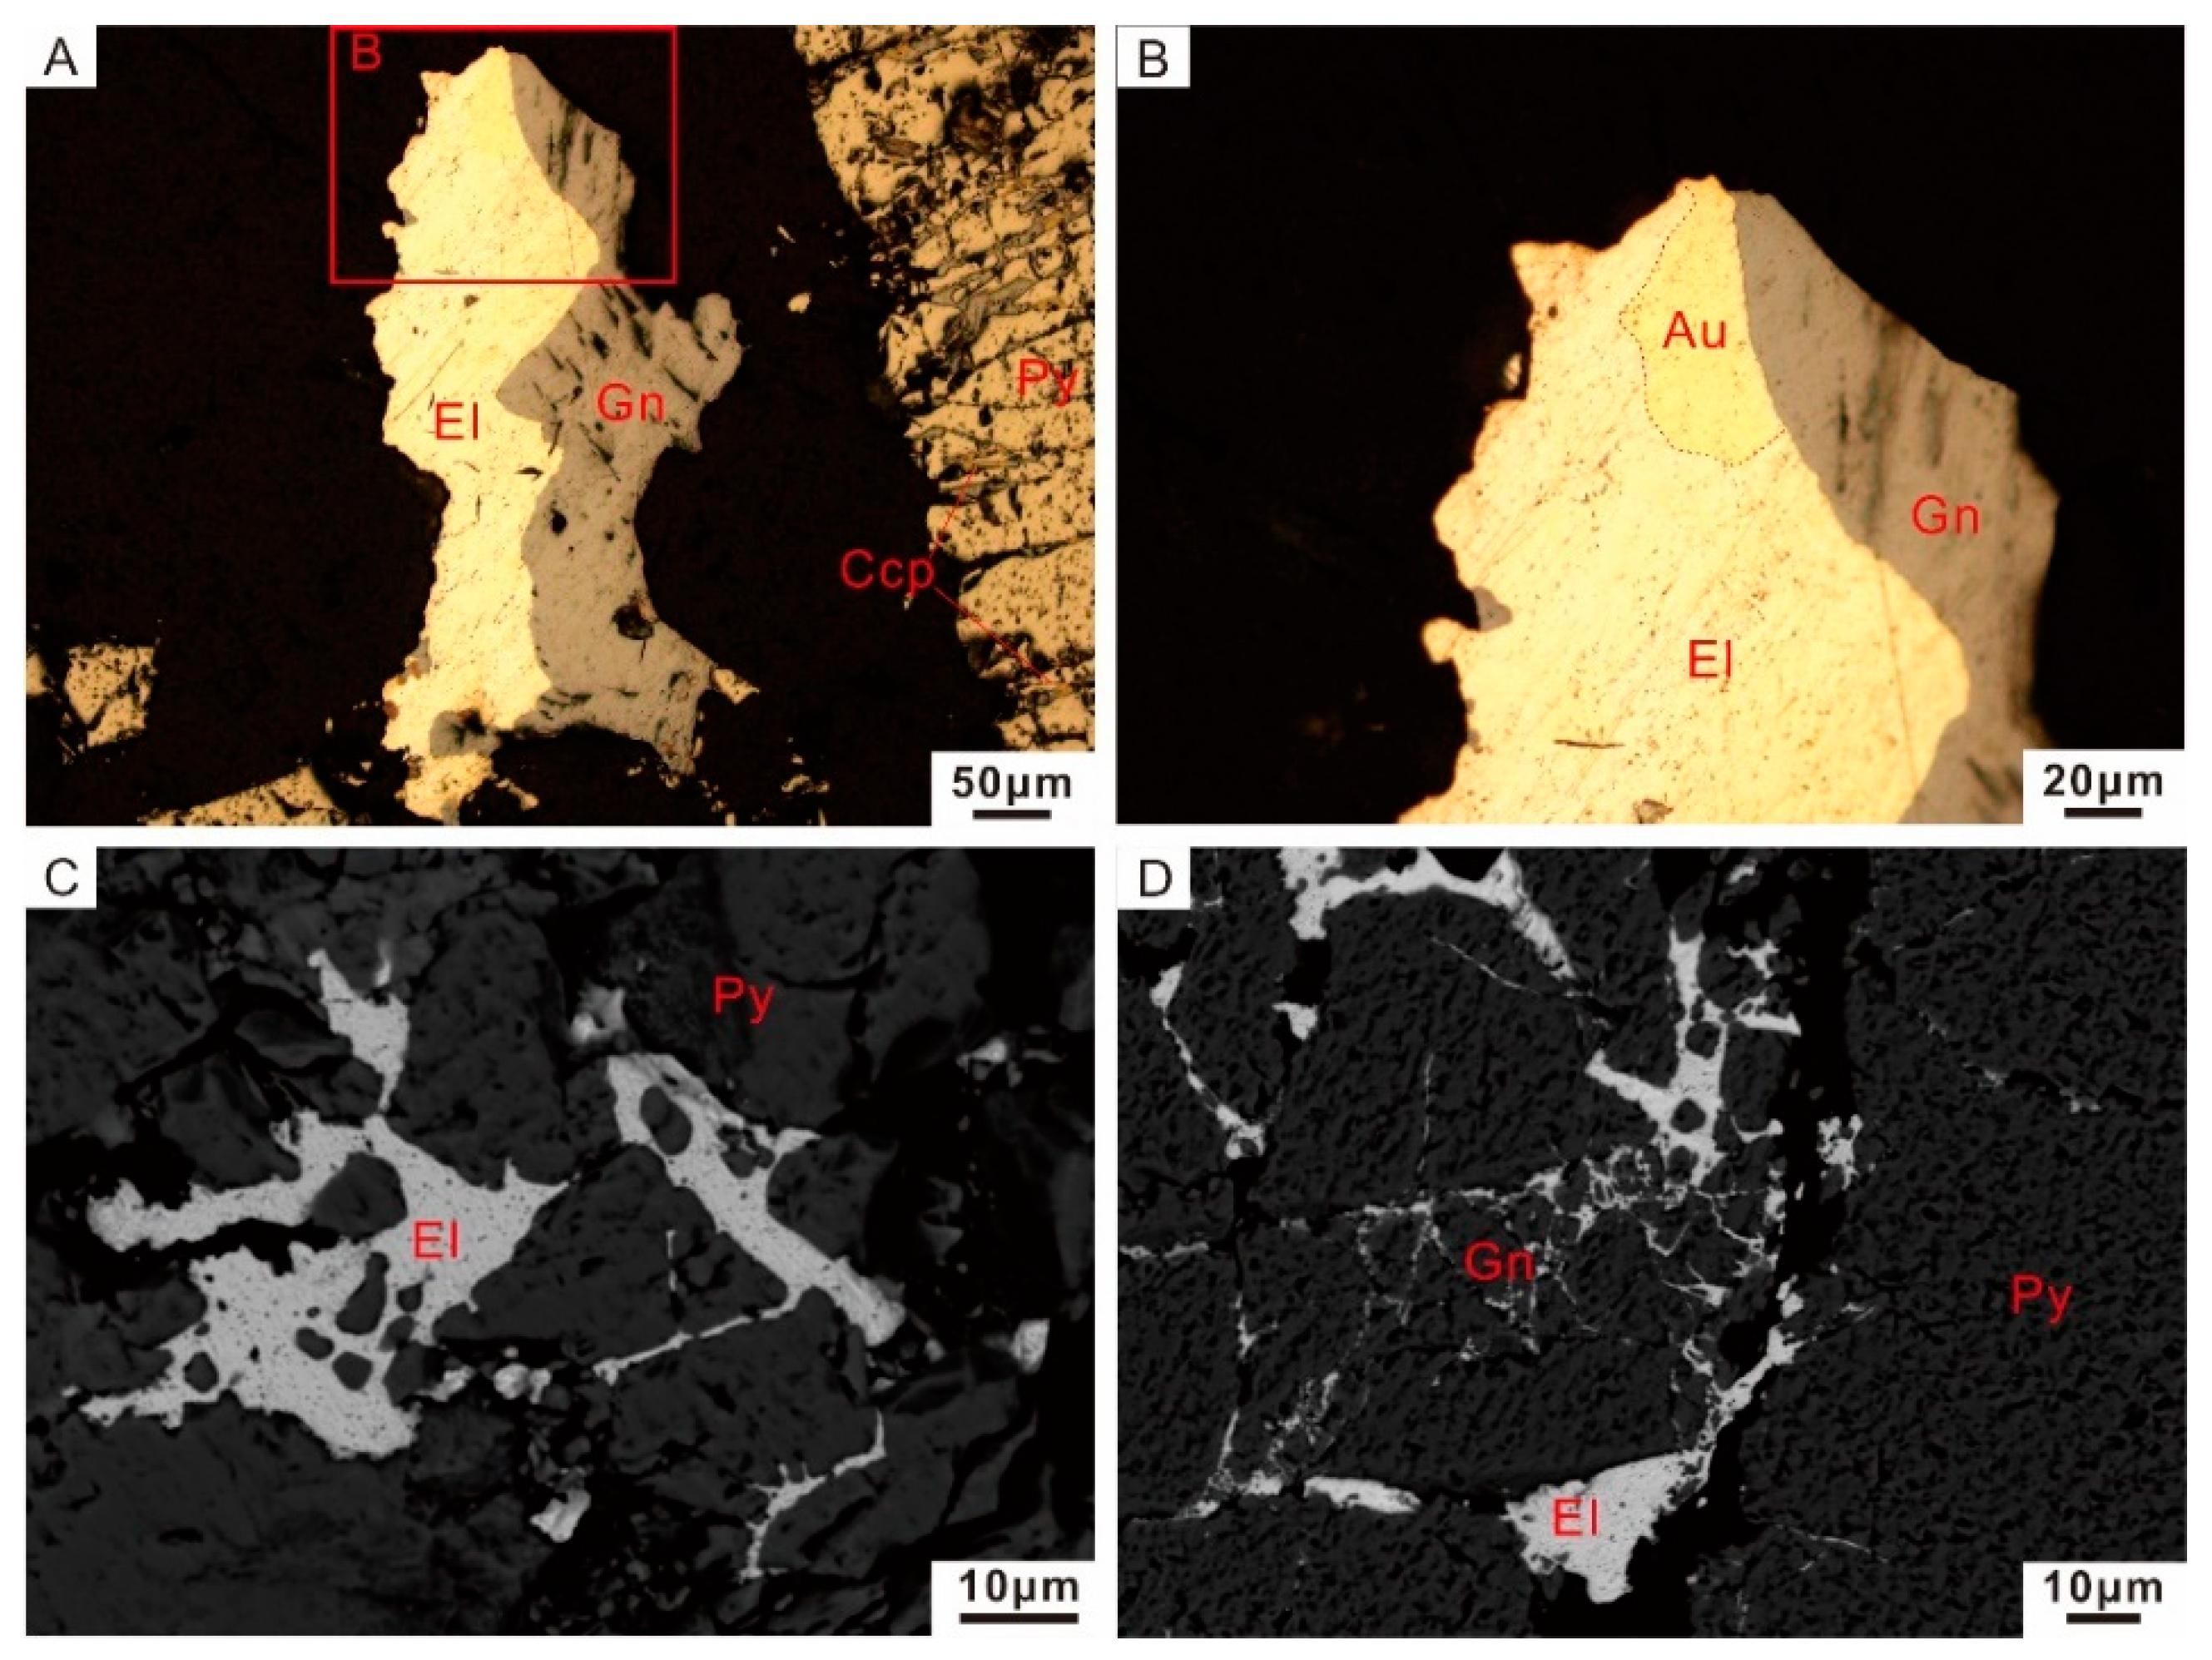
4.1. Electron Probe Microanalyses (EPMA)
4.2. Bulk Geochemistry
4.2.1. Major and Trace Elements
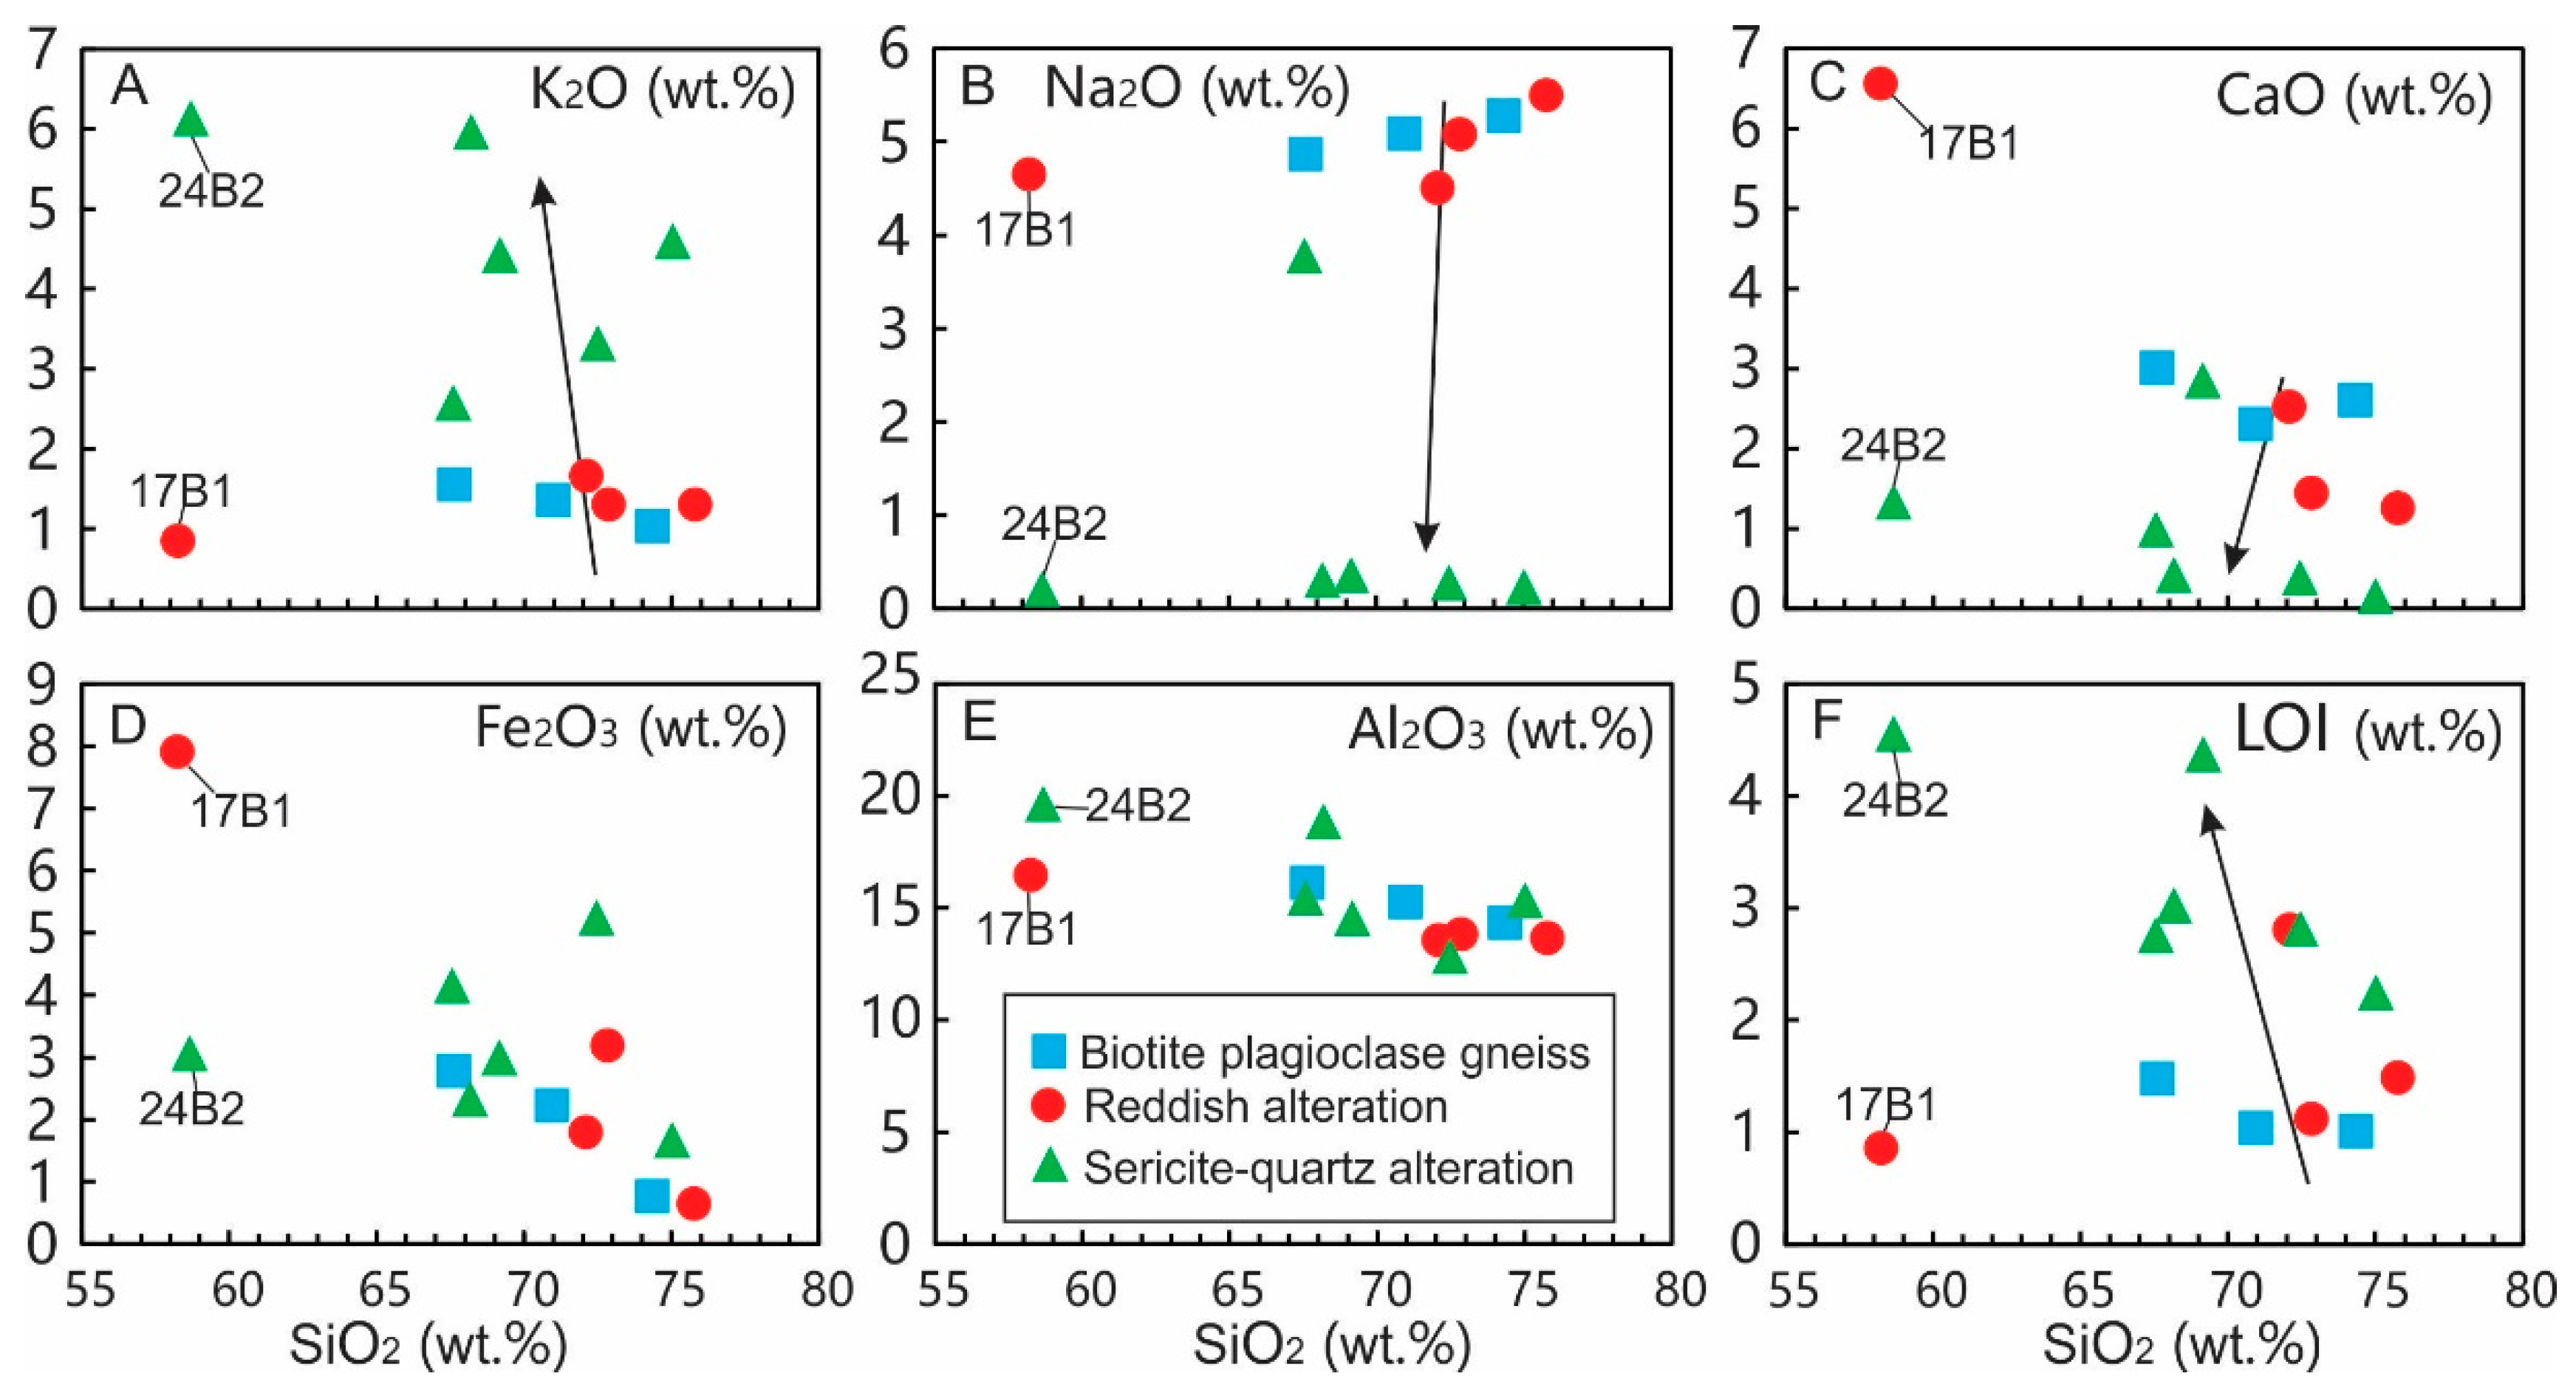
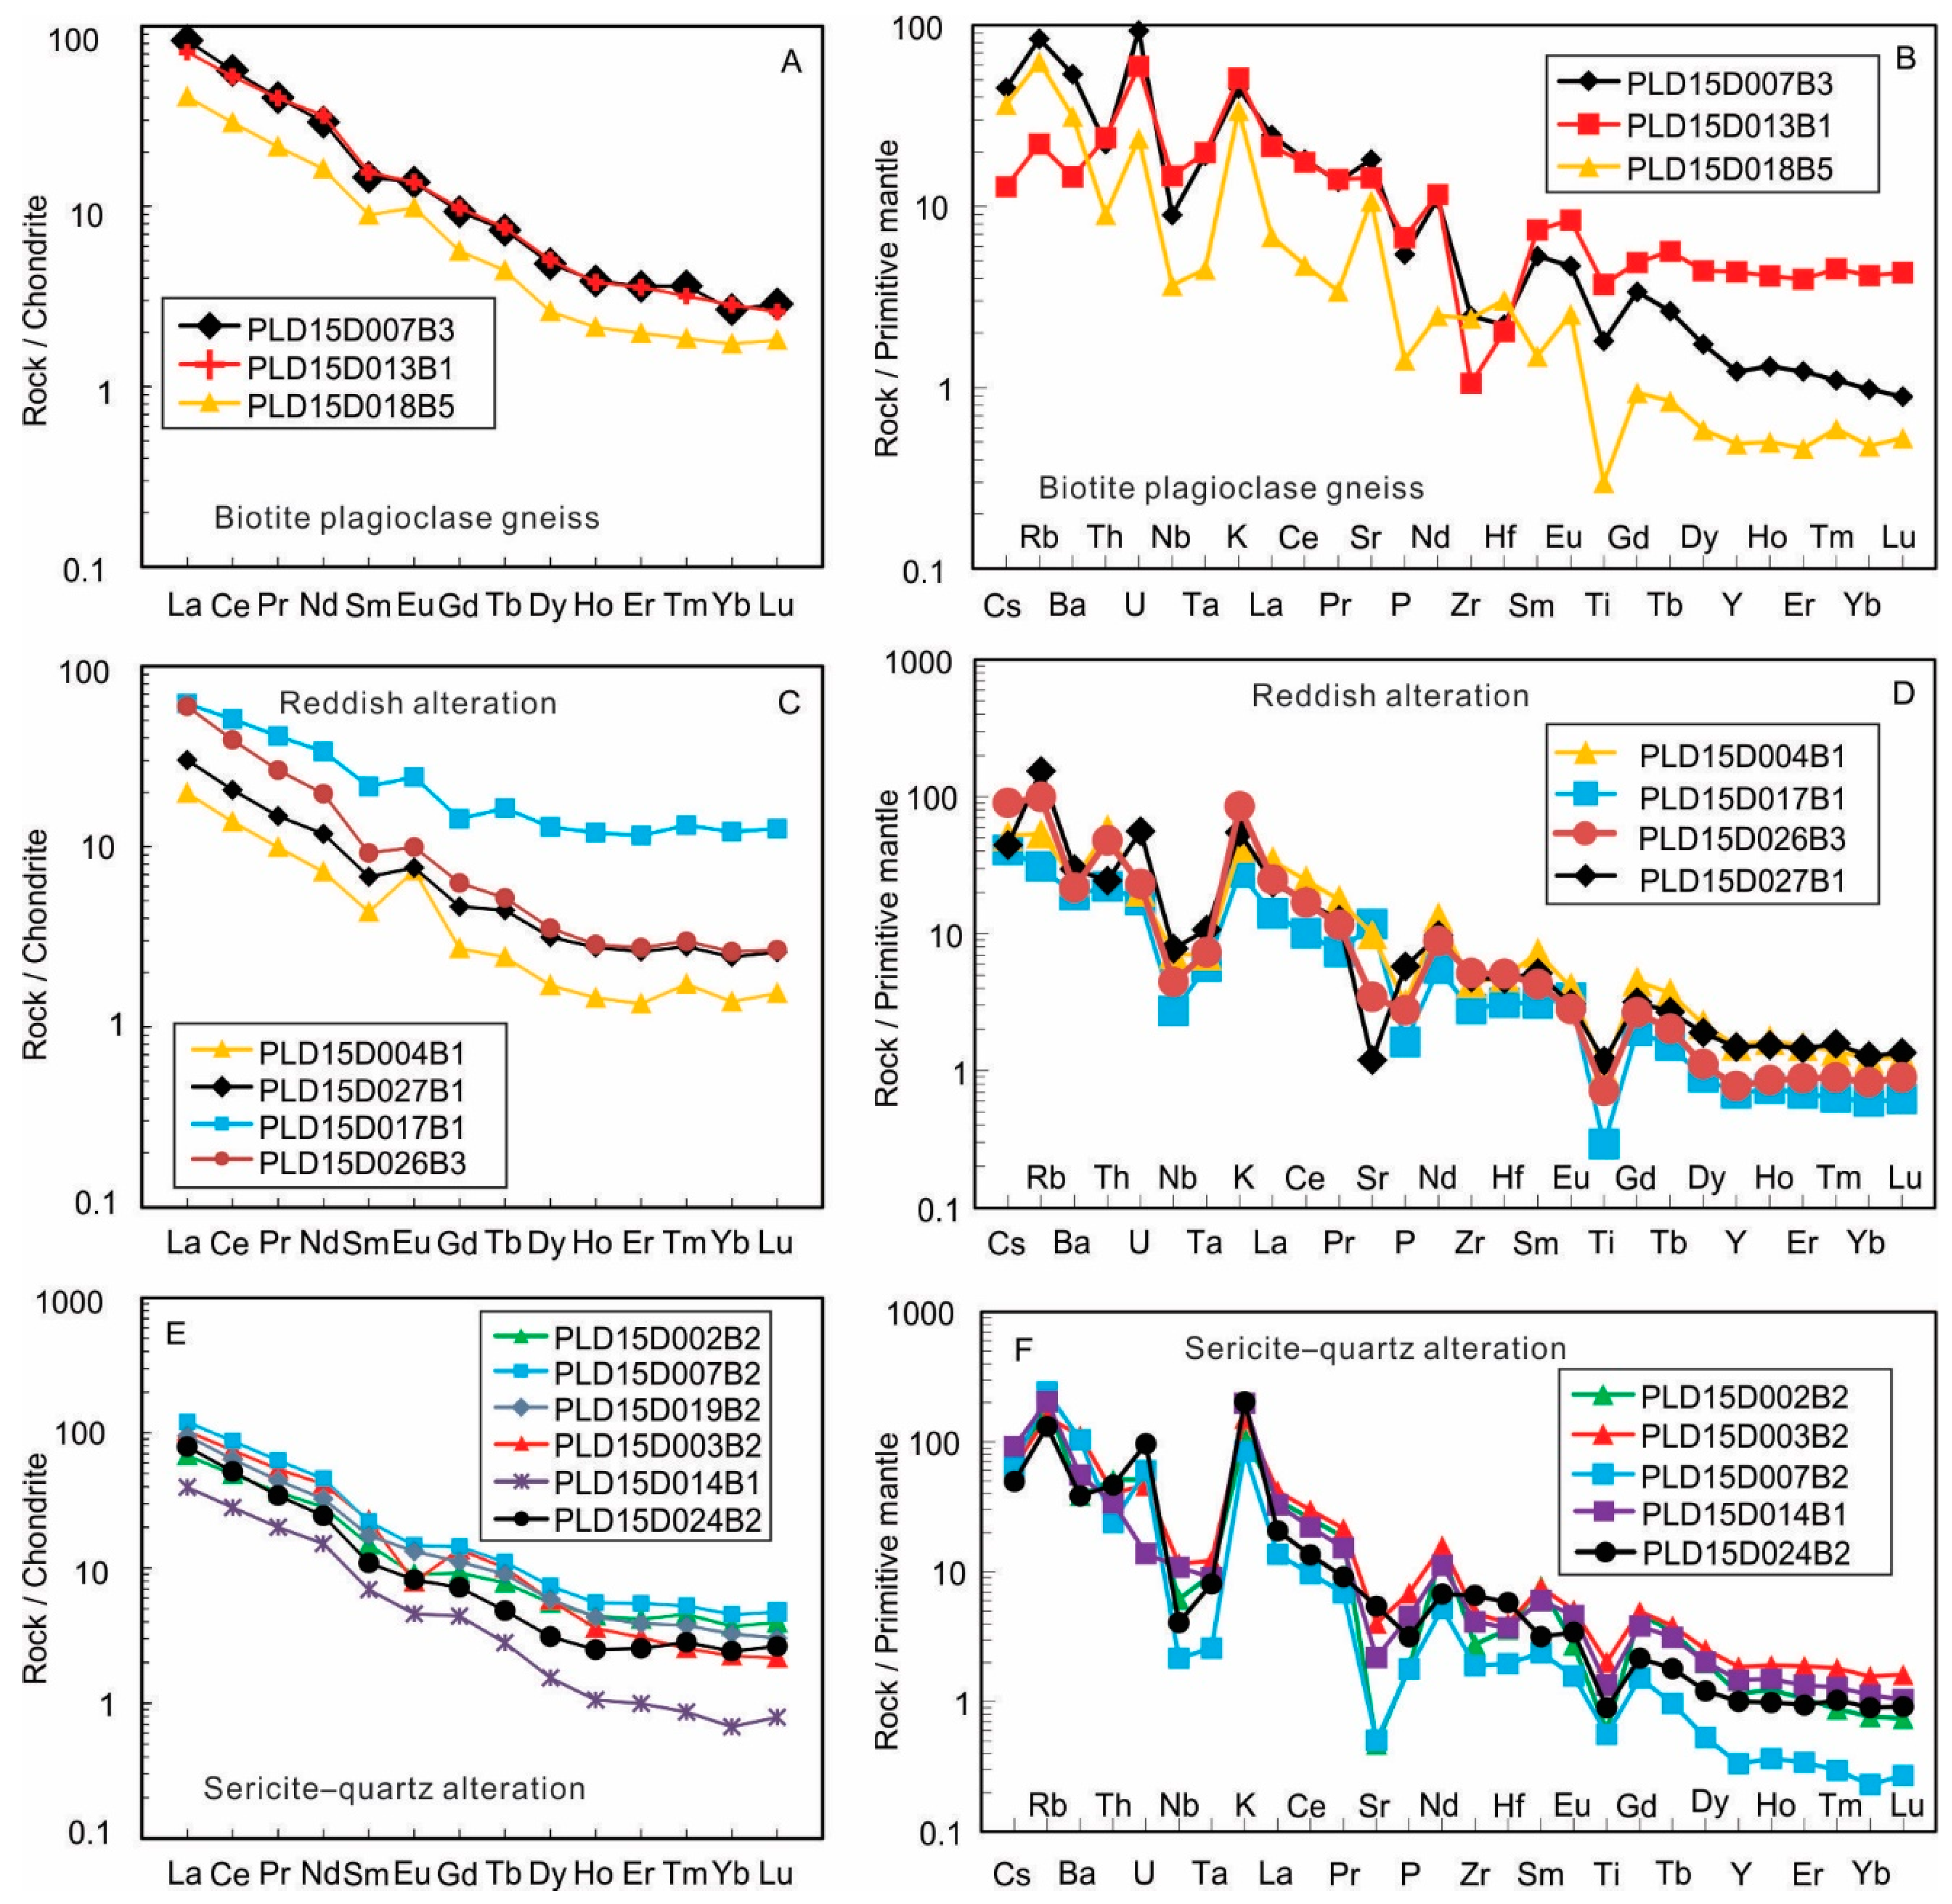
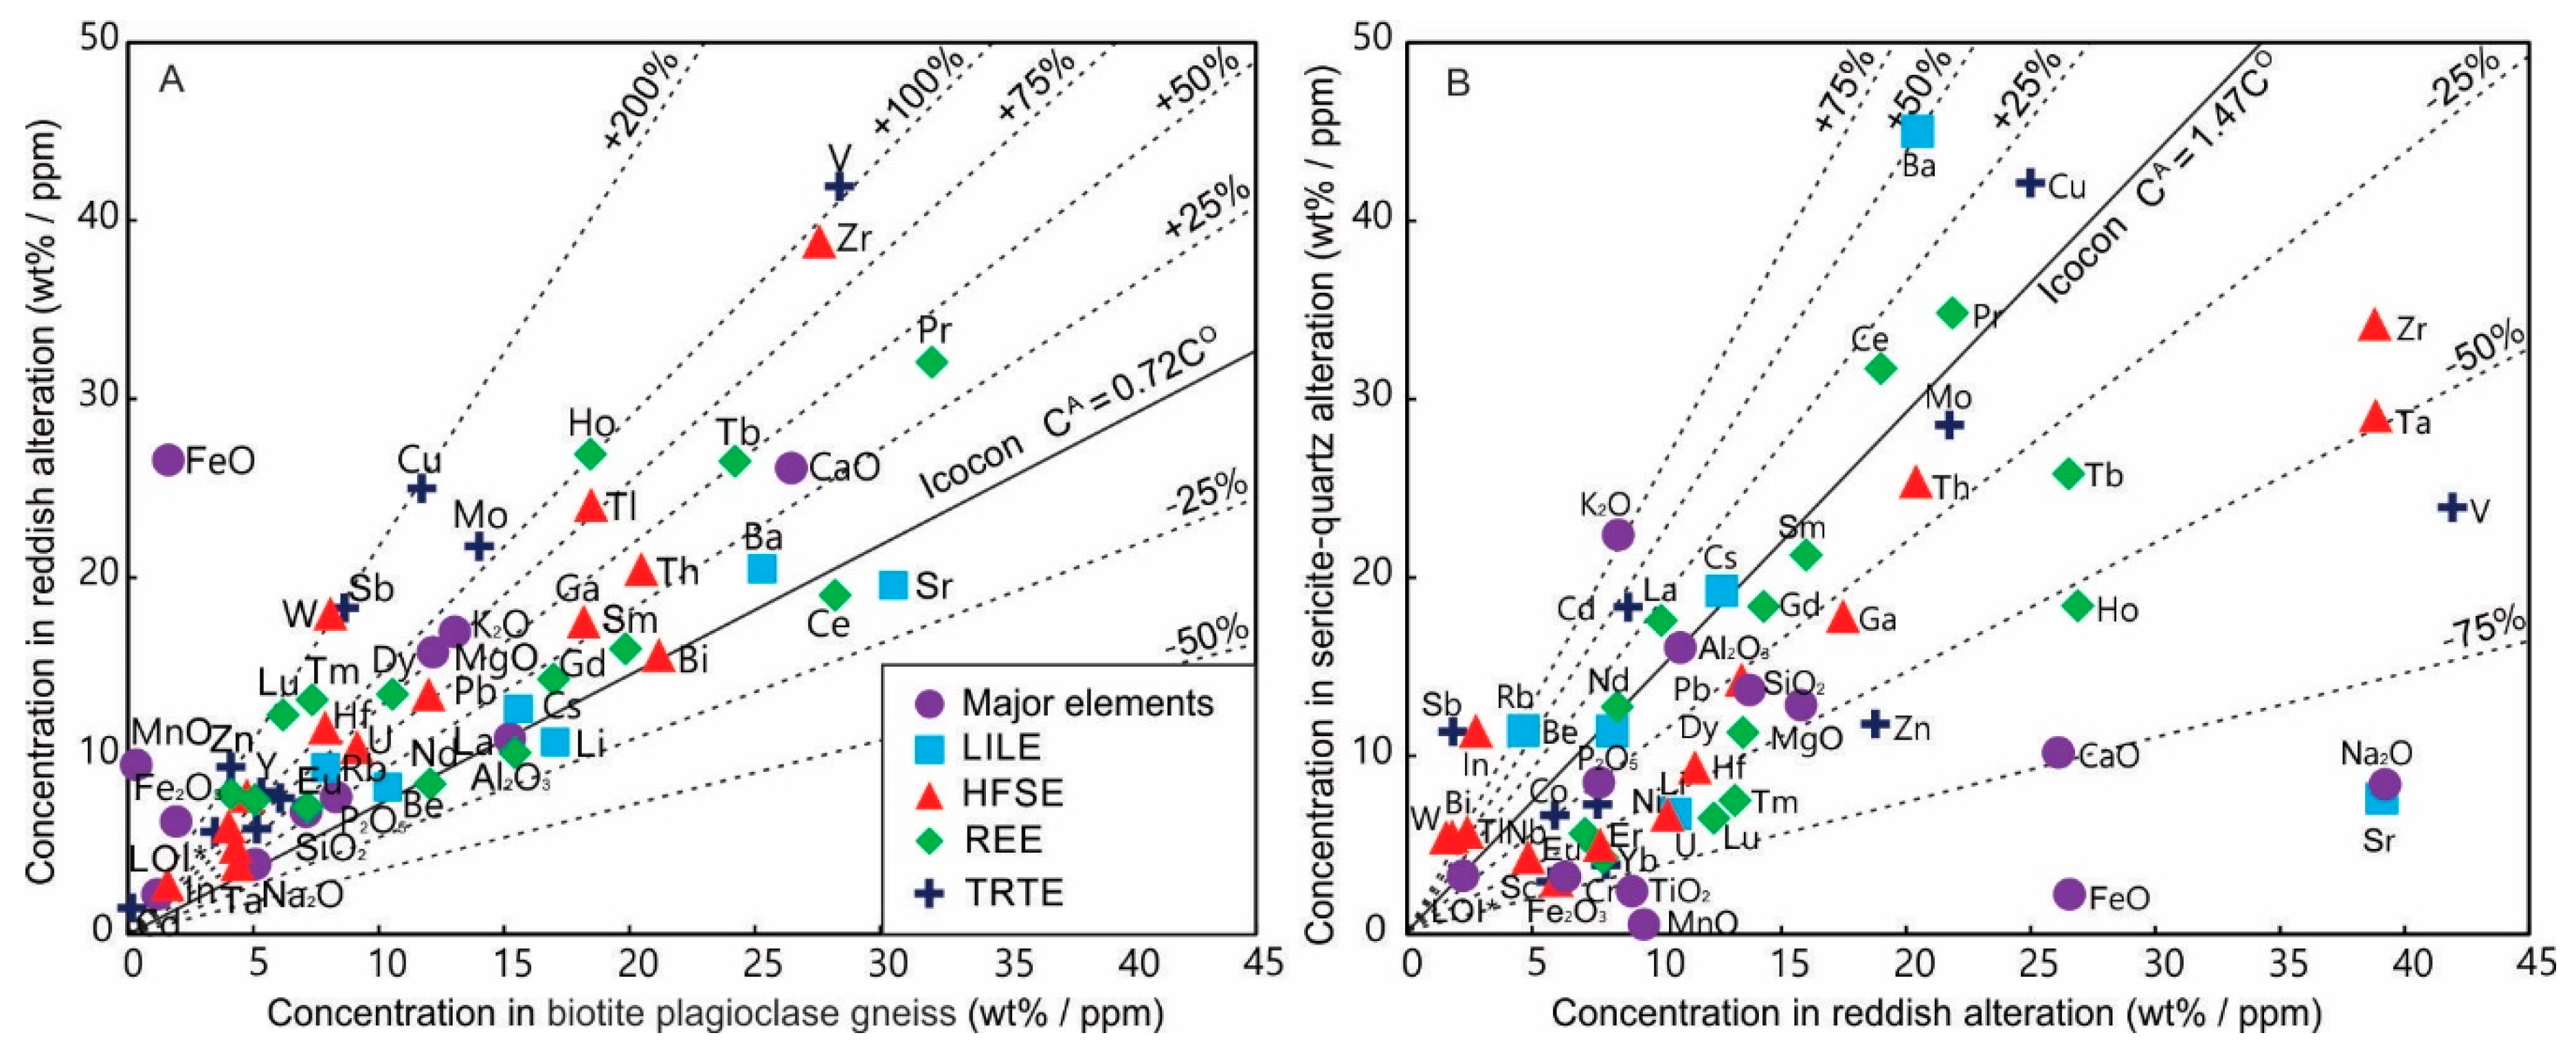
4.2.2. Geochemical Characteristics of the Original and Altered Rock
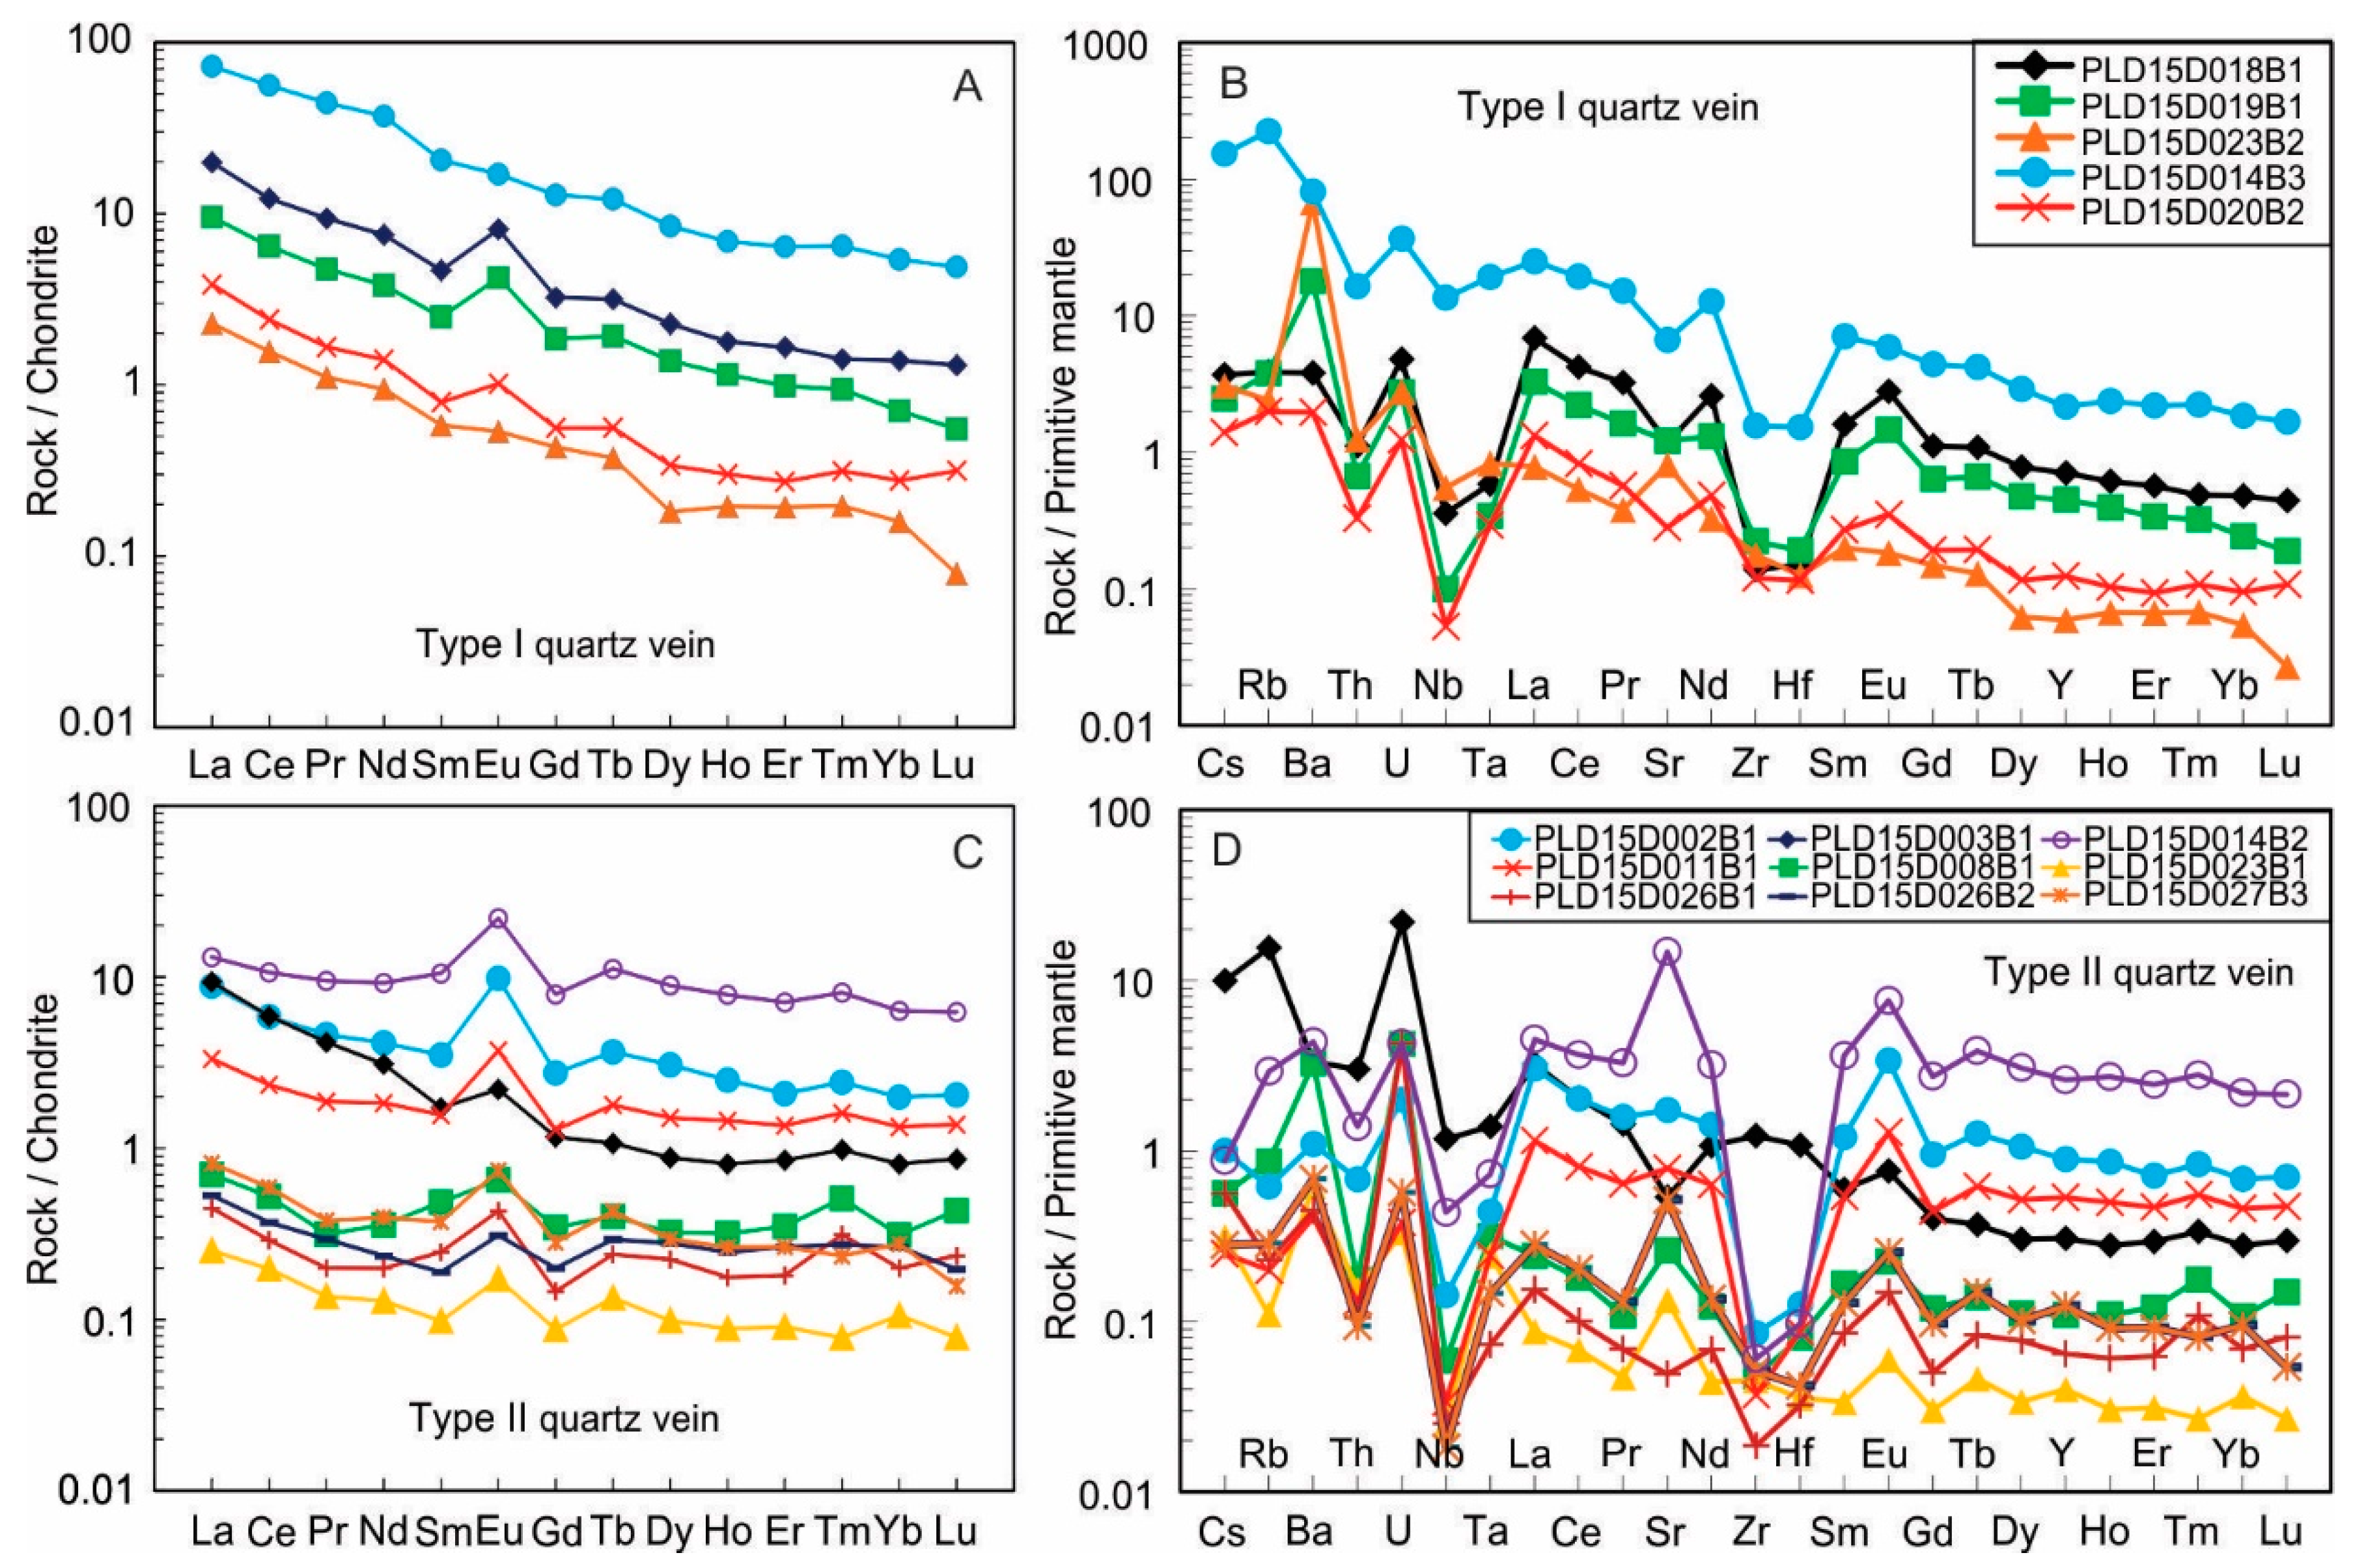
4.2.3. Geochemical Characteristics of the Two Types Quartz Veins
4.3. Mass-Balance Calculations
5. Discussion
5.1. Mineral Dissolution and Precipitation Processes
5.1.1. Early Alteration Stage
5.1.2. Alteration that Was Related to Gold Mineralization
5.1.3. Auriferous Quartz Veins and Gold Precipitation
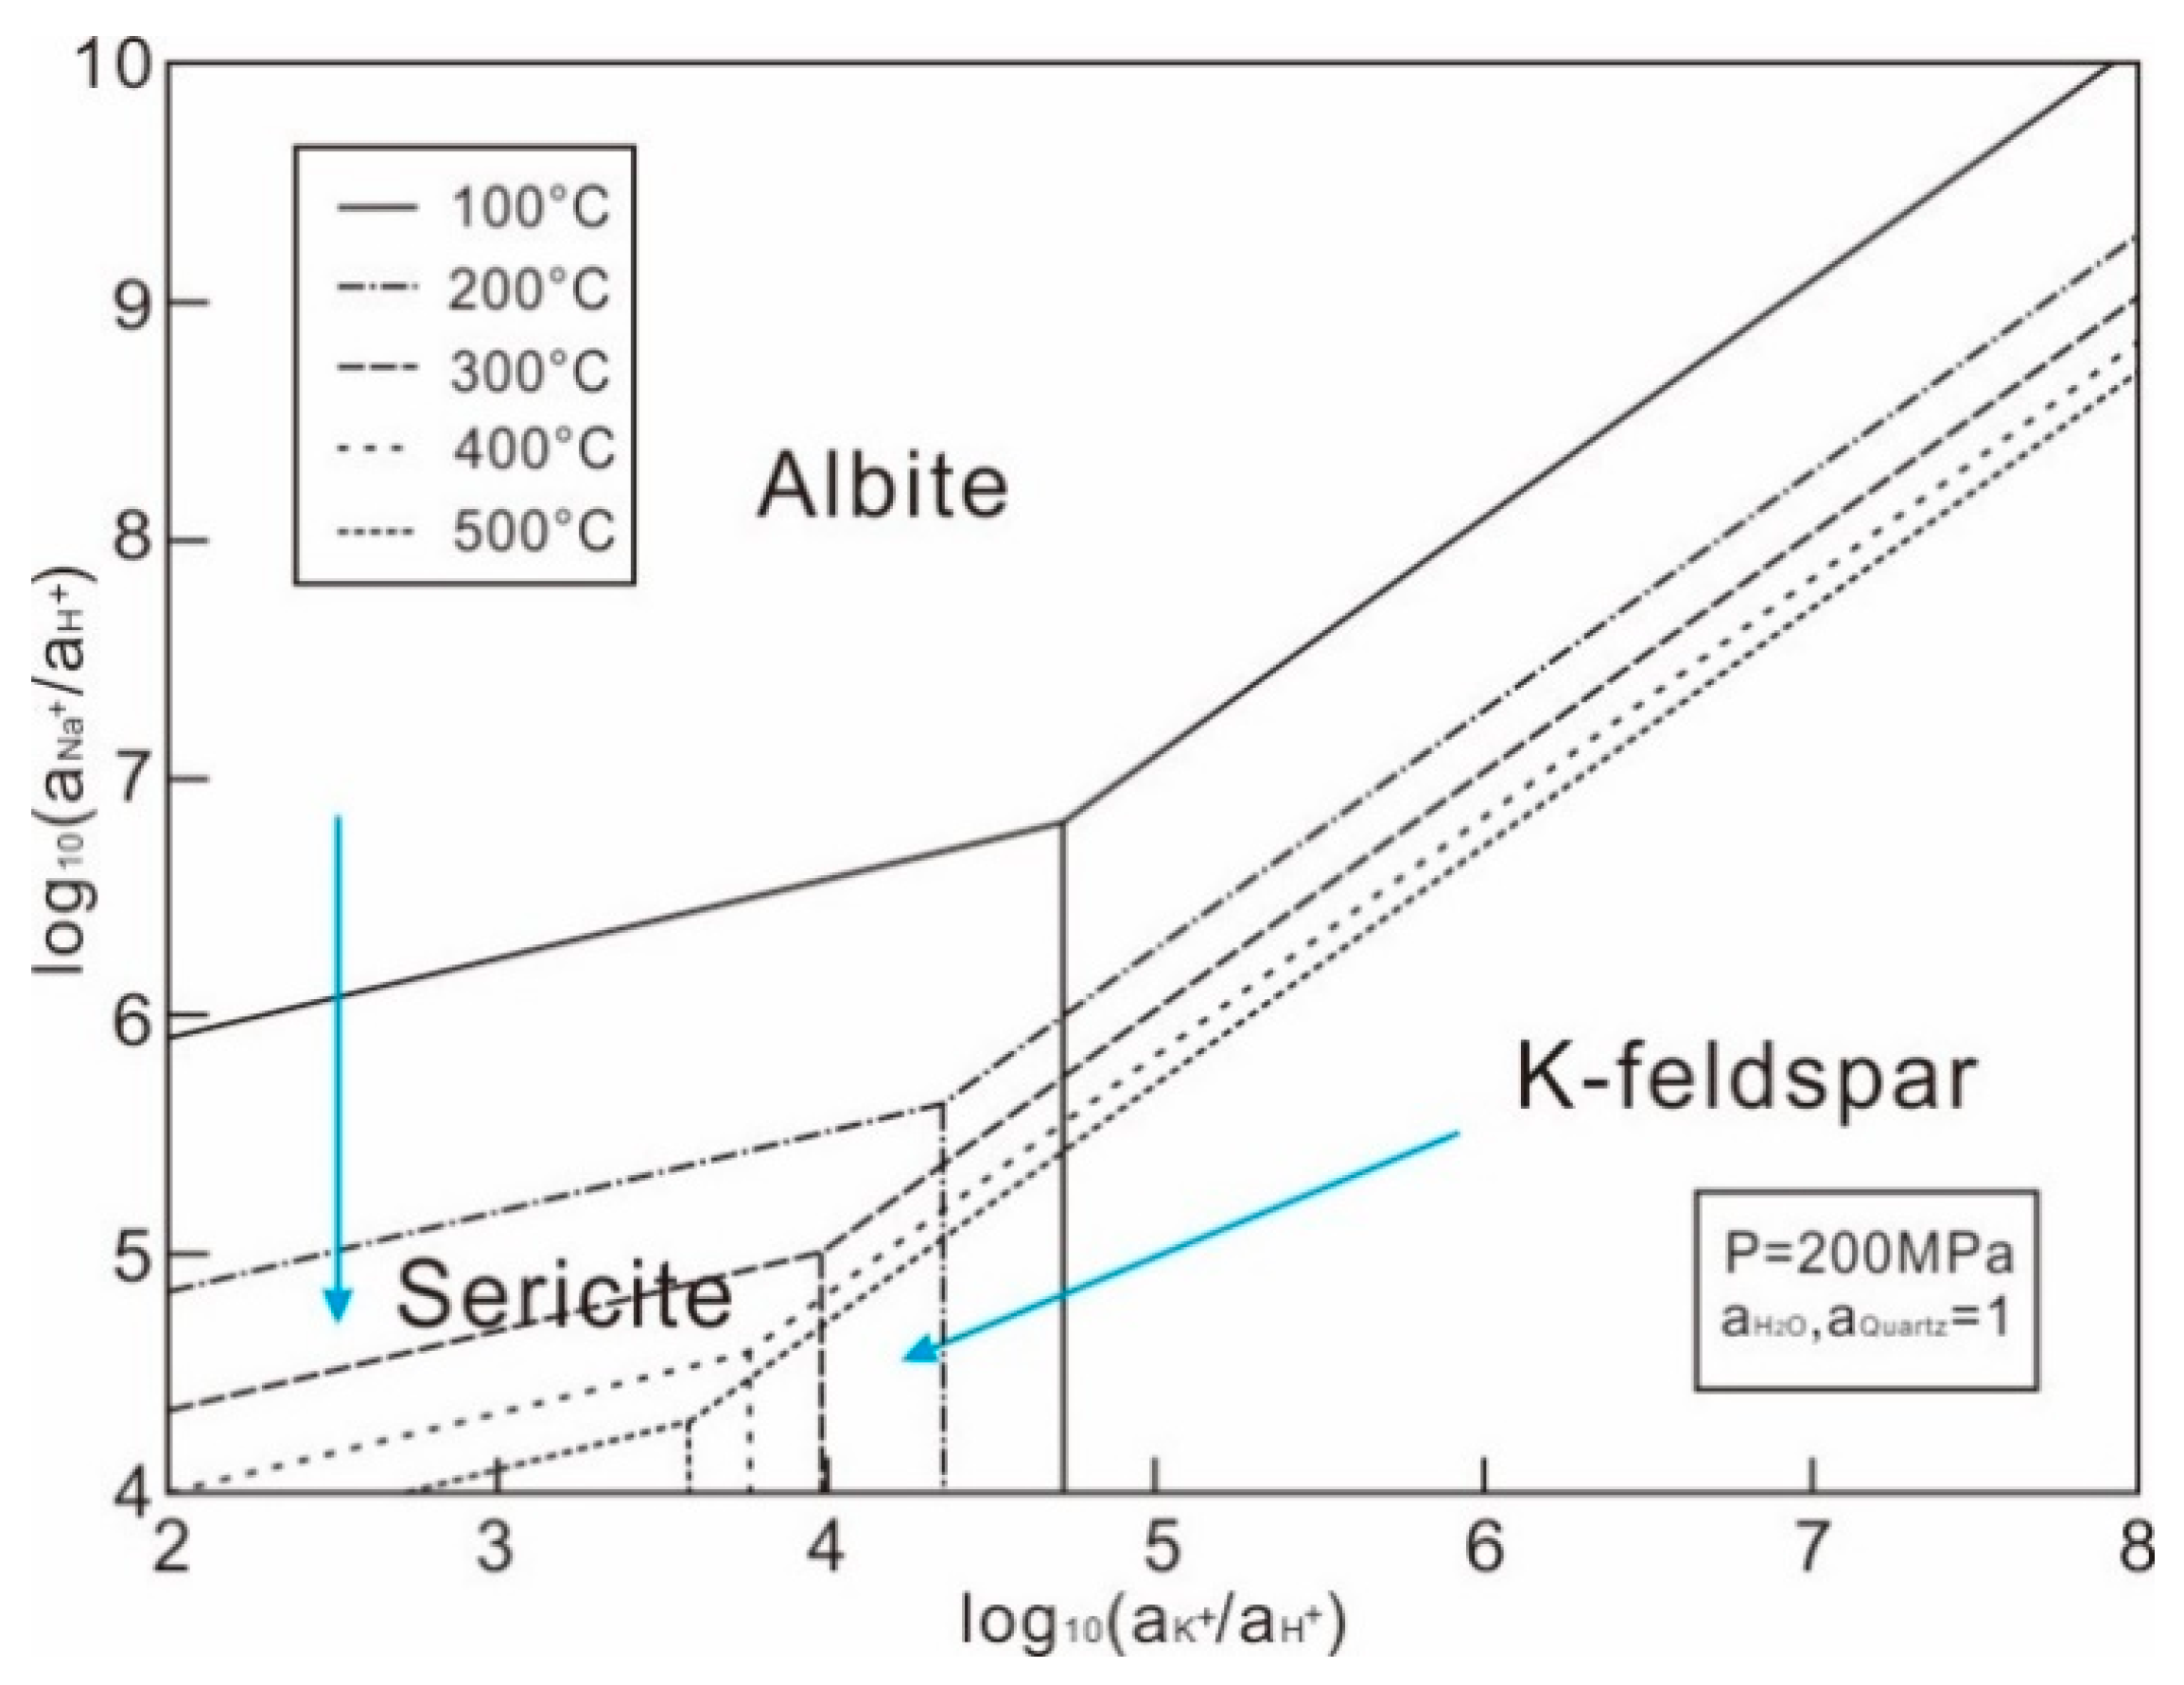
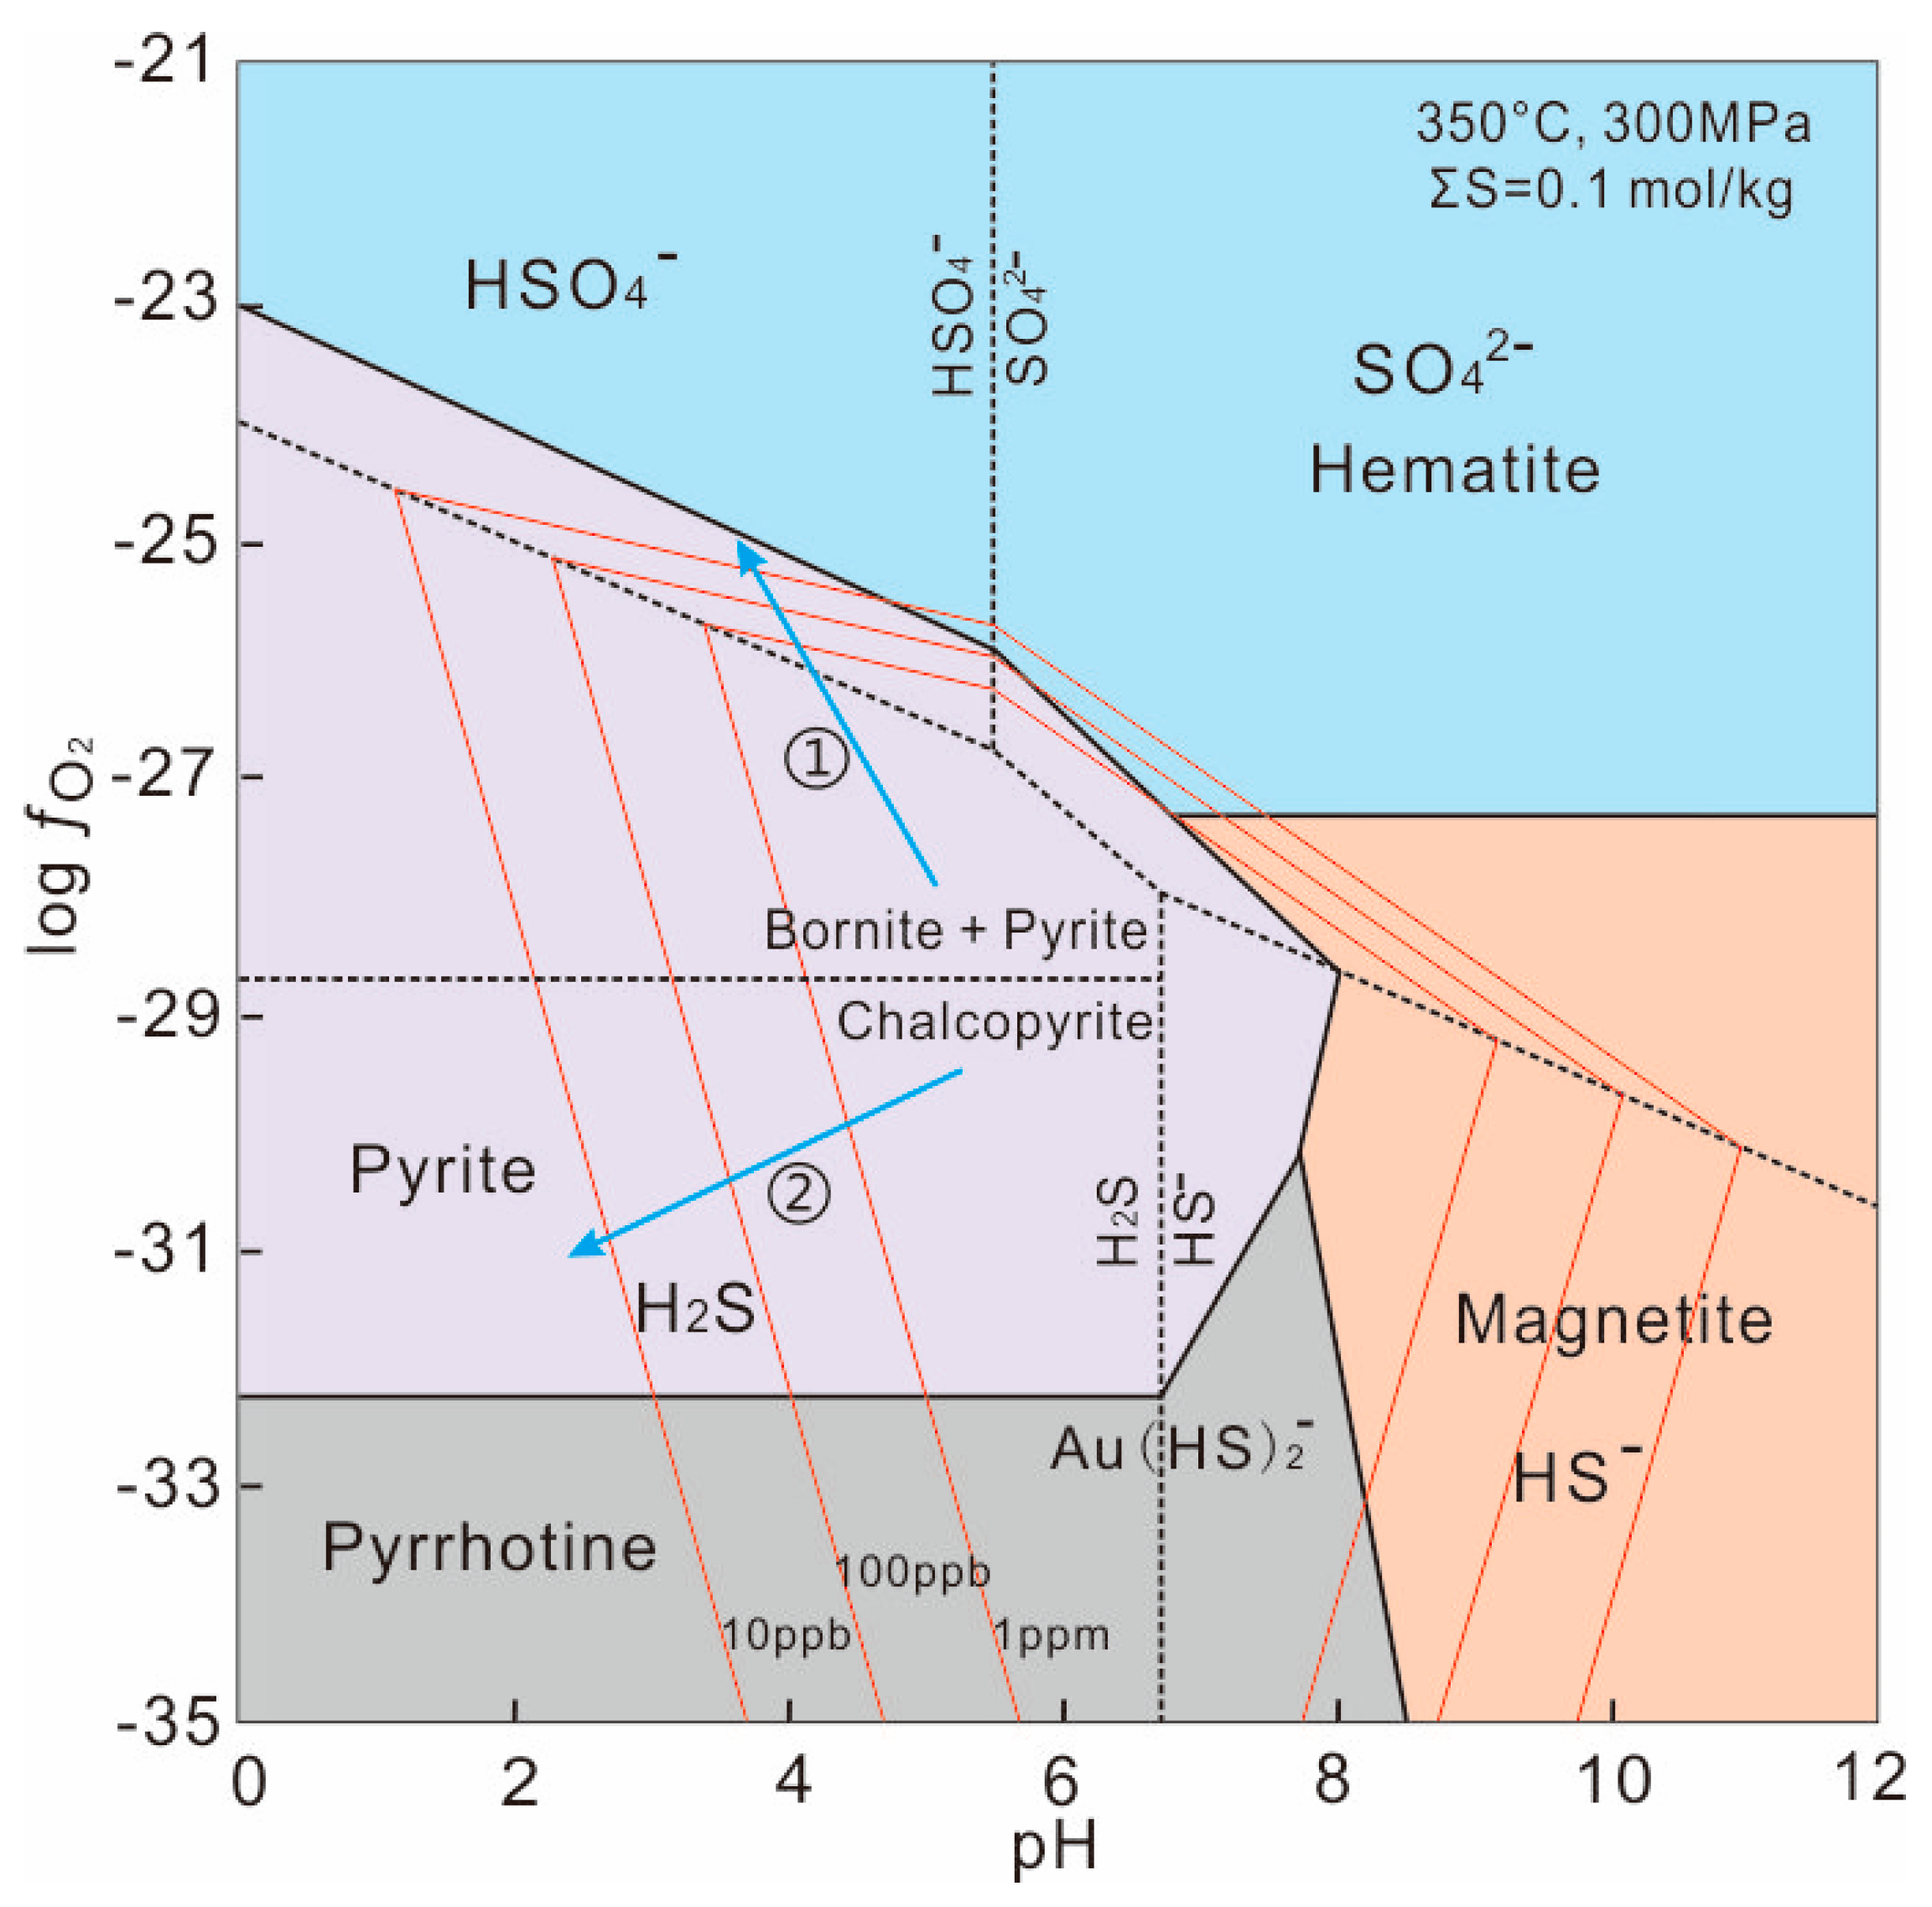
5.2. Physicochemical Conditions
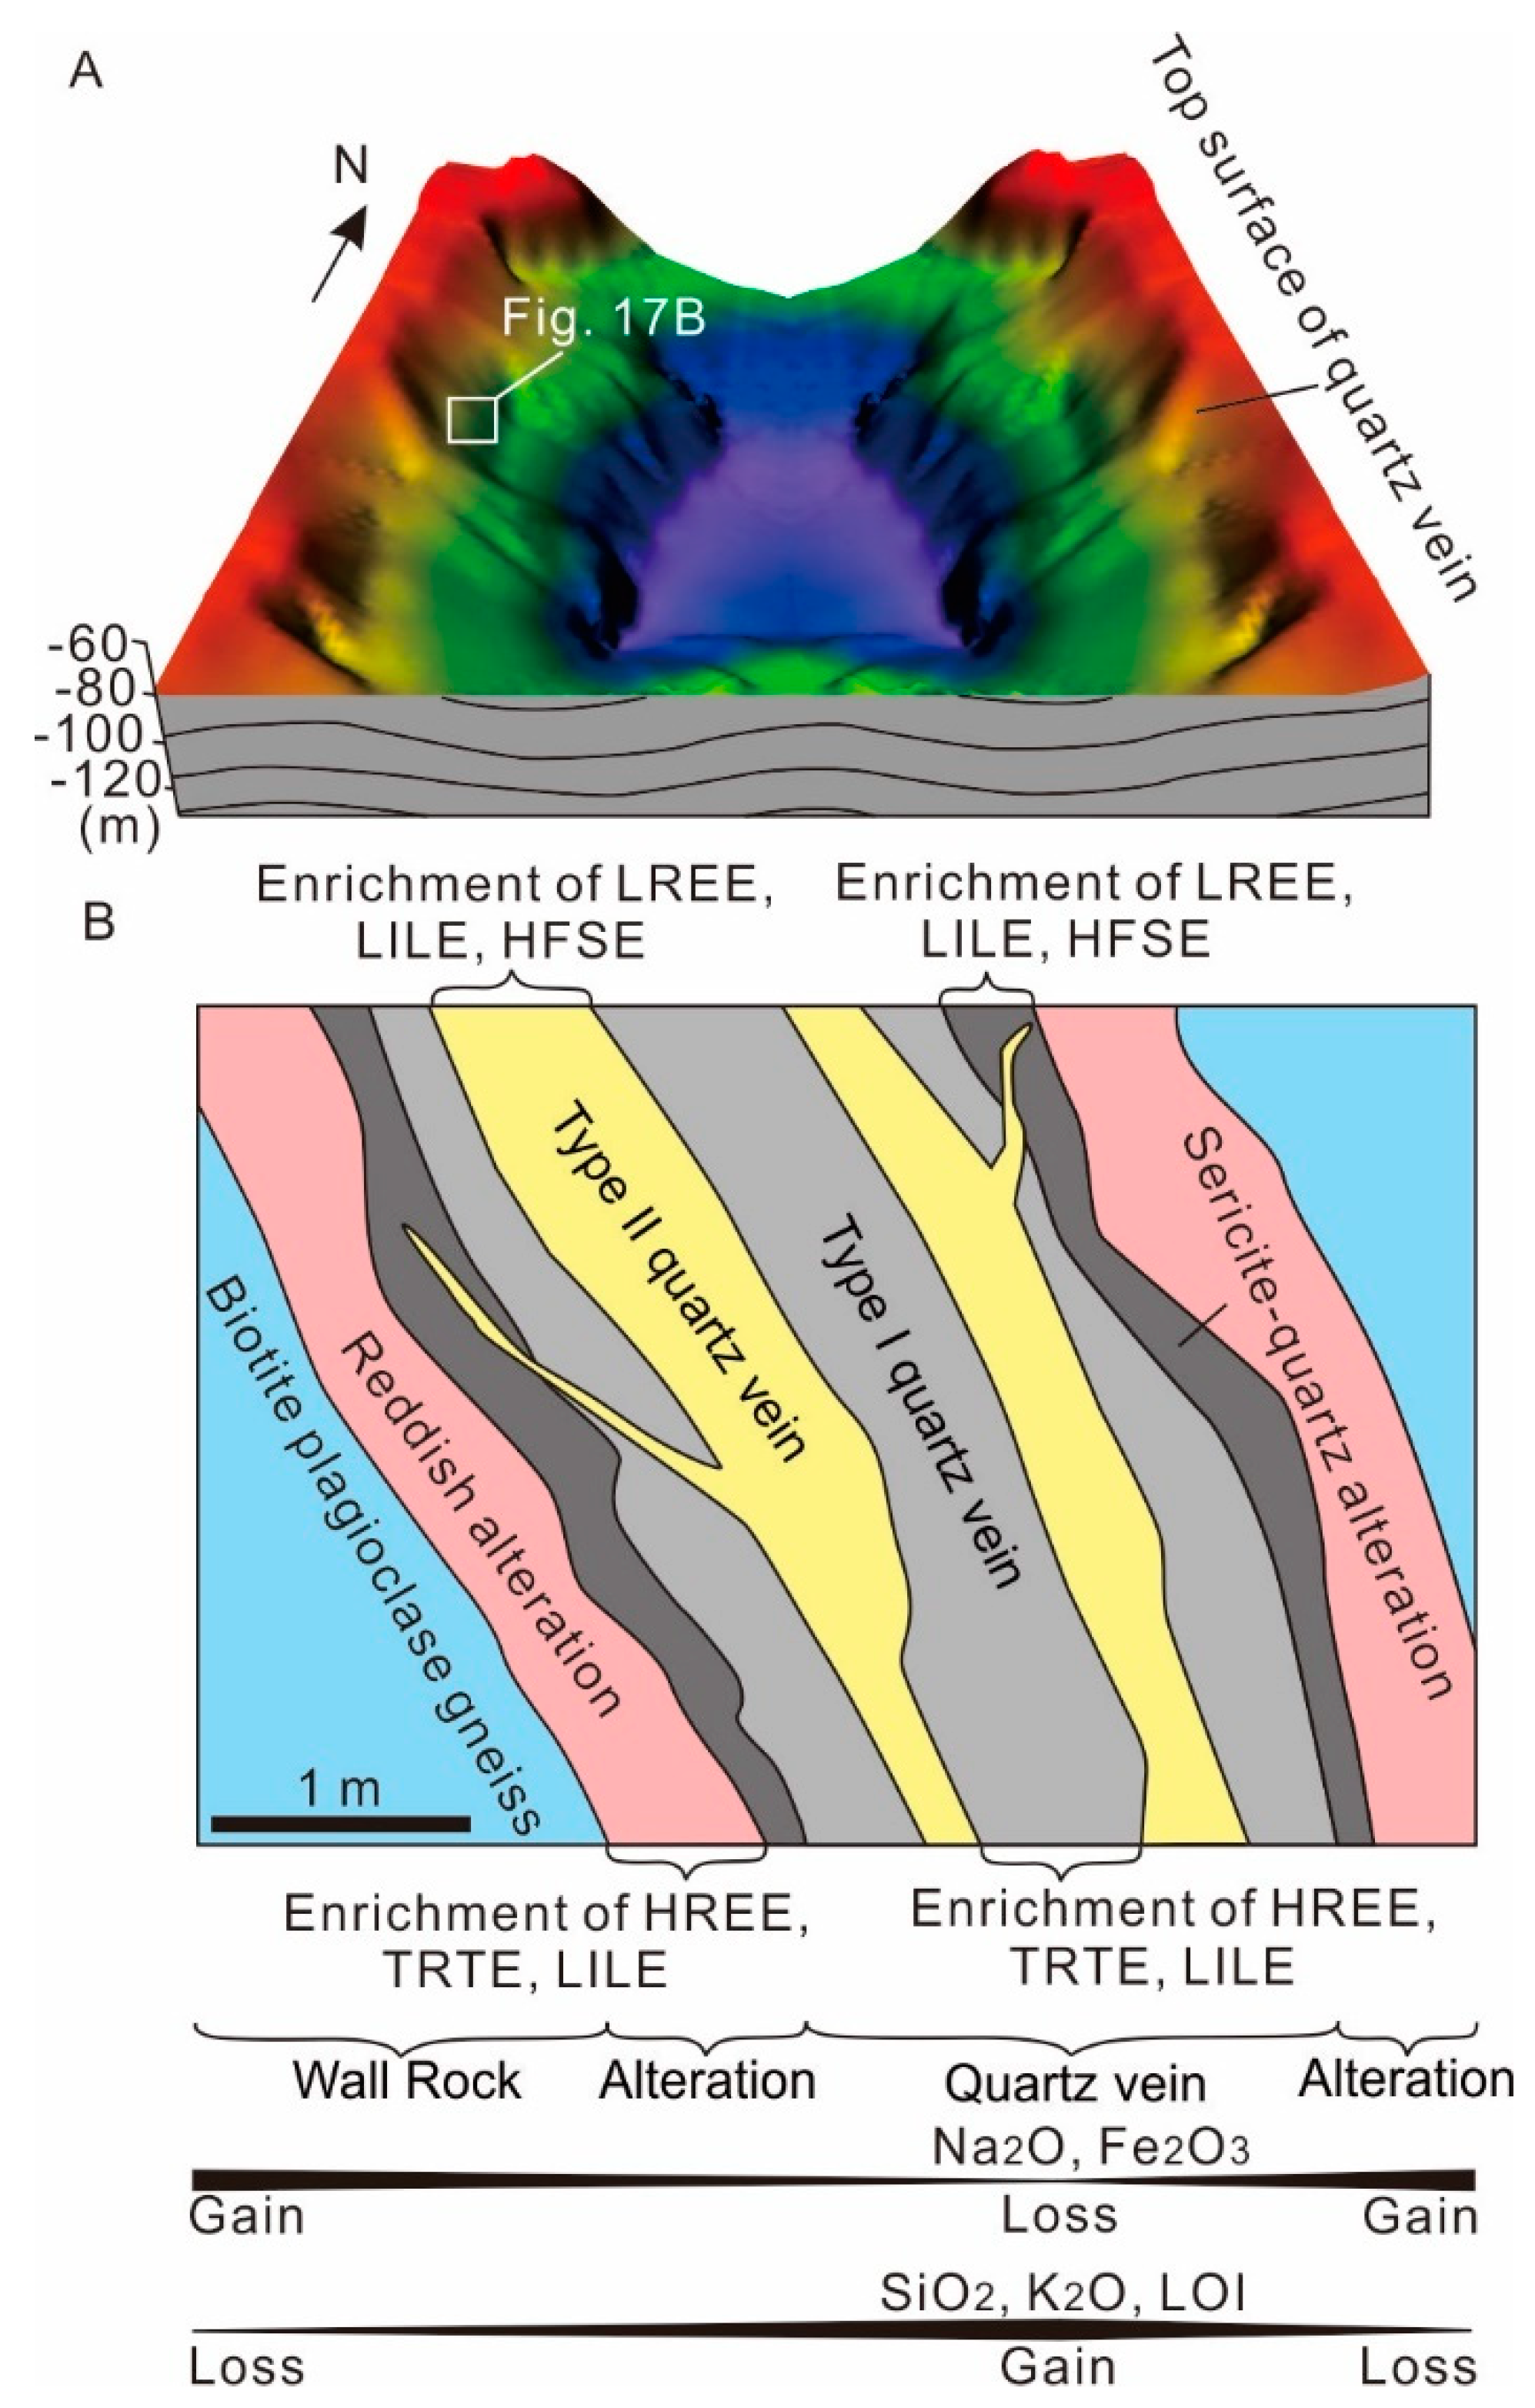
5.3. Implications for Exploration
6. Conclusions
Author Contributions
Funding
Acknowledgments
Conflicts of Interest
References
- Tang, L.; Santosh, M. Neoarchean granite-greenstone belts and related ore mineralization in the north china craton: An overview. Geosci. Front. 2018, 9, 751–768. [Google Scholar] [CrossRef]
- Li, S.R.; Santosh, M. Metallogeny and craton destruction: Records from the North China Craton. Ore Geol. Rev. 2014, 56, 376–414. [Google Scholar] [CrossRef]
- Li, S.R.; Santosh, M. Geodynamics of heterogeneous gold mineralization in the North China Craton and its relationship to lithospheric destruction. Gondwana Res. 2017, 50, 267–292. [Google Scholar] [CrossRef]
- Deng, J.; Wang, Q.F. Gold mineralization in China: Metallogenic provinces, deposit types and tectonic framework. Gondwana Res. 2016, 36, 219–274. [Google Scholar] [CrossRef]
- Goldfarb, R.J.; Santosh, M. The dilemma of the Jiaodong gold deposits: Are they unique? Geosci. Front. 2014, 5, 139–153. [Google Scholar] [CrossRef]
- Deng, J.; Wang, Q.F.; Li, G.J. Tectonic evolution, superimposed orogeny, and composite metallogenic system in China. Gondwana Res. 2017, 50, 216–266. [Google Scholar] [CrossRef]
- Groves, D.I.; Santosh, M. The giant Jiaodong gold province: The key to a unified model for orogenic gold deposits. Geosci. Front. 2016, 7, 409–418. [Google Scholar] [CrossRef]
- Bierlein, F.P.; Arne, D.C.; McKnight, S.; Lu, J.; Reeves, S.; Besanko, J.; Marek, J.; Cooke, D.R. Wall-rock petrology and geochemistry in alteration halos associated with mesothermal gold mineralization, central Victoria, Australia. Econ. Geol. 2000, 95, 283–312. [Google Scholar] [CrossRef]
- Qiu, Y.; Groves, D.I.; Mcnaughton, N.J.; Wang, L.G.; Zhou, T. Nature, age, and tectonic setting of granitoid-hosted, orogenic gold deposits of the Jiaodong Peninsula, Eastern North China Craton, China. Miner. Depos. 2002, 37, 283–305. [Google Scholar] [CrossRef]
- Mackenzie, D.J.; Craw, D.; Begbie, M. Mineralogy, geochemistry, and structural controls of a disseminated gold-bearing alteration halo around the schist-hosted bullendale orogenic gold deposit, New Zealand. J. Geochem. Explor. 2007, 93, 160–176. [Google Scholar] [CrossRef]
- Pirajno, F. Hydrothermal Processes and Mineral Systems; Springer: Dordrecht, The Netherlands, 2009; pp. 1–162. [Google Scholar]
- Li, X.C.; Fan, H.R.; Santosh, M.; Hu, F.F.; Yang, K.F.; Lan, T.G. Hydrothermal alteration associated with Mesozoic granite-hosted gold mineralization at the Sanshandao deposit, Jiaodong gold province, China. Ore Geol. Rev. 2013, 53, 403–421. [Google Scholar] [CrossRef]
- Yang, L.Q.; Deng, J.; Wang, Z.L.; Guo, L.N.; Li, R.H.; Groves, D.I.; Danyushevsky, L.V.; Zhang, C.; Zheng, X.L.; Zhao, H. Relationships between gold and pyrite at the xincheng gold deposit, jiaodong peninsula, china: Implications for gold source and deposition in a brittle epizonal environment. Econ. Geol. 2016, 111, 105–126. [Google Scholar] [CrossRef]
- Goldfarb, R.J.; Baker, T.; Dube, B.; Groves, D.I.; Hart, C.J.; Gosselin, P. Distribution, character and genesis of gold deposits in metamorphic terranes. In Economic Geology 100th Anniversary; Hedenquist, J.W., Thompson, J.F.H., Eds.; Society of Economic Geologists: Littleton, CO, USA, 2005; pp. 407–450. [Google Scholar]
- Goldfarb, R.J.; Taylor, R.D.; Collins, G.S.; Goryachev, N.A.; Orlandini, O.F. Phanerozoic continental growth and gold metallogeny of Asia. Gondwana Res. 2014, 2014. 25, 48–102. [Google Scholar] [CrossRef]
- Davies, J.H. The role of hydraulic fractures and intermediate depth earthquakes in generating subduction-zone magmatism. Nature 1999, 398, 142–145. [Google Scholar] [CrossRef]
- Bons, P.D.; van Milligen, B.P. New experiment to model self-organize critical transport and accumulation of melt and hydrocarbons from their source rocks. Geology 2001, 29, 919–922. [Google Scholar] [CrossRef]
- Faulkner, D.R.; Jackson, C.A.L.; Lunn, R.J.; Schlische, R.W.; Shipton, Z.K.; Wibberley, C.A.J.; Withjackd, M.O. A review of recent developments concerning the structure, mechanics and fluid flow properties of fault zones. J. Struct. Geol. 2010, 32, 1557–1575. [Google Scholar] [CrossRef]
- Bons, P.D.; Elburg, M.A.; Gomez-Rivas, E. A review of the formation of tectonic veins and their microstructures. J. Struct. Geol. 2012, 43, 33–62. [Google Scholar] [CrossRef]
- Putnis, A. Mineral replacement reactions. Rev. Miner. Geochem. 2009, 70, 87–124. [Google Scholar] [CrossRef]
- Jamtveit, B.; Austrheim, H. Metamorphism: The role of fluids. Elements 2010, 6, 153–158. [Google Scholar] [CrossRef]
- Arghe, F.; Skelton, A.; Pitcairn, I. Spatial coupling between spilitization and carbonation of basaltic sills in SW Scottish Highlands: Evidence of a mineralogical control of metamorphic fluid flow. Geofluids 2011, 11, 245–259. [Google Scholar] [CrossRef]
- Parsons, I.; Lee, M.R. Mutual replacement reactions in alkali feldspars I: Microtextures and mechanisms. Contrib. Miner. Petrol. 2009, 157, 641–661. [Google Scholar] [CrossRef]
- Skelton, A. Flux rate for water and carbon during greenschist facies metamorphism. Geology 2011, 39, 43–46. [Google Scholar] [CrossRef]
- Jonas, L.; John, T.; King, H.E.; Geisler, T.; Putnis, A. The role of grain boundaries and transient porosity in rocks as fluid pathways for reaction front propagation. Earth Planet. Sci. Lett. 2014, 386, 64–74. [Google Scholar] [CrossRef]
- Yang, L.Q.; Deng, J.; Wang, Z.L.; Zhang, L.; Guo, L.N.; Song, M.C.; Zheng, X.L. Mesozoic gold metallogenic system of the Jiaodong gold province, eastern China. Acta Petrol. Sin. 2014, 30, 2447–2467. (In Chinese) [Google Scholar]
- Li, L.; Santosh, M.; Li, S.R. The ‘Jiaodong type’ gold deposits: Characteristics, origin and prospecting. Ore Geol. Rev. 2015, 65, 589–611. [Google Scholar] [CrossRef]
- Lü, G.X.; Kong, Q.C. Geology on the Linglong-Jiaojia-Type Gold Deposits in the Jiaodong Area; Science Press: Beijing, China, 1993; pp. 1–253. (In Chinese) [Google Scholar]
- Yang, L.Q.; Deng, J.; Wang, Q.F.; Zhou, Y.H. Coupling effects on gold mineralization of deep and shallow structures in the Northwestern Jiaodong Peninsula, Eastern China. Acta Geol. Sin. 2006, 80, 400–411. [Google Scholar]
- Lu, H.Z.; Archambault, G.; Li, Y.; Wei, J. Structural geochemistry of gold mineralization in the Linglong-Jiaojia district, Shandong Province, China. Chin. J. Geochem. 2007, 3, 215–234. [Google Scholar] [CrossRef]
- Deng, J.; Wang, Q.F.; Yang, L.Q.; Zhou, L.; Gong, Q.J.; Yuan, W.M.; Xu, H.; Guo, C.Y.; Liu, X.W. The structure of ore-controlling strain, stress fields in the Shangzhuang gold deposit in Shandong Province, China. Acta Geol. Sin. 2008, 82, 769–780. [Google Scholar]
- Deng, J.; Yang, L.Q.; Gao, B.F.; Sun, Z.S.; Guo, C.Y.; Wang, Q.F.; Wang, P. Fluid Evolution and Metallogenic Dynamics during Tectonic Regime Transition: Example from the Jiapigou Gold Belt in Northeast China. Resour. Geol. 2009, 59, 140–152. [Google Scholar] [CrossRef]
- Bierlein, F.P.; Crowe, D.E. Phanerozoic orogenic lode gold deposits. Rev. Econ. Geol. 2000, 2000, 103–139. [Google Scholar]
- Wang, L.G.; Qiu, Y.M.; McNaughton, N.J.; Groves, D.I.; Luo, Z.K.; Huang, J.Z.; Miao, L.C.; Liu, Y.K. Constraints on crustal evolution and gold metallogeny in the northwestern Jiaodong Peninsula, China, from SHRIMP U–Pb zircon studies of granitoids. Ore Geol. Rev. 1998, 13, 275–291. [Google Scholar] [CrossRef]
- Deng, J.; Wang, C.M.; Bagas, L.; Carranza, E.J.M.; Lu, Y.J. Cretaceous–Cenozoic tectonic history of the Jiaojia Fault and gold mineralization in the Jiaodong Peninsula, China: Constraints from zircon U–Pb, illite K–Ar, and apatite fission track thermochronometry. Miner. Depos. 2015, 50, 987–1006. [Google Scholar] [CrossRef]
- Deng, J.; Yang, L.Q.; Li, R.H.; Groves, D.I.; Santosh, M.; Wang, Z.L.; Sai, S.X.; Wang, S.R. Regional structural control on the distribution of world-class gold deposits: An overview from the Giant Jiaodong Gold Province, China. Geol. J. 2018, 3, 1–14. [Google Scholar] [CrossRef]
- Jahn, B.M.; Liu, D.Y.; Wan, Y.S.; Song, B.; Wu, J.S. Archean crustal evolution of the Jiaodong Peninsula, China, as revealed by zircon shrimp geochronology elemental and Nd-isotope geochemistry. Am. J. Sci. 2008, 308, 232–269. [Google Scholar] [CrossRef]
- Wan, Y.S.; Dong, C.Y.; Xie, H.Q.; Wang, S.J.; Song, M.C.; Xu, Z.Y.; Wang, S.Y.; Zhou, H.Y.; Ma, M.Z.; Liu, D.Y. Formation Ages of Early Precambrian BIFs in the North China Craton: SHRIMP Zircon U-Pb Dating. Acta Geol. Sin. 2012, 86, 1447–1478. (In Chinese) [Google Scholar]
- Wallis, S.; Enami, M.; Banno, S. The Sulu UHP Terrane: A review of the petrology and structural geology. Int. Geol. Rev. 1999, 41, 906–920. [Google Scholar] [CrossRef]
- Tang, J.; Zheng, Y.F.; Wu, Y.B.; Gong, B.; Liu, X.M. Geochronology and Geochemistry of Metamorphic rocks in the Jiaobei terrane: Constraints on its tectonic affinity in the Sulu orogen. Precambrian Res. 2007, 152, 48–82. [Google Scholar] [CrossRef]
- Zhou, X.W.; Zhao, G.C.; Wei, C.J.; Geng, Y.S.; Sun, M. EPMA U-Th-Pb monazite and SHRIMP U-Pb zircon geochronology of high-pressure pelitic granulites in the Jiaobei massif of the North China Craton. Am. J. Sci. 2008, 308, 328–350. [Google Scholar] [CrossRef]
- Liu, P.H.; Liu, F.L.; Wang, F.; Liu, J.H.; and Cai, J. Petrological and geochronological preliminary study of the Xiliu ~2.1Ga meta-gabbro from the Jiaobei terrane, the southern segment of the Jiao-Liao-Ji Belt in the North China Craton. Acta Petrol. Sin. 2013, 29, 2371–2390. (In Chinese) [Google Scholar]
- Deng, J.; Liu, X.F.; Wang, Q.F.; Dilek, K.; Yang, L.Q. Isotopic characterization and petrogenetic modeling of early cretaceous mafic diking-lithospheric extension in the North China craton, eastern Asia. GSA Bull. 2017, 129, 1379–1407. [Google Scholar] [CrossRef]
- Yang, Q.Y.; Santosh, M. Early Cretaceous magma flare-up and its implications on gold mineralization in the Jiaodong Peninsula, China. Ore Geol. Rev. 2015, 65, 626–642. [Google Scholar] [CrossRef]
- Yang, Q.Y.; Santosh, M.; Shen, J.F.; Li, S.R. Juvenile vs. recycled crust in NE China: Zircon U-Pb geochronology, Hf isotope and an integrated model for Mesozoic gold mineralization in the Jiaodong Peninsula. Gondwana Res. 2014, 25, 1445–1468. [Google Scholar] [CrossRef]
- Zhang, J.; Zhao, Z.F.; Zheng, Y.F.; Dai, M.N. Postcollisional magmatism: Geochemical constraints on the petrogenesis of Mesozoic granitoids in the Sulu orogen, China. Lithos 2010, 119, 512–536. [Google Scholar] [CrossRef]
- Ma, L.; Jiang, S.Y.; Dai, B.Z.; Jiang, Y.H.; Hou, M.L.; Pu, W.; Xu, B. Multiple sources for the origin of Late Jurassic Linglong adakitic granite in the Shandong Peninsula, eastern China: Zircon U-Pb geochronological, geochemical and Sr-Nd-Hf isotopic evidence. Lithos 2013, 162, 251–263. [Google Scholar] [CrossRef]
- Yang, L.Q.; Deng, J.; Ge, L.S.; Wang, Q.F.; Zhang, J.; Gao, B.F.; Jiang, S.Q.; Xu, H. Metallogenic Age and Genesis of Gold Ore Deposits in Jiaodong Peninsula, Eastern China: A Regional Review. Prog. Nat. Sci. 2007, 17, 138–143. [Google Scholar]
- Yang, L.Q.; Deng, J.; Zhang, J.; Guo, C.Y.; Gao, B.F.; Gong, Q.J.; Wang, Q.F.; Jiang, S.Q.; Yu, H.J. Decrepitation Thermometry and Compositions of Fluid Inclusions of the Damoqujia Gold Deposit, Jiaodong Gold Province, China: Implications for Metallogeny and Exploration. J. Earth Sci. 2008, 19, 378–390. [Google Scholar]
- Zhao, Z.; Zhao, Z.X.; Xu, J.R. Velocity structure heterogeneity and tectonic motion in and around the Tan-Lu fault of China. J. Asian Earth Sci. 2012, 57, 6–14. [Google Scholar] [CrossRef]
- Sibson, R.H. Brittle failure mode plots for compressional and extensional tectonic regimes. J. Struct. Geol. 1998, 20, 655–660. [Google Scholar] [CrossRef]
- Cox, S.F. The application of failure mode diagrams for exploring the roles of fluid pressure and stress states in controlling styles of fracture-controlled permeability enhancement in faults and shear zones. Geofluids 2010, 10, 217–233. [Google Scholar]
- Cox, S.F.; Munroe, S.M. Breccia formation by particle fluidization in fault zones: Implications for transitory, rupture-controlled fluid flow regimes in hydrothermal systems. Am. J. Sci. 2016, 316, 241–278. [Google Scholar] [CrossRef]
- Li, X.H.; Qi, C.S.; Liu, Y.; Liang, X.R.; Tu, X.L.; Xie, L.W.; Yang, Y.H. Petrogenesis of the Neoproterozoic bimodal volcanic rocks along the western margin of the Yangtze Block: New constraints from Hf isotopes and Fe/Mn ratios. Chin. Sci. Bull. 2005, 50, 2481–2486. [Google Scholar] [CrossRef]
- Sun, S.S.; McDonough, W.F. Chemical and isotopic systematics of oceanic basalts: Implications for mantle composition and processes. Geol. Soc. Lond. Spec. Publ. 1989, 42, 313–345. [Google Scholar] [CrossRef]
- Gresens, R.L. Composition-volume relations of metasomatism. Chem. Geol. 1967, 2, 47–65. [Google Scholar] [CrossRef]
- Grant, J.A. The isocon diagram—A simple solution to Gresens equation for metasomatic alteration. Econ. Geol. 1986, 81, 1976–1982. [Google Scholar] [CrossRef]
- Kishida, A.; Kerrich, R. Hydrothermal alteration zoning and gold concentration at the kerr-Addison Archean lode gold deposit, Kirkland Lake, Ontario. Econ. Geol. 1987, 82, 649–690. [Google Scholar] [CrossRef]
- Putnis, A.; John, T. Replacement processes in the Earth’s Crust. Elements 2009, 6, 159–164. [Google Scholar] [CrossRef]
- Cox, S.F.; Braun, J.; Knackstedt, M.A. Principles of structural control on permeability and fluid flow in hydrothermal systems. Rev. Econ. Geol. 2001, 14, 1–24. [Google Scholar]
- Putnis, A.; Hinrichs, R.; Putnis, C.V.; Golla-Schindler, U.; Collins, L.G. Hematite in porous red-clouded feldspars: Evidence of large-scale crustal fluid-rock interaction. Lithos 2007, 95, 10–18. [Google Scholar] [CrossRef]
- Carmichael, D.M. On the mechanism of prograde metamorphic reactions in quartz-bearing pelitic rocks. Contrib. Miner. Petrol. 1969, 20, 244–267. [Google Scholar] [CrossRef]
- Du, X.J. Study on the technological mineralogy of the ores from the −145 level gold deposit of altered-rock type in Xincheng, Laizhou city. Geol. Shandong 1988, 4, 69–79. (In Chinese) [Google Scholar]
- Huston, D.L.; Large, R.R. A chemical model for the concentration of gold in volcanogenic massive sulfide deposits. Ore Geol. Rev. 1989, 4, 174–200. [Google Scholar] [CrossRef]
- Stefánsson, A.; Seward, T.M. Gold(I) complexing in aqueous sulphide solutions to 500 °C at 500 bar. Geochim. Cosmochim. Acta 2004, 68, 4121–4143. [Google Scholar] [CrossRef]
- Williams-Jones, A.E.; Bowell, R.J.; Migdisov, A.A. Gold in solution. Elements 2009, 5, 281–287. [Google Scholar] [CrossRef]
- Wilkinson, J.J.; Johnston, J.D. Pressure fluctuations, phase separation, and gold precipitation during seismic fracture propagation. Geology 1996, 24, 395–398. [Google Scholar] [CrossRef]
- Wang, Z.L.; Yang, L.Q.; Guo, L.N.; Marsh, E.; Wang, J.P.; Liu, Y.; Zhang, C.; Li, R.H.; Zhang, L.; Zheng, X.L.; et al. Fluid immiscibility and gold deposition in the Xincheng deposit, Jiaodong Peninsula, China: A fluid inclusion study. Ore Geol. Rev. 2015, 65, 701–717. [Google Scholar] [CrossRef]
- Plümper, O.; Putnis, A. The complex hydrothermal history of granitic rocks: Multiple feldspar replacement reactions under subsolidus conditions. J. Petrol. 2009, 50, 967–987. [Google Scholar] [CrossRef]
- Yang, L.Q.; Deng, J.; Guo, L.N.; Wang, Z.L.; Li, X.Z.; Li, J.L. Origin and evolution of ore fluid, and Au deposition processes at the giant Taishang Au deposit, Jiaodong Peninsula, eastern China. Ore Geol. Rev. 2016, 72, 582–602. [Google Scholar] [CrossRef]
- Guo, L.N.; Goldfarb, R.J.; Wang, Z.L.; Li, R.H.; Chen, B.H.; Li, J.L. A comparison of Jiaojia-and Linglong-type gold deposit ore-forming fluids: Do they differ? Ore Geol. Rev. 2017, 88, 511–533. [Google Scholar] [CrossRef]
- Scholz, C.H. The brittle-plastic transition and the depth of seismic faulting. Geol. Rundsch. 1988, 77, 319–328. [Google Scholar] [CrossRef]
- Passchier, C.W.; Trouw, R.A. Microtectonics, 2nd ed.; Springer: Berlin, Germany, 2005; pp. 1–289. [Google Scholar]
- Li, R.H.; Liu, Y.; Li, H.L.; Zheng, X.L.; Zhao, H.; Lu, H.W. Ore-controlling structure deformation condition of Xincheng gold deposit, Jiaodong: The microstructure and EBSD fabrics analysis constrain. Acta Petrol. Sin. 2014, 30, 2546–2558. (In Chinese) [Google Scholar]
- Sverjensky, D.A.; Hemley, J.J.; D’Angelo, W.M. Thermodynamic assessment of hydrothermal alkali feldspar-mica-aluminosilicate equilibria. Geochim. Cosmochim. Acta 1991, 55, 989–1004. [Google Scholar] [CrossRef]
- Akinfiev, N.N.; Zotov, A.V. Thermodynamic description of aqueous species in the system Cu–Ag–Au–S–O–H at temperatures of 0–600 °C and pressures of 1–3000 bar. Geochem. Int. 2010, 48, 714–720. [Google Scholar] [CrossRef]
- Johnson, J.W.; Oelkers, E.H.; Helgeson, H.C. SUPCRT92: A software package for calculating the standard molal thermodynamic properties of minerals, gases, aqueous species, and reactions from 1 to 5000 bars and 0 to 1000 °C. Comput. Geosci. 1992, 18, 899–947. [Google Scholar] [CrossRef]
- Faure, G.; Mensing, T.M. Isotopes Principles and Applications, 2nd ed.; John Wiley & Sons: New York, NY, USA, 2005; pp. 1–343. [Google Scholar]
- Yang, L.Q.; Guo, L.N.; Wang, Z.L.; Zhao, R.X.; Song, M.C.; Zheng, X.L. Timing and mechanism of gold mineralization at the Wang’ershan gold deposit, Jiaodong peninsula, eastern china. Ore Geol. Rev. 2016, 88, 491–510. [Google Scholar] [CrossRef]
- Rollinson, H.R. Using Geochemical Data: Evaluation, Presentation, Interpretation; Longman Publishing Group: New York, NY, USA, 1993; pp. 1–441. [Google Scholar]
- Zhang, L.; Yang, L.Q.; Wang, Y.; Weinberg, R.F.; An, P.; Chen, B.Y. Thermochronologic constrains on the processes of formation and exhumation of the Xinli orogenic gold deposit, Jiaodong Peninsula, eastern China. Ore Geol. Rev. 2017, 81, 140–153. [Google Scholar] [CrossRef]


| Samples | Au | Ag | S | As | Se | Fe | Zn | Pb | Cu | Sb | Cd | Bi | Te | Total (%) | Mineral |
|---|---|---|---|---|---|---|---|---|---|---|---|---|---|---|---|
| 02B1-1 | 71.37 | 28.30 | 0.04 | / | / | / | / | / | / | / | 0.06 | 0.15 | / | 99.92 | Electrum |
| 02B1-2 | 62.19 | 36.89 | 0.05 | / | / | / | / | / | / | / | 0.07 | 0.67 | 0.05 | 99.92 | Electrum |
| 02B1-3 | 59.03 | 39.64 | 0.11 | / | / | 0.63 | / | / | / | / | / | 0.48 | 0.03 | 99.92 | Electrum |
| 02B1-4 | 72.86 | 25.80 | 0.03 | / | / | 0.62 | / | / | / | / | / | 0.61 | / | 99.92 | Electrum |
| 02B1-5 | 71.65 | 27.51 | 0.02 | 0.06 | / | 0.42 | / | / | / | 0.05 | / | 0.23 | 0.04 | 99.98 | Electrum |
| 02B1-6 | 55.92 | 43.67 | / | / | 0.06 | 0.14 | / | / | / | / | / | 0.14 | 0.05 | 99.98 | Electrum |
| 02B1-7 | 72.15 | 26.86 | / | / | / | 0.19 | / | / | / | / | / | 0.57 | 0.07 | 99.84 | Electrum |
| 14B2-1 | / | / | 34.42 | / | / | 30.44 | 0.06 | 0.14 | 34.23 | / | / | / | / | 99.29 | Chalcopyrite |
| 20B1-2 | / | / | 34.58 | 0.07 | / | 30.24 | / | 0.09 | 33.72 | / | / | 0.15 | 0.03 | 98.88 | Chalcopyrite |
| 28B1-2 | 0.08 | 0.72 | 33.94 | / | / | 32.22 | 0.11 | 0.20 | 31.61 | / | 0.06 | 0.11 | / | 99.05 | Chalcopyrite |
| 16B1-1 | / | / | 13.46 | / | / | / | / | 86.3 | / | / | 0.07 | 0.29 | 0.07 | 100.19 | Galena |
| 16B1-2 | / | / | 13.74 | / | / | 0.06 | / | 86.28 | / | / | 0.15 | 0.21 | 0.03 | 100.47 | Galena |
| 20B1-1 | / | / | 13.34 | / | / | / | / | 86.39 | / | 0.04 | 0.11 | 0.30 | / | 100.18 | Galena |
| 28B1-1 | / | / | 13.55 | / | / | 0.12 | / | 85.34 | / | / | 0.10 | 0.29 | / | 99.40 | Galena |
| 14B2-2 | / | / | 53.67 | 0.04 | / | 46.22 | / | 0.14 | / | / | / | 0.11 | / | 100.18 | Pyrite |
| 16B1-3 | 0.04 | / | 53.52 | / | / | 46.40 | / | 0.11 | / | / | / | / | 0.03 | 100.10 | Pyrite |
| 20B1-3 | / | 0.09 | 53.42 | / | / | 46.05 | / | 0.16 | 0.11 | / | 0.03 | / | / | 99.86 | Pyrite |
| 28B1-3 | 0.06 | / | 53.57 | 0.05 | 0.03 | 45.80 | / | 0.21 | / | / | 0.04 | / | / | 99.76 | Pyrite |
| Samples | Biotite Plagioclase Gneiss | Reddish Alterated Rock | Sericite-Quartz Alterated Rock | ||||||||||
|---|---|---|---|---|---|---|---|---|---|---|---|---|---|
| 07B3 | 13B1 | 18B5 | 04B1 | 17B1 | 18B4 | 27B1 | 02B2 | 03B2 | 07B2 | 14B1 | 19B2 | 24B2 | |
| SiO2 | 70.96 | 67.62 | 74.34 | 75.77 | 58.24 | 72.84 | 72.09 | 72.47 | 75.02 | 67.57 | 68.18 | 69.16 | 58.67 |
| Al2O3 | 15.24 | 16.11 | 14.34 | 13.64 | 16.46 | 13.82 | 13.55 | 12.80 | 15.30 | 15.42 | 18.80 | 14.49 | 19.60 |
| Fe2O3 | 2.22 | 2.78 | 0.76 | 0.65 | 7.91 | 3.19 | 1.80 | 5.23 | 1.66 | 4.14 | 2.32 | 2.98 | 3.05 |
| MgO | 1.30 | 1.92 | 0.43 | 0.28 | 3.22 | 0.78 | 0.73 | 2.23 | 0.56 | 2.14 | 0.79 | 0.85 | 1.14 |
| CaO | 2.31 | 3.02 | 2.61 | 1.26 | 6.57 | 1.45 | 2.53 | 0.38 | 0.15 | 0.98 | 0.41 | 2.85 | 1.33 |
| Na2O | 5.08 | 4.86 | 5.27 | 5.49 | 4.64 | 5.07 | 4.5 | 0.25 | 0.21 | 3.76 | 0.28 | 0.34 | 0.18 |
| K2O | 1.35 | 1.54 | 1.02 | 1.29 | 0.84 | 1.29 | 1.65 | 3.30 | 4.57 | 2.55 | 5.94 | 4.40 | 6.11 |
| MnO | 0.03 | 0.04 | 0.02 | 0.03 | 0.21 | 0.04 | 0.04 | 0.08 | 0.02 | 0.03 | 0.01 | 0.09 | 0.08 |
| TiO2 | 0.27 | 0.39 | 0.06 | 0.06 | 0.80 | 0.21 | 0.19 | 0.25 | 0.12 | 0.44 | 0.12 | 0.29 | 0.20 |
| P2O5 | 0.09 | 0.11 | 0.03 | 0.03 | 0.14 | 0.06 | 0.06 | 0.12 | 0.04 | 0.15 | 0.03 | 0.09 | 0.05 |
| LOI* | 1.04 | 1.48 | 1.01 | 1.49 | 0.86 | 1.12 | 2.81 | 2.81 | 2.24 | 2.75 | 3.02 | 4.37 | 4.55 |
| TOTAL | 99.91 | 99.89 | 99.90 | 100.00 | 99.90 | 99.89 | 99.96 | 99.94 | 99.91 | 99.94 | 99.93 | 99.93 | 94.99 |
| B | 9.42 | 10.50 | 10.80 | 10.90 | 7.69 | 8.59 | 10.30 | 27.20 | 34.60 | 11.40 | 32.50 | 14.20 | 24.10 |
| Li | 20.40 | 25.40 | 5.31 | 4.73 | 20.60 | 19.50 | 6.11 | 15.50 | 3.51 | 16.30 | 3.15 | 11.40 | 4.30 |
| Be | 0.84 | 1.27 | 0.99 | 0.63 | 1.21 | 0.97 | 0.61 | 1.30 | 1.45 | 0.86 | 1.69 | 1.14 | 1.61 |
| Sc | 3.96 | 5.09 | 1.35 | 1.29 | 16.80 | 3.35 | 2.70 | 3.43 | 1.63 | 5.18 | 2.03 | 4.23 | 2.67 |
| V | 28.00 | 46.60 | 10.50 | 10.80 | 127.00 | 28.10 | 14.30 | 28.80 | 12.80 | 41.80 | 30.30 | 25.90 | 28.50 |
| Cr | 5.03 | 8.19 | 2.72 | 3.03 | 23.10 | 7.46 | 2.96 | 4.86 | 2.98 | 8.87 | 2.25 | 4.93 | 2.24 |
| Co | 5.50 | 8.83 | 1.06 | 0.97 | 16.20 | 3.16 | 3.27 | 5.87 | 2.13 | 8.08 | 3.08 | 3.51 | 2.28 |
| Ni | 3.98 | 12.80 | 1.39 | 1.56 | 24.30 | 3.50 | 1.84 | 5.19 | 1.62 | 6.44 | 3.82 | 3.34 | 2.53 |
| Cu | 4.01 | 25.60 | 5.51 | 44.20 | 35.90 | 6.74 | 14.90 | 12.60 | 112.00 | 5.34 | 9.95 | 18.80 | 49.10 |
| Zn | 49.60 | 54.10 | 19.20 | 18.80 | 142.00 | 81.00 | 33.80 | 316.00 | 43.20 | 70.50 | 36.80 | 59.00 | 56.50 |
| Ga | 19.10 | 18.20 | 17.20 | 14.60 | 22.80 | 19.60 | 15.80 | 17.60 | 18.90 | 20.60 | 23.20 | 18.00 | 24.40 |
| Rb | 45.40 | 53.30 | 19.60 | 39.90 | 14.00 | 34.10 | 49.40 | 97.60 | 129.00 | 98.10 | 154.00 | 130.00 | 174.00 |
| Sr | 286 | 382 | 248 | 226 | 303 | 209 | 138 | 25.20 | 9.97 | 84.70 | 10.70 | 46.40 | 40.20 |
| Y | 5.49 | 5.60 | 3.09 | 2.23 | 19.80 | 6.91 | 4.32 | 6.78 | 5.24 | 8.44 | 1.52 | 6.69 | 3.93 |
| Mo | 0.14 | 0.13 | 0.14 | 0.11 | 0.49 | 0.15 | 0.18 | 0.20 | 0.15 | 0.21 | 1.09 | 0.13 | 0.05 |
| Cd | 0.15 | 0.13 | 0.16 | 0.15 | 0.44 | 0.34 | 0.14 | 4.16 | 0.44 | 0.25 | 0.29 | 0.16 | 8.51 |
| In | 0.02 | 0.02 | 0.01 | 0.01 | 0.07 | 0.02 | 0.01 | 0.02 | 0.02 | 0.03 | 0.05 | 0.03 | 0.11 |
| Sb | 0.08 | 0.11 | 0.07 | 0.18 | 0.08 | 0.16 | 0.20 | 0.41 | 0.46 | 0.26 | 0.27 | 0.45 | 4.73 |
| Cs | 1.93 | 1.44 | 1.30 | 1.17 | 0.41 | 1.66 | 1.88 | 1.42 | 1.90 | 2.10 | 2.04 | 2.94 | 2.54 |
| Ba | 252 | 374 | 133 | 220 | 102 | 171 | 228 | 207 | 270 | 779 | 723 | 387 | 571 |
| La | 19.70 | 17.00 | 9.59 | 4.69 | 14.70 | 23.30 | 7.14 | 16.10 | 24.40 | 28.50 | 9.39 | 22.50 | 18.70 |
| Ce | 34.70 | 32.10 | 17.80 | 8.40 | 31.10 | 43.60 | 12.60 | 30.30 | 45.50 | 53.20 | 17.20 | 39.10 | 31.70 |
| Pr | 3.81 | 3.78 | 2.03 | 0.94 | 3.89 | 4.90 | 1.40 | 3.46 | 5.12 | 5.94 | 1.90 | 4.23 | 3.27 |
| Nd | 13.70 | 14.90 | 7.53 | 3.38 | 15.70 | 17.90 | 5.49 | 13.20 | 19.50 | 21.40 | 7.07 | 15.20 | 11.40 |
| Sm | 2.22 | 2.36 | 1.37 | 0.66 | 3.29 | 3.23 | 1.04 | 2.28 | 3.46 | 3.37 | 1.06 | 2.66 | 1.67 |
| Eu | 0.78 | 0.78 | 0.57 | 0.42 | 1.41 | 0.68 | 0.44 | 0.51 | 0.46 | 0.85 | 0.26 | 0.77 | 0.47 |
| Gd | 1.92 | 2.01 | 1.16 | 0.55 | 2.92 | 2.67 | 0.95 | 1.89 | 2.82 | 2.96 | 0.91 | 2.29 | 1.48 |
| Tb | 0.27 | 0.28 | 0.16 | 0.09 | 0.61 | 0.40 | 0.17 | 0.29 | 0.37 | 0.41 | 0.11 | 0.33 | 0.18 |
| Dy | 1.22 | 1.28 | 0.66 | 0.43 | 3.26 | 1.61 | 0.79 | 1.40 | 1.47 | 1.87 | 0.39 | 1.49 | 0.78 |
| Ho | 0.21 | 0.21 | 0.12 | 0.08 | 0.67 | 0.27 | 0.15 | 0.25 | 0.20 | 0.31 | 0.06 | 0.24 | 0.14 |
| Er | 0.59 | 0.58 | 0.32 | 0.22 | 1.90 | 0.72 | 0.43 | 0.69 | 0.50 | 0.90 | 0.16 | 0.64 | 0.42 |
| Tm | 0.09 | 0.08 | 0.04 | 0.04 | 0.33 | 0.10 | 0.07 | 0.11 | 0.06 | 0.13 | 0.02 | 0.09 | 0.07 |
| Yb | 0.45 | 0.48 | 0.29 | 0.23 | 2.05 | 0.60 | 0.41 | 0.63 | 0.38 | 0.77 | 0.11 | 0.55 | 0.41 |
| Lu | 0.07 | 0.06 | 0.04 | 0.03 | 0.31 | 0.09 | 0.06 | 0.10 | 0.05 | 0.12 | 0.02 | 0.07 | 0.06 |
| W | 0.47 | 0.16 | 1.78 | 2.36 | 1.01 | 5.58 | 1.51 | 3.02 | 8.80 | 2.22 | 7.67 | 3.49 | 8.36 |
| Re | 0.005 | 0.004 | 0.003 | <0.002 | 0.008 | 0.006 | 0.006 | <0.002 | 0.002 | 0.002 | 0.007 | <0.002 | 0.002 |
| Tl | 0.22 | 0.24 | 0.08 | 0.19 | 0.08 | 0.14 | 0.24 | 0.53 | 0.68 | 0.45 | 0.75 | 0.63 | 0.88 |
| Pb | 9.44 | 242 | 108 | 30.30 | 261 | 61.40 | 71.90 | 337 | 2081 | 10.70 | 165 | 85.90 | 35622 |
| Bi | 0.03 | 0.43 | 0.16 | 0.05 | 0.45 | 0.17 | 0.04 | 0.06 | 0.07 | 0.05 | 0.30 | 0.02 | 2.61 |
| Th | 2.39 | 1.88 | 1.87 | 0.76 | 2.03 | 4.94 | 1.41 | 2.07 | 4.37 | 3.43 | 2.03 | 2.88 | 2.44 |
| U | 0.41 | 1.96 | 0.36 | 0.49 | 1.24 | 0.42 | 0.41 | 1.17 | 1.07 | 0.96 | 1.26 | 0.29 | 0.37 |
| Nb | 4.49 | 6.40 | 1.94 | 2.62 | 10.50 | 5.07 | 3.39 | 5.53 | 4.40 | 8.22 | 1.54 | 7.73 | 3.75 |
| Ta | 0.29 | 0.78 | 0.23 | 0.18 | 0.81 | 0.28 | 0.23 | 0.44 | 0.38 | 0.50 | 0.11 | 0.37 | 0.35 |
| Zr | 23.50 | 27.70 | 31.50 | 27.00 | 11.80 | 49.10 | 42.60 | 53.40 | 31.00 | 54.00 | 21.30 | 46.10 | 51.70 |
| Hf | 0.70 | 0.69 | 0.97 | 0.94 | 0.63 | 1.49 | 1.25 | 1.44 | 1.12 | 1.24 | 0.61 | 1.15 | 1.43 |
| Eu/Eu* | 1.14 | 1.08 | 1.34 | 2.08 | 1.36 | 0.69 | 1.33 | 0.74 | 0.44 | 0.81 | 0.81 | 0.93 | 0.90 |
| Ce/Ce* | 0.92 | 0.94 | 0.94 | 0.92 | 0.99 | 0.95 | 0.92 | 0.95 | 0.95 | 0.95 | 0.94 | 0.92 | 0.91 |
| ΣREE | 79.77 | 75.94 | 41.71 | 20.2 | 82.16 | 100.09 | 31.17 | 71.23 | 104.32 | 120.75 | 38.67 | 90.2 | 70.78 |
| LREE/HREE | 15.45 | 14.17 | 13.79 | 10.88 | 5.81 | 14.46 | 9.19 | 12.26 | 16.75 | 15.13 | 20.65 | 14.73 | 18.85 |
| (La/Yb)N | 31.13 | 25.30 | 23.48 | 14.38 | 5.14 | 27.86 | 12.34 | 18.27 | 45.94 | 26.51 | 59.08 | 29.08 | 32.48 |
| (Sm/Yb)N | 5.43 | 5.44 | 5.20 | 3.15 | 1.78 | 5.98 | 2.78 | 4.01 | 10.09 | 4.86 | 10.33 | 5.33 | 4.49 |
| (La/Sm)N | 5.73 | 4.65 | 4.52 | 4.57 | 2.88 | 4.66 | 4.43 | 4.56 | 4.55 | 5.46 | 5.72 | 5.46 | 7.23 |
| Samples | Type I Quartz Veins | Type II Quartz Vein | ||||||||||||
|---|---|---|---|---|---|---|---|---|---|---|---|---|---|---|
| 14B3 | 18B1 | 19B1 | 20B2 | 23B2 | 02B1 | 03B1 | 08B1 | 11B1 | 14B2 | 23B1 | 26B1 | 26B2 | 27B3 | |
| Li | 11.70 | 11.70 | 2.65 | 6.07 | 6.76 | 1.85 | 2.63 | 1.08 | 0.776 | 1.34 | 0.26 | 0.25 | 2.11 | 0.90 |
| Be | 0.87 | 0.07 | 0.08 | 0.04 | 0.04 | 0.08 | 0.17 | 0.01 | 0.01 | 0.12 | 0.01 | 0.04 | 0.05 | 0.002 |
| Sc | 8.66 | 0.96 | 0.39 | 0.15 | 0.62 | 2.04 | 0.39 | 0.35 | 0.73 | 3.72 | 0.80 | 0.31 | 0.57 | 0.15 |
| V | 70.60 | 2.97 | 0.58 | 0.97 | 3.58 | 4.32 | 5.18 | 5.93 | 0.83 | 5.76 | 0.04 | 2.41 | 0.33 | 1.07 |
| Cr | 7.22 | 3.14 | 7.05 | 1.73 | 10.80 | 2.17 | 3.89 | 2.01 | 1.61 | 1.39 | 1.36 | 1.70 | 2.93 | 1.88 |
| Co | 8.74 | 1.13 | 1.29 | 1.22 | 3.29 | 21.00 | 8.25 | 28.10 | 0.59 | 7.97 | 0.05 | 2.95 | 0.04 | 6.77 |
| Ni | 6.72 | 2.65 | 2.95 | 0.93 | 8.03 | 26.00 | 10.20 | 40.20 | 1.38 | 11.00 | 0.67 | 4.46 | 0.52 | 12.90 |
| Cu | 15.10 | 293 | 10.20 | 825 | 4780 | 57.50 | 2154 | 4356 | 4131 | 10647 | 1.67 | 321 | 1.35 | 28 |
| Zn | 70.40 | 445 | 18.90 | 124 | 12.50 | 87.80 | 5059 | 13.40 | 56.70 | 140 | 1.49 | 20.90 | 8.05 | 6.70 |
| Ga | 21.80 | 2.75 | 0.82 | 0.52 | 1.15 | 1.61 | 1.43 | 0.23 | 0.53 | 1.38 | 0.07 | 0.71 | 0.31 | 0.32 |
| Rb | 143 | 2.46 | 2.40 | 1.27 | 1.53 | 0.39 | 9.87 | 0.55 | 0.12 | 1.86 | 0.07 | 0.14 | 0.11 | 0.18 |
| Sr | 140 | 24.90 | 25.60 | 5.95 | 17.10 | 36.60 | 11.30 | 5.51 | 16.70 | 311 | 2.82 | 1.04 | 3.18 | 10.90 |
| Y | 9.85 | 3.21 | 2.05 | 0.56 | 0.27 | 4.07 | 1.40 | 0.49 | 2.43 | 11.90 | 0.18 | 0.29 | 0.37 | 0.56 |
| Zr | 17.60 | 1.56 | 2.49 | 1.35 | 2.00 | 0.95 | 13.80 | 0.53 | 0.41 | 0.67 | 0.50 | 0.21 | 0.59 | 0.57 |
| Nb | 9.68 | 0.25 | 0.07 | 0.03 | 0.39 | 0.10 | 0.83 | 0.04 | 0.02 | 0.31 | 0.02 | 0.01 | 0.01 | 0.01 |
| Cs | 4.93 | 0.11 | 0.07 | 0.04 | 0.09 | 0.03 | 0.31 | 0.01 | 0.01 | 0.03 | 0.01 | 0.02 | 0.01 | 0.01 |
| Ba | 565 | 26.70 | 125 | 13.80 | 473 | 7.69 | 23.20 | 22.90 | 2.86 | 30.50 | 4.33 | 3.14 | 91.50 | 4.80 |
| La | 17.20 | 4.71 | 2.26 | 0.91 | 0.54 | 2.10 | 2.22 | 0.16 | 0.78 | 3.10 | 0.06 | 0.11 | 0.12 | 0.19 |
| Ce | 34.30 | 7.50 | 3.94 | 1.47 | 0.95 | 3.60 | 3.62 | 0.32 | 1.44 | 6.52 | 0.12 | 0.17 | 0.22 | 0.36 |
| Pr | 4.22 | 0.89 | 0.45 | 0.15 | 0.10 | 0.43 | 0.39 | 0.03 | 0.17 | 0.90 | 0.01 | 0.01 | 0.02 | 0.03 |
| Nd | 17.30 | 3.51 | 1.78 | 0.65 | 0.44 | 1.93 | 1.45 | 0.16 | 0.86 | 4.32 | 0.06 | 0.09 | 0.11 | 0.18 |
| Sm | 3.14 | 0.71 | 0.38 | 0.12 | 0.08 | 0.53 | 0.26 | 0.07 | 0.24 | 1.61 | 0.01 | 0.03 | 0.02 | 0.05 |
| Eu | 0.98 | 0.46 | 0.24 | 0.05 | 0.03 | 0.57 | 0.12 | 0.03 | 0.21 | 1.28 | 0.01 | 0.02 | 0.01 | 0.04 |
| Gd | 2.64 | 0.66 | 0.38 | 0.11 | 0.08 | 0.56 | 0.24 | 0.07 | 0.26 | 1.63 | 0.01 | 0.03 | 0.04 | 0.05 |
| Tb | 0.45 | 0.11 | 0.07 | 0.02 | 0.01 | 0.13 | 0.04 | 0.01 | 0.06 | 0.41 | 0.01 | 0.01 | 0.01 | 0.02 |
| Dy | 2.15 | 0.57 | 0.35 | 0.08 | 0.05 | 0.78 | 0.22 | 0.08 | 0.38 | 2.27 | 0.02 | 0.05 | 0.07 | 0.07 |
| Ho | 0.38 | 0.10 | 0.06 | 0.02 | 0.01 | 0.14 | 0.04 | 0.01 | 0.08 | 0.44 | 0.01 | 0.01 | 0.01 | 0.01 |
| Er | 1.06 | 0.27 | 0.16 | 0.04 | 0.03 | 0.34 | 0.14 | 0.05 | 0.22 | 1.18 | 0.01 | 0.03 | 0.04 | 0.04 |
| Tm | 0.16 | 0.03 | 0.02 | 0.01 | 0.01 | 0.06 | 0.02 | 0.01 | 0.04 | 0.20 | 0.002 | 0.008 | 0.007 | 0.006 |
| Yb | 0.91 | 0.23 | 0.12 | 0.04 | 0.02 | 0.33 | 0.13 | 0.05 | 0.22 | 1.08 | 0.01 | 0.03 | 0.04 | 0.04 |
| Lu | 0.12 | 0.03 | 0.01 | 0.01 | 0.002 | 0.05 | 0.02 | 0.01 | 0.03 | 0.15 | 0.002 | 0.006 | 0.005 | 0.004 |
| Hf | 0.47 | 0.04 | 0.05 | 0.03 | 0.03 | 0.03 | 0.33 | 0.02 | 0.02 | 0.03 | 0.01 | 0.01 | 0.01 | 0.01 |
| Ta | 0.78 | 0.02 | 0.01 | 0.01 | 0.03 | 0.01 | 0.05 | 0.01 | 0.01 | 0.03 | 0.01 | 0.003 | 0.008 | 0.006 |
| Pb | 18.60 | 6092 | 1052 | 4689 | 11,871 | 592 | / | / | 165 | 579 | 251 | / | 544 | / |
| Th | 1.40 | 0.09 | 0.05 | 0.02 | 0.10 | 0.05 | 0.25 | 0.01 | 0.01 | 0.11 | 0.01 | 0.009 | 0.008 | 0.008 |
| U | 0.77 | 0.10 | 0.05 | 0.02 | 0.05 | 0.04 | 0.46 | 0.08 | 0.008 | 0.09 | 0.007 | 0.09 | 0.09 | 0.01 |
| Eu/Eu* | 1.02 | 2.05 | 1.94 | 1.51 | 1.05 | 3.14 | 1.53 | 1.58 | 2.61 | 2.90 | 2.19 | 1.60 | 2.26 | 2.39 |
| Ce/Ce* | 0.96 | 0.84 | 0.90 | 0.87 | 0.92 | 0.87 | 0.87 | 1.03 | 0.90 | 0.85 | 0.90 | 0.89 | 0.99 | 0.94 |
| ΣREE | 85.05 | 19.83 | 10.25 | 3.72 | 2.39 | 11.60 | 8.95 | 1.12 | 5.05 | 0.25 | 0.64 | 0.78 | 1.14 | 25.13 |
| LREE | 77.15 | 17.79 | 9.06 | 3.38 | 2.16 | 9.18 | 8.08 | 0.80 | 3.72 | 0.21 | 0.46 | 0.54 | 0.88 | 17.74 |
| HREE | 7.90 | 2.04 | 1.19 | 0.35 | 0.23 | 2.42 | 0.88 | 0.32 | 1.32 | 0.04 | 0.18 | 0.24 | 0.27 | 7.39 |
| LREE/HREE | 9.77 | 8.72 | 7.61 | 9.73 | 9.57 | 3.79 | 9.22 | 2.48 | 2.81 | 4.68 | 2.49 | 2.26 | 3.31 | 2.40 |
| (La/Yb)N | 13.47 | 14.32 | 13.51 | 13.95 | 14.35 | 4.44 | 11.54 | 2.26 | 2.49 | 3.67 | 2.24 | 2.01 | 2.96 | 2.06 |
| (La/Sm)N | 3.54 | 4.28 | 3.83 | 4.88 | 3.92 | 2.53 | 5.43 | 1.46 | 2.12 | 2.59 | 1.80 | 2.81 | 2.20 | 1.24 |
| (Sm/Yb)N | 3.81 | 3.35 | 3.53 | 2.86 | 3.66 | 1.76 | 2.12 | 1.55 | 1.17 | 0.93 | 1.24 | 0.72 | 1.35 | 1.66 |
| △Ci | Reddish Alteration | Sericite-Quartz Alteration | △Ci | Reddish Alteration | Sericite-Quartz Alteration | △Ci | Reddish Alteration | Sericite-Quartz Alteration |
|---|---|---|---|---|---|---|---|---|
| SiO2 | 24.45 | −21.94 | Be | 0.10 | −0.04 | Zr | 26.34 | −15.48 |
| Fe2O3 | 6.86 | −4.12 | Rb | 25.487 | 31.21 | Hf | 0.81 | −0.51 |
| MgO | 0.97 | −0.70 | Sr | −33.70 | −169.51 | Y | 6.02 | −4.33 |
| CaO | 0.98 | −1.91 | Cs | 0.19 | 0.05 | Pb | 66.43 | −36.99 |
| Na2O | 0.38 | −3.34 | Ba | 31.48 | 106.51 | U | 0.53 | −0.58 |
| K2O | 1.05 | 1.36 | Sc | 4.53 | −3.73 | Bi | 0.005 | 0.21 |
| MnO | 1.28 | −0.91 | V | 29.88 | −25.59 | Th | 0.78 | −0.31 |
| TiO2 | 1.01 | −0.73 | Cr | 5.77 | −5.31 | La | −1.28 | 1.82 |
| P2O5 | 0.02 | −0.01 | Co | 3.09 | −1.36 | Ce | −1.80 | 2.63 |
| LOI * | 1.94 | −0.003 | Ni | 4.55 | −2.66 | Pr | −0.16 | 0.18 |
| FeO | 35.31 | −25.03 | Cu | 23.02 | 3.73 | Nd | −0.32 | 0.26 |
| F | 0.60 | −0.41 | Zn | 89.49 | −53.67 | Sm | 0.24 | −0.15 |
| Cl | 6.49 | −38.70 | Mo | 0.16 | −0.02 | Eu | 0.27 | −0.32 |
| S | 45.19 | −32.29 | Cd | 1.08 | 0.36 | Gd | 0.29 | −0.17 |
| Au | 0.009 | −0.003 | Sb | 0.16 | 0.59 | Tb | 0.12 | −0.08 |
| Ag | 0.01 | 1.40 | In | 0.02 | 0.05 | Dy | 0.81 | −0.57 |
| As | −0.30 | 0.24 | Ga | 6.11 | −5.34 | Ho | 0.18 | −0.14 |
| Hg | −0.38 | 3.47 | W | 1.68 | 1.92 | Er | 0.54 | −0.41 |
| B | 4.06 | 3.16 | Re | 0.004 | −0.004 | Tm | 0.10 | −0.08 |
| Li | −2.08 | −6.15 | Tl | 0.14 | 0.14 |
© 2019 by the authors. Licensee MDPI, Basel, Switzerland. This article is an open access article distributed under the terms and conditions of the Creative Commons Attribution (CC BY) license (http://creativecommons.org/licenses/by/4.0/).
Share and Cite
Li, R.; Albert, N.N.; Yun, M.; Meng, Y.; Du, H. Geological and Geochemical Characteristics of the Archean Basement-Hosted Gold Deposit in Pinglidian, Jiaodong Peninsula, Eastern China: Constraints on Auriferous Quartz-Vein Exploration. Minerals 2019, 9, 62. https://doi.org/10.3390/min9010062
Li R, Albert NN, Yun M, Meng Y, Du H. Geological and Geochemical Characteristics of the Archean Basement-Hosted Gold Deposit in Pinglidian, Jiaodong Peninsula, Eastern China: Constraints on Auriferous Quartz-Vein Exploration. Minerals. 2019; 9(1):62. https://doi.org/10.3390/min9010062
Chicago/Turabian StyleLi, Ruihong, Ntwali Ntabira Albert, Menghe Yun, Yinsheng Meng, and Hao Du. 2019. "Geological and Geochemical Characteristics of the Archean Basement-Hosted Gold Deposit in Pinglidian, Jiaodong Peninsula, Eastern China: Constraints on Auriferous Quartz-Vein Exploration" Minerals 9, no. 1: 62. https://doi.org/10.3390/min9010062
APA StyleLi, R., Albert, N. N., Yun, M., Meng, Y., & Du, H. (2019). Geological and Geochemical Characteristics of the Archean Basement-Hosted Gold Deposit in Pinglidian, Jiaodong Peninsula, Eastern China: Constraints on Auriferous Quartz-Vein Exploration. Minerals, 9(1), 62. https://doi.org/10.3390/min9010062