Article

Total and Effective Stresses in Backfilled Stopes during the Fill Placement on a Pervious Base for Barricade Design

1
Research Institute on Mines and Environment (RIME UQAT-Polytechnique), Department of Civil, Geological and Mining Engineering, École Polytechnique de Montréal, C.P. 6079, Succursale Centre-Ville, Montréal, QC H3C 3A7, Canada
2
MOE Key Laboratory of Soft Soils and Geoenvironmental Engineering, Department of Civil Engineering, Zhejiang University, Hangzhou 310058, China
*
Author to whom correspondence should be addressed.
Minerals 2019, 9(1), 38; https://doi.org/10.3390/min9010038
Submission received: 10 November 2018 / Revised: 30 December 2018 / Accepted: 7 January 2019 / Published: 11 January 2019
(This article belongs to the Special Issue Backfilling Materials for Underground Mining)

Abstract

:
Backfill is increasingly used in underground mines worldwide. Its successful application depends on the stability of the barricades built at the base of the stopes to hold the backfill in place, which in turn depends on the knowledge of the pore water pressure (PWP) and stresses during, or shortly after, the placement of the slurried backfill. Until now, self-weight consolidation is usually considered for the estimation of the PWP. There is no solution available to evaluate the total and effective stresses during, and shortly after, the filling operation. As excess PWP can simultaneously be generated (increased) and dissipated (decreased) during the backfilling operation, effective stresses can develop when the filling rate is low and/or hydraulic conductivity of the backfill is high. The arching effect has to be considered to evaluate the effective and total stresses in the backfilled stopes. In this paper, a pseudo-analytical solution is proposed to evaluate the effective and total stresses in backfilled stopes during the backfill deposition on a permeable base, by considering the self-weight consolidation and arching effect. The proposed solution is validated by numerical results obtained by Plaxis2D. A few sample applications of the proposed solution are shown.

1. Introduction

Backfill is largely used in underground mines to fill stopes [1,2]. The benefits of backfilling include, improved ground stability, reduced mineral dilution, and increased ore recovery [3,4]. When mine wastes are used as the fill materials, backfilling the underground mine stopes reduces the surface disposal of mine wastes and minimizes the environmental impact [5,6,7,8]. In most cases, binder is added in the mining backfill in order for the backfill to stay self-standing after being exposed, due to the excavation of an adjacent secondary stope [9,10,11,12,13,14,15,16,17,18,19,20].
When the mining backfill is transported by boreholes and pipelines, it must contain sufficient water to ensure workability and facilitate transportation. The construction of a confining structure, called barricade (bulkhead), in the draw-point at the base of the stope is necessary to hold the slurried backfill in place. The stability of the barricade can thus become a critical concern as the barricade failures, previously reported in the literature, have mostly resulted in serious consequences, such as damage of equipment, personal injury, and even loss of lives [21,22,23,24,25,26,27,28,29,30].
The stability analysis of barricades requires the proper estimation of the pore water pressure (PWP), and the total stresses in the backfilled stopes and on the barricades. It is important to know that the most critical moments for the stability of the barricades are during, and shortly after, the placement of the slurried backfill. After these critical moments, the total stresses in the backfilled stopes and on the barricades can dramatically diminish due to the development of arching effect and cementation of cemented backfill.
During the placement of the slurried backfill, excess PWP can be instantaneously generated (increased) with the addition of new backfill layers, and progressively dissipated (decreased). This process is known as self-weight consolidation [31,32,33,34]. With the drainage and consolidation of slurried backfill, effective stresses and arching effect can develop in the backfilled stopes, especially when the filling rate is low and the hydraulic conductivity of the backfill is high.
For cemented backfill, the cementation can be an important process because it consumes pore water and reduces the PWP [35,36,37]. The PWP and stresses can be further decreased by the generation of hydration products such as calcium silicate hydrate and calcium silicate, which, in turn, increase the strength and stiffness of the cemented backfill [15,18,19,38,39,40]. When the binder content is high (>7%) and the stope filling is slow, the effect of the cementation on the PWP and stresses can be very significant. The neglect of the cement hydration in pressure and stress estimation can lead to an overly conservative design of the barricades.
In most of the underground mines of Canada, the commonly used binding agents include, Portland cement, fly ash, and furnace slag, while the binder content is typically in the range of 3% to 7% by weight [18,38,41]. As the cement content is low, the cementation during the stope filling can be insignificant. This has been confirmed by several in situ measurements [42,43,44,45,46]. After a certain period of curing time (7 to 28 days), the effect of the cementation can become non-negligible with considerable gains in strength and stiffness [15,18,38,41]. As the stope filling is usually completed within a few days, it is conservative to neglect the effect of cementation for the design of barricades. The knowledge of the total stresses is necessary for conducting the stability analysis for the barricades.
Until now, the self-weight consolidation is largely considered for the estimation of the PWP during the placement of the slurried backfill, without any consideration of the effective stress development [31,46,47,48,49,50,51,52]. The arching theory has been applied to evaluate the stresses, either for dry backfill [26,53,54,55,56,57,58,59,60,61,62], or for submerged backfill with hydrostatic pressure [63,64,65]. These conditions correspond to the final steady states of the slurried backfill when the drainage and self-weight consolidation are fully completed, with a pervious (for dry backfill), or an impervious (for submerged backfill) barricade. The conditions do not correspond to the most critical moment for the stability of the barricades during, and after, the filling operation. The question is how to evaluate the total and effective stresses during, and shortly after, the filling operation (the most critical moments for the stability of barricades). To reply to this question, the self-weight consolidation and arching effect should be jointly considered.
In this paper, a pseudo-analytical solution is proposed to calculate the effective and total stresses in backfilled stopes during the deposition of slurried backfill on a permeable base. The self-weight consolidation and arching effect are jointly taken into account. The PWP is first evaluated by using an analytical solution proposed by Zheng et al. [51]. The effective and total stresses are then obtained by introducing the PWP expression in the arching model of Li and Aubertin [63]. The proposed solution is validated by numerical modeling results obtained by Plaxis2D (v2016, Plaxis B.V. Delft, The Netherlands).

2. Proposed Solution

Figure 1 represents a typical vertical mine stope, which is continuously filled with a slurried backfill at a filling rate of m (m/h). The stope has a width of B (m) and filled to a final height of H (m). At a given time t, the backfill reaches a height h (=mt). In the figure, x (m) is the elevation of a studied point (0 ≤ xh). Other parameters shown in the figure will be presented on their application.
As the base of the backfill is pervious with zero PWP (Figure 1), all the pore water in the backfill tends to move down and flow out of the stope. When the water reaches its final steady state, the water table falls down to the level of the base, resulting in zero PWP everywhere in the backfill (suction neglected here). Since the excess PWP is defined as the difference between the current total PWP and the final steady-state PWP [51,66,67], the excess PWP in a backfilled stope with a pervious base and barricade is always equal to the current total PWP. Therefore, a distinction between the excess PWP and current total PWP is not necessary. In the following sections, they are noted as (excess) PWP [51].

2.1. Solution to Estimate the (Excess) PWP

Gibson [31] proposed a solution to evaluate the (excess) PWP in slurried materials placed on a pervious base with the thickness increasing at a constant speed:
c v 2 p w x 2 = p w t γ d h d t
where pw (kPa) is the (excess) PWP, t (h) is the filling time, γ (kN/m3) is the saturated unit weight of the backfill, cv (m2/g) is consolidation coefficient of the backfill.
Using the boundary conditions pw = 0 at x = 0 and x = h, Gibson [31] gives the following solution:
p w = γ x ( 1 + m x 2 c v ) + γ m 2 c v ( π c v t ) 1 2 × exp ( x 2 4 c v t ) × E
where m (m/h) is the filling rate; E is expressed as follows:
E = 0 ξ 2 coth ( m ξ 2 c v ) × sinh ( x ξ 2 c v t ) × exp ( ξ 2 4 c v t ) d ξ
where ξ (m) is an arbitrary integration parameter (0 < ξ < ∞).
The gradient of the (excess) PWP can be calculated as:
d p w d x = ( γ + m γ x c v ) + γ m 2 c v ( π c v t ) 1 2 × exp ( x 2 4 c v t ) [ ( x 2 c v t ) × E + F ]
where F is given as
F = 0 ξ 2 coth ( m ξ 2 c v ) × cosh ( x ξ 2 c v t ) × ( ξ 2 c v t ) × exp ( ξ 2 4 c v t ) d ξ
Assuming:
y 2 = ξ 2 4 c v t
and substituting Equation (6) into Equation (3), E can be expressed as follows:
E = G ( y ) = 0 g ( y ) exp ( y 2 ) d y
where
g ( y ) = 8 ( c v t ) 3 2 × y 2 × coth ( m t × y c v ) × sinh ( x × y c v t )
As g(y) is an even function, G(y) is also an even function and can be rewritten as follows:
G ( y ) = 1 2 g ( y ) exp ( y 2 ) d y
Goodwin [68] proposed the following transformation to approximate the calculation of the integral:
g ( y ) e y 2 d y = h 0 n = g ( n h 0 ) e n 2 h 0 2
where h0 is step length of y; n is a series number in the range of −∞ to +∞. Goodwin [68] has shown that good approximations with high accuracy can be obtained with Equation (10) when the value of h0 is in the range of 0 to 1 and n is large enough.
Equation (3) can thus be re-written as follows:
E = h 0 2 n = 8 ( c v t ) 3 2 × ( n h 0 ) 2 × coth ( m n h 0 t c v ) × sinh ( x n h 0 c v t ) × e ( n h 0 ) 2
Substituting Equation (11) into Equation (2) leads to:
p w = γ x ( 1 + m x 2 c v ) + γ m 2 c v ( π c v t ) 1 2 × exp ( x 2 4 c v t ) ×    h 0 2 n = 8 ( c v t ) 3 2 × ( n h 0 ) 2 × coth ( m n h 0 t c v ) × sinh ( x n h 0 c v t ) × e ( n h 0 ) 2
Equation (12) is the analytical solution to evaluate the (excess) PWP in the slurried material during the backfill deposition on a pervious base, which was proposed by Zheng et al. [51] based on the model of Gibson [31]. Stable and reliable results of (excess) PWP can be obtained with Equation (12) when h0 is taken as 0.5 and n is in the range of −55 and 55 for most cases [51].
Using the same derivation process as function E, function F can be expressed as follows:
F = h 0 2 n = 8 ( c v t ) 3 2 × ( n h 0 ) 2 × coth ( m n h 0 t c v ) × n h 0 c v t × cosh ( x n h 0 c v t ) × e ( n h 0 ) 2
Substituting Equations (11) and (13) into Equation (4) yields:
d p w d x = ( γ + m γ x c v ) + γ m 2 c v ( π c v t ) 1 2 × exp ( x 2 4 c v t ) [ ( x 2 c v t ) × h 0 2 n = 8 ( c v t ) 3 2 × ( n h 0 ) 2 × coth ( m n h 0 t c v ) × sinh ( x n h 0 c v t ) × e ( n h 0 ) 2 + h 0 2 n = 8 ( c v t ) 3 2 × ( n h 0 ) 2 × coth ( m n h 0 t c v ) × n h 0 c v t × cosh ( x n h 0 c v t ) × e ( n h 0 ) 2 ]
Equation (14) will be introduced into the below section to evaluate the effective and total stresses in the backfilled stopes by jointly taking into account the self-weight consolidation and arching effect.

2.2. Solution to Evaluate the Effective and Total Stresses

In Figure 1, the forces acting on the isolated layer element include its own weight W (kN), two compressive forces C (kN), and two lateral shearing forces S (kN) on two sides wall, a vertical total force V (kN) on the top and a vertical total force V + dV (kN) on the base. Considering the equilibrium state of the isolated layer element leads to:
d V + 2 S = W
The layer element weight W can be expressed as:
W = γ B d l
where l (=h − x) is the depth of the calculation point from the top of the slurried backfill, dl (m) is the thickness of the element layer.
Assuming the vertical total stress σv is uniformly distributed across the stope width, the vertical force V can be expressed as follows:
V = σ v B
By applying the Mohr-Coulomb criterion and assuming the horizontal effective stress (σh, kPa) is proportional to the vertical effective stress (σv, kPa), the lateral shear force S can be calculated as follows:
S = σ h ' tan δ ' d l = K σ v ' tan φ ' d l
where δ’ (°) is the effective friction angle along the backfill-wall contact interfaces, which is assumed here to be equal to the value of the effective friction angle of the backfill ϕ’ (°); K is the lateral earth pressure coefficient for the placed backfill. Based on numerical and experimental results, some researchers suggested to use Rankine’s active earth pressure coefficient Ka [54,55,63,64,69]:
K a = σ h ' / σ v ' = tan 2 ( 45 ° φ ' / 2 )
while others proposed to take Jaky’s at-rest earth pressure coefficient K0 by arguing that the rock walls do not move [56,57,70,71]:
K 0 = σ h ' / σ v ' = 1 sin φ '
Sobhi et al. [72] and Yang et al. [73] revealed that the wall immobilization is a necessary and sufficient condition for the backfill to be in an at-rest condition only when the natural soil (not backfill as shown in most textbook) before excavation (not backfilling) is initially in an at-rest state. For cases of the placement of a backfill in a pre-existing confining structure (rather than construction of a retaining wall later to hold a pre-existing soil), an active state is possible for the newly deposited backfill. Yang et al. [74] further showed why the state of the backfill along the vertical center line of the backfilled stope can be in an at-rest or an active state, depending on the relationship between the value of friction angle and Poisson’s ratio. In the case of an at-rest state, the earth pressure coefficient will be expressed as K0 = μ/(1 − μ), rather than the Jaky’s expression. Further discussion on this aspect is beyond the scope of this paper. In the following sections, Rankine’s active earth pressure coefficient of Ka will be used.
The vertical (σv, kPa) and horizontal (σh, kPa) total stresses can be expressed as follows:
σ v = σ v ' + p w
σ h = σ h ' + p w = K σ v ' + p w
Introducing Equation (21) to Equation (17) leads to:
d V = B d [ σ v ' + p w ]
Substituting Equations (16), (18) and (23) into Equation (15) yields:
B [ d σ v ' + d p w ] + 2 K σ v ' tan φ ' d l = γ B d l
or
d σ v ' d l + 2 K tan φ ' B σ v ' = γ d p w d l
Solving Equation (25) results in the following expression:
σ v ' = e 2 K tan φ ' B l [ ( γ d p w d l ) × e 2 K tan φ ' B l d l + A ]
where A is an arbitrary constant.
By considering the boundary condition σv = 0 at l = 0, the vertical effective stress σv in the backfill can then be expressed as follows (see the detailed development in Appendix A):
σ v ' = e 2 K tan φ ' B l 0 l ( γ d p w d l ) × e 2 K tan φ ' B l d l
Considering that l = hx (dpw/dl = −dpw/dx), Equation (27) can be re-written as:
σ v ' = e 2 K tan φ ' B l 0 l ( γ + d p w d x ) × e 2 K tan φ ' B l d l
Knowing the vertical effective stress with Equation (28), the horizontal effective stress σh can then be calculated as:
σh = v
With the calculated PWP and effective stresses, the horizontal (σh) and vertical (σv) total stresses can be calculated as:
σ v = e 2 K tan φ ' B l 0 l ( γ + d p w d x ) × e 2 K tan φ ' B l d l + p w
σ h = K e 2 K tan φ ' B l 0 l ( γ + d p w d x ) × e 2 K tan φ ' B l d l + p w
Equations (28)–(31) constitute the proposed pseudo-analytical solution to evaluate the vertical and horizontal effective and total stresses during the stope filling operation. For the barricade design, the key parameter is the horizontal total stress. A MATLAB program (R2014a, The MathWorks, Inc., Natick, MA, USA) to solve Equation (31) for the horizontal total stress has been presented in Appendix B by considering a case with H = 20 m, B = 4 m, m = 0.1 m/h, cv = 5 m2/h, γw = 10 kN/m3, γ = 20 kN/m3, ϕ’ = 10° and K = Ka. It is important to use a large enough value of nmax to ensure stable and accurate results of σh. Sensitivity analysis should be done to study the influence of nmax on the calculated σh.
Figure 2 represents the variation of the calculated σh at the base of the stope (x = 0) as a function of nmax. It can be seen that a stable result of σh can be obtained when the value of nmax exceeds 101 for the given case (the results σh = 167.37 kPa for nmax = 1001 and σh = 167.27 kPa for nmax = 10,001 are not presented in the figure). This sensitivity analysis should be conducted for each new calculation to ensure stable and reliable results.

3. Validation of the Analytical Results by Numerical Results

In this section, the proposed pseudo-analytical solution will be validated by numerical results obtained by Plaxis2D [75].
The first validation is to compare the distribution and evolution of the vertical and horizontal total stresses in a backfilled stope calculated by the proposed solution (Equations (30) and (31)) with those reported by Fahey et al. [70]. The stope is 50 m high and 20 m wide. The backfill is saturated and characterized by the parameters: γ = 20 kN/m3 (saturated unit weight), γw = 10 kN/m3 (unit weight of water), k = 4.17 × 10⁻³ m/h (permeability), cv = 4.625 m2/h (consolidation coefficient), c = 0 kPa (effective cohesion); E’ = 10 MPa (drained Young’s Modulus), μ = 0.2 (Poisson’s ratio), ϕ’ = 45° (effective friction angle) and ψ’ = 0° (effective dilation angle). In the numerical model, a 2 m layer of backfill was first placed in the stope, followed by a 3 m layer of backfill in 0.1 days. The rest of the stope was filled with nine layers of backfill; each of them has 5 m and was filled in 0.1 days. The total filling time was 1.1 days, resulting an average filling rate of m = 1.89 m/h.
Figure 3 shows the distribution of the vertical and horizontal total stresses along a vertical profile of 2 m from the vertical center line of the stope, calculated with the proposed solutions (Equations (30) and (31)) with K = Ka and obtained by the numerical modeling performed by Fahey et al. [70] with Plaxis. It can be seen that the analytical results compared fairly well with the numerical results. The slight difference between the two solutions can be attributed to the relatively large thickness of each backfill layer used in their numerical model. The 5 m for each layer in the numerical models is not thin enough to represent the continuous backfilling in the stope [51].
In order to further validate the proposed solutions, additional numerical simulations were conducted by using more representative backfill parameters. A series of very thin backfill layers was used in the numerical simulations to well-represent the continuous filling.
Figure 4a represents the physical model of an underground mine stope, which is 4 m wide and 12.4 m high. The stope is continuously filled with a saturated backfill at a filling rate of m = 0.5 m/h to a final height of 12 m with a gap of 0.4 m being left between the stope roof and top surface of the backfill. In practice, a gap that is 3 to 5 m high (the height of a drift) can be left to allow the passage of vehicles or workers. The backfill and rock walls are assumed to be elasto-plastic and obey the Mohr-Coulomb criterion.
The backfill is considered as cohesion-less and has a saturated unit weight of γ = 20 kN/m3, unit weight of water γw = 10 kN/m3, drained Young’s Modulus E’ = 864 kPa, Poisson’s ratio μ = 0.2, drained constrained modulus M’ = 960 kPa, effective friction angle ϕ’ = 10° and effective dilation angle ψ’ = 0°. The consolidation coefficient (cv) can be calculated with the permeability (k) and drained constrained modulus (M) using the following equation:
c v = k M γ w
By considering k = 4.176 × 10⁻² m/h (i.e., 1.16 × 10⁻⁵ m/s), one obtains cv = 4 m2/h.
The surrounding rock mass is assumed to be impermeable. Its geotechnical properties are unit weight γr = 27 kN/m3, Poisson’s ratio μr = 0.25, Young’s modulus Er = 42 GPa, cohesion cr = 9.4 MPa, friction angle ϕr = 38°, and dilation angle ψr = 0°.
Figure 4b presents the numerical model built by Plaxis2D, which shows only half the full numerical model by considering the vertical symmetry plane (VSP). The VSP and the right outer boundary are restrained in the horizontal direction, but can move freely in the vertical direction. The upper outer boundary of the model is free to move in the horizontal and vertical directions, while the lower outer boundary is restrained in all directions. The VSP and fill-wall interface are impermeable, while the top and bottom surfaces of the backfill, after adding a new layer, are permeable and imposed with zero PWP.
The numerical modeling was conducted in three steps. The first step was to build the numerical model with rock mass and attain an initial stress state in it without any excavations. The stope was then excavated in the rock mass. The last step was to fill the stope in layers. In practice, the backfill was continuously filled in the underground mine stope with a gradual increase in thickness. In the numerical model with Plaxis2D, this continuous and gradual increase of the backfill can only be approximately represented by instantaneously adding a series of very thin backfill layers. If the backfill layer thickness is dh, the waiting delay before adding a new layer will be dh/dm. Drainage and consolidation took place during this waiting time. In order to well represent the continuous backfilling in a mine stope, the thickness of each layer dh should be as thin as possible. Meanwhile, the calculation time increases exponentially as the layer thickness decrease and the number of layer increases. A compromise was made between the accuracy and time calculation. In this paper, each layer had a thickness of 0.4 m. The waiting delay before adding a new layer was 0.8 h for a filling rate of 0.5 m/h. The sensitivity analysis showed that the thickness was indeed small enough to ensure numerically stable results were achieved.
Figure 5 represents the distribution of the (excess) PWP (Figure 5a), total (Figure 5b), and effective (Figure 5c) stresses along the vertical center line (VCL) of the stope at the end of backfill deposition, obtained by numerical simulation with Plaxis2D and calculated with the proposed solution (Equations (12), (28)–(31)) using Ka. The (excess) PWP and total stresses based on the geostatic overburden solution (pw = σv = σh = γh) are also plotted on the figure. One sees that a good agreement is obtained between the analytical and numerical results.
Additional numerical simulations were also done. Good agreements were obtained again between the analytical and numerical results. These results are presented in the Ph.D. thesis of Zheng [76]. The proposed solution is thus considered to be validated by numerical modeling results. It can thus be applied to calculate the stresses and PWP in backfilled stopes during the accreting deposition.

4. Sample Application

This section uses the proposed solution to investigate the influence of backfill properties, filling rate, and stope geometry on the total and effective stresses in a backfilled stope at the end of backfill deposition. The slurried backfill, having a saturated unit weight of γ = 20 kN/m3, was filled to a final height of H = 40 m.
Figure 6 represents the distribution of the total (Figure 6a) and effective (Figure 6b) stresses along the full height of the backfilled stope at the end of backfill deposition, predicted by the proposed solution when cv increases from 0.1 to 10 m2/h. The stope width B is taken as 6 m. The filling rate m is 0.2 m/h. The effective friction angle ϕ’ is taken as 20°. The Rankine’s active earth pressure coefficient Ka is 0.49. Without any surprise, the results indicate that the value of cv can significantly influence the effective and total stresses at the end of filling. With a very low value of cv (=0.1 m2/h), the drainage and consolidation can be very slow, resulting in total stresses almost equal to the geostatic overburden pressure at the upper part of the backfill. When the consolidation coefficient is high (cv = 10 m2/h), significant drainage and consolidation take place during the backfill accreting deposition, resulting in relatively low total stresses and relatively high effective stresses.
Similar results have been shown in previous publications, mostly through numerical modeling [34,70]. This is now shown for the first time through pseudo-analytical solutions without numerical modeling.
Figure 7 represents the distribution of the total (Figure 7a) and effective (Figure 7b) stresses along the full height of the backfilled stope when the deposition ceases as the filling rate m varies from 0.1 to 1 m/h, predicted by the proposed solution by considering a consolidation coefficient cv = 5 m2/h, an effective friction angle ϕ’ = 20°, and an earth pressure coefficient of K = Ka = 0.49. One can see that high total stresses and low effective stresses result from high filling rate. Once again, these results are very similar to those shown in previous publications through numerical modeling [34]. However, this is for the first time the results are shown through pseudo-analytical solution.
Near the bottom of the backfill, abnormally high effective stress at high filling rate is observed. The same phenomenon has been observed in previous cases with low consolidation coefficient (Figure 6b). These results are surprising, but easy to understand. When the filling rate is high or when the coefficient consolidation is low, the drainage and consolidation are slow and the arching effect is weak, resulting in high (excess) PWP, high total stresses, and low effective stresses along the full height of the backfill, except near the bottom. As the effective stresses are equal or very close to the total stresses near the pervious bottom along which the PWP is equal or close to zero, the high total stresses near the bottom due to the high total stresses in the upper portion result in high effective stresses near the bottom of the backfilled stope. This explains well the high total stresses along the full height of the stope and high total and effective stresses near the bottom of the stope, with low consolidation coefficient (Figure 6a) or high filling rate (Figure 7a).
Figure 8 represents the distribution of the total (Figure 8a) and effective (Figure 8b) stresses along the full height of the backfilled stope at the end of filling, with a different effective friction angle of backfill ϕ’, predicted by the proposed solution by using a consolidation coefficient of cv = 5 m2/h, a filling rate of m = 0.2 m/h, and an earth pressure coefficient of K = Ka. The iso-geostatic overburden pressure is also included in the figure. The results show that the total and effective stresses decrease as the value of the effective friction angle of the backfill increases. These results are straightforward because the high effective friction angle of backfill leads to the generation of a high degree of arching effect, and hence, reduces the effective and total stresses.
Figure 9 represents the distribution of the total (Figure 9a) and effective (Figure 9b) stresses along the full height of the backfilled stope when the deposition ceases as stope width varies from 3 to 12 m, predicted by the proposed solution by considering a consolidation coefficient cv = 5 m2/h, a filling rate m = 0.2 m/h, an effective friction angle ϕ’ = 20°, and an earth pressure coefficient K = Ka = 0.49. The results show that, high total and effective stresses are generated with increased stope width. This is because the degree of arching effect decreases as the stope width increases, resulting in high effective and total stresses.

5. Discussion

This paper proposed a new pseudo-analytical solution to calculate the (excess) PWP, as well as the total and effective stresses in a backfilled stope, by considering the occurrence of self-weight consolidation and arching effect during the placement of the backfill. The proposed solution has been validated by numerical simulation results obtained by Plaxis2D. It thus provides a useful tool to evaluate the pressure and stresses in backfilled stopes. However, one should keep in mind that the proposed solution, presented in this paper, contains some limitations due to the assumptions used in the development process. For instance, the validation of the proposed solution against numerical simulation was realized by considering Rankine’s active earth pressure coefficient Ka. With the given problems and material parameters, one can conclude that the application of the proposed solution using Rankine’s active earth pressure coefficient Ka is appropriate, while using Jaky’s at-rest earth pressure coefficient K0, may lead to an overly conservative barricade design. However, this conclusion should not be generalized in all cases. In reality, the value of the lateral earth pressure coefficient depends on the relationship between the friction angle and Poisson’s ratio. When the friction angle is higher than a critical value (determined by the value of Poisson’s ratio), or when the Poisson’s ratio is higher than a critical value (determined by the friction angle), the value of the lateral earth pressure coefficient is close to the at-rest earth pressure as defined by Poisson’s ratio. Otherwise, the value of the lateral earth pressure coefficient should take Rankine’s active earth pressure coefficient. More details can be seen in Yang et al. [73,74].
In this study, the (excess) PWP was evaluated by considering, one after the other, the self-weight consolidation and the arching effect. In reality, the arching effect tends to hold the backfill in the original place and has the effect of slowing down the consolidation. When the consolidation is slowed down, the arching development in turn slows down. The slow-down of the arching in turn favors the development of the consolidation. A coupled process is implicated between the consolidation and arching development. An equilibrium state can be found only after a number of iterations between the two processes. More work is required to consider the coupled processes in the future.
Another limitation is related to the application of the Gibson [31] model, which considers a one-dimensional consolidation model, under small strain with constant physical, mechanical, and hydraulic properties. The one-dimensional model can be representative in tailing dams with large horizontal sections. However, the lateral drainage can take place in tailing dams when the waste rock inclusion is applied, or in mine stopes when the stope rock walls contain conductive fractures and joints.
It should be pointed out that the proposed solution (Equations (28)–(31)) was developed by considering fully saturated backfill during the filling operation. This is only possible when the filling rate is large and/or when the consolidation coefficient is low. Otherwise, unsaturation can take place somewhere in the backfill due to the seepage through the pervious base. More work is necessary to take into account the base seepage and the subsequent unsaturation.
It is important to reiterate that the excess PWP is generally defined as the difference between the current total PWP and the PWP when the water reaches a steady state [66]. Based on this general definition, two specific definitions of excess PWP result from two different situations [67]. The first one applies when the PWP at the final (steady) state is equal to the PWP at the initial state; both are the hydrostatic pressure. The application of the general definition of the excess PWP leads to the difference between the current PWP and the hydrostatic pressure. This is a well-known definition of excess PWP, which is used in the traditional theory of consolidation in Terzaghi [77]. The second specific definition applies when the PWP, at the final steady state, falls to zero. This is the case in this study with a pervious base. The PWP at the final steady state is zero when all water flows out of the stope through the pervious base (suction neglected). The application of the general definition of the excess PWP leads to the excess PWP always equaling the current PWP. No distinction is needed between them. This second specific definition of excess PWP is poorly known and not unanimously accepted. It would, however, be impossible to explain the subsidence or settlement of ground surface, which is associated with the drainage and consolidation due to the water pumping from a water well, if the initial hydrostatic pressure before water pumping in the well is not considered as excess PWP. This is because the dissipation of excess PWP is inseparable with the drainage and consolidation in soil mechanics [78].
Finally, further experimental work is required to validate or calibrate the proposed solutions. This work is ongoing and will be part of future publications.

6. Conclusions

In this paper, a new pseudo-analytical solution was presented to evaluate the (excess) PWP, as well as the effective and total stresses in backfilled stopes, by jointly considering the self-weight consolidation and arching effect during the placement of slurried backfill on a pervious base. The main conclusions are given as follows:
  • One is used to define the excess PWP as the difference between the current PWP and the hydrostatic pressure. This definition is, however, only valid when the initial and final steady PWP are the same, all equaling the hydrostatic pressure. In this study, the final steady PWP is zero due to the pervious base (and barricade) with zero PWP. The PWP and the excess PWP in the backfilled stopes are always equal to each other. No distinction is needed between the PWP and excess PWP.
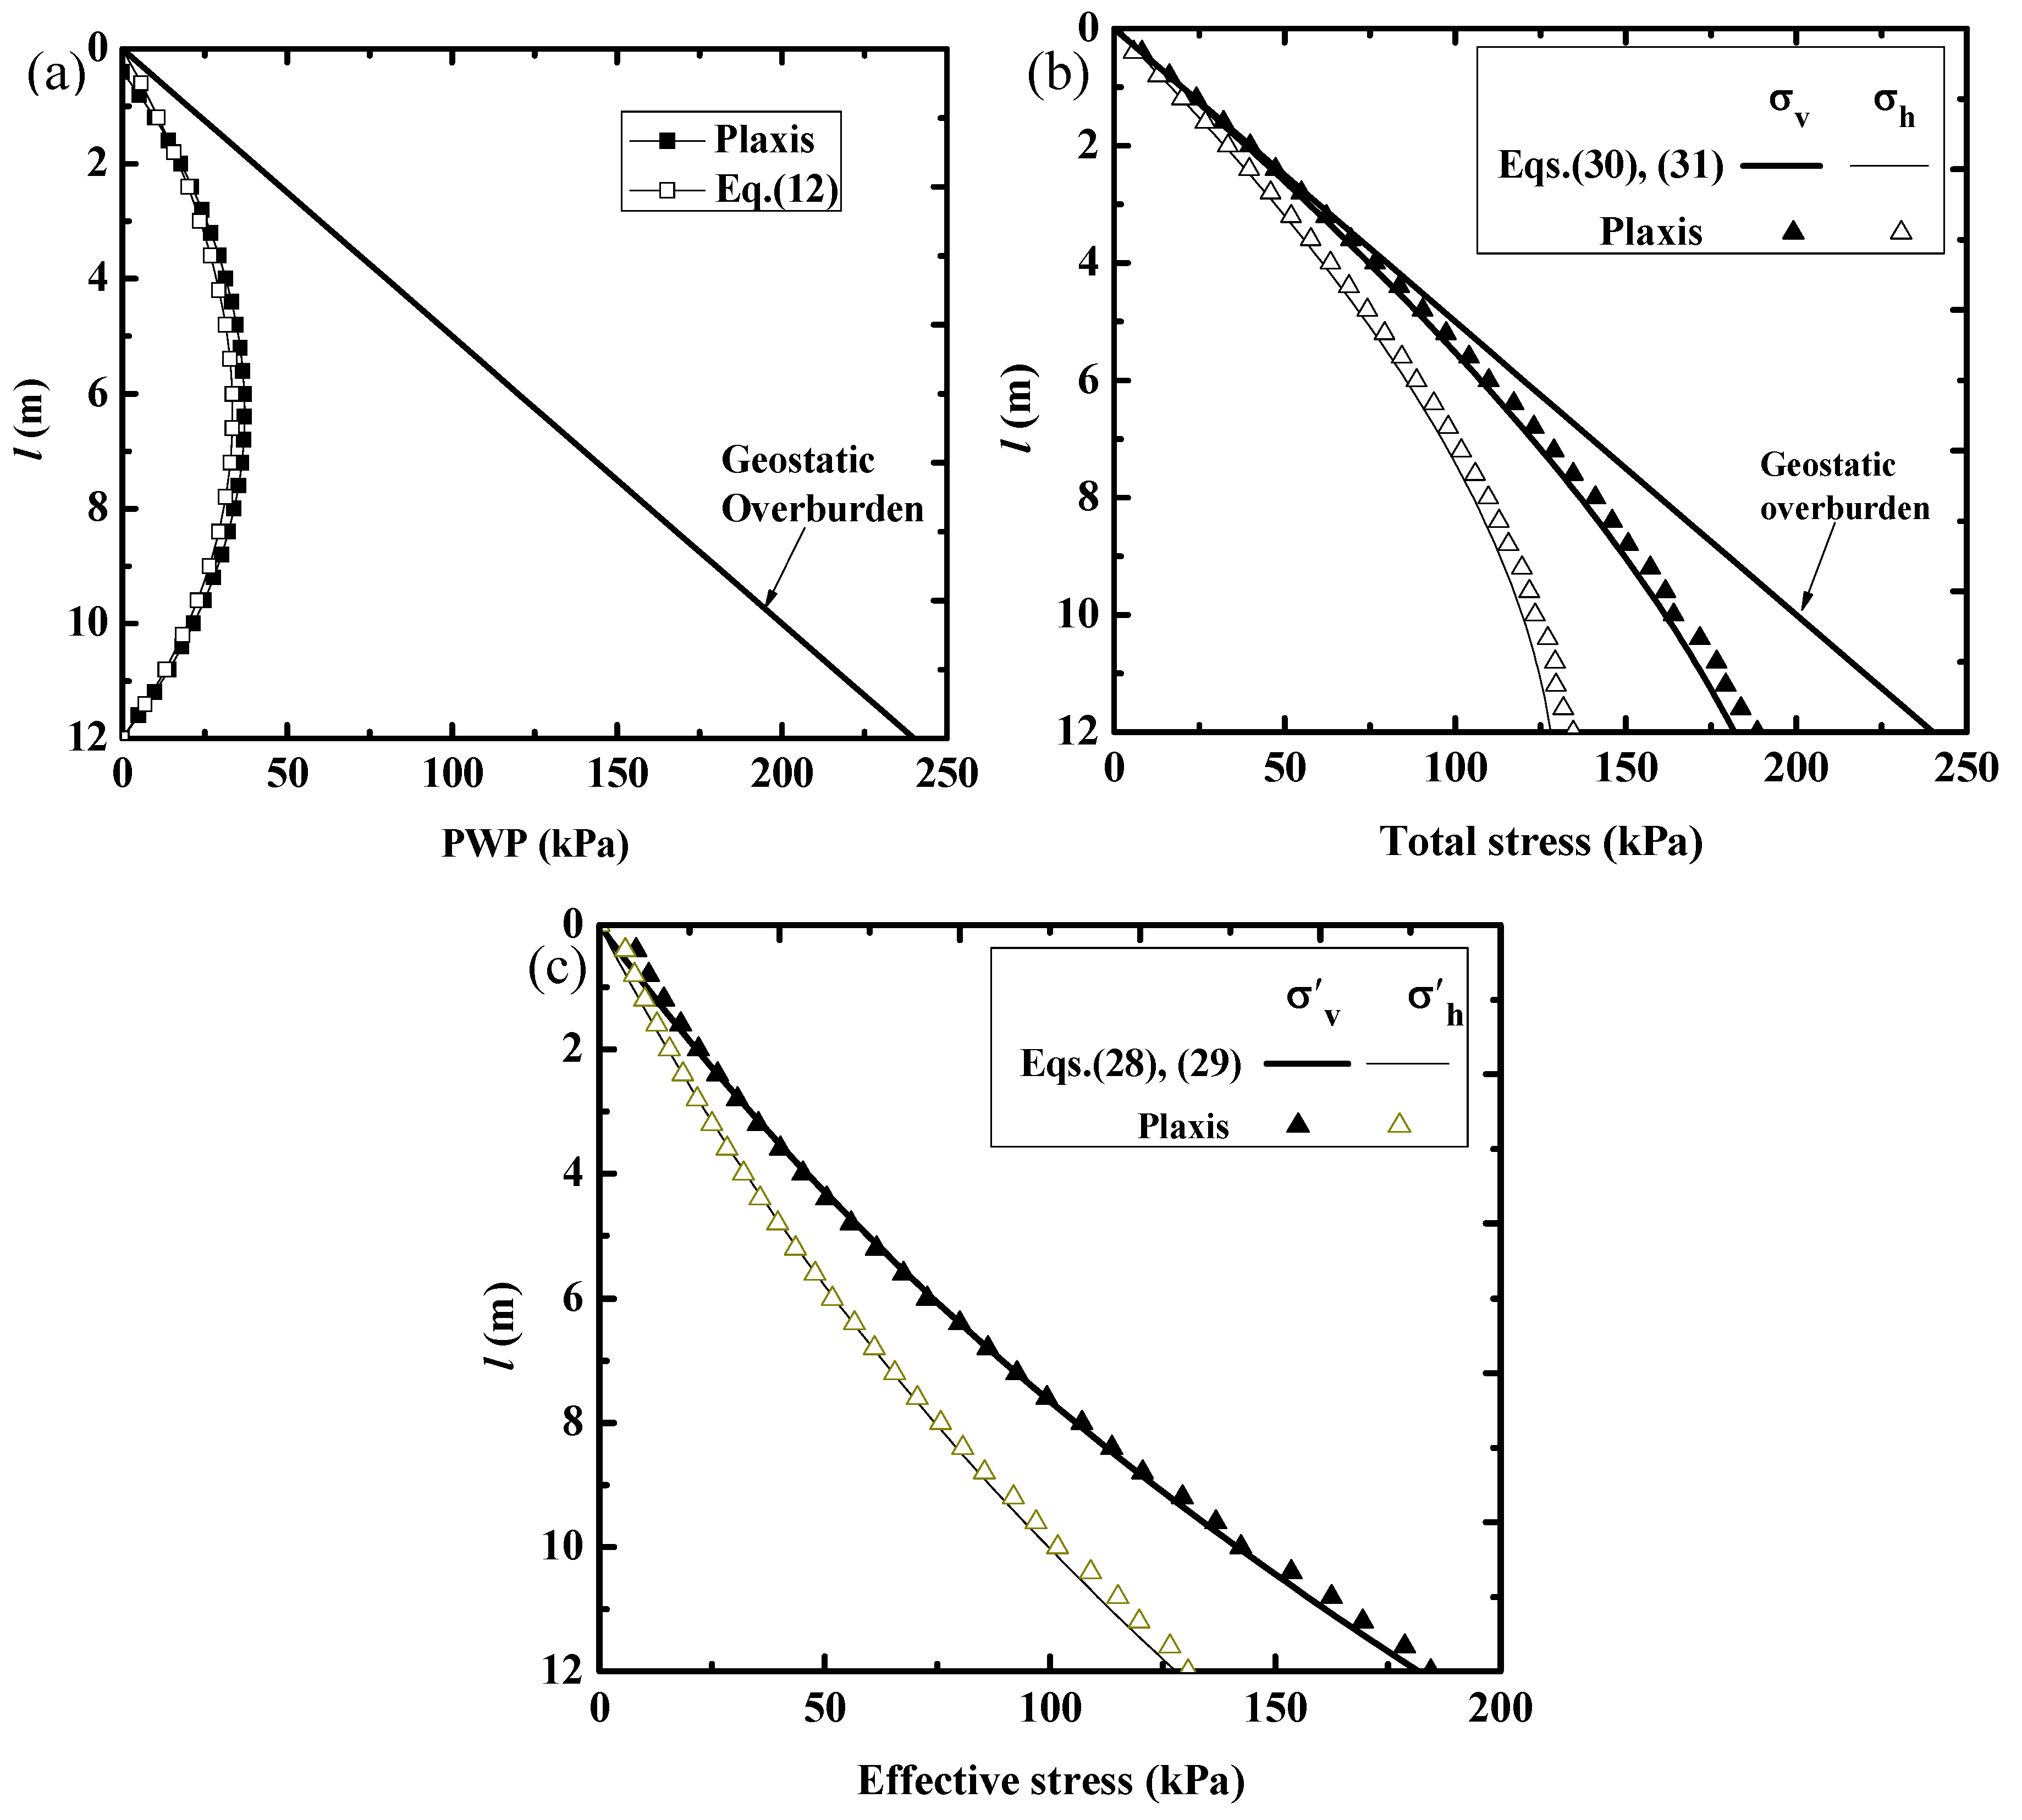
  • The proposed solution has been validated against numerical results obtained by numerical modeling with Plaxis2D. The proposed solution constitutes a simple and useful tool to calculate the pressures and stresses in backfilled stopes for the design of barricades. It can be particularly useful for parametric sensitivity analysis in the preliminary stage of a project.
  • The calculated effective and total stresses in the backfilled stopes, during the backfill deposition, are lower than the iso-geostatic overburden pressure, due to the occurrence of the consolidation and arching effects.
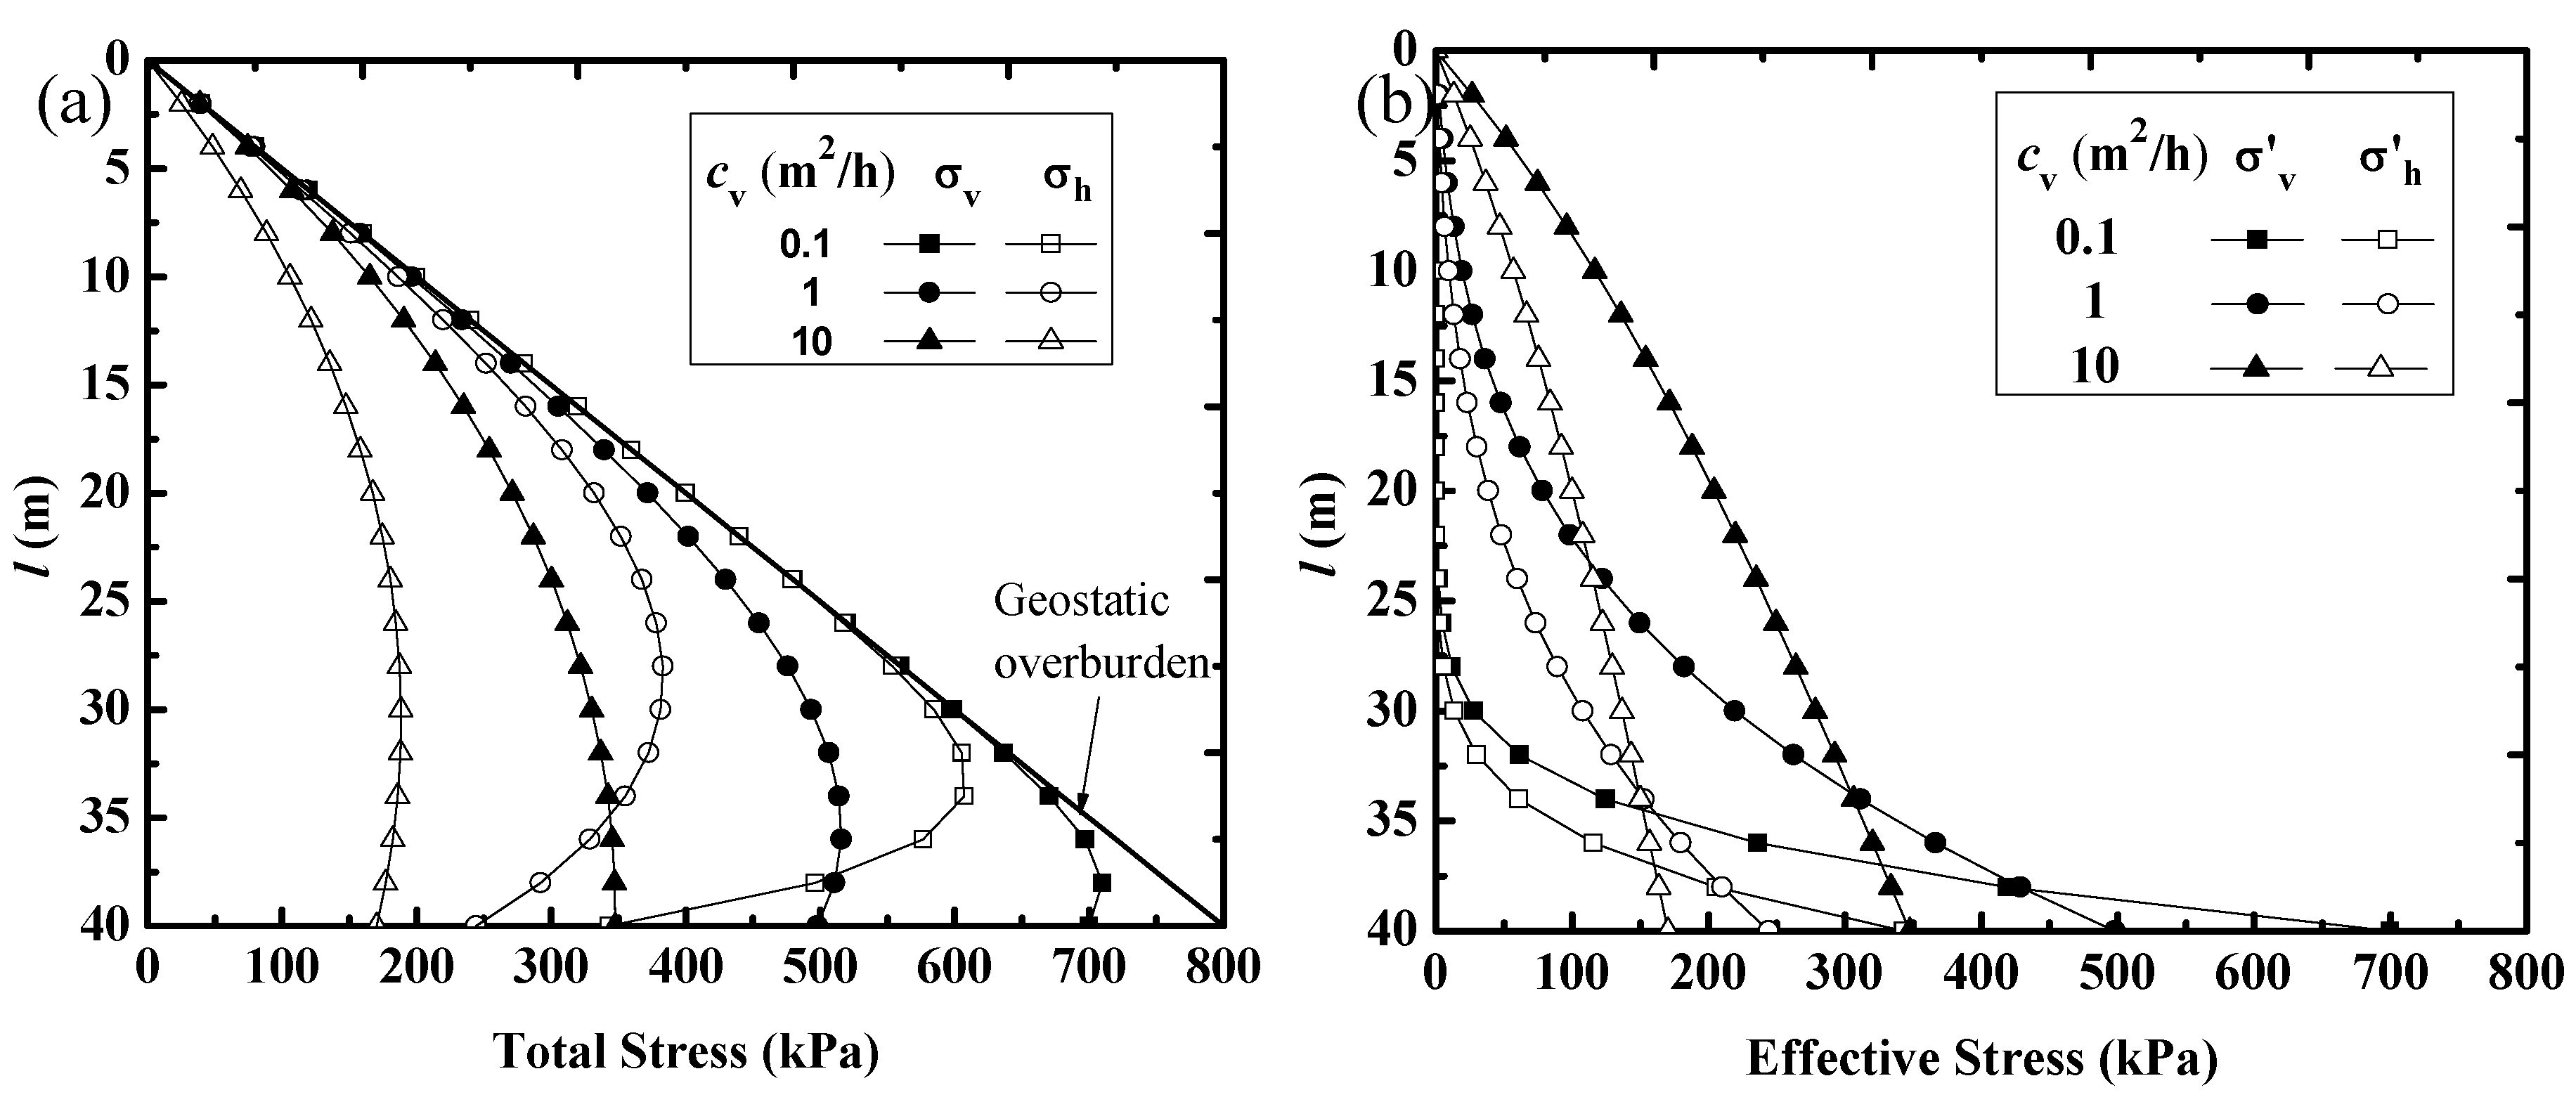
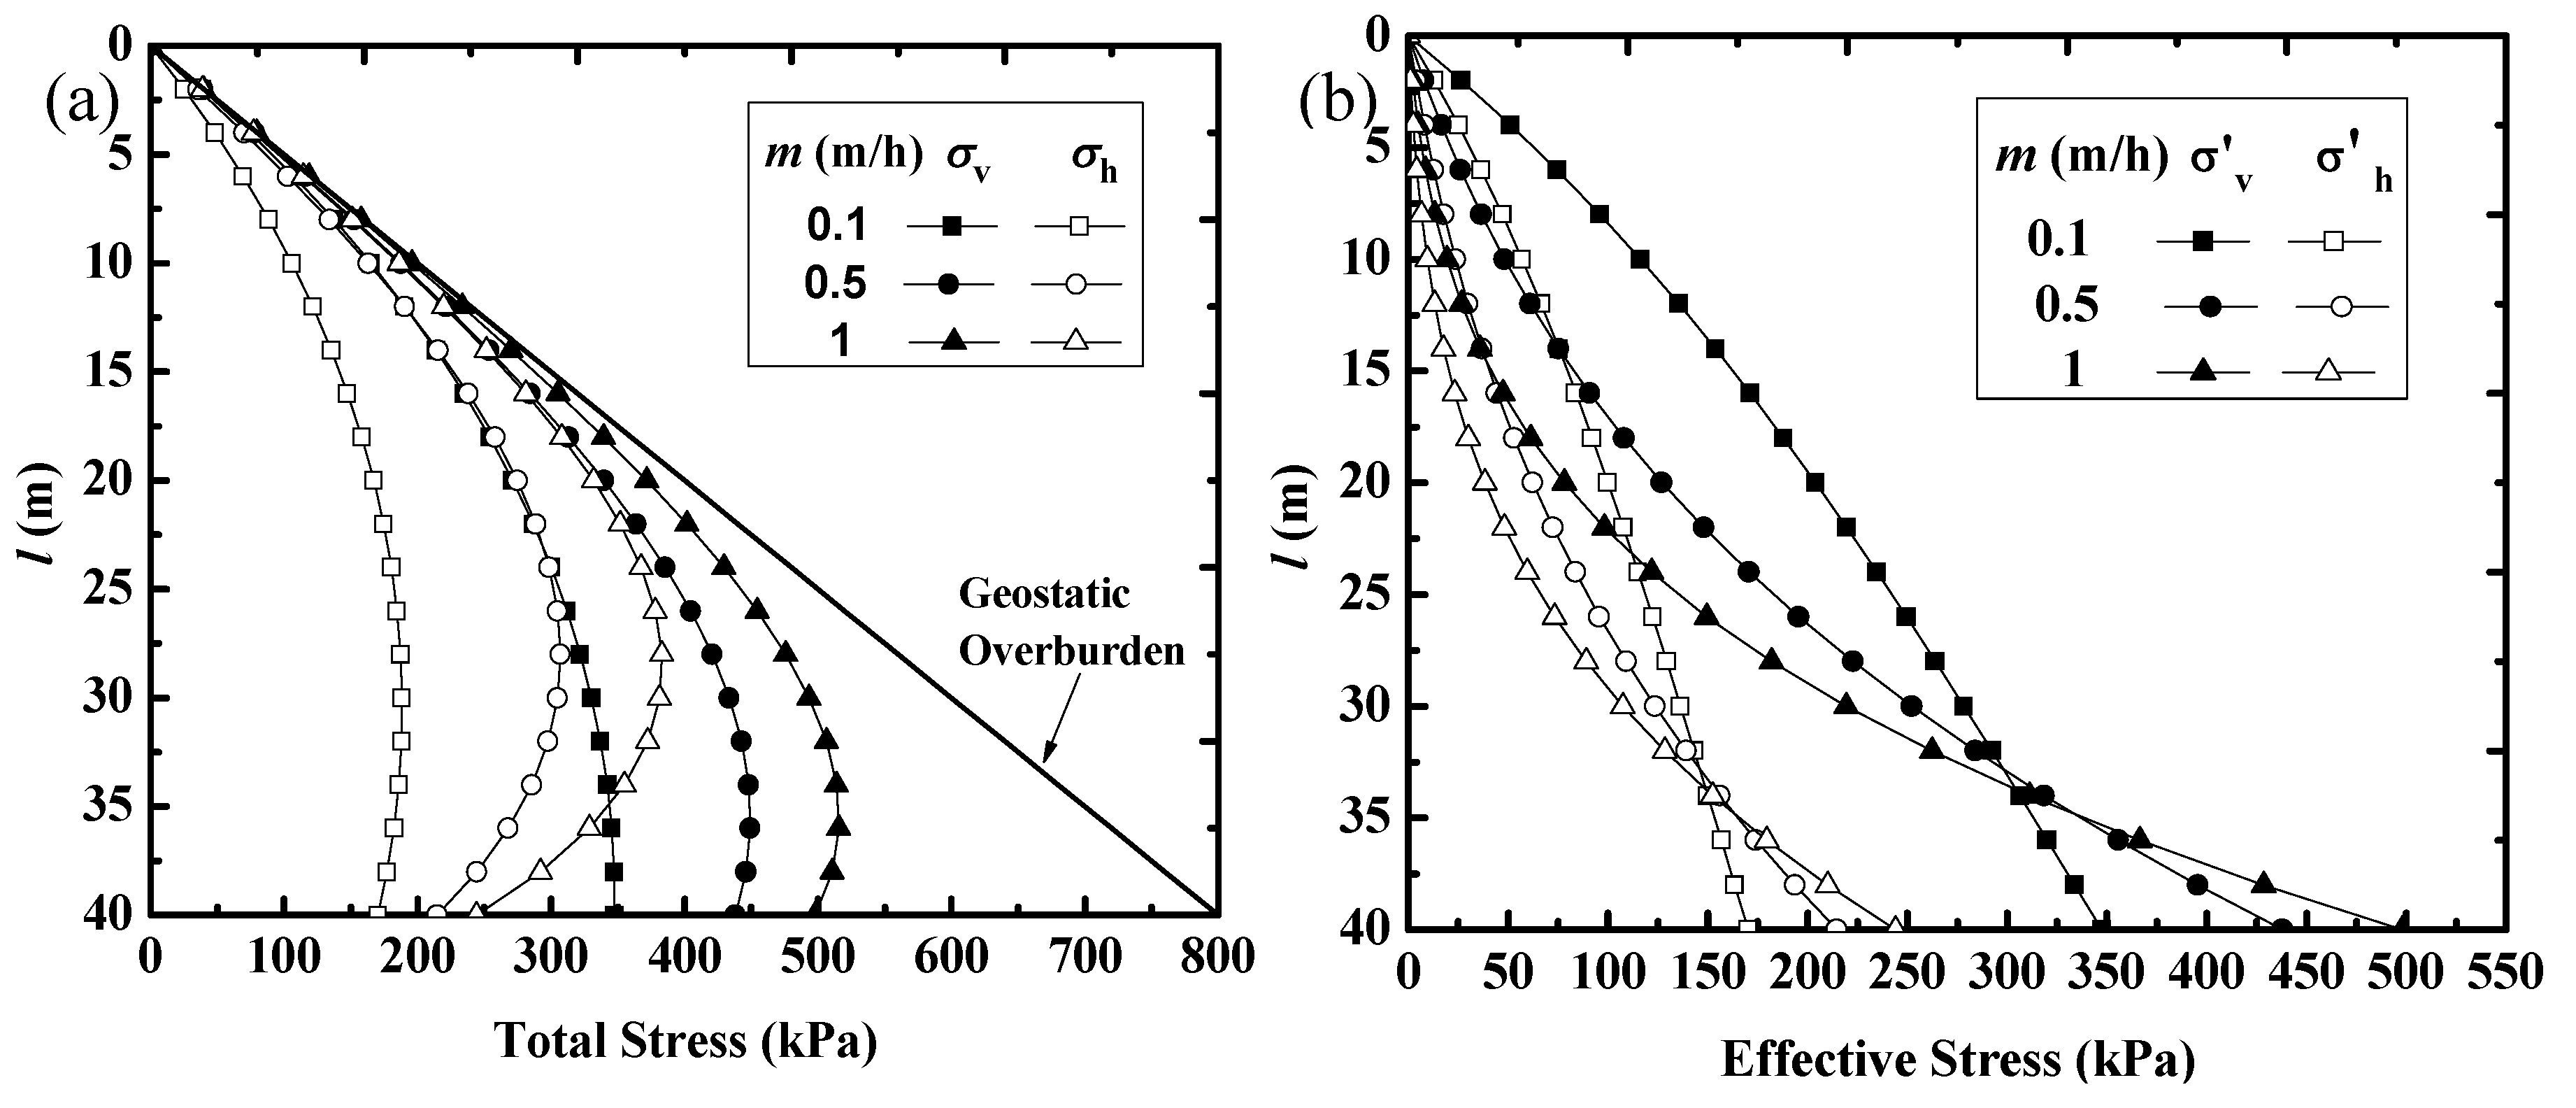
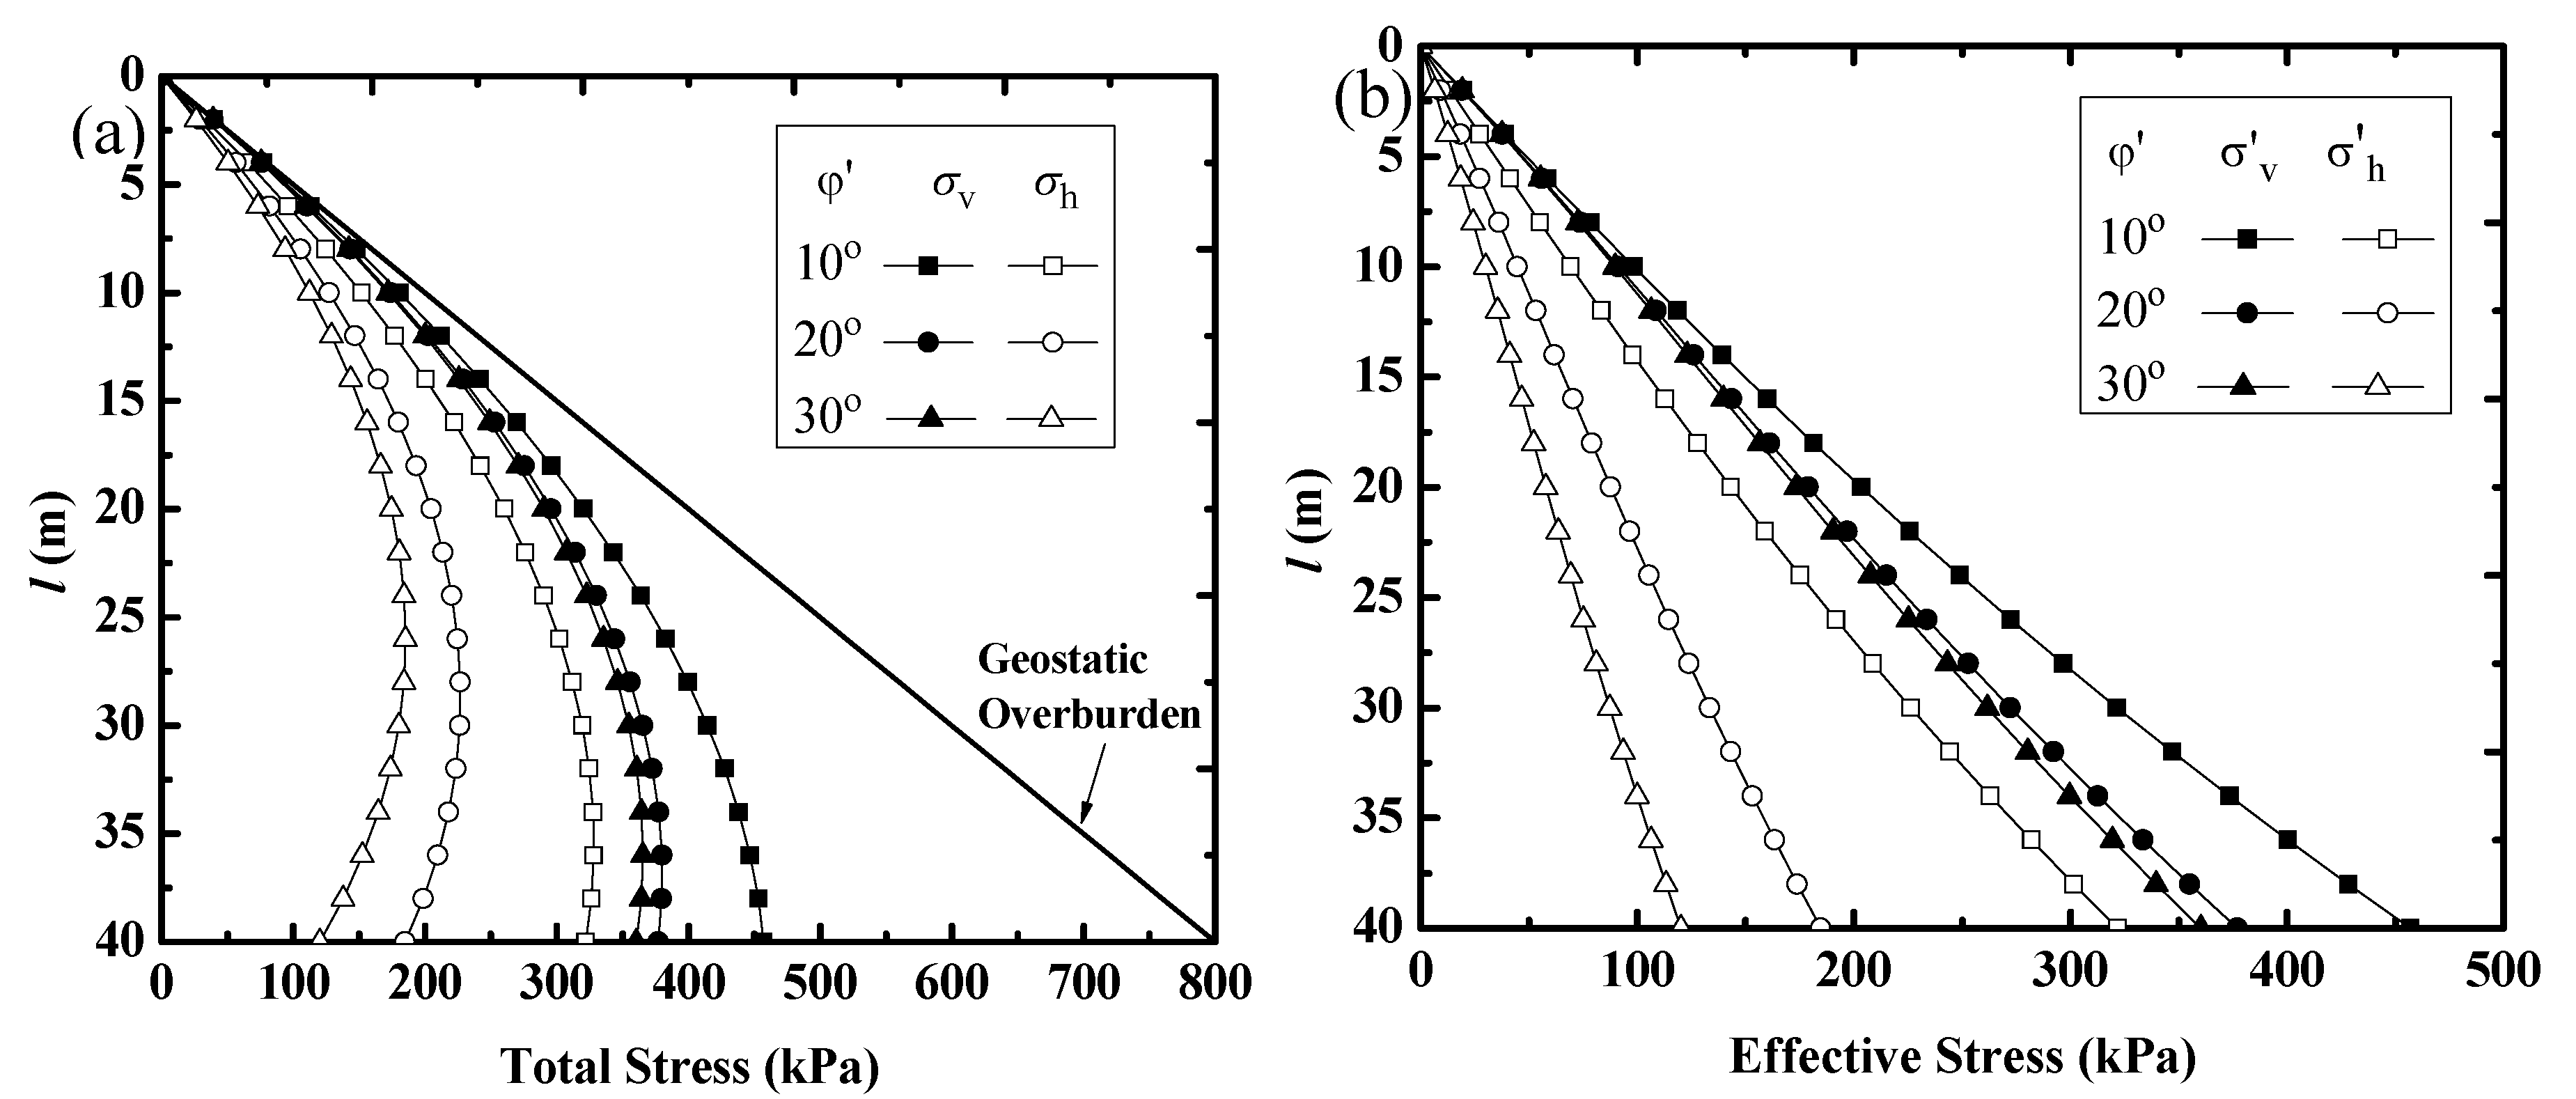
  • The sample applications of the proposed solution showed that high total stresses along the full height of backfilled stopes can result from low consolidation coefficient, high filling rate, low effective friction angle, or large stope width. Similar results have been reported in previous publications through numerical modeling. This is, however, shown for the first time through pseudo-analytical solutions without numerical modeling.

Author Contributions

J.Z., equations development, numerical modeling, writing of the original draft; L.L., project initiation and administration; J.Z., L.L., and Y.L., review and editing of the writing.

Funding

The research received financial support from Natural Sciences and Engineering Research Council of Canada NSERC (NSERC 402318), Fonds de recherche du Québec—Nature et Technologies (FRQNT 2015-MI-191676), and the industrial partners of the Research Institute on Mines and the Environment (RIME UQAT-Polytechnique). The authors gratefully acknowledge this support.

Conflicts of Interest

The authors declare no conflict of interest.

Appendix A. Development of Equation (27)

The vertical effective stress σv (Equation (26)) can be re-written as:
σ v ' = e 2 K tan φ ' l B [ f ( l ) d l + A ]
where
f ( l ) = ( γ d p w d l ) e 2 K tan φ ' l B
By assuming F(l) is the original function of f(l), one obtains:
F ' ( l ) = f ( l )   or   f ( l ) d l = F ( l ) + C
Introducing Equation (A3) into Equation (A1) yields:
σ v ' = e 2 K tan φ ' B [ F ( l ) + A + C ]
With the boundary condition σv’ = 0 at l = 0, Equation (A4) can be solved as:
F ( 0 ) + A + C = 0 F ( 0 ) = A C
Introducing Equation (A5) into Equation (A4) results in:
σ v ' = e 2 K tan φ ' B [ F ( l ) F ( 0 ) ]
With Equation (A3), the following equation can be obtained:
0 l f ( l ) d l = F ( l ) F ( 0 )
Introducing Equation (A7) into Equation (A6) results in:
σ v ' = e 2 K tan φ ' B 0 l f ( l ) d l = e 2 K tan φ ' B 0 l ( γ d p w d l ) e 2 K tan φ ' l B d l

Appendix B. MATLAB Program to Solve Equation (31)

A MTALAB program is developed to solve Equation (31) for assessing the horizontal total stress along the full height of a stope at the end of backfill deposition. Sample calculation is conducted here by considering: H = 20 m, B = 4 m, m = 0.1 m/h, γw = 10 kN/m3, γ = 20 kN/m3, cv = 5 m2/h, ϕ’ = 10° and K = Ka.
%=======================================================================%
% Total and effective stresses in backfilled stopes during the fill placement on a pervious base
% for barricade design %
%=======================================================================%
nmax = 101; % number of division of H (here nmax = 101);
time = 200; % time of filling (here t = 200 h);
m = 0.1; % filling rate during the filling operation (here m = 0.1 m/h);
H = m*time; % final thickness of the backfill (here H = 20 m);
c_v = 5; % consolidation coefficient of the backfill (here cv = 5 m2/h);
h_0 = 0.5; % step interval of x (x = 0 at the bottom, see Figure 1);
gama = 20; % saturated unit weight of the backfill (here γ = 20 kN/m3);
gama_w = 10; % unit weight of water (here γw = 10 kN/m3);
gama_sub = gama-gama_w; submerged unit weight of the backfill;
B = 4; % stope width (here B = 4 m);
Phi = 10; % effective internal friction angle of the backfill (here ϕ’ = 10°);
K_a = (1 − sind(Phi))/(1 + sind(Phi)); % Rankine’s active earth pressure coefficient of the backfill (used in this sample calculation);
K_0 = 1 − sind(Phi); %Jaky’s at-rest earth pressure coefficient (not used in this sample calculation);
A = 2*K_a*tand(Phi)/B;
 
% calculate the PWP, pw, in Equation (12)
for i = 1:nmax
l(i)= H/(nmax-1)*(i-1);
x(i)= H-l(i);
pw(i) = 0.0;
for jloop = -55:55
temp1 = m*jloop*h_0*sqrt(time)/sqrt(c_v);
temp2 = x(i)*jloop*h_0/sqrt(c_v*time);
a = exp(-(jloop*h_0)^2)*coth(temp1)*sinh(temp2);
if (jloop == 0)
a=0.0;
else
end
pw(i) = pw(i)+h_0/2.0*8.*sqrt((c_v*time)^3)*(jloop*h_0)^2*a;
end
pre_multi = gama*m/2./c_v/sqrt(pi*c_v*time)*exp(-x(i)*x(i)/4./c_v/time);
pw(i)=((-gama*x(i)*(1+m*x(i)/2./c_v)+pre_multi*pw(i)));
end
 
%calculate the dpw/dx of Equation (14)
for i = 1:nmax;
l(i) = H/(nmax-1)*(i-1);
x(i) = H-l(i);
derive_pw(i) = 0.0;
for j = -55:55;
temp1 = m*j*h_0*sqrt(time)/sqrt(c_v);
temp2 = x(i)*j*h_0/sqrt(c_v*time);
temp3 = j*h_0/sqrt(c_v*time);
temp4 = -x(i)/2./c_v/time;
a = exp(-(j*h_0)^2)*coth(temp1)*sinh(temp2);
b = exp(-(j*h_0)^2)*coth(temp1)*cosh(temp2)*(j*h_0/sqrt(c_v*time));
if (j == 0)
a=0.0;
b=0.0;
else
end
derive_pw(i)= derive_pw(i)+temp4*h_0/2.*8.*sqrt((c_v*time)^3)*(j*h_0)^2*a+h_0/2.*8*sqrt((c_v*time)^3)*(j*h_0)^2*b;
end
pre_multi = gama*m/2./c_v/sqrt(pi*c_v*time)*exp(-x(i)*x(i)/4./c_v/time);
derive_pw(i)=(-gama-m*gama*x(i)/c_v)+pre_multi*derive_pw(i);
end
 
% calculate the horizontal total stress of Equation (31)
for i = 1:nmax
l(i) = H/(nmax-1)*(i-1);
sigma_sub(i)=0.0;
n_y = i;
for k = 1:n_y
delta_y = l(i)/(n_y);
sigma_sub(i) = sigma_sub(i)+(gama+derive_pw(k))*exp(A*(k*delta_y))*delta_y;
end
sigma_sub(i) = exp(-A*l(i))*sigma_sub(i);
sigma_H(i)= K_a*sigma_sub(i)+ pw(i);
end
 
% results output and saved in the file “output filename.txt”
fid = fopen(Output filename. txt’,’w’)
for i=1:nmax
fprintf(fid,’%g %g\r\n’,l(i),sigma_H(i))
end
fclose(fid)
 
plot(sigma_H,l,’-.’);
set(gca,’Ydir’,’reverse’);

References

  1. Potvin, Y.; Thomas, E.; Fourie, A. Handbook on Mine Fill; Australian Centre for Geomechanics (ACG): Perth, Australia, 2005. [Google Scholar]
  2. Liu, G.S.; Li, L.; Yao, M.; Landry, D.; Malek, F.; Yang, X.C.; Guo, L.J. An investigation of the uniaxial compressive strength of a cemented hydraulic backfill made of alluvial sand. Minerals 2017, 7, 4. [Google Scholar] [CrossRef]
  3. Hassani, F.; Archibald, J. Mine Backfill; CD-ROM; Canadian Institute of Mining, Metallurgy and Petroleum (CIM): Montreal, QC, Canada, 1998. [Google Scholar]
  4. Jung, S.J.; Biswas, K. Review of current high density paste fill and its technology. Miner. Resour. Eng. 2002, 11, 165–182. [Google Scholar] [CrossRef]
  5. Aubertin, M.; Bussière, B.; Bernier, L. Environnement et Gestion des Rejets Miniers; Manual on CD-ROM; Presses Internationales Polytechnique: Montreal, QC, Canada, 2002. [Google Scholar]
  6. Simms, P.; Grabinsky, M.; Zhan, G.S. Modelling evaporation of paste tailings from the Bulyanhulu mine. Can. Geotech. J. 2007, 44, 1417–1432. [Google Scholar] [CrossRef]
  7. Komurlu, E.; Kesimala, A. Sulfide-rich mine tailings usage for short-term support purposes: An experimental study on paste backfill barricades. Geomech. Eng. 2015, 9, 195–205. [Google Scholar] [CrossRef]
  8. Cui, L.; Fall, M. Mathematical modelling of cemented tailings backfill: A review. Int. J. Min. Reclam. Environ. 2018, 1–20. [Google Scholar] [CrossRef]
  9. Mitchell, R.J.; Olsen, R.S.; Smith, J.D. Model studies on cemented tailings used in mine backfill. Can. Geotech. J. 1982, 19, 14–28. [Google Scholar] [CrossRef]
  10. Li, L.; Aubertin, M. A modified solution to assess the required strength of exposed backfill in mine stopes. Can. Geotech. J. 2012, 49, 994–1002. [Google Scholar] [CrossRef]
  11. Li, L.; Aubertin, M. An improved method to assess the required strength of cemented backfill in underground stopes with an open face. Int. J. Min. Sci. Technol. 2014, 24, 549–558. [Google Scholar] [CrossRef]
  12. Li, L. Analytical solution for determining the required strength of a side-exposed mine backfill containing a plug. Can. Geotech. J. 2014, 51, 508–519. [Google Scholar] [CrossRef]
  13. Li, L. Generalized solution for mining backfill design. Int. J. Geomech. 2014, 14, 04014006. [Google Scholar] [CrossRef]
  14. Yang, P.Y.; Li, L.; Aubertin, M. A new solution to assess the required strength of mine backfill with a vertical exposure. Int. J. Geomech. 2017, 17, 04017084. [Google Scholar] [CrossRef]
  15. Cao, S.; Yilmaz, E.; Song, W.D. Evaluation of viscosity, strength and microstructural properties of cemented tailings backfill. Minerals 2018, 8, 352. [Google Scholar] [CrossRef]
  16. Liu, G.S.; Li, L.; Yang, X.; Guo, L.J. Required strength estimation of a cemented backfill with the front wall exposed and back wall pressured. Int. J. Min. Miner. Eng. 2018, 9, 1–20. [Google Scholar] [CrossRef]
  17. Wu, J.Y.; Feng, M.M.; Chen, Z.Q.; Mao, X.B.; Han, G.S.; Wang, Y.M. Particle size distribution effects on the strength characteristic of cemented paste backfill. Minerals 2018, 8, 322. [Google Scholar] [CrossRef]
  18. Xu, W.B.; Cao, P.W.; Tian, M.M. Strength development and microstructure evolution of cemented tailings backfill containing different binder types and contents. Minerals 2018, 8, 167. [Google Scholar] [CrossRef]
  19. Zhang, J.; Deng, H.; Taheri, A.; Deng, J.; Ke, B. Effects of superplasticizer on the hydration, consistency, and strength development of cemented paste backfill. Minerals 2018, 8, 381. [Google Scholar] [CrossRef]
  20. Zhao, Y.; Soltani, A.; Taheri, A.; Karakus, M.; Deng, A. Application of slag-cement and fly ash for strength development in cemented paste backfills. Minerals 2019, 9, 22. [Google Scholar] [CrossRef]
  21. Sivakugan, N.; Rankine, K.; Rankine, R. Permeability of hydraulic fills and barricade bricks. Geotech. Geol. Eng. 2006, 24, 661–673. [Google Scholar] [CrossRef]
  22. Sivakugan, N.; Rankine, R.M.; Rankine, K.J.; Rankine, K.S. Geotechnical considerations in mine backfilling in Australia. J. Clean. Prod. 2006, 14, 1168–1175. [Google Scholar] [CrossRef]
  23. Sivakugan, N.; Rankine, K.; Lovisa, J.; Hall, W. Flow rate computations in hydraulic fill mine stopes. Indian Geotech. J. 2013, 43, 195–202. [Google Scholar] [CrossRef]
  24. Yumlu, M.; Guresci, M. Paste backfill bulkhead monitoring-A case study from Inmet’s Cayeli mine. In Proceedings of the 9th International Symposium in Mining with Backfill (CD-ROM), Canadian Institute of Mining, Metallurgy and Petroleum, Montreal, QC, Canada, 29 April–2 May 2007. [Google Scholar]
  25. Revell, M.B.; Sainsbury, D.P. Paste bulkhead failures. In Proceedings of the 9th International Symposium on Mining with Backfill (Minefill’07), Montréal, QC, Canada, 29 April–2 May 2007. [Google Scholar]
  26. Li, L.; Aubertin, M. Horizontal pressure on barricades for backfilled stopes. Part I: Fully drained conditions. Can. Geotech. J. 2009, 46, 37–46. [Google Scholar] [CrossRef]
  27. Li, L.; Aubertin, M. Limit equilibrium analysis for the design of backfilled stope barricades made of waste rock. Can. Geotech. J. 2011, 48, 1713–1728. [Google Scholar] [CrossRef]
  28. Cui, L.; Fall, M. Modeling of pressure on retaining structures for underground fill mass. Tunn. Undergr. Space Technol. 2017, 69, 94–107. [Google Scholar] [CrossRef]
  29. Yang, P.Y.; Li, L.; Aubertin, M.; Brochu-Baekelmans, M.; Ouellet, S. Stability analyses of waste rock barricades designed to retain paste backfill. Int. J. Geomech. 2017, 17, 04016079. [Google Scholar] [CrossRef]
  30. Ning, J.; Wang, J.; Tan, Y.; Zhang, L.; Bu, T. In situ investigations into mining-induced overburden failures in close multiple-seam longwall mining: A case study. Geomech. Eng. 2017, 12, 657–673. [Google Scholar] [CrossRef]
  31. Gibson, R.E. The progress of consolidation in a clay layer increasing in thickness with time. Geotechnique 1958, 8, 171–182. [Google Scholar] [CrossRef]
  32. Pedroni, L. Étude Expérimentale et Numérique de la Sédimentation et de la Consolidation des Boues de Traitement des Eaux Acides. Ph.D. Thesis, École Polytechnique de Montréal, Montréal, QC, Canada, 2011. [Google Scholar]
  33. Li, L.; Alvarez, I.C.; Aubertin, J.D. Self-weight consolidation of slurried deposition: Tests and interpretation. Int. J. Geotech. Eng. 2013, 7, 205–213. [Google Scholar] [CrossRef]
  34. El Mkadmi, N.; Aubertin, M.; Li, L. Effect of drainage and sequential filling on the behavior of backfill in mine stopes. Can. Geotech. J. 2013, 51, 1–15. [Google Scholar] [CrossRef]
  35. Grabinsky, M.W.; Simms, P.H. Self-desiccation of cemented paste backfill and implications for mine design. In Proceedings of the 9th International Seminar on Paste and Thickened Tailings, Australian Centre for Geomechanics, Crawley, Australia, 3–7 April 2006. [Google Scholar]
  36. Helinski, M.; Fourie, A.; Fahey, M.; Ismail, M. Assessment of the self-desiccation process in cemented mine backfills. Can. Geotech. J. 2007, 44, 1148–1156. [Google Scholar] [CrossRef]
  37. Wang, Y.; Fall, M.; Wu, A.X. Initial temperature-dependence of strength development and self-desiccation in cemented paste backfill that contains sodium silicate. Cem. Concr. Compos. 2016, 67, 101–110. [Google Scholar] [CrossRef]
  38. Belem, T.; Benzaazoua, M. Design and application of underground mine paste backfill technology. Geotech. Geol. Eng. 2008, 26, 147–174. [Google Scholar] [CrossRef]
  39. Taheri, A.; Tatsuoka, F. Stress–strain relations of cement-mixed gravelly soil from multiple-step triaxial compression test results. Soils Found. 2012, 52, 748–766. [Google Scholar] [CrossRef]
  40. Taheri, A.; Tatsuoka, F. Small-and large-strain behaviour of a cement-treated soil during various loading histories and testing conditions. Acta Geotech. 2015, 10, 131–155. [Google Scholar] [CrossRef]
  41. Belem, T.; Benzaazoua, M.; Bussière, B. Mechanical behaviour of cemented paste backfill. In Proceedings of the 53th Canadian Geotechnical Conference, Canadian Geotechnical Society, Montréal, QC, Canada, 15–18 October 2000. [Google Scholar]
  42. Helinski, M.; Fahey, M.; Fourie, A. Behavior of cemented paste backfill in two mine stopes: Measurements and modeling. J. Geotech. Geoenviron. 2011, 137, 171–182. [Google Scholar] [CrossRef]
  43. Thompson, B.D.; Bawden, W.F.; Grabinsky, M.W. In situ measurements of cemented paste backfill at the Cayeli Mine. Can. Geotech. J. 2012, 49, 755–772. [Google Scholar] [CrossRef]
  44. Grabinsky, M.W.; Bawden, W.F.; Simon, D.; Thompson, B.D.; Veenstra, R.L. In situ properties of cemented paste backfill from three mines. In Proceedings of the 66th Canadian Geotechnical Conference, Montreal, QC, Canada, 29 Septermber–3 October 2013. [Google Scholar]
  45. Grabinsky, M.W.; Simon, D.; Thompson, B.D.; Bawden, W.F.; Veenstra, R.L. Interpretation of as-placed cemented paste backfill properties from three mines. In Proceedings of the 11th International Symposium on Mining with Backfill, Australian Centre for Geomechanics, Perth, Australia, 20–22 May 2014. [Google Scholar]
  46. Shahsavari, M.; Grabinsky, M.W. Cemented paste backfill consolidation with deposition-dependent boundary conditions. In Proceedings of the 67th Canadian Geotechnical Conference, Regina, SK, Canada, 28 September–1 October 2014. [Google Scholar]
  47. Fahey, M.; Helinski, M.; Fourie, A. Consolidation in accreting sediments: Gibson’s solution applied to backfilling of mine stopes. Géotechnique 2010, 60, 877–882. [Google Scholar] [CrossRef]
  48. Shahsavari, M.; Grabinsky, M. Mine backfill porewater pressure dissipation: Numerical predictions and field measurements. In Proceedings of the 68th Canadian geotechnical conference, Quebec City, QC, Canada, 20–23 September 2015. [Google Scholar]
  49. Wood, M.D.; Doherty, J.P.; Walske, M.L. Deposition and self-weight consolidation of a shrinking fill. Géotech. Lett. 2016, 6, 72–76. [Google Scholar] [CrossRef]
  50. Walske, M.L.; Doherty, J. Incorporating chemical shrinkage volume into Gibson’s solution. Can. Geotech. J. 2017, 55, 903–908. [Google Scholar] [CrossRef]
  51. Zheng, J.; Li, L.; Mbonimpa, M.; Pabst, T. An analytical solution of Gibson’s model for estimating the pore water pressures in accreting deposition of slurried material under one-dimensional self-weight consolidation. Part I: Pervious base. Indian Geotech. J. 2018, 48, 72–83. [Google Scholar] [CrossRef]
  52. Zheng, J.; Li, L.; Mbonimpa, M.; Pabst, T. An Analytical solution of Gibson’s model for estimating pore water pressures in accreting deposition of slurried material under one-dimensional self-weight consolidation. Part II: Impervious base. Indian Geotech. J. 2018, 48, 188–195. [Google Scholar] [CrossRef]
  53. Aubertin, M.; Li, L.; Arnoldi, S.; Belem, T.; Bussière, B.; Benzaazoua, M.; Simon, R. Interaction between backfill and rock mass in narrow stopes. In Proceedings of the Soil and Rock America, Verlag Glückauf Essen (VGE), Essen, Germany, 22–26 June 2003. [Google Scholar]
  54. Li, L.; Aubertin, M.; Simon, R.; Bussière, B.; Belem, T. Modeling arching effects in narrow backfilled stopes with FLAC. In Proceedings of the 3rd International Symposium on FLAC and Numerical Modeling in Geomechanics, Sudbury, ON, Canada, 21–24 October 2003; CRC Press: Boca Raton, FL, USA, 2003. [Google Scholar]
  55. Li, L.; Aubertin, M.; Belem, T. Formulation of a three dimensional analytical solution to evaluate stress in backfilled vertical narrow openings. Can. Geotech. J. 2005, 42, 1705–1717. [Google Scholar] [CrossRef]
  56. Pirapakaran, K.; Sivakugan, N. Arching within hydraulic fill stopes. Geotech. Geol. Eng. 2007, 25, 25–35. [Google Scholar] [CrossRef]
  57. Pirapakaran, K.; Sivakugan, N. A laboratory model to study arching within a hydraulic fill stope. Geotech. Test. J. 2007, 30, 496–503. [Google Scholar]
  58. Li, L.; Aubertin, M. An improved analytical solution to estimate the stress state in subvertical backfilled stopes. Can. Geotech. J. 2008, 45, 1487–1496. [Google Scholar] [CrossRef]
  59. Li, L.; Aubertin, M. Horizontal pressure on barricades for backfilled stopes. Part II: Submerged conditions. Can. Geotech. J. 2009, 46, 47–56. [Google Scholar] [CrossRef]
  60. Jahanbakhshzadeh, A.; Aubertin, M.; Li, L. A new analytical solution for the stress state in inclined backfilled mine stopes. Geotech. Geol. Eng. 2017, 35, 1151–1167. [Google Scholar] [CrossRef]
  61. Jahanbakhshzadeh, A.; Aubertin, M.; Li, L. Three-dimensional stress state in inclined backfilled stopes obtained from numerical simulations and new closed-form solution. Can. Geotech. J. 2018, 55, 810–828. [Google Scholar] [CrossRef]
  62. Jahanbakhshzadeh, A.; Aubertin, M.; Li, L. Analysis of the stress distribution in inclined backfilled stopes using closed-form solutions and numerical simulations. Geotech. Geol. Eng. 2018, 36, 1011–1036. [Google Scholar] [CrossRef]
  63. Li, L.; Aubertin, M. Influence of water pressure on the stress state in stopes with cohesionless backfill. Geotech. Geol. Eng. 2009, 27, 1–11. [Google Scholar] [CrossRef]
  64. Li, L.; Aubertin, M. A three-dimensional analysis of the total and effective stresses in submerged backfilled stopes. Geotech. Geol. Eng. 2009, 27, 559–569. [Google Scholar] [CrossRef]
  65. Li, L.; Aubertin, M. An analytical solution for the nonlinear distribution of effective and total stresses in vertical backfilled stopes. Geomech. Geoeng. 2010, 5, 237–245. [Google Scholar] [CrossRef]
  66. Lambe, T.W.; Whitman, R.V. Soil Mechanics; Wiley: New York, NY, USA, 1969. [Google Scholar]
  67. Gibson, R.E.; Schiffman, R.L.; Whitman, R.V. On two definitions of excess pore water pressure. Geotechnique 1989, 39, 169–171. [Google Scholar] [CrossRef]
  68. Goodwin, E.T. The Evaluation of Integrals of the Form + f ( x ) e x 2 d x . In Mathematical Proceedings of the Cambridge Philosophical Society; Cambridge University: Cambridge, UK, 1949. [Google Scholar]
  69. Ting, C.H.; Sivakugan, N.; Shukla, S.K. Laboratory simulation of the stresses within inclined stopes. Geotech. Test. J. 2012, 35, 280–294. [Google Scholar]
  70. Fahey, M.; Helinski, M.; Fourie, A. Some aspects of the mechanics of arching in backfilled stopes. Can. Geotech. J. 2009, 46, 1322–1336. [Google Scholar] [CrossRef]
  71. Ting, C.H.; Shukla, S.K.; Sivakugan, N. Arching in soils applied to inclined mine stopes. Int. J. Geomech. 2011, 11, 29–35. [Google Scholar] [CrossRef]
  72. Sobhi, M.A.; Li, L.; Aubertin, M. Numerical investigation of earth pressure coefficient along central line of backfilled stopes. Can. Geotech. J. 2017, 54, 138–145. [Google Scholar] [CrossRef] [Green Version]
  73. Yang, P.Y.; Li, L.; Aubertin, M. Stress ratios in entire mine stopes with cohesionless backfill: A numerical study. Minerals 2017, 7, 201. [Google Scholar] [CrossRef]
  74. Yang, P.Y.; Li, L.; Aubertin, M. Theoretical and numerical analyses of earth pressure coefficient along the centerline of vertical openings with granular fills. Appl. Sci. 2018, 8, 1721. [Google Scholar] [CrossRef]
  75. Brinkgreve, R.B.J.; Kumarswamy, S.; Swolfs, W.M. PLAXIS 2014; PLAXIS bv: Delft, Netherlands, 2014. [Google Scholar]
  76. Zheng, J. Numerical, analytical and experimental studies of the hydro-geotechnical behaviors of slurried materials. Ph.D. Thesis, École Polytechnique de Montréal, Montréal, QC, Canada, 2019. [Google Scholar]
  77. Terzaghi, K. Theoretical Soil Mechanics; Wiley: New York, NY, USA, 1943. [Google Scholar]
  78. Holt, R.D.; Kovacs, W.D. Introduction to Geotechnical Engineering; Prentice Hall: Englewood Cliffs, NJ, USA, 1981. [Google Scholar]
Figure 1. Schematic diagram of a vertical backfilled stope with a pervious base and continuously filled with slurried backfill.
Minerals 09 00038 g001
Figure 2. Variation of σh with the value of nmax obtained by calculations with the MATLAB program; calculated with H = 20 m, B = 4 m, m = 0.1 m/h, cv = 5 m2/h, γw = 10 kN/m3, γ = 20 kN/m3, ϕ’ = 10° and K = Ka.
Minerals 09 00038 g002
Figure 3. Distribution of the vertical and horizontal total stresses along a vertical profile of 2 m from the vertical center line of the stope at the end of the filling operation, calculated by the proposed solutions (Equations (30) and (31)) with K = Ka and obtained by numerical simulation with Plaxis (numerical results taken from Fahey et al. [70]).
Minerals 09 00038 g003
Figure 4. (a) The physical model and (b) numerical model of the backfilled stope built by Plaxis2D after considering the vertical symmetry plane (VSP).
Minerals 09 00038 g004
Figure 5. Distribution of the (a) (excess) PWP, (b) total and (c) effective stresses along the VCL at the end of backfill deposition (at t = 24 h and h = H = 12 m), obtained by numerical modeling results performed with Plaxis2D and calculated using the proposed solution (Equations (12), (28)–(31)) by considering Ka; calculations conducted with H = 12 m, B = 4 m, cv = 4 m2/h, m = 0.5 m/h, γ = 20 kN/m3, γw = 10 kN/m3, and ϕ’ = 10°.
Minerals 09 00038 g005
Figure 6. Distribution of the horizontal and vertical total (a) and effective (b) stresses with different consolidation coefficient cv along the full height of the stope at the end of backfill accreting deposition, predicted by the proposed solution (Equations (28)–(31)) by using: H = 40 m, B = 6 m, γw = 10 kN/m3, γ = 20 kN/m3, m = 0.2 m/h, ϕ’ = 20°, and K = Ka.
Minerals 09 00038 g006
Figure 7. Distribution of the horizontal and vertical total (a) and effective (b) stresses with different filling rate m along the full height of the backfilled stope when the deposition ceases, predicted by the proposed solution (Equations (28)–(31)) by considering H = 40 m, B = 6 m, cv = 5 m2/h, γ = 20 kN/m3, γw = 10 kN/m3, ϕ’ = 20° and K = Ka.
Minerals 09 00038 g007
Figure 8. Distribution of the horizontal and vertical total (a) and effective (b) stresses with different effective friction angle ϕ’ along the full height of the backfilled stope when the deposition ceases, predicted by the proposed solution (Equations (28)–(31)) by using H = 40 m, B = 6 m, cv = 5 m2/h, m = 0.2 m/h, γw = 10 kN/m3, γ = 20 kN/m3 and K = Ka.
Minerals 09 00038 g008
Figure 9. Distribution of the horizontal and vertical total (a) and effective (b) stresses along the full height of the backfilled stope with different stope widths when the filling operation ceases, predicted by the proposed solution (Equations (28)–(31)) by considering H = 40 m, m = 0.2 m/h, cv = 5 m2/h, γ = 20 kN/m3, γw = 10 kN/m3, ϕ’ = 20°, and K = Ka.
Minerals 09 00038 g009

