Article

In Situ X-Ray CT Investigations of Meso-Damage Evolution of Cemented Waste Rock-Tailings Backfill (CWRTB) during Triaxial Deformation

1
Beijing Key Laboratory of Urban Underground Space Engineering, Department of Civil Engineering, School of Civil & Resource Engineering, University of Science and Technology Beijing, Beijing 100083, China
2
Beijing General Research Institute of Mining and Metallurgy Technology Group, Beijing 102628, China
*
Author to whom correspondence should be addressed.
Minerals 2019, 9(1), 52; https://doi.org/10.3390/min9010052
Submission received: 4 December 2018 / Revised: 3 January 2019 / Accepted: 6 January 2019 / Published: 16 January 2019
(This article belongs to the Special Issue Backfilling Materials for Underground Mining)

Abstract

:
This work presents an experimental study that focused on the meso-damage evolution of cemented waste rock-tailing backfill (CWRTB) under triaxial compression using the in situ X-ray computed tomography (CT) technique. Although numerous investigations have studied the magnitude of the strength of CWRTB material, the mesoscopic damage evolution mechanisms under triaxial deformation are still poorly understood. Artificial CWRTB samples with a waste rock proportion of 30% were prepared by mixing tailings, waste rock, cement, and water. A specific self-developed loading device was used to match the CT machine to real-time CT scanning for the CWRTB sample. A series of 2D CT images were obtained by performing CT imaging at five key points throughout the test and from three positions in the sample. The CT values, for the purpose of meso-damage evolution in CWRTB, were identified. The results showed that the axial stress–strain curve presented strain hardening characteristics. The CT data revealed the inhomogeneous damage field inside the CWRTB sample and the most severely damaged regions that were usually located at the waste block-tailings paste interfaces. The changes in CT values for the different regions of interest (ROI) revealed the complicated interactions between the waste blocks and the tailings paste matrix. The meso-structural changes, formation of the localized bands, and the associated stress dilatancy phenomenon were strongly influenced by the interactions between the waste blocks and tailing paste.

1. Introduction

During the mining of underground mineral resources, plenty of mine waste is generated by mine and mill operations worldwide [1,2,3,4,5]. Among much of the waste material, fine-grained tailings and coarse-grained rock blocks make up a large proportion. The fine-grained tailings are usually discharged in slurry form to surface dams, while coarse-grained waste blocks are stored by being deposited as dry material in large dumps. However, serious environmental pollution and ecological damage, due to the formation of stockpiles on the ground surface, as well as risk problems, such as tailings that cause dam failures, emerge [6,7,8]. A catastrophic event occurred in the Shanxi Province of China, in September 2008, 277 people died in an accident owing to a break in a tailing dam [9]. Moreover, the disposal of waste blocks on dumps has a serious, negative effect on the natural environment; its stability also threatens the life and property of people. Therefore, backfilling technology is expected to fill the underground gobs using mine tailings, which is a better way to dispose of these solid wastes [10,11,12,13]. Cemented waste rock-tailing backfilling (CWRTB) has gained increasing popularity as a mine backfill material because it offers mine designers more versatility than other backfill techniques and is usually characterized by a mixture of mill tailings, waste blocks, hydraulic binder, and water. Using the CWRTB technique in the mining industry may provide ground and wall support, limit the possibility of caving and, therefore, economic and environmental benefits may be achieved. Hence, the mechanical properties of CWRTB, including the uniaxial compressive strength and triaxial stress–strain behaviors, are viewed as a key factor in the safety and efficient design of CWRTB structures.
The uniaxial compressive strength (UCS) of CWRTB is one of the most important factors considered in the design of backfill because the CWRTB structure must remain stable during the extraction of adjacent stopes to ensure the safety of the mine workers and to avoid ore dilution. Many scholars have studied the strength and mechanical characteristics of CWRTB and its influencing factors. Hane et al. [14] revealed the influence of waste rock content on the strength and deformation characteristics of the sample through UCS tests and found that adding waste rock into the mixture could improve the strength of the sample. Wu et al. [15] performed UCS tests to study the mechanical characteristics of gangue backfilling and continuous particle grading and found that the strength of the samples increased and porosity decreased backfilling; they also found that the UCS backfilled gangue was greater than the sample without gangue block. He et al. [16] conducted uniaxial compression testing and obtained seven different ratios of backfill strength at different solidification times. The strength of backfill samples after 28 days of curing was selected as the basic parameter to simulate stope stability. UCS with different curing durations for CWRTB were also obtained by He et al. [17] and the corresponding theoretical damage model and energy dissipation equation of cemented waste rock backfill and surrounding rock were established. Liu et al. [18] investigated the strength characteristics of a CWRTB sample at low temperatures and the results showed that adding waste blocks could improve slurry density. They also found that low temperatures affected hydration and that the strength of a backfill soil sample has a strong impact on curing temperature and curing time.
Although the required strength of CWRTB is an important parameter in mining design, investigations of the failure process of CWRTB are also crucial for ensuring stope stability. The damage evolution characteristics of CWRTB have already been studied by ultrasonic measurements and acoustic emission monitoring. Du et al. [19] conducted uniaxial compression tests for cemented coal waste backfill samples and monitored the failure process of samples by acoustic emission (AE) positioning technology. Anay et al. [20] used the acoustic emission method to monitor the formation and agglomeration of micro-cracks in cement slurry samples. Assi et al. [21] used acoustic emission technology to study the early hydration of a kind of Portland cement paste and explored the relationship between the recording signals related to elastic stress waves and the potential mechanism related to cement hydration. According to the literature review, almost all the recent studies involved the damage evolution of CWRTB under a uniaxial compression state. However, in the actual mining stope, the paste backfill is always under three-dimensional stress conditions. Therefore, the triaxial mechanical behaviors of CWRTB are critical to the stability of mining stopes. Triaxial compression testing is an effective way to evaluate the mechanical characteristics of a material and most of the studies focused on cemented paste backfill (CPB), no waste blocks were added to the CPB. Pierce [22] studied the triaxial compression behaviors of CPB under a confining pressure of 103.5 kPa, a stress–strain behavior was revealed. Based on the particle flow code (PFC2D), Liu et al. [23] developed a numerical model to reproduce the stress–strain curve of cemented paste backfill (CPB); the triaxial stress–strain response showed that the model could be used to predict the strength and binder additive optimization for CPB material. Fall et al. [24] conducted laboratory triaxial compression testing for CPB and found that stress–strain behavior of CPB is strongly influenced by the confinement, although the strength, stiffness, and failure modes are different under various confining pressure conditions. Wu et al. [25] studied the influence of particle size distribution of the aggregates on the CPB mechanical parameters and revealed a relationship between the compressive strength and the confining pressure. Xu et al. [26] conducted triaxial deformation testing to reveal the deformation and energy dissipation characteristics of backfill paste. The results showed that the failure mode of the samples was different for the sample under uniaxial compression, X-shaped and Y-shaped shear failure morphology was observed. Batista de Araujo et al. [27] pointed out that the mechanical behavior of CPB under high confining pressure is crucial to the stability of stopes. CPB samples with different curing method were tested, and it was found that the curing method and binder content influenced the geo-mechanical properties. In order to study the effects of confining pressure on the strength of cement backfill paste from the Zijinshan gold copper mine, Deng et al. [28] performed a triaxial test on the energy dissipation characteristics of backfill paste with different cement–sand ratios and established the relationship between confining pressure and dissipated energy. For CPB under triaxial compression, many effects of the macroscopic mechanical behaviors of CPB under triaxial compression have been explored. However, application of the X-ray CT technique to investigate mesoscopic damage evolution is not common. There are many advantages of using CT scanning to detect crack damage evolution compared to other methods, such as acoustic emission monitoring or ultrasonic measurement. The meso-structural changes during sample deformation can be observed, and the damage evolution of backfill can be conducted visually and by digitization analysis. The X-ray CT technique offers real-time information on the variation of some physical parameters occurring in the tested sample. Sun et al. [29] studied porosity evolution during CPB deformation via a medical X-ray CT technique that revealed the porosity distribution. Wang et al. [30] conducted uniaxial compression testing on CWRTB using a real-time industrial X-ray CT technique. The crack damage evolution characteristics were obtained and a corresponding damage constitutive equation was established. Based on the literature review, studies about the mechanical behaviors of CWRTB have mainly focused on macroscopic strength properties; however, the physically mesoscopic mechanical mechanism of CWRTB under triaxial compression has rarely been studied. Furthermore, investigating the meso-structural changes during triaxial deformation and revealing the associated meso-damage characteristics of CWRTB is important for predictions of the stability of pillars and the ground pressure control during mining.
In this work, we continue to study the meso-damage evolution characteristics of CWRTB through laboratory experimentation. In this work, we use the results of a recent CWRTB experiment under triaxial deformation. The triaxial confining pressure was determined via in situ monitoring of the Lilou Iron Mine. The confining pressure was applied by a special self-designed loading apparatus developed to match the loading device and X-ray CT machine, which is transparent to X-rays. Rather than focus on macroscopic stress–strain characteristics, this paper explores how interactions between waste blocks and tailings paste occur throughout the experiment by interpreting various stages of progressive failure. This work emphatically investigates the mesoscopic damage evolution mechanism for CWRTB under triaxial compression at different loading stages.

2. Material and Methods

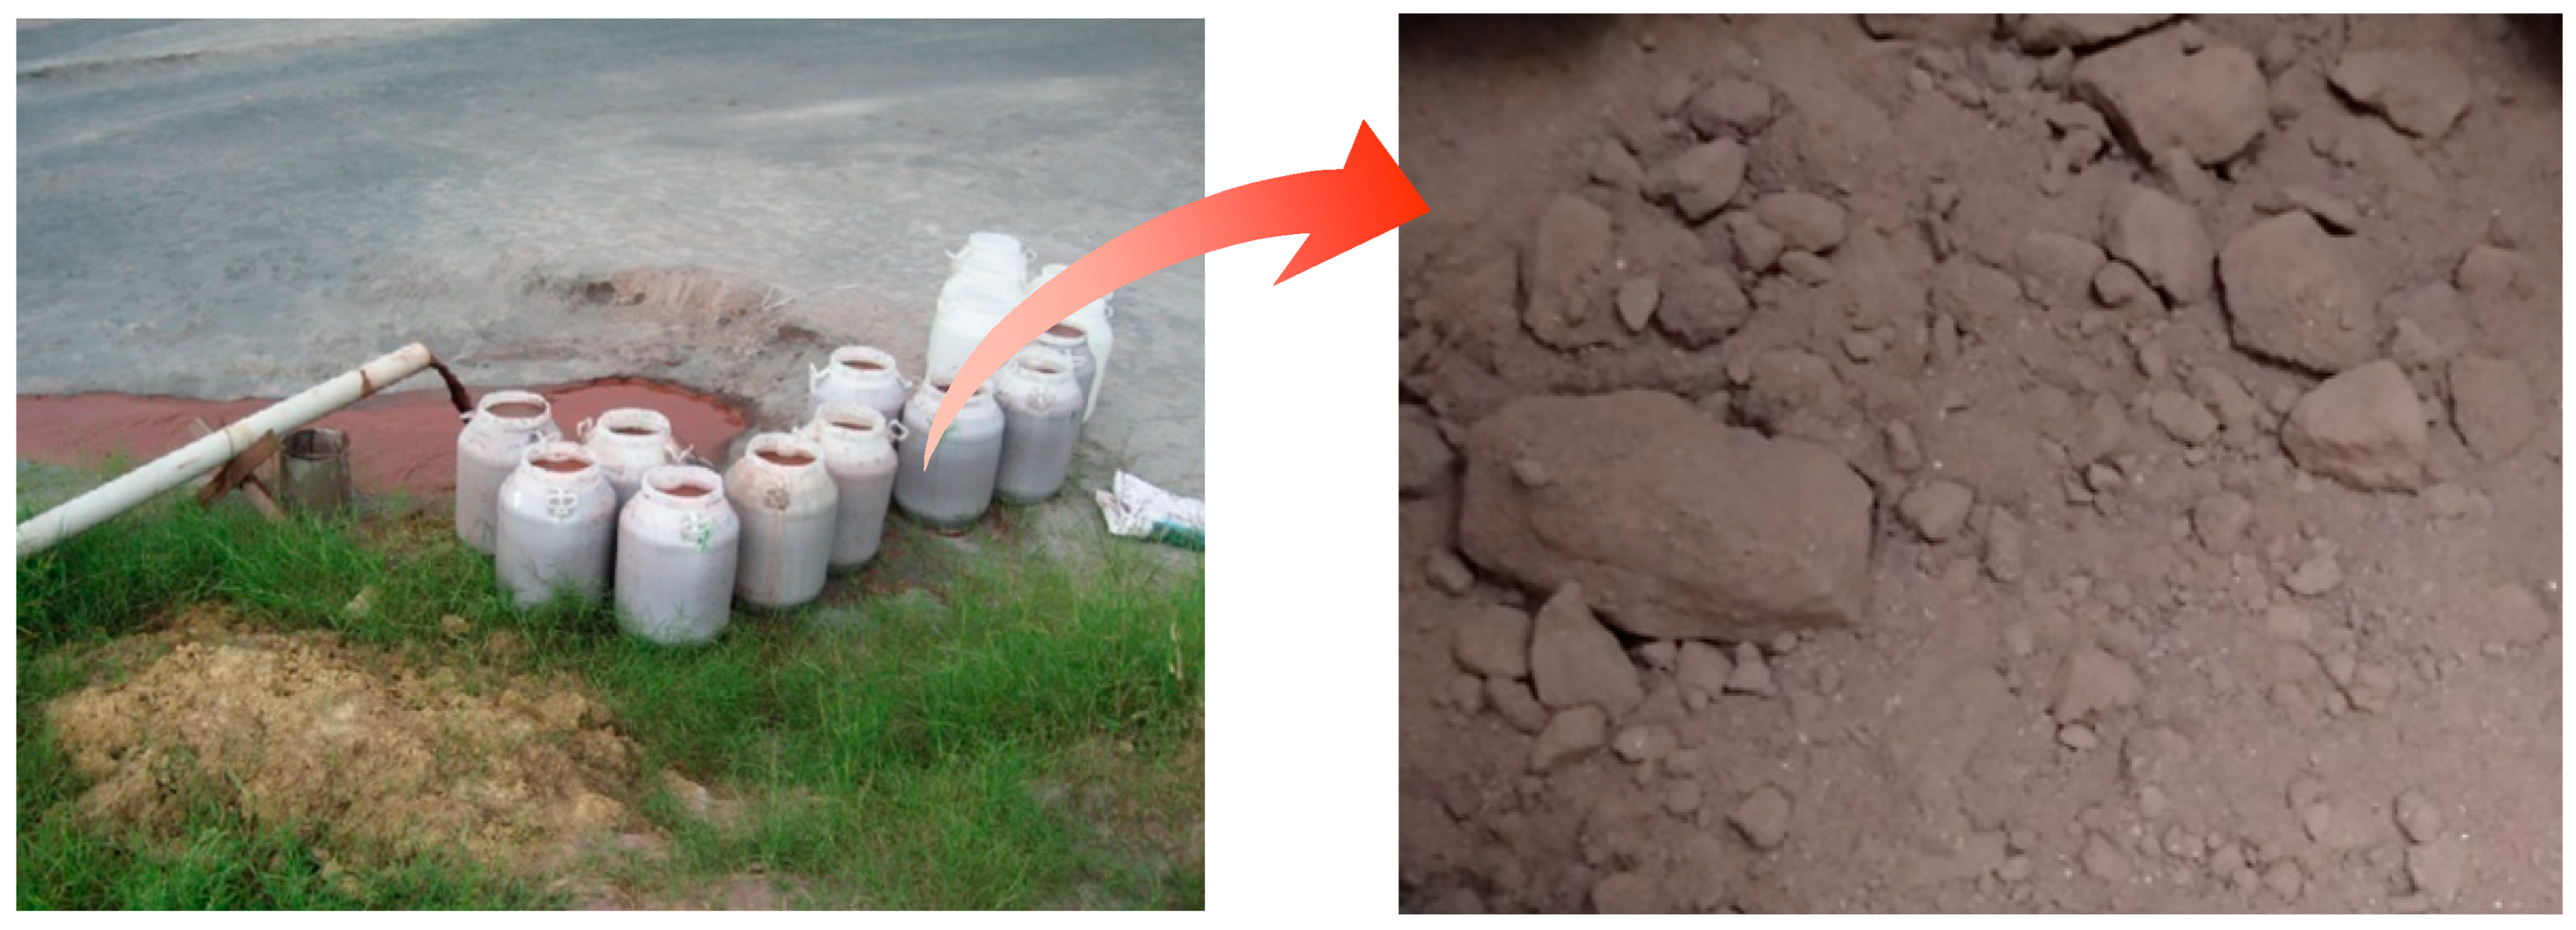
2.1. Tailings and Binders

The full tailings were obtained from the Lilou Iron Mine in the Anhui province, China, as shown in Figure 1. The relative density of the full tailings was measured according to Chinese standard GB/T 208-94 [30]. The particle size distribution of the tailings was measured by a CILAS1064 particle size analyzer (Table 1). The main mineral composition of tailings by X-ray powder diffraction analysis revealed that the tailings were composed of quartz (80.2%), hematite (9.7%), dolomite (5.4%), and muscovite (2.6%). The binder used in the preparation of the CWRTB samples was a kind of ordinary Portland cement (OPC, 32.5), which is in accordance with Chinese National Standards GB 175-2007 [31]. The main components of the OPC include calcium aluminate, dicalcium silicate, calcium ferroaluminates, tricalcium silicate, and gypsum. The proportion of dicalcium silicate, and tricalcium silicate is about 25% and 51%, respectively. Binder material was added to the mixture to produce a hydration reaction that resulted in gelation properties.
The SEM results, Figure 2, showed that the consolidation process of the full tailings paste included a series of processes, hydration reaction, dissolution, accumulation, and hardening. When the tailings, binder, and water were mixed together, 3CaO·SiO2 and 2CaO·SiO2, a dissolution and hydration reaction took place. This process generated large amounts of gel and sped up the cement reaction of the fine particles in the full tailings material. The strength of the cemented paste backfill improved accordingly. The pores and micro-cracks could be seen in the SEM figures. The micro-structure was clearly visible with the increase of magnification on the images. The brightest points in the SEM pictures indicated iron power; the dark regions indicated the mixture experiencing a full hydration reaction, and the gray regions indicated that the hydration reaction was underreacting.

2.2. Waste Rock

During the CWRTB sample preparation, the waste rocks acted as coarse aggregates obtained from the Lilou Waste Dump and were mainly composed of marble aggregates. For triaxial testing, the CWRTB sample was cylindrically shaped, with a size of Φ 50 mm × H 100 mm. The waste blocks were obtained from the goaf, which are formed during mining blast. The lithology of the waste blocks was marble, the same as the surrounding rock. According to GB/T 50123-1999 [32], the required particle size of waste rock should not be more than 1/5 times the sample height. After the crushing treatment of the marble blocks, the particle size of the waste rock was 2–10mm and about 65.7% of the waste rock aggregates was 6–8 mm. The proportion of crushed waste rock within 2–6 mm was 35.3%. Figure 3 shows the physical and mechanical properties of the waste blocks. According to XRD analysis, the main mineral composition of the marble waste block was quartz, hematite, calcite, and tremolite. The SEM results revealed that the microscopic structure of the waste block had a compact texture, some of the dissolved voids can be observed in the images. The natural density of the marble aggregates was 2.81 g/cm3; the uniaxial compressive strength was about 180.51 MPa.

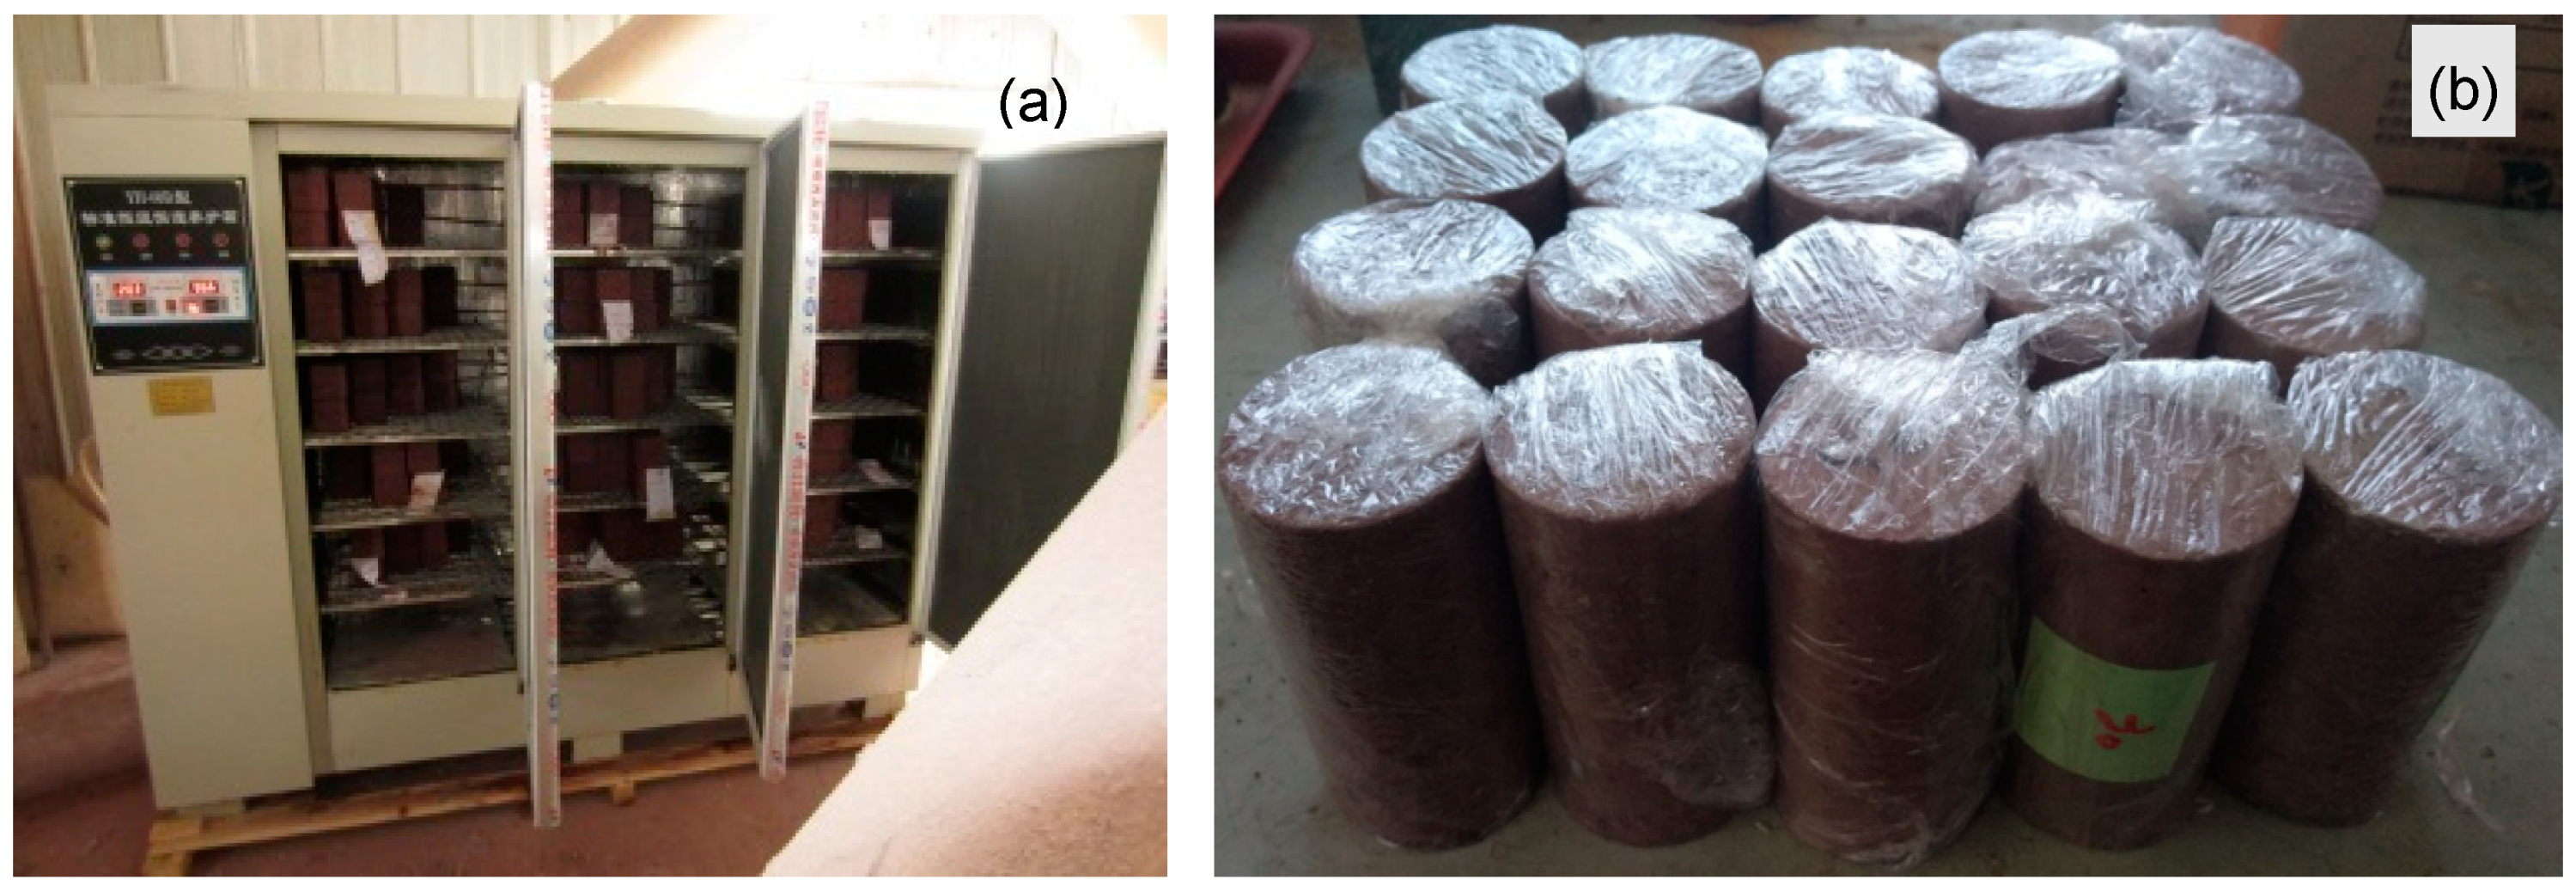
2.3. CWRTB Sample Preparation

Tap water was used to mix the required amounts of tailings, binder, and waste rock. The ratio of the full tailings and binder was 1:8, according to the mining design. The waste rock proportion was designed to be 30% and material pulp density was about 75%. In order to ensure the homogenous distribution of the waste pieces, the mixtures were placed in a double spiral mortar mixer for 10 min. During the mix operation, the full tailings and waste blocks were first mixed, then the binder was added to the mixture, and, finally, water was added. Immediately after mixing, the mixtures were poured into a cast iron cylinder with an inner diameter of 50 mm and a height of 100 mm, the same as the CWRTB sample. The samples were then cured in a humidity chamber at 20 ± 1 °C with a relative humidity (RH) of 90% for 24 h (sealed). The samples were then demolded and placed in the same curing chamber under the same curing conditions for 28 days, until the mechanical testing was conducted (Figure 4). In this work, a total of 20 samples were prepared for the laboratory study.

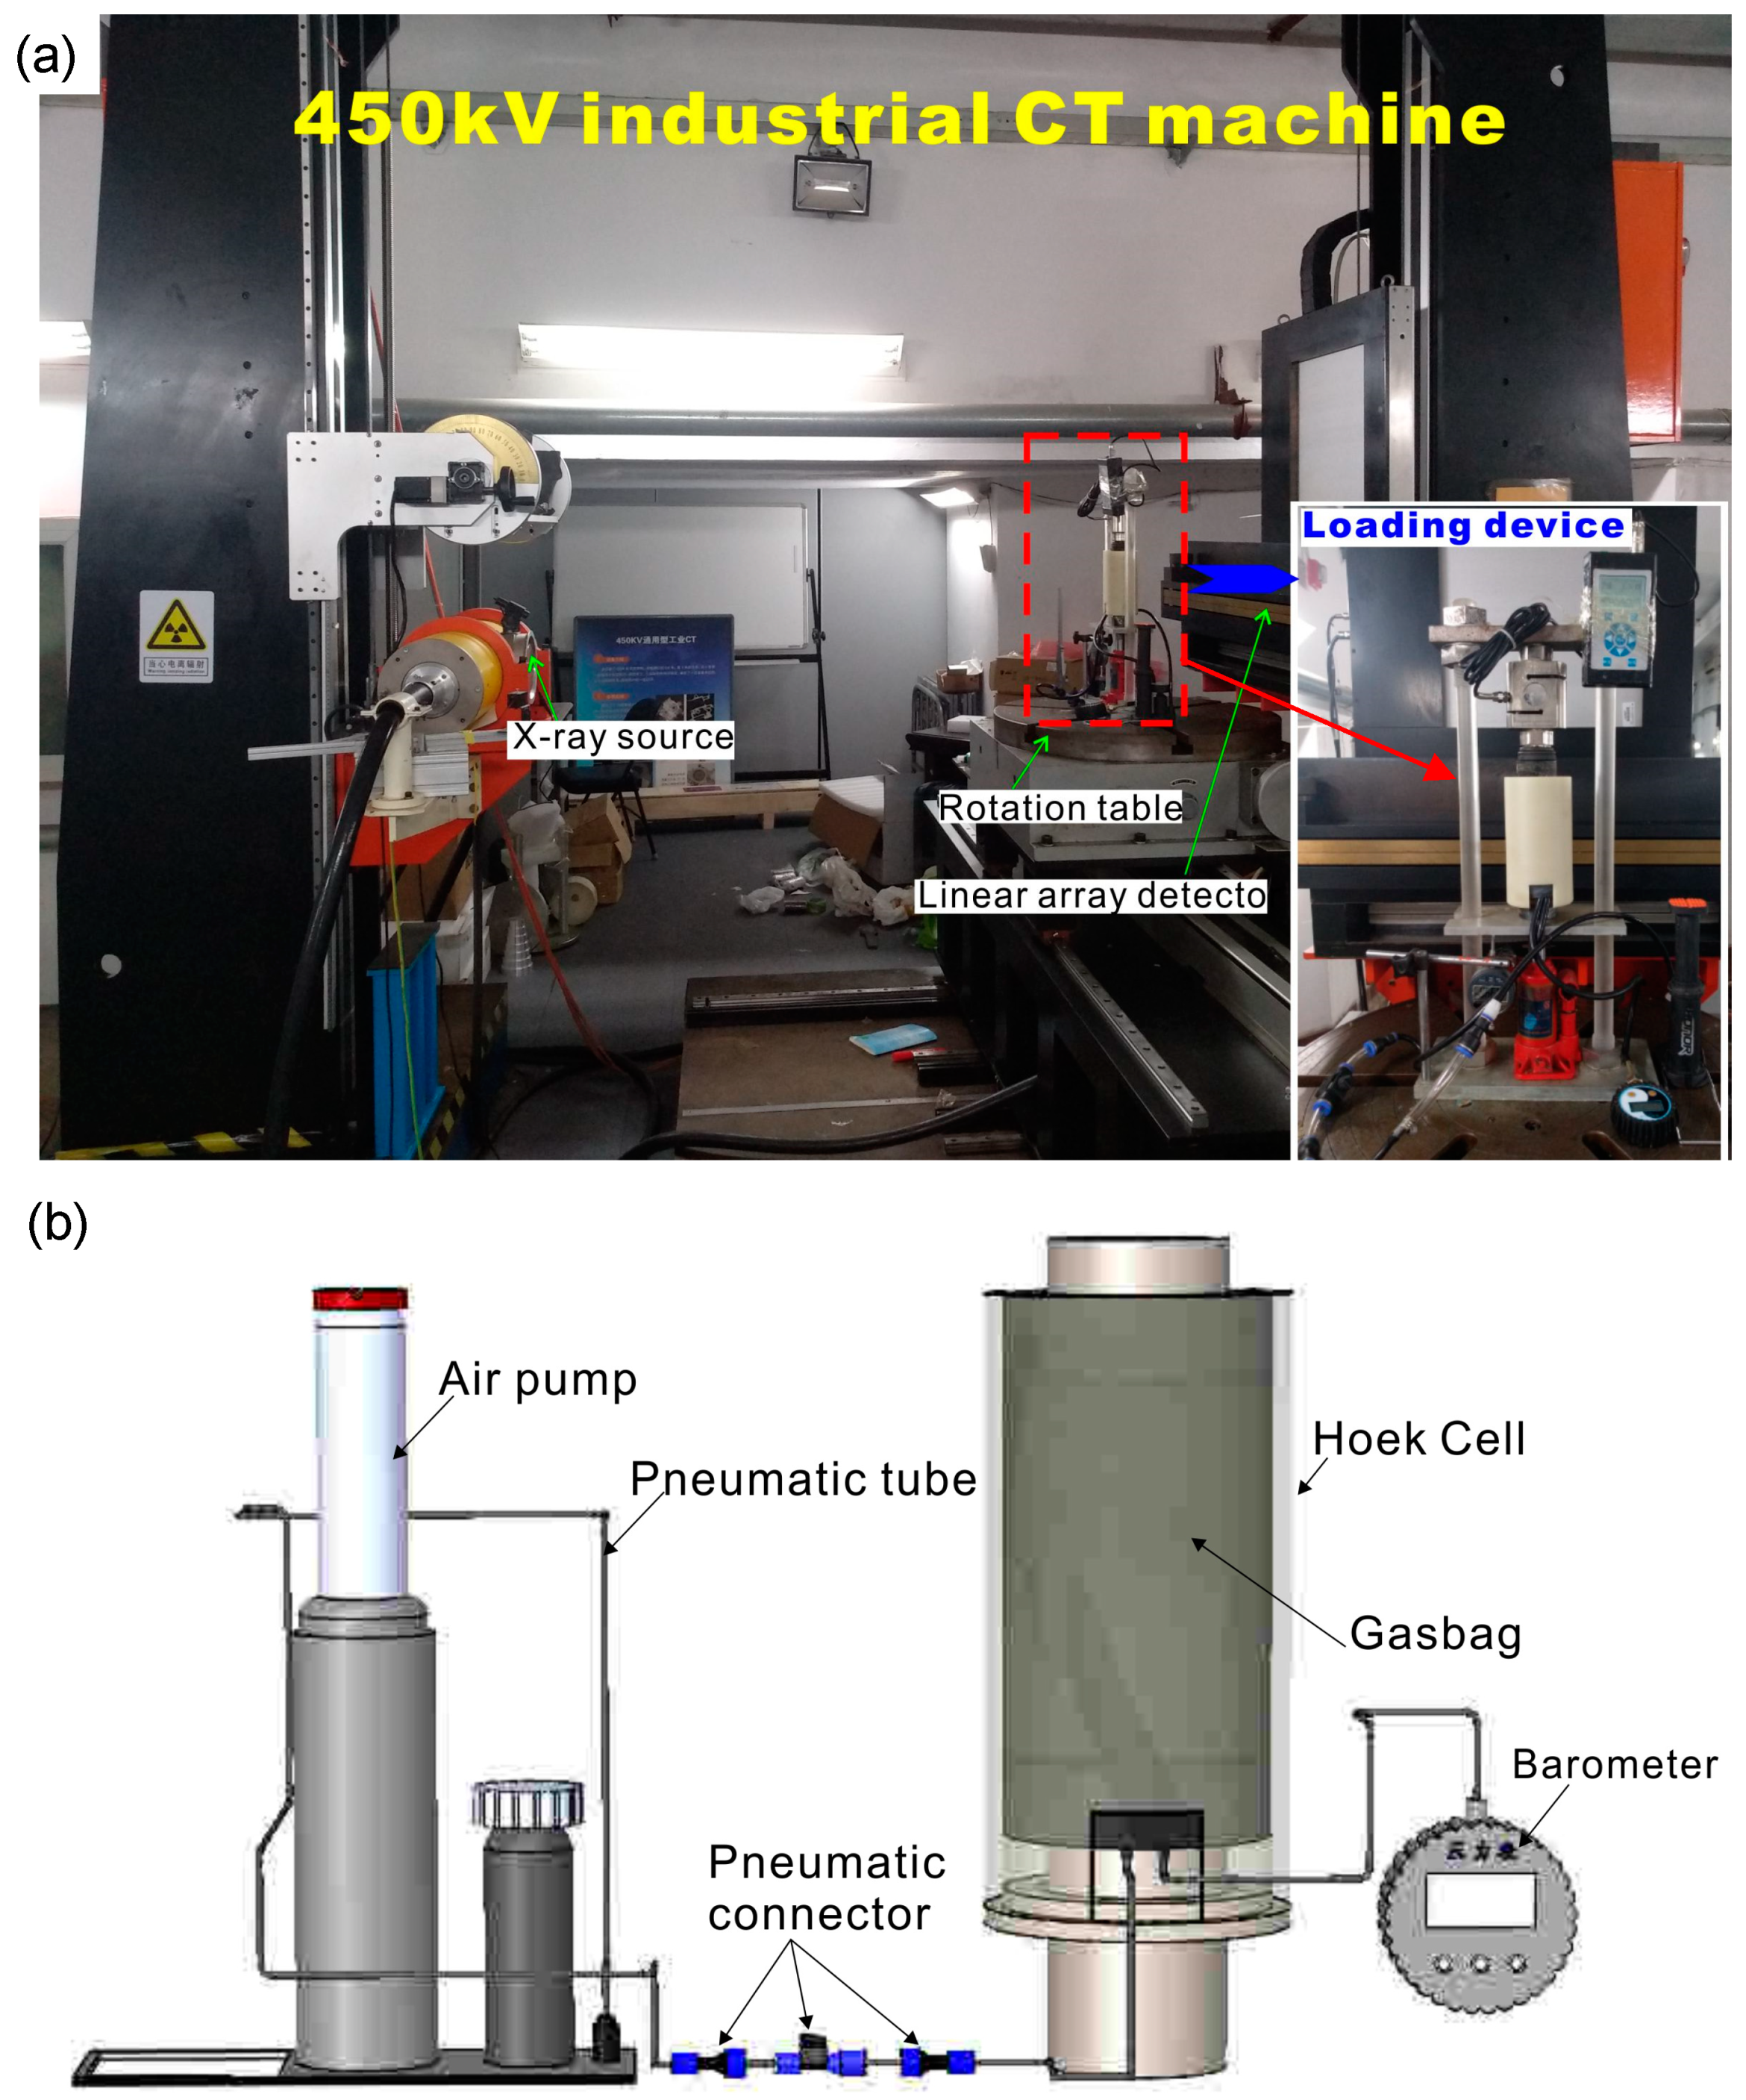
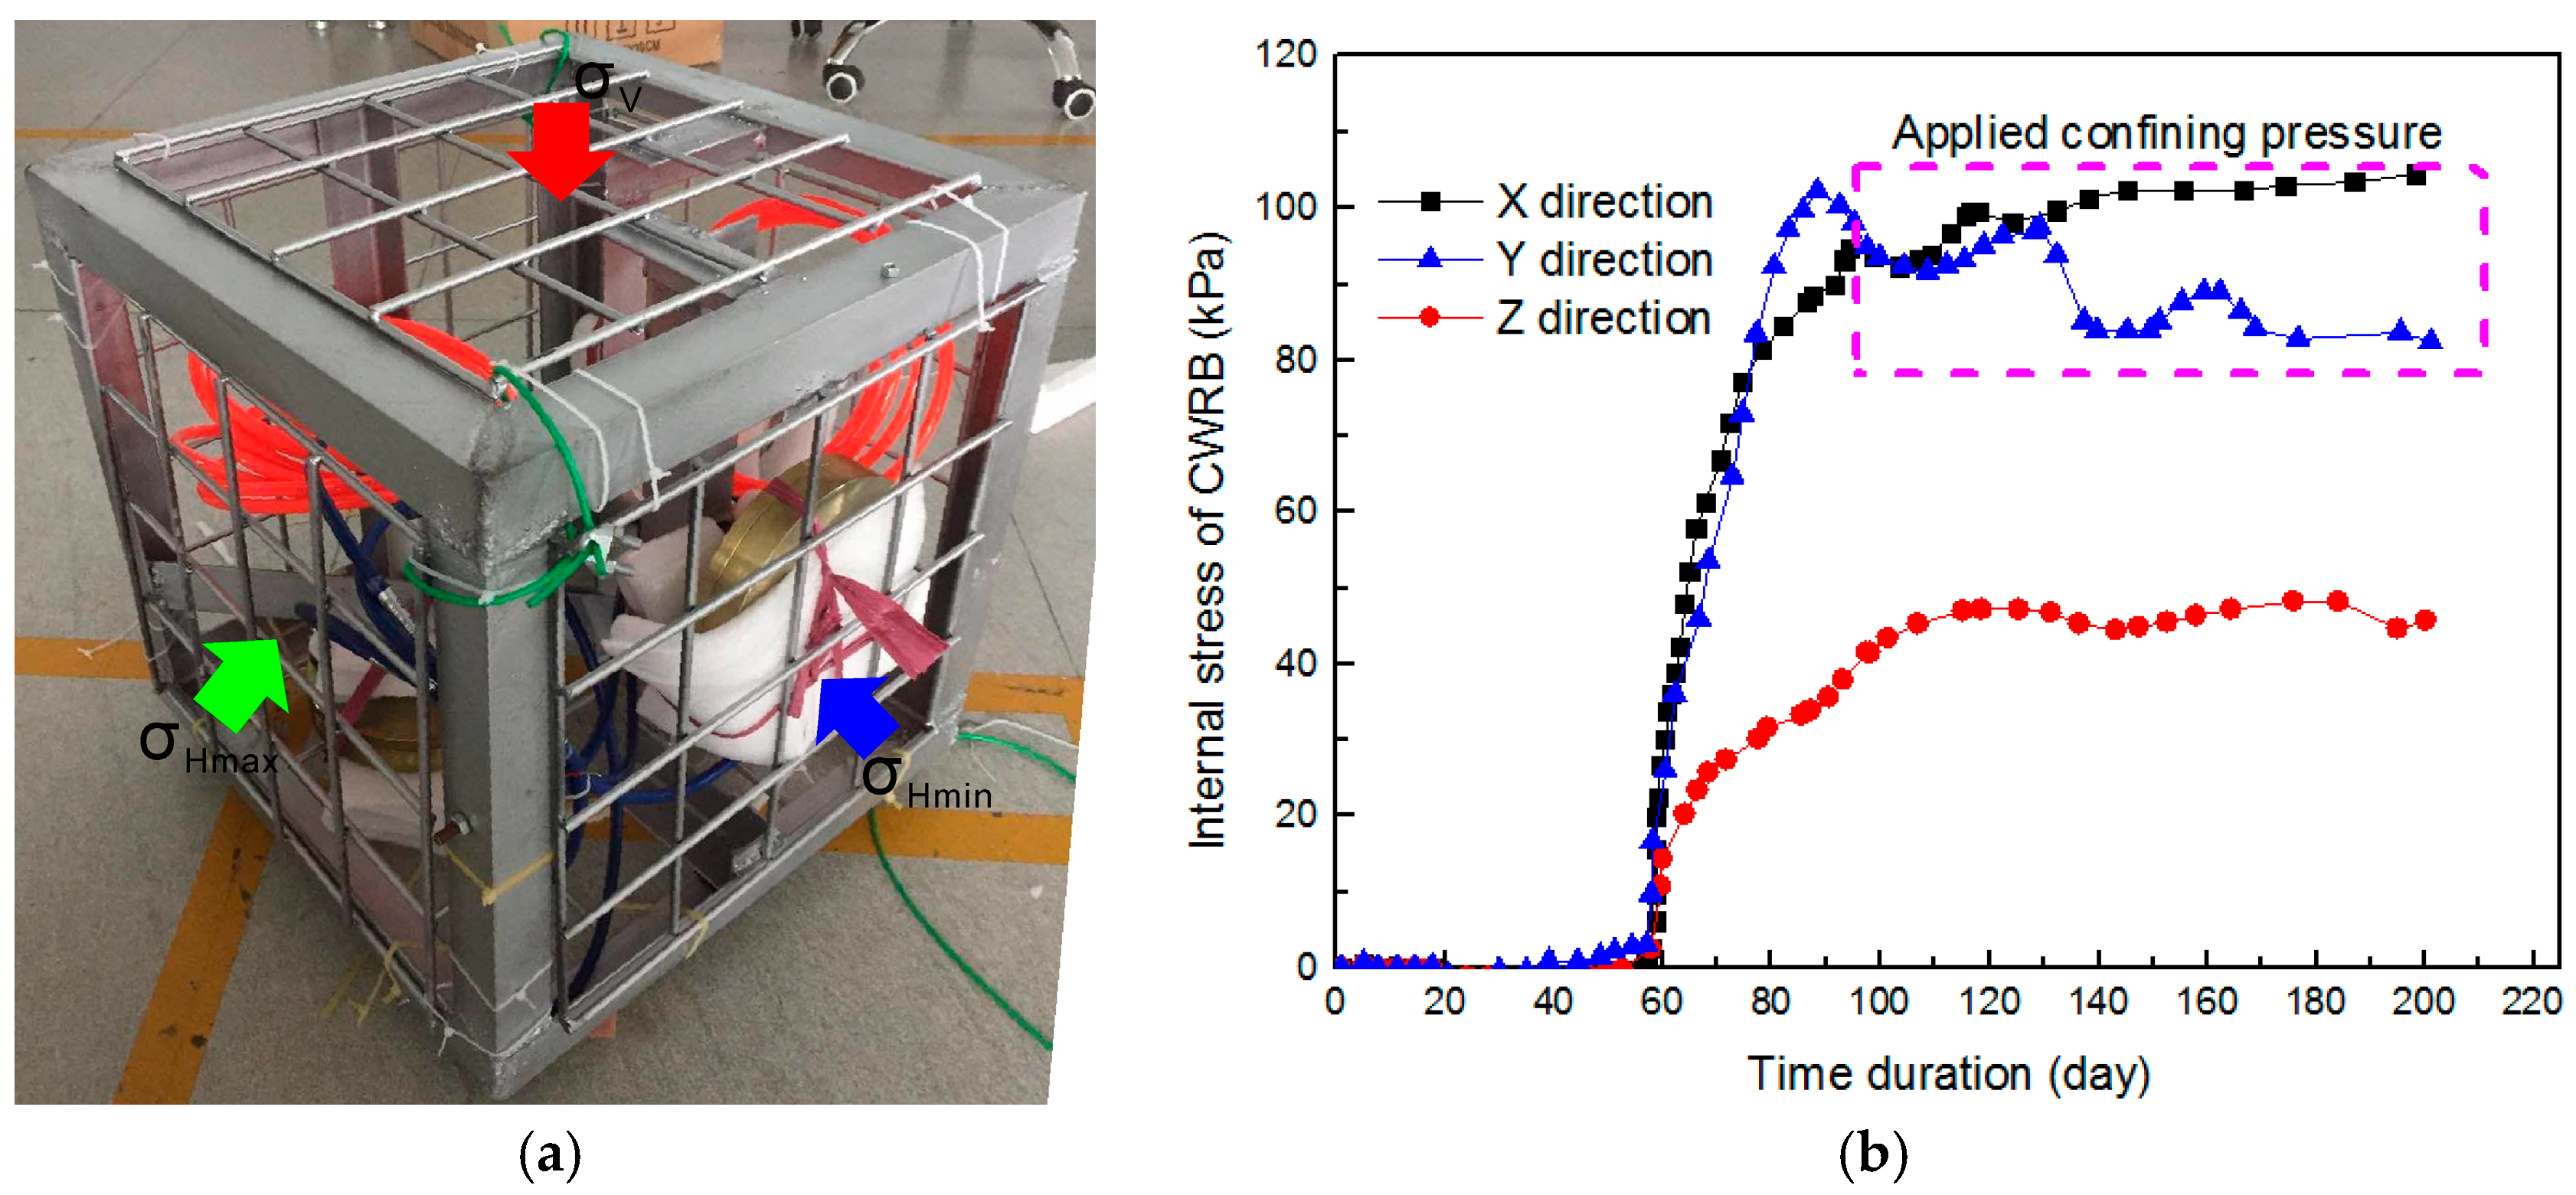
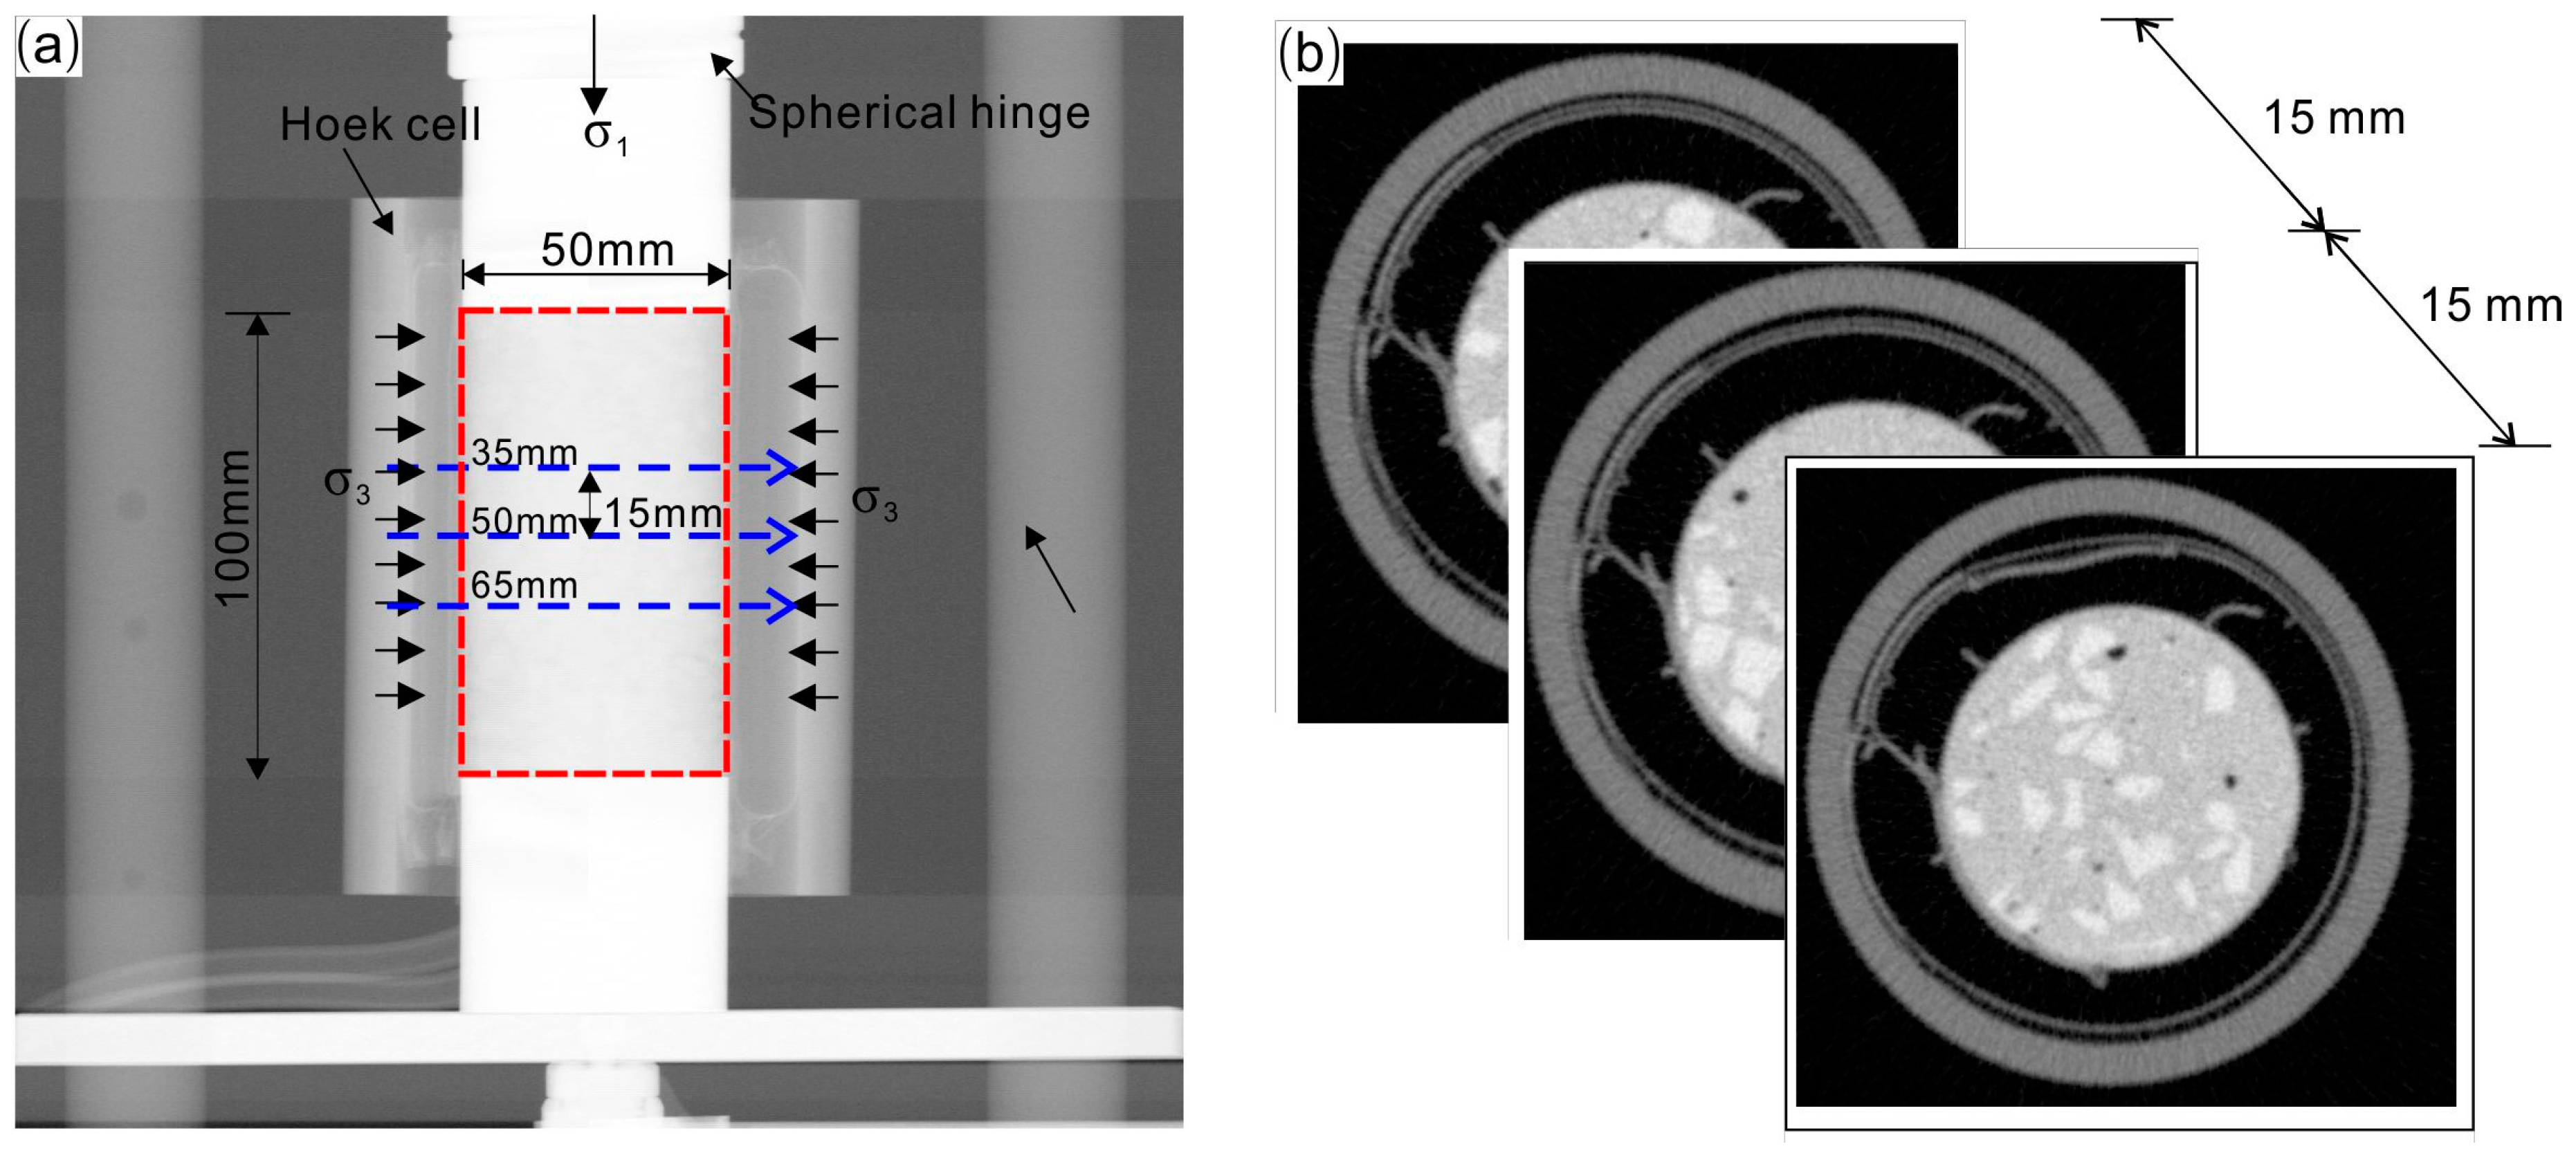
2.4. Lab Test Set-up

CT images of the internal meso-structures of the CWRTB sample were obtained using a 450 kV industrial X-ray CT system (Institute for High Energy Physics, Beijing, China). An industrial X-ray CT machine works in the same way as medical CT devices. The sample was also subjected to cyclic triaxial compression conditions, as shown in Figure 5a. The principle of the imaging measurement was to record an X-ray image of a sample at different angles. From these different angles, it was possible to reconstruct the 3D object by adding together virtual slices that were reconstructed using appropriate algebraic or reverse projection algorithms [33,34,35,36]. The system consisted of a focused X-ray source, an imaging enhancement detector coupled with a CCD camera, a sample manipulator, and an image processing unit. In this experiment, as the sample size was relatively large (Φ 50 mm × H 100 mm), a power setting of 420 kV and 2.0 mA was used for the 360° fan beam scan with 54,000 project views. The CWRTB sample was installed in a loading device and mounted on a precision rotary table. The detector was then adjusted to fit the image in the field of view. Before performing the CT scan, the scanning parameters and conditions were calibrated and set to obtain high-resolution images and reduce noise and artifacts in the image acquisition process. Through a rotating object in the computer controlled rotary table, the isometric X-ray attenuation recorded the different angles between 0 and 360°. The data was then reconstructed to create a cross-sectional image of an object on the scanning plane. Each CT image is called a slice because it can scan objects on an airplane that appear to be cut off. Each slice or cross-sectional image varied from 1024 to 1024 µm in pixel size. Stacking these slices together created a three-dimensional volume image of the scanned sample.
In order to keep track of the in situ mechanical behaviors of the CWRTB sample under the conditions of the classical triaxial test, a loading device was specially designed to meet the requirement of the CT machine. This test apparatus was made up of a reaction frame, a displacement measurement subsystem, and a loading measuring subsystem. The test apparatus should be transparent to X-rays, so it was made of low-attenuated materials: Fiberglass reinforced with nylon resin (PA66 + GF30), with a density of about 1.38 g/cm3, was used for the reaction column. In the nylon resin material, 30% glass fiber was added, which had acceptable heat resistance, strength and rigidity. Its deformation was relatively small when subjected to tensile stress. The tensile strength, yield strength, compressive strength, and elastic modulus of the material PA66 + GF30 was about 80.32 MPa, 54.88 MPa, 103.88 MPa, and 330 MPa, respectively. To avoid winding during the rotating of the rotation table, the force measuring subsystem was battery-driven. Figure 5 shows the loading apparatus used in the triaxial compression test. The confining pressure was applied by a gasbag Hoek cell that provided a maximum of confining pressure of 600 kPa and 0.5 kPa precision.

2.5. Testing Scheme

During the triaxial deformation testing, the loading apparatus was first placed on the rotation table of the X-ray industrial CT machine. Then, the CWRTB sample was place into the Hoek cell and installed on the loading device, a confining pressure of 94.5 kPa monitored from the filling stope at −400 m level was applied by a gas-bag supercharger. The in-situ stress monitoring result of the CWRTB material is shown in Figure 6. The axial loading was then applied at a constant speed of 0.1 kN/s until the peak strength; after the peak strength, the loading was controlled by a displacement mode at a rate of 0.3 mm/min. The determination of the CT scanning stages referred to the macroscopic stress–strain curves, as shown in Figure 7a. The stress–strain curves showed strain hardening characteristics and the strength of the CWRTB sample was about 3.571 MPa at an axial strain of 5%. During in situ X-ray scanning testing, five scanning stages were chosen and the corresponding axial strain was set to 0%, 0.542%, 1.371%, 1.919%, and 3.210%, respectively, as shown in Figure 7b.
X-ray CT images were obtained from the central three cross sections on the CWRTB sample. The initial positions were at 65 mm, 50 mm, and 35 mm along the sample, from top to bottom, as shown in Figure 8. It took about one minute to scan a single cross-section of the sample and two minutes to reconstruct a CT image. A total of 54,000 project views and five accumulations were needed. It took about 18 min for every CT scan in the stress–strain curve. In this work, about 90 min were needed to complete the CT experiment. When the X-ray CT scan was performed, we stopped loading in order to keep the CWRTB sample in a stationary state. After one CT scan of a loading stage, the samples were loaded again with the same loading rate. It is important to note that stress relaxation phenomenon occurred at each scanning point on the stress–strain curve, as the axial displacement was fixed during the scanning process.
The data were composed of the radiological densities of each pixel, which can be visualized as a grayscale image on the grid. Each pixel was expressed via a Hounsfield value. The gray scale has a dynamic range, which is suitable for the crack variation in the CWRTB sample. Changes of the radiological density indicate variations in the internal crack, which can be calculated via Hounsfield values. When cracks appear in the CWRTB sample, the color is black at the localization of the cracks.

3. Results and Discussions

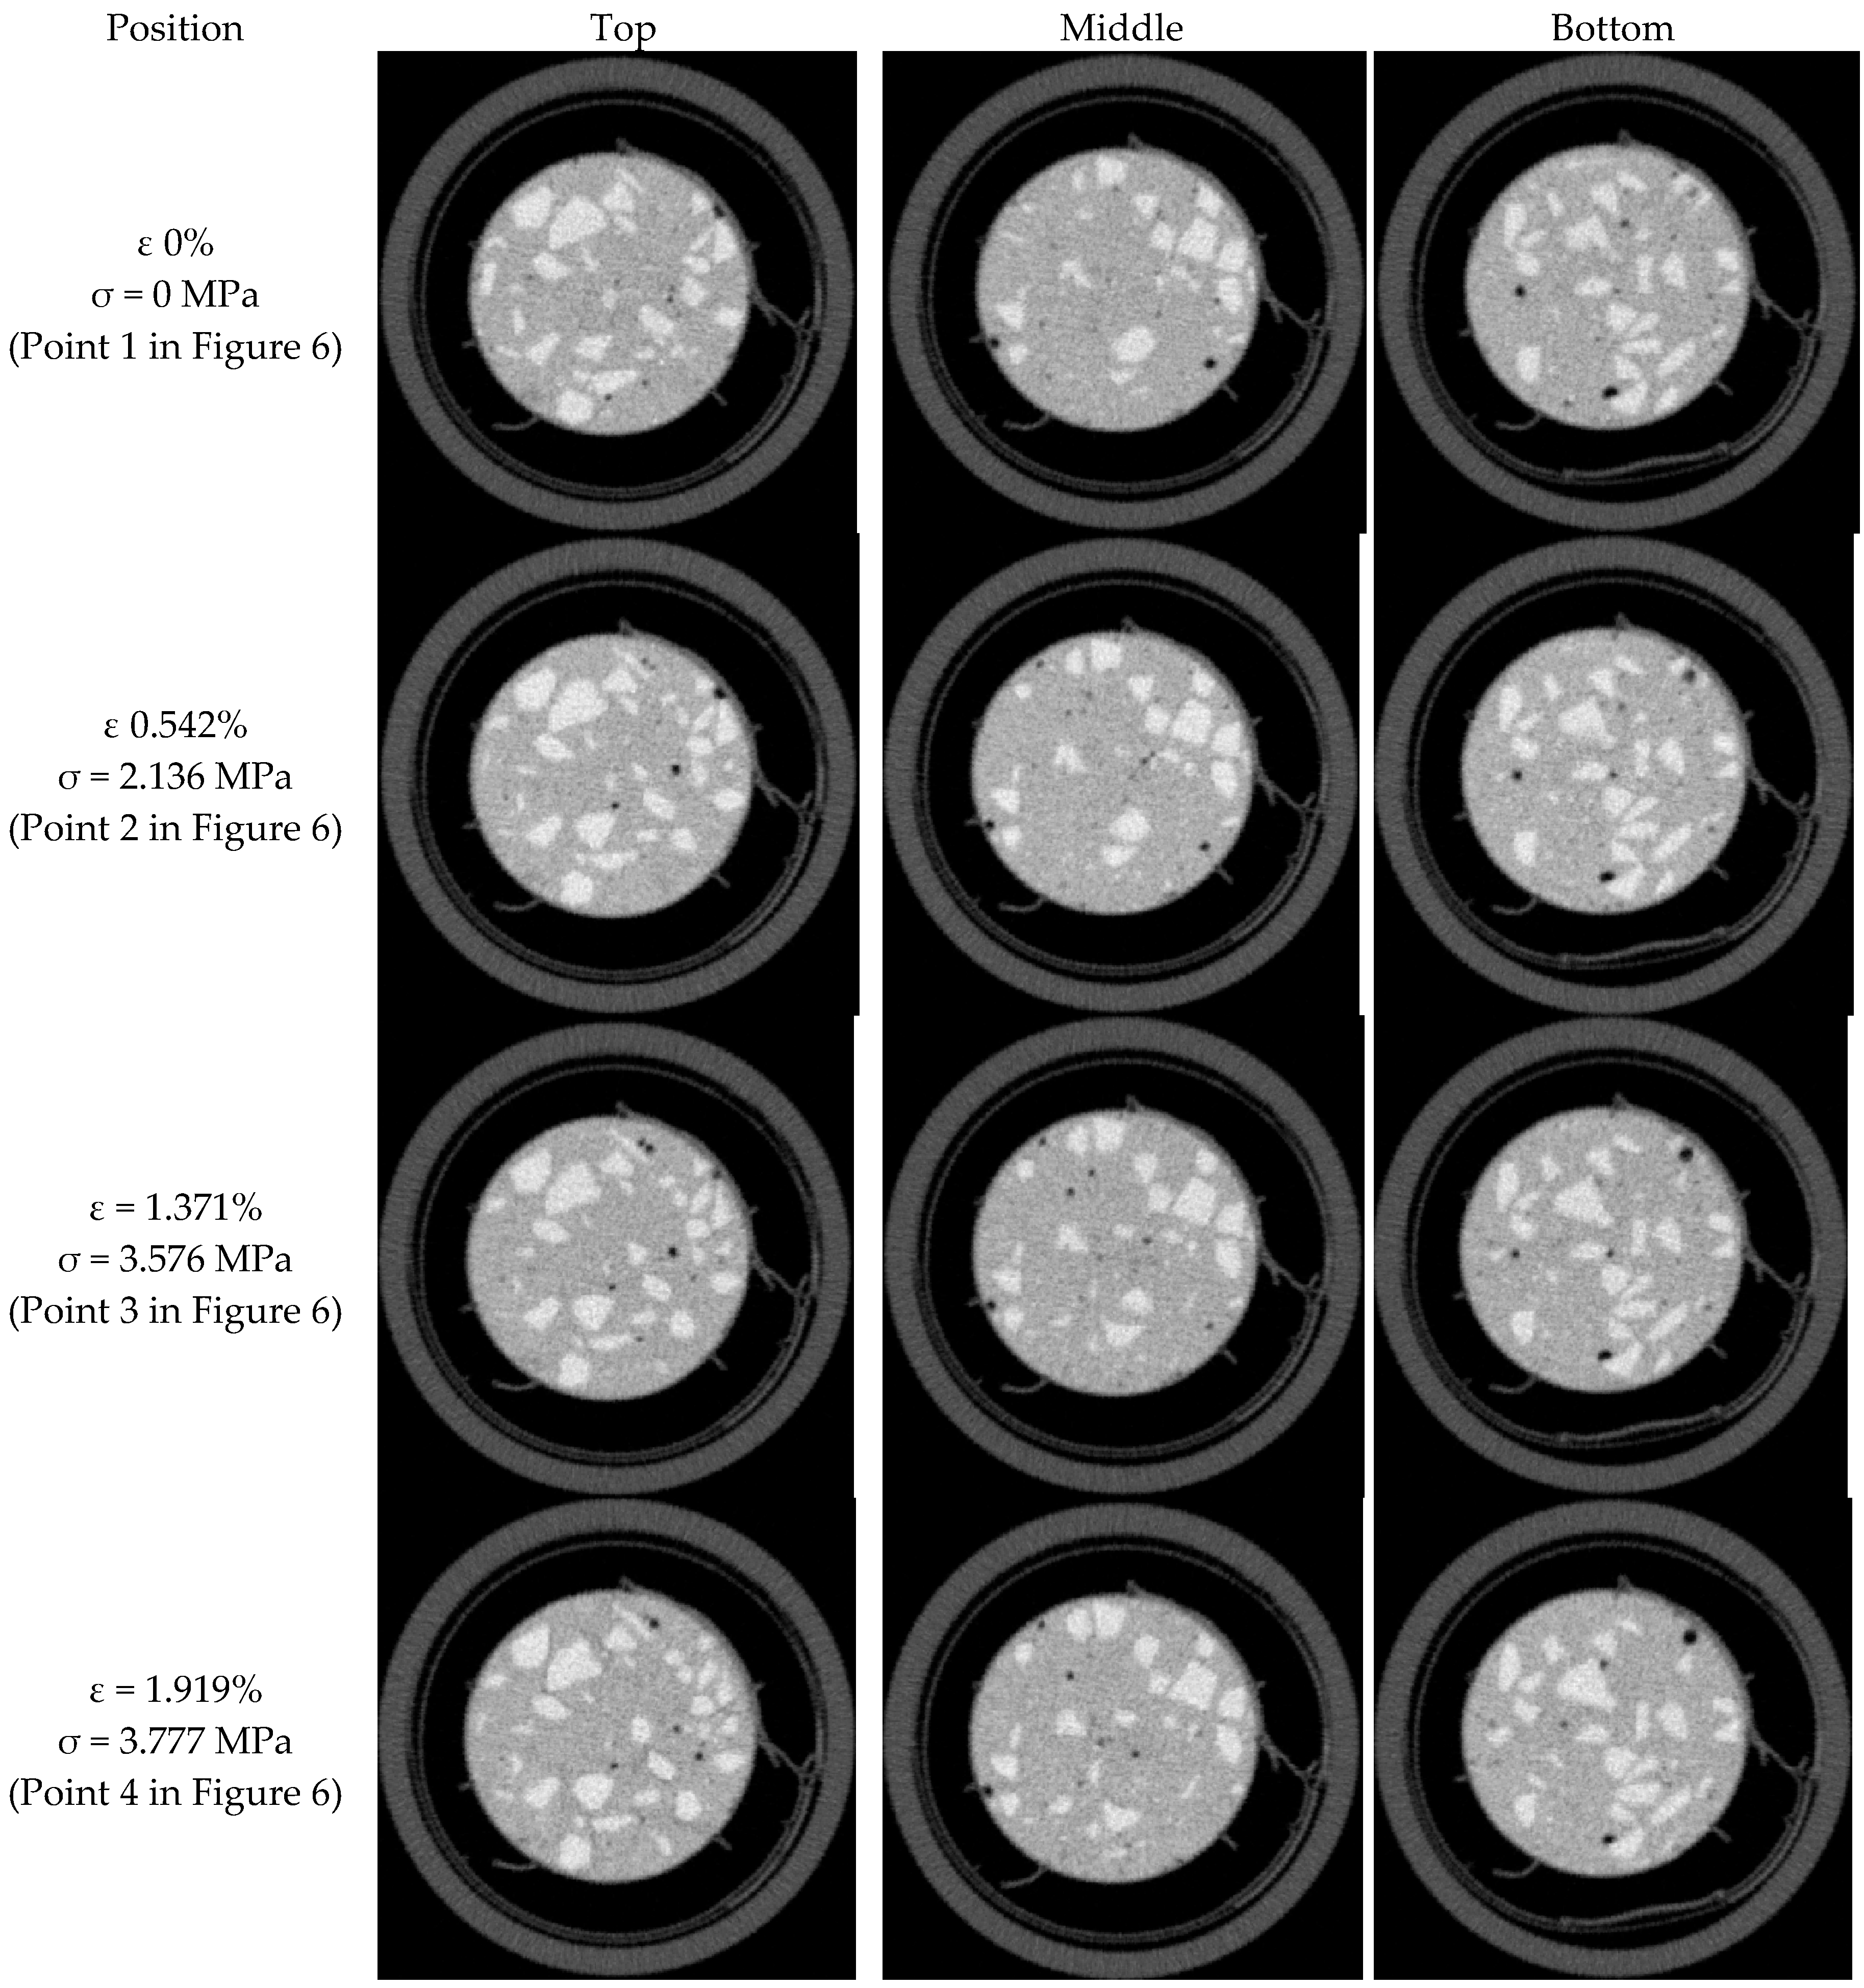
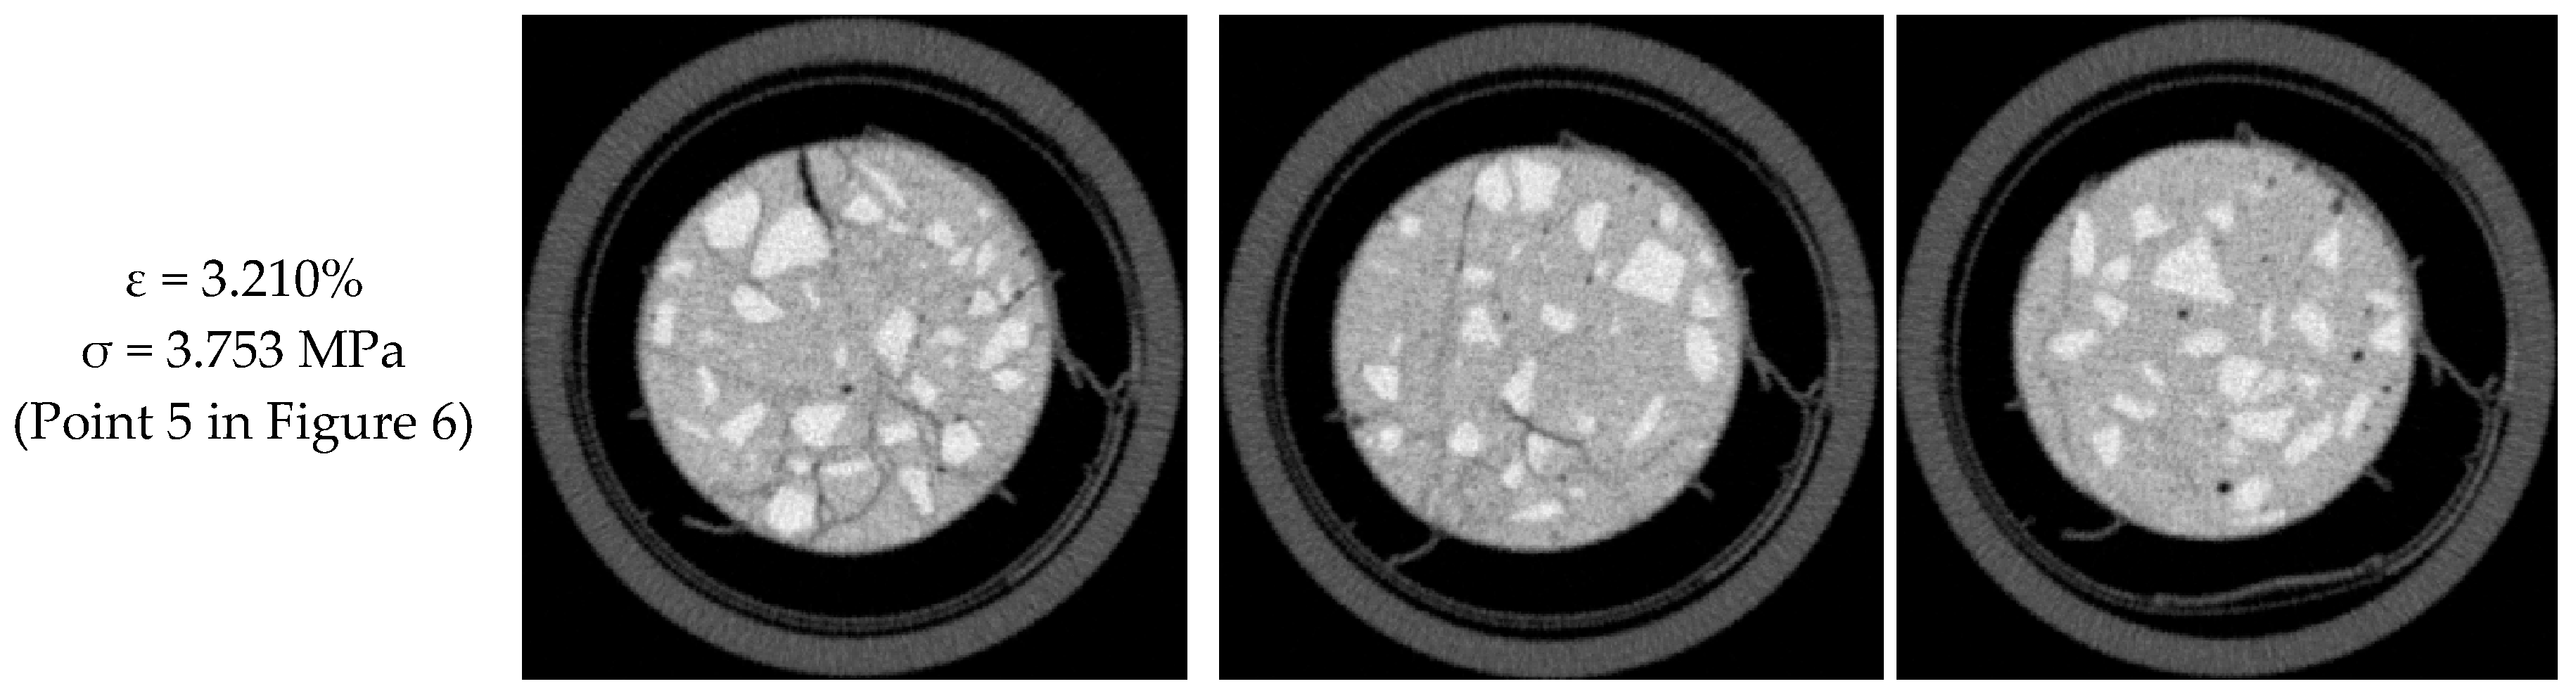
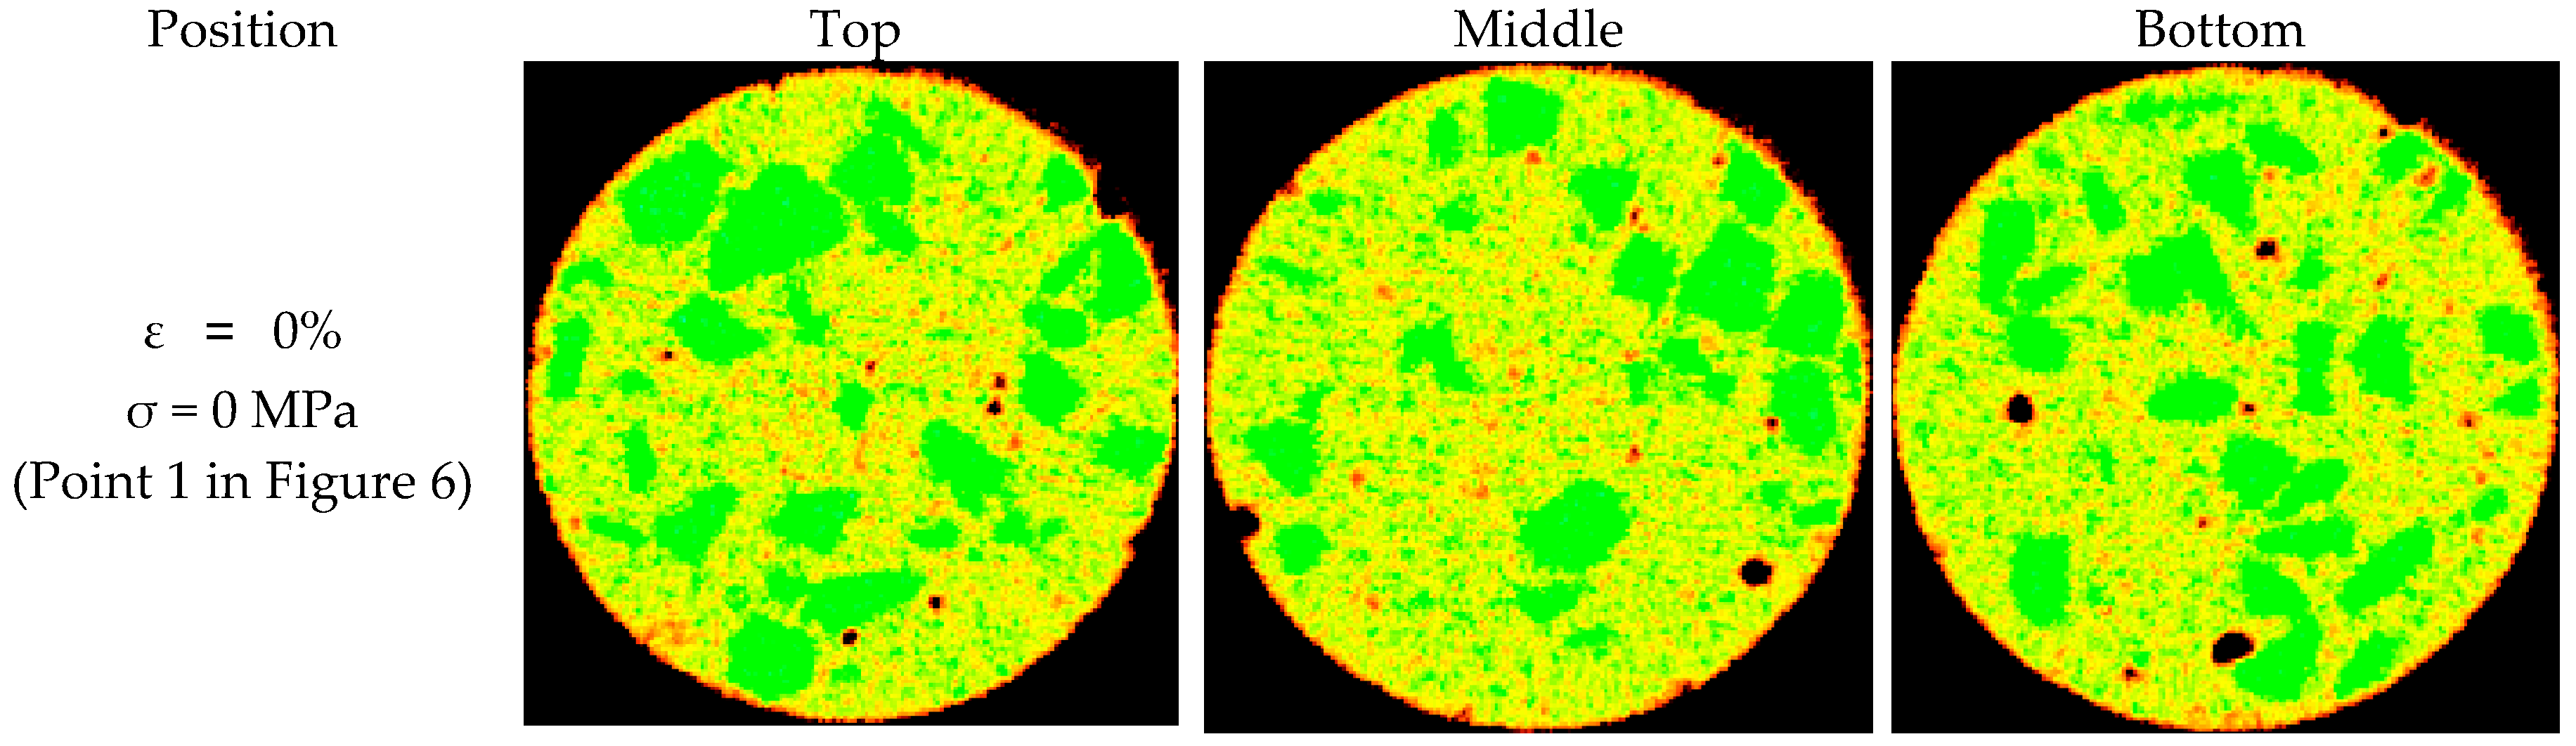
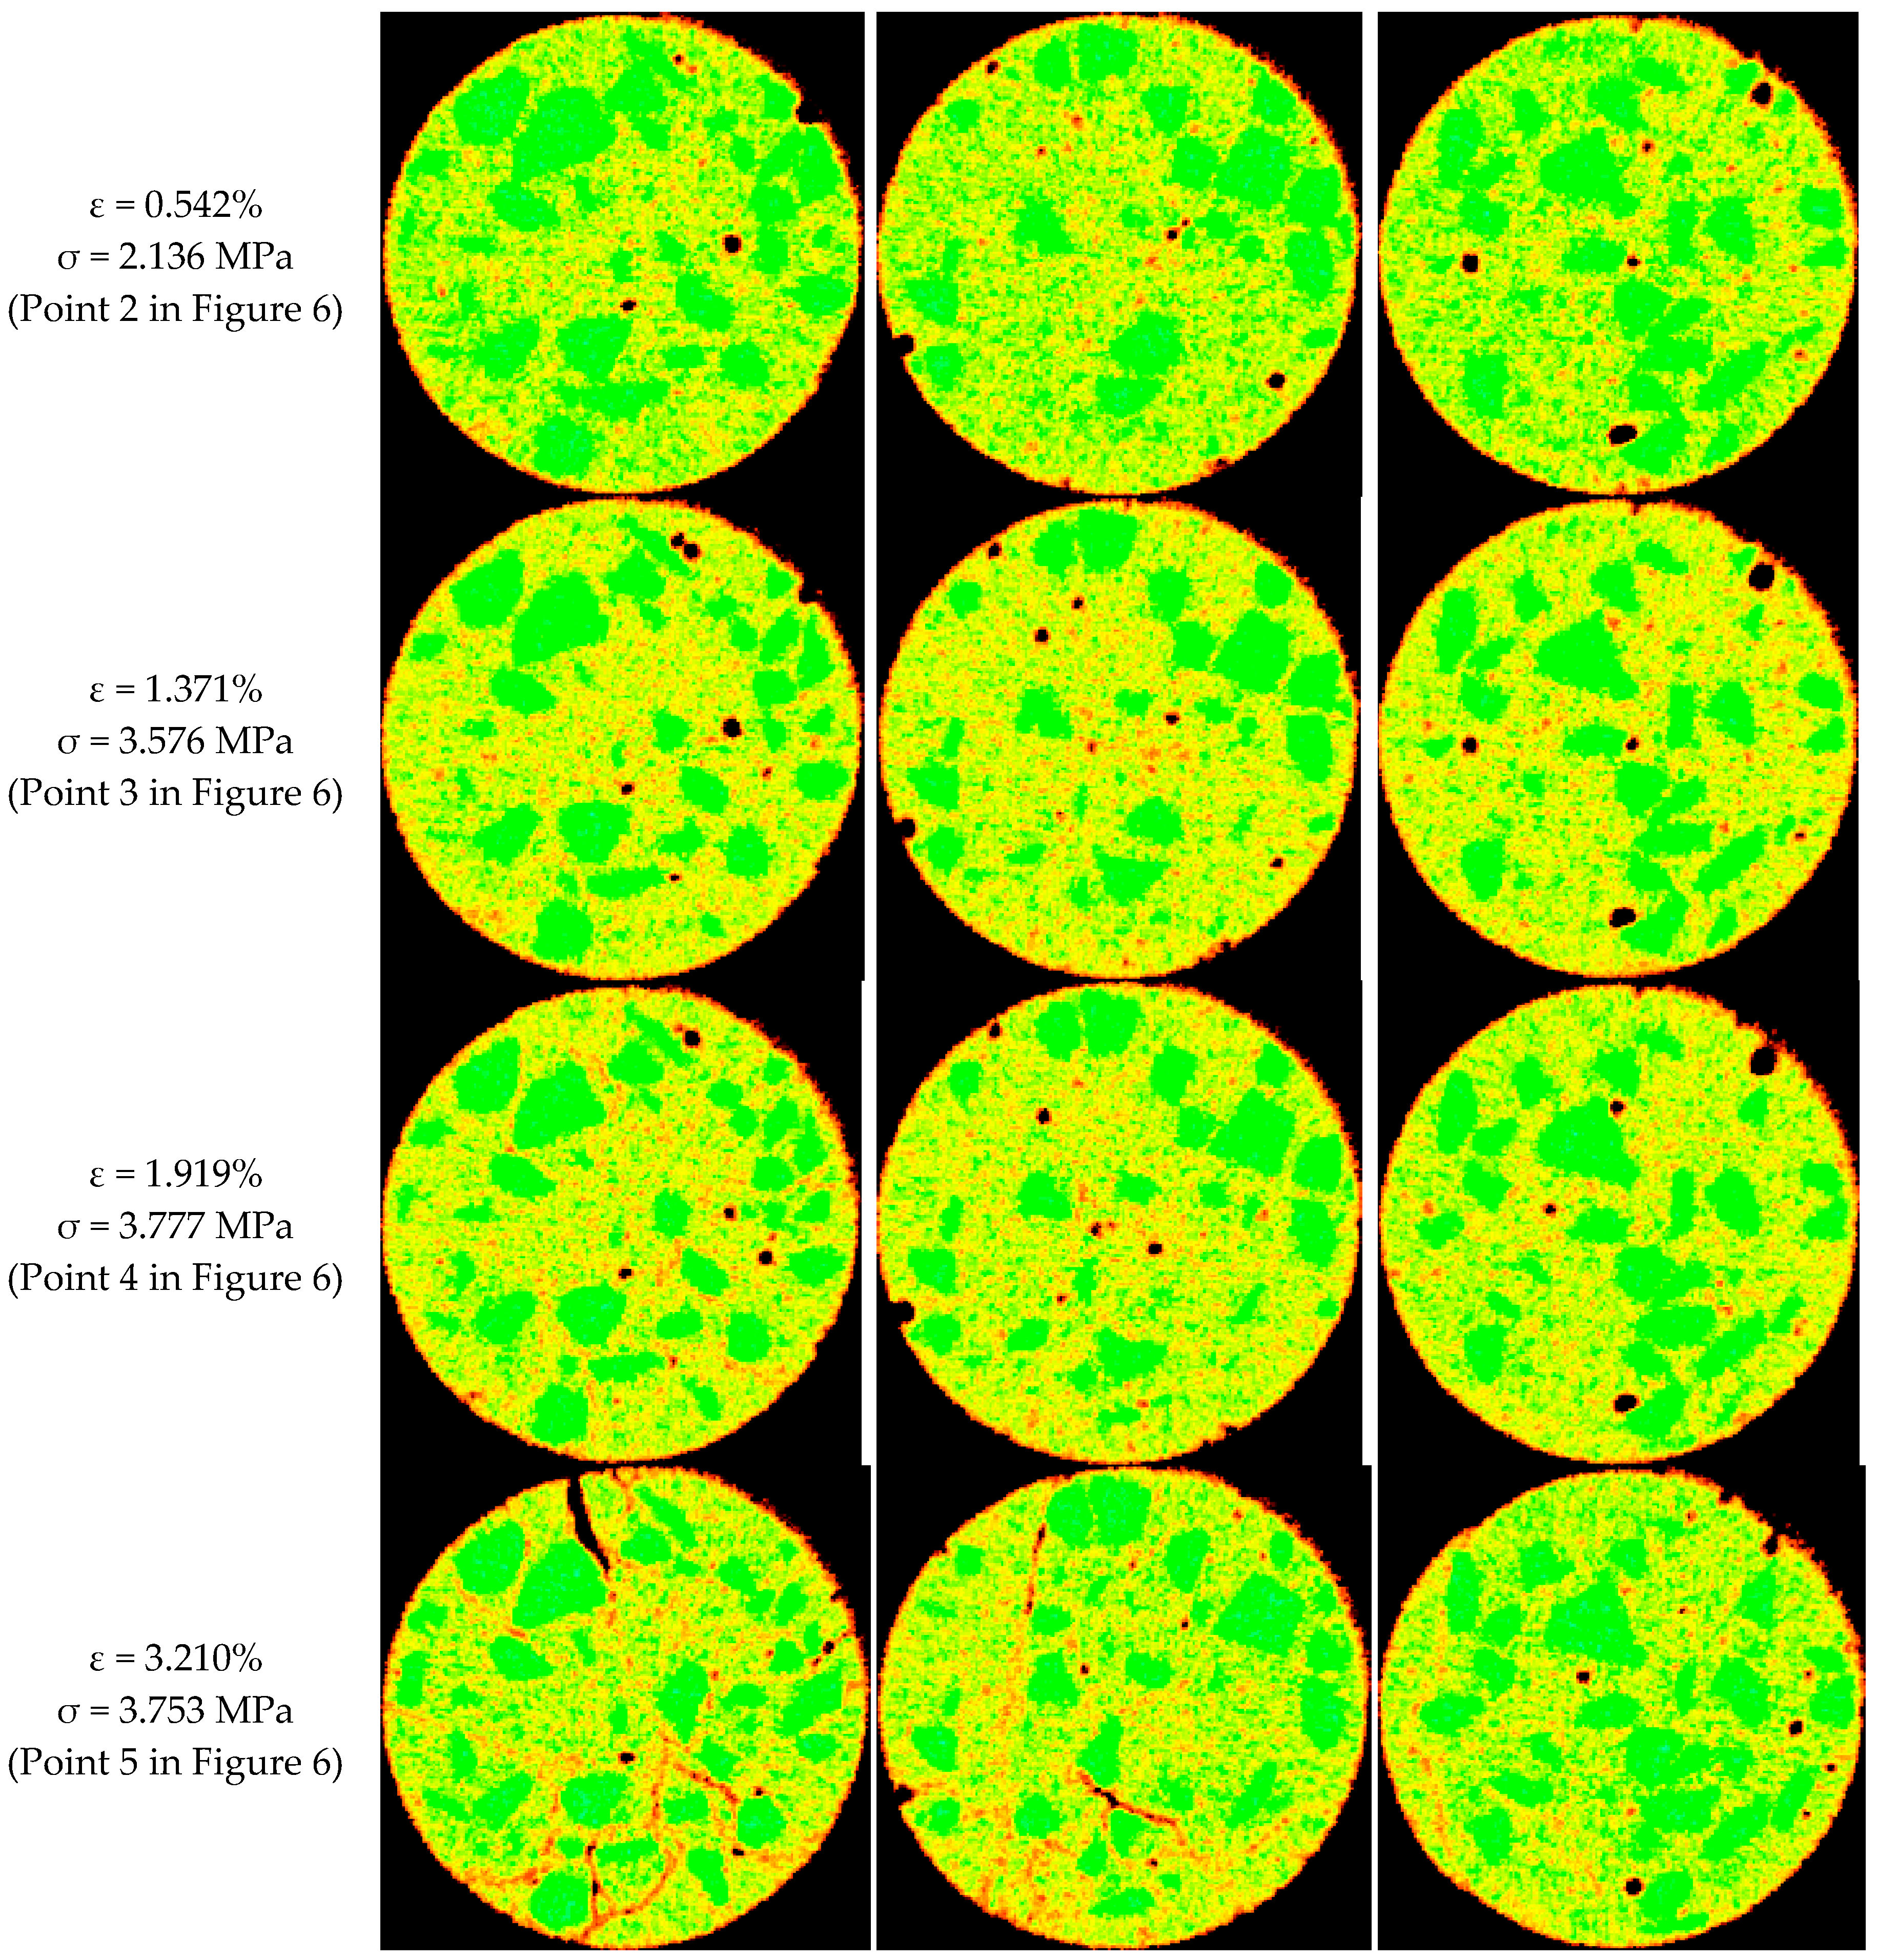
3.1. Observation of Structural Changes

The reconstructed CT images are shown in Figure 9. The non-metal Hoek cell can be seen around the CWRTB samples. According to the principle of CT imaging, due to the relatively high density of the waste rock, the gray level is brighter than the cemented tailings paste. Inside the sample, because the sample was not in a full compaction state, pores were displayed in black and could be seen clearly. Randomly distributed waste blocks could be observed inside the sample. As the height of the sample changed during sample deformation, in order to ensure the same scanning section for different loading stages, the internal scanning was adjusted according to the total variation of the sample height. In doing so, we ensured the same position at the different loading stages. Although the scanning was carried out in the same positions, some blocks disappeared and new waste blocks appeared due to the motion of the waste blocks. Because of the stiff contrast between the waste rock and cemented tailings paste, when the deformation grew, low density regions appeared at the fourth and fifth stages. These regions were usually located at the interfaces of the waste rock and the tailings paste.
Although the mixture was mixed for 10 min to homogenously distribute the waste rock pieces, it was seen that the CWRTB was not homogenous. Therefore, before loading, the inhomogeneous characteristics of the CWRTB sample, such as different components of waste block, tailings paste, pores and cracks, could be seen clearly. In order to analyze the meso-structural changes from the CT images, a pseudo color enhancing algorithm was used to process the original images. The pseudo color scales varied in hue (color) and luminance (brightness) within the images. Different color scales were used to enhance small differences in the pores, cracks or the waste block. Unlike the gray scale, the pseudo-color scales are non-linear. We examined the porosity of the CWRTB from the pseudo-color scales. Here, a kind of full spectrum pseudo-color enhancing algorithm was used and the color scale of the CWRTB images varied within a standard, continuous range of hues from orange to yellow to green to blue to red, as plotted in Figure 10. The basic reason for the difference in colors in the CT images was the differential chemical composition of the matrix and the waste blocks. After pseudo-color enhancing treatment, the waste block, iron particle, pore, cracks, tailings paste, and even the damage zone could be vividly observed in the images. During deformation, the pores marked as a black color were gradually compacted to a minimum; waste blocks (marked as green color) moved and rotated resulting in the formation of cracks at the interface of tailings paste and waste blocks. From the color changes in the meso-structures, the proportion of the material marked with orange gradually increased, which indicated that damage accumulated during the compression and shear process. At the fifth stage, the region marked in orange reached the largest area. From the distribution of the orange-color regions, we found that the damage was extremely inhomogeneous; the positions that occurred were influenced by the existing waste blocks. Apart from the waste blocks, the inside of the tailings paste matrix, material with a green color, was discretely distributed into the tailings paste. These scattered points belonged to fine iron powder and high density minerals. Their positions changed during sample deformation. During the sample preparation, we also observed the fine iron powder in the full tailings. The X-ray CT observation further confirmed the existence of iron powder in the mixture.

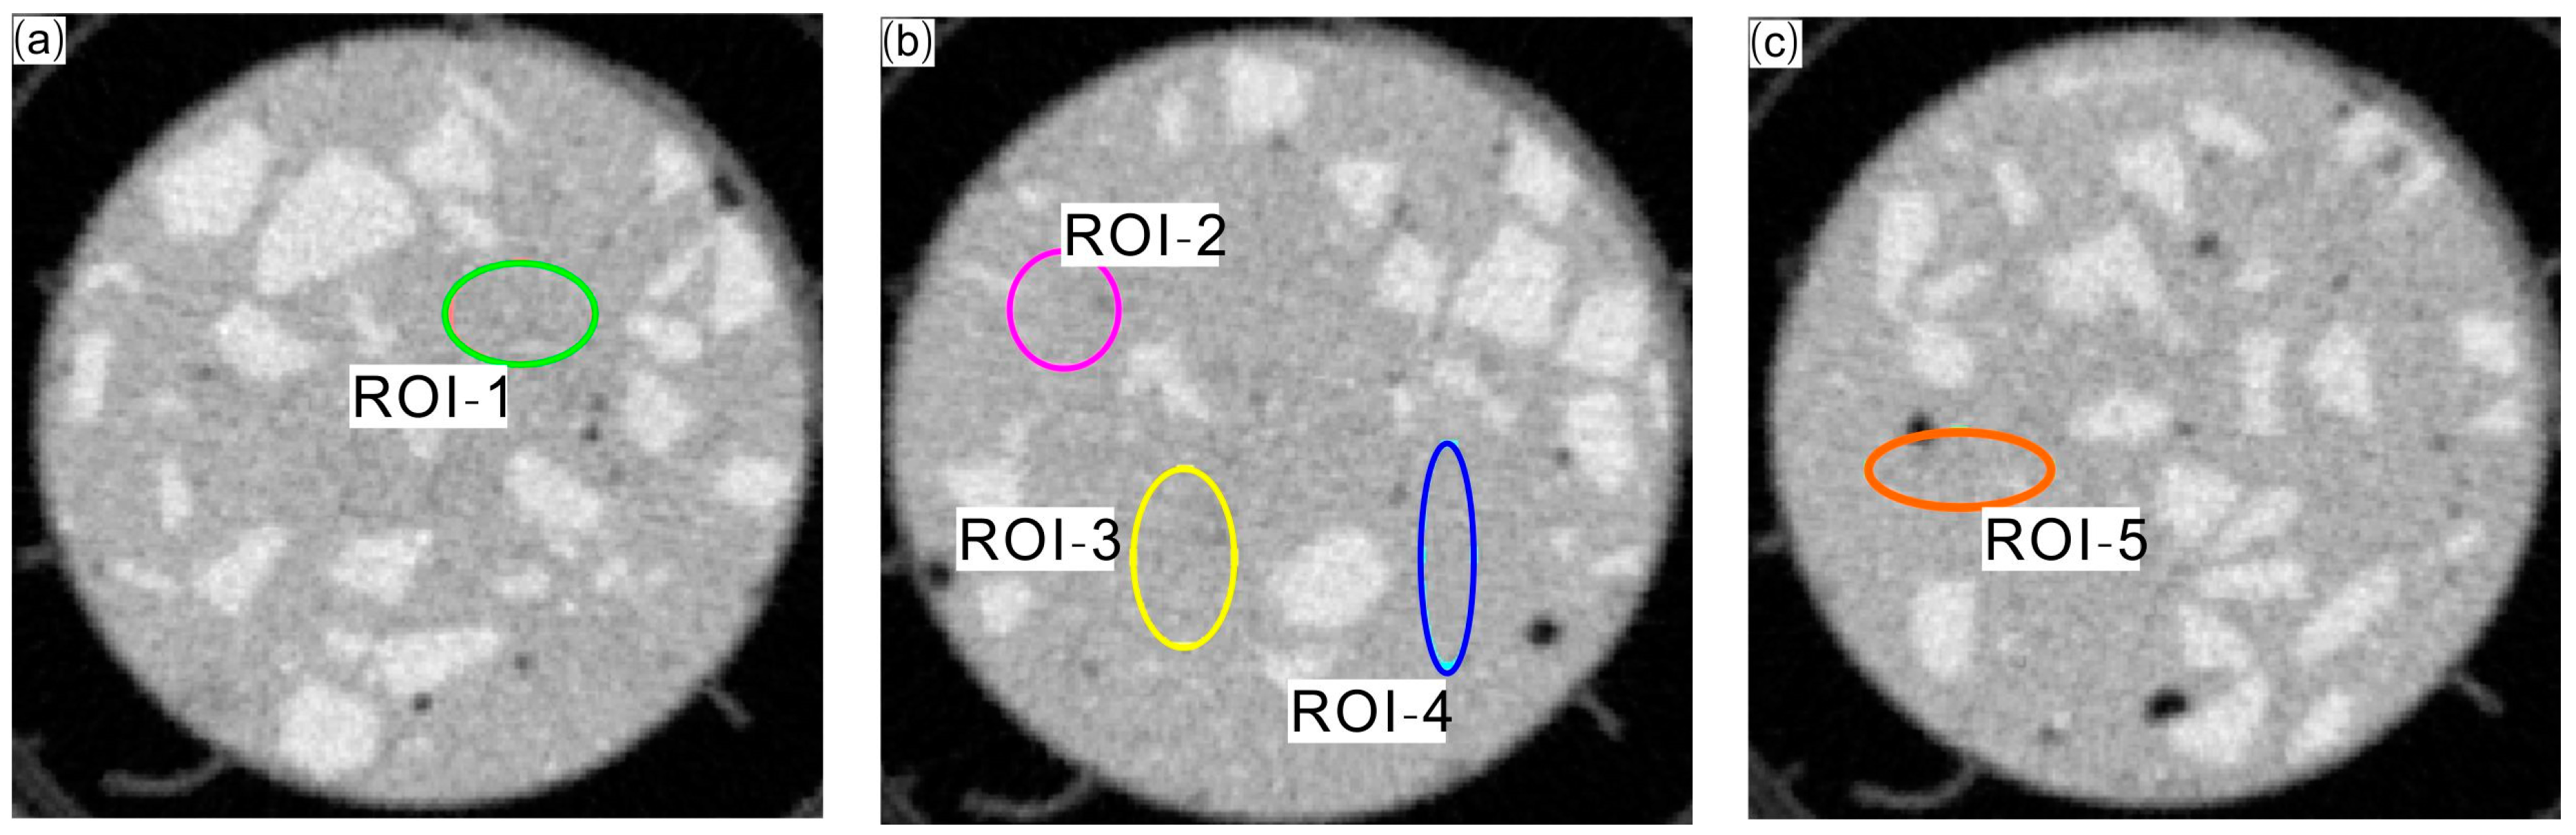
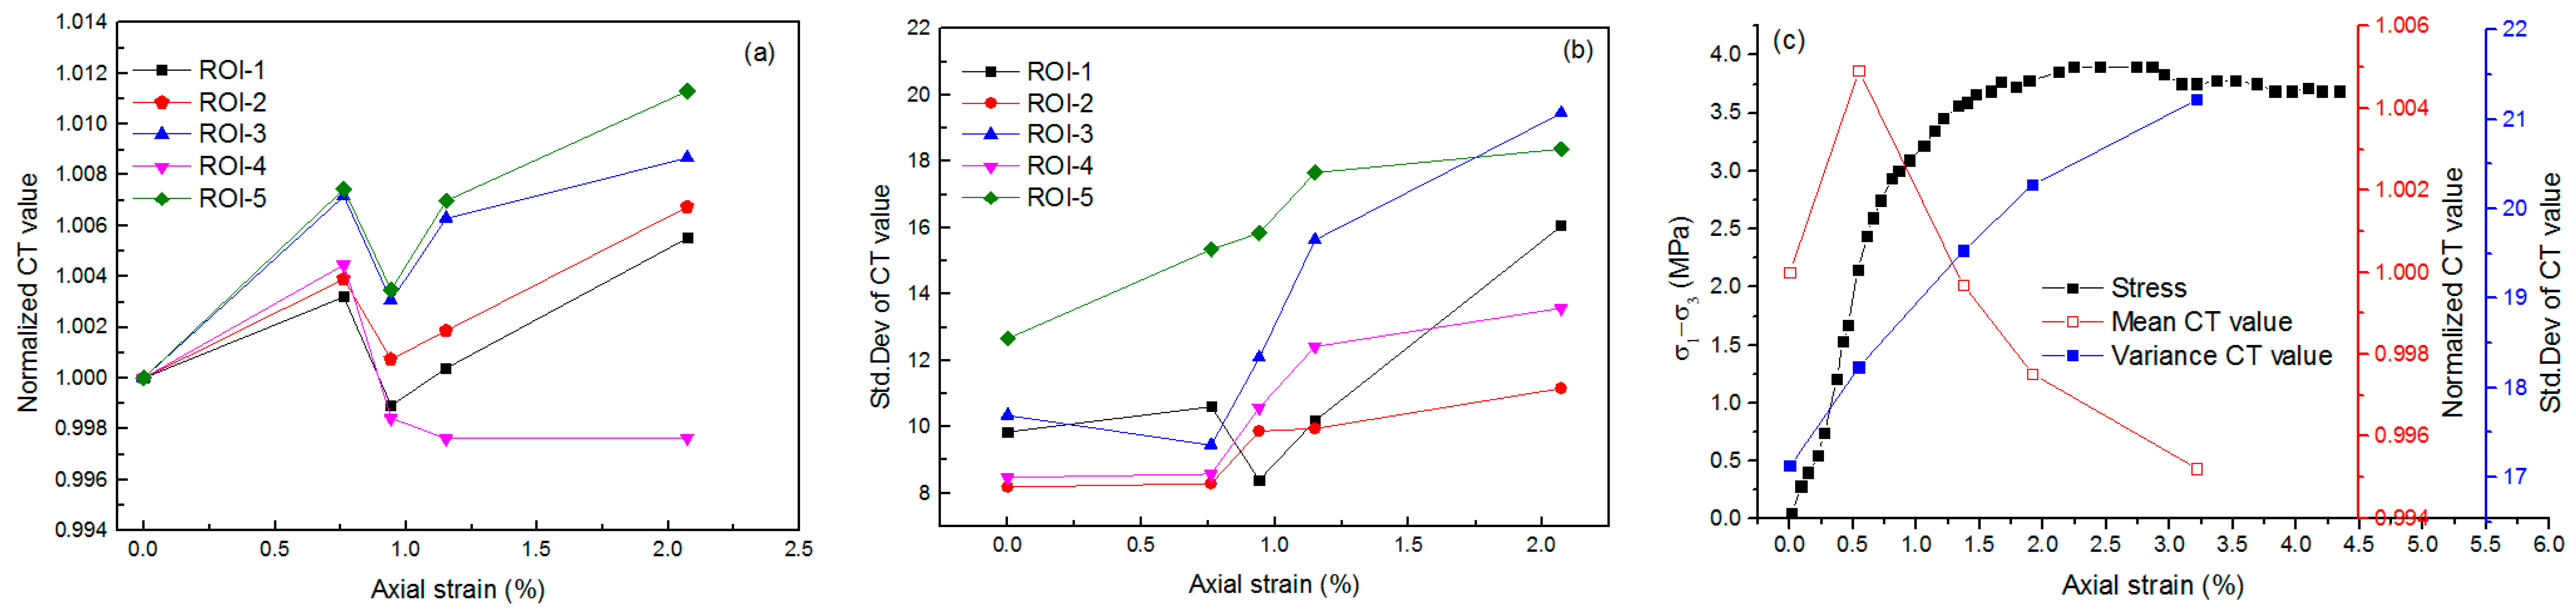
3.2. CT Value Characteristics of ROI Regions

The simplest imaging principle of CT scanning is by recording X-ray radiographic images of an object at several different angular positions. This technique achieves the imaging process. Either based on the algebraic algorithms or the back projection principle, virtual slices can be reconstructed from these different projections. It is possible to further reconstruct a 3D image of an object by stacking several sequential slices. Adopting the famous LamberBeer’s law, we were able to ascertain the relationship between the intensity of incident radiation and intensity of transmitted radiation, as follows:
I = I 0 exp ( μ x )
where I and I0 are the X-ray intensity after and before passing the object of the X-rays, respectively, µ is the linear attenuation coefficient, and x is the passing path of the X-rays through the tested object. The images were reconstructed from the signals in each point and we called the signal the CT value. A term of “CT value” is expressed in Hounsfield units and is defined below:
CT   value = 1000 ( μ μ w ) / μ w
where μ is the attenuation coefficient for the matrix material and μw is the attenuation coefficient for pure water. The Hu (Hounsfield Unit) corresponds to the unit for the attenuation coefficient, and it has a scaling coefficient factor of 1000. The CT value for air and pure water are −1000 Hu and 0 Hu, respectively, according to the definition of Equation (2). The CT value reflects material density. In other words, if the CT value of the material is relatively large, the material usually has a high density [37,38,39,40].
For the CWRTB sample, five regions of interest (ROIs) in the CT images were selected to study the meso-damage evolution characteristics, as shown in Figure 11. The principle for selecting the ROI ensured the damage occurred within the region of the tailings cemented paste matrix. The size and shape of the region was defined to reflect the damage characteristics and to cover the propagation of the localized band. The position of the ROI was determined as being at the tailings paste. In the bottom slice, ROI-1 was selected; in the middle slice, ROI-2, 3, and 4 were selected; in the top slice, ROI-5 was selected. Changes of the mean and standard deviation (SD) of the CT value are listed in Table 2. Changes of the CT value during sample deformation at the five scanning stages are shown in Figure 12. From Figure 12a, it can be seen that the changes in the normalized CT value (which is defined as the ratio of the CT value at different loading stages to the value before loading) of the five ROIs are different. They show fluctuation trends as deformation grows, this result may be attributed to the interaction between the tailings paste and the waste blocks. The complicated interactions alter the density in the ROI and the change of ROI density is affected by the waste block position, shape, and size. When the normalized CT value increases, it indicates that the density of the ROI increases, and vice versa. As the SD of the CT value is much more sensitive than the mean, it reflects the inhomogeneous density of the entire material element and indirectly reflects the development of damage of the pores and cracks. As shown in Figure 12b, the SD of the CT value shows an increasing trend of the five ROI. This result indicates that the degree of damage increases as sample deformation grows. Due to the inhomogeneous nature of the selected ROI, their variation trends are different.
From Figure 12c, as well as for the entire sample, it can be seen that the mean of the CT value first increased at an axial strain of 0.542 and then decreased as deformation grew. However, the SD of the CT value decreased monotonously with the increase of axial deformation. Although cracks appeared at the strain hardening stages, compared to the uniaxial compression result of variation of the CT mean, the mean CT value did not decrease suddenly under triaxial deformation. This result was attributed to the strong interactions between the waste blocks and tailings paste. The movement of block pieces further resulted in the rising compactness of tailings paste, which led to a rising CT value in the tailings paste. Therefore, the overall CT value of the CWRTB sample did not drop sharply.

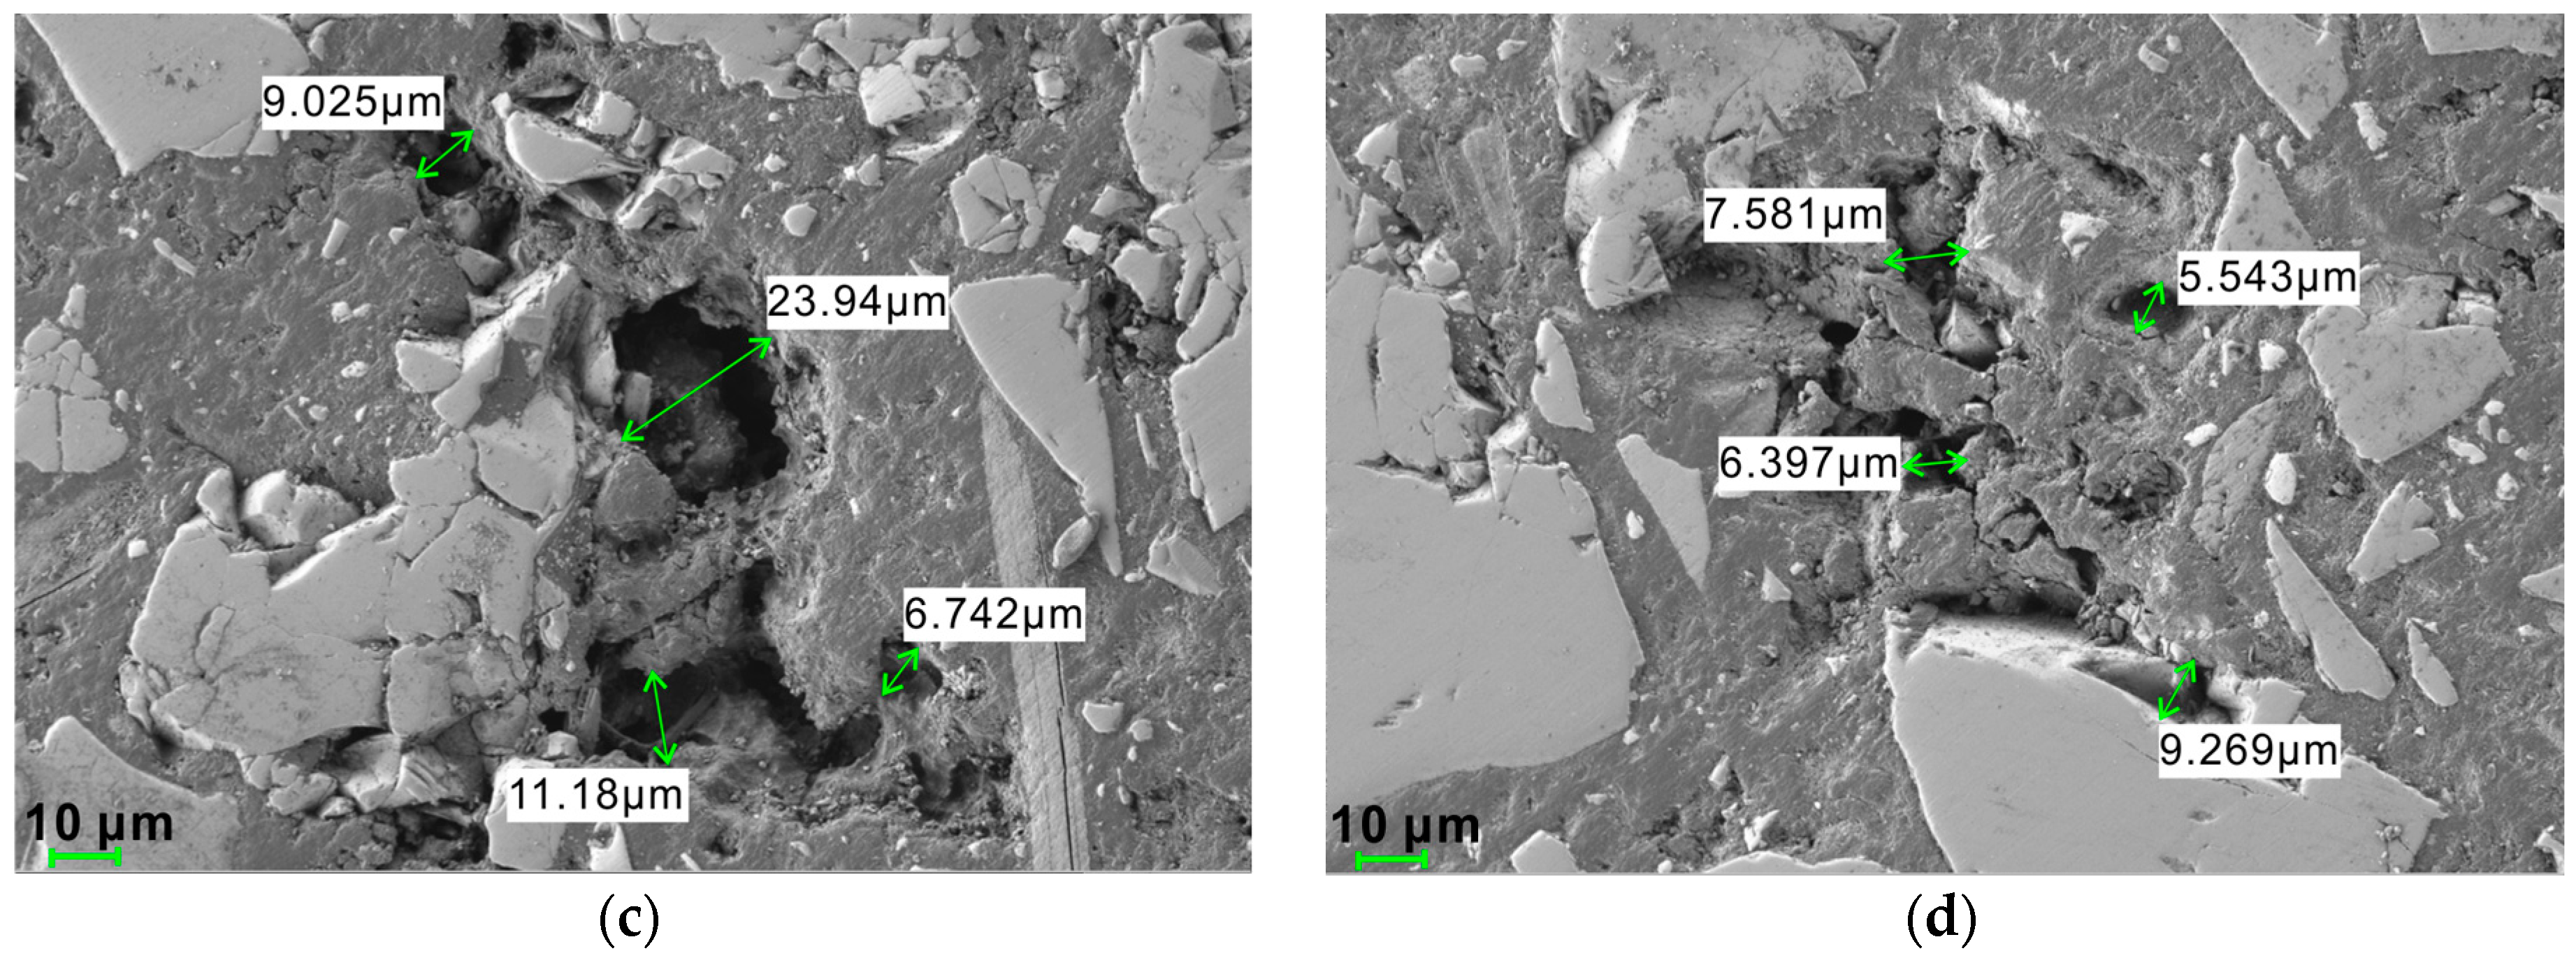
3.3. Meso-damage Evolution Analysis

As depicted in Figure 10, the orange colored regions in the CT images indicated the low density regions, i.e., the damaged regions. From the initial state to sample failure, it was difficult to observe cracks marked in orange below 3.576 MPa; for the CT images at the fourth and fifth loading stages, localized deformation bands formed and they gradually evolved into cracks.
When using the CT method, the damage identification of rock material was divided into two varieties: one kind was based on the CT value and the other was the gray threshold segmentation. The crack was not easy to capture before an axial strain of 1.371%, so the threshold segmentation method was not suitable for damage analysis for the CWRTB sample under 0–3.576 MPa. Therefore, the method of mean CT value was used to investigate the damage evolution of the CWRTB sample. If the effects of the CT value on the damage variable are taken into account [32,35], the expression can be rewritten according to the studies of Singh and Digby [41] and Lemaitre and Chaboche [42]:
D = 1 m 2 Δ ρ ρ 0
where the space resolution is m of the used CT machine and Δ ρ is the sample density variation during the damage evolution of the rock material, i.e., Δ ρ = ρ ρ 0 .
We have known that there is a direct link between CT value and density, therefore, the damage factor can be rewritten as [40]:
D = 1 m 2 [ H 0 H a ] ρ 0 ( H H 0 ) ( ρ 0 ρ a )
where the CT values for the sample at any stress level are H, pore air is Ha, and initial state is H0, respectively. For a shale sample, ρ 0 = 2.43 g/cm3, ρ a = 0 g/cm3, Ha = −1000, and m = 70 μm. In fact, X-ray tube and detector response stability (i.e., filament aging, detector saturation, etc.) have certain effects on the CT values, which all play a certain role in the obtained CT values. In this study, the impacts of these factors on CT value were not taken into account and CT value was mainly used to characterize the degree of damage of the CWRTB sample at different loading stages in order to grasp the medium damage propagation characteristics.
The damage evolution characteristics of CWRTB sample are listed in Table 3. When the applied stress went from 0 to 2.136 MPa, the mean CT value increased with increasing axial stress. At this stage, the sample was in a compacted state, the soft materials such as pores, matrix-block interfaces, and microstructures were compacted. When the stress was greater than 2.136 MPa, the CWRTB sample began to show damage in the form of cracks and crack growth until the failure of CWRTB sample.

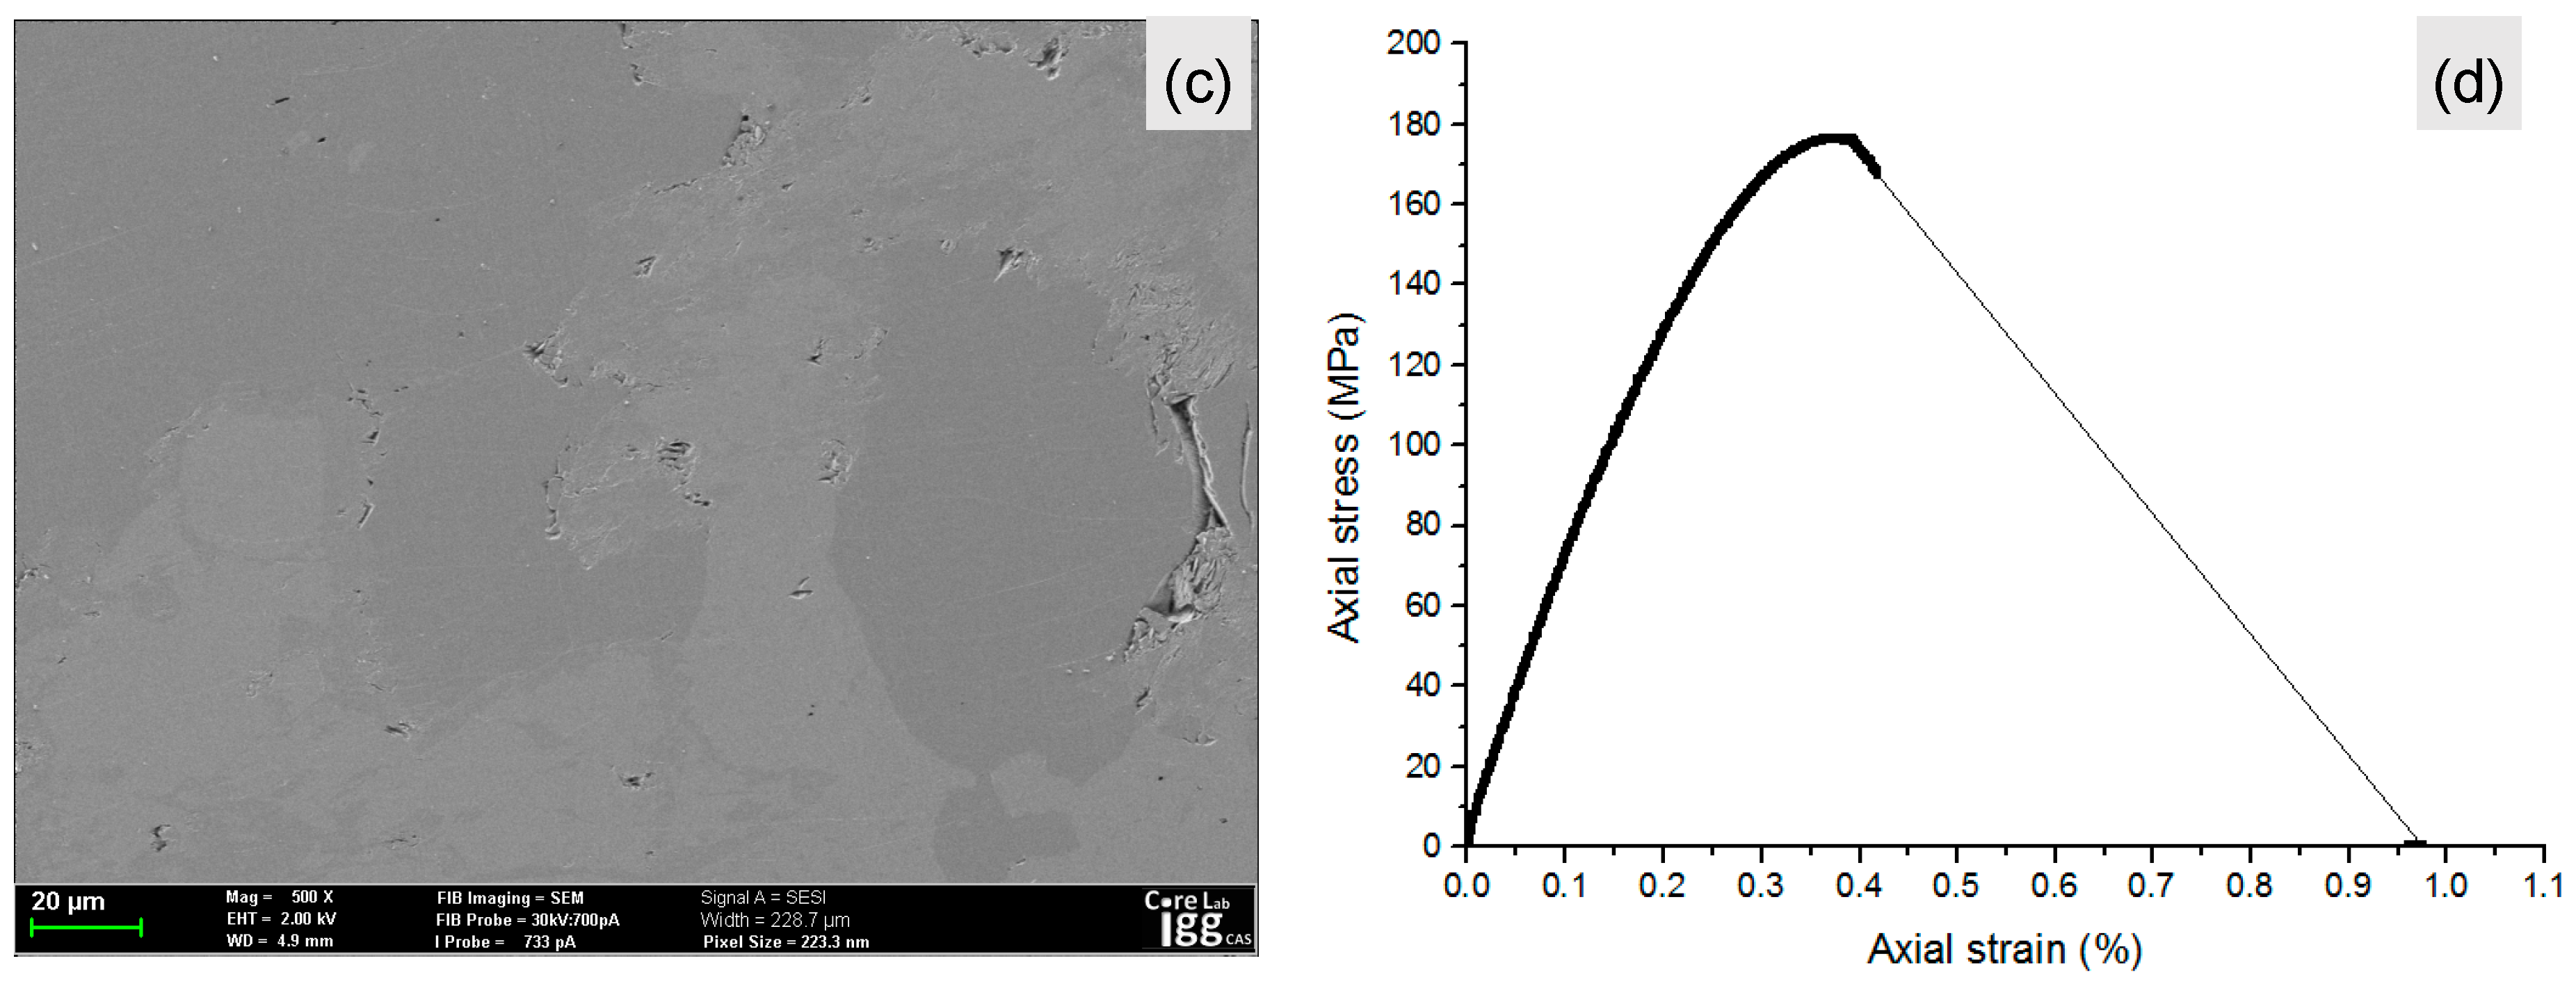
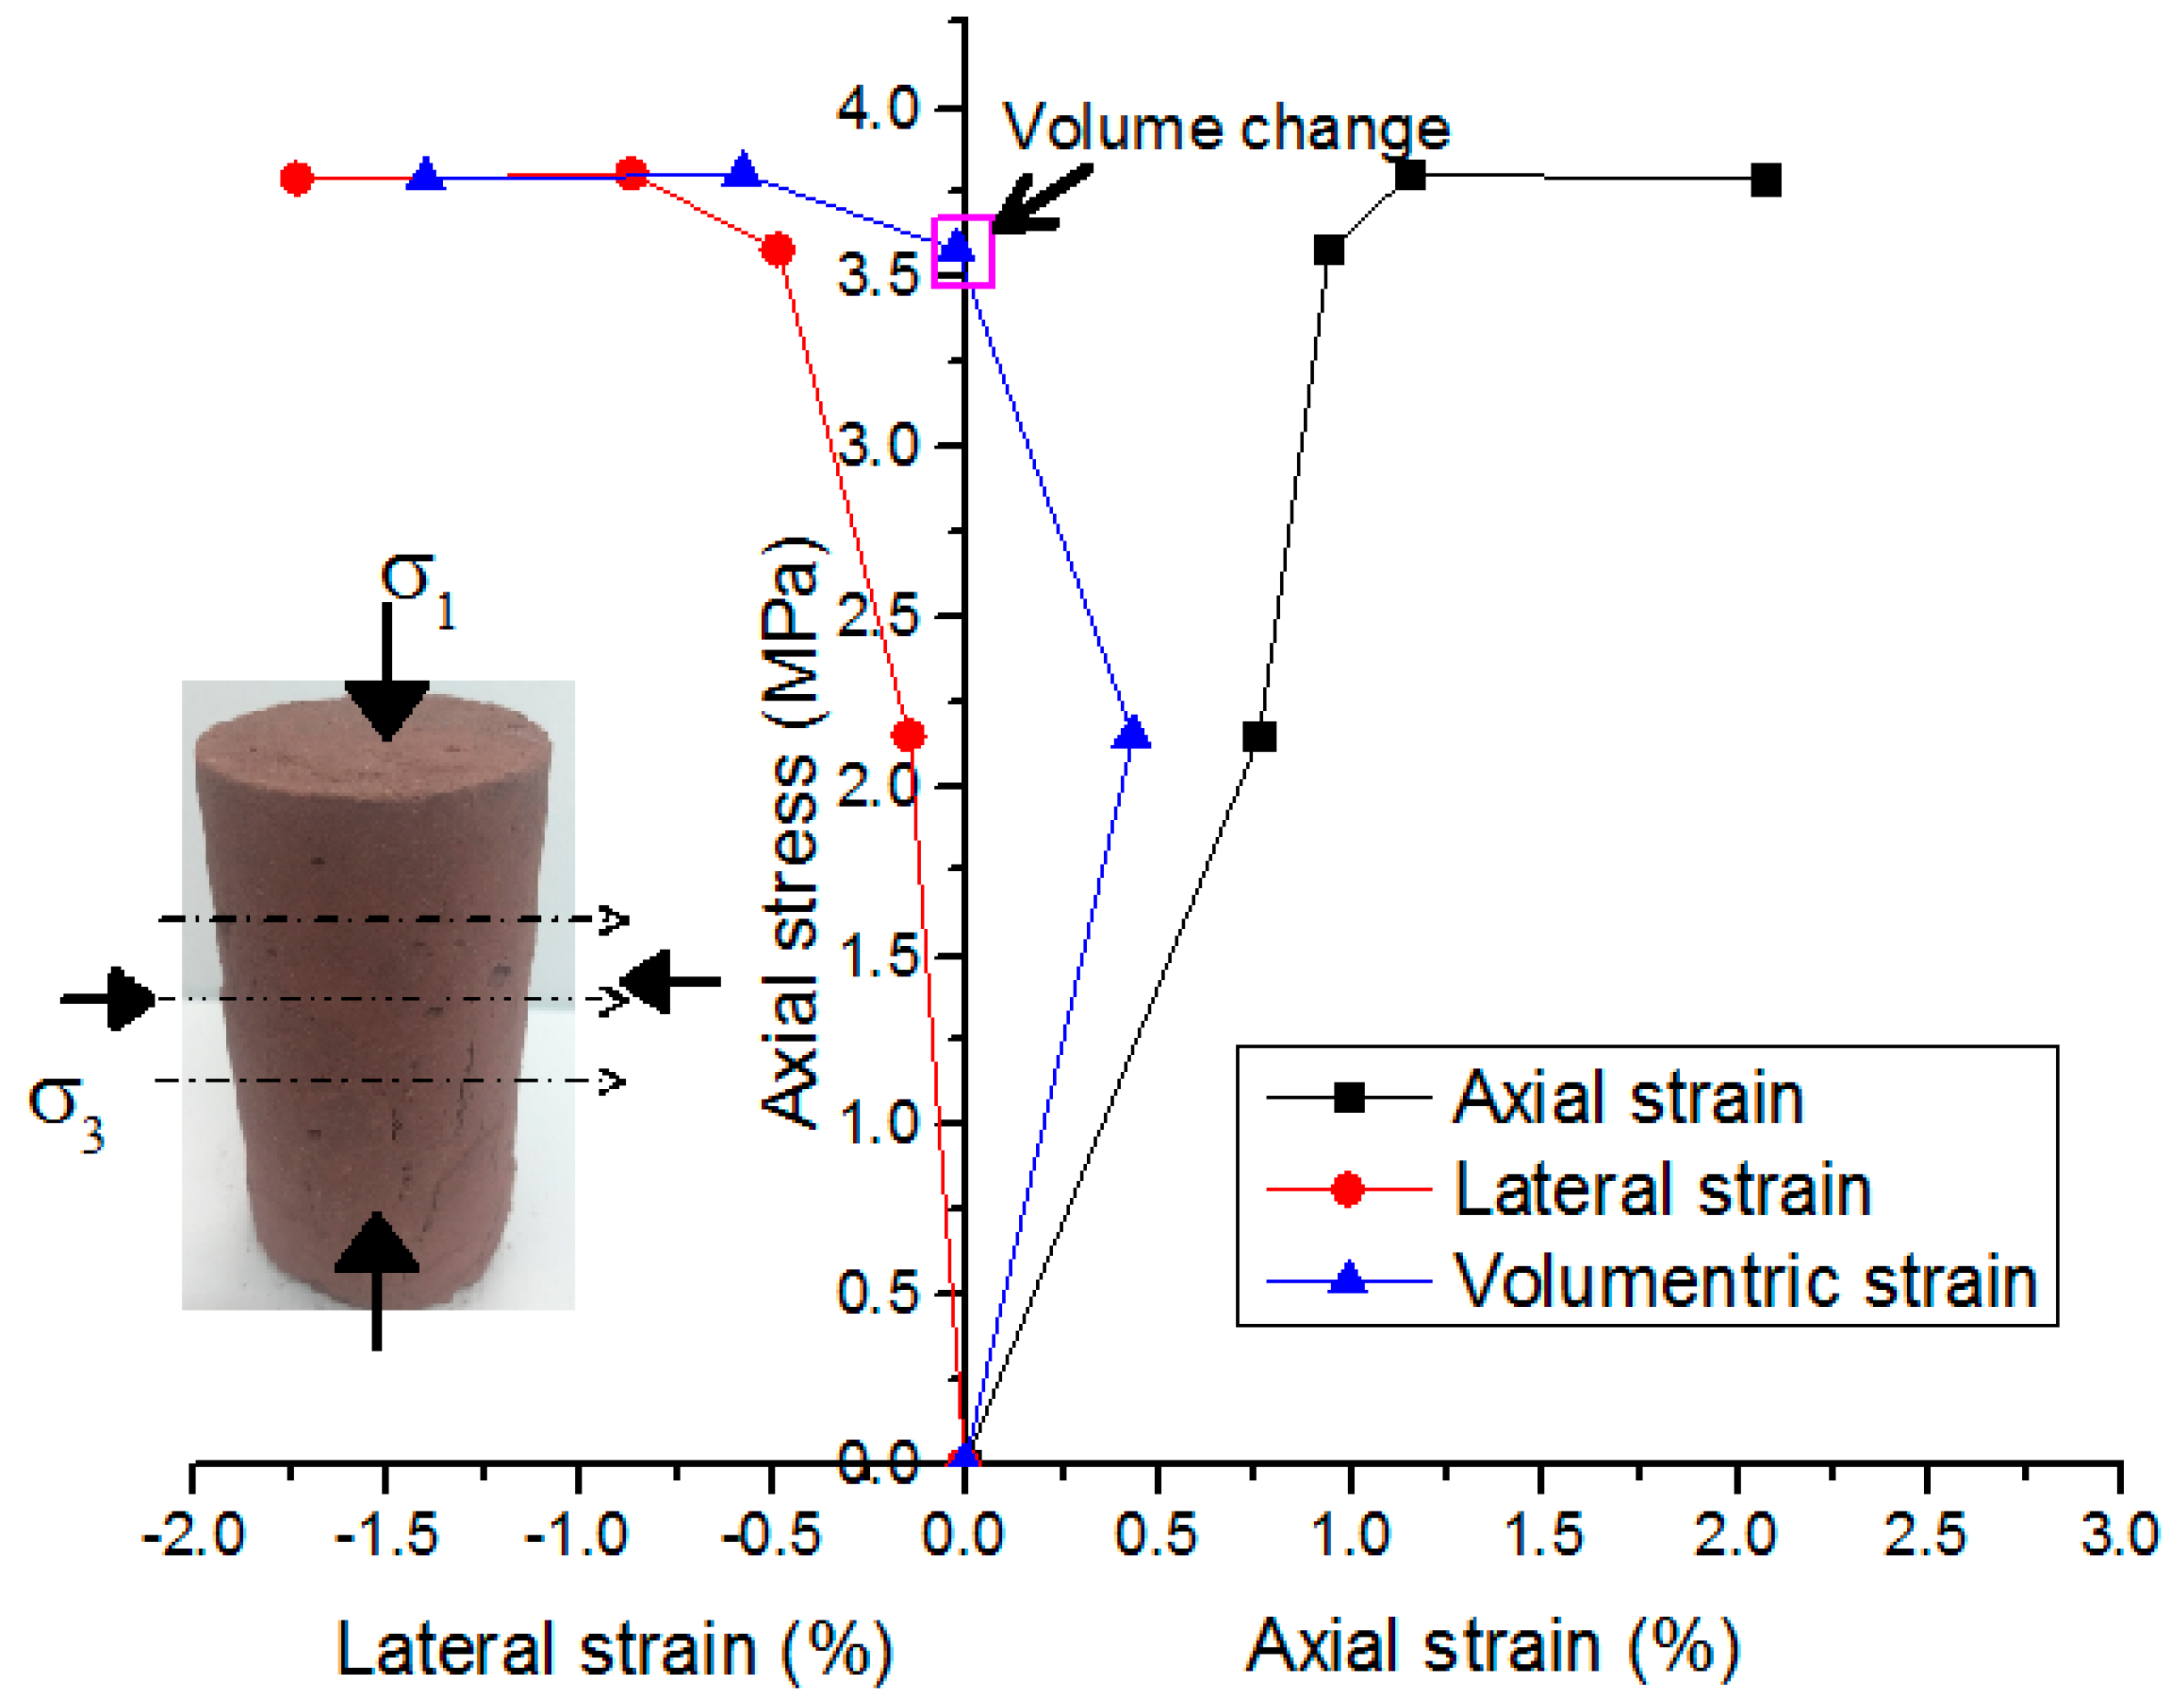
3.4. Dilatancy Behavior Analysis

For the CWRTB sample under triaxial compression, the sample volume first decreased owing to the compaction of tailings paste material. Then, the sample volume changed from compression to expansion. The volumetric expansion phenomena resulted from the formation of localized bands, movement of waste blocks aggravated the lateral deformation and dilation became more obvious. Table 4 summarizes the section area variation of CT images, it can be seen that from the third stage, the section area increased sharply. Figure 13 plots the complete stress–strain curves of the CWRTB sample. It can be seen that volumetric strain changed from shear shrinkage to dilatancy. As the volumetric strain changed from positive values to negative values, the sample volume changed from compression to expansion at the third loading stage, which corresponded to the third round of CT scans. After the inflection point, unstable crack propagation occurred and the dilatancy behavior became more severe. The results from the CT image analysis are consistent with the macroscopic stress–strain curve.

4. Discussions

In this work, triaxial compression testing for the CWRTB samples was conducted using in situ CT scanning and the mesoscopic damage evolution characteristics were obtained. Although some scholars point out that confining pressure should be considered when investigating the mechanical behaviors of CWRTB [23,24,25], most performed mechanical tests on the macroscopic stress–strain responses, revealing that meso-damage evolution of CWRTB rarely occurs. Here, in situ X-ray CT testing was used on CWRTB samples under a confining pressure of 94.5 kPa (monitored from the filling stope). The stress–strain curve of CWRTB showed strain hardening characteristics, which was different from the uniaxial compressive results. At the strain hardening stages, CT data visualized the interactions between the waste blocks and tailings paste backfill. Owing to the existence of confining pressure, the movement of waste blocks was limited and the damage and cracking phenomena were not so obvious compared to those of the CWRTB sample under uniaxial compression [30]. The propagation paths of the cracks were restricted by the randomly distributed waste blocks. The cracks bypassed the waste blocks but mostly propagated around them. The complicated propagation path further resulted in the increasing sample strength under triaxial loading. Due to the interactions, the localized bands gradually formed in the CWRTB and dilatancy behaviors became more severe at the strain hardening stages. The distribution of the low density regions (i.e., the cracks) indicates that the fracture plane of CWRTB is curved and its morphology is influenced by the waste blocks. The results of this work demonstrate that the stress state and structural pattern of CWRTB all affect the meso-damage behavior of CWRTB. Considering the actual stress state of CWRTB, the confining pressure effect should be considered.

5. Conclusion Remarks

The main results from this study can be summarized as follows:
(1) The stress–strain curve showed strain hardening characteristics under triaxial compression. Adding waste blocks into the cemented paste backfills influenced the stress distribution and the associated localized deformation. CT data revealed the inhomogeneous field of damage inside the CWRTB sample. The images indicated that the skeleton structure formed by the randomly distributed waste blocks influenced the propagation of damage and the associated stress dilatancy behaviors.
(2) The changes of CT value revealed the complicated interactions between the waste blocks and the tailings paste matrix. Density in the regions of interest did not always increase but showed a fluctuating trend. The waste blocks altered the compactness of the tailings paste around them due to their movement during the CWRTB sample deformation. The most severely damaged regions were usually located at the waste block tailings paste interface, due to the stiff contrast between them. Low density regions in the CT images evolved into cracks and dilatancy became severe as the deformation grew. The formation of the localized bands was strongly influenced by the relative positions of the waste rocks in the CWRTB.
(3) The experimental results indicated that X-ray CT techniques are effective for the study of the meso-damage evolution of CWRTB. In this work, the applied confining pressure referred to the monitoring data from the filling stope. The damage evolution behaviors of CWRTB under different confining pressures should be studied further in order to reveal the damage characteristics and associated stress dilatancy behaviors.

Author Contributions

Y.W. designed the theoretical framework; Y.W. conducted the experiments and wrote the manuscript; H.W. prepared the CWRTB samples; X.Z., X.Y., Y.X., and X.W. corrected the figures.

Funding

This study was supported by the National Key Technologies Research and Development program (2018YFC0808402, 2018YFC0604601), the Fundamental Research Funds for the Central Universities (2302017FRF-TP-17-027A1), and the National Natural Science Foundation of China (Grants Nos. 41502294).

Acknowledgements

The authors would like to thank the editors and the anonymous reviewers for their helpful and constructive comments.

Conflicts of Interest

The authors declare no conflicts of interest.

References

  1. Roux, K.L.; Bawden, W.F.; Grabinsky, M.F. Field properties of cemented paste backfill at the golden giant mine. Mining Technol. 2013, 114, 65–80. [Google Scholar] [CrossRef]
  2. Yilmaz, E. Advances in reducing large volumes of environmentally harmful mine waste rocks and tailings. Miner. Resour. Manag. 2011, 27, 89–112. [Google Scholar]
  3. Koohestani, B.; Bussière, B.; Belem, T.; Koubaa, A. Influence of polymer powder on properties of cemented paste backfill. Int. J. Miner. Process. 2017, 167, 1–8. [Google Scholar] [CrossRef]
  4. Yilmaz, E. One-dimensional consolidation parameters of cemented paste backfills/parametry Jednowymiarowej Konsolidacji Podsadzki W Postaci Cementowej Pasty. Gospod. Surow. Miner.-Miner. Resour. Manag. 2012, 28, 29–45. [Google Scholar] [CrossRef]
  5. Zhang, J.; Deng, H.; Taheri, A.; Deng, J.; Ke, B. Effects of superplasticizer on the hydration, consistency, and strength development of cemented paste backfill. Minerals 2018, 8, 381. [Google Scholar] [CrossRef]
  6. Sivakugan, N.; Rankine, R.M.; Rankine, K.J.; Rankin, K.S. Geotechnical considerations in mine backfilling in Australia. J. Clean. Prod. 2006, 14, 1168–1175. [Google Scholar] [CrossRef]
  7. Licskó, I.; Lois, L.; Szebényi, G. Tailings as a source of environmental pollution. Water Sci. Technol. 1999, 39, 333–336. [Google Scholar] [CrossRef]
  8. Passariello, B.; Giuliano, V.; Quaresima, S.; Barbaro, M.; Caroli, S.; Forte, G.; Carelli, G.; Iavicoli, I. Evaluation of the environmental contamination at an abandoned mining site. Microchem. J. 2002, 73, 245–250. [Google Scholar] [CrossRef]
  9. Yin, S.H.; Wu, A.X.; Hu, K.J.; Wang, Y.; Zhang, Y.K. The effect of solid components on the rheological and mechanical properties of cemented paste backfill. Miner. Eng. 2012, 35, 61–66. [Google Scholar] [CrossRef]
  10. Fall, M.; Benzaazoua, M. Modeling the effect of sulphate on strength development of paste backfill and binder mixture optimization. Cem. Concr. Res. 2005, 35, 301–314. [Google Scholar] [CrossRef]
  11. Fall, M.; Pokharel, M. Coupled effects of sulphate and temperature on the strength development of cemented tailings backfills: Portland cement-paste backfill. Cem. Concr. Compos. 2013, 32, 819–828. [Google Scholar] [CrossRef]
  12. Huang, Y.; Zhang, J.; Zhang, Q.; Nie, S. Backfilling technology of substituting waste and fly ash for coal underground in China coal mining area. Environ. Eng. Manag. J. 2011, 10, 112–121. [Google Scholar] [CrossRef]
  13. Liu, L.; Fang, Z.F.; Wu, Y.P.; Lai, X.P.; Wang, P.; Song, K.I. Experimental investigation of solid-liquid two-phase flow in cemented rock-tailings backfill using Electrical Resistance Tomography. Construct. Build. Mater. 2018, 175, 267–276. [Google Scholar] [CrossRef]
  14. Hane, I.; Belem, T.; Benzaazoua, M.; Maqsoud, A. Laboratory Characterization of Cemented Tailings Paste Containing Crushed Waste Rocks for Improved Compressive Strength Development. Geotech. Geol. Eng. 2017, 35, 645–662. [Google Scholar] [CrossRef]
  15. Wu, J.Y.; Feng, M.M.; Yu, B.Y.; Chen, Z.Q.; Mao, X.B.; Han, G.S. Experimental study of strength and deformation characteristics of cemented waste rock backfills with continuous gradation. Rock Soil Mech. 2017, 38, 101–107. [Google Scholar]
  16. He, G.C.; Liu, Y.; Ding, D.X.; Zhang, Z.J. Strength characteristic of cemented waste rock backfills and its application. J. Min. Saf. Eng. 2013, 30, 75–79. [Google Scholar]
  17. He, G.C.; Liu, S.L.; Huang, B.X.; Zhang, Z.J.; Ding, D.X. Reasonable matching for cemented waste rock backfill and sand shale. J. Min. Saf. Eng. 2017, 34, 371–377. [Google Scholar]
  18. Liu, C.; Han, B.; Sun, W.; Wu, J.X.; Yao, S.; Hu, H.Y. Experimental study of strength of backfillings of cemented rock debris and its application under low temperature condition. Chin. J. Rock Mech. Eng. 2015, 34, 139–147. [Google Scholar]
  19. Du, X.J.; Feng, G.R.; Guo, Y.X.; Qi, T.Y.; Zhang, Y.J.; Guo, J. Failure analyses of unconfined CCWBM body in uniaxial compression based on central pressure variation. Waste Manag. Res. 2018, 36, 159–168. [Google Scholar] [CrossRef] [PubMed]
  20. Anay, R.; Soltangharaei, V.; Assi, L.; DeVol, T.; Ziehl, P. Identification of damage mechanisms in cement paste based on acoustic emission. Construct. Build. Mater. 2018, 164, 286–296. [Google Scholar] [CrossRef]
  21. Assi, L.; Anay, R.; Leaphart, D.; Soltangharaei, V.; Ziehl, P. Understanding Early Geopolymerization Process of Fly Ash-Based Geopolymer Paste Using Pattern Recognition. ConsJ. Mater. Civ. Eng. 2018, 30, 04018092. [Google Scholar] [CrossRef]
  22. Pierce, M.E. Laboratory and Numerical Analysis of the Strength and Deformation. Behaviour of Paste Backfill; Queen’s University: Kingston, ON, Canada, 1997. [Google Scholar]
  23. Liu, Q.; Liu, D.; Tian, Y.; Liu, X. Numerical simulation of stress–strain behaviour of cemented paste backfill in triaxial compression. Eng. Geol. 2017, 231, 165–175. [Google Scholar] [CrossRef]
  24. Fall, M.; Belem, T.; Samb, S.; Benzaazoua, M. Experimental characterization of the stress–strain behaviour of cemented paste backfill in compression. J. Mater. Sci. 2007, 42, 3914–3922. [Google Scholar] [CrossRef]
  25. Wu, J.; Feng, M.; Xu, J.; Qiu, P.; Wang, Y.; Han, G. Particle size distribution of cemented rockfill effects on strata stability in filling mining. Minerals 2018, 8, 407. [Google Scholar] [CrossRef]
  26. Xu, W.B.; Song, W.D.; Wang, D.X.; Ma, Y. Characteristic analysis of deformation failure and energy dissipation of cemented backfill body under triaxial compression. Rock Soil Mech. 2014, 35, 3421–3429. [Google Scholar]
  27. De ARAÚJO, E.E.B.; Simon, D.; de FRANÇA, F.A.N.; de Freitas Neto, O. Shear Strength of a Cemented Paste Backfill Submitted to High Confining Pressure. In Applied Mechanics and Materials; Trans Tech Publications: Zurich, Switzerland, 2017; Volume 858, pp. 219–224. [Google Scholar]
  28. Deng, D.Q.; Gao, Y.T.; Wu, S.C.; Yu, W.J. Experimental study of destructive energy dissipation properties of backfill under complicated stress condition. Rock Soil Mech. 2010, 31, 737–742. [Google Scholar]
  29. Wang, Y.; Li, C.; Hou, Z.; Yi, X.; Wei, X. In Vivo X-ray Computed Tomography Investigations of Crack Damage Evolution of Cemented Waste Rock Backfills (CWRB) under Uniaxial Deformation. Minerals 2018, 8, 539. [Google Scholar] [CrossRef]
  30. Sun, W.; Hou, K.; Yang, Z.; Wen, Y. X-ray CT three-dimensional reconstruction and discrete element analysis of the cement paste backfill pore structure under uniaxial compression. Construct. Build. Mater. 2017, 138, 69–78. [Google Scholar] [CrossRef]
  31. GB/T 175-2007, Common Portland Cement; Standards Press of China: Beijing, China, 2007.
  32. MWRPRC (Ministry of Water Resources of the People’s Republic of China). GB/T 50123-1999: Standard for Soil Test Method; MWRPRC: Beijing, China, 1999.
  33. Hirono, T.; Takahashi, M.; Nakashima, S. In situ visualization of fluid flow image within deformed rock by X-ray CT. Eng. Geol. 2003, 70, 37–46. [Google Scholar] [CrossRef]
  34. Cnudde, V.; Boone, M.N. High-resolution X-ray computed tomography in geosciences: A review of the current technology and applications. Earth-Sci. Rev. 2013, 123, 1–17. [Google Scholar] [CrossRef] [Green Version]
  35. Wang, Y.; Li, C.H.; Hao, J.; Zhou, R.Q. X-ray micro-tomography for investigation of meso-structural changes and crack evolution in Longmaxi formation shale during compressive deformation. J. Pet. Sci. Eng. 2018, 164, 278–288. [Google Scholar] [CrossRef]
  36. Wang, Y.; Li, X.; Wu, Y.F.; Lin, C.; Zhang, B. Experimental study on meso-damage cracking characteristics of RSA by CT test. Environ. Earth Sci. 2015, 73, 5545–5558. [Google Scholar] [CrossRef]
  37. Zhou, X.P.; Zhang, Y.X.; Ha, Q.L. Real-time computerized tomography (CT) experiments on limestone damage evolution during unloading. Theor. Appl. Fract. Mech. 2008, 50, 49–56. [Google Scholar] [CrossRef]
  38. Karpyn, Z.T.; Alajmi, A.; Radaelli, F.; Halleck, P.M.; Grader, A.S. X-ray CT and hydraulic evidence for a relationship between fracture conductivity and adjacent matrix porosity. Eng. Geol. 2009, 103, 139–145. [Google Scholar] [CrossRef]
  39. Watanabe, Y.; Lenoir, N.; Otani, J.; Nakai, T. Displacement in sand under triaxial compression by tracking soil particles on X-ray CT data. Soils Found. 2012, 52, 312–320. [Google Scholar] [CrossRef] [Green Version]
  40. Wang, Y.; Hou, Z.Q.; Hu, Y.Z. In situ X-ray micro-CT for investigation of damage evolution in black shale under uniaxial compression. Environ. Earth Sci. 2018, 77, 717. [Google Scholar] [CrossRef]
  41. Singh, U.K.; Digby, P.J. A continuum damage model for simulation of the progressive failure of brittle rocks. Int. J. Solids Struct. 1989, 25, 647–663. [Google Scholar] [CrossRef]
  42. Lemaitre, J.; Chaboche, J.L. Mechanics of Solid Materials; Cambridge University Press: Cambridge, UK, 1990. [Google Scholar]
Figure 1. The full tailings, from the Lilou Iron Mine, used during CWRTB sample preparation.
Minerals 09 00052 g001
Figure 2. SEM images of the cemented tailings paste. Images (ad) are at 129, 571, 620, and 667 times magnification, respectively).
Minerals 09 00052 g002aMinerals 09 00052 g002b
Figure 3. The waste rock blocks used in the preparation of the CWRTB samples. (a) The waste rock pieces used in the preparation of CWRTB samples; (b) the XRD results; (c) the SEM results; (d) the stress–strain curve of the marble block under uniaxial compression with a sample size of 50 mm in diameter and 100 mm in height. Tested according to ASTM standards.
Minerals 09 00052 g003aMinerals 09 00052 g003b
Figure 4. Preparation of the CWRTB samples for the experiment. (a) Curing the samples in a humidity chamber; (b) CWRTB samples after curing.
Minerals 09 00052 g004
Figure 5. The experimental system of real-time CT scanning for the CWRTB samples. (a) X-ray CT machine and loading device; (b) scheme of the gasbag Hoek cell.
Minerals 09 00052 g005
Figure 6. Results of the in situ stress of the CWRTB material in the filling stope. (a) The stress monitoring device to record the stress in three directions in the Lilou Iron Mine stope; (b) the internal stress monitoring curves in the vertical, lateral, and longitudinal directions.
Minerals 09 00052 g006
Figure 7. The axial stress–strain curves of the CWRTB sample under triaxial compression. (a) Macroscopic stress–strain curve for five CWRTB samples; (b) determination of the CT scanning stages for the CWRTB sample.
Minerals 09 00052 g007
Figure 8. X-ray CT scanning positions during sample triaxial deformation. (a) Scheme of the scanning positions; (b) the reconstructed CT images before loading.
Minerals 09 00052 g008
Figure 9. The reconstructed CT images of the CWRTB sample at the top, middle, and bottom positions at five loading stages.
Minerals 09 00052 g009aMinerals 09 00052 g009b
Figure 10. The reconstructed CT images of the CWRTB sample at the top, middle and bottom positions at five loading stages. The regions marked in orange indicate damage zones inside the sample.
Minerals 09 00052 g010aMinerals 09 00052 g010b
Figure 11. Determination of the positions of ROI in the CT images. (ac) ROI-1 was located in the bottom slice, ROI-2–4 were located in the middle slice, and ROI-5 was located in the top slice.
Minerals 09 00052 g011
Figure 12. Changes of the CT values during sample deformation at the five scanning stages. (a) Evolution of the normalized CT value against axial strain for ROI 1–5; (b) Evolution of the variance CT value against axial strain for ROI 1–5. (c) Relationship between the normalized CT value, variance CT value, and axial strain for the entire CWRTB sample.
Minerals 09 00052 g012
Figure 13. The axial, lateral, and volumetric stress–strain curves at the five CT scanning points.
Minerals 09 00052 g013
Table 1. Grain compositions of the full tailings material.
Grain Size (μm)510205075100150180360
Cumulative Proportion/%9.2513.5619.8338.0151.5062.7176.3981.65100
Table 2. The mean and standard deviation of CT values for different region of interest (ROI) in the entire sample.
Loading Stageε1 (%)σ1 − σ3 (MPa)εV (%)ROI-1ROI-2ROI-3ROI-4ROI-5Sample
meanSDmeanSDmeanSDmeanSDmeanSDmeanSD
1000944.699.85945.538.19944.610.35946.8210.75943.0921.79953.417.13
20.5422.1360.15947.710.6949.28.3951.369.44951.038.48950.1119.35958.0818.23
31.3713.576−0.285943.678.39946.229.86947.4914.09945.338.59946.3615.84951.0919.53
41.9193.777−3.317945.0710.18947.289.96950.5417.62944.579.42949.67712.65945.0421.87
53.213.753−7.306949.8916.06951.8911.17952.7721.44944.6110.58953.7314.37933.8323.22
Table 3. Stress–strain mean CT value and damage characteristics of the CWRTB sample.
Scan Stageσ1 (MPa)ε1 (%)Mean CT ValueDamage FactorCracking Behavior
100953.40No
22.1360.542958.080.089Compression
33.5761.371951.090.267damage
43.7771.919945.040.534Cracking
53.7533.21933.830.802Propagation
Table 4. Stress–dilatancy characterization of the CWRTB sample under triaxial compression.
Loading StageAxial Stress (%)Axial Strain (%)Volumetric Strain (%)Top Slice Δs (mm2)Middle Slice Δs (mm2)Bottom Slice Δs (mm2)
1000///
22.1360.5420.158.1436.7257.6
33.5761.371−0.28527.58616.35415.86
43.7771.919−3.31794.58872.68219.937
53.7533.21−7.306223.461179.57789.725

