Article

Infra Red Spectroscopy of the Regulated Asbestos Amphiboles

by
Giancarlo Della Ventura
1,2,*,
Ruggero Vigliaturo
3,
Reto Gieré
3,4,
Simone Pollastri
5,
Alessandro F. Gualtieri
6 and
Gianluca Iezzi
7
1
Dipartimento di Scienze, Universita Roma Tre, Largo S. Leonardo Murialdo 1, I-00146 Rome, Italy
2
Istituto Nazionale di Fisica Nucleare, Via E. Fermi 40, Frascati, I-00044 Rome, Italy
3
Department of Earth and Environmental Science, University of Pennsylvania 240 S. 33rd Street, Hayden Hall, Philadelphia, PA 19104-6316, USA
4
Center of Excellence in Environmental Toxicology, University of Pennsylvania, Philadelphia, PA 19104, USA
5
CERIC-ERIC, ss 14, Km 163.5, Basovizza, I-34149 Trieste, Italy;[email protected]
6
Department of Chemical and Geological Sciences, University of Modena and Reggio Emilia, Via Campi 103, Modena, I-41125 Italy
7
Dipartimento di Ingegneria & Geologia (INGEO), Università G. d’Annunzio, Via Dei Vestini 30, I-66013 Chieti, Italy
*
Author to whom correspondence should be addressed.
Minerals 2018, 8(9), 413; https://doi.org/10.3390/min8090413
Submission received: 21 August 2018 / Revised: 4 September 2018 / Accepted: 14 September 2018 / Published: 18 September 2018
(This article belongs to the Special Issue Occurrence, Crystal-Chemistry and Properties of Fibrous Minerals)

Abstract

:
Vibrational spectroscopies (Fourier Transform Infra Red, FTIR, and Raman) are exceptionally valuable tools for the identification and crystal–chemical study of fibrous minerals, and asbestos amphiboles in particular. Raman spectroscopy has been widely applied in toxicological studies and thus a large corpus of reference data on regulated species is found in the literature. However, FTIR spectroscopy has been mostly used in crystal–chemical studies and very few data are found on asbestos amphiboles. This paper is intended to fill this gap. We report new FTIR data collected on a suite of well-characterized samples of the five regulated amphibole species: anthophyllite, amosite, and crocidolite, provided by the Union for International Cancer Control (UICC) Organization, and tremolite and actinolite, from two well-known occurrences. The data from these reference samples have been augmented by results from additional specimens to clarify some aspects of their spectroscopic features. We show that the FTIR spectra in both the OH-stretching region and in the lattice modes region can be effective for rapid identification of the asbestos type.

1. Introduction

The term “asbestos” is a misleading non-scientific commercial term [1], which commonly refers to silicate minerals with fibrous morphology [2]. From a legal perspective, six fibrous minerals are regulated as asbestos minerals: five species of the amphibole group, and chrysotile, which belongs to the serpentine group of the layer silicates [3,4,5]. From a mineralogical point of view, chrysotile has only limited variations from its ideal crystal–chemical composition described as Mg3Si2O5(OH)4 [6], whereas amphiboles exhibit extremely wide ranges in composition, even in samples from the same outcrop, in the same rock, or within the same (zoned) crystal [7,8,9,10]. Such chemical variability results in significant challenges for identification and classification of amphiboles, implying difficulties for health and legal issues arising from exposure to the amphibole fibers [11,12]. Another critical aspect concerns the textural features describing “asbestiform,” “fibrous,” or “acicular” minerals [9,13,14,15,16]. According to the criteria of the World Health Organization (WHO), a regulated “fiber” is an elongated particles with a length ≥5 μm, a width ≤3 μm, and an aspect ratio (length:width) ≥ 3:1. Needle-like crystals not fulfilling this criterion are more correctly termed “acicular”; we will use these definitions throughout this text.
Accurate and full characterization of asbestos fibers and their host rocks requires a combination of several analytical techniques, most notably optical microscopy, scanning and transmission electron microscopy (SEM and TEM), X-ray diffraction (XRD), and vibrational spectroscopy (Fourier Transform Infra Red, FTIR, and Raman) [16]. Both FTIR and Raman spectroscopy have been applied for the identification of fibers in environmental or biological/medical applications, where the identification of the sample was the main goal. However, a careful examination of the literature reveals that, although Raman spectra are available as reference data for the correct fiber identification, reference FTIR data for the regulated mineral species are lacking.
To fill this gap, we provide here FTIR data for well-characterized samples of the five regulated amphibole species: anthophyllite, amosite, and crocidolite, provided by the Union for International Cancer Control (UICC) Organization, as well as tremolite and actinolite, which were from two well-known occurrences and were diffusively used in several previous studies. Where needed, the data from these reference samples have been augmented by, and compared with, results from additional specimens to clarify some of the spectroscopic features. All mineral samples used in this study have been examined by Field Emission Gun Environmental SEM (FEG-ESEM) and TEM prior to their characterization by FTIR. The FTIR data presented shall serve as a reference data set when dealing with fibrous materials in environmental or toxicological studies.

2. Vibrational Spectroscopy Applied to the Crystal Chemistry of Fibrous Amphiboles

FTIR and Raman spectroscopy are frequently used for the characterization of earth and analogue materials [17,18,19]. Both methods have been used extensively for rapid identification of asbestiform minerals and the characterization of their site occupancies [8,20,21,22,23]. Vibrational spectra can be collected either on powders or on single crystals, requiring only a very small amount of material (mg), such as tiny crystals with sizes ranging from some µm to few tens of µm. The spatial resolution of conventional Raman spectroscopy is better than that of FTIR spectroscopy, but similar to that of an IR beam at a synchrotron source [24,25]. Commonly, FTIR data are collected on few mg of powdered asbestos samples dispersed in a salt matrix (e.g., KBr, NaCl) to form a pellet (see below). Asbestos materials can also be analyzed by diffuse-reflectance IR spectroscopy (DRIFT), where the IR beam is scattered by the rough sample surface, collected by a mirror, and then sent to the detector [26]. This technique is helpful when studying cement-asbestos, because the powder to be analyzed can be easily scratched off a wall, a brick, or a roof tile by using an abrasive paper, and subsequently placed onto the DRIFT sample holder without any further preparation.
The vibrational spectrum of an amphibole (as well as of all hydrous silicates) is conventionally divided into two ranges: the higher wavenumber region (4000–3000 cm−1) where typical bands due to water/OH stretching are observed, and the lower wavenumber range (<1200 cm−1), where bands resulting from longer bonds, such as those of the tetrahedral skeleton, the cation-oxygen (≥six-fold) polyhedral, or the bending/libration modes, are found. The near-infrared (NIR) region, at wavenumbers 10,000–4000 cm−1, although rarely used, is also of significant interest due to the possible applications in remote sensing [27].
Amphiboles may crystallize in several different space groups, but the C2/m is by far the most common [28]. Their OH-stretching (3000 to 4000 cm−1) FTIR and Raman spectra are very similar and show identical band multiplicity and band wavenumbers [25,26,29]; by contrast, band intensities can be significantly different, a feature that has important consequences in quantitative analysis [30]. At low frequency, the lattice mode region (<1200 cm−1) can display a large number of peaks for a C2/m amphibole [29]. Such complex spectra, typically consisting of many overlapping bands, prevent a reliable assignment of the observed modes to a single molecular motion. Moreover, in this low-frequency region, IR and Raman spectra are significantly different [26]. For mineral identification and crystal–chemical studies, however, the spectral results can be used by comparison with a relatively large dataset available in the literature, collected on samples spanning the complete compositional space of environmental/biological interest. Here, we focus on completing this set of reference data for FTIR, which are lacking or scattered throughout the literature.
In amphiboles, the OH group is directly bonded to three cations in six-fold coordination, labelled M(1) and M(3), forming the base of a nearly equilateral triangle around the OH group (Figure 1a). The O–H distance is extremely short (≈0.96 Å [31]), and consequently, the OH-stretching modes occur at very high wavenumbers (3750–3600 cm−1).
This frequency range is almost invariably free from interferences by other absorbing species, which represents a clear advantage of O–H stretching spectroscopy. The exact position (i.e., energy) of the principal OH-stretching band(s) scales with the relative strength of the O–H bond that is also dependant on the degree of hydrogen bonding between the H atom and the surrounding O atoms. In other words, both the strength and the length of the O–H bond are extremely sensitive to any local arrangement of atoms around the OH group. This aspect makes IR and Raman spectroscopy very important tools for crystal–chemical studies of hydrous silicates. Details on how the exact position of the bands observed in the OH-stretching spectra of amphiboles can be used as a tool for their characterization can be found is a vast body of literature (see [21,32] for a complete list of references). Specifically, applications to the study of fibrous amphiboles can be found in References [8,26,33].

3. Materials and Methods

A list of the samples used for this investigation, including mineral formulae and information on their occurrence, is given in Table 1.
Powder FTIR spectra were collected at Roma Tre University using a Nicolet iS50 spectrometer, equipped with a Globar source, a KBr beam-splitter, and a DGTS (Deuterated Triglycine Sulfate) detector. Sixty-four spectra were averaged for both sample and background, for a nominal resolution of 4 cm−1. Samples were prepared as KBr pellets, using 5:150 and 0.5:150 mg ratios for the 3000–4000 and <1200 cm−1 regions, respectively. Single-crystal FTIR spectra in the OH-stretching medium-infrared (MIR) were collected with unpolarized light using a Bruker Hyperion 3000 microscope equipped with an MCT (Mercury Cadmium Telluride) detector and a KBr beam splitter at Istituto Nazionale di Fisica Nucleare (INFN, Frascati, Rome).
For the SEM analysis, the mineral powders were dispersed in 2-propanol and ground by hand, using an agate mortar for 3 min, resulting in a homogeneous suspension. An FEI Quanta 600 Field-Emission-Gun Mark II Environmental Scanning Electron Microscope (FEG-ESEM) was used to investigate the samples. Environmental SEM allows for observation of the sample without the need of a conductive coating, and thus, the 2-propanol suspensions containing the amphiboles were directly transferred onto a conductive carbon tape fixed onto a SEM stub (12.7 mm diameter). The instrument was set to environmental mode with a voltage of 15 kV and a chamber pressure of 0.53 Torr. Variable beam dimension was used to optimize imaging and semi-quantitative chemical analysis (in general, sizes 3 and 6, respectively). Chemical data obtained with the SEM through energy-dispersive X-ray (EDX) spectroscopy were used exclusively to confirm the identity of the studied specimen.
TEM analyses were conducted on a JEOL 2010F TEM and involved a combination of imaging and high-resolution (HRTEM) techniques together with selected area electron diffraction (SAED). The microscope was operated at 200 kV combining different sets of objective apertures, selected area apertures, and camera lengths to optimize the observations. All examinations were performed on a minimum of 50 fibers.

4. Results and Discussion

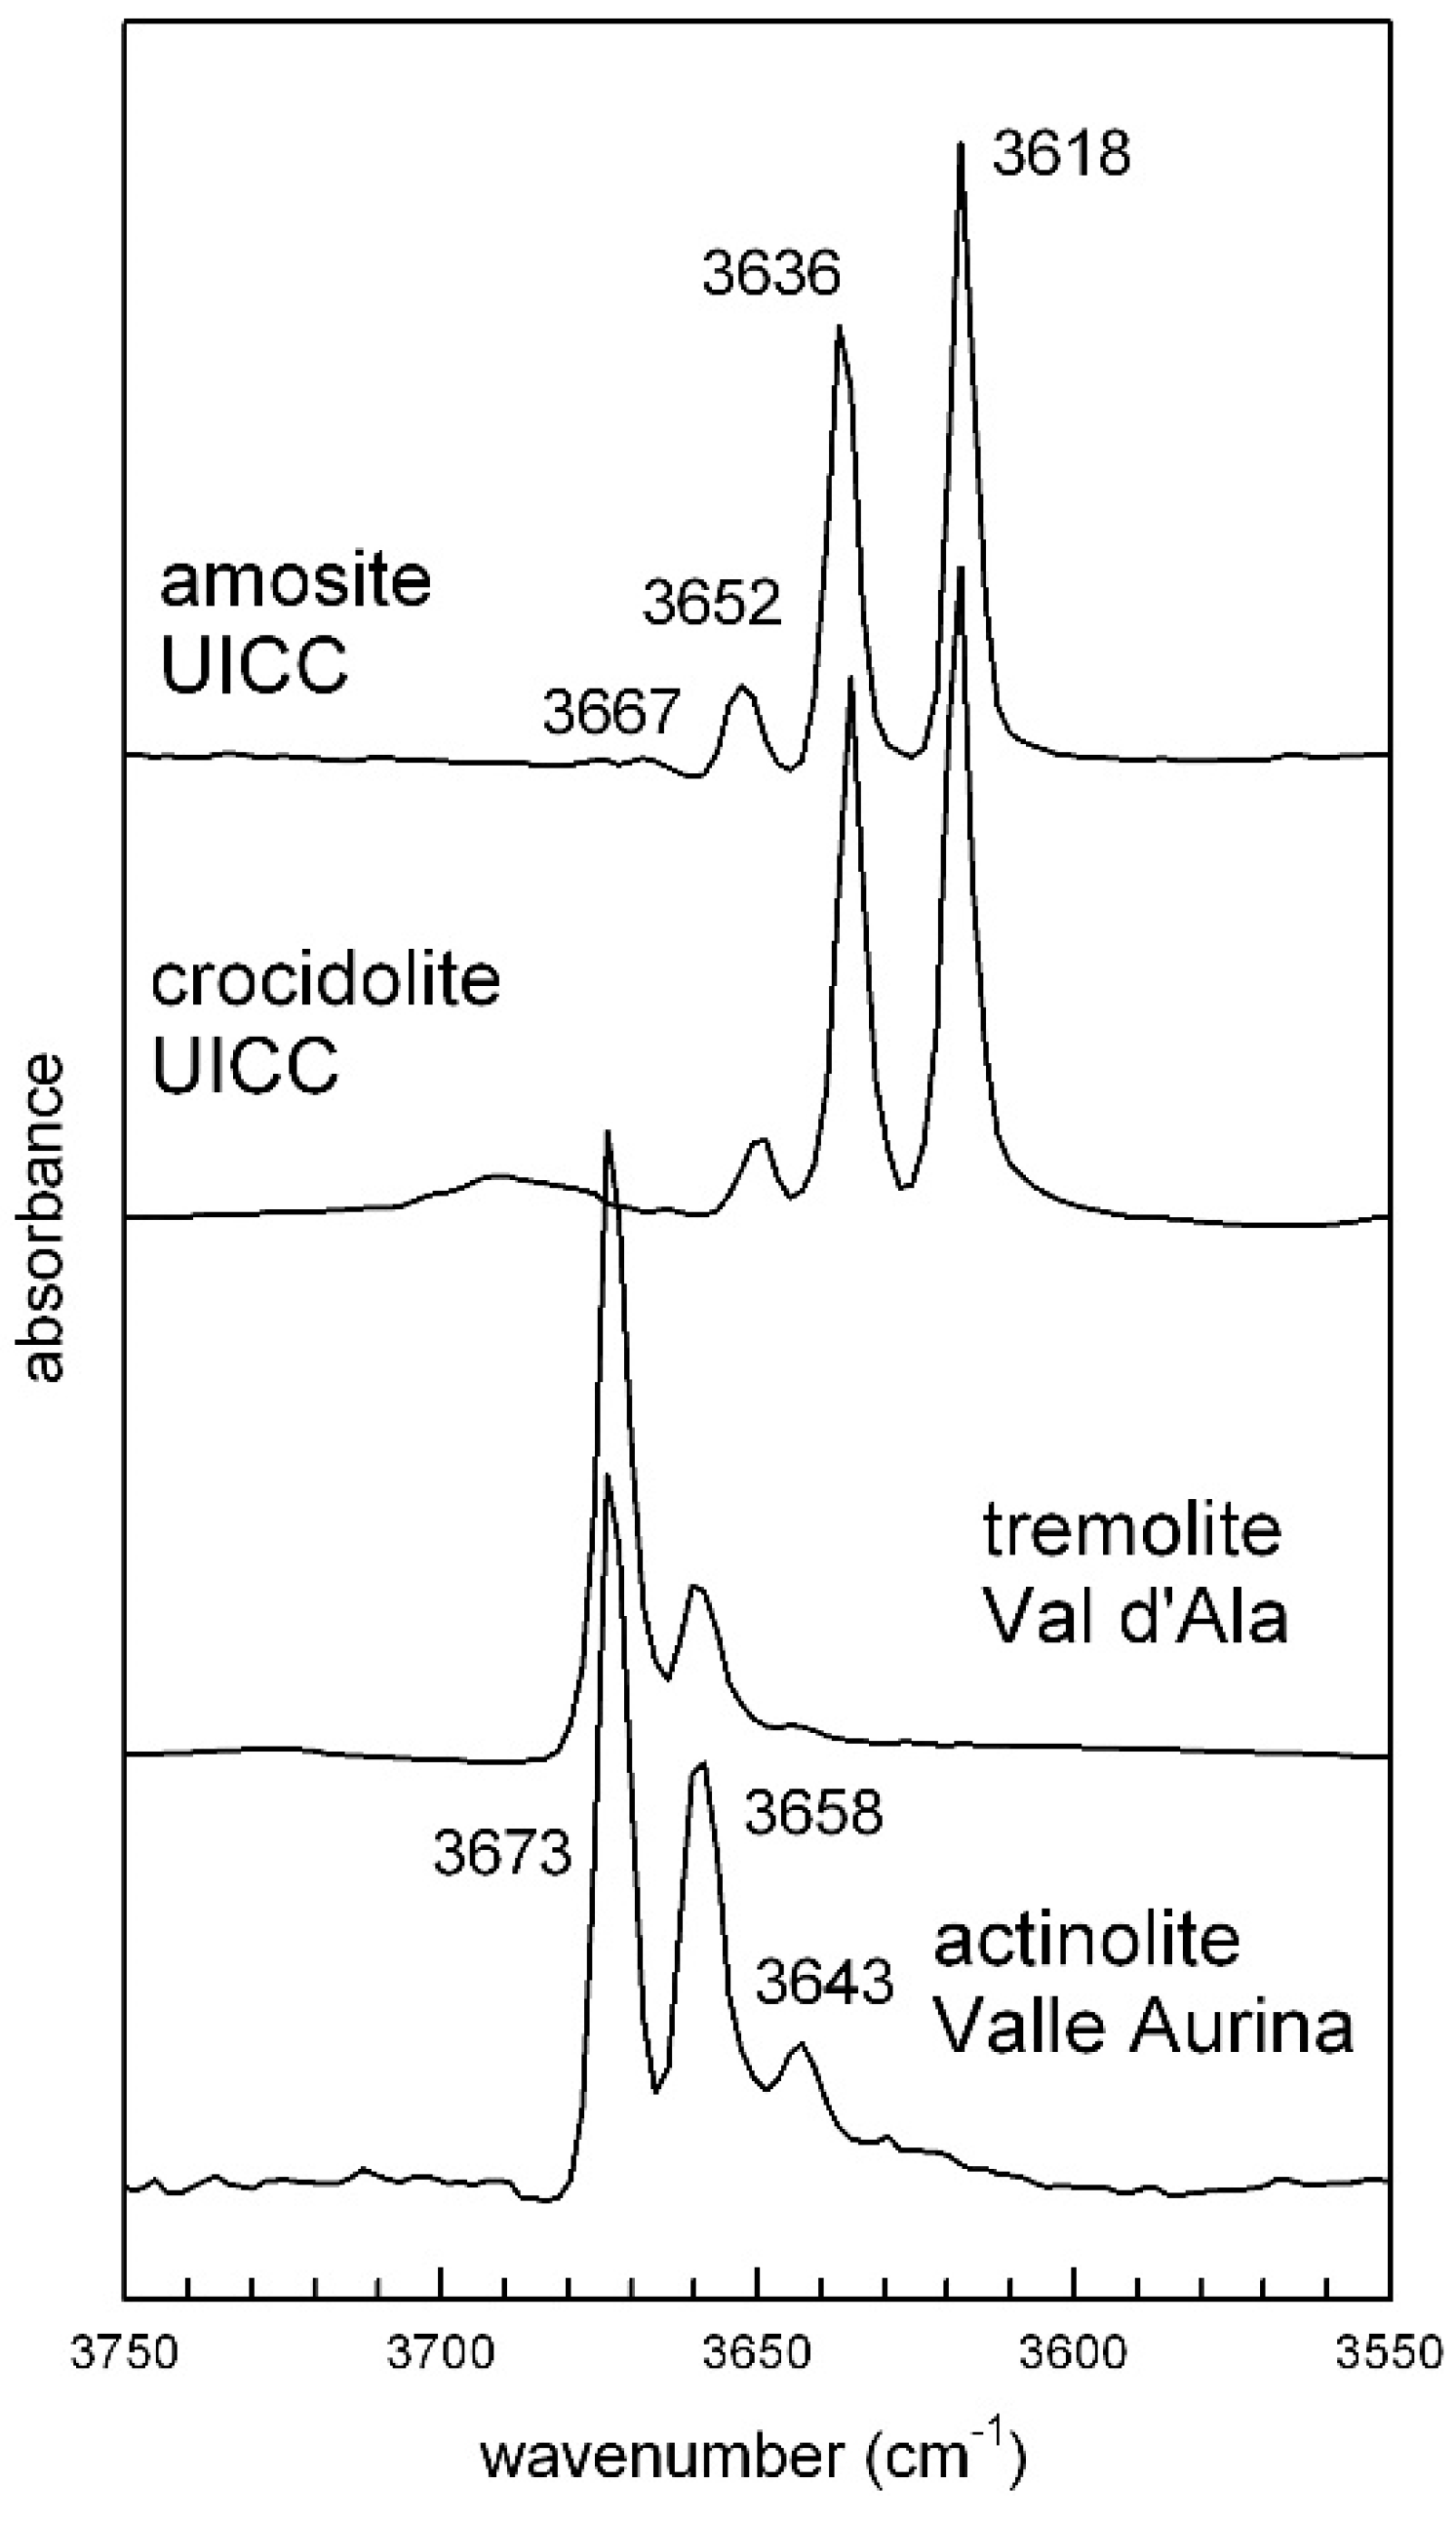
4.1. OH-Stretching Spectra and Crystal Chemistry

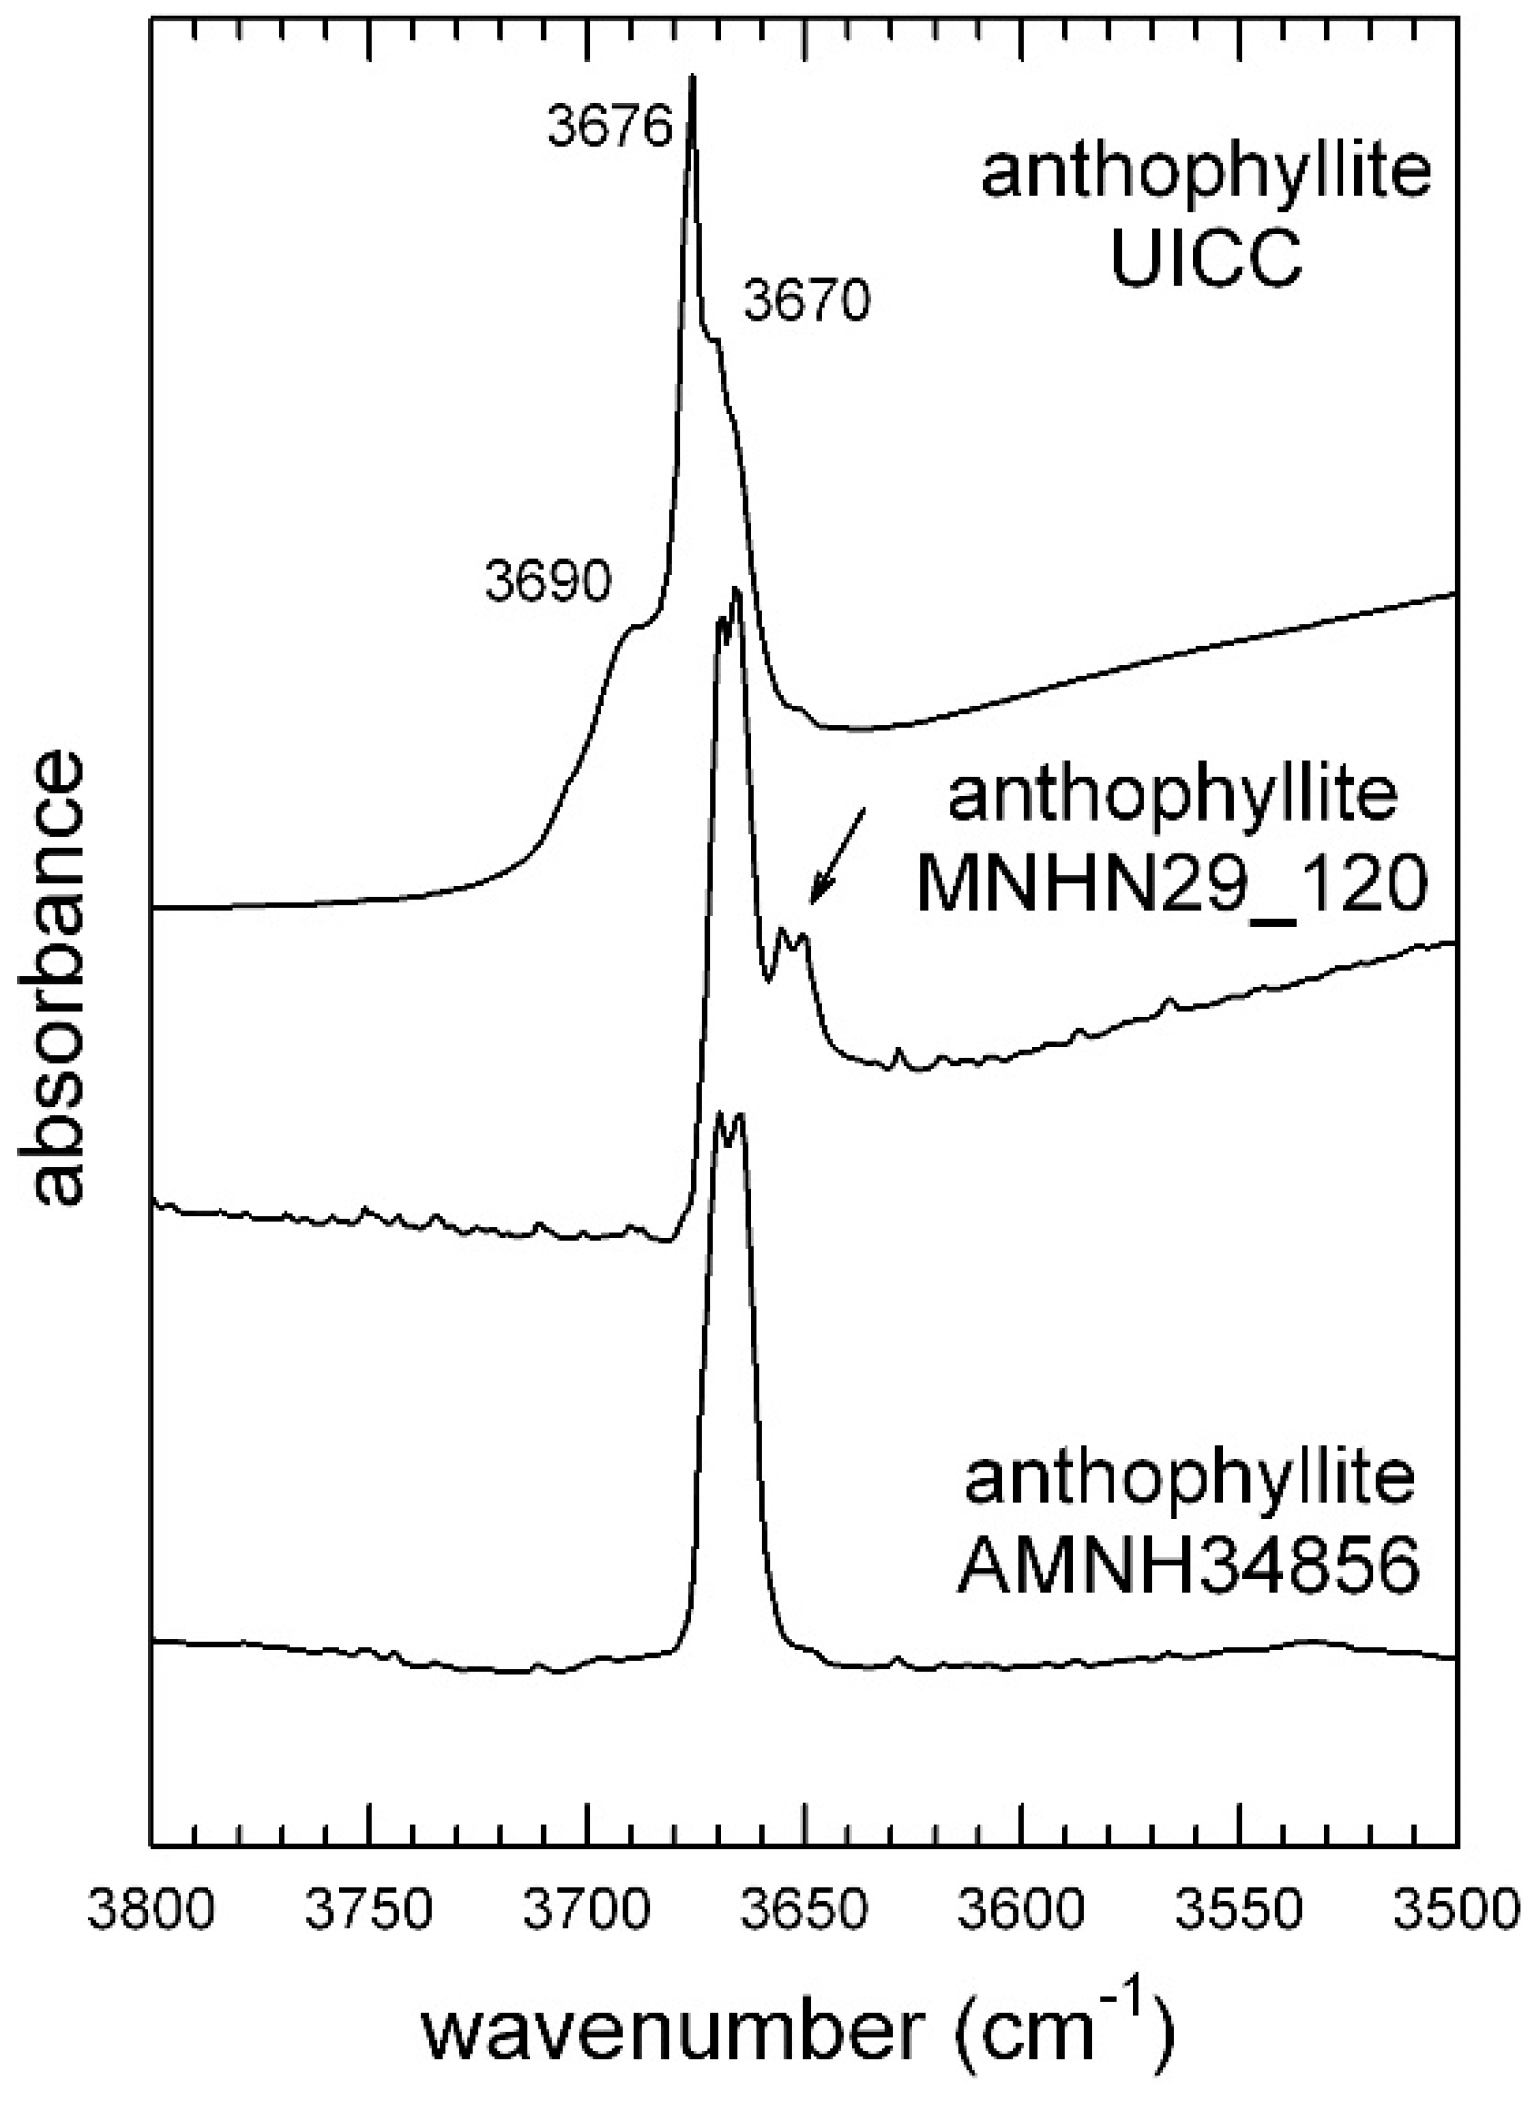
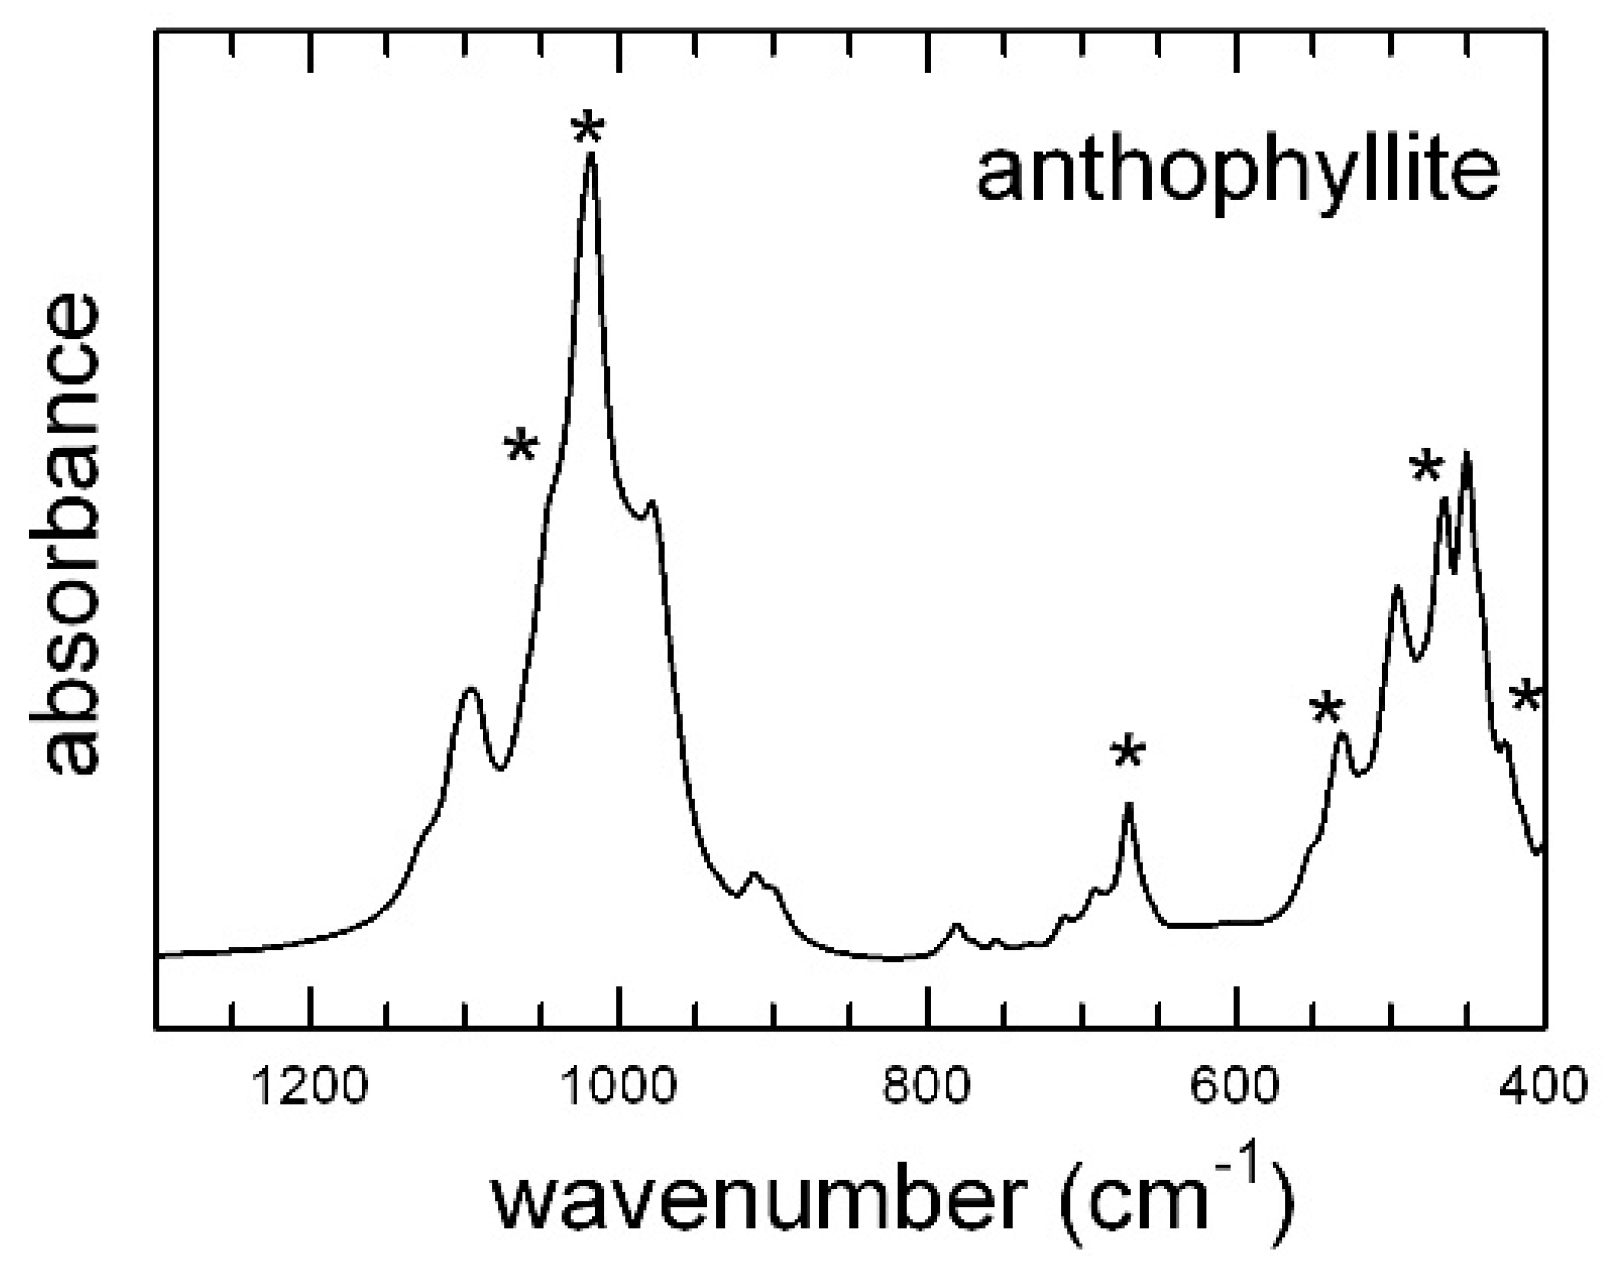
4.1.1. UICC Anthophyllite Asbestos

Anthophyllite has the ideal end-member composition AB(Mg)2C(Mg)5TSi8O22W(OH)2. According to the most recent IMA (International Mineralogical Association) classification, anthophyllite belongs to the magnesium-iron-manganese subgroup, defined by B(Ca + ΣM2+)/ΣB ≥ 0.75, BΣM2+/ΣB > BCa/ΣB. Amphiboles of this subgroup may be orthorhombic (space groups Pnma or Pnmn) or monoclinic (space groups C2/m or P21/m). End-member anthophyllite is orthorhombic, with a potential solid–solution toward ferro-anthophyllite A(□)B(Fe2+)2C(Fe2+)5T(Si)8O22W(OH)2. The monoclinic P21/m and Mg-rich polymorph of the series is named cummingtonite, where a low amount of Fe2+ at both B- and C-sites stabilizes the C2/m polytype [42].
Anthophyllite has a color ranging between dull green to white; it typically occurs in metamorphic rocks of the lower to middle amphibolite facies and in serpentinized ultrabasic rocks [7], where it almost invariably grows as distinctly fibrous crystals. Anthophyllite was industrially employed in limited amounts, mainly for insulation products and construction materials; it frequently occurs as a contaminant in chrysotile asbestos, vermiculite, and talc [7]. The main commercially exploited deposits are those in metamorphosed dunites and harzburgites of Eastern Finland (Paakkila and Maljasalmi), where anthophyllite was formed as a replacement of olivine and orthopyroxene during the serpentinization of the host rock. The UICC sample investigated here was from Paakkila (Table 1). Similar occurrences are known in the U.S., such as in Idaho, Georgia, and North Carolina [43].
According to the X-ray powder diffraction (XRPD) analysis given in References [34,35], the studied sample consisted of amphibole with impurities of biotite, clinochlore/vermiculite, and talc. The refined unit-cell data (Table 2) were in agreement with previous data for similar amphiboles [28].
FEG-ESEM images (Figure 2a) show that the sample consisted of asbestiform to acicular crystals with dimensions averaging 1 μm in width and more than 100 μm in length. Larger bundles of acicular crystals, a few tens of μm in width, were also common. In agreement with the XRPD data, lamellar and platy particles of talc were recognizable in the FEG-FESEM images (Figure 2b). The fibers showed very straight edges and low amounts of amorphous material along the surfaces. Several stepped features could be detected at the apex and along the edges of the fibers (Figure 2c).
The SAED patterns obtained by TEM display the typical amphibole streaking normal to the c axis (Figure 2d), which resulted from diffuse chain-width errors (chain multiplicity faults: CMF). Published microchemical data (Table 3) show that the UICC anthophyllite contained appreciable amounts of iron; Mössbauer and XAS (X-ray Absorption Spectroscopy) data indicate that Fe was present entirely as Fe2+ [38]. Additional components include Mn (0.04 apfu) and trace amounts of Ni, Cr, and Ca.
The FTIR spectrum in the OH-stretching region (Figure 3) of the UICC sample displays a relatively broad absorption consisting of several overlapping bands at 3690, 3676, and 3670 cm−1, with the 3676 cm−1 band being the sharpest and most intense. This type of pattern does not match the pattern expected by considering the local configuration of the OH group in amphiboles [21] with anthophyllite composition [45]; FTIR spectra of four (Mg, Fe2+) anthophyllites published in Reference [46] indeed show, in the OH-stretching region, four components, namely at 3666, 3654, 3639, and 3618 cm−1, whose relative intensities are correlated with the Mg/Fe2+ ratio at M(1,3). Ishida and Hawthorne [47] later reported that anthophyllite shows considerable fine structure in the form of band splitting of the principal OH-stretching region, indicative of an orthorhombic symmetry with two very similar but crystallographically independent OH groups [28].
To further corroborate the FTIR data, we collected infrared spectra of two well-characterized anthophyllite-group minerals for comparison (Table 1). For the amphibole from Norway (MNHN 29_102), we could collect a powder FTIR spectrum, whereas for that from Talcville (AMNH34856), we could collect only a single-crystal spectrum due to the scarcity of material. The anthophyllite from Norway shows (Figure 3) two absorptions, resulting from the presence of small amounts of Fe2+ at M(1,3) (Della Ventura, unpublished data), both showing fine structure, whereas the anthophyllite from Talcville shows only one doublet (Figure 3). This latter amphibole indeed represents a reference point for this species, because it exhibits nearly end-member composition; its complete crystal-chemical characterization [36], which included EMPA (Electron Micro Probe Analysis) and XRPD data, returned the formula ANa0.01B(Mg1.30Mn0.57Ca0.09Na0.04)C(Mg4.95Fe0.02Al0.03)T(Si8.00)O22W(OH)2, with significant Mn at M(4) only. Therefore, only Mg was present at the OH-coordinated M(1,3)-sites, besides trace amounts of Fe2+ and Al. In agreement with these results, only one split absorption was present in the OH-stretching region. The splitting factor was ∆ = 5 cm−1, and was observed only at high resolution (≤2 cm−1), both in powder and single-crystal spectra. The observed splitting was thus direct evidence for the symmetry of the amphibole to be either Pnma or P21/m. Based on the above discussion, in the FTIR spectrum of the UICC anthophyllite, the sharp peak at 3676 cm−1 was assigned to talc, whereas the broad absorption at 3690 cm−1 could be assigned to clinochlore/vermiculite impurities [45]. According to the Rietveld refinement results of Reference [35], the UICC anthophyllite is orthorhombic Pnma, but the band splitting in the OH spectrum is not observable due to the overlap with the signals from the talc and clinochlore impurities. We also note that, although the sample contained significant Fe (Table 3), no absorptions due to local configurations, such as MgMgFe or MgFeFe, were observed in the spectrum. This is consistent with the fact that in the UICC anthophyllite, all ferrous iron was ordered at M(4), whereas the M(1,2,3) octahedra had a composition of Mg = 5.0 apfu (atoms per fomula unit) [35]. Anthophyllite MNHN 29_102 contained 13.0 wt% Fe, and the FTIR spectrum showed two split O–H absorptions (Figure 3), again consistent with a Pnma or P21/m symmetry; however, the presence of the 3655–3650 cm−1 doublet (highlighted by the arrow in Figure 3) indicates that Fe2+ was partially disordered at M(1,3) in this sample.

4.1.2. UICC Amosite (Grunerite Asbestos)

The commercial material “amosite”, an acronym for “Asbestos Mines of South Africa”, is commonly referred to as “brown asbestos”. It corresponds to the amphibole-group mineral grunerite, which is characterized by the ideal formula A(□)B(Fe2+)2C(Fe2+)5T(Si)8O22W(OH)2 and monoclinic C2/m symmetry; the orthorhombic polymorph is instead labelled ferro-anthophyllite. A complete Fe2+-Mg solid–solution may exist along the monoclinic grunerite–cummingtonite series, which is correlated to a symmetry adjustment from P21/m to C2/m [48,49]. Hence, and in spite of, the chemical simplicity involving the homovalent Mg–Fe2+ exchange, the amphiboles of the magnesium-iron-manganese subgroup can crystallize with different structures, a feature that is strongly correlated to the size of the B-site cations [50,51,52,53]. Notably, the Mg-end member anthophyllite is orthorhombic, the Mg-rich (or Fe-poor) cummingtonite is P21/m, whereas the Fe-rich (or Mg-poor) grunerite is C2/m [54,55].
The members of the cummingtonite–grunerite series are typically found in Ca-poor regionally and contact metamorphosed rocks; they are well known from metamorphosed banded iron formations (BIF). Amosite fibers, up to several cm long, occur interbedded within ironstones [56]. Mg-rich compositions are also reported from igneous environments [7]. Amosite was used most frequently in cement sheets and pipe insulation, insulating boards, ceiling tiles, and thermal insulation products. Although cummingtonite–grunerite amphiboles are relatively common, there is only one locality were these materials have been commercially exploited, i.e., the metamorphic iron formations of Eastern Transvaal (South Africa). We characterize here the standard UICC material, sourced from the Transvaal locality (Table 1). The same material was investigated with XRPD in Reference [35], showing it to consist of amphibole with impurities of calcite, hematite, and quartz. Rietveld refinement demonstrated that the sample is monoclinic C2/m, with the lattice parameters listed in Table 2, in agreement with previous data for similar amphiboles [28]. Specifically, the measured small β angle agrees well with monoclinic amphiboles hosting small divalent cations (Mg and/or Fe2+) at the B-site. FEG-FESEM images of the studied UICC amosite (Figure 4a,b) revealed that the sample consisted of ≈1 μm-wide fibres, which were arranged in parallel fashion to form elongated bundles with lengths of several hundred μm. In addition, the amosite fibers exhibited crystal defects (CMF), which were visible in HRTEM images (Figure 4c) and confirmed by streaking normal to the c* direction, as observed in the SAED patterns (Figure 4d). The SAED patterns display defined spots as well as satellite reflections (due to the presence of more than one crystallite in the selected area), which exhibit less intense streaking than those in anthophyllite. Many fibers have an extended amorphous surface cover, with a thickness ranging between 1 and 5 nm (Figure 4c). Inspection of the available chemical data for the UICC amosite revealed that this sample is close to the Fe-end member composition, but contained significant amounts of Mg (6.23 wt% of MgO) and ferric iron (3.9 wt% of Fe2O3). Trace elements included Ti, Cr, Ni, Mn, Ca, and alkalis (Table 3). The FTIR spectrum of the UICC amosite in the OH-stretching region (Figure 5) shows three well-resolved peaks at 3652, 3636, and 3618 cm−1, as well as an additional, very weak peak at 3667 cm−1. The spectrum is consistent with the distribution of Mg and Fe2+ at the C-sites, the observed bands being assigned to hydroxyl groups bonded to MgMgMg, MgMgFe2+, MgFe2+Fe2+, and Fe2+Fe2+Fe2+ octahedral clusters, from higher to lower frequency, respectively. Moreover, no bands due to the presence of Fe3+ are observed in this spectrum [57,58], demonstrating it to be fully ordered at the M(2)-site. The peaks of UICC amosite are sharp, with a nearly Lorentzian shape and without any hyperfine splitting such as that observed for anthophyllite (Figure 3). These features are indicative of a well-ordered C2/m structure. It is known since the pioneering work in References [59,60] that the relative intensities (peak area) of the four components observed in the OH-spectrum of amphiboles is correlated to the Fe2+/Mg occupancy at the hydroxyl-coordinated M(1,3) sites. This feature has been validated later with the analysis of several sets of synthetic solid–solution series with varying and controlled composition at the octahedral strip [61,62,63,64,65]. Deconvolution of the OH-spectrum of UICC amosite was relatively straightforward due to the peak sharpness and lack of band overlapping; following the method described in Reference [26], a value of M(1,3)Fe2+ = 2.40 apfu was obtained, in excellent agreement with the value derived from site-occupancy refinement via the Rietveld method from synchrotron-radiation XRD data [35].

4.1.3. UICC Crocidolite (Riebeckite Asbestos)

Crocidolite, the so-called “blue asbestos,” is the most popular and commercially employed amphibole asbestos. Mineralogically, it corresponds to the end-member riebeckite, which has the nominal formula A(□)B(Na)2C(Fe2+3,Fe3+2)T(Si)8O22W(OH)2 and is classified in the sodic amphibole subgroup defined by B(Na + Li)/ΣB ≥ 0.75, BNa/ΣB ≥ BLi/ΣB [42]; mineral species in this group invariably display the monoclinic C2/m symmetry. The chemical composition of riebeckite can vary substantially, primarily due to two main substitutions at the C-sites, i.e., Fe2+ ⇔ Mg and Fe3+ ⇔ Al [58]. These amphiboles are typical constituents of acidic igneous rocks, such as granites and quartz syenites, as well as high-grade metamorphic rocks. The fibrous varieties are essentially found in meta-ironstones, where the blue asbestos occurs in columnar and slip-fiber veins, whose origin is connected with rock deformation coupled to intense activity of metamorphic/metasomatic fluids. This extensively exploited asbestos material was used massively for insulation of steam engines, but also for some spray-on coatings, pipe insulation, plastics, and cement products. Notable occurrences of crocidolite are those of Bolivia, Western Australia (Hamersley Iron province), and South Africa (Transvaal and Cape Province). Here, we consider the UICC standard from South Africa (Table 1).
XRPD data for the amphibole studied here can be found in Reference [34]; accordingly, the sample consists of amphibole plus very minor amounts of hematite, magnetite, quartz, talc, and lizardite. The lattice dimensions of the amphibole are given in Table 2. A representative FEG-FESEM image (Figure 6a) shows that the sample consisted of parallelly arranged fibers with a width of 0.5–1.0 μm and a length of 50–100 μm. HRTEM and SAED (Figure 6b–d) images document that the sample was the most defective and feature-rich of the studied amphiboles. CMFs were pervasive, together with a diffuse presence of Moiré fringes, that were a consequence of a slight misorientation of superposed crystal lattices; in the present case they could also be related to a lattice parameter variation due to the presence of lattice defect, i.e., CMF. The surface of many fibers was covered by an amorphous layer. As is the case for all investigated amphiboles, this surface layer, when present, could be identified as a Si-rich amorphous material or as ferrihydrite; additional higher-resolution analytical techniques must be used to distinguish between the two materials without inducing beam-damage artefacts in the studied region that could lead to erroneous conclusions. Microchemical data of this studied UICC crocidolite (Table 3) show that the only significant departure of the amphibole from an end-member riebeckite composition was the presence of low, but significant amounts of Mg (0.52 apfu) at M(1,3); the ferric iron content was also very close to the ideal value (Fe3+ = 2.05 apfu). Trace elements included Ti, Cr, Ni, Mn, and Ca.
The FTIR spectrum of the UICC crocidolite in the OH-stretching region (Figure 5) shows three well-resolved peaks at 3650, 3636, and 3618 cm−1. This pattern is almost identical to that of a well-characterized sample from Madagascar published recently in Reference [39] for the synthetic end-member riebeckite [51], and the UICC amosite (Figure 5). A broad absorption extending from 3710 to 3680 cm−1 could be assigned to small amounts of alkali cations at the A-site [51]. From the relative intensities of the component bands fitted to the spectrum of Figure 5, neglecting the broad absorption peak at 3690 cm−1 provided a Fe2+ content at M(1,3) = 2.39 apfu. Intriguingly, the high-temperature oxidation of crocidolite has been the object of a large number of studies during the 1960–1970s due to the increasing technological relevance of this material, whose widespread use was abandoned only once its carcinogenic effect was definitively recognized. A detailed study has been provided recently in Reference [39], which showed that this process is far from being straightforward and may have significant implications for the surface availability of iron species.

4.1.4. Tremolite Asbestos from Val d’Ala

Tremolitic amphiboles belong to the calcium-amphibole subgroup, defined by B(Ca + ΣM2+)/ΣB ≥ 0.75, BCa/ΣB ≥ BΣM2+/ΣB [42]. Ideal tremolite has the formula A(□)B(Ca)2C(Mg)5T(Si)8O22W(OH)2, with a nominal solid–solution towards the end-member ferro-actinolite A(□)B(Ca)2C(Fe2+)5T(Si)8O22W(OH)2; all compositions along this join have C2/m symmetry [42]. Intermediate C(Mg,Fe2+) compositions are termed “actinolite”.
Actinolites are essentially metamorphic minerals occurring in both contact and regionally metamorphosed rocks, whereby they are particularly common in the latter environment [7]. Actinolites are characteristic of greenschist-facies metabasites (ophiolitic sequences), whereas tremolite occurs in metacarbonates and metamorphosed ultrabasic rocks. Actinolites occur typically with extremely fibrous shapes, and their growth is in many cases connected to rock deformation, which is accompanied by fluid–rock interactions during the geological history of the parent rocks [66,67].
Mg-rich members are usually more fibrous than the Fe-rich ones, a feature that has been observed during synthesis of similar systems, such as along the richterite–ferro-richterite join [64], and they possess appreciable tensile strength [7]. Tremolite, as well as the other regulated amphibole of the calcium subgroup, i.e., actinolite, has not been commercially exploited, but it occurs in the environment as contaminants in chrysotile asbestos, vermiculite, and talc. In the absence of a UICC reference material, the sample described here is from a well-known occurrence of fibrous tremolite, namely from the serpentinites associated with the ultrabasic Massif of Lanzo outcropping at Ala di Stura (Val d’Ala), Piedmont, Italy [37,40].
Previous XRPD studies showed the studied sample to consist of tremolite with minor amounts of antigorite, clinochlore, hematite, and quartz [34]. Refined unit-cell data (Table 2) match those measured in similar minerals [28]. In contrast to amosite, the measured β angle was close to 105°, in agreement with the presence of a large divalent cation (Ca) at the B-site (Table 2). The tremolite from Val d’Ala consisted of asbestiform, bladed and acicular crystals, showing a tendency to split apart in fibers (mostly at the micro-scale) and/or cleavage fragments (down to the nanoscale) (Figure 7a). TEM images of the Val d’Ala tremolite (e.g., Figure 7b) document the separation of elongated fiber-like particles and/or cleavage fragments derived from the main fibers or from elongated bladed particles. The diffuse presence of Moiré fringes suggests a planar ((110) or (200)) rearrangement of crystal planes (Figure 7b). The apex of the fibers shows evidence of dissolution and re-precipitation processes, with subsequent accumulation of probably Si-rich amorphous or re-crystallized material characterized by an irregular shape and multiple crystallographic orientations (Figure 7c). The SAED (Figure 7d) and HRTEM investigations did not provide evidence of structural defects. Microchemical data and the derived crystal–chemical formula of this sample from Val d’Ala, provided in References [34,37], show that the amphibole was close to the tremolite end member, as it had a very low Fe2+ content (0.22 apfu) and only negligible amounts of Fe3+ (0.08 apfu). Trace elements included Ti, Cr, Ni, Mn, and alkalis (Table 3).
The FTIR spectrum of the studied tremolite in the OH-stretching region (Figure 5) shows three well-resolved peaks at 3673, 3656, and 3643 cm−1, which could be assigned to the different Mg/Fe2+ configurations at M(1,3) [26,64]. No peaks due to the OH-containing impurities, such as antigorite and clinochlore, are observed in the spectrum, in agreement with their very low abundance determined by XRPD (see above). From the relative intensities of the component bands fitted to the spectrum of Figure 5, a Fe2+ content at M(1,3) of 0.35 apfu was derived, in excellent agreement with the site occupancies refined via the Rietveld method in Reference [40].

4.1.5. Actinolite Asbestos from Valle Aurina

The sample described here was from a well-known occurrence of fibrous tremolite in Valle Aurina (northern Italy). It has been fully described in Reference [41].
According to the high-resolution synchrotron radiation XRPD analysis, the studied sample consisted of pure amphibole within the detection limit of the method. The refined unit-cell data (Table 2) are in agreement with previous data for similar amphiboles [28]. FEG-FESEM images [41] show that the sample consists of both fibrous and acicular crystals, and the HRTEM images and indexed electron diffraction spots provide evidence for a high degree of crystallinity of the amphibole and absence of dislocations [41]. Published EMPA data for actinolite from Valle Aurina (Table 3) show that the amphibole had an intermediate Fe2+ content (0.79 apfu), with minor Fe3+ (0.11 apfu) and traces of K, Na, Ni, and Cr.
The FTIR spectrum of this actinolite in the OH-stretching region (Figure 5) shows three well-resolved peaks at 3673, 3658, and 3643 cm−1, which could be assigned to the Mg/Fe2+ configurations at M(1,3), similarly to what was discussed above for tremolite from Val d’Ala. The stronger intensity of the 3658 and 3643 cm−1 peaks in the OH-spectrum of actinolite compared to that of tremolite is in agreement with its higher Fe2+ content (Table 3). From the relative intensities of the component bands fitted to the spectrum of Figure 5, a Fe2+ content at M(1,3) of 0.91 apfu was derived, in excellent agreement with the site occupancies refined via the Rietveld method in Reference [41].

4.2. FTIR Spectra in the Low-Wavenumber Region

As stated above, the interpretation of the vibrational spectra of amphiboles in the region <1200 cm−1 and, in particular, at <650 cm−1, was extremely challenging due to the complexity of the spectra, and because in this range, tetrahedral modes overlap with octahedral (M–O) modes and OH librations [26]. In addition, the internal vibrations of the T4O11 double chain involve different types of T–O bonds, as a result of the occurrence of both bridging (Ob: O(5), O(6), O(7)) and non-bridging (Onb: O(1), O(2)) oxygens (Figure 1b). References [68,69,70] presented a factor group analysis of the vibrations that are IR-active for the T4O11 unit of the amphiboles, but assignment of the many bands in this region is still done on an empirical basis [71,72]. Despite these difficulties, vibrational spectroscopy in the lattice region is extremely useful and widely applied for asbestos identification, particularly with micro-Raman spectroscopy [73,74,75,76]. The success of this method is essentially due to the fact that the Raman spectrum in the low-frequency region provides a reliable fingerprint for regulated asbestos species; the high-resolving power of Raman (beam dimension < 1 μm2) also makes this technique suitable for biomedical/toxicological studies [77,78]. A comprehensive summary of Raman data for amphiboles in the region of framework phonon modes has been provided recently in Reference [26]. FTIR data for the <1200 cm−1 region are relatively scarce, however, and very few applications to asbestos minerals exist [79], although this technique might be extremely useful in environmental studies due to the ease of sample preparation and data acquisition/interpretation.
The few systematic FTIR studies performed on relatively well-constrained solid–solution series clearly show that the lattice-mode IR spectra are extremely sensitive to the chemical variations at the different structural sites. According to References [71,72], the MIR range of amphiboles may be conveniently divided into three regions: (1) The 1200–800 cm−1 region, where seven to eight very intense to medium intense bands due to lattice Si–O–Si and O–Si–O antisymmetric stretching vibrations are observed. In particular, the highest wavenumber peaks in this range can be assigned to T(1)–O(1), which is a very short bond in the amphibole structure [80]. (2) The 800–600 cm−1 range, where four to six medium weak to very weak peaks resulting from Si–O–Si symmetric stretching or chain deformation modes occur; in this range two OH librational modes at around 700 and 690–640 cm−1 have been identified in TAl-free amphiboles, via hydrothermal treatment with deuterium [45]. The most intense peak in the Raman spectrum of amphiboles occurs in this region, and it has been shown that the wavenumber value of this sharp peak provides a reliable identification of the species [20,77]. (3) At wavenumbers <650 cm−1, there is a mixture of T–O and M–O bending modes and OH librations [81]. For alkali amphiboles of the glaucophane–riebeckite series, Ishida et al. [71] reported linear shifts for most bands in this region, consistent with the strong influence of the chemical composition of the amphibole on the peak positions.
The spectra collected in the 1300–400 cm−1 range for the studied amphiboles are given in Figure 8 and Figure 9. In particular, Figure 8 shows the spectrum collected for UICC anthophyllite, a sample that, as discussed above, contains significant impurities of hydrous silicates (talc and chlorite); the sharp peaks at 1041, 1091, 669, 531, 465, and 424 cm−1, indicated with an asterisk in Figure 8, could be assigned to talc [45]. In Figure 9, the spectra of all other samples are displayed; relevant data and tentative band assignment from the literature are given in Table 4. Inspection of Figure 9 reveals that, in region 1, the patterns of tremolite and actinolite were almost identical, with the only chemical difference between these samples being the Mg–Fe2+ substitution at the C-sites. Five intense bands plus two shoulders were observed (Table 4). In the same region, however, the spectra of UICC anthophyllite, amosite, and crocidolite were significantly different and show, as a peculiar characteristic, a major and sharp peak plus several medium intense bands and shoulders. Inspection of the literature data unveiled that the spectrum of anthophyllite MNHN29_102 is almost identical to those of anthophyllites published in Reference [46], whereas the spectrum of UICC crocidolite is almost identical to that of riebeckites published in References [71,82], suggesting that the IR patterns in this region are indeed characteristic of the species.
Following the work of Reference [46], the positions of the medium–strong peaks in region 2 are also characteristic of the amphibole species, being sensitive of both the A- and B-site occupants. In the present case, the A-site was empty for all samples, thus the observed differences were due to the B-site cation only: for Na (crocidolite), there was a single and relatively sharp peak at 778 cm−1; for Mg (anthophyllite), a very weak single band at 780 cm−1; for Fe2+ (amosite), a doublet at 797–775 cm−1; and for Ca (tremolite-actinolite), a medium intense peak at 757 cm−1. The OH librations, identified through deuteration experiments, occurred at 709 and 688 cm−1 for anthophyllite [46] and at 685 and 642 cm−1 (Table 4) for tremolite [72].
Significant differences were finally observed in region 3, and these are again related to the amphibole type: the Fe-Mg amphiboles anthophyllite and amosite showed a medium-intensity peak around 530 cm−1 followed by an intense doublet around 480–500 cm−1. In the Na-amphibole crocidolite at the same wavenumbers, there are two weak peaks, followed by a sharp and intense absorption at 450 cm−1. The Ca-amphiboles tremolite and actinolite show two/three peaks with medium intensity at 600–500 cm−1 followed by an intense doublet at 445–465 cm−1.

5. Conclusions

This work is intended to fill a gap in vibrational spectroscopy of asbestos amphiboles, providing FTIR data for a suite of well-characterized regulated species, whose IR data are either scattered or not present in the literature. The data presented here can be used as reference spectra for environmental/toxicological studies where vibrational spectroscopy is used as an analytical tool. Our study shows that, based on a vast body of literature, mostly summarized in References [21,26], the FTIR spectra in the OH-stretching region provide a relatively easy and rapid identification of the amphibole asbestos minerals; this task is eased by the fact that all asbestos amphiboles have a vacant A-site, a feature that has a strong effect on the IR spectra [21,30] and references therein. Considering that the exact wavenumbers of the OH-stretching bands are also sensitive, albeit weakly, to the next-nearest neighbors, i.e., the M(4) and M(2) cations [8,51,57], the calcic amphiboles tremolite–actinolite can be easily distinguished from the ferromagnesian amphiboles of the anthophyllite–grunerite type. For simple binary M(1,3)Mg-M(1,3)Fe2+ solid-solutions, as is typically the case for asbestos amphiboles, the relative amount of these cations in the OH-bonded octahedra can be calculated with a high degree of confidence [26], and, provided that the Al and Fetot amounts are known from EMPA, the complete cation distribution at all octahedral sites can be derived.
The present work also shows that, although data from species spanning the complete chemical diversity of this large mineral supergroup are still lacking, the spectra in the mid-IR lattice modes region can be effective for rapid identification of the asbestos type.

Author Contributions

G.D.V. and G.I. conceived the research and wrote the bulk of the manuscript; R.V. and R.G. did the FEG-FESEM and HRTM/SAED work and helped clarifying some aspect of the data; S.P. and A.F.G. provided the samples and contributed to write the manuscript.

Funding

Part of this research was funded by PRIN 2010–2011, prot. 2010MKHT9B 004 “Interazione fra minerali e biosfera: conseguenze per l’ambiente e la salute umana”, and by MIUR-Italy Dipartimenti di Eccellenza, ARTICOLO 1, COMMI 314–337 LEGGE 232/2016. This study was also supported in part by grants P30-ES013508 and P42-ES023720 awarded by the National Institute of Environmental Health Sciences (NIEHS). The findings are not the official opinions of NIEHS or NIH.

Conflicts of Interest

The authors declare no conflict of interest.

References

  1. Thompson, C.S. Discussion of the mineralogy of industrial talcs: U.S. Bureau of Mines Information Circular. In Proceedings of the Symposium on Talc, Washington, DC, USA, 8 May 1973; Volume 8639, pp. 22–42. [Google Scholar]
  2. Mossman, B.T.; Mignon, J.; Corn, M.; Seaton, A.; Gee, J.B.L. Asbestos: Scientific developments and implications for public policy. Science 1990, 247, 294–301. [Google Scholar] [CrossRef] [PubMed]
  3. National Institute for Occupational Safety and Health (NIOSH). Asbestos Fibres and Other Elongate Mineral Particles: State of the Science and Roadmap for Research, revised ed.; Center for Disease Control and Prevention, Department of Health and Human Services: Washington, DC, USA, 2011; p. 174.
  4. Carbone, M.; Ly, B.H.; Dodson, R.F.; Pagano, I.; Morris, P.T.; Dogan, U.A.; Azdar, A.F.Z.; Pass, H.I.; Yang, H. Malignant mesothelioma: Facts myths, and hypotheses. J. Cell. Physiol. 2013, 227, 44–58. [Google Scholar] [CrossRef] [PubMed]
  5. Oury, T.D.; Sporn, T.A.; Roggli, V.L. Pathology of Asbestos-Associated Diseases, 3rd ed.; Springer: Heidelberg, Germany, 2014; p. 358. [Google Scholar]
  6. Wiewiora, A. Crystallochemical classifications of phyllosilicates based on the unified system of projection of chemical composition: III. The serpentine-kaolin group. Clay Miner. 1990, 25, 93–98. [Google Scholar] [CrossRef]
  7. Deer, W.A.; Howie, R.A.; Zussman, J. Double-Chain Silicates, 2nd ed.; The Geological Society: London, UK, 1997; 764p. [Google Scholar]
  8. Iezzi, G.; Della Ventura, G.; Bellatreccia, F.; Lomastro, S.; Bandli, B.R.; Gunter, M.E. Site occupancy in richterite-winchite from Libby, Montana USA, by FTIR spectroscopy. Mineral. Mag. 2007, 71, 93–104. [Google Scholar] [CrossRef]
  9. Gunter, M.E.; Belluso, E.; Mottana, A. Amphiboles: Environmental and health concerns. Rev. Mineral. Geochem. 2017, 67, 453–516. [Google Scholar] [CrossRef]
  10. Bozhilov, K.N. Structures and microstructures of non-classical pyriboles. EMU Notes Mineral. 2013, 14, 109–152. [Google Scholar]
  11. Plumlee, G.S.; Morman, S.A.; Ziegler, T.L. The toxicological geochemistry of Earth materials: An overview of processes and the interdisciplinary methods used to understand them. Rev. Mineral. Geochem. 2006, 64, 5–57. [Google Scholar] [CrossRef]
  12. Fubini, B.; Fenoglio, I. Toxic potential of mineral dusts. Elements 2007, 3, 407–414. [Google Scholar] [CrossRef]
  13. Roggli, V.L. The so-called short-fibre controversy. Literature review and critical analysis. Arch. Pathol. Lab. Med. 2015, 139, 1052–1057. [Google Scholar] [CrossRef] [PubMed]
  14. Bursi Gandolfi, N.; Gualtieri, A.F.; Pollastri, S.; Ribaldi, E.; Belpoggi, F. Assessment of asbestos body formation by high resolution FEG-SEM after exposure of Sprague-Dawley rats to chrysotile, crocidolite, or erionite. J. Hazard. Mater. 2016, 306, 95–104. [Google Scholar] [CrossRef] [PubMed]
  15. Belluso, E.; Cavallo, A.; Halterman, D. Crystal habit of mineral fibres. In Mineral Fibres: Crystal Chemistry, Chemical-Physical Properties, Biological Interaction and Toxicity; Gualtieri, A.F., Ed.; European Mineralogical Union: London, UK, 2017; Volume 18, pp. 65–110. [Google Scholar]
  16. Yao, S.; Iezzi, G.; Della Ventura, G.; Bellatreccia, F.; Petibois, C.; Marcelli, A.; Nazzari, M.; Lazzarin, F.; Di Gioacchino, M.; Petrarca, C. Mineralogy and textures of riebeckitic asbestos (crocidolite): The role of single versus agglomerated fibres in toxicological experiments. J. Hazard. Mater. 2017, 340, 472–485. [Google Scholar] [CrossRef] [PubMed]
  17. Hawthorne, F.C. Spectroscopic methods in Mineralogy and Geology. Rev. Mineral. 1988, 18, 698. [Google Scholar]
  18. Beran, A.; Libowitzky, E. Spectroscopic methods in Mineralogy. EMU Notes Mineral. 2004, 6, 661. [Google Scholar]
  19. Henderson, G.S.; Neuville, D.R.; Downs, R.T. Spectroscopic methods. Rev. Mineral. Geochem. 2014, 78, 800. [Google Scholar]
  20. Rinaudo, C.; Belluso, E.; Gastaldi, D. Assessment of the use of Raman spectroscopy for the determination of amphibole asbestos. Mineral. Mag. 2004, 68, 455–465. [Google Scholar] [CrossRef]
  21. Hawthorne, F.C.; Della Ventura, G. Short-range order in amphiboles. Rev. Mineral. Geochem. 2017, 67, 173–222. [Google Scholar] [CrossRef]
  22. Gottschalk, M.; Andrut, M.; Melzer, S. The determination of cummingtonite content of synthetic tremolite. Eur. J. Mineral. 1999, 11, 967–982. [Google Scholar] [CrossRef]
  23. Yao, S.; Chen, H.H.; Harte, E.; Della Ventura, G.; Petibois, C. The role of asbestos morphology on their cellular toxicity: An in vitro 3D Raman/Raley imaging study. Anal. Bioanal. Chem. 2013, 405, 8701–8707. [Google Scholar] [CrossRef] [PubMed]
  24. Della Ventura, G.; Marcelli, A.; Bellatreccia, F. SR-FTIR microscopy and FTIR imaging in the Earth Sciences. Rev. Mineral. Geochem. 2014, 78, 447–479. [Google Scholar] [CrossRef]
  25. Leissner, L.; Schlüter, J.; Horn, I.; Mihailova, B. Exploring the potential of Raman spectroscopy for crystallochemical analyses of complex hydrous silicates: I. Amphiboles. Am. Mineral. 2015, 100, 2682–2694. [Google Scholar] [CrossRef]
  26. Della Ventura, G. The analysis of asbestos minerals using vibrational spectroscopies (FTIR, Raman): Crystal Chemistry, identification and environmental applications. In Mineral Fibres: Crystal Chemistry, Chemical-Physical Properties, Biological Interaction and Toxicity; Gualtieri, A.F., Ed.; European Mineralogical Union: London, UK, 2017; Volume 18, pp. 135–169. [Google Scholar]
  27. Lewis, I.R.; Chaffin, N.C.; Gunter, M.E.; Griffiths, P.R. Vibrational spectroscopic studies of asbestos and comparison of suitability for remote analysis. Spectroch. Acta A 1996, 52, 315–328. [Google Scholar] [CrossRef]
  28. Hawthorne, F.C.; Oberti, R. Amphiboles: Crystal Chemistry. Rev. Mineral. Geochem. 2007, 67, 1–54. [Google Scholar] [CrossRef]
  29. Wang, A.; Dhamelincourt, P.; Turrell, G. Raman and infrared spectroscopic investigation of the cation distributions in amphiboles. J. Mol. Struct. 1988, 175, 183–188. [Google Scholar] [CrossRef]
  30. Sbroscia, M.; Della Ventura, G.; Iezzi, G.; Sodo, A. Quantifying the A-site occupancy in amphiboles: A Raman study in the OH-stretching region. Eur. J. Mineral. 2018, in press. [Google Scholar] [CrossRef]
  31. Hawthorne, F.C.; Grundy, H.D. The crystal chemistry of the amphiboles. IV. X-ray and neutron refinements of the crystal structure of tremolite. Can. Mineral. 1976, 14, 334–345. [Google Scholar]
  32. Hawthorne, F.C.; Della Ventura, G.; Oberti, R.; Robert, J.-L.; Iezzi, G. Short-range order in minerals: Amphiboles. Can. Mineral. 2005, 43, 1895–1920. [Google Scholar] [CrossRef]
  33. Della Ventura, G.; Mottana, A.; Caprilli, E.; Bellatreccia, F.; De Benedetti, A. Asbestiform tremolite within the late pyroclastic deposits of the Alban Hills volcano (Latium, Italy): FTIR spectroscopy and crystal chemistry. Rendiconti Accademia Lincei 2014, 25, 229–236. [Google Scholar]
  34. Pollastri, S. Crystal Chemistry and Physical-Chemical Characterization of Mineral Fibres Aimed at Understanding Their Toxicity Potential. Unpublished. Ph.D. Thesis, University of Modena and Reggio Emilia, Modena, Italy, March 2016. [Google Scholar]
  35. Pollastri, S.; Perchiazzi, N.; Gigli, L.; Ferretti, P.; Cavallo, A.; Gandolf, N.B.; Pollok, K.; Gualtieri, A.F. The crystal structure of mineral fibres. 2. Amosite and fibrous anthophyllite. Period. Mineral. 2017, 86, 55–63. [Google Scholar]
  36. Welch, M.D.; Cámara, F.; Oberti, R. Thermoelasticity and high-T behaviour of anthophyllite. Phys. Chem. Miner. 2011, 38, 321–334. [Google Scholar] [CrossRef]
  37. Pollastri, S.; Gualtieri, A.F.; Gualtieri, M.L.; Hanuskova, M.; Cavallo, A.; Gaudino, G. The zeta potential of mineral fibres. J. Hazard. Mater. 2014, 276, 469–679. [Google Scholar] [CrossRef] [PubMed]
  38. Pollastri, S.; D’Acapito, F.; Trapananti, A.; Colantoni, I.; Andreozzi, G.B.; Gualtieri, A.F. The chemical environment of iron in mineral fibres. A combined X-ray absorption and Mössbauer spectroscopic study. J. Hazard. Mater. 2015, 298, 282–293. [Google Scholar] [CrossRef] [PubMed]
  39. Della Ventura, G.; Mihailova, B.; Susta, U.; Guidi, M.C.; Marcelli, A.; Schlüter, J.; Oberti, R. The dynamics of Fe oxidation in riebeckite: A model for amphiboles. Am. Mineral. 2018, 103, 1103–1111. [Google Scholar] [CrossRef]
  40. Pacella, A.; Andreozzi, G.B.; Ballirano, P.; Gianfagna, A. Crystal chemical and structural characterization of fibrous tremolite from Ala di Stura (Lanzo Valley, Italy). Period. Mineral. 2008, 77, 51–62. [Google Scholar]
  41. Pollastri, S.; Gigli, L.; Ferretti, P.; Andreozzi, G.B.; Gandolfi, N.B.; Pollok, K.; Gualtieri, A.F. The crystal structure of mineral fibres. 3. Actinolite asbestos. Period. Mineral. 2017, 86, 89–98. [Google Scholar]
  42. Hawthorne, F.C.; Oberti, R.; Harlow, G.E.; Maresch, W.V.; Martin, R.F.; Schumacher, J.C.; Welch, M.D. Nomenclature of the amphibole supergroup. Am. Mineral. 2012, 97, 2031–2048. [Google Scholar] [CrossRef]
  43. Ross, M. The geological occurrences and health hazards of amphibole and serpentine asbestos. Rev. Mineral. 1981, 9, 279–323. [Google Scholar]
  44. Fantauzzi, M.; Pacella, A.; Atzei, D.; Gianfagna, A.; Andreozzi, G.B.; Rossi, A. Combined use of X-ray photoelectron and Mössbauer spectroscopic techniques in the analytical characterization of iron oxidation state in amphibole asbestos. Anal. Bioanal. Chem. 2010, 396, 2889–2898. [Google Scholar] [CrossRef] [PubMed]
  45. Ishida, K. Identification of infrared OH librational bands of talc-willemseite solid-solutions and Al(VI)-free amphiboles through deuteration. Miner. J. 1990, 15, 93–104. [Google Scholar] [CrossRef]
  46. Ishida, K. Cation disordering in heat-treated anthophyllites through oxidation and dehydrogenation. Phys. Chem. Miner. 1998, 25, 160–167. [Google Scholar] [CrossRef]
  47. Ishida, K.; Hawthorne, F.C. Fine structure of infrared OH-stretching bands of holmquistite and anthophyllite. Phys. Chem. Miner. 2003, 30, 330–336. [Google Scholar] [CrossRef]
  48. Hirschmann, M.; Evans, B.W.; Yang, H. Composition and temperature dependence of Fe-Mg ordering in cummingtonite-grunerite as determined by X-ray diffraction. Am. Mineral. 1994, 79, 862–877. [Google Scholar]
  49. Yang, H.; Hirschmann, M.M. Crystal structure of P21/m ferromagnesian amphibole and the role of cation ordering and composition in the P21/m-C2/m transition in cummingtonite. Am. Mineral. 1995, 80, 916–922. [Google Scholar] [CrossRef]
  50. Boffa Ballaran, T.; Carpenter, M.A.; Domeneghetti, M.C. Phase transition and mixing behaviour of the cummingtonite-grunerite solid solution. Phys. Chem. Miner. 2001, 28, 87–101. [Google Scholar]
  51. Iezzi, G.; Della Ventura, G.; Cámara, F.; Pedrazzi, G.; Robert, J.L. BNa-BLi solid-solution in A-site-vacant amphiboles: Synthesis and cation ordering along the ferri-clinoferroholmquistite-riebeckite join. Am. Mineral. 2003, 88, 955–961. [Google Scholar] [CrossRef]
  52. Iezzi, G.; Della Ventura, G.; Tribaudino, M. Synthetic P21/m amphiboles in the system Li2O-Na2O-MgO-SiO2-H2O (LNMSH). Am. Mineral. 2006, 91, 425–429. [Google Scholar] [CrossRef]
  53. Della Ventura, G.; Bellatreccia, F.; Iezzi, G.; Oberti, R.; Camara, F. The P21/m-C2/m phase transition in synthetic amphiboles in the system Li2O-Na2O-MgO-SiO2-H2O: A high-T FTIR study. Eur. J. Mineral. 2008, 20, 1019–1026. [Google Scholar] [CrossRef]
  54. Ross, M.; Papike, J.J.; Weiblen, P.W. Exsolution in clinoamphiboles. Science 1968, 159, 1099–1102. [Google Scholar] [CrossRef] [PubMed]
  55. Prewitt, C.T.; Papike, J.J.; Ross, M. Cummingtonite: A reversible, nonquenchable transition from P21/m to C2/m symmetry. Earth Planet. Sci. Lett. 1970, 8, 448–450. [Google Scholar] [CrossRef]
  56. Dreyer, C.J.B.; Robinson, H.A. The Occurrence and Exploitation of Amphibole Asbestos in South Africa; Preprint No. 78-H-64; Society of Mining Engineers; AIME: Salt Iake City, UT, USA, 1978; pp. 1–21. [Google Scholar]
  57. Iezzi, G.; Della Ventura, G.; Hawthorne, F.C.; Pedrazzi, G.; Robert, J.-L.; Novembre, D. The (Mg,Fe2+) substitution in ferri-clinoholmquistite, □Li2(Mg,Fe2+)3Fe3+2Si8O22(OH)2. Eur. J. Mineral. 2005, 17, 733–740. [Google Scholar] [CrossRef]
  58. Della Ventura, G.; Iezzi, G.; Redhammer, G.J.; Hawthorne, F.C.; Scaillet, B.; Novembre, D. Synthesis and crystal-chemistry of amphiboles along the magnesioriebeckite—Magnesio-arfvedsonite series as a function of fO2. Am. Mineral. 2005, 90, 1375–1383. [Google Scholar] [CrossRef]
  59. Strens, G.J. Infrared study of cation ordering and clustering in some (Fe,Mg) amphibole solid solutions. Chem. Commun. 1966, 519b–520. [Google Scholar] [CrossRef]
  60. Burns, R.G.; Strens, R.G.J. Infrared study of the hydroxyl bands in clinoamphiboles. Science 1966, 153, 890–892. [Google Scholar] [CrossRef] [PubMed]
  61. Hawthorne, F.C.; Della Ventura, G.; Robert, J.-L. Short-range order and long-range order in amphiboles: A model for the interpretation of infrared spectra in the principal OH-stretching region. Geochim. Cosmochim. Acta 1996, 5, 49–54. [Google Scholar]
  62. Della Ventura, G.; Robert, J.-L.; Hawthorne, F.C. Infrared spectroscopy of synthetic (Ni,Mg,Co)-potassium-richterite. Geochim. Cosmochim. Acta 1996, 5, 55–63. [Google Scholar]
  63. Della Ventura, G.; Robert, J.L.; Raudsepp, M.; Hawthorne, F.C.; Welch, M.D. Site occupancies in synthetic monoclinic amphiboles: Rietveld structure refinement and infrared spectroscopy of (nickel, magnesium, cobalt)-richterite. Am. Mineral. 1997, 82, 291–301. [Google Scholar] [CrossRef]
  64. Della Ventura, G.; Redhammer, G.J.; Robert, J.L.; Sergent, J.; Iezzi, G. Crystal-chemistry of synthetic amphiboles along the richterite-ferro-richterite join: A combined spectroscopic (FTIR, Mössbauer), XRPD, and microchemical study. Can. Mineral. 2016, 54, 97–114. [Google Scholar] [CrossRef]
  65. Iezzi, G.; Cámara, F.; Della Ventura, G.; Oberti, R.; Pedrazzi, G.; Robert, J.-L. Synthesis, crystal structure and crystal-chemistry of ferri-clinoholmquistite, □Li2Mg3Fe3+2Si8O22(OH)2. Phys. Chem. Mineral. 2004, 31, 375–385. [Google Scholar] [CrossRef]
  66. Vignaroli, G.; Rossetti, F.; Belardi, G.; Billi, A. Linking rock fabric to fibrous mineralisation: A basic tool for the asbestos hazard. Nat. Hazards Earth Syst. Sci. 2011, 11, 1267–2011. [Google Scholar] [CrossRef] [Green Version]
  67. Vignaroli, G.; Ballirano, P.; Belardi, G.; Rossetti, F. Asbestos fibre identification vs. evaluation of asbestos hazard in ophiolitic rock mélanges, a case study from the Ligurian Alps (Italy). Environ. Earth Sci. 2014. [Google Scholar] [CrossRef]
  68. Lazarev, A.N. Vibrational Spectra and Structure of Silicates; Consultants Bureau (Plenum Publishing Company Ltd.): New York, NY, USA; London, UK, 1972; 302p. [Google Scholar]
  69. Andrut, M.; Gottschalk, M.; Melzer, S.; Najorka, J. Lattice vibrational modes in synthetic tremolite-Sr-tremolite and tremolite-richterite solid solutions. Phys. Chem. Miner. 2000, 27, 301–309. [Google Scholar] [CrossRef]
  70. Hofmeister, A.M.; Bowey, J.E. Quantitative infrared spectra of hydrosilicates and related minerals. Mon. Not. R. Astron. Soc. 2006, 367, 577–591. [Google Scholar] [CrossRef]
  71. Ishida, K. Infrared spectra of alkali amphiboles of glaucophane–riebeckite series and their relation to chemical composition. Mineral. J. 1990, 15, 147–161. [Google Scholar] [CrossRef]
  72. Ishida, K.; Jenkins, D.M.; Hawthorne, F.C. Mid-IR bands of synthetic calcic amphiboles of tremolite-pargasite series and of natural calcic amphiboles. Am. Mineral. 2008, 93, 1112–1118. [Google Scholar] [CrossRef]
  73. Bard, D.; Yarwood, J.; Tylee, B. Asbestos fibre identification by Raman microspectroscopy. J. Raman Spectrosc. 1997, 28, 803–809. [Google Scholar] [CrossRef]
  74. Blaha, J.J.; Rosasco, G.J. Raman microprobe spectra of individual microcrystals and fibers of talc, tremolite, and related silicate minerals. Anal. Chem. 1978, 50, 892–896. [Google Scholar] [CrossRef]
  75. Rinaudo, C.; Gastaldi, D.; Belluso, E.; Capella, S. Application of Raman Spectroscopy on asbestos fibre identification. Neues Jahrbuch für Mineralogie-Abhandlungen 2005, 182, 31–36. [Google Scholar] [CrossRef]
  76. Rinaudo, C.; Cairo, S.; Gastaldi, D.; Gianfagna, A.; Mazziotti Tagliani, S.; Tosi, G.; Conti, C. Characterization of fluoro-edenite by µ-Raman and µ-FTIR spectroscopy. Mineral. Mag. 2006, 70, 291–298. [Google Scholar] [CrossRef]
  77. Rinaudo, C.; Allegrina, M.; Fornero, E.; Musa, M.; Croce, A.; Belli, D. Micro-Raman spectroscopy and VP-SEM/EDS applied to the identification of mineral particles and fibres in histological sections. J. Raman Spec. 2009, 41, 27–32. [Google Scholar] [CrossRef]
  78. Rinaudo, C.; Croce, A.; Musa, M.; Fornero, E.; Allegrina, M.; Trivero, P.; Bellis, D.; Sferch, D.; Toffalorio, F.; Veronesi, G.; et al. Study of inorganic particles, fibers, and asbestos bodies by variable pressure scanning electron microscopy with annexed energy dispersive spectroscopy and micro-raman spectroscopy in thin sections of lung and pleural plaque. Appl. Spectrosc. 2010, 64, 571–577. [Google Scholar] [CrossRef] [PubMed]
  79. Campopiano, A.; Olori, A.; Cannizzaro, A.; Iannò, A.; Capone, P.P. Quantification of Tremolite in Friable Material Coming from Calabrian Ophiolitic Deposits by Infrared Spectroscopy. J. Spectrosc. 2015. [Google Scholar] [CrossRef]
  80. Della Ventura, G.; Robert, J.L.; Beny, J.M. Tetrahedrally coordinated Ti4+ in synthetic Ti-rich potassic richterite: Evidence from XRD, FTIR, and Raman studies. Am. Mineral. 1991, 76, 1134–1140. [Google Scholar]
  81. Apopei, A.I.; Buzgar, N. The Raman study of amphiboles. Analele Stiintifice de Univ. AI Cuza din Iasi. Sect. 2 Geol. 2010, 56, 57–83. [Google Scholar]
  82. Oberti, R.; Boiocchi, M.; Zema, M.; Hawthorne, F.C.; Redhammer, G.J.; Susta, U.; Della Ventura, G. The high-temperature behaviour of riebeckite: Expansivity, deprotonation, selective Fe oxidation and a novel cation disordering scheme for amphiboles. Eur. J. Mineral. 2018, in press. [Google Scholar] [CrossRef]
Figure 1. (a) Local octahedral configuration around the OH group in amphiboles. (b) Schematic representation of part of the double-chain of tetrahedra in amphiboles. Ob = bridging oxygen, Onb = non bridging oxygen.
Minerals 08 00413 g001
Figure 2. UICC standard anthophyllite Finnish NB #4173-111-5 sample (Table 1). Representative FEG-ESEM images at relatively low (a) and high (b) magnification, where a platy talc particle (red arrow) is visible. (c) High-resolution TEM image highlighting edge features of the fiber viewed along the c axis, and (d) SAED pattern parallel to the c* axis.
Minerals 08 00413 g002
Figure 3. FTIR OH-stretching spectra of the studied UICC standard anthophyllite Finnish NB #4173-111-5 compared to sample MNHN29_120 and anthophyllite AMNH34856.
Minerals 08 00413 g003
Figure 4. UICC amosite from South Africa NB #4173-111-4 (Table 1). Representative FEG-ESEM images at relatively low (a) and high (b) magnifications. (c) HR-TEM image documenting a limited-extent amorphous cover layer, and (d) SAED pattern parallel to the c* axis.
Minerals 08 00413 g004
Figure 5. FTIR OH-stretching spectra of the studied amphiboles (Table 1): UICC amosite from South African NB #4173-111-4, UICC crocidolite NB#4173-111-3, tremolite from Val d’Ala, and actinolite from Valle Aurina.
Minerals 08 00413 g005
Figure 6. UICC crocidolite NB#4173-111-3 (Table 1). (a) Representative FEG-ESEM image of the typical texture of the sample at high magnification. (b) HRTEM image with Moiré fringes. (c) HRTEM image showing a transition region from a highly crystalline area (streaking along c is clearly visible) to a nearly amorphous boundary. (d) Representative SAED pattern parallel to the c* axis.
Minerals 08 00413 g006
Figure 7. (a) Representative FEG-ESEM images of the typical appearance of tremolite from Val d’Ala, Turin (Italy) (Table 1). (b) TEM medium high-resolution images displaying cleavage fragments that were detaching from the main fibre, with disoriented Moiré fringes. (c) HRTEM image showing highly irregular edge features. (d) Representative SAED pattern oriented parallel to the c* axis.
Minerals 08 00413 g007
Figure 8. FTIR spectrum of UICC anthophyllite in the low-frequency (1300–400 cm−1) region. The asterisks indicate the main bands of talc [45].
Minerals 08 00413 g008
Figure 9. Stacked FTIR spectra in the low-frequency (1300–400 cm−1) region for the amphiboles investigated in this study (see Table 1).
Minerals 08 00413 g009
Table 1. Studied samples.
Amphibole SpeciesProvenanceReference
AnthophylliteUICC standard Anthophyllite
from Paakkila, NB #4173-111-5
[34,35]
AnthophylliteAMNH34856, Talcville,
New York State (USA)
[36]
AnthophylliteMNHN 29_102Della Ventura, unpublished
AmositeUICC standard Amosite
South African NB #4173-111-4
[34,35]
CrocidoliteUICC standard Crocidolite
South African NB #4173-111-3
[34,37,38]
CrocidoliteMadagascar[39]
TremoliteVal d’Ala, Turin (Italy)[34,40]
ActinoliteValle Aurina (Bolzano, Italy)[41]
Table 2. XRD data for the studied reference amphiboles.
Samplea (Å)b (Å)c (Å)β (°)Space GroupRef.
Anthophyllite UICC18.5770(8)18.0353(22)5.27285(9)90Pnma[35]
Amosite UICC9.5484(2)18.3395(4)5.3346(1)101.825(2)C2/m[35]
Crocidolite UICC9.73238(7)18.0414(1)5.32794(4)103.515(1)C2/m[34]
Tremolite Ala9.8424(1)18.0712(2)5.28354(7)104.680(1)C2/m[40]
Actinolite Aurina9.84896(4)18.07748(8)5.28860(2)104.817(2)C2/m[41]
Table 3. Microchemical data for the studied reference amphiboles. * Partition determined from Mössbauer spectroscopy [44].
SampleAnthophyllite UICCAmosite UICCCrocidolite UICCTremoliteActinolite
reference[35][35][34][40][41]
SiO257.3(4)49.8(2)51.7(3)57.8(1)54.83(5)
TiO20.02(2)0.04(2)0.03(3)0.02(2)0.04(9)
Al2O30.11(5)0.04(2)0.12(4)0.11(7)2.70(6)
FeO9.9(7)37.8(4)17.3(9) *2.4(4) *6.76(5)
Fe2O30.03.3(4)18.7(9) *0.3(4) *1.01(5)
Cr2O30.04(3)0.01(1)0.01(1)0.02(2)0.08(9)
NiO0.04(4)0.02(4)0.01(2)0.08(5)0.18(2)
MnO0.4(1)0.42(6)0.04(2)0.15(5)0.40(7)
MgO28.5(2)6.23(9)2.3(4)22.8(2)18.21(3)
CaO0.27(7)0.09(1)0.22(7)12.9(1)12.77(6)
Na2O0.02(1)0.03(2)6.7(2)0.23(6)0.48(6)
K2O0.02(1)0.02(1)0.05(4)0.05(2)0.13(3)
H2O2.301.942.182.022.47
Total98.9299.7499.3698.88100.06
Table 4. Peak positions (cm−1) and band assignment (according to 71) for the studied amphiboles in the low-wavenumber (<1200 cm−1) range.
Anthophyllite 29_102Amosite UICCCrocidolite UICCTremoliteActinoliteAssignment
11261128114211051102Region 1
Si–O–Si, O–Si–O and Si–O stretching modes
11061082110510591058
10951020104810381038
1058997101710151012
1026969990995993
1008888976953952
978 896921919
910 878
898
781797778757756Region 2
chain deformations and OH libration modes
755775726738736
736729693724724
709700655685684
688654634661661
657635 642642
530528543543540Region 3
M–O modes
495499506526508
480479450508463
463424 465446
440 445

