Effect of H2O2 on the Separation of Mo-Bi-Containing Ore by Flotation


Abstract
:1. Introduction
2. Materials and Methods
2.1. Samples and Reagents
2.1.1. Samples
2.1.2. Reagents
2.2. Batch Flotation Experiments
2.3. Thermodynamic Calculations
2.4. Flotation Kinetics Model
2.5. X-ray Photoelectron Spectroscopy
3. Results and Discussion
3.1. Flotation Performances
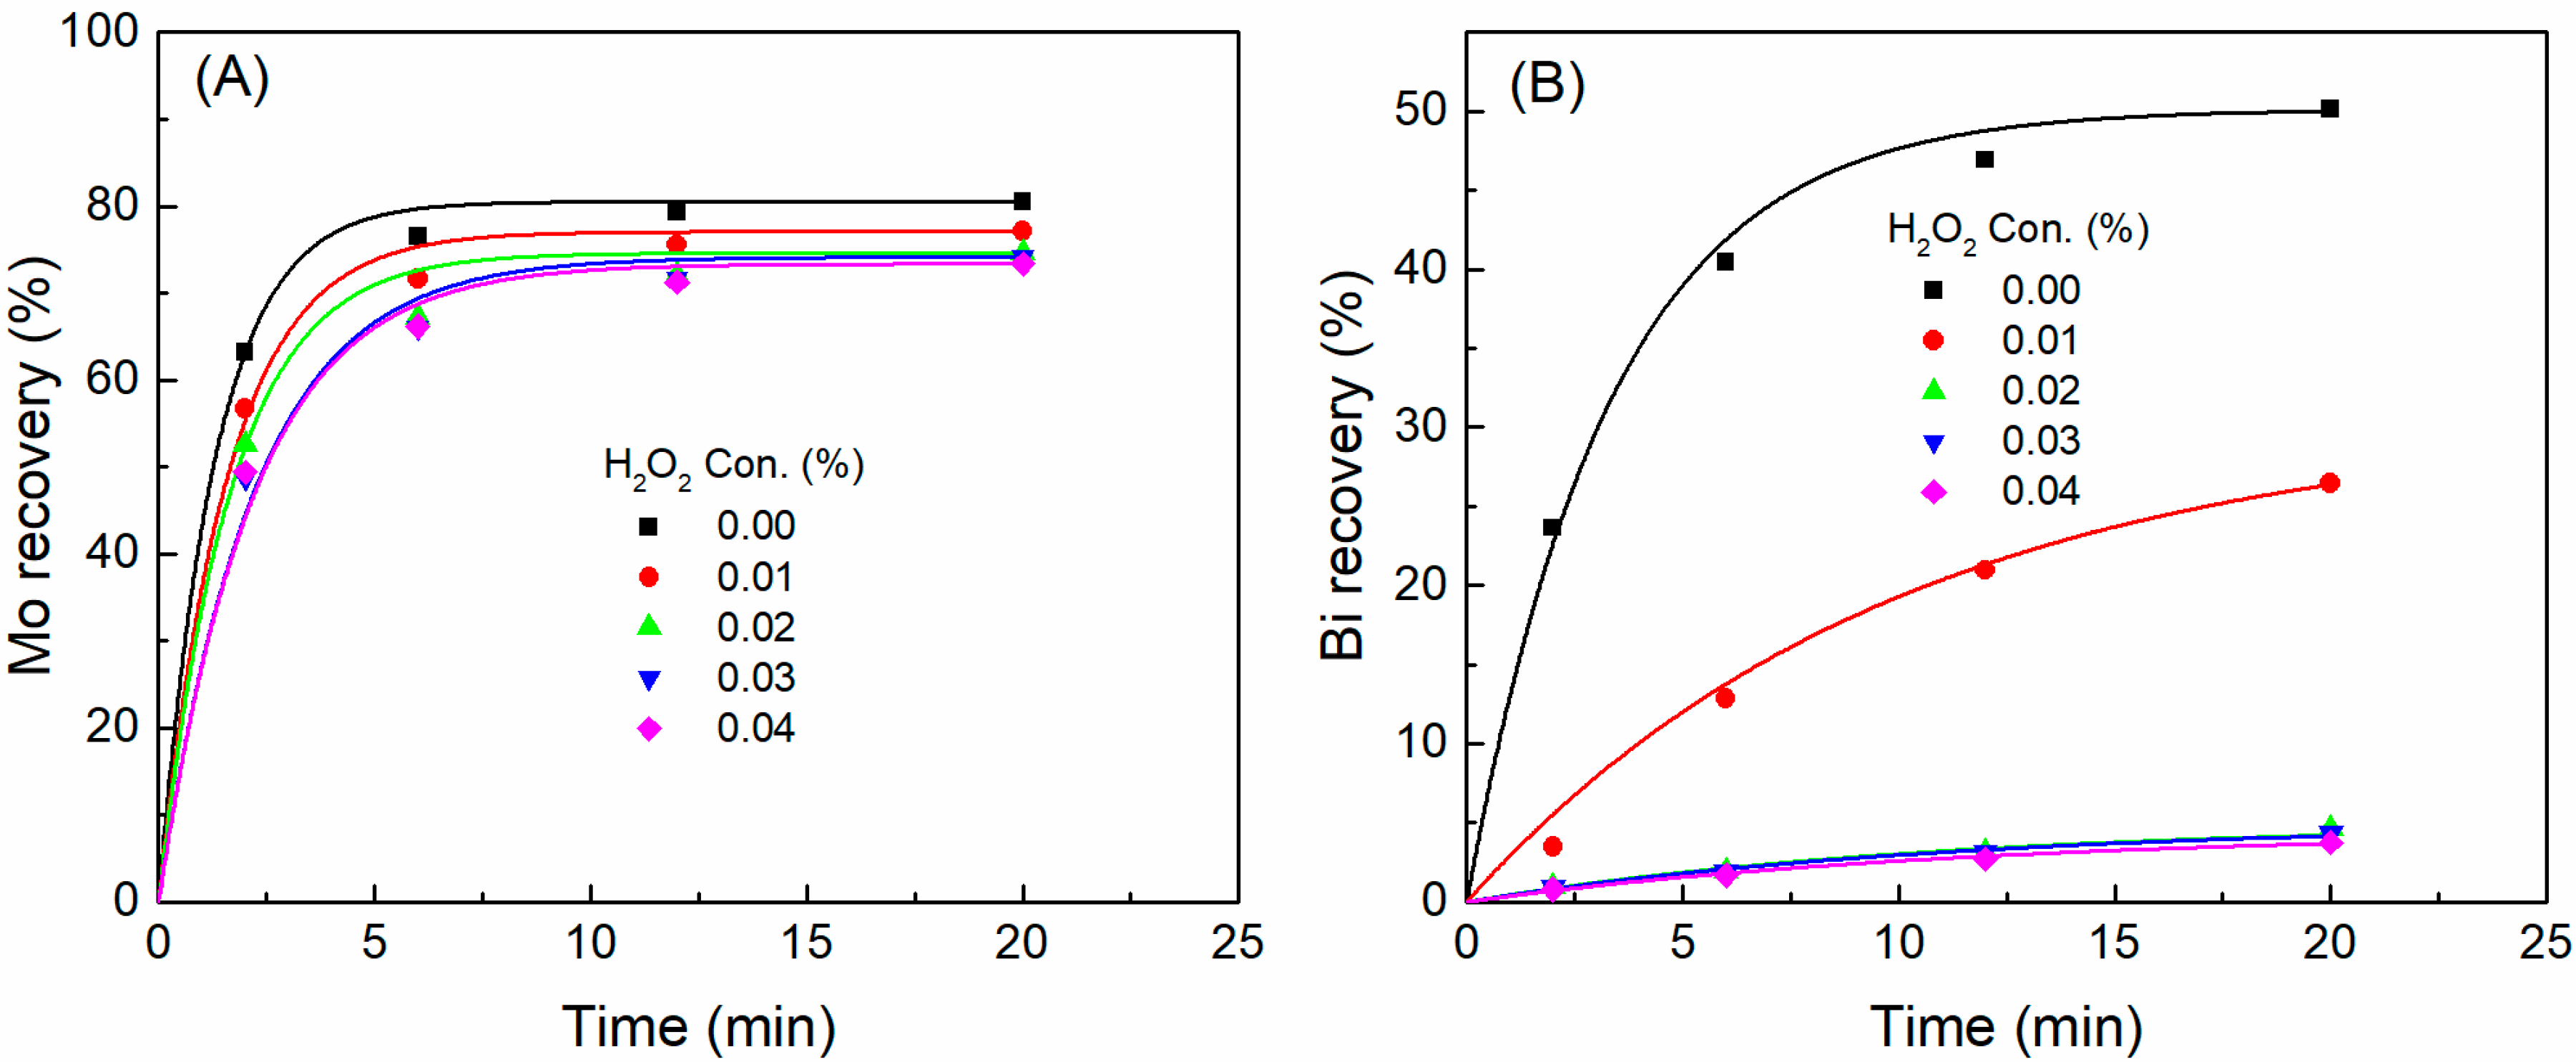
3.2. Flotation Kinetics
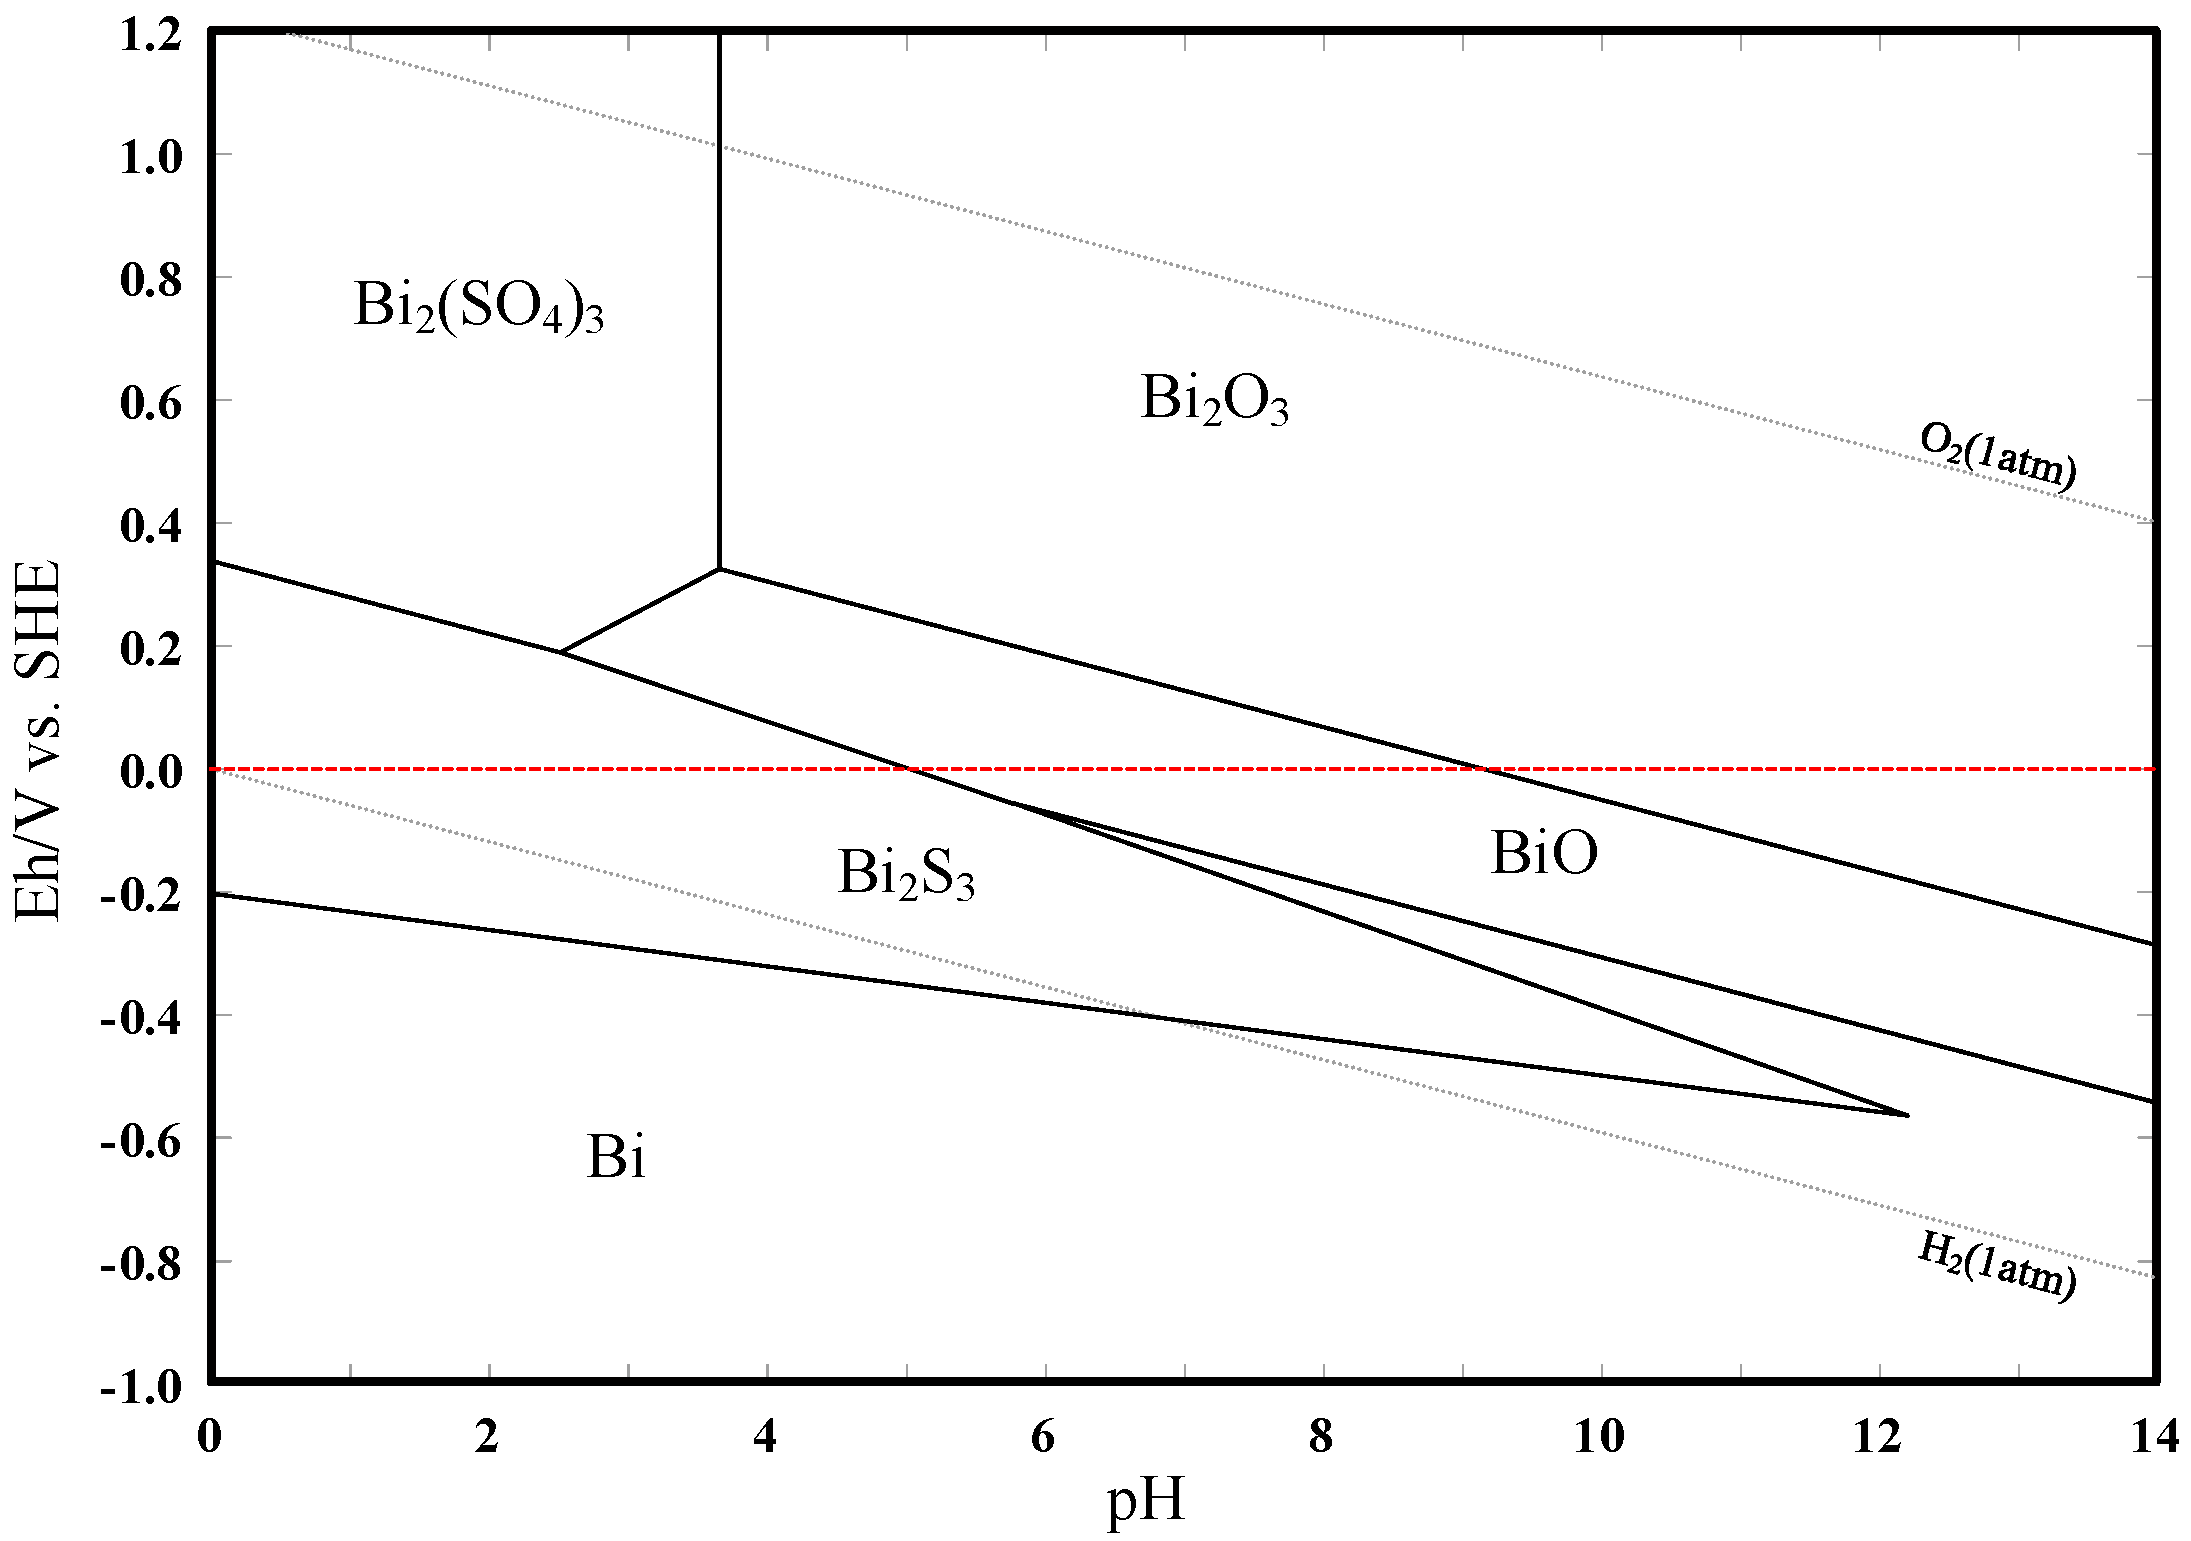
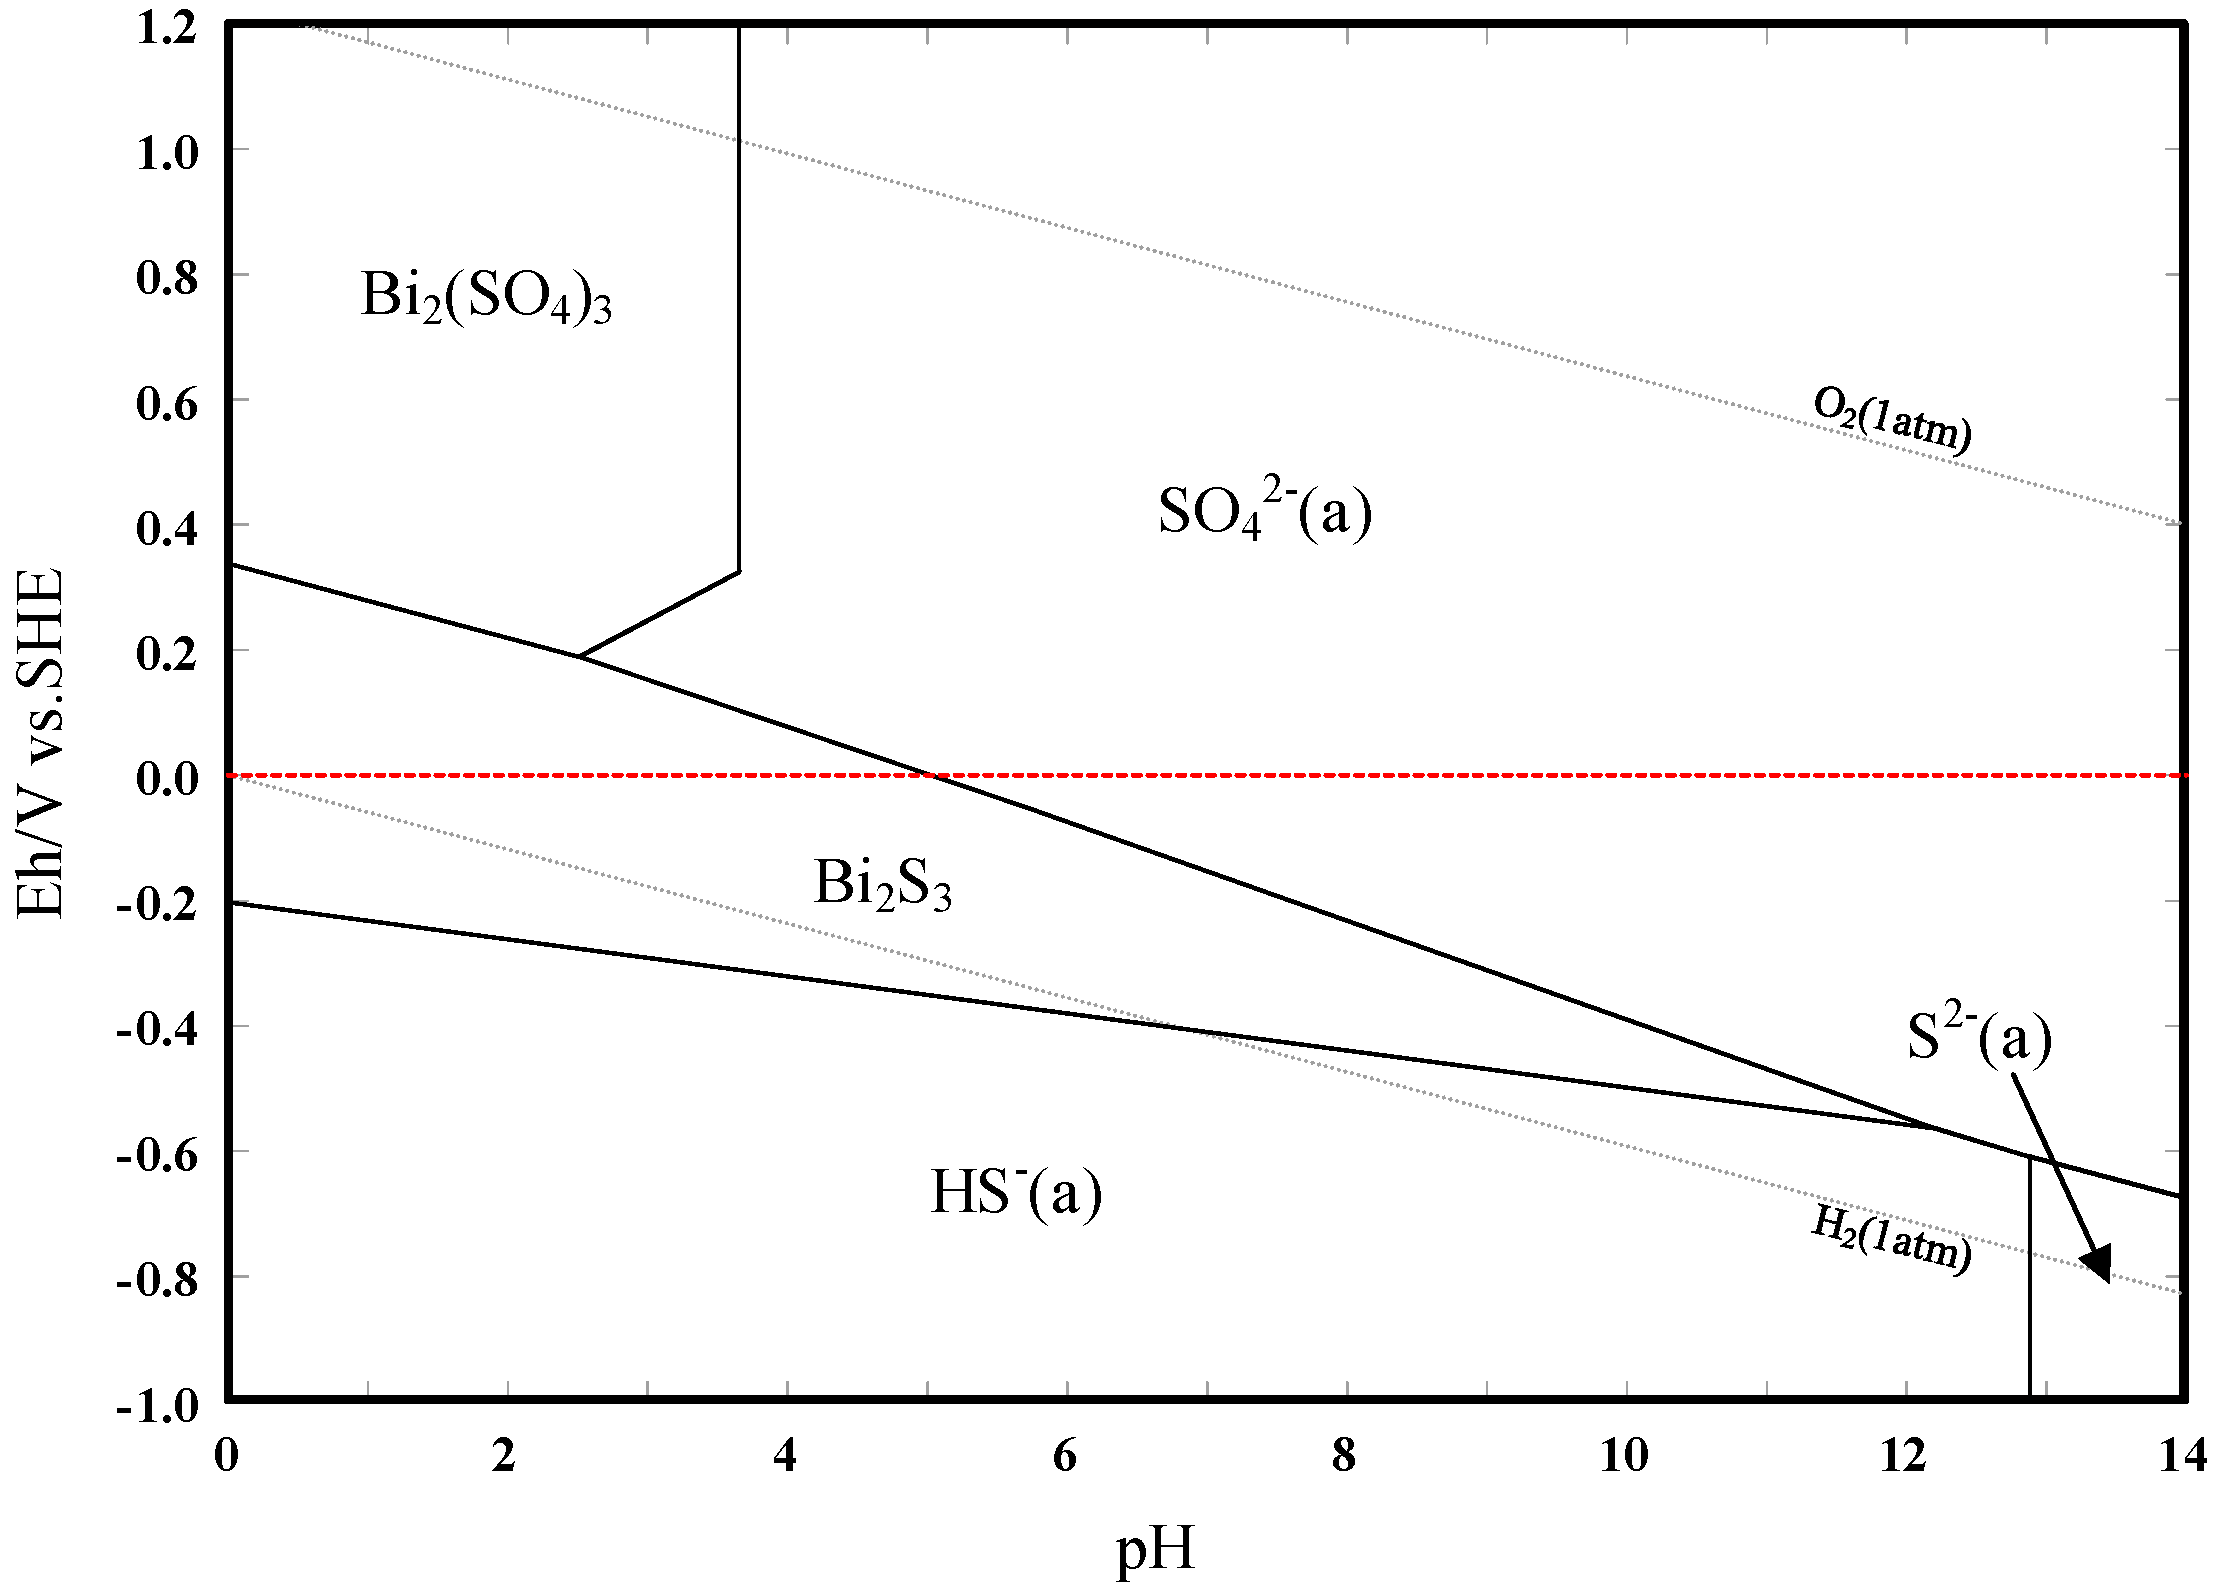
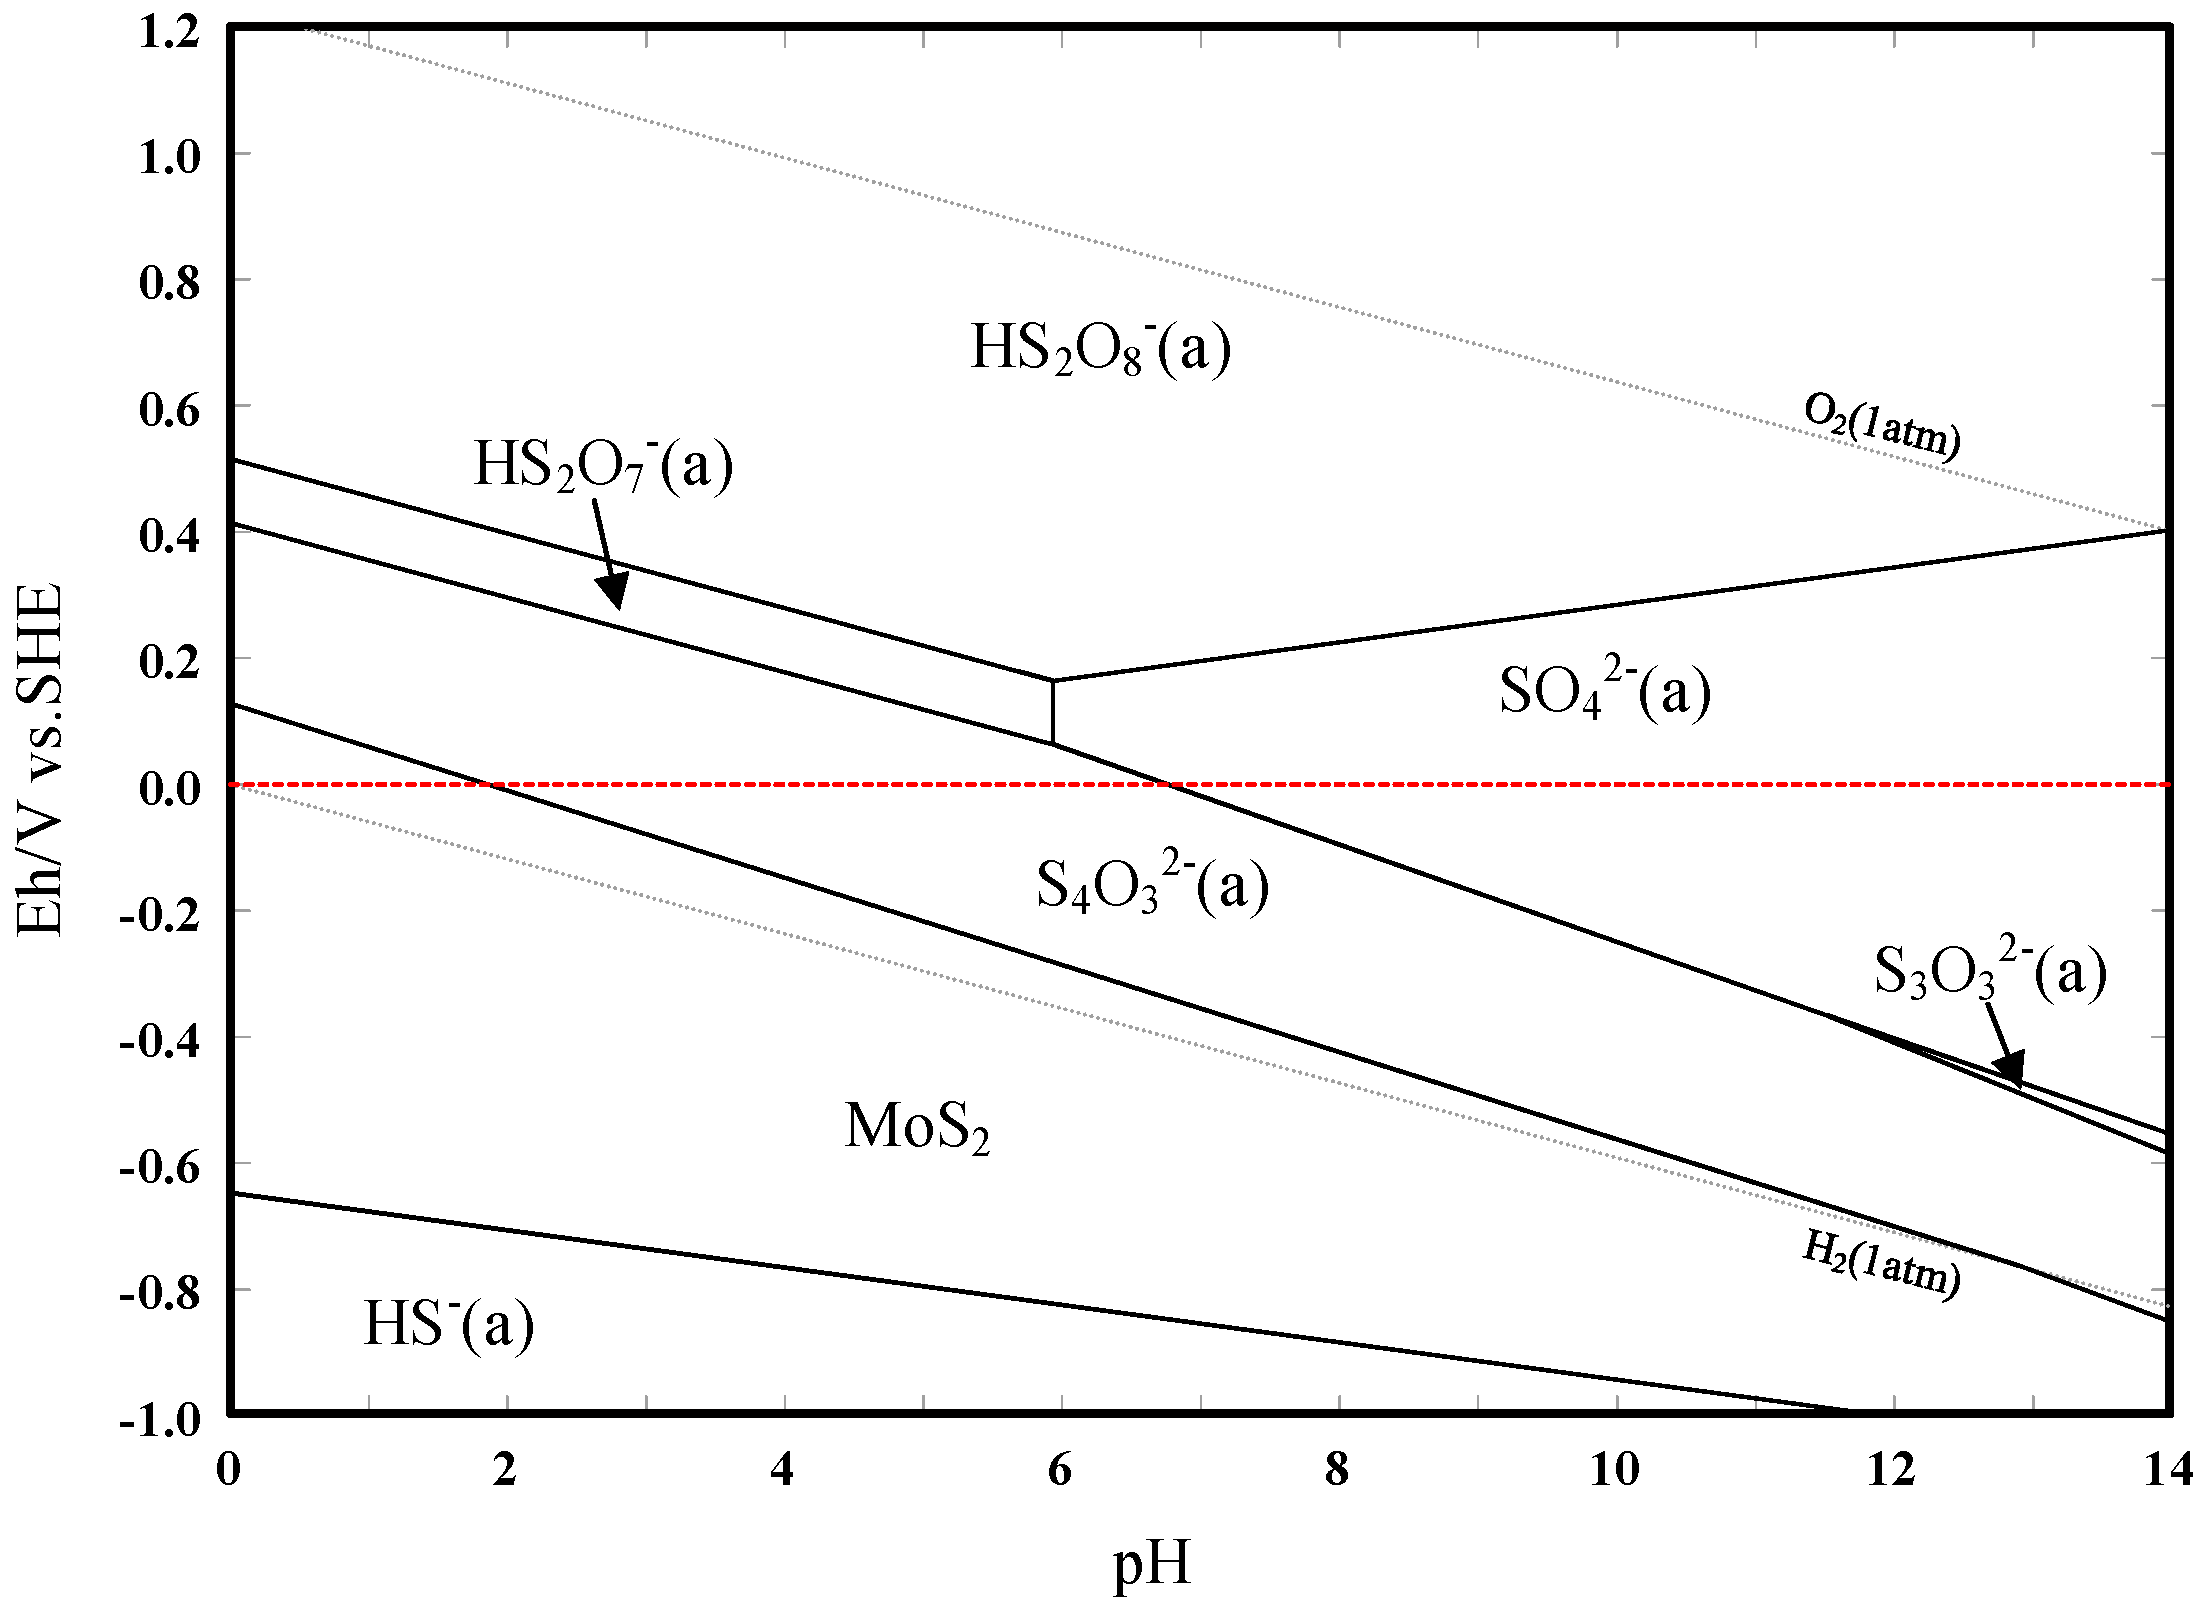
3.3. Eh–pH Diagram
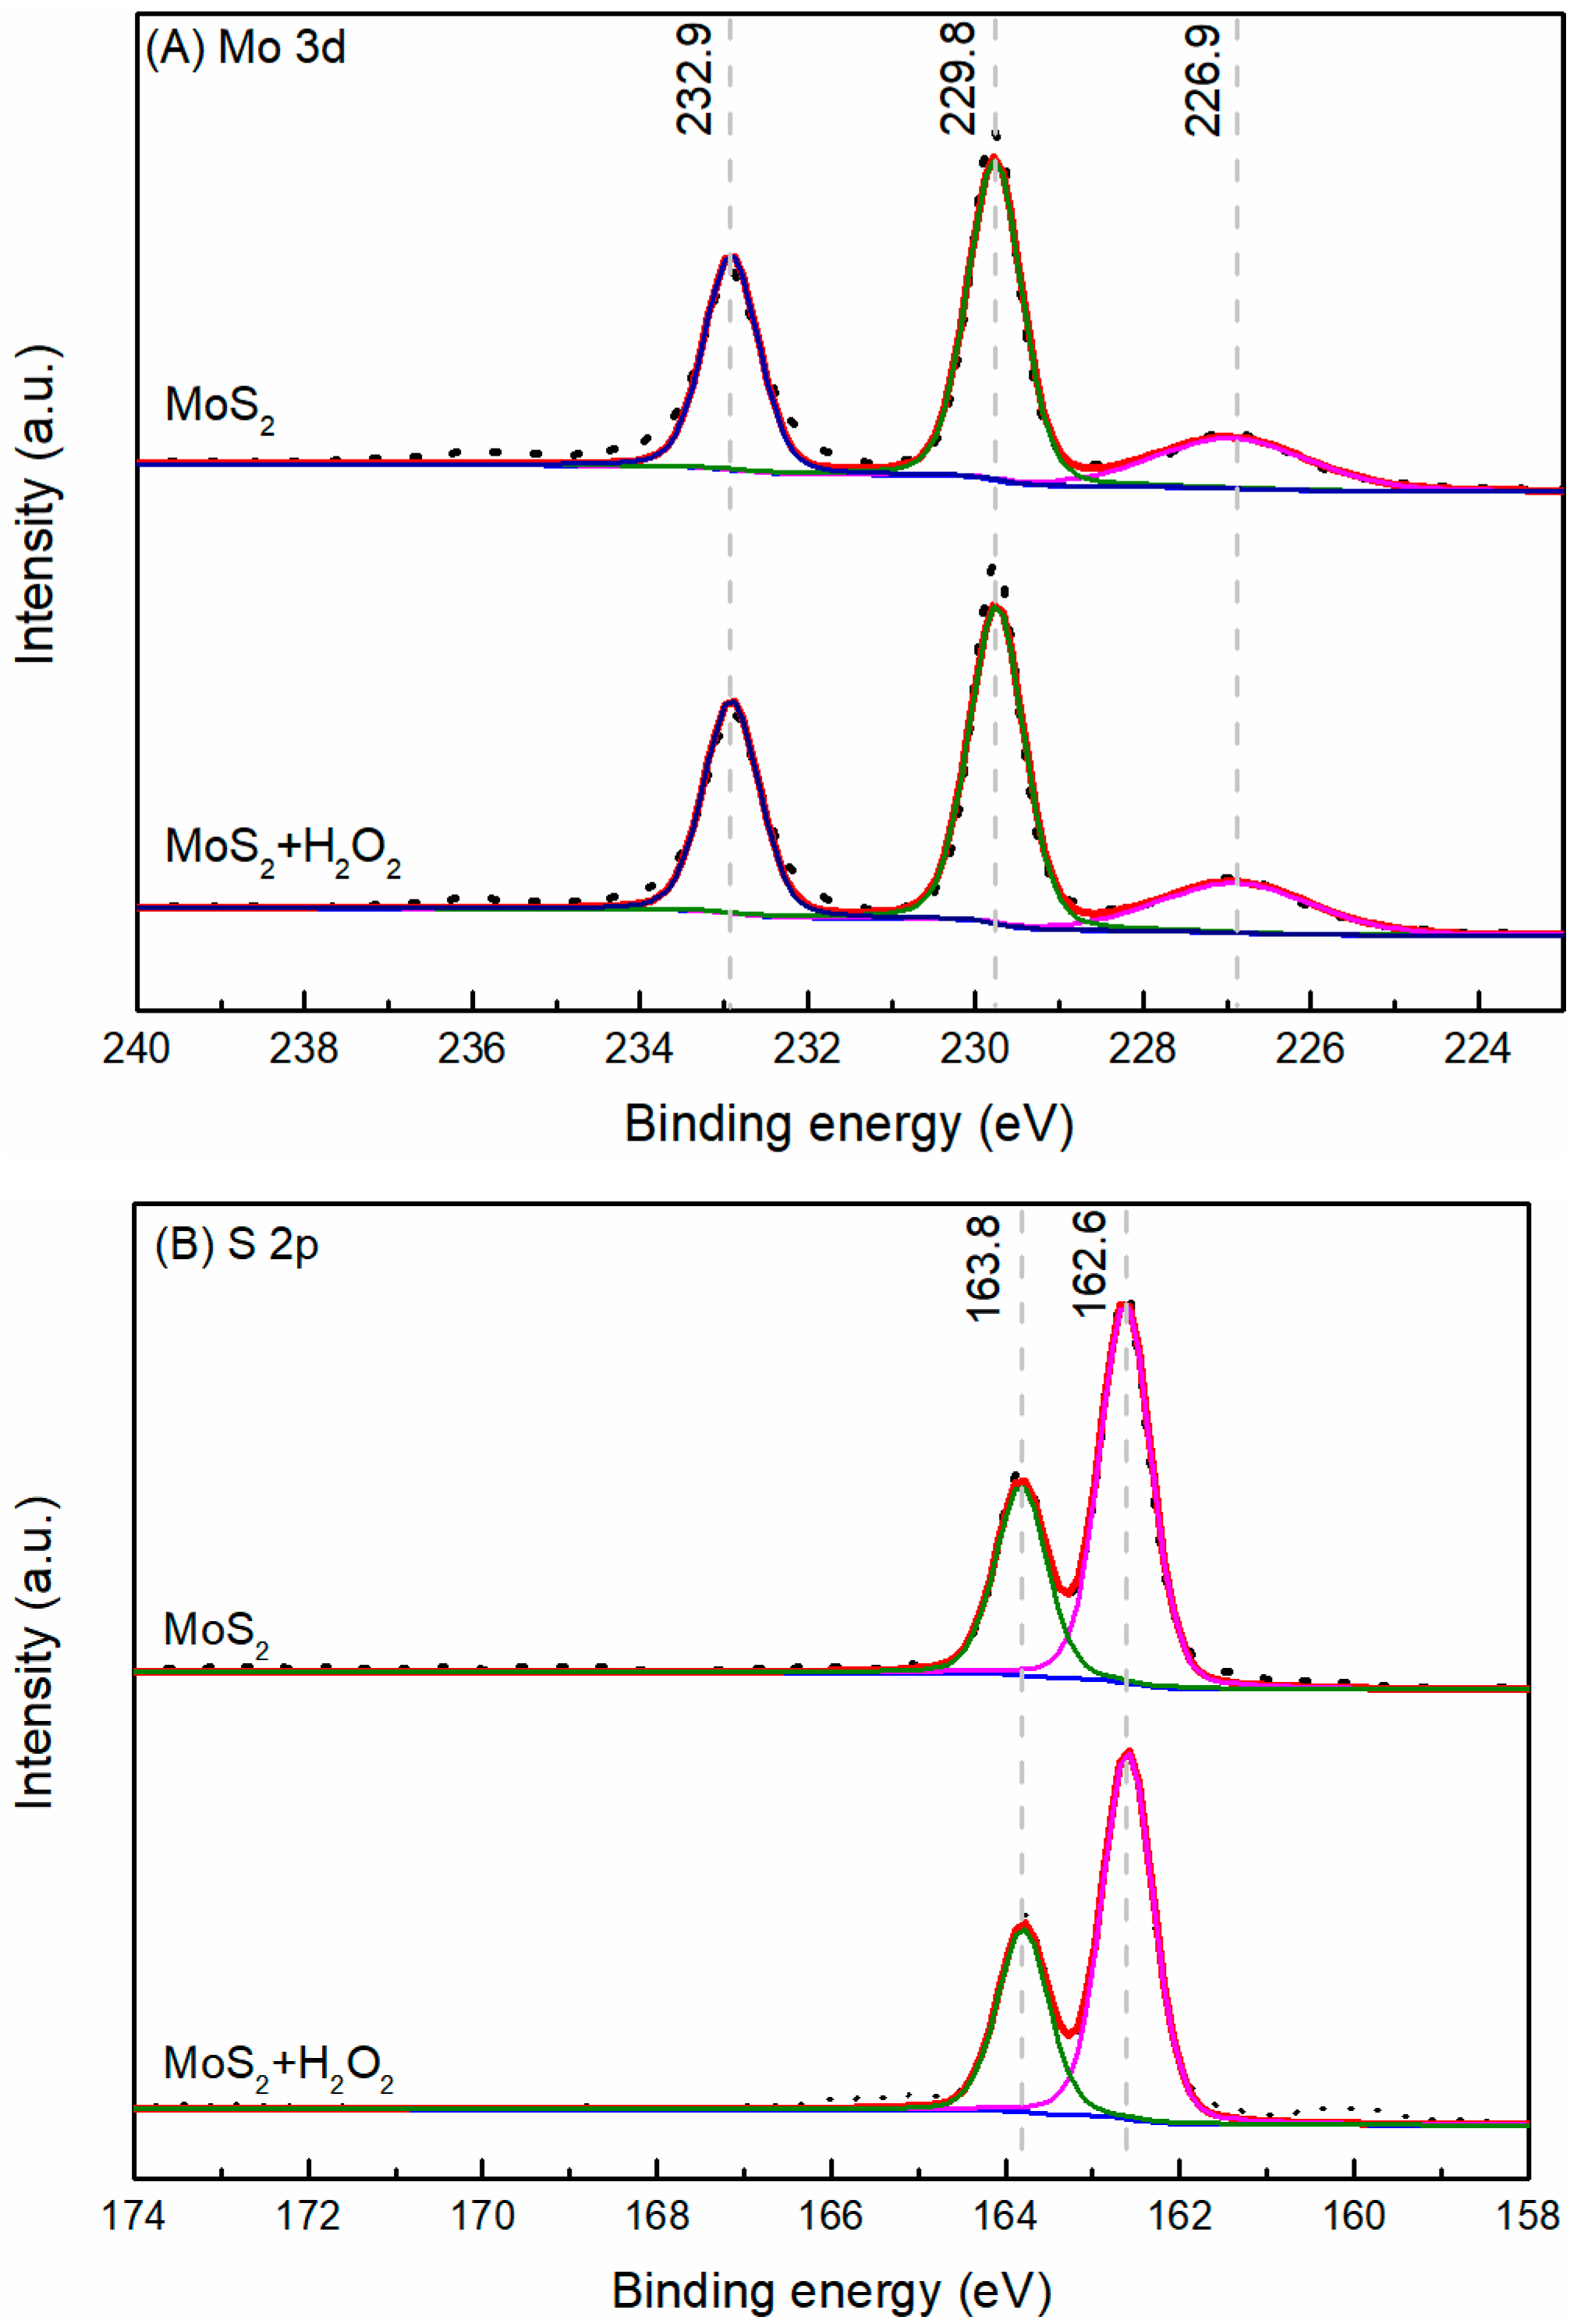
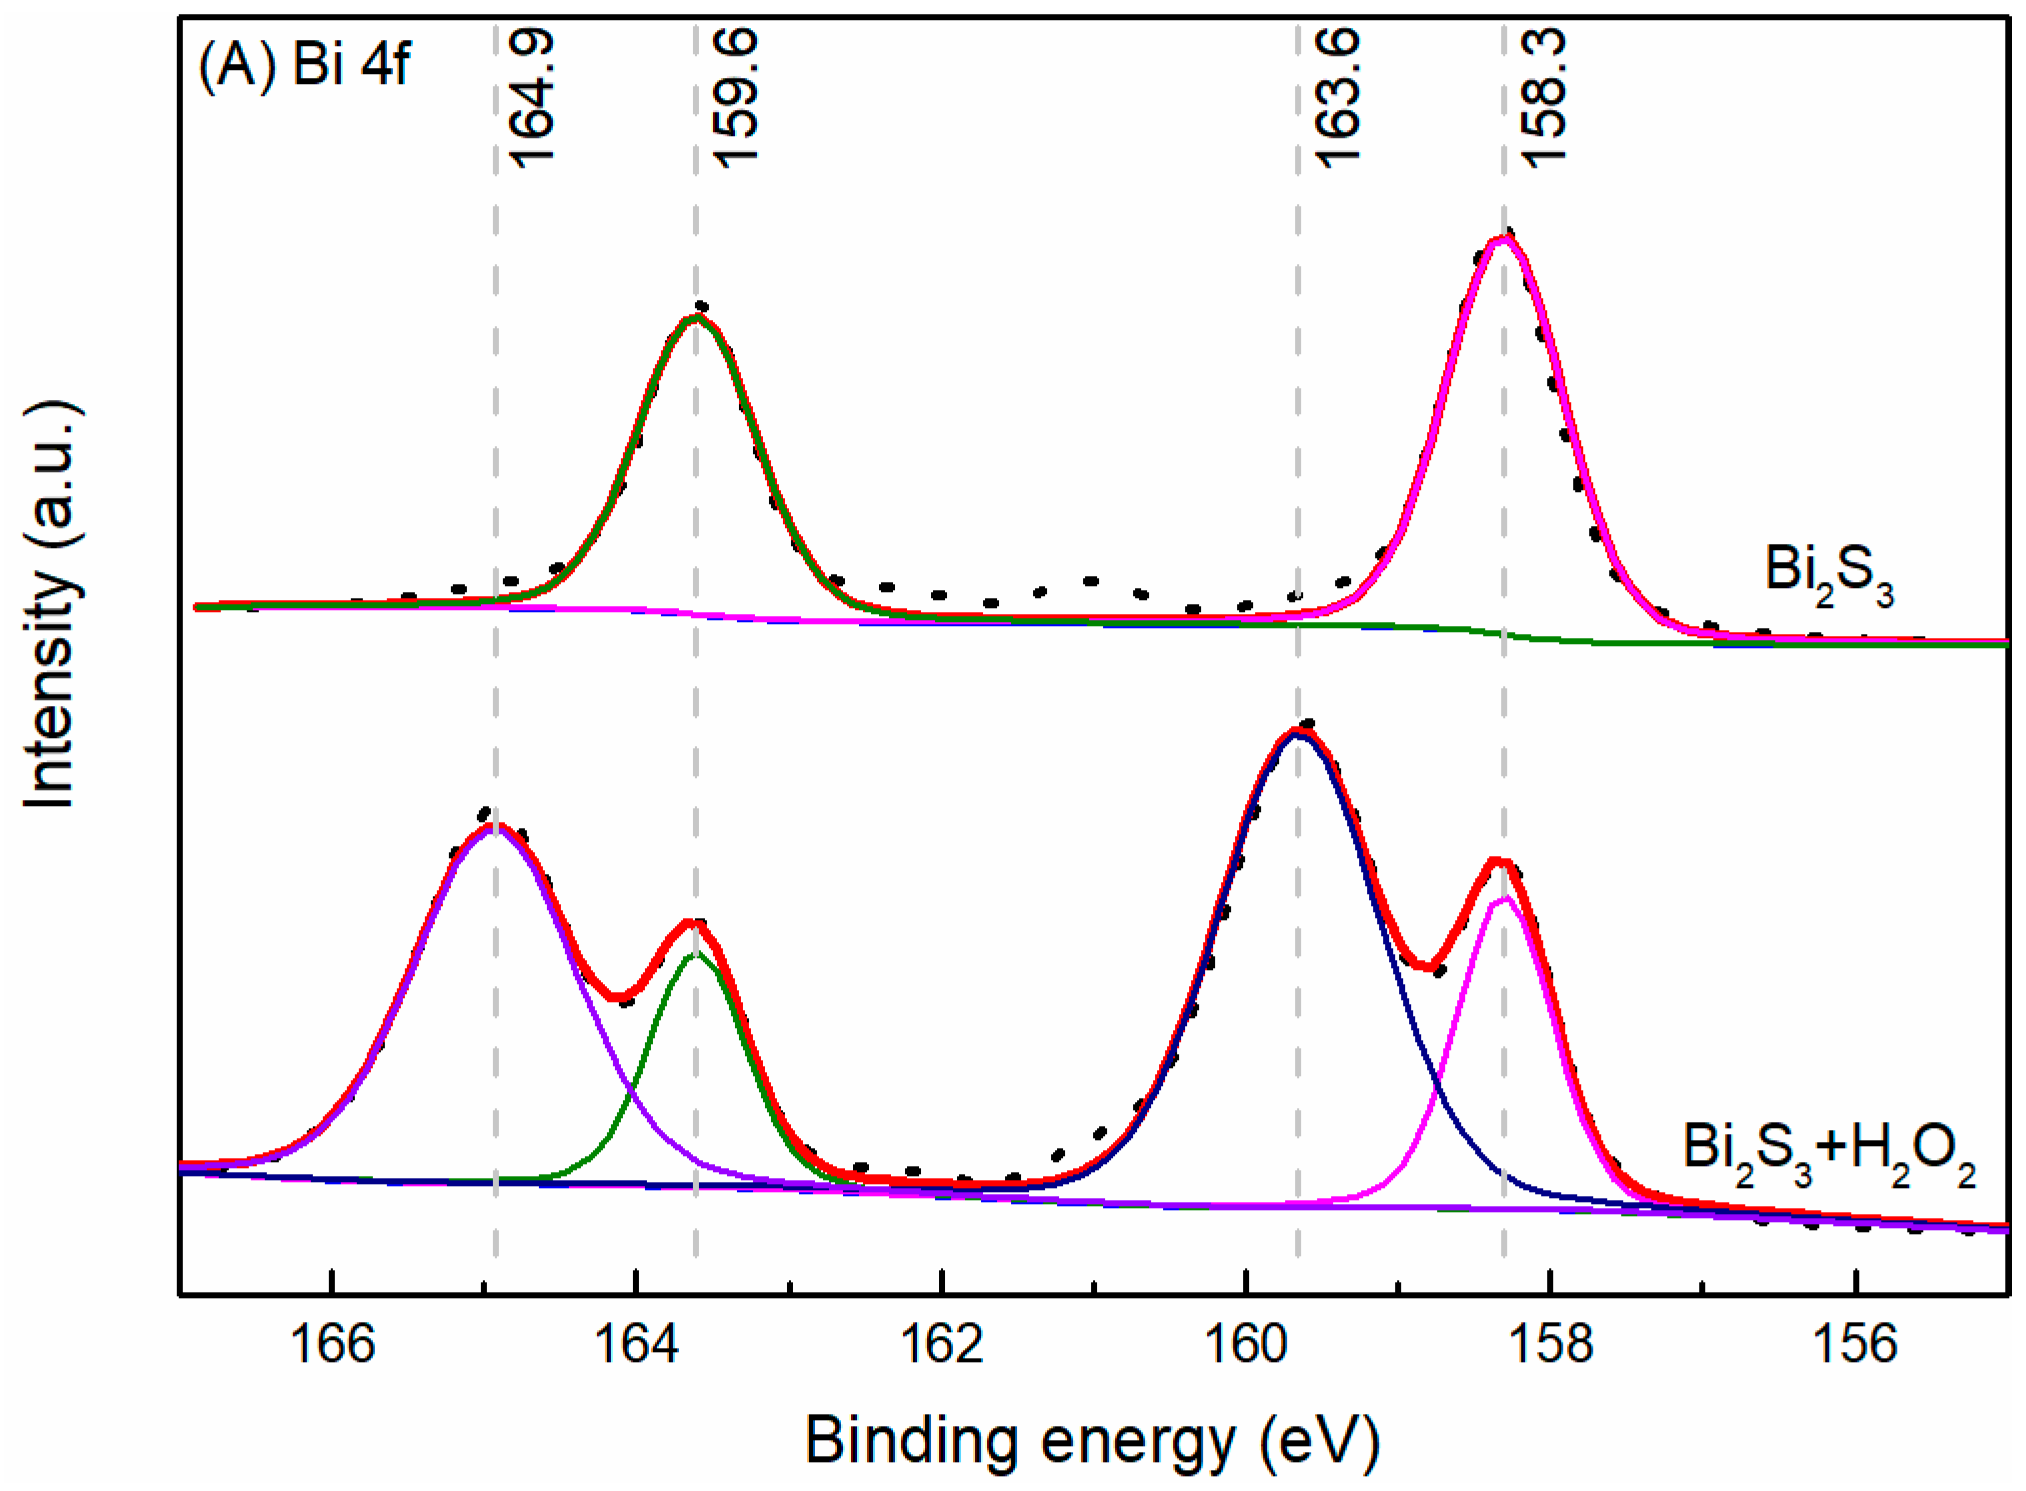
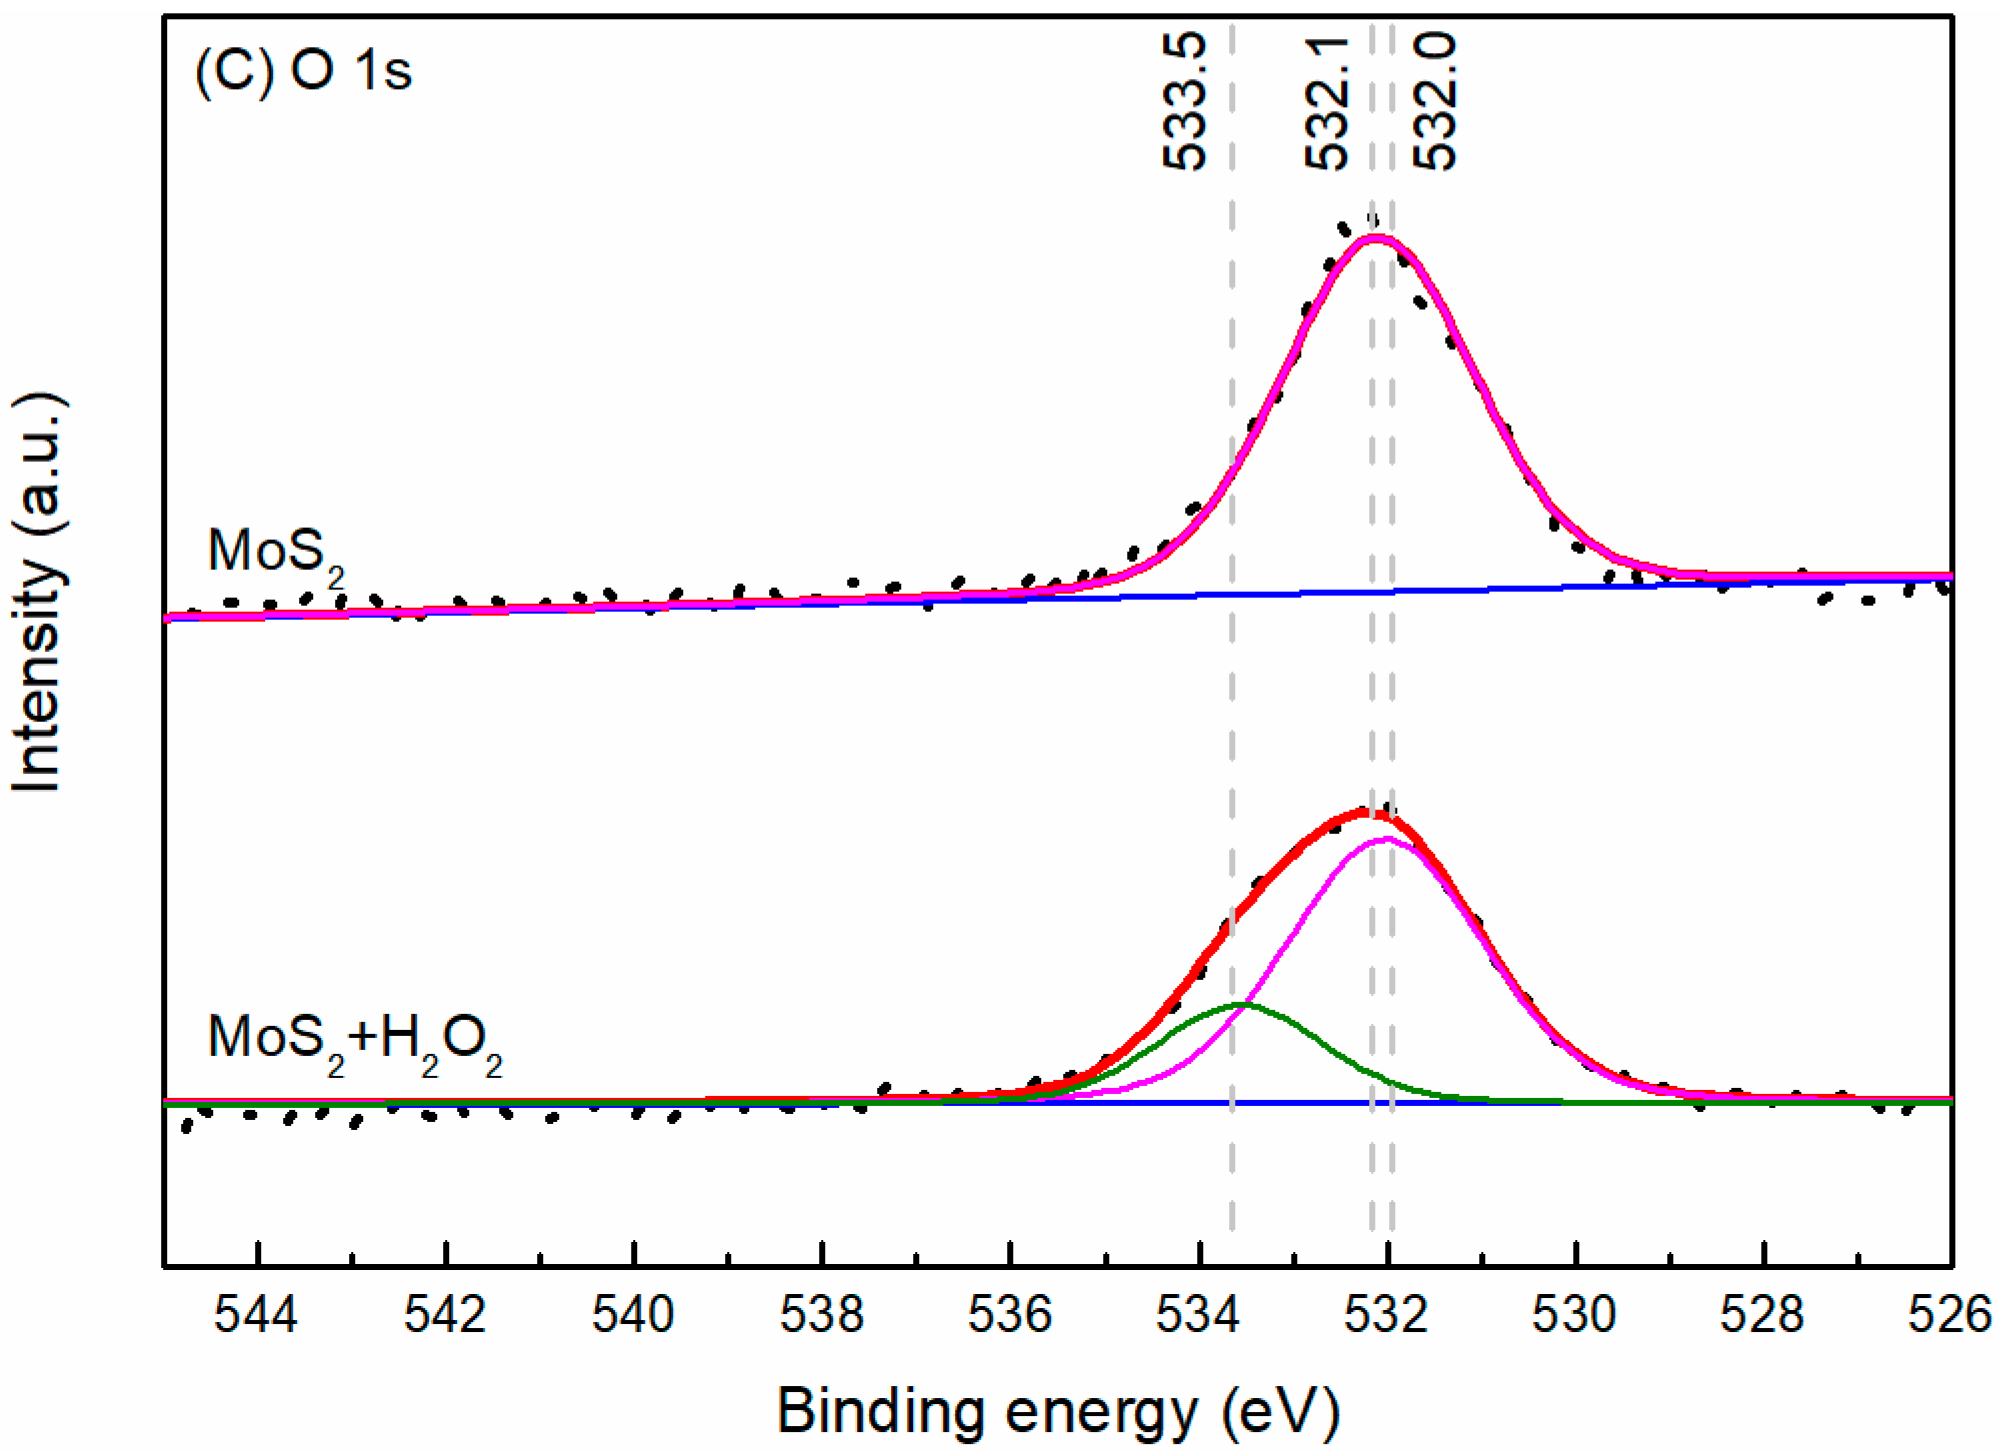
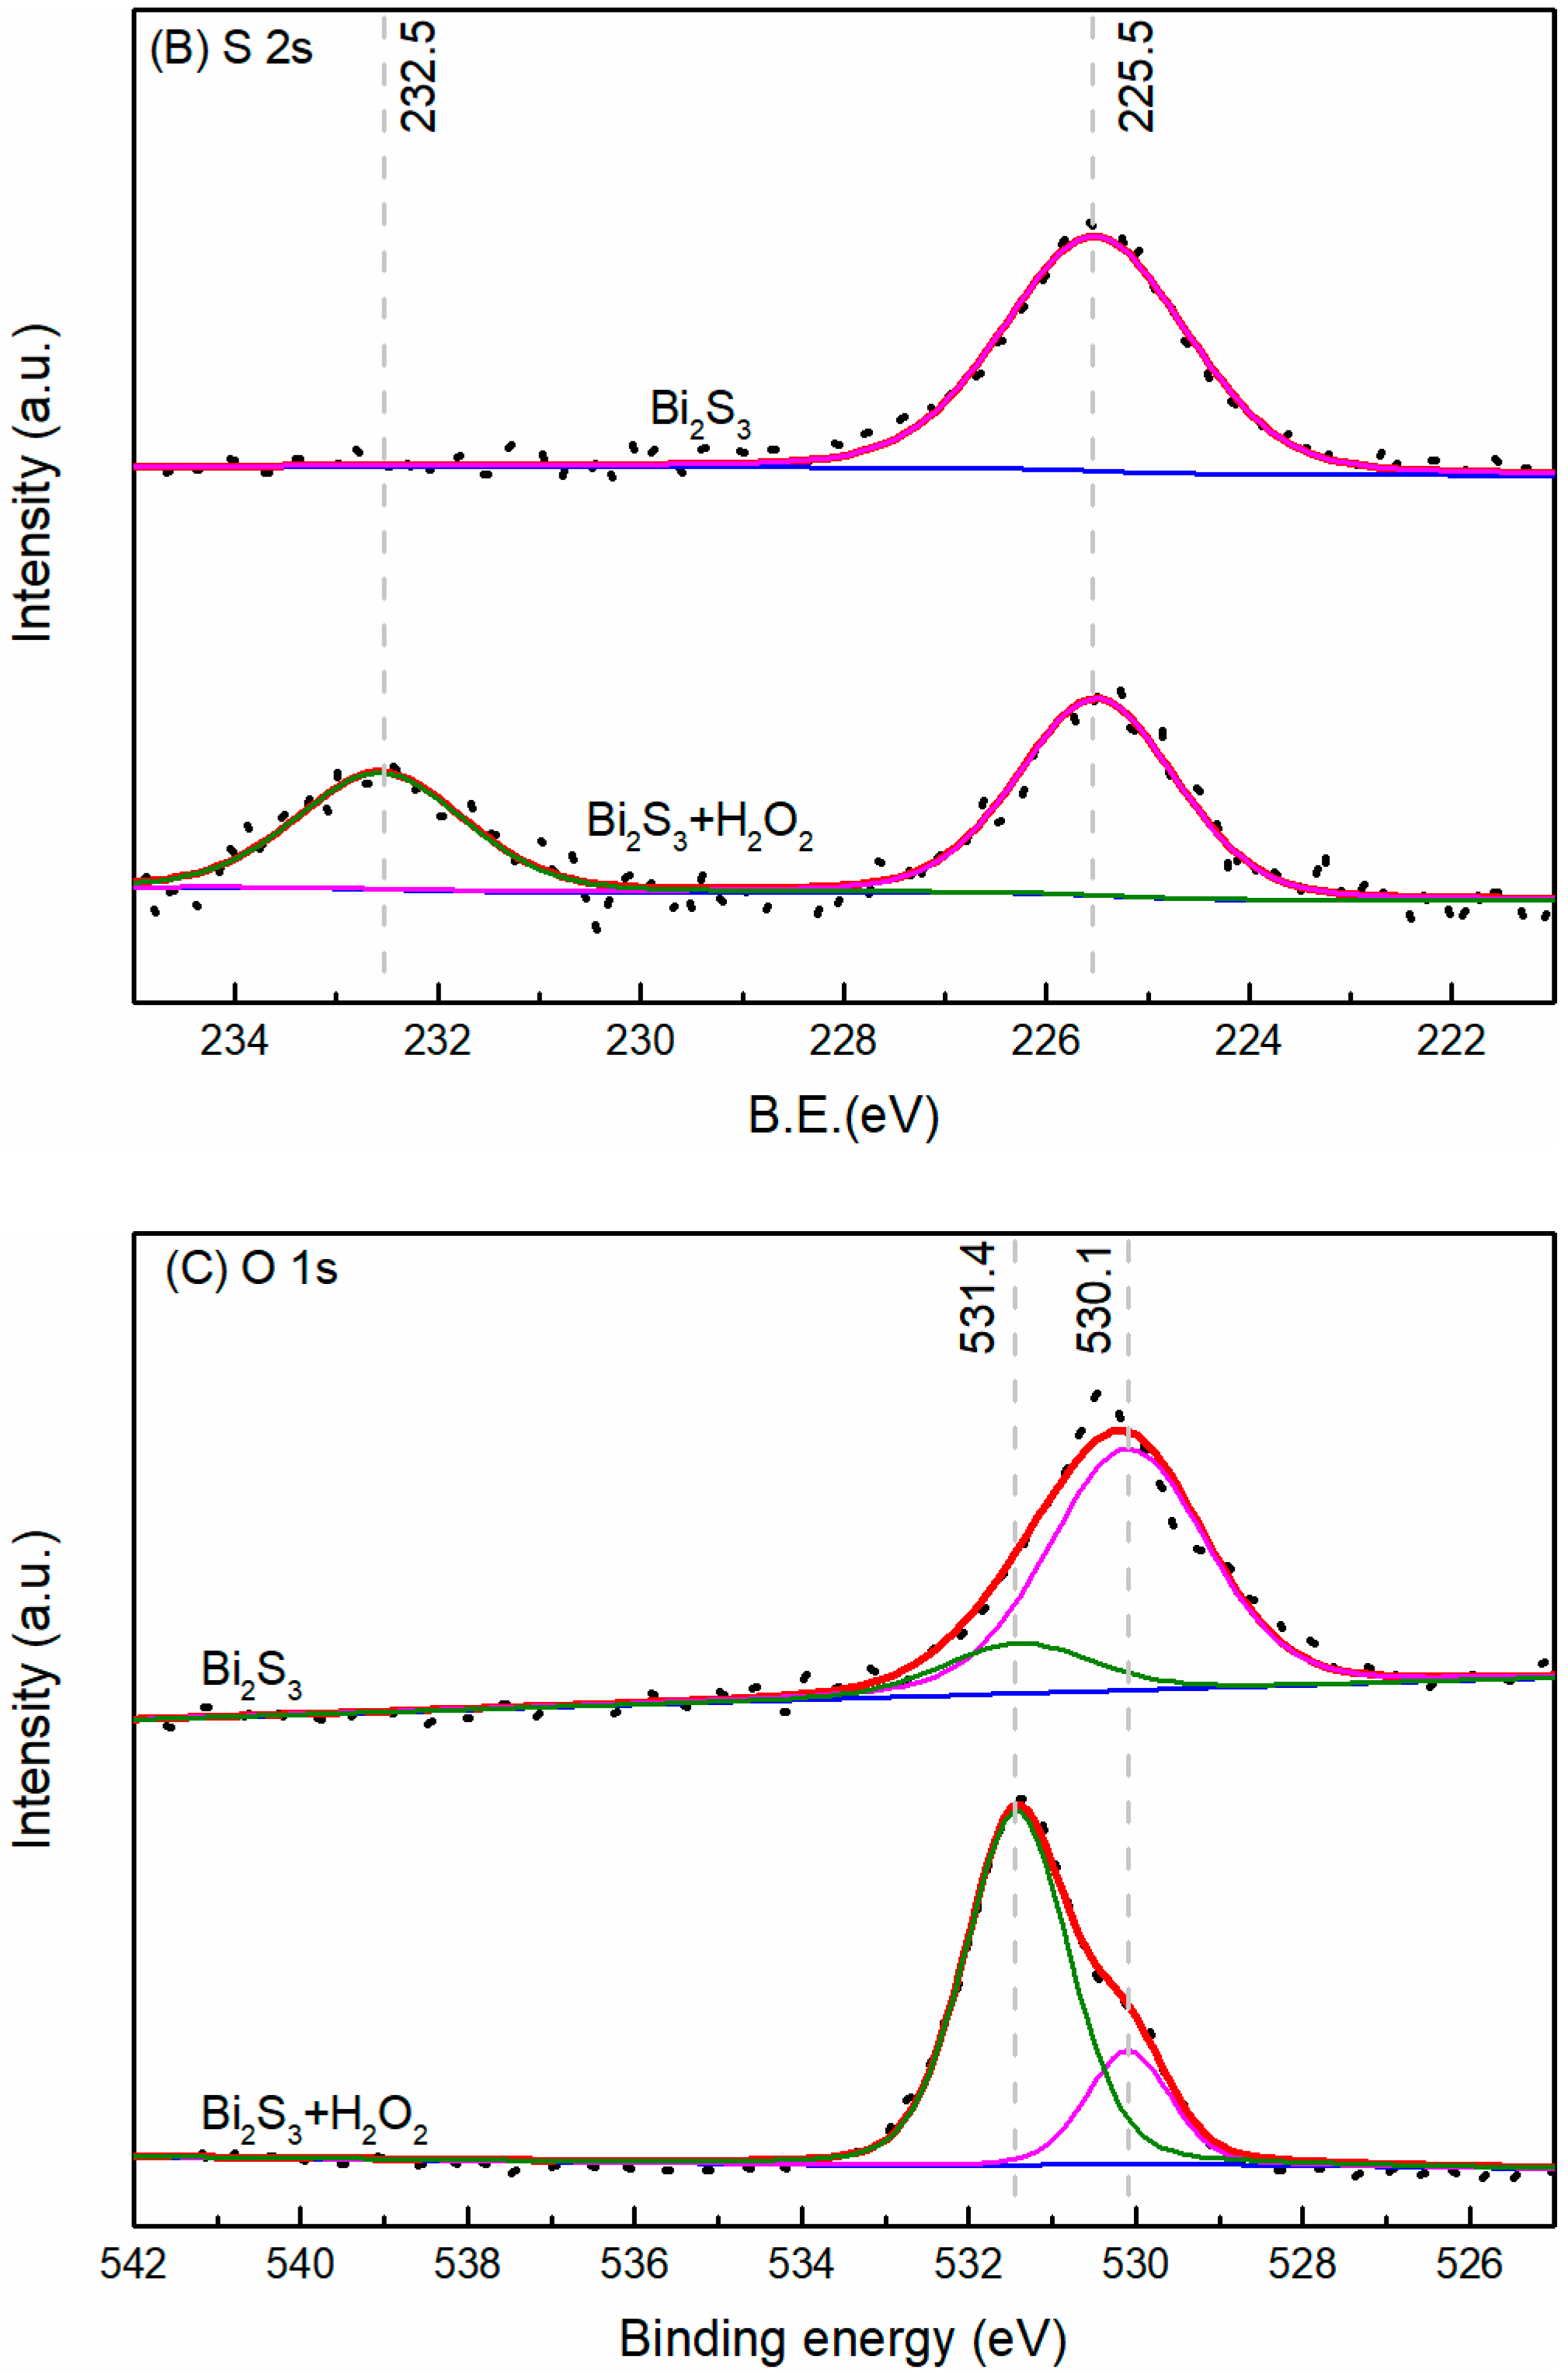
3.4. XPS Analysis
4. Conclusions
- (1)
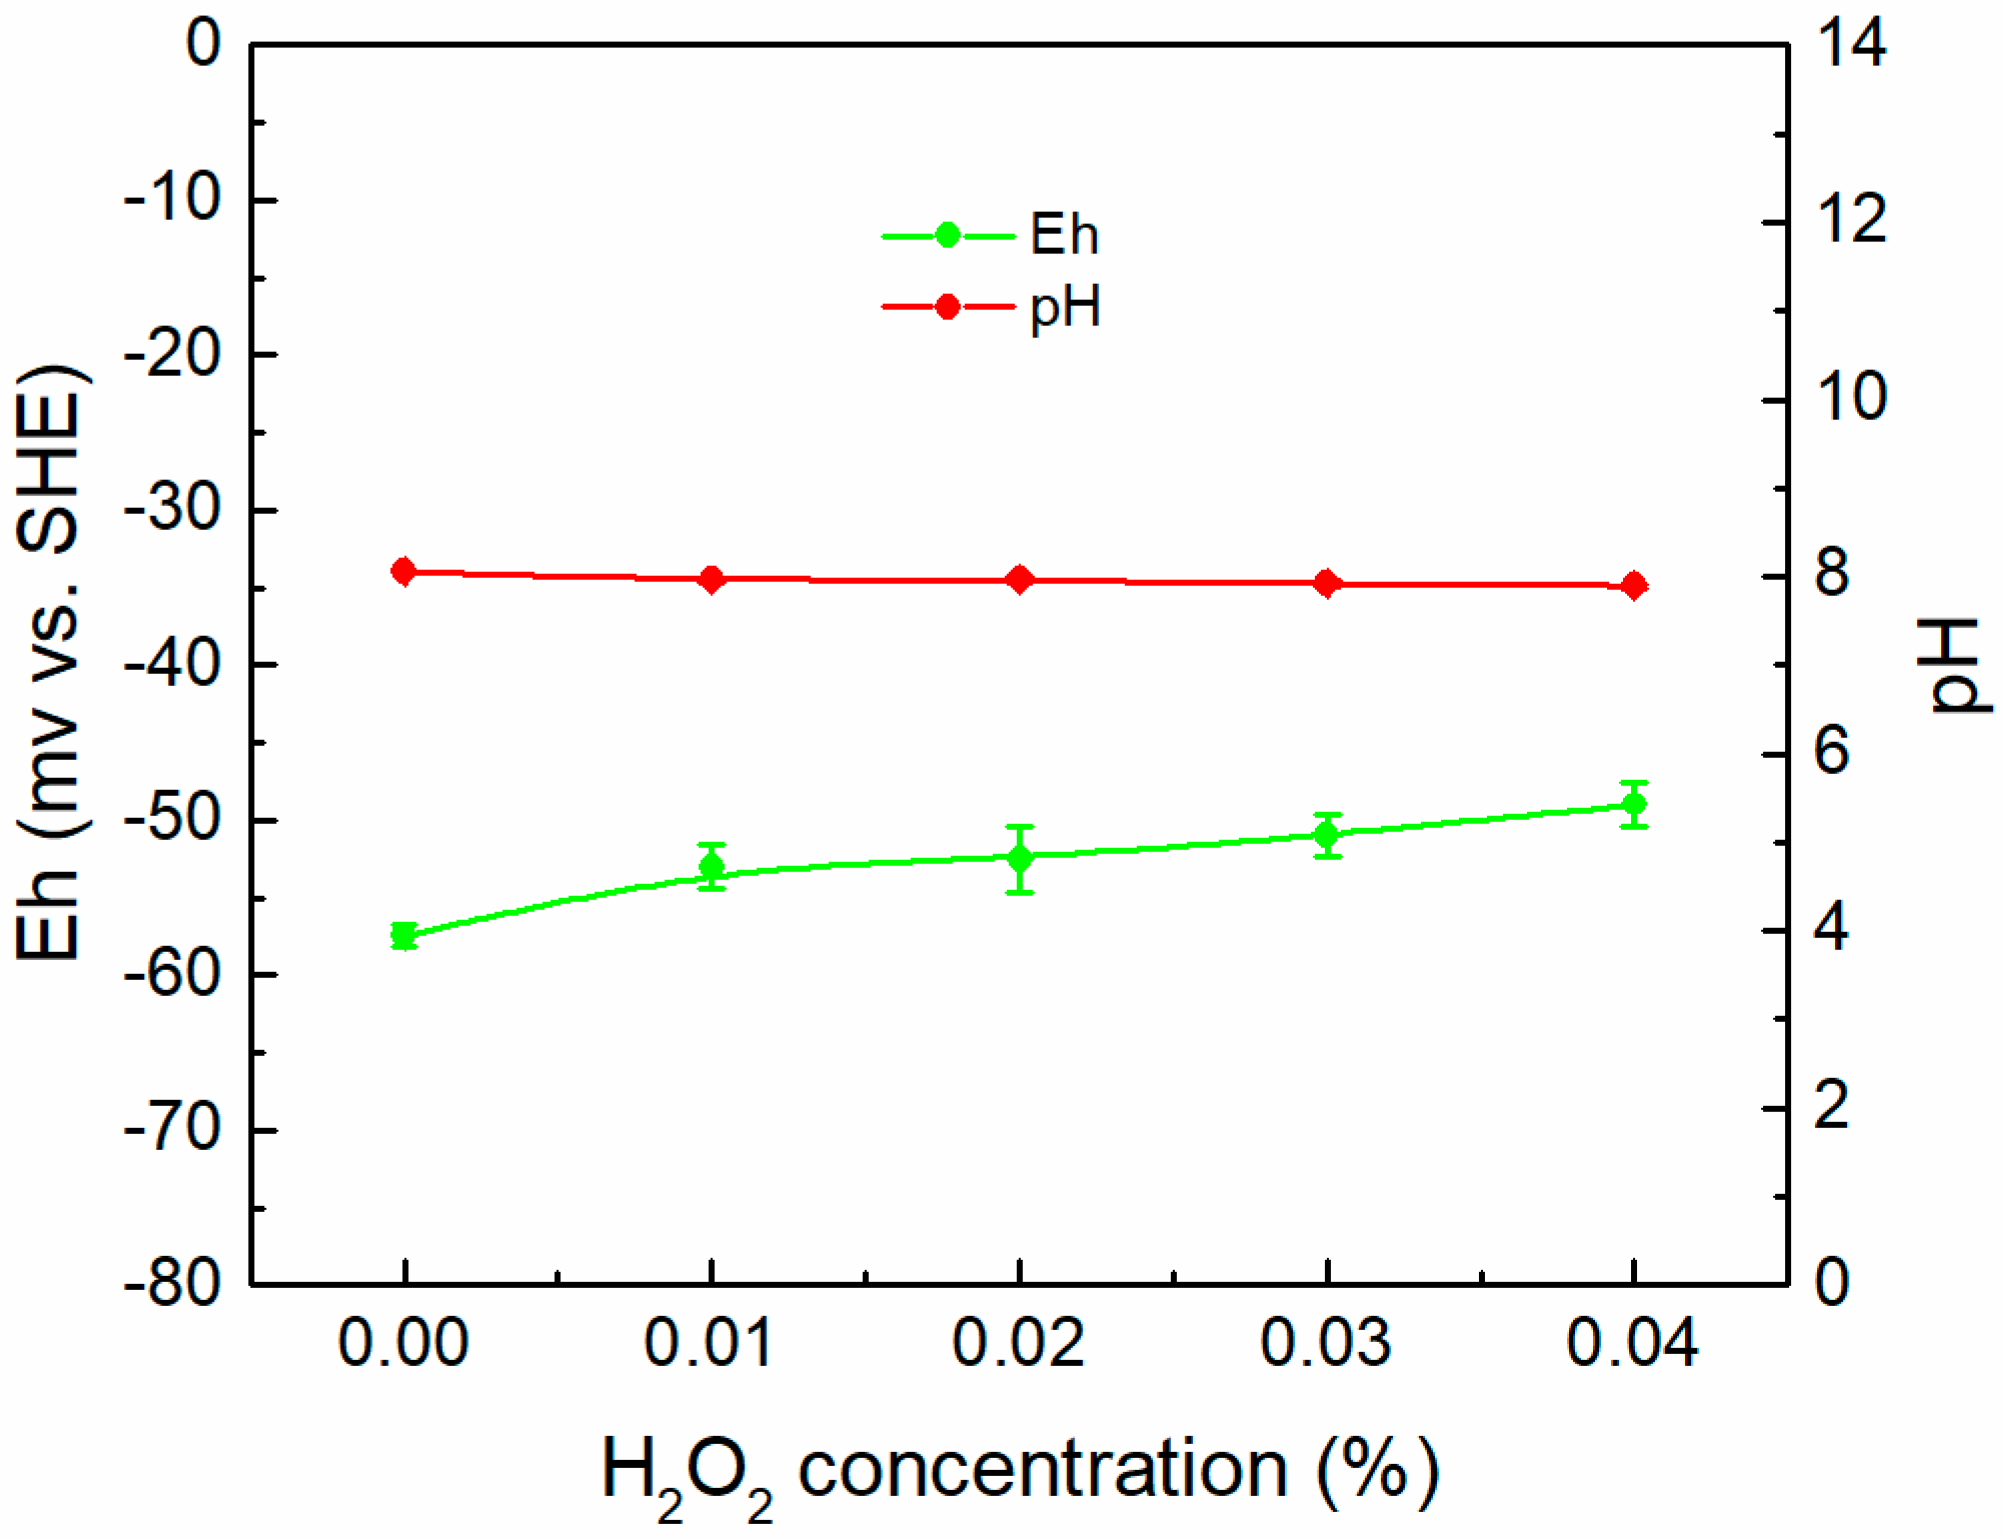
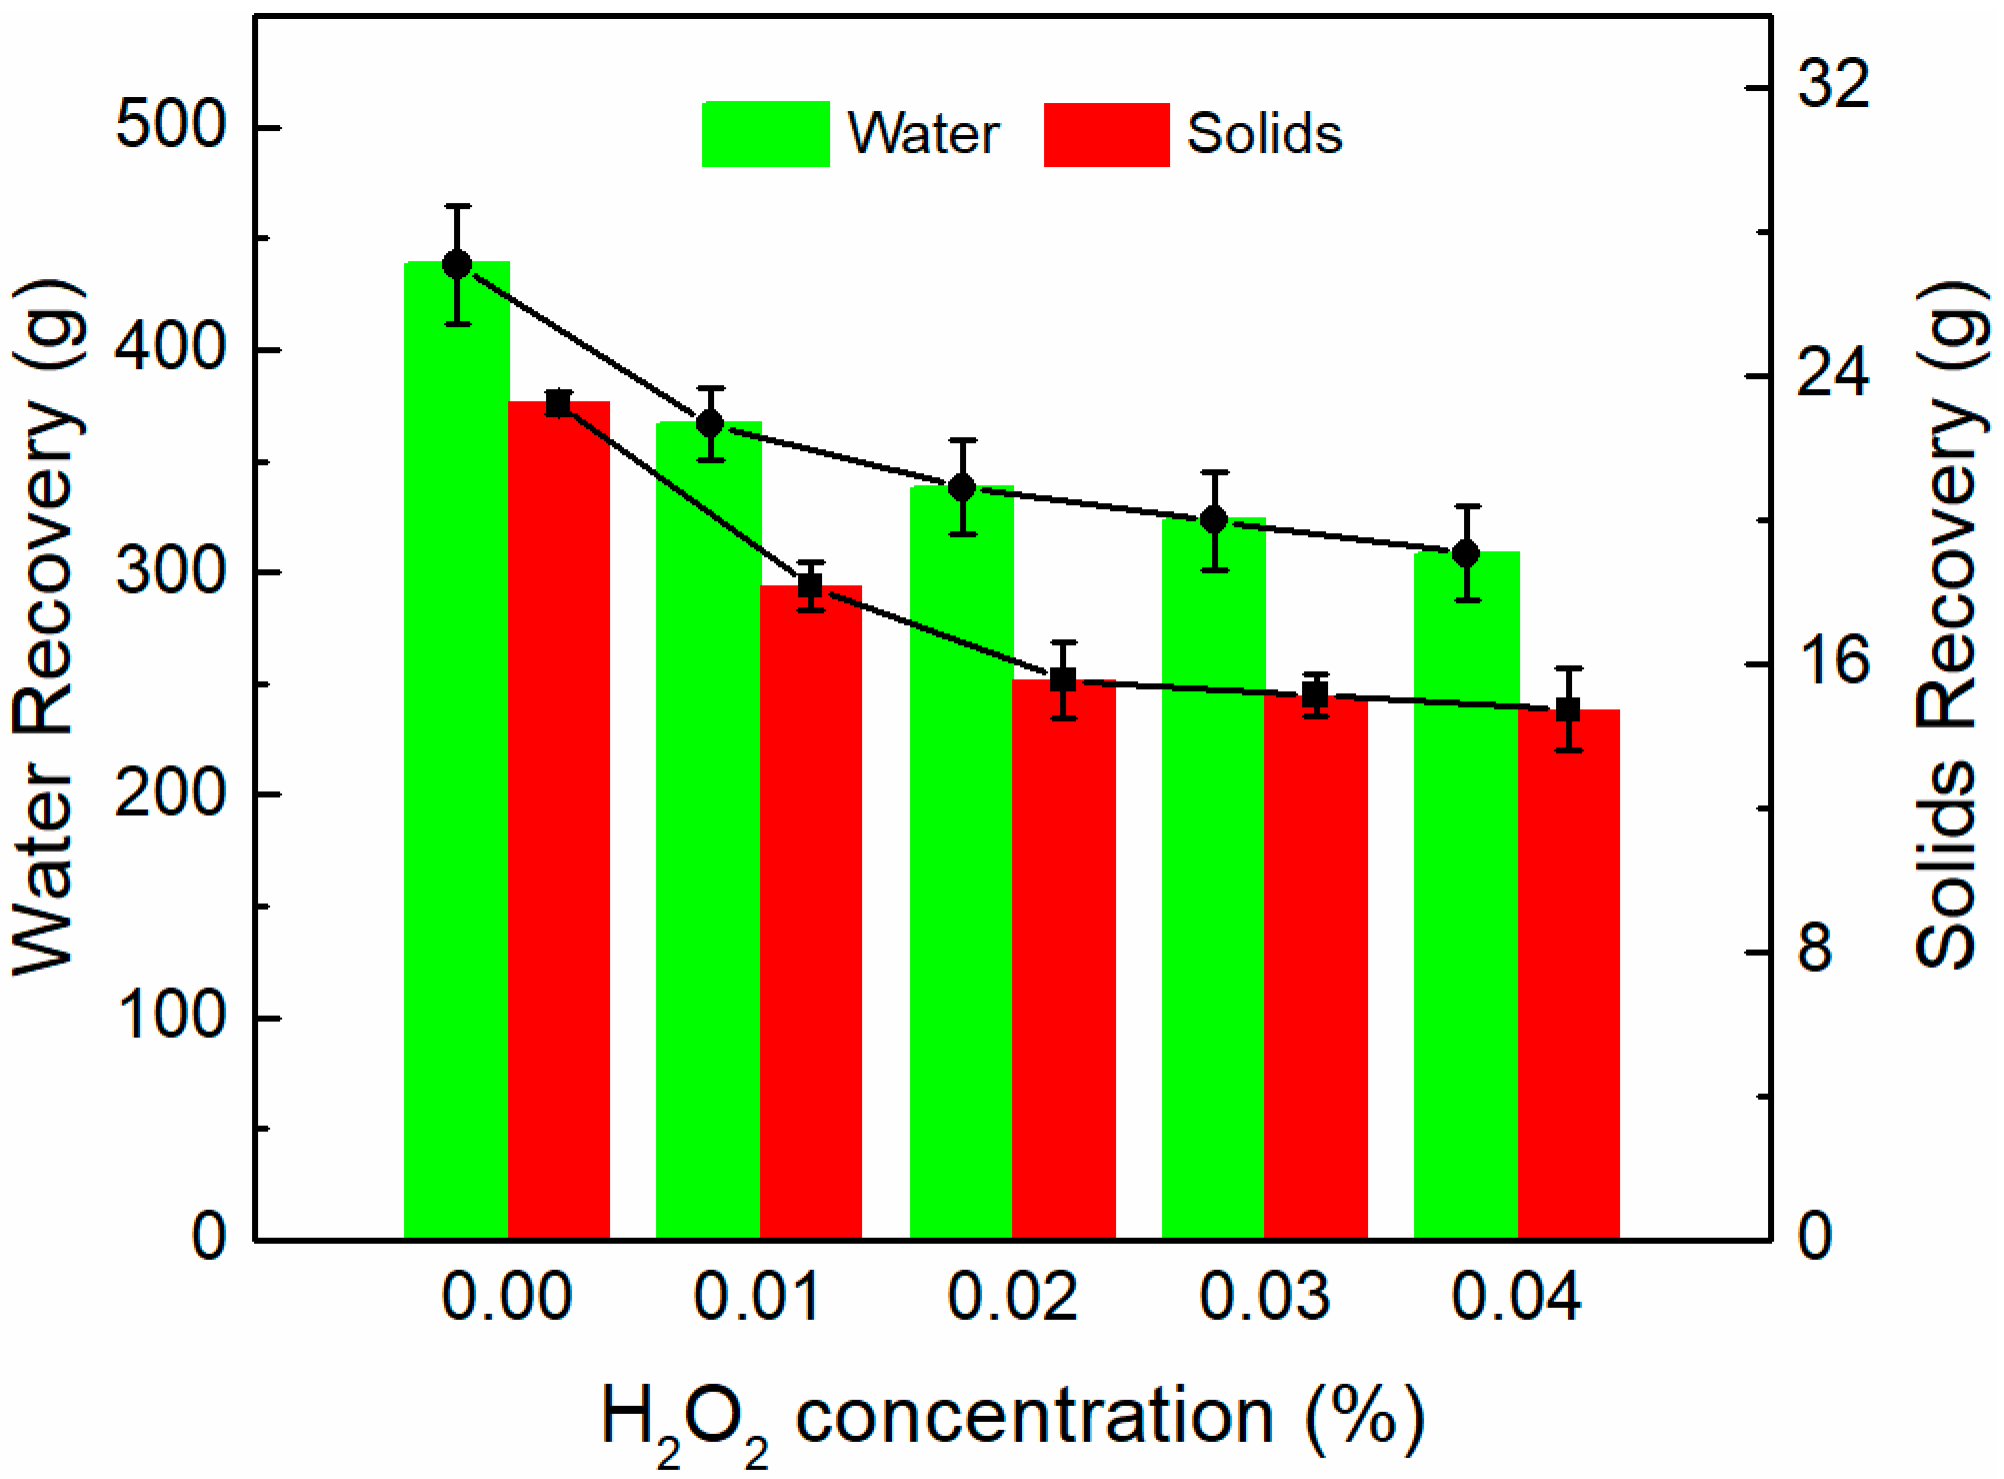
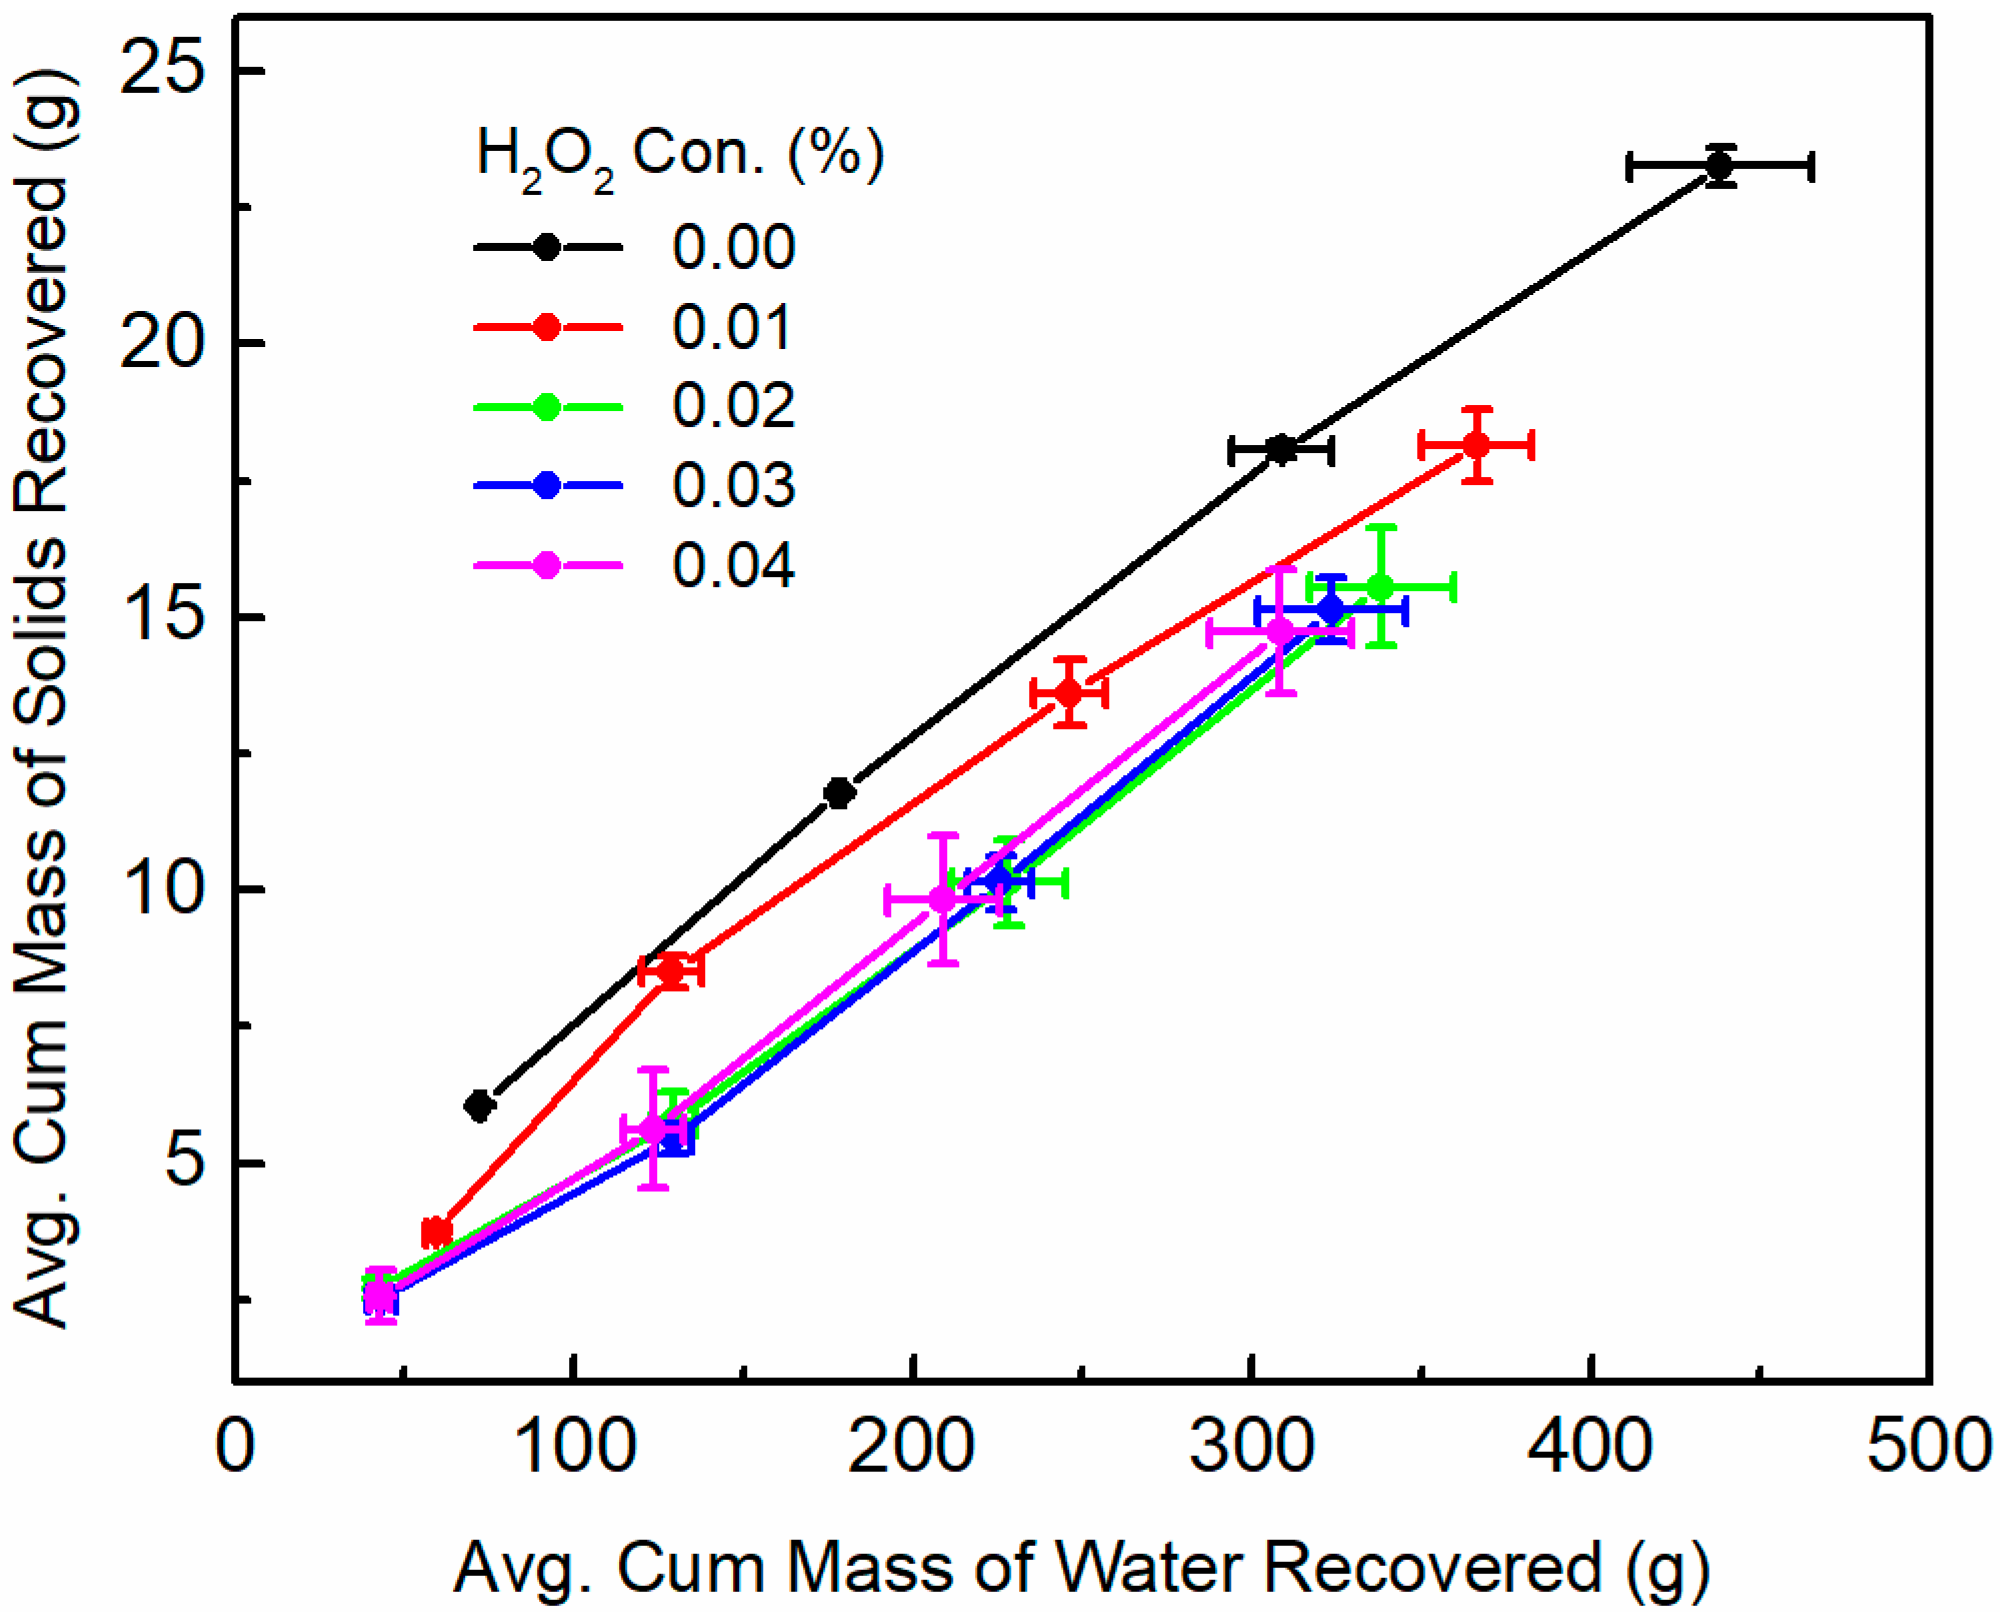
- Increasing H2O2 concentration results in a decrease in the amount of solids and water recovery from the concentrate at pH 8, which indicates that the presence of H2O2 leads to gangue depression and lower froth stability.
- (2)
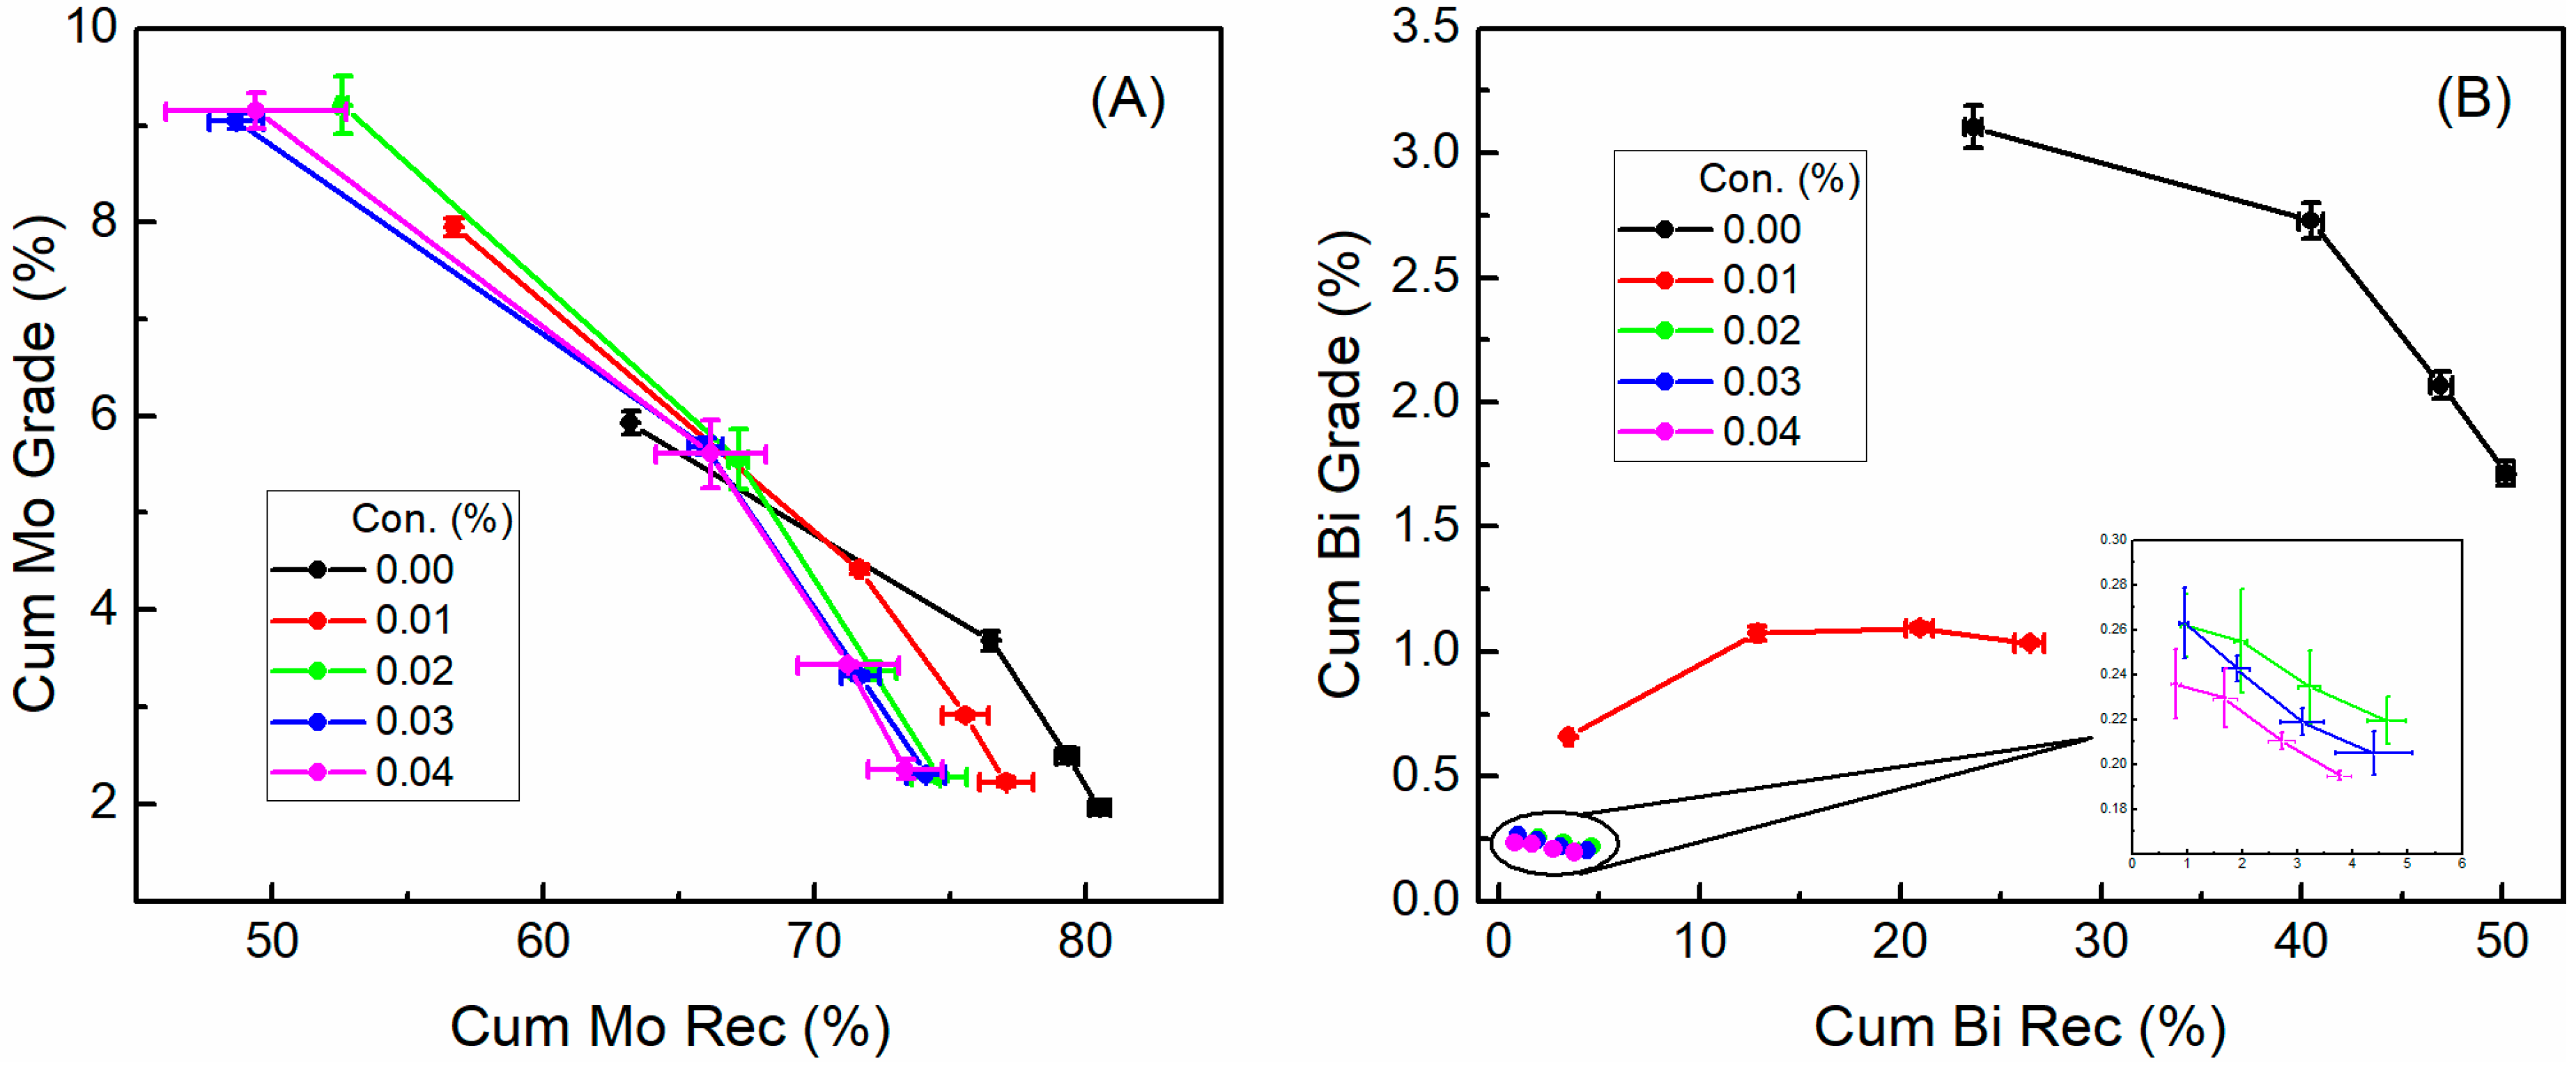
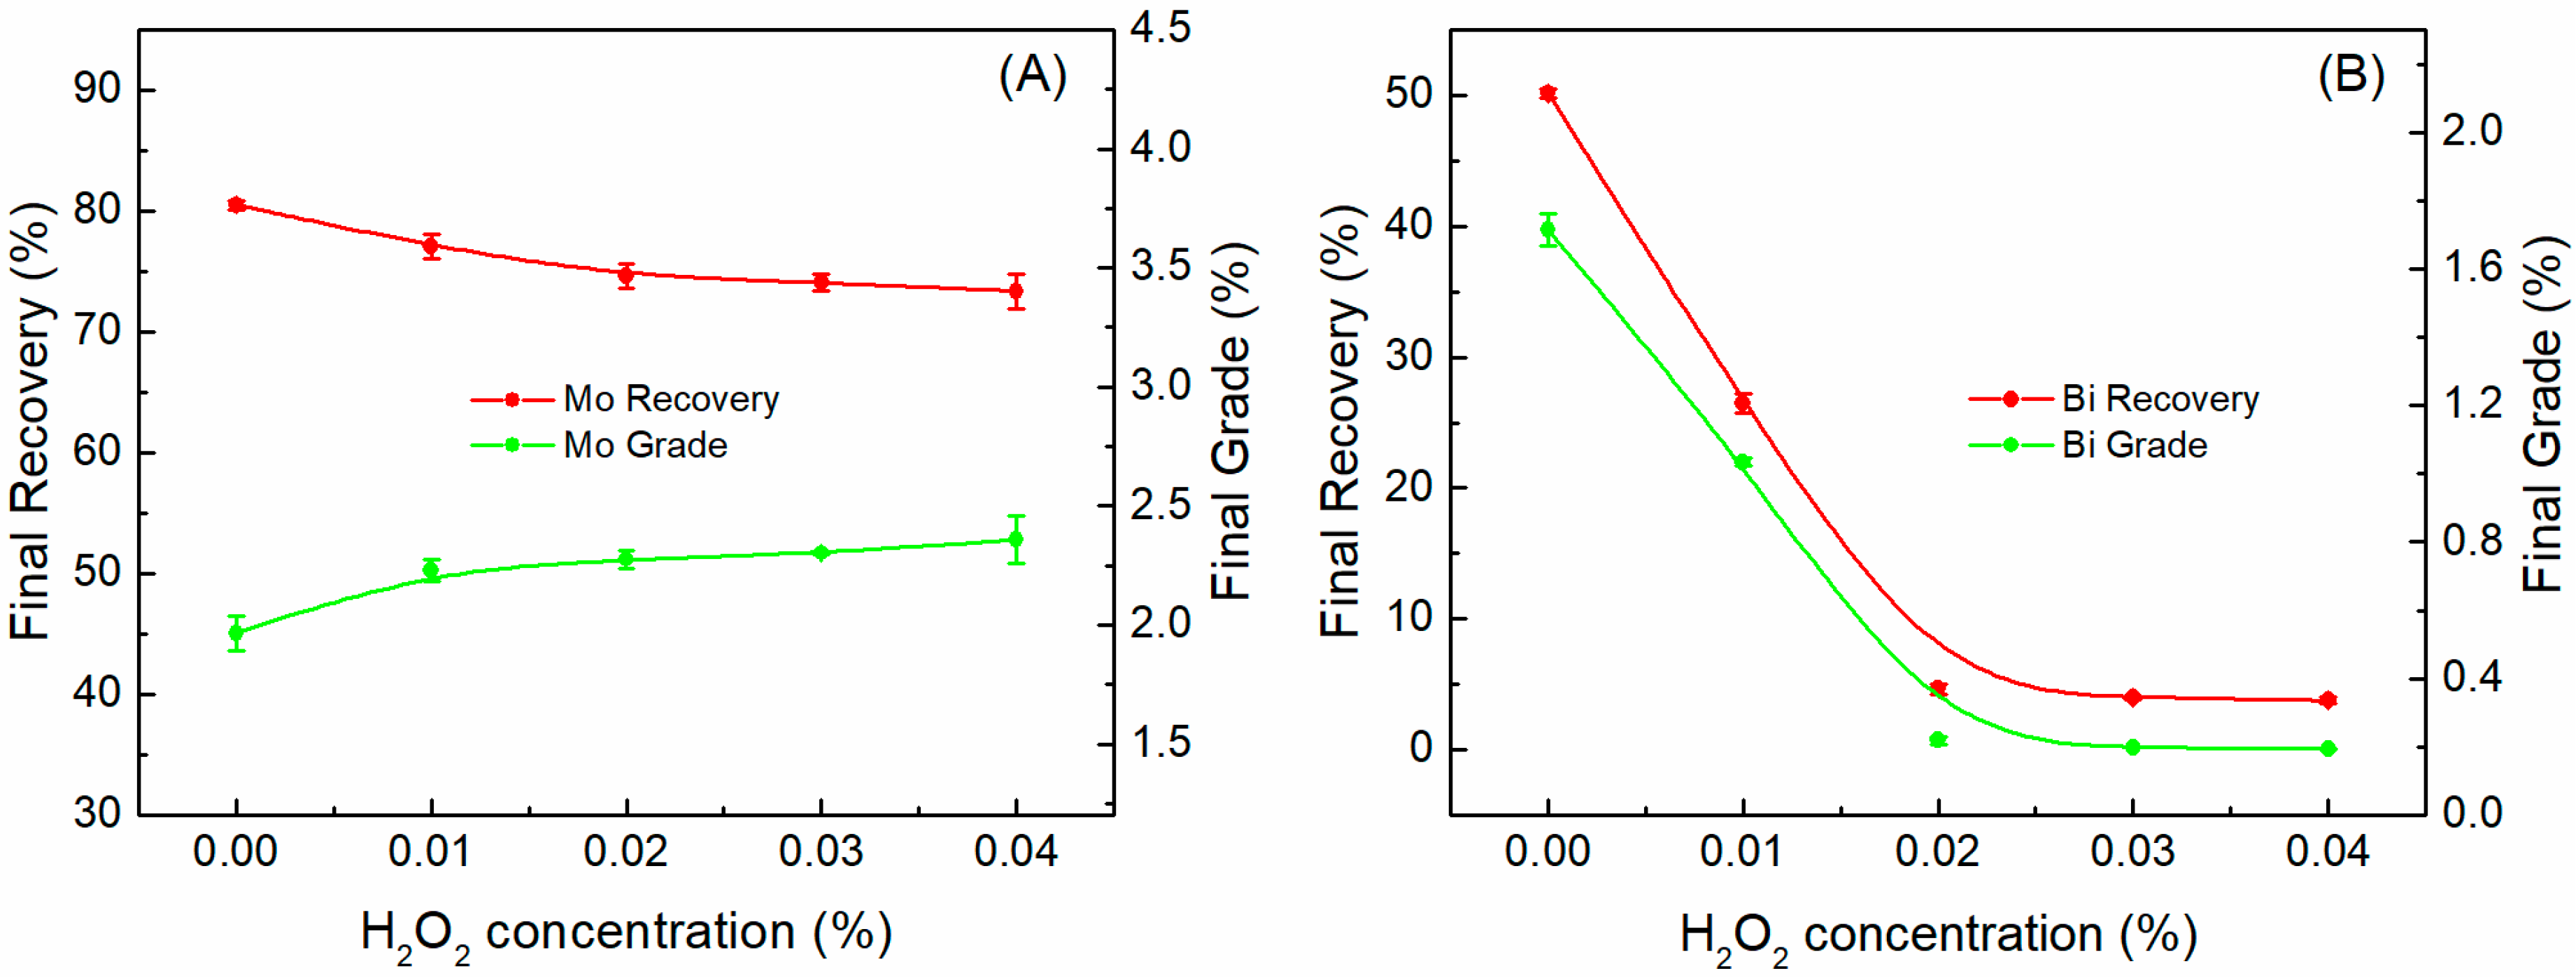
- The recovery and grade of bismuthinite was drastically decreased from 50.14% and 1.71% to 4.64% and 0.22%, respectively, after adding H2O2, while that of molybdenite were slightly affected. This result suggests that the inhibition effect of H2O2 on flotation is much more pronounced for bismuthinite than in molybdenite.
- (3)
- The flotation rate of bismuthinite was significantly lower than that of molybdenite, which demonstrates that bismuthinite floats more slowly than molybdenite. The addition of H2O2 marginally decreased the flotation rate of bismuthinite and showed a negligible influence on molybdenite.
- (4)
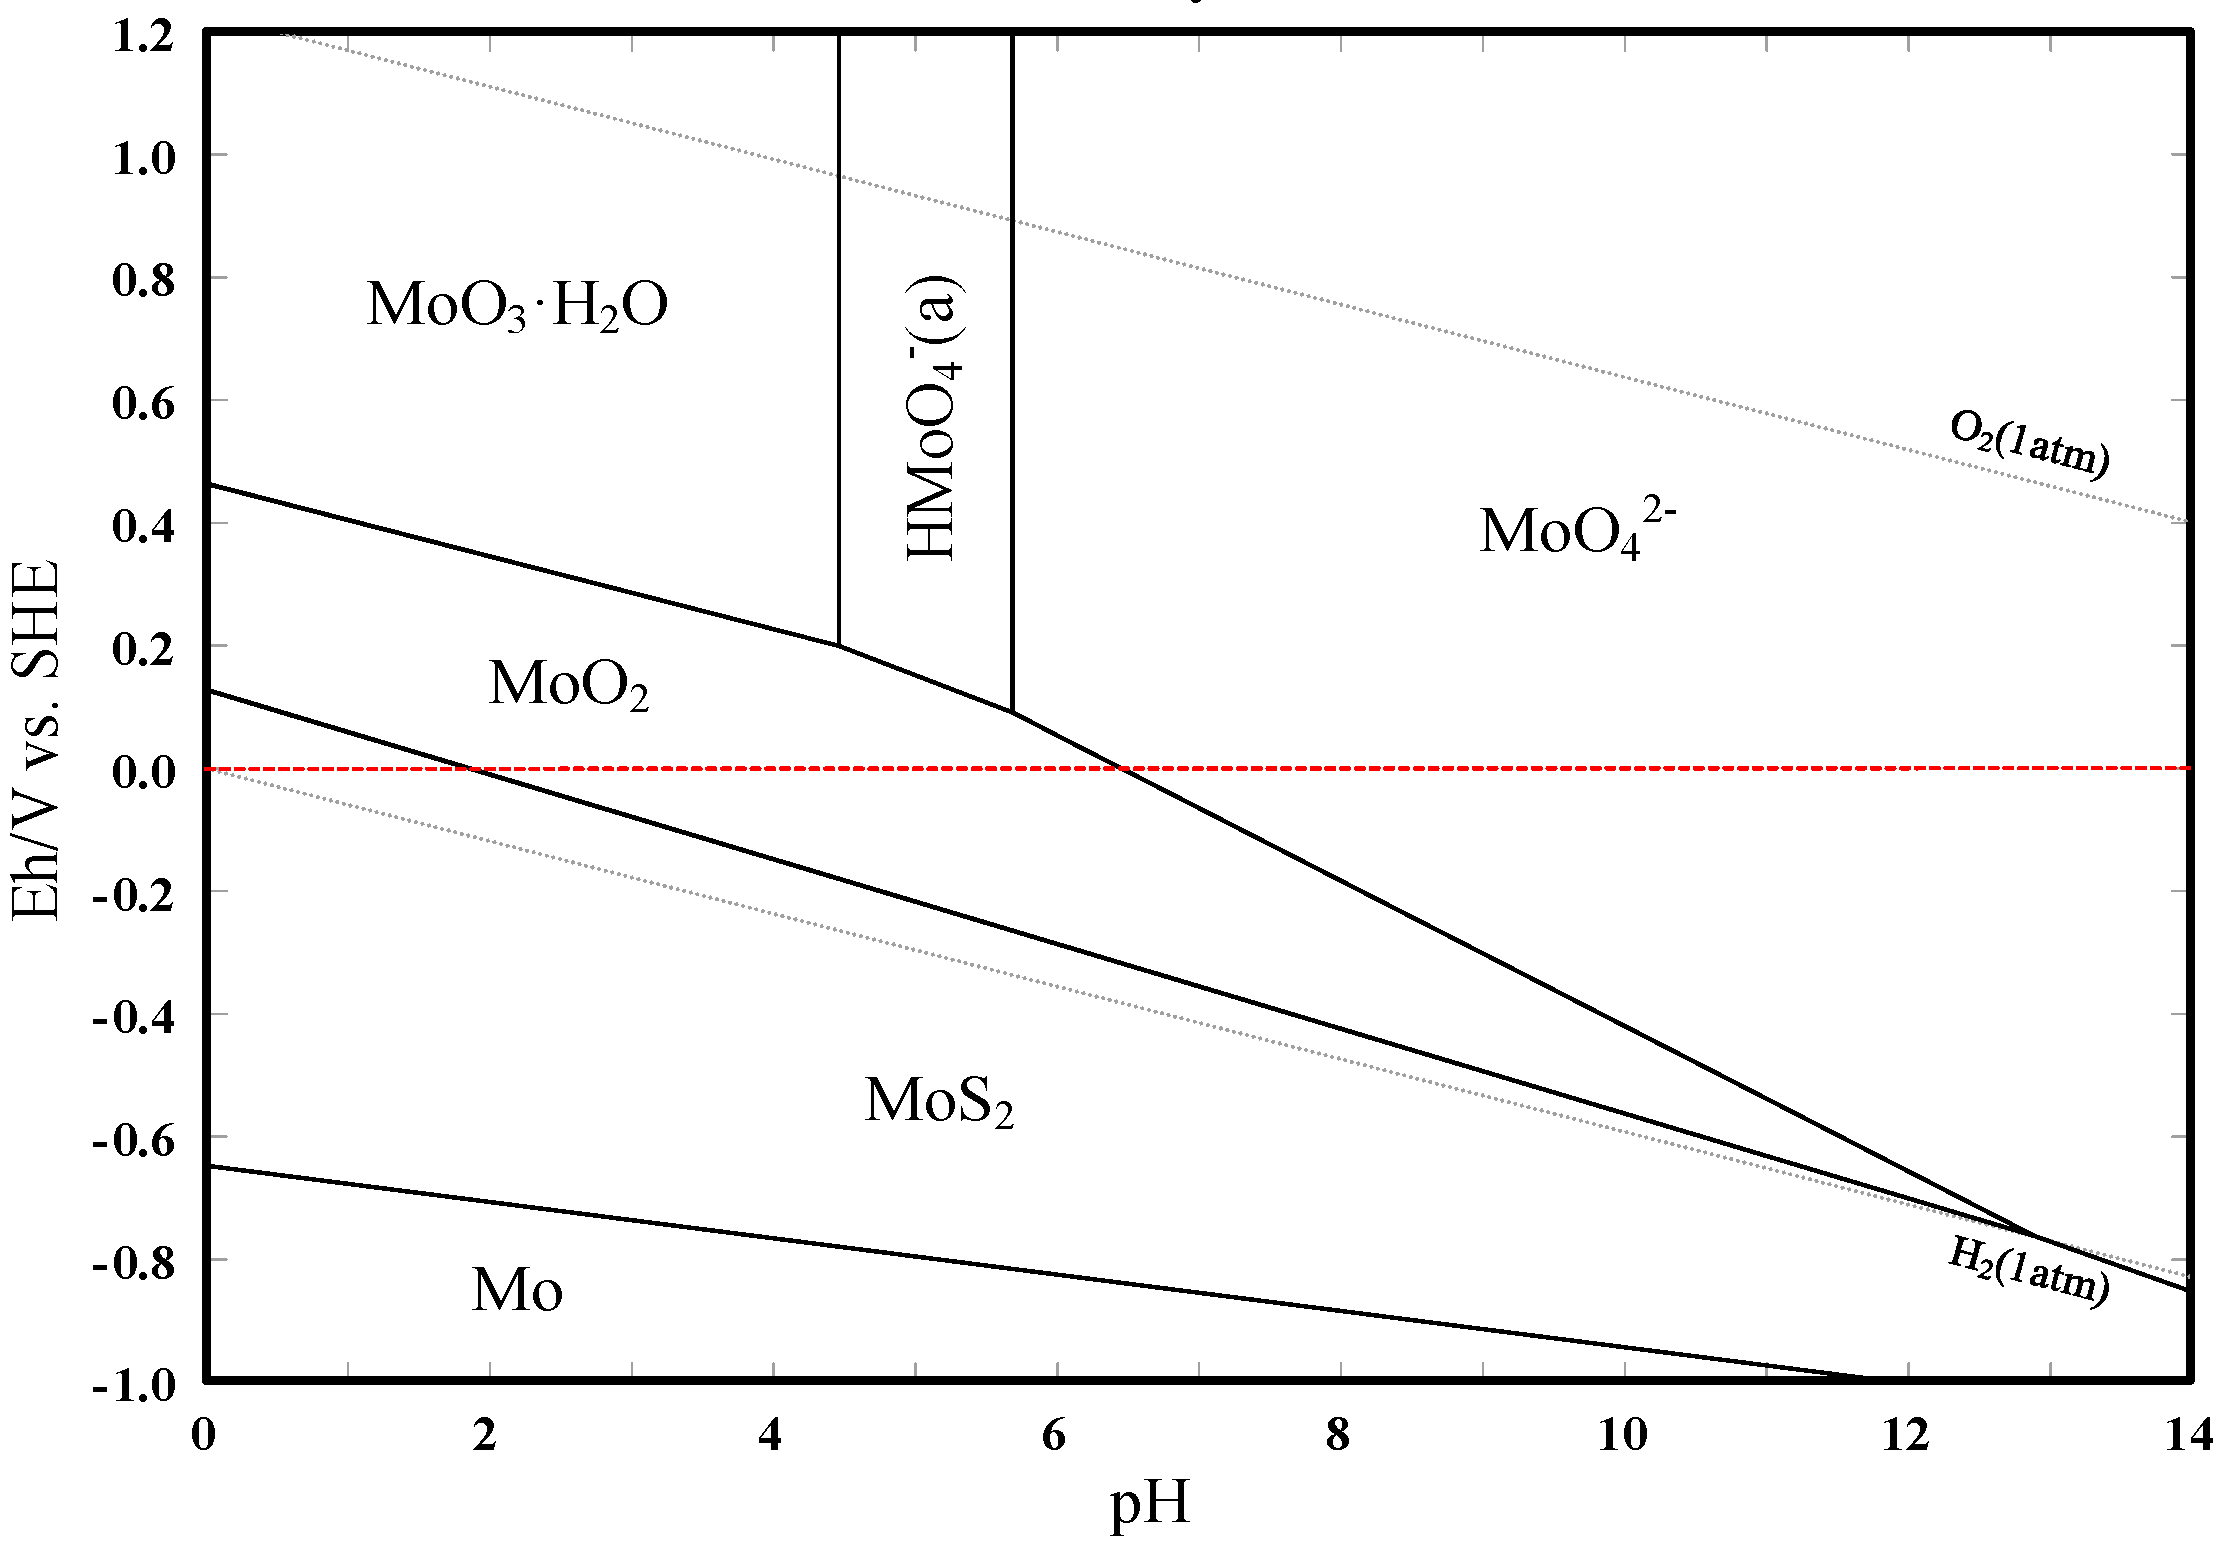
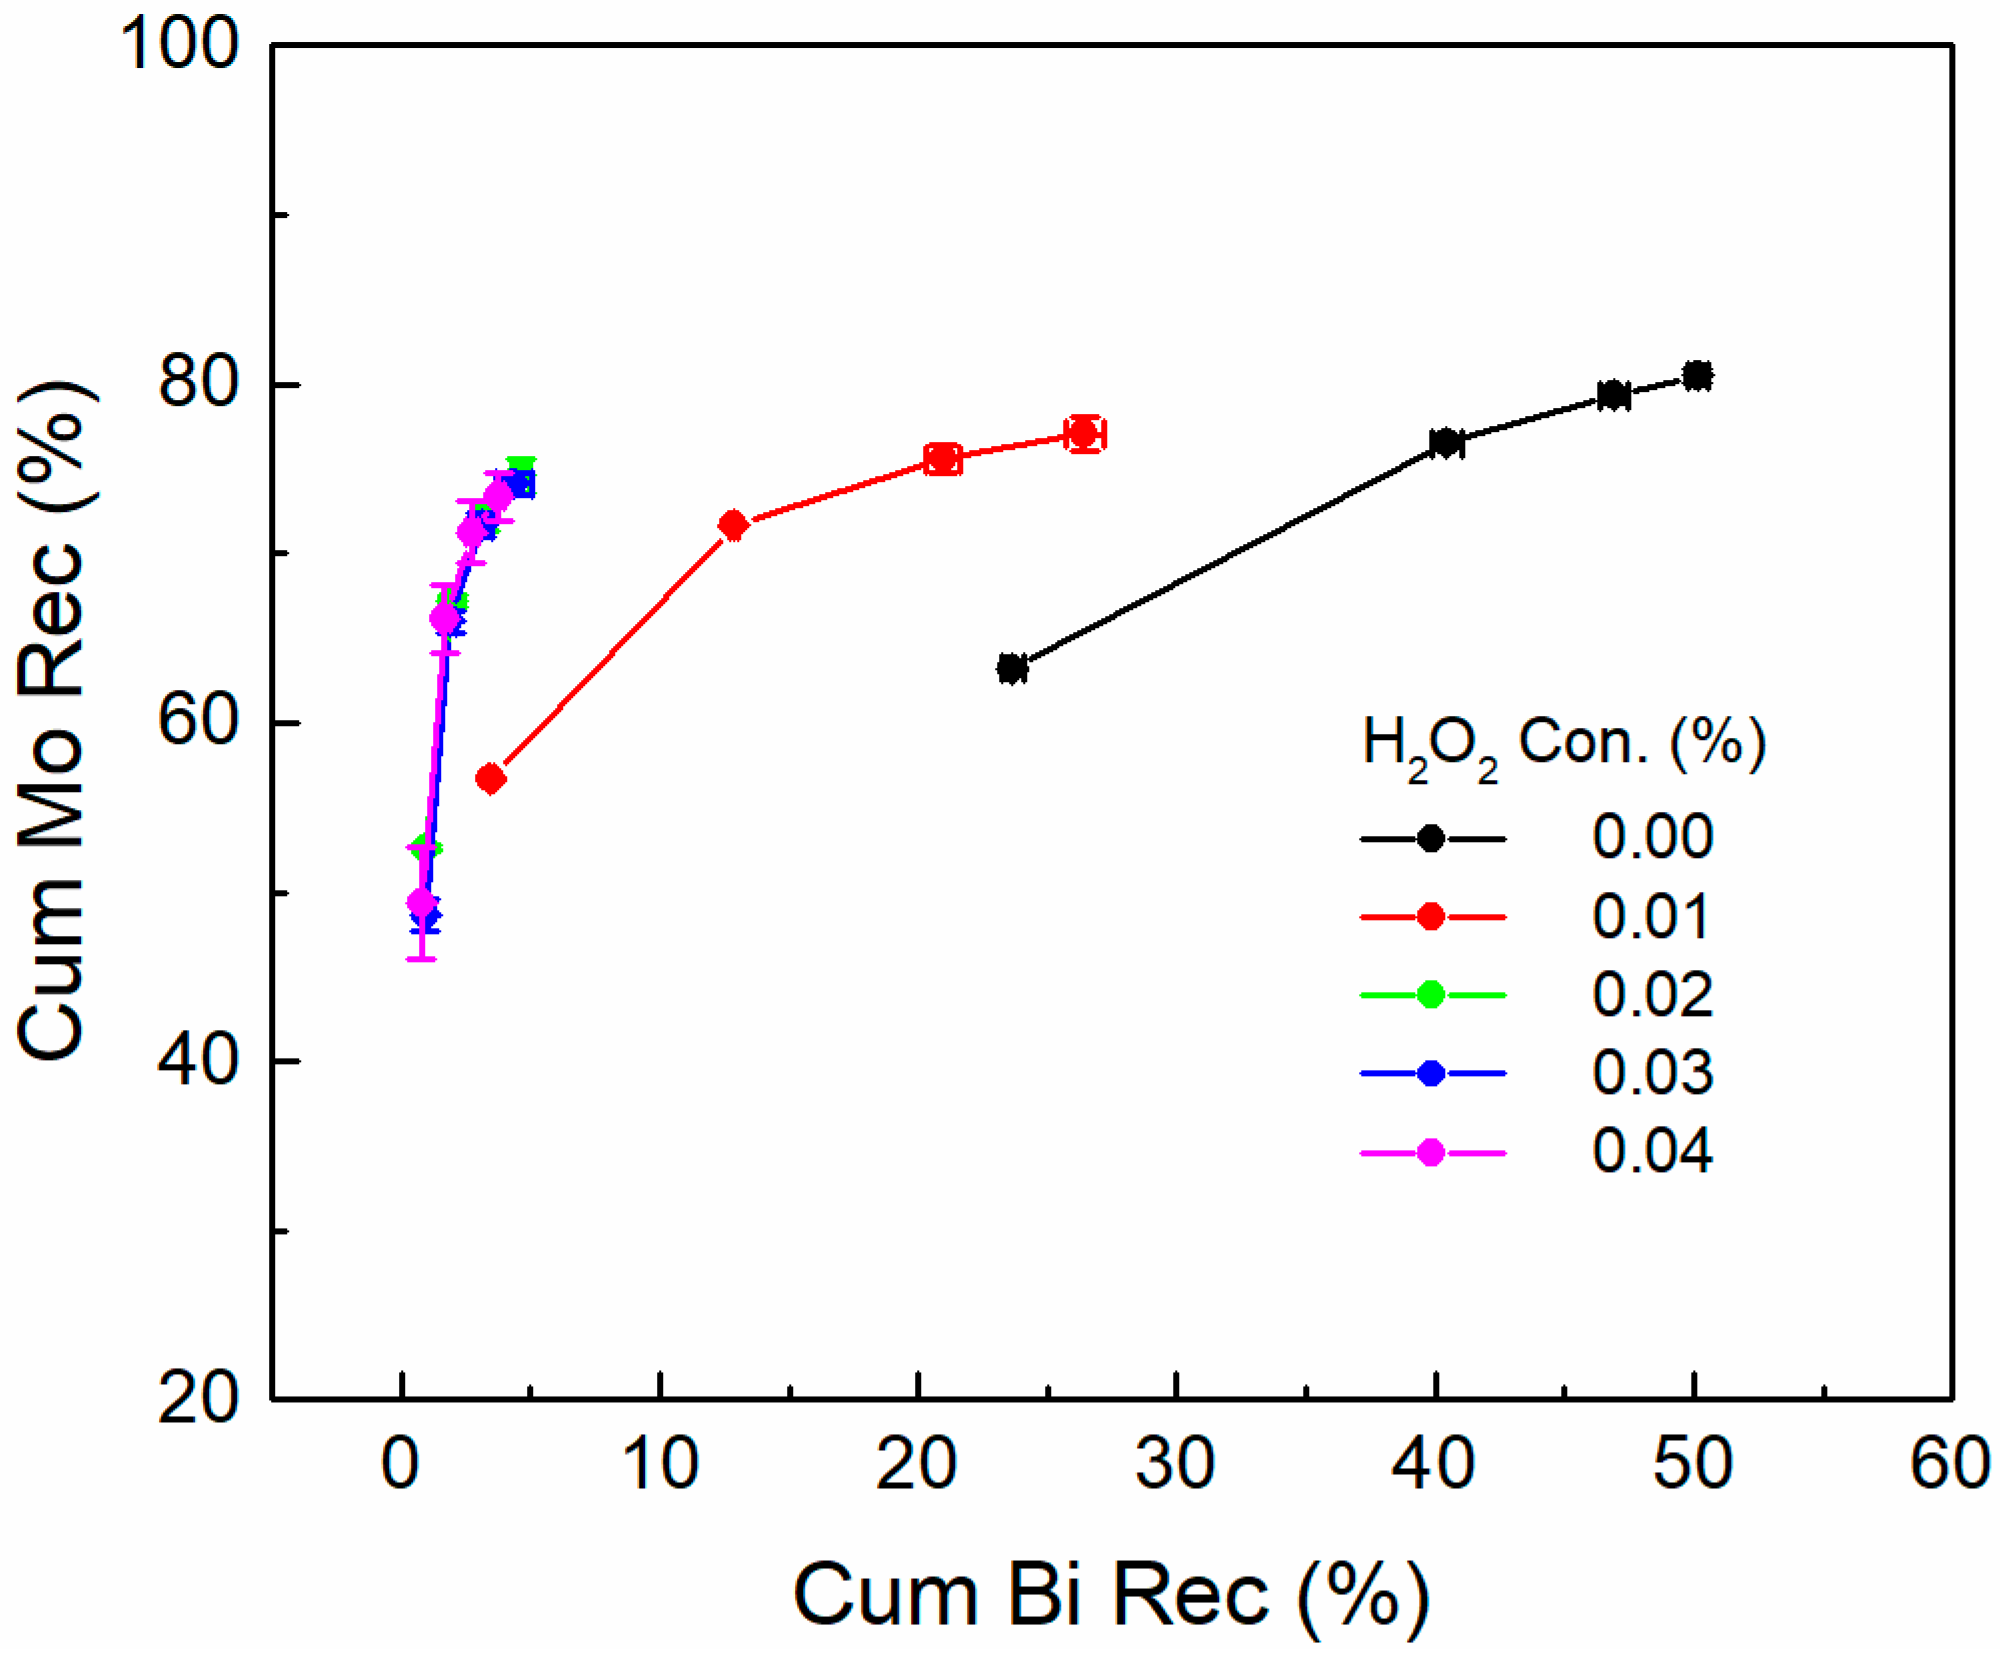
- The results support the possibility of the selective separation of molybdenite and bismuthinite by applying H2O2 into flotation. The separation mechanism might probably be due to the precipitation of oxidation products (e.g., BiO) on the bismuthinite surface that enhances its hydrophilicity. The oxidation products produced by H2O2 on the molybdenite surface dissolved into the solution (e.g., MoO42−), maintaining its hydrophobicity.
Author Contributions
Acknowledgments
Conflicts of Interest
References
- Chen, Y.; Li, H.; Sun, W.; Ireland, T.; Tian, X.; Hu, Y.; Yang, W.; Chen, C.; Xu, D. Generation of late mesozoic qianlishan a 2-type granite in nanling range, south China: Implications for shizhuyuan W-Sn mineralization and tectonic evolution. Lithos 2016, 266, 435–452. [Google Scholar] [CrossRef]
- Yin, J.; Kim, S.J.; Lee, H.K.; Itay, T. K–Ar ages of plutonism and mineralization at the shizhuyuan W-Sn-Bi-Mo deposit, Hunan province, China. J. Asian Earth Sci. 2002, 20, 151–155. [Google Scholar] [CrossRef]
- Cheng, Y.S. Petrogenesis of skarn in shizhuyuan W-polymetallic deposit, southern Hunan, China: Constraints from petrology, mineralogy and geochemistry. Trans. Nonferr. Met. Soc. China 2016, 26, 1676–1687. [Google Scholar] [CrossRef]
- Zhao, P.; Yuan, S.; Mao, J.; Yuan, Y.; Zhao, H.; Zhang, D.; Shuang, Y. Constraints on the timing and genetic link of the large-scale accumulation of proximal W-Sn-Mo-Bi and distal Pb-Zn-Ag mineralization of the world-class dongpo orefield, Nanling range, south China. Ore Geol. Rev. 2018, 95, 1140–1160. [Google Scholar] [CrossRef]
- Ding, F.; Zhan, J.; Wang, Z.; Chai, L.; Zhang, C. Simultaneous leaching of low grade bismuthinite and pyrolusite ores in hydrochloric acid medium. Hydrometallurgy 2016, 166, 279–284. [Google Scholar] [CrossRef]
- Zhang, F.; Lin, R.; Zeng, Q.; Zhang, X. Experimental research on the beneficiation of Mo-Bi-W polymetallic ore from Jiangxi. Metal. Mine 2009, 1, 024. [Google Scholar]
- Li, A. New process of flotation separation of associated Mo-Cu-Bi sulfide ore of xingluokeng tungsten ore. Metal. Mine 2012, 4, 74–78. [Google Scholar]
- Han, Z.; Guan, Z. Status quo of research on copper-bismuth separation. Metal. Mine 2008, 4, 75–76. [Google Scholar]
- Huang, P.; Cao, M.; Liu, Q. Using chitosan as a selective depressant in the differential flotation of Cu-Pb sulfides. Int. J. Miner. Process. 2012, 106, 8–15. [Google Scholar] [CrossRef]
- Huang, P.; Wang, L.; Liu, Q. Depressant function of high molecular weight polyacrylamide in the xanthate flotation of chalcopyrite and galena. Int. J. Miner. Process. 2014, 128, 6–15. [Google Scholar] [CrossRef]
- Suyantara, G.P.W.; Hirajima, T.; Miki, H.; Sasaki, K.; Yamane, M.; Takida, E.; Kuroiwa, S.; Imaizumi, Y. Selective flotation of chalcopyrite and molybdenite using H2O2 oxidation method with the addition of ferrous sulfate. Miner. Eng. 2018, 122, 312–326. [Google Scholar] [CrossRef]
- Castro, S.; Lopez-Valdivieso, A.; Laskowski, J.S. Review of the flotation of molybdenite. Part I: Surface properties and floatability. Int. J. Miner. Process. 2016, 148, 48–58. [Google Scholar] [CrossRef]
- Yuan, K. Study on cyanide free separation of Cu-Bi mixed concentrate. Hunan Nonferr. Met. 1988, 1988, 24–26. [Google Scholar]
- Liu, Q.; Zhang, Y.; Laskowski, J.S. The adsorption of polysaccharides onto mineral surfaces: An acid/base interaction. Int. J. Miner. Process. 2000, 60, 229–245. [Google Scholar] [CrossRef]
- Bulatovic, S.M. Use of organic polymers in the flotation of polymetallic ores: A review. Miner. Eng. 1999, 12, 341–354. [Google Scholar] [CrossRef]
- Mu, Y.; Peng, Y.; Lauten, R.A. The depression of pyrite in selective flotation by different reagent systems—A literature review. Miner. Eng. 2016, 96, 143–156. [Google Scholar] [CrossRef]
- Chimonyo, W.; Wiese, J.; Corin, K.; O’Connor, C. The use of oxidising agents for control of electrochemical potential in flotation. Miner. Eng. 2017, 109, 135–143. [Google Scholar] [CrossRef]
- Nooshabadi, A.J.; Rao, K.H. Formation of hydrogen peroxide by galena and its influence on flotation. Adv. Powder Technol. 2014, 25, 832–839. [Google Scholar] [CrossRef]
- Hirajima, T.; Miki, H.; Suyantara, G.P.; Matsuoka, H.; Elmahdy, A.M.; Sasaki, K.; Imaizumi, Y.; Kuroiwa, S. Selective flotation of chalcopyrite and molybdenite with H2O2 oxidation. Miner. Eng. 2017, 100, 83–92. [Google Scholar] [CrossRef]
- Wang, D. Development of Flotation Theory; Science Press: Beijing, China, 1992; pp. 79–143. [Google Scholar]
- Hu, Y.; Sun, W.; Wang, D. Electrochemistry of Flotation of Sulphide Minerals; Springer: Berlin, Germany, 2009; pp. 142–166. [Google Scholar]
- Tao, D.; Luttrell, G.H.; Yoon, R.H. A parametric study of froth stability and its effect on column flotation of fine particles. Int. J. Miner. Process. 2000, 59, 25–43. [Google Scholar] [CrossRef]
- Cho, Y.S.; Laskowski, J.S. Effect of flotation frothers on bubble size and foam stability. Int. J. Miner. Process. 2002, 64, 69–80. [Google Scholar] [CrossRef]
- Ekmekçi, Z.; Bradshaw, D.J.; Allison, S.A.; Harris, P.J. Effects of frother type and froth height on the flotation behaviour of chromite in UG2 ore. Miner. Eng. 2003, 16, 941–949. [Google Scholar] [CrossRef]
- Zheng, X.; Johnson, N.W.; Franzidis, J.P. Modelling of entrainment in industrial flotation cells: Water recovery and degree of entrainment. Miner. Eng. 2006, 19, 1191–1203. [Google Scholar] [CrossRef]
- Chimonyo, W.; Corin, K.C.; Wiese, J.G.; O’Connor, C.T. Redox potential control during flotation of a sulphide mineral ore. Miner. Eng. 2017, 110, 57–64. [Google Scholar] [CrossRef]
- Wiese, J.G. Investigating Depressant Behaviour in the Flotation of Selected Merensky Ores. Master’s Thesis, University of Cape Town, Cape Town, South Africa, 2009. [Google Scholar]
- Corin, K.C.; Wiese, J.G. Investigating froth stability: A comparative study of ionic strength and frother dosage. Miner. Eng. 2014, 66, 130–134. [Google Scholar] [CrossRef]
- Wiese, J.G.; Harris, P.J.; Bradshaw, D.J. The effect of increased frother dosage on froth stability at high depressant dosages. Miner. Eng. 2010, 23, 1010–1017. [Google Scholar] [CrossRef]
- Manono, M.S.; Corin, K.C.; Wiese, J.G. The effect of ionic strength of plant water on foam stability: A 2-phase flotation study. Miner. Eng. 2013, 40, 42–47. [Google Scholar] [CrossRef]
- Xu, M. Modified flotation rate constant and selectivity index. Miner. Eng. 1998, 11, 271–278. [Google Scholar] [CrossRef]
- Dowling, E.C.; Klimpel, R.R.; Aplan, F.F. Model discrimination in the flotation of a porphyry copper ore. Miner. Metall. Process. 1985, 2, 87–101. [Google Scholar]
- Polat, M.; Chander, S. First-order flotation kinetics models and methods for estimation of the true distribution of flotation rate constants. Int. J. Miner. Process. 2000, 58, 145–166. [Google Scholar] [CrossRef]
- Lynch, A.J.; Johnson, N.W.; Manlapig, E.V.; Thorne, C.G. Mineral and Coal Flotation Circuits; Elsevier Scientific Pub. Co.: Amsterdam, The Netherlands, 1981. [Google Scholar]
- Wills, B.A.; Napiermunn, T.J. Wills’ Mineral Processing Technology: An Introduction to the Practical Aspects of Ore Treatment and Mineral Recovery; Pergamon Press: Oxford, UK, 2006; pp. 651–659. [Google Scholar]
- Agar, G.E. The optimization of flotation circuit design from laboratory rate data. In Proceedings of the 15th International Mineral Processing Congress, Cannes, France, 1985; p. 100. [Google Scholar]
- Sheni, N.; Corin, K.; Wiese, J. Considering the effect of pulp chemistry during flotation on froth stability. Miner. Eng. 2018, 116, 15–23. [Google Scholar] [CrossRef]
- Savassi, O.N. Direct Estimation of the Degree of Entrainment and the Froth Recovery of Attached Particles in Industrial Flotation Cells. Ph.D. Thesis, The University of Queensland, Queensland, Australia, 1998. [Google Scholar]
- Kampf, A.R. HANDBOOK OF MINERALOGY, VOLUME: V. Borates, Carbonates, Sulfates. By John W. Anthony, Richard A. Bideaux, Kenneth W. Bladh, and Monte C. Nichols. Mineral Data Publishing, Tucson, Arizona; 2003, 813 p., $130 ($97.50 for MSA members). Am. Mineral. 2003, 88, 1842. [Google Scholar]
- Mindat Org. Kornerupina: Mineral Data Publishing. Available online: https://www.mindat.org/min-2254.html (accessed on 5 September 2018).
- Lince, J.R.; Carre, D.J.; Fleischauer, P.D. Effects of argon-ion bombardment on the basal plane surface of molybdenum disulfide. Langmuir 1986, 2, 805–808. [Google Scholar] [CrossRef]
- Turner, N.H.; Single, A.M. Determination of peak positions and areas from wide-scan XPS spectra. Surf. Interface Anal. 1990, 15, 215–222. [Google Scholar] [CrossRef]
- Benoist, L.; Gonbeau, D.; Pfister-Guillouzo, G.; Schmidt, E.; Meunier, G.; Levasseur, A. XPS analysis of lithium intercalation in thin films of molybdenum oxysulphides. Surf. Interface Anal. 1994, 22, 206–210. [Google Scholar] [CrossRef]
- Stevens, G.C.; Edmonds, T. Electron spectroscopy for chemical analysis spectra of molybdenum sulfides. J. Catal. 1975, 37, 544–547. [Google Scholar] [CrossRef]
- Zhuang, S.; Hall, W.K.; Ertl, G.; Knözinger, H. X-ray photoemission study of oxygen and nitric oxide adsorption on MoS2. J. Catal. 1986, 100, 167–175. [Google Scholar]
- Han, M.; Jia, J. The interlace of Bi2S3 nanowires with TiO2 nanorods: An effective strategy for high photoelectrochemical performance. J. Colloid Interface Sci. 2016, 481, 91–99. [Google Scholar] [CrossRef] [PubMed]
- Wang, Y.; Chen, J.; Jiang, L.; Sun, K.; Liu, F.; Lai, Y. Photoelectrochemical properties of Bi2S3 thin films deposited by successive ionic layer adsorption and reaction (SILAR) method. J. Alloys Compd. 2016, 686, 684–692. [Google Scholar] [CrossRef]
- Xu, W.; Fang, J.; Chen, Y.; Lu, S.; Zhou, G.; Zhu, X.; Fang, Z. Novel heterostructured Bi2S3/Bi2Sn2O7 with highly visible light photocatalytic activity for the removal of rhodamine B. Mater. Chem. Phys. 2015, 154, 30–37. [Google Scholar] [CrossRef]
- Díaz-Cruz, E.B.; Castelo-González, O.A.; Martínez-Alonso, C.; Montiel-González, Z.; Arenas-Arrocena, M.C.; Hu, H. Morphology control in microwave synthesized bismuth sulfide by using different bismuth salts. Mater. Sci. Semicond. Process. 2018, 75, 311–318. [Google Scholar] [CrossRef]
- Kumar, D.R.; Kesavan, S.; Baynosa, M.L.; Nguyen, V.Q.; Shim, J.J. Flower-like Bi2S3 nanostructures grown on nitrogen-doped reduced graphene oxide for electrochemical determination of hydrogen peroxide. J. Colloid Interface Sci. 2018, 530, 361–371. [Google Scholar] [CrossRef] [PubMed]
- Tamašauskaitė-Tamašiūnaitė, L.; Valiulienė, G.; Žielienė, A.; Šimkūnaitė-Stanynienė, B.; Naruškevičius, L.; Sudavičius, A. EQCM study on the oxidation/reduction of bismuth sulfide thin films. J. Electroanal. Chem. 2010, 642, 22–29. [Google Scholar] [CrossRef]
- Mi, Y.; Li, H.; Zhang, Y.; Zhang, R.; Hou, W. One-pot synthesis of belt-like Bi2S3/BiOCl hierarchical composites with enhanced visible light photocatalytic activity. Appl. Surf. Sci. 2017, 423, 1062–1071. [Google Scholar] [CrossRef]


| Mineral | Wt % | Mineral | Wt % |
|---|---|---|---|
| Bismuthinite | 0.10 | Sericite | 4.50 |
| Molybdenite | 0.08 | Chlorite | 3.50 |
| Scheelite | 0.37 | Hornblende | 2.00 |
| Wolframite | 0.05 | Kaolinite | 2.00 |
| Cassiterite | 0.09 | Feldspar | 2.00 |
| Bismutite | 0.02 | Diopside | 1.50 |
| Magnetite | 2.00 | Idocrase | 0.50 |
| Pyrite | 1.20 | Calcite | 7.00 |
| Fluorite | 21.50 | Dolomite | 1.00 |
| Quartz | 20.00 | Other | 0.59 |
| Garnet | 30.00 | Total | 100.00 |
| H2O2 Concentration (%) | MoS2 | Bi2S3 | S.I.(Mo/Bi) | ||
|---|---|---|---|---|---|
| k (min−1) | Rmax (%) | k (min−1) | Rmax (%) | ||
| 0.00 | 0.76 | 80.51 | 0.30 | 50.14 | 4.07 |
| 0.01 | 0.63 | 77.07 | 0.10 | 30.50 | 15.92 |
| 0.02 | 0.60 | 74.61 | 0.09 | 5.00 | 99.48 |
| 0.03 | 0.46 | 74.13 | 0.09 | 5.00 | 75.78 |
| 0.04 | 0.46 | 73.36 | 0.08 | 4.50 | 93.74 |
| Compound | Mo | MoS2 | MoO2 | MoO3·H2O | HMoO4−(a) | MoO42− |
| 0.00 | −63.86 | −127.17 | −219.15 | −207.61 | −199.85 | |
| Compound | HS−(a) | S4O32−(a) | S3O32−(a) | SO42−(a) | HS2O7−(a) | HS2O8−(a) |
| 2.97 | −228.82 | −197.70 | −177.91 | −328.06 | −360.97 |
© 2018 by the authors. Licensee MDPI, Basel, Switzerland. This article is an open access article distributed under the terms and conditions of the Creative Commons Attribution (CC BY) license (http://creativecommons.org/licenses/by/4.0/).
Share and Cite
Lin, S.; Liu, R.; Sun, W.; Hu, Y.; Han, H. Effect of H2O2 on the Separation of Mo-Bi-Containing Ore by Flotation. Minerals 2018, 8, 402. https://doi.org/10.3390/min8090402
Lin S, Liu R, Sun W, Hu Y, Han H. Effect of H2O2 on the Separation of Mo-Bi-Containing Ore by Flotation. Minerals. 2018; 8(9):402. https://doi.org/10.3390/min8090402
Chicago/Turabian StyleLin, Shangyong, Runqing Liu, Wei Sun, Yuehua Hu, and Haisheng Han. 2018. "Effect of H2O2 on the Separation of Mo-Bi-Containing Ore by Flotation" Minerals 8, no. 9: 402. https://doi.org/10.3390/min8090402
APA StyleLin, S., Liu, R., Sun, W., Hu, Y., & Han, H. (2018). Effect of H2O2 on the Separation of Mo-Bi-Containing Ore by Flotation. Minerals, 8(9), 402. https://doi.org/10.3390/min8090402