Oxidative Depression of Arsenopyrite by Using Calcium Hypochlorite and Sodium Humate

 , , ,
, , , 


Abstract
:1. Introduction
2. Materials and Methods
2.1. Materials
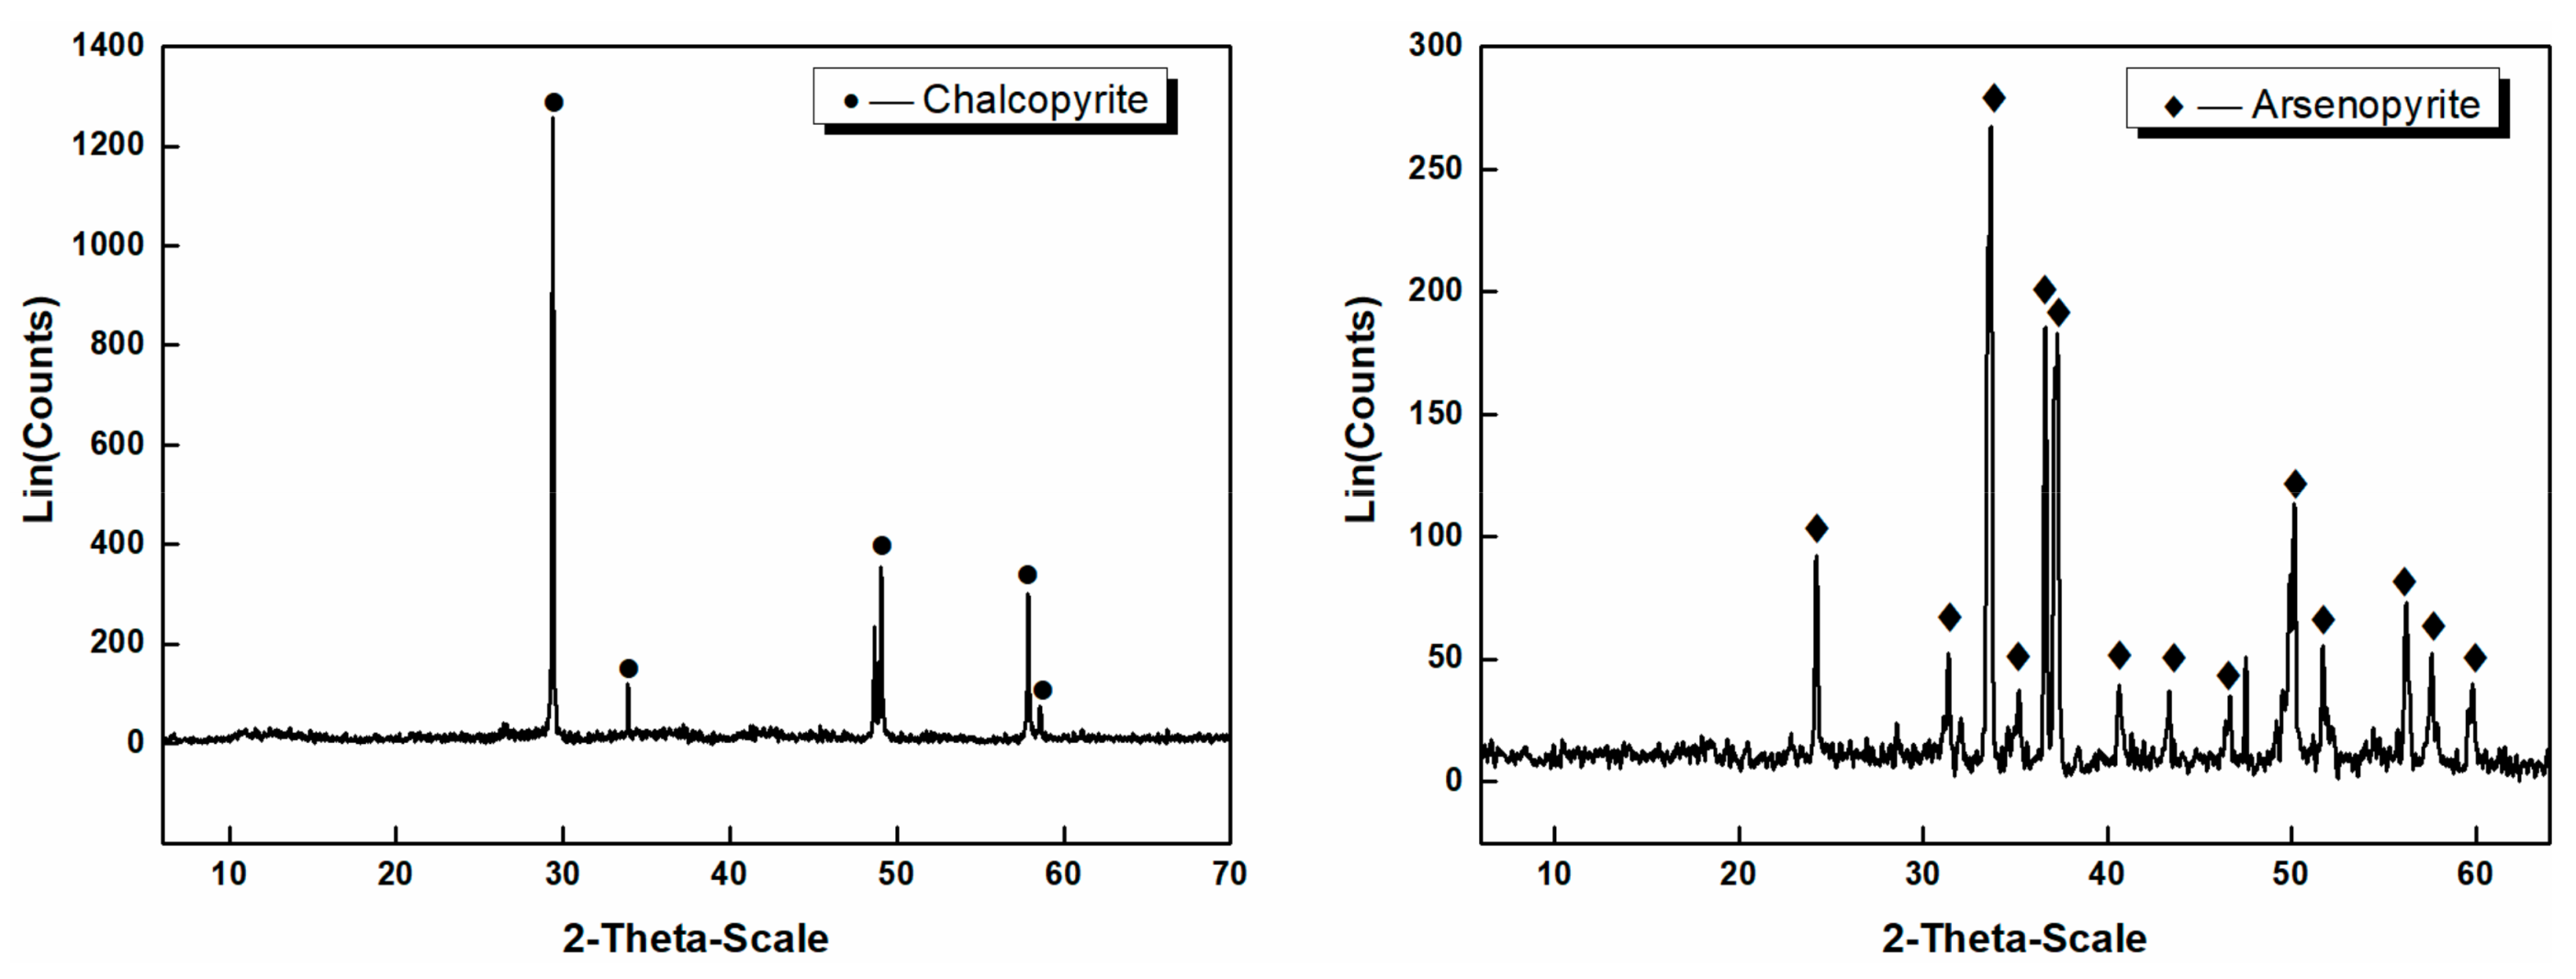
2.1.1. Minerals
2.1.2. Reagents
2.2. Methods
2.2.1. Flotation Study
2.2.2. Zeta Potential Measurement
2.2.3. FTIR Spectroscopic Measurements
2.2.4. X-ray Photoelectron Spectroscopy
3. Results and Discussion
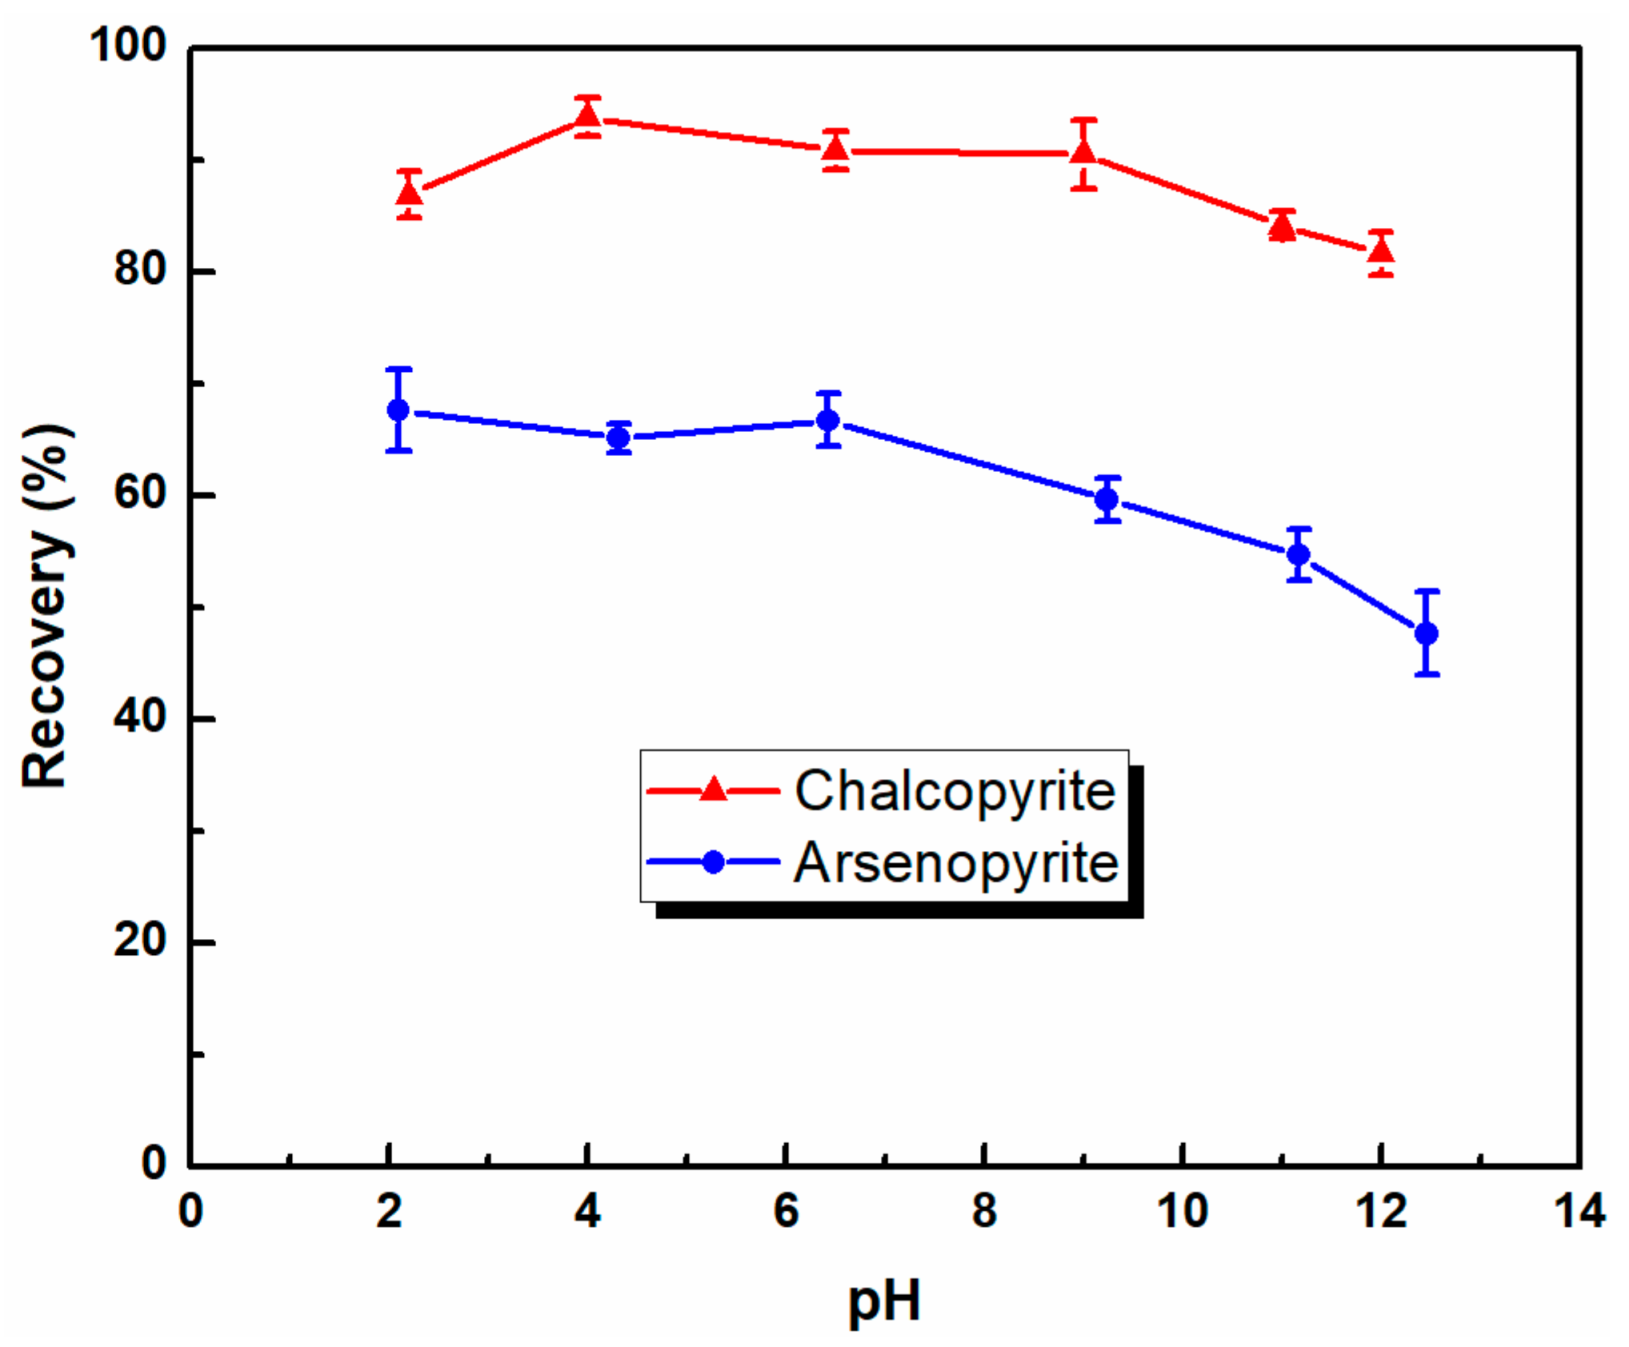
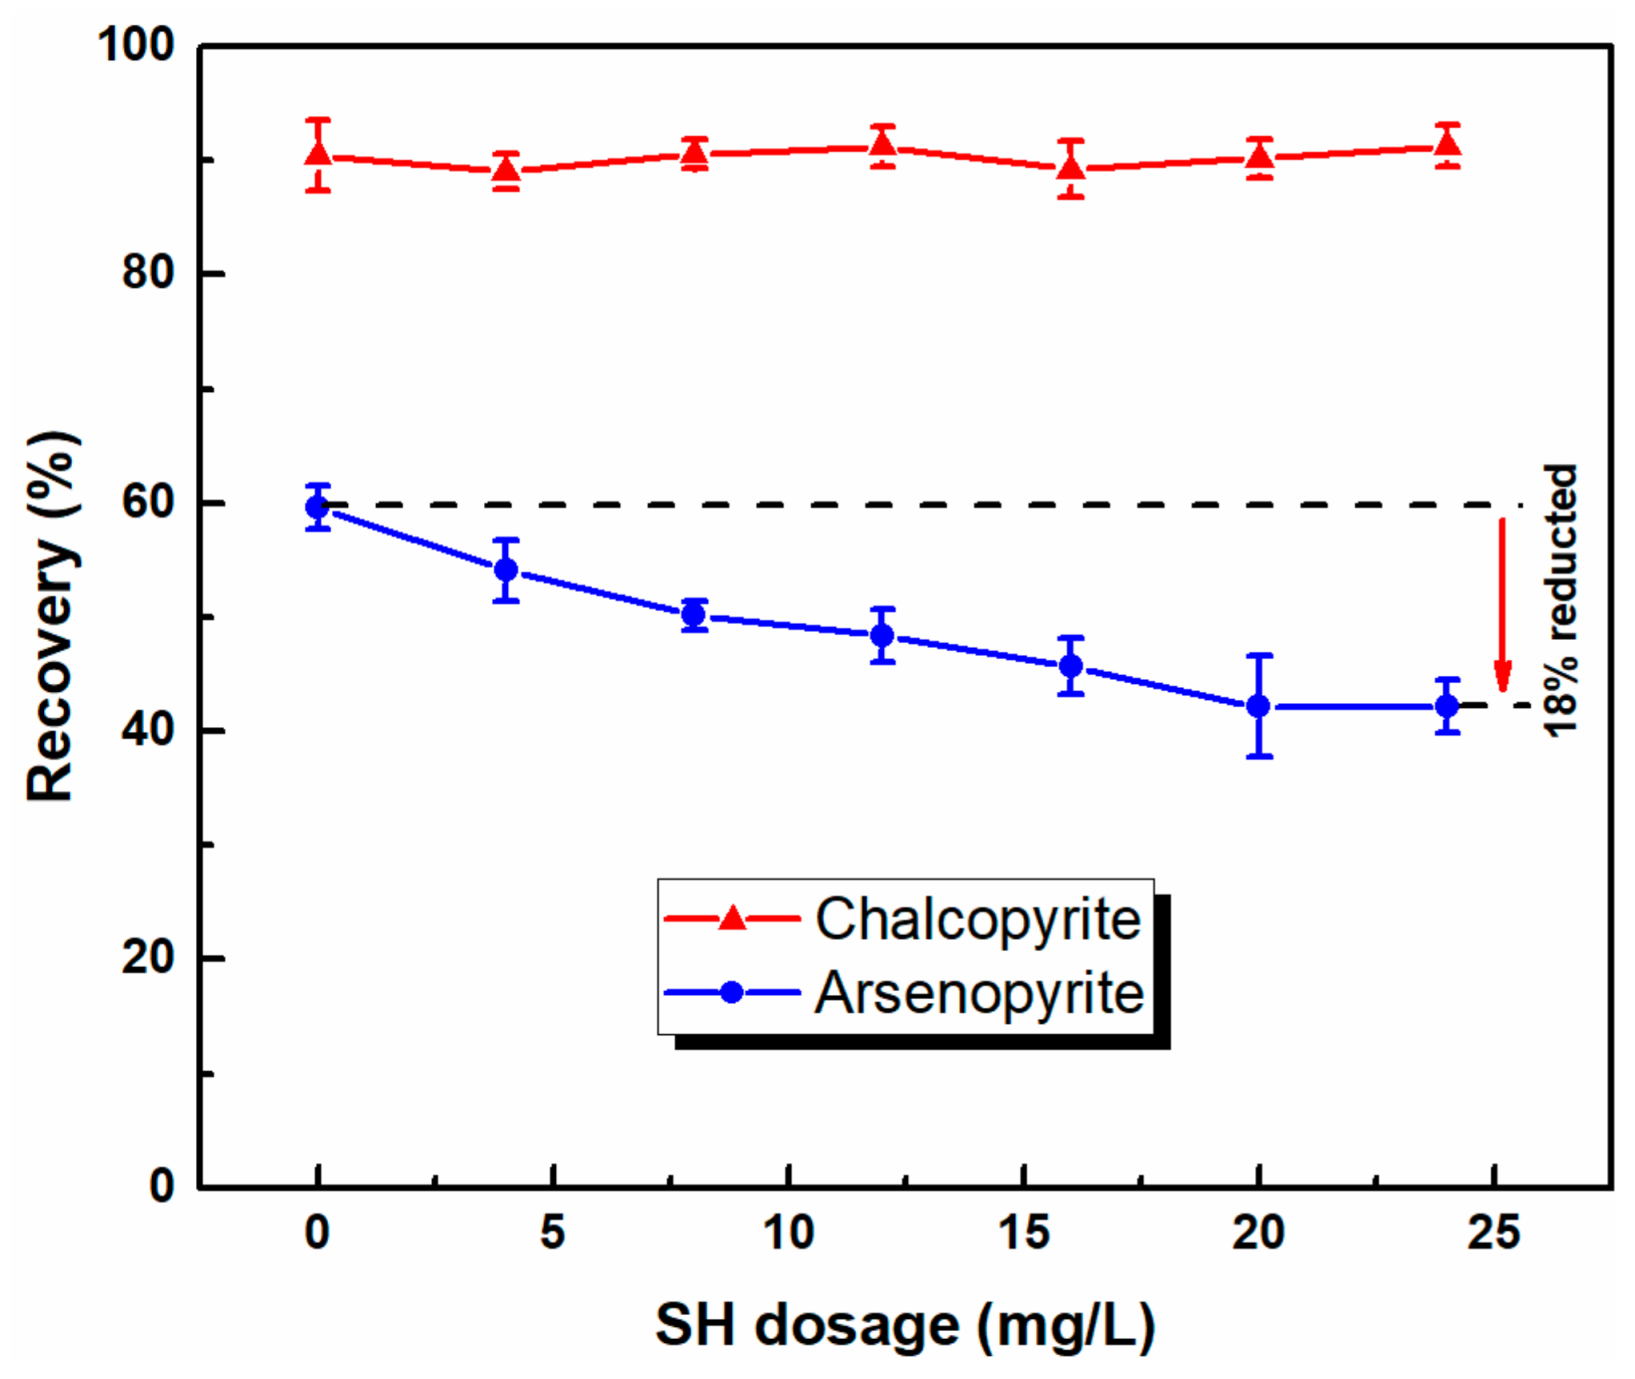
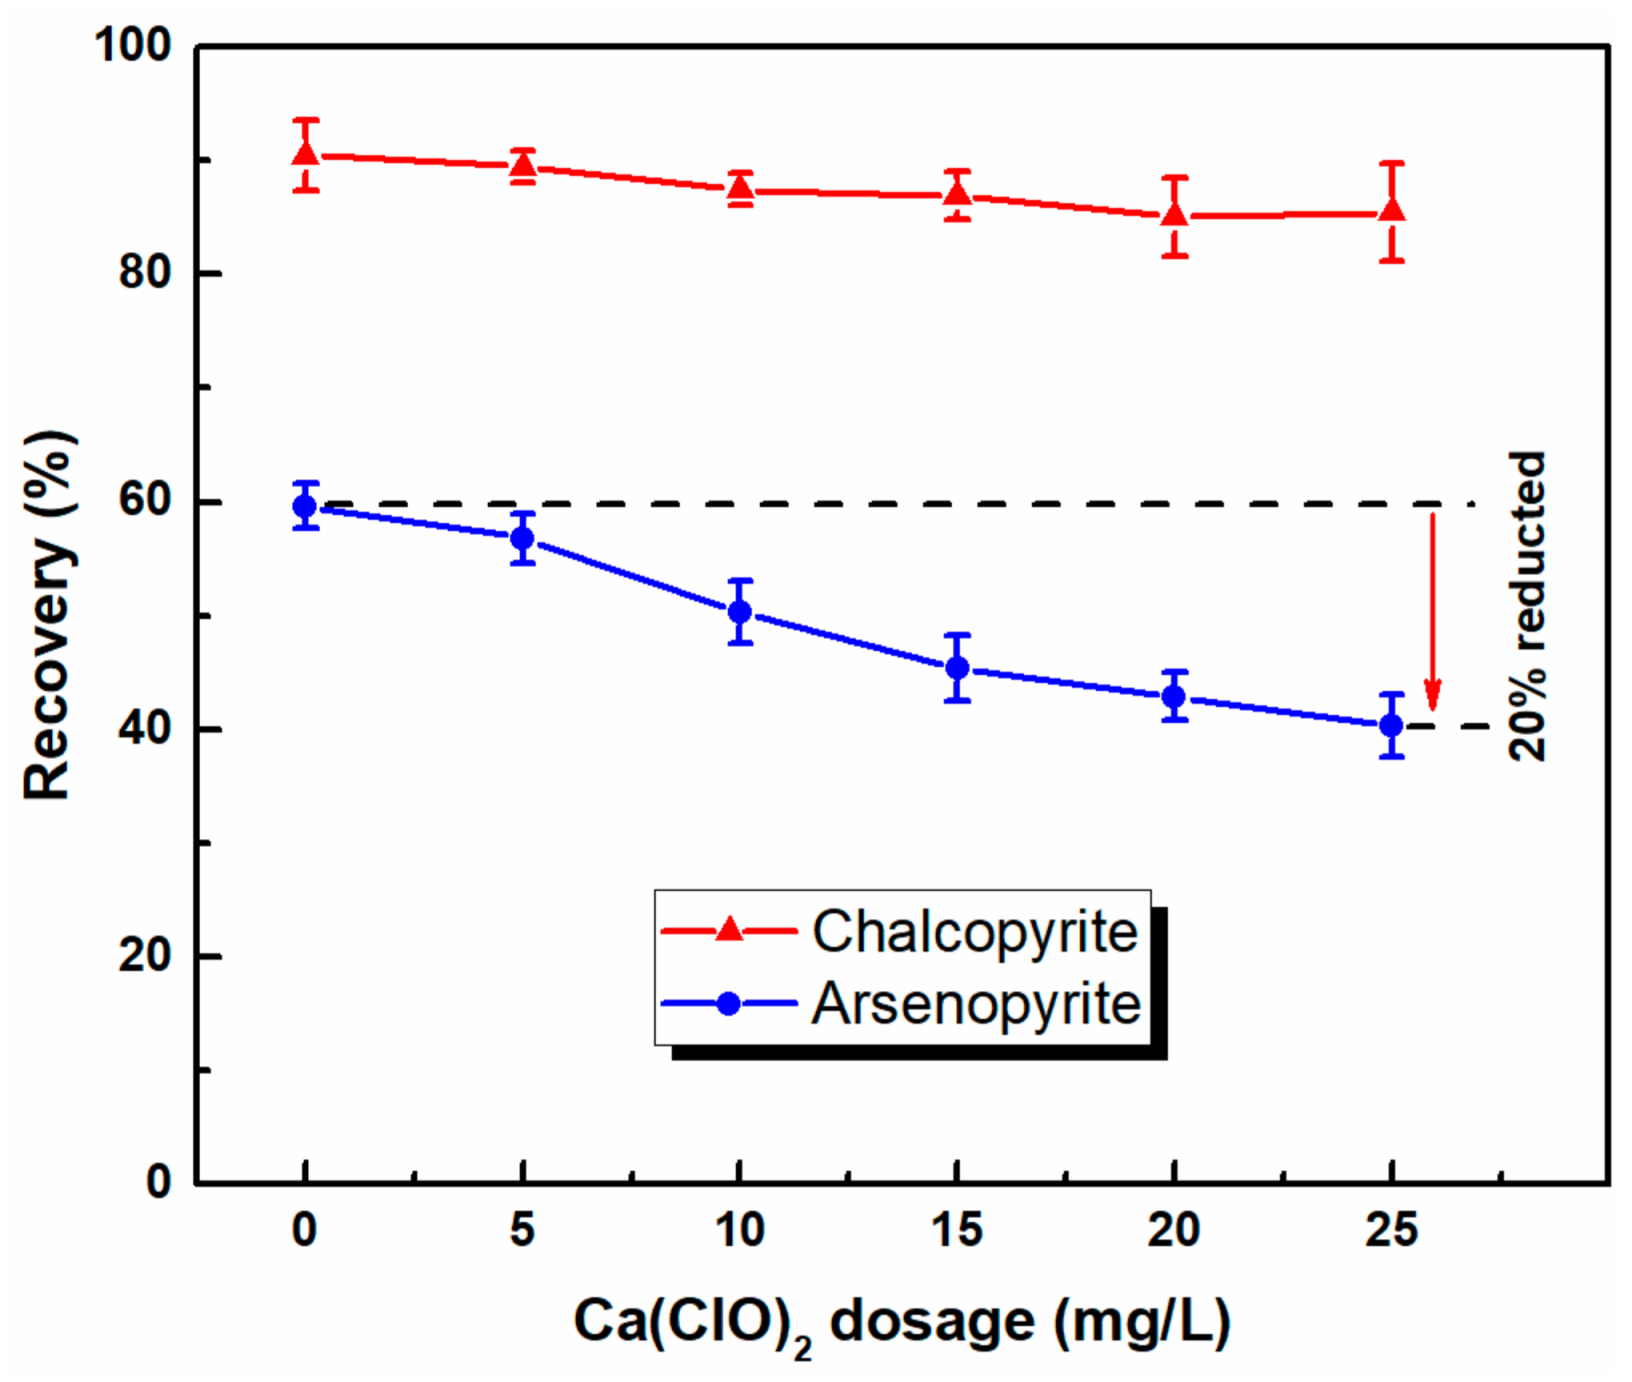
3.1. Microflotation of Pure Mineral
3.2. Flotation Separation of Mixed Minerals
3.3. Zeta Potential
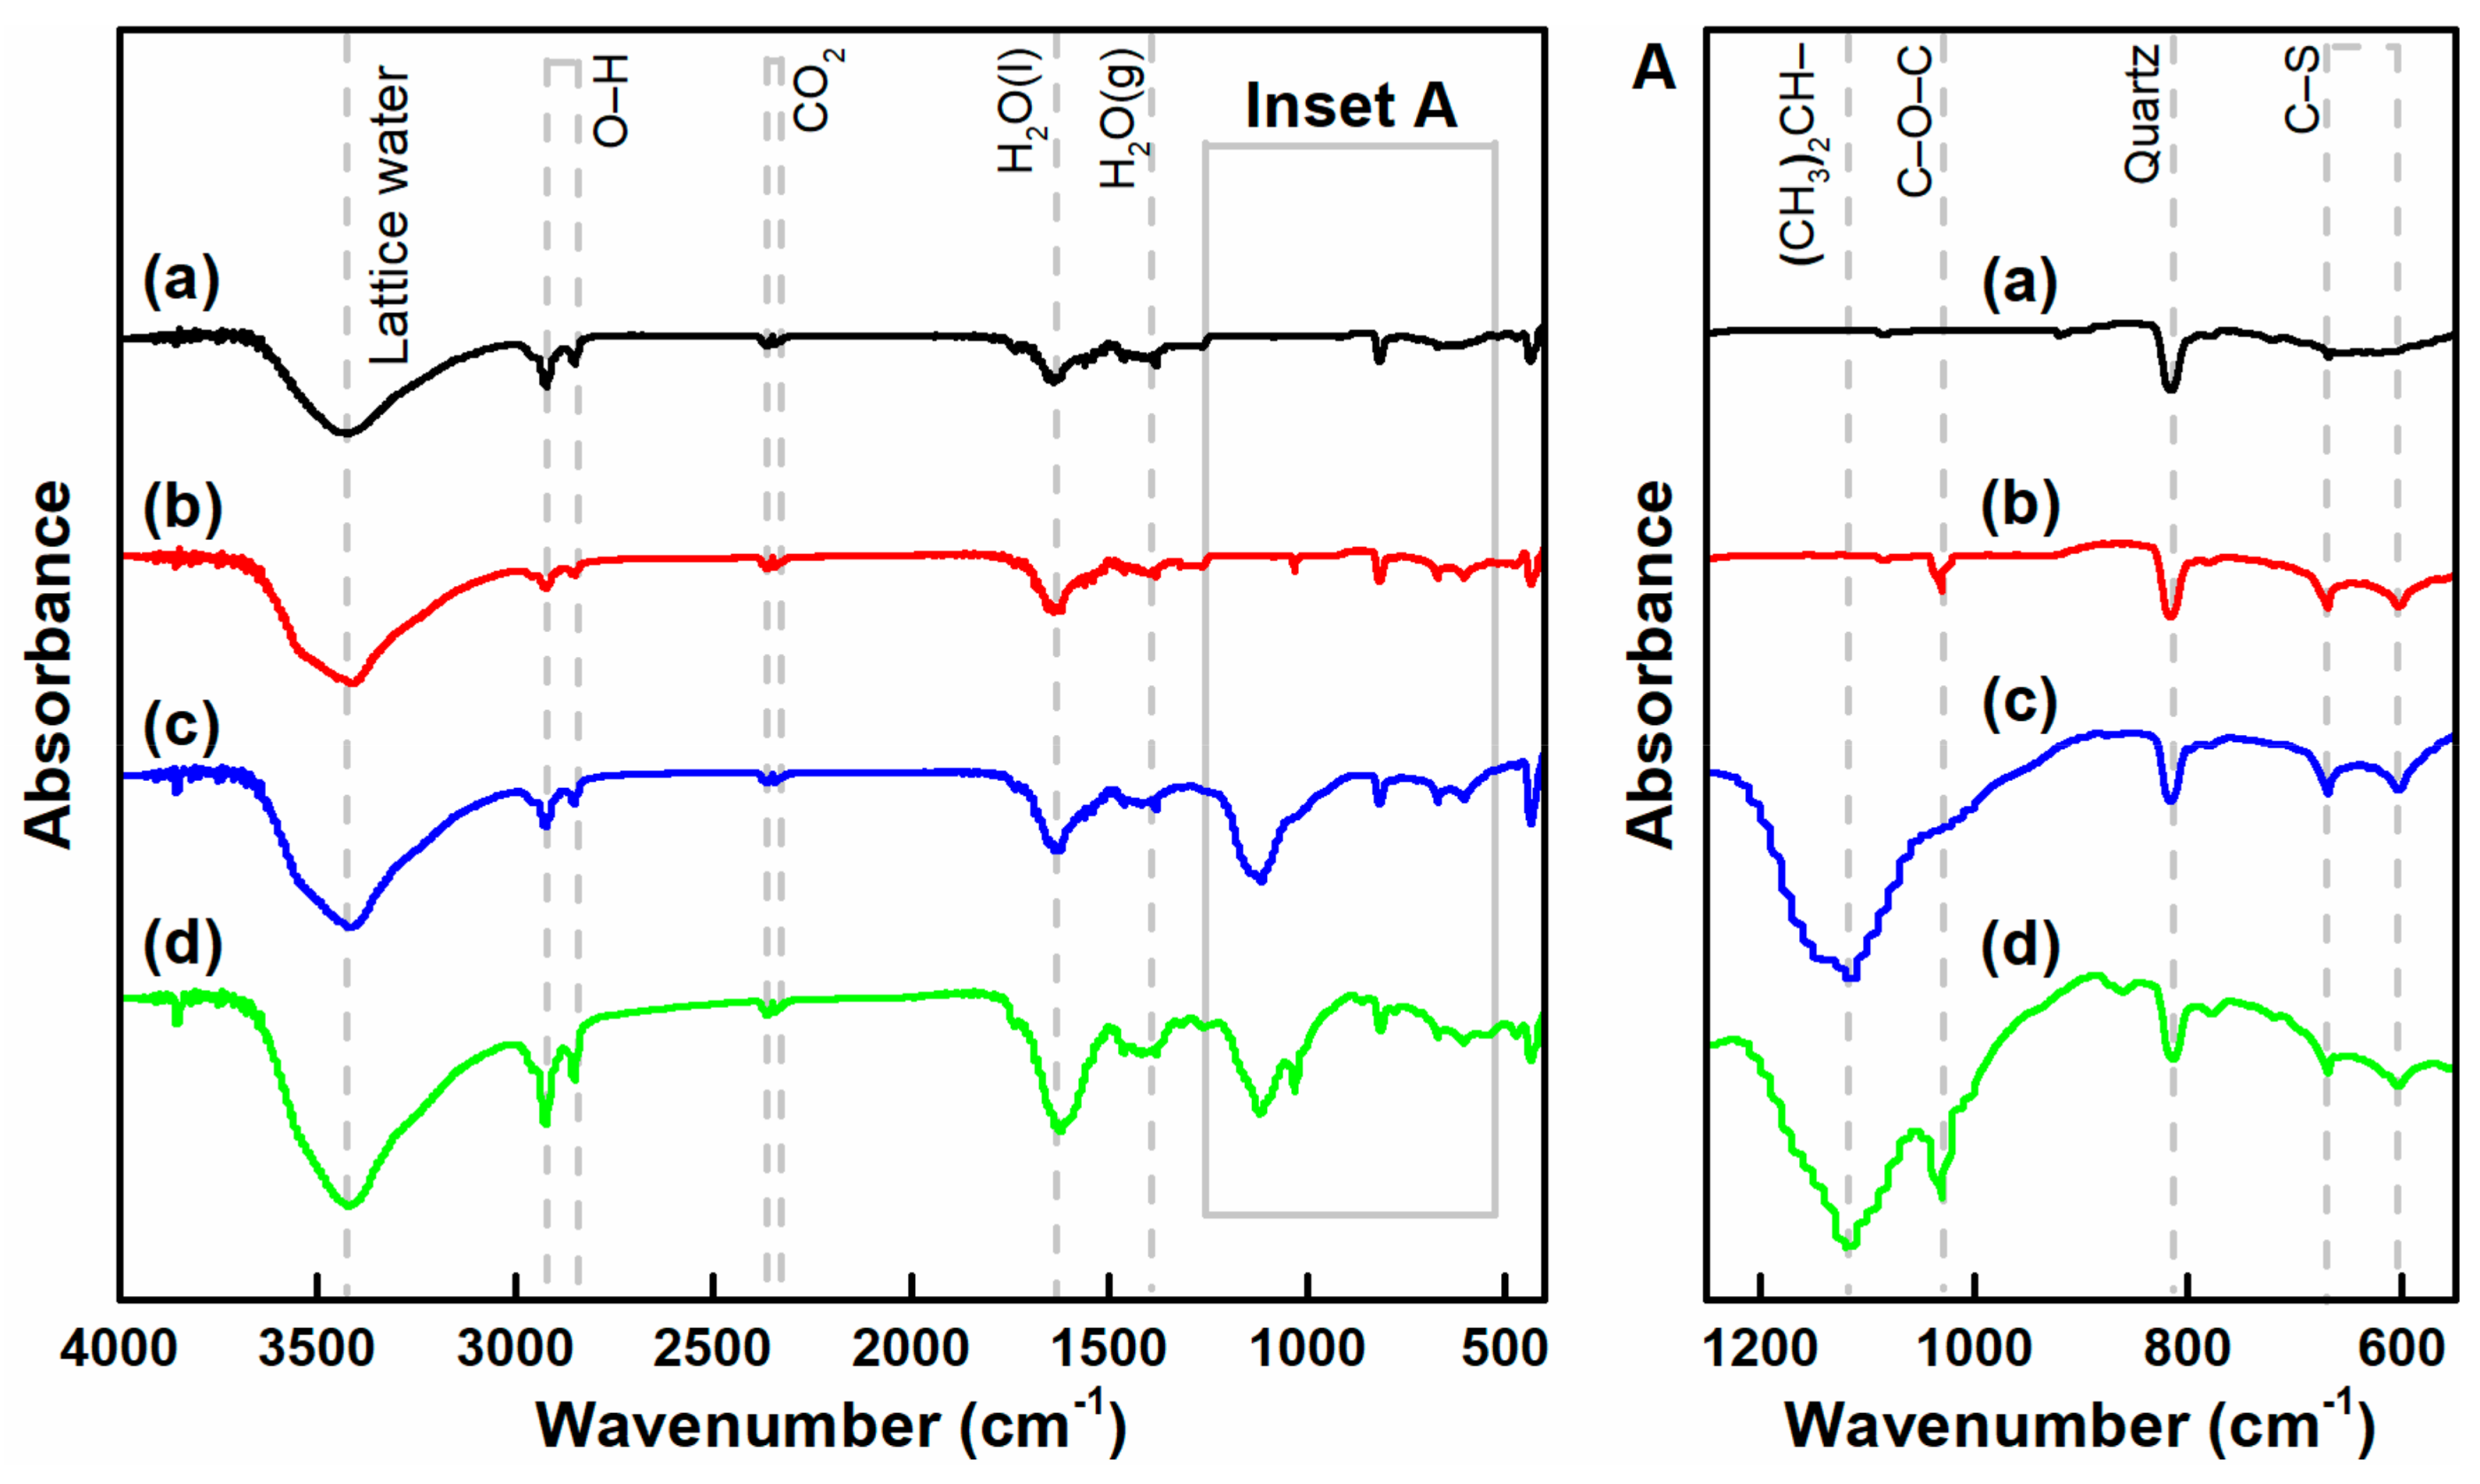
3.4. FTIR Spectra of Chalcopyrite and Arsenopyrite
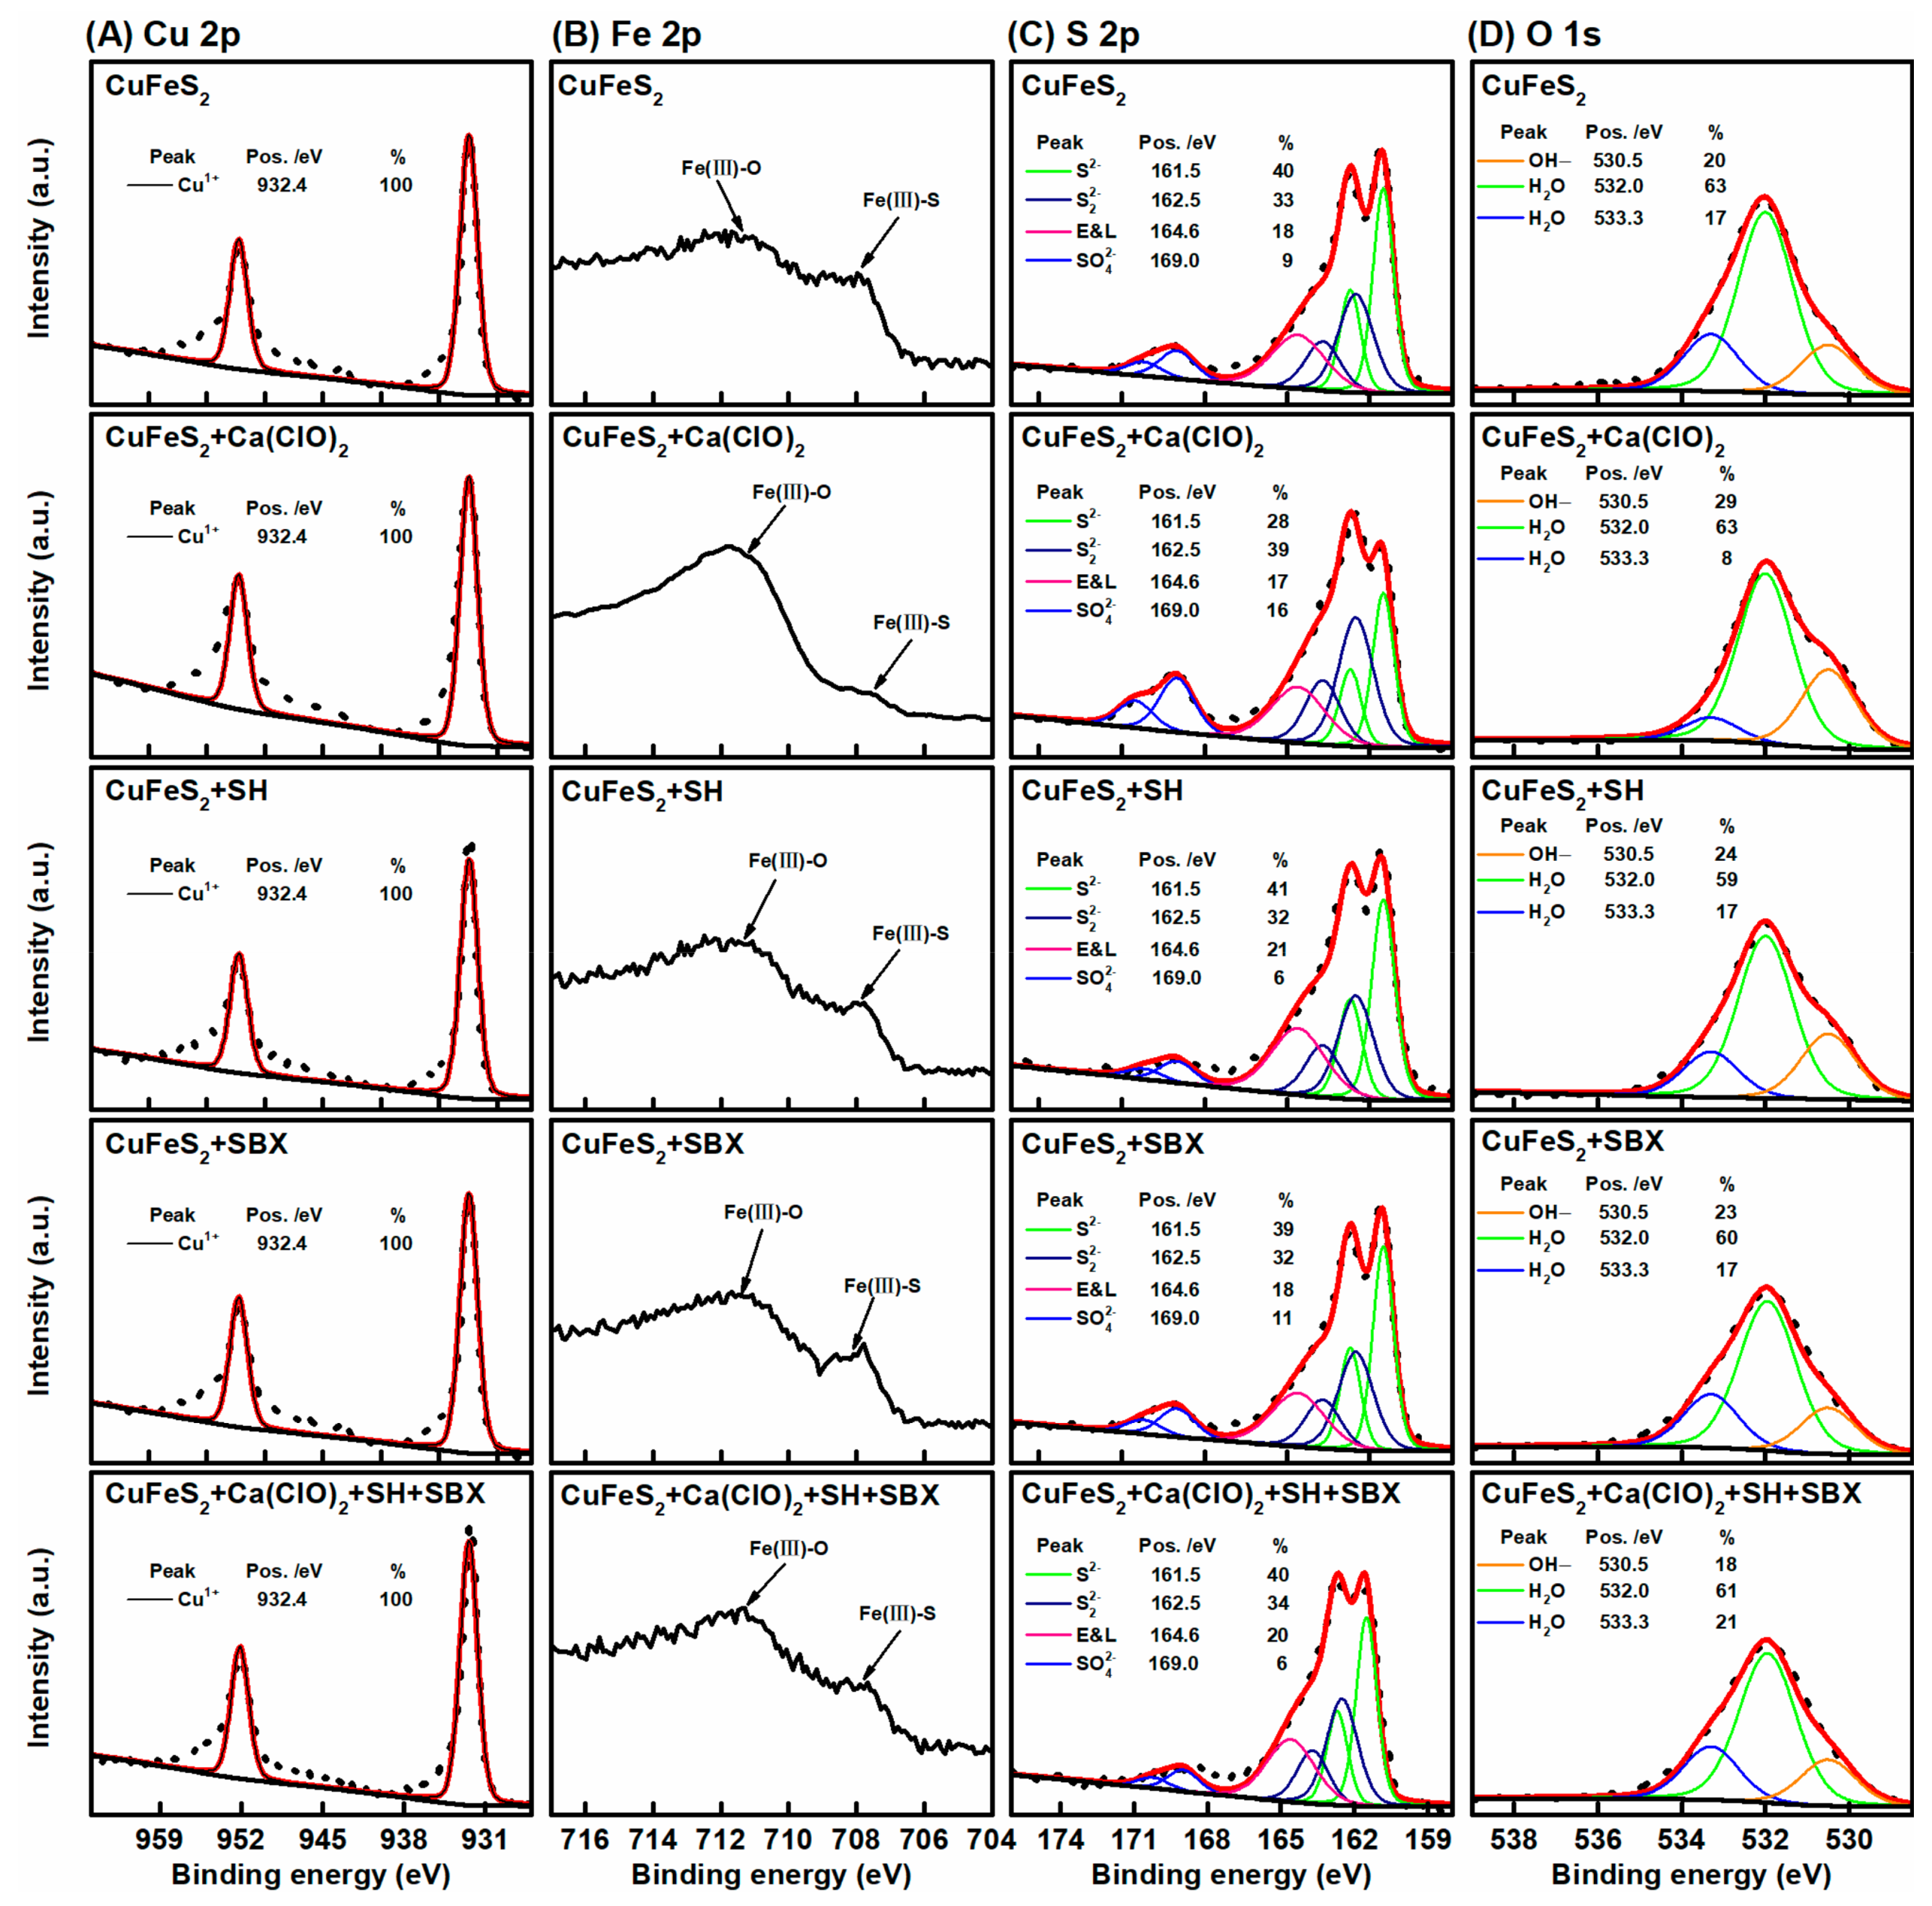
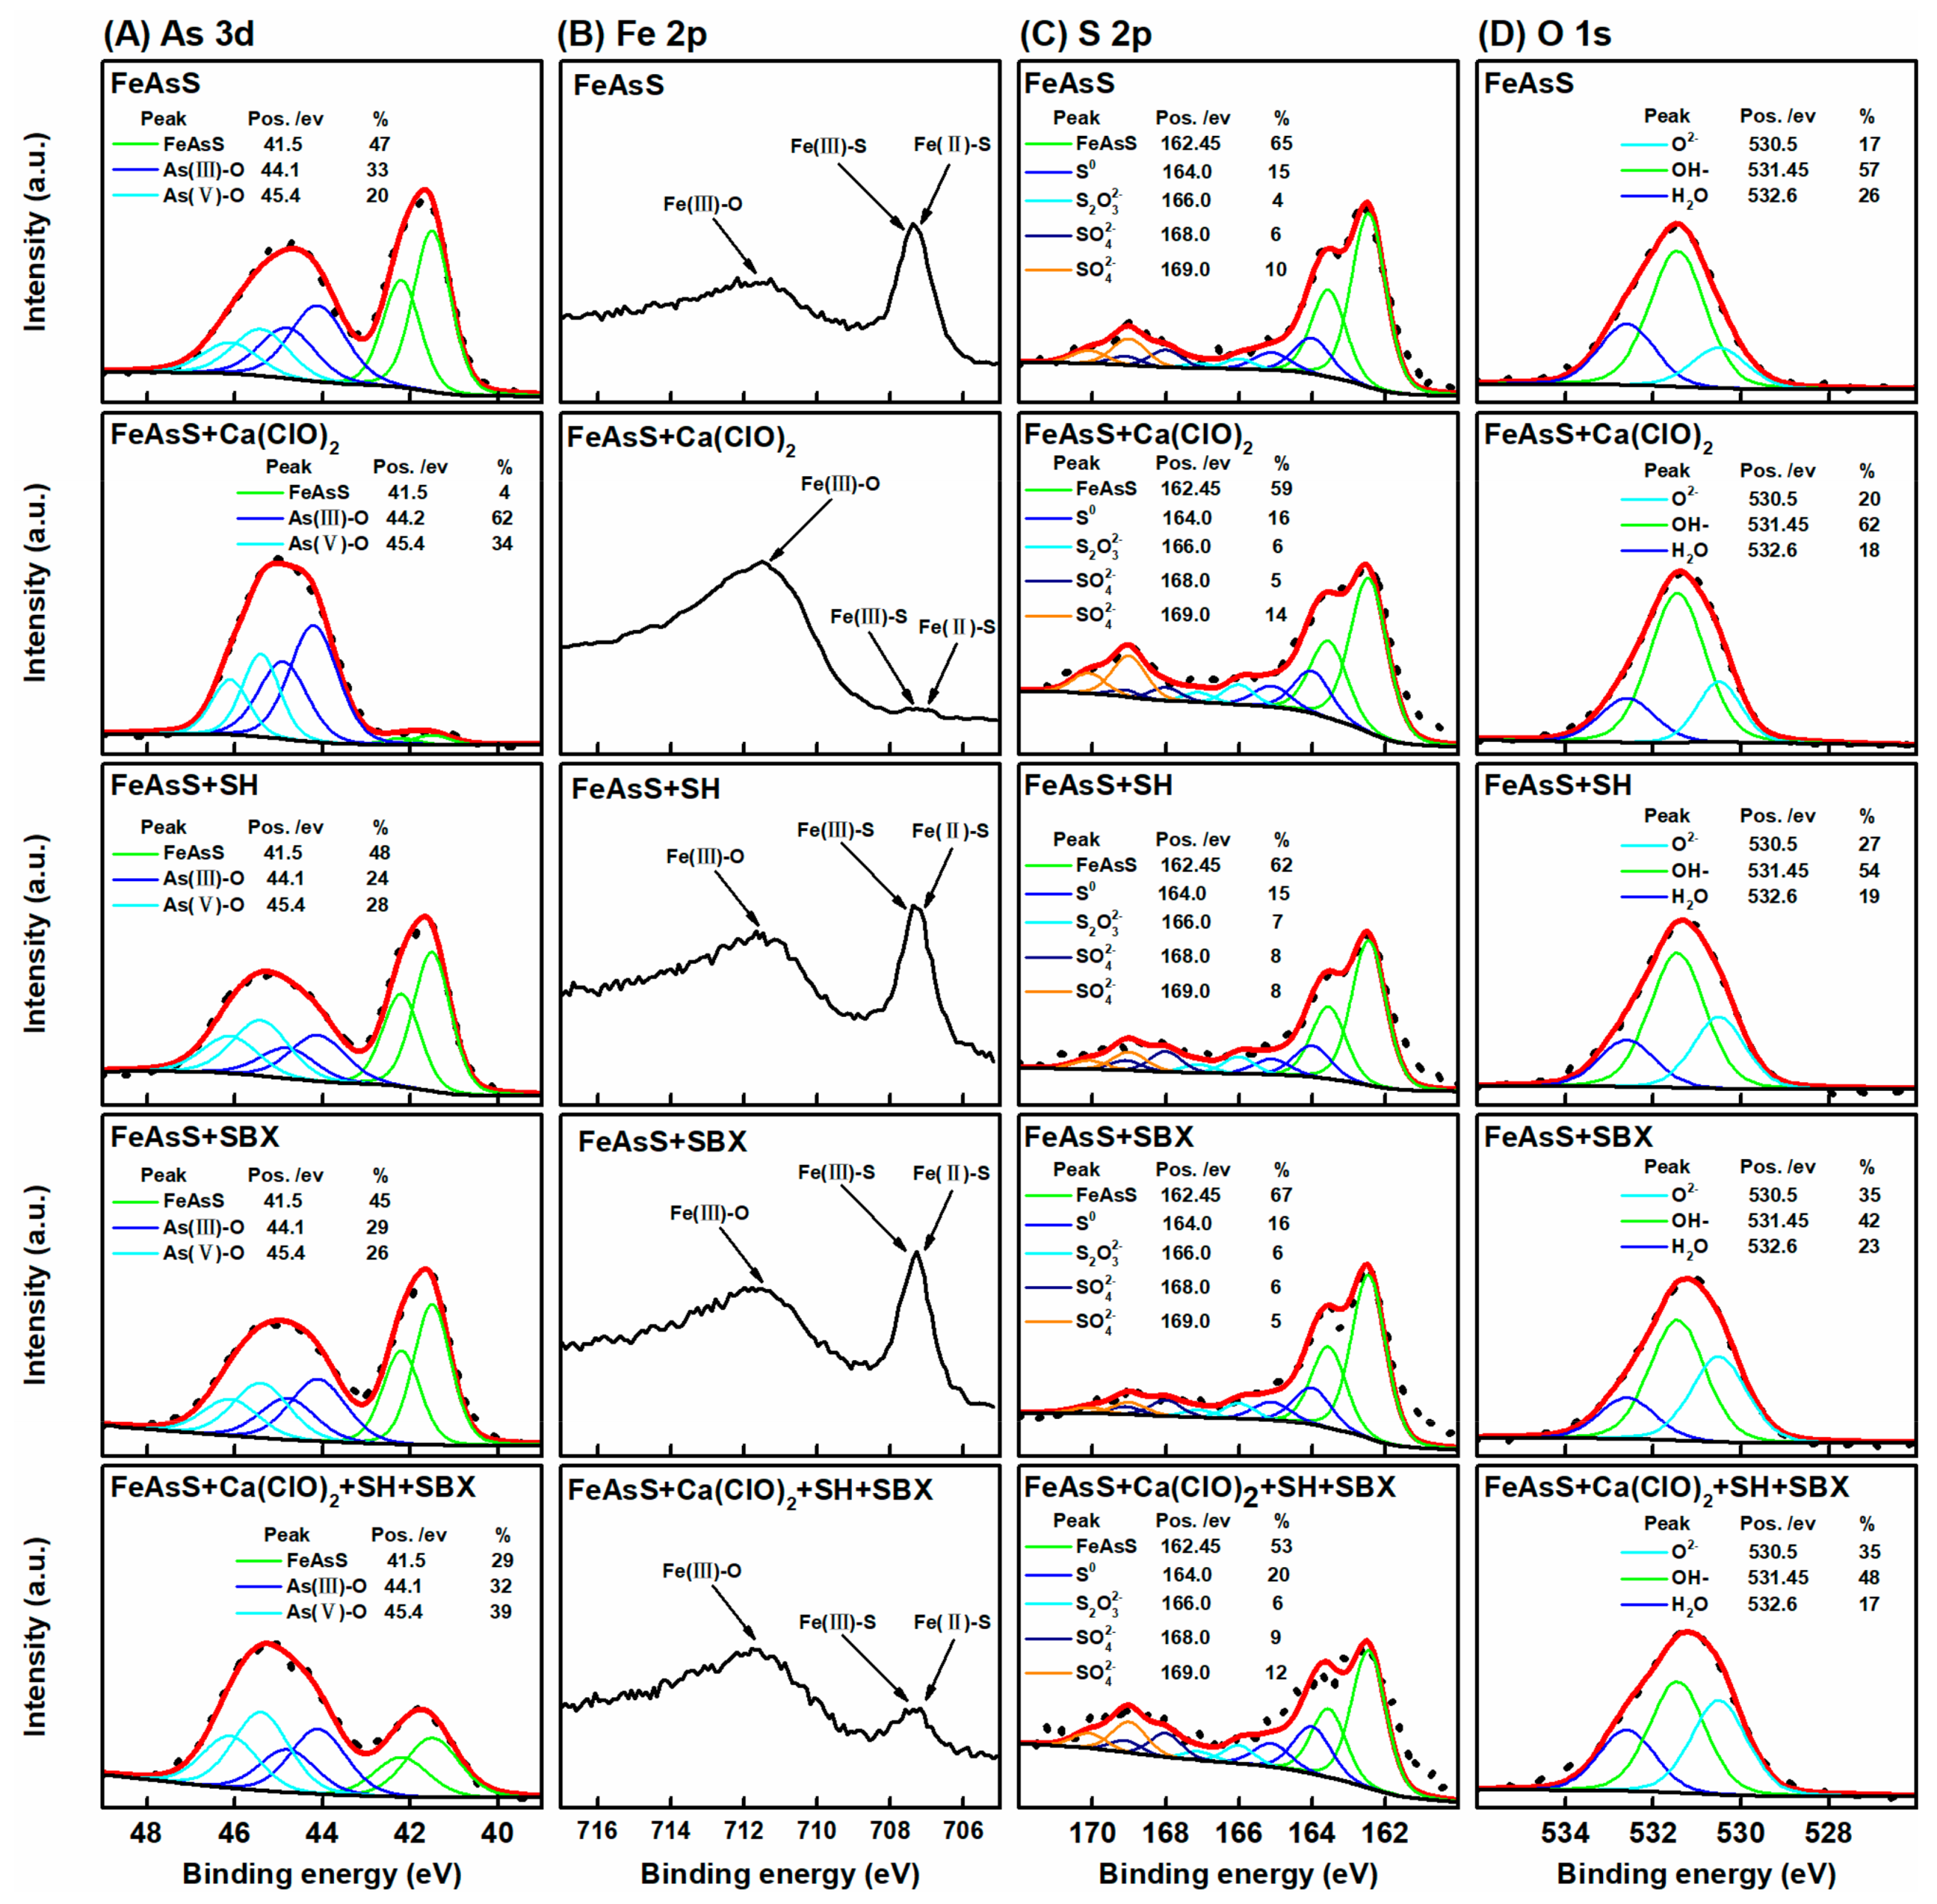
3.5. XPS Study
4. Conclusions
- (1)
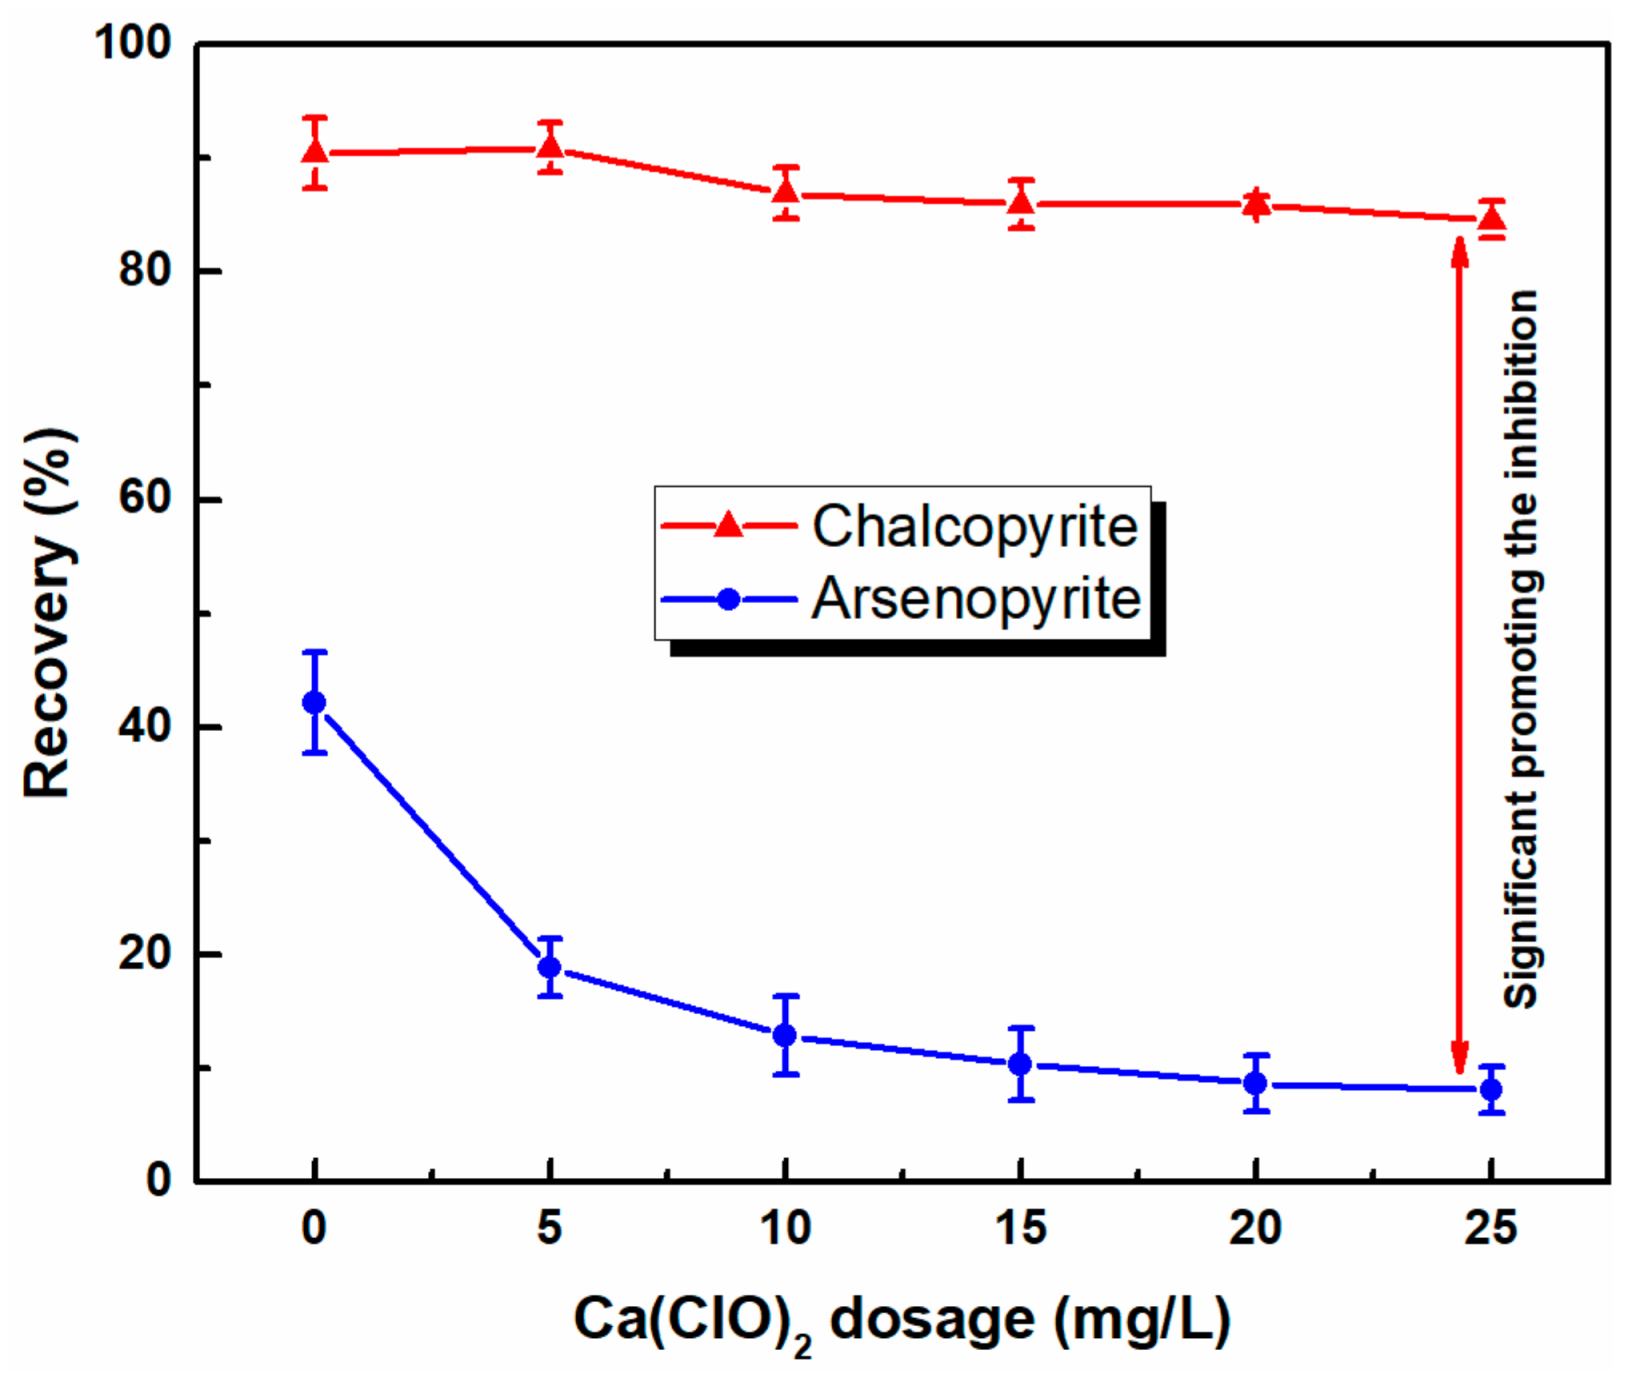
- Microflotation tests showed that chalcopyrite can be selectively separated from arsenopyrite by selective flotation using the combined depressants of Ca(ClO)2 and SH in a low alkaline system. With the use of combined depressants, the recovery of arsenic in copper concentrates sharply decreased from 63% to 11%; that of chalcopyrite also slightly decreased.
- (2)
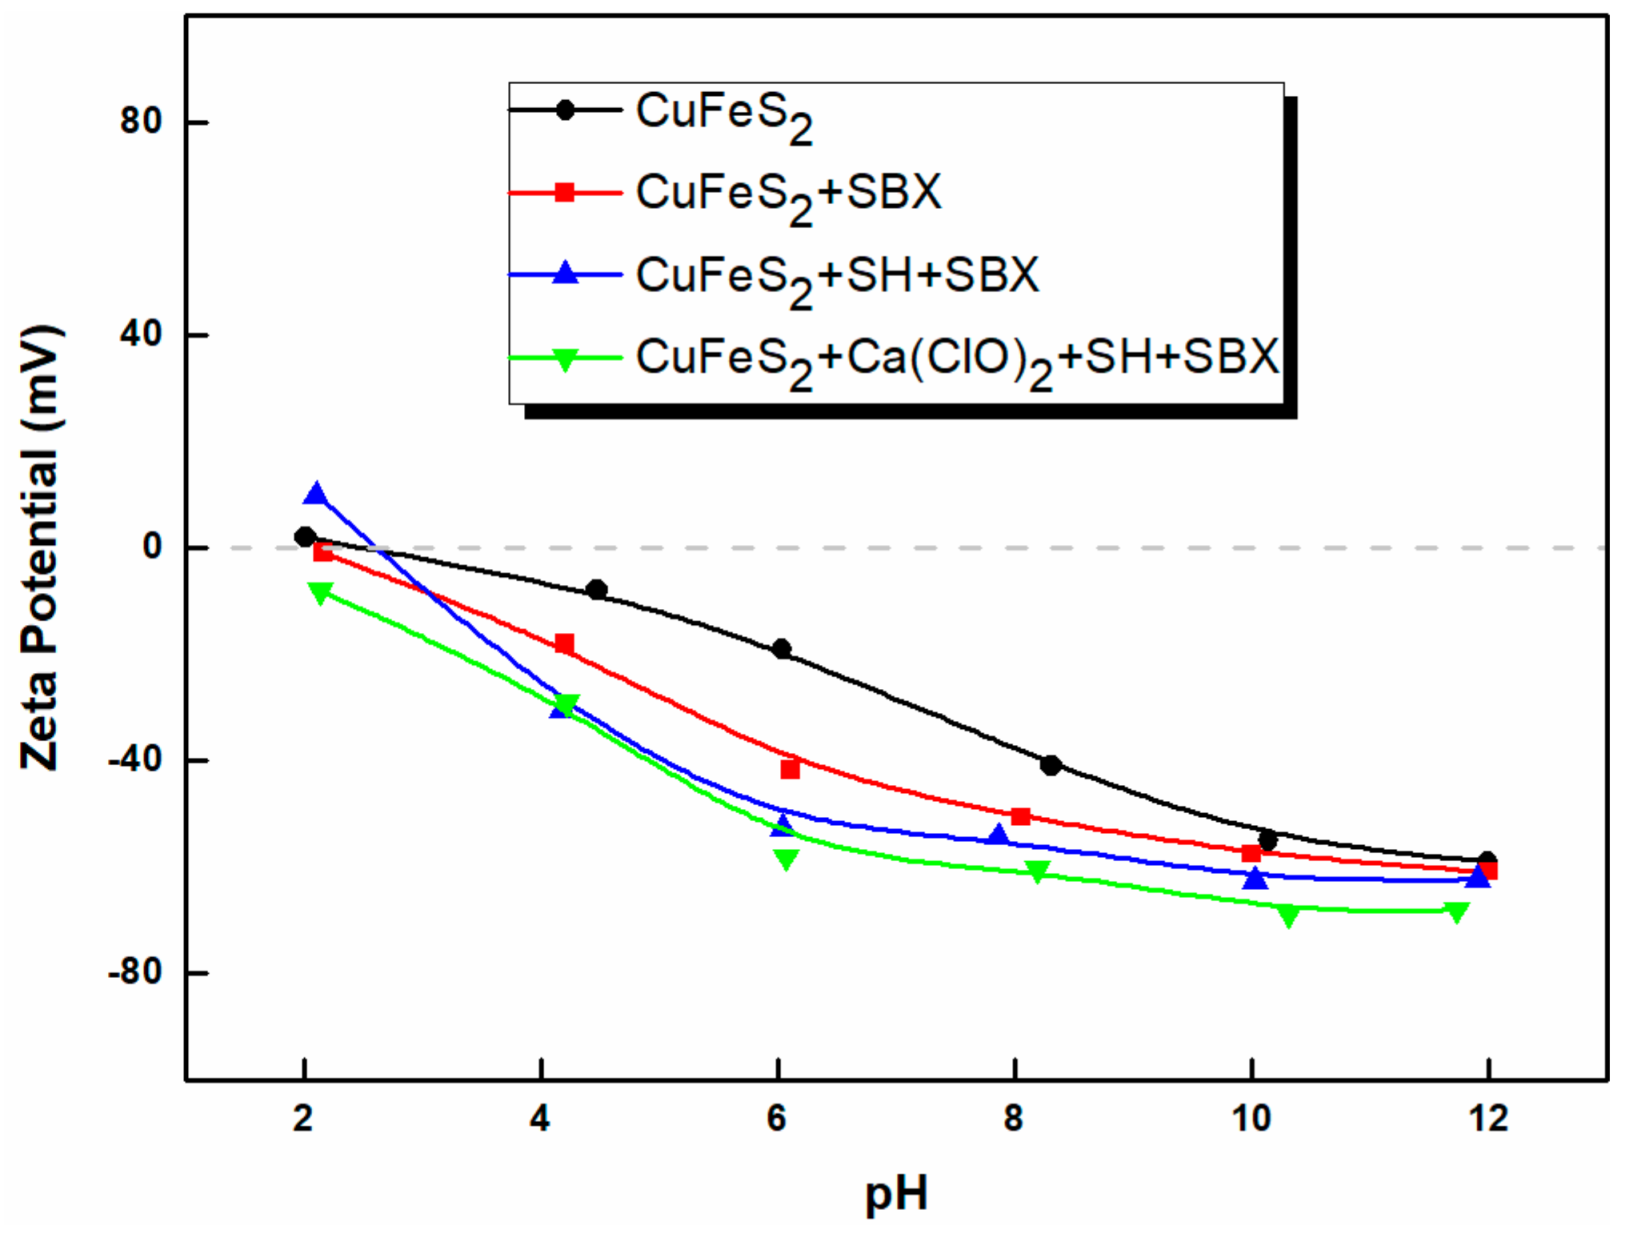
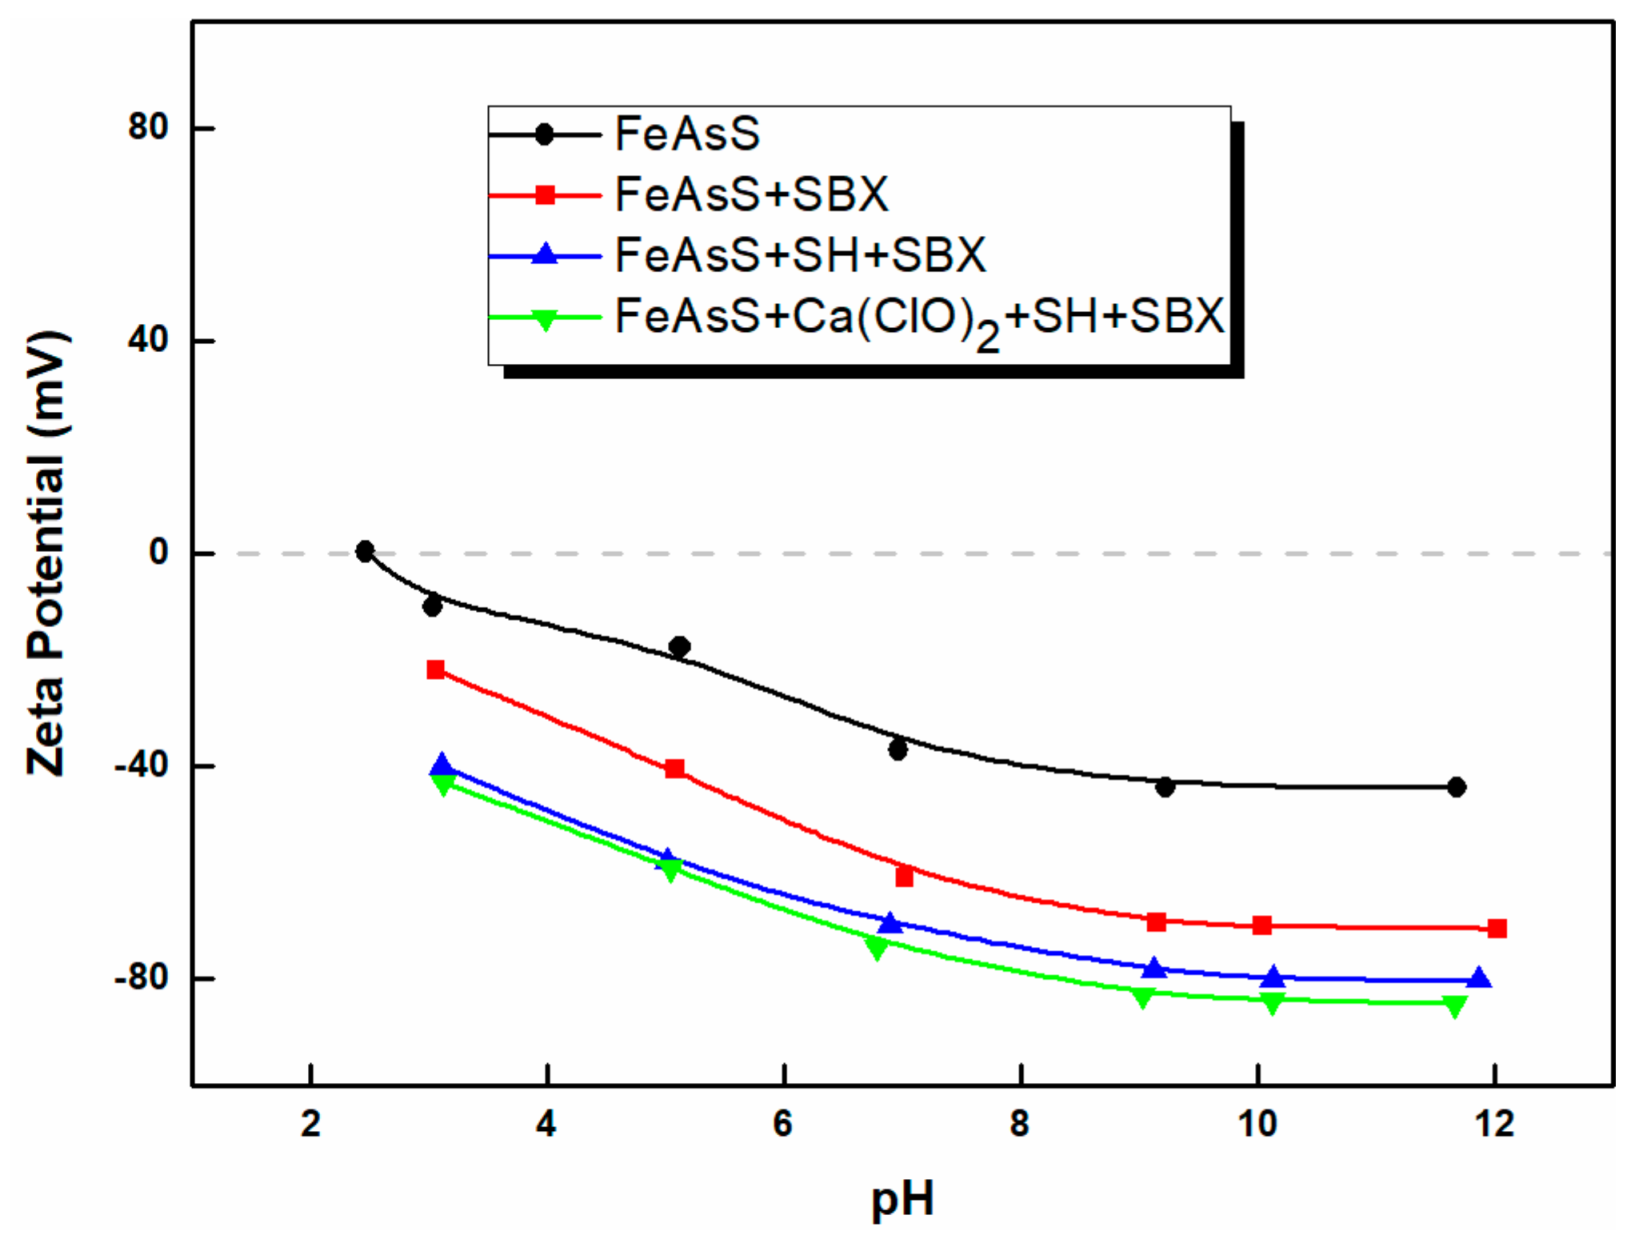
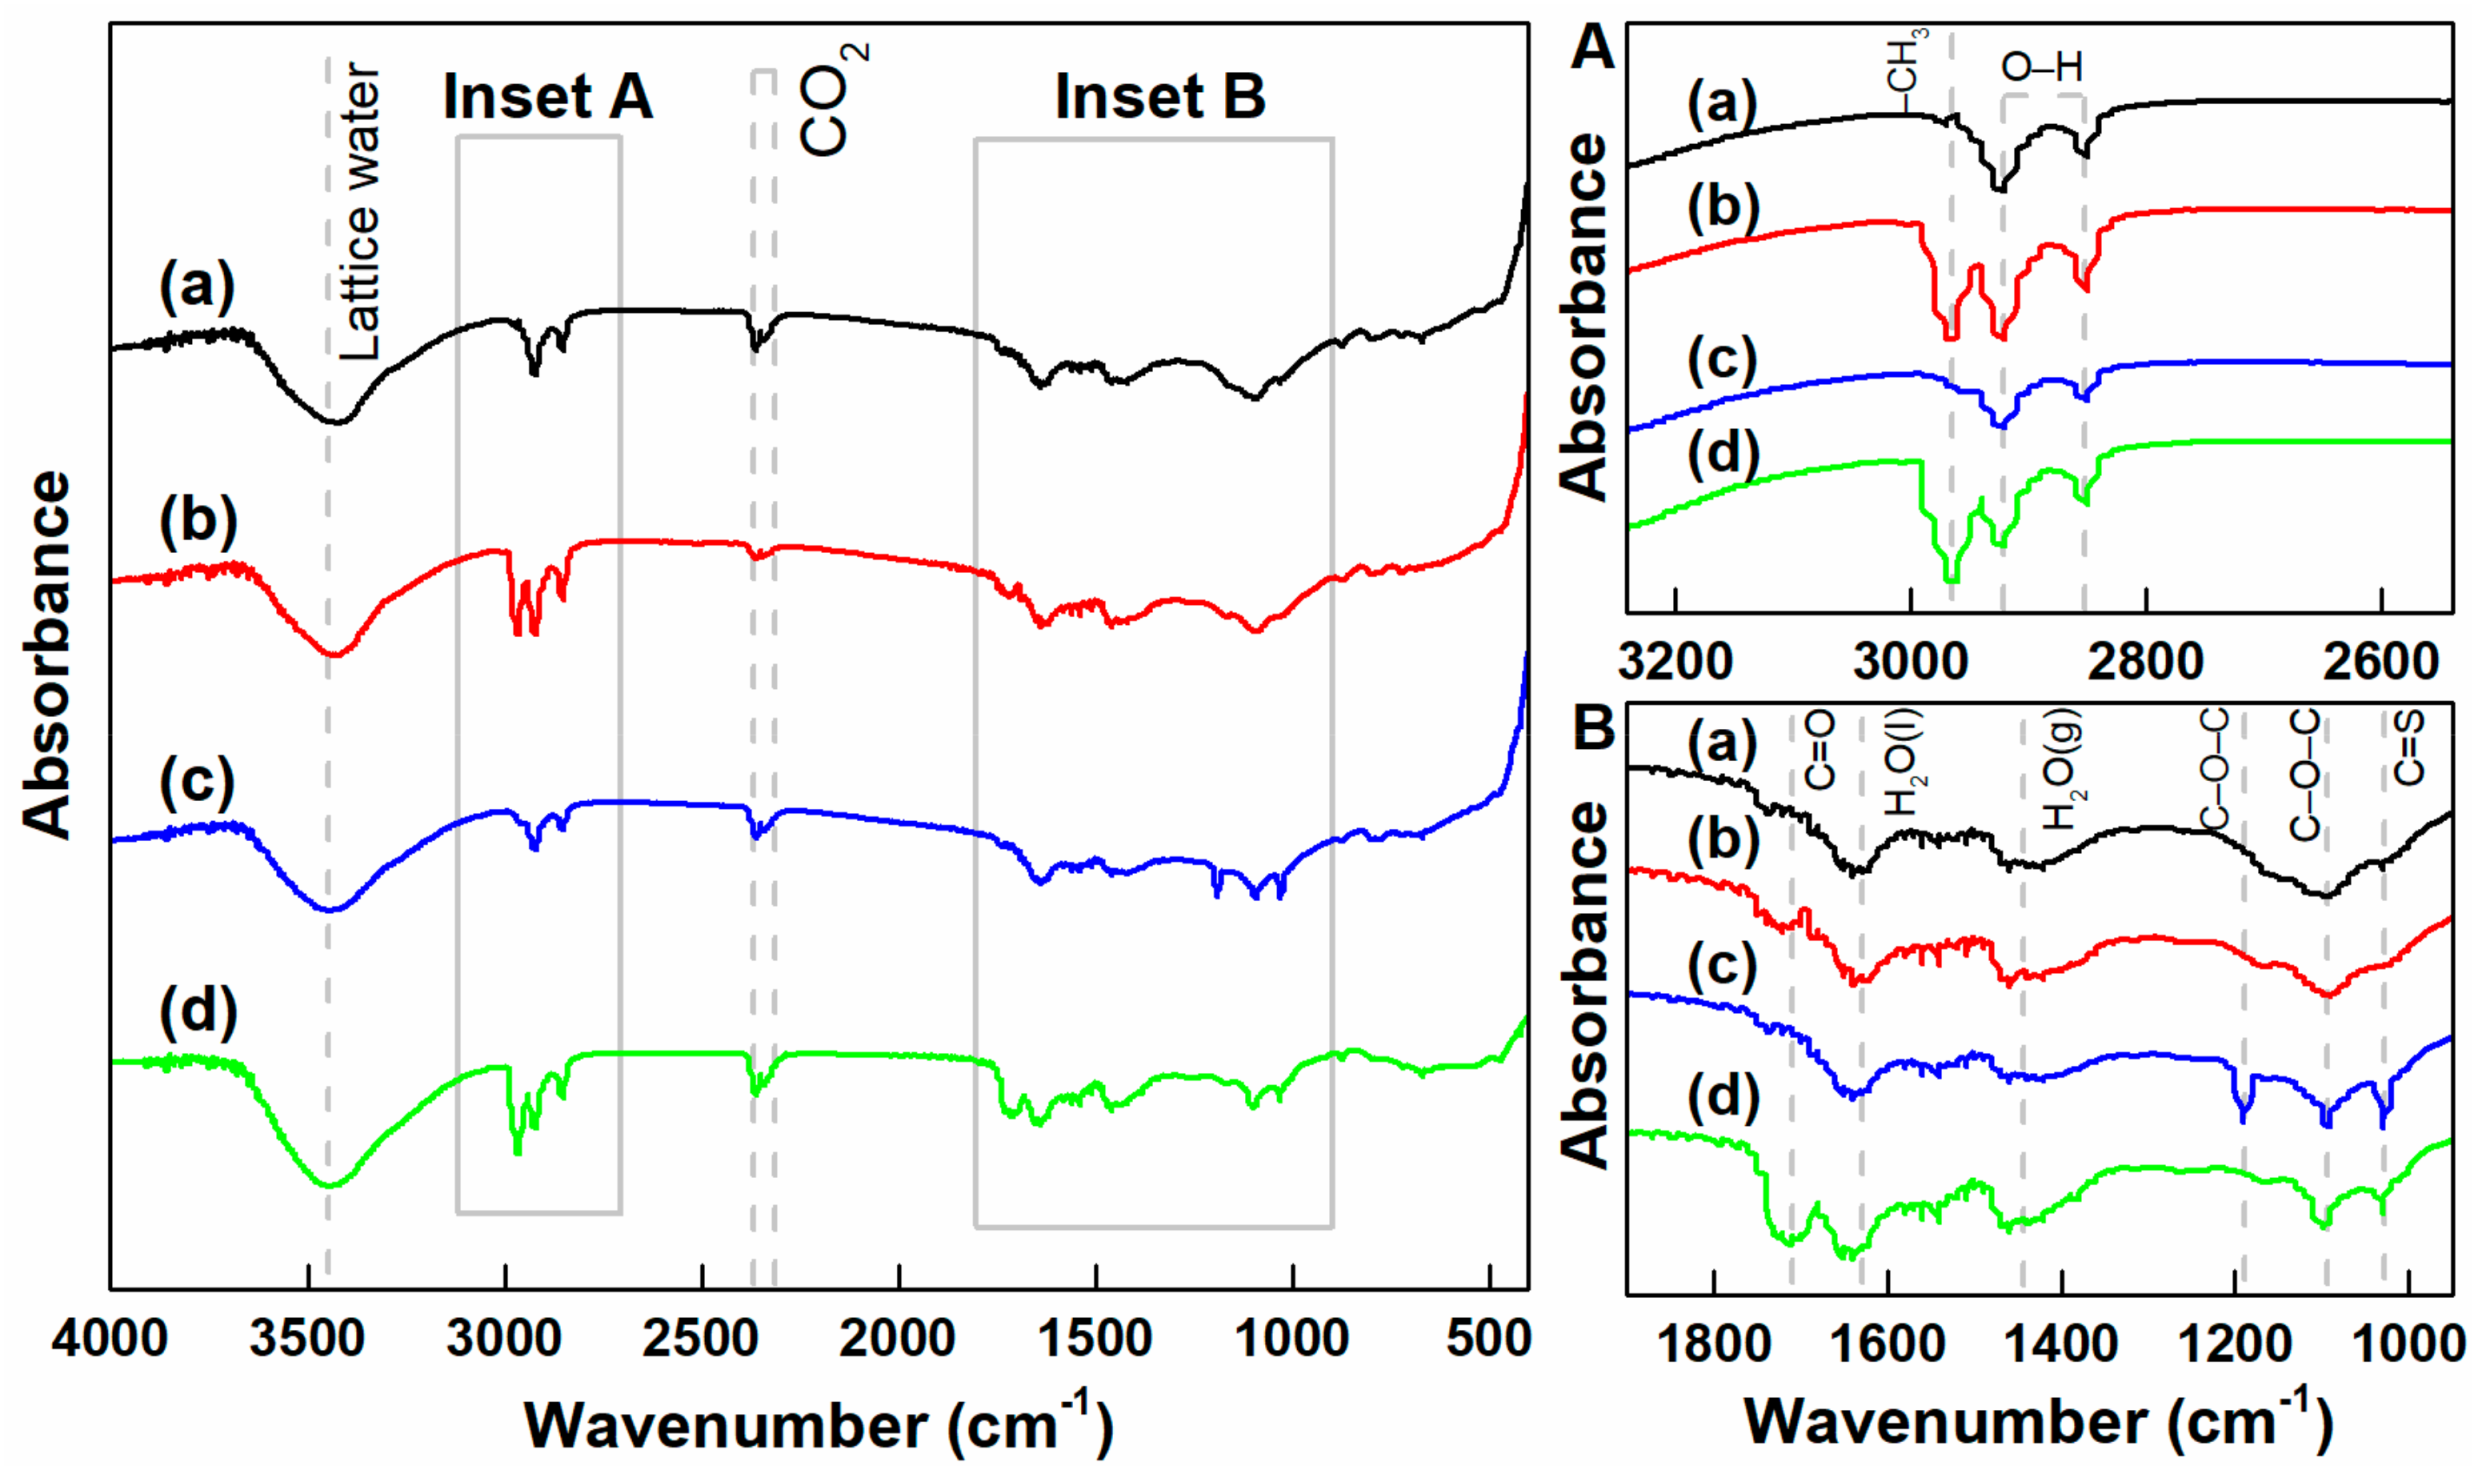
- The measurements of zeta potential and FTIR spectra revealed that SH adsorption on the arsenopyrite surface was stronger than that on the chalcopyrite surface. SH adsorption on arsenopyrite was enhanced with Ca(ClO)2.
- (3)
- XPS analysis demonstrated that SH unremarkably affected the chalcopyrite and arsenopyrite, whereas Ca(ClO)2 simultaneously oxidized the surfaces of chalcopyrite and arsenopyrite. However, oxidation was stronger on arsenopyrite than on chalcopyrite. The oxidation products caused by Ca(ClO)2 not only reduced the hydrophobicity of the arsenopyrite surface but also caused SH adsorption.
Author Contributions
Funding
Acknowledgments
Conflicts of Interest
References
- Wang, J.S. Arsenic in drinking water—A global environmental problem. J. Chem. Educ. 2004, 81, 207–213. [Google Scholar] [CrossRef]
- Chandraprabha, M.N.; Natarajan, K.A.; Somasundaran, P. Selective separation of pyrite from chalcopyrite and arsenopyrite by biomodulation using acidithiobacillus ferrooxidans. Int. J. Miner. Process. 2005, 75, 113–122. [Google Scholar] [CrossRef]
- Long, G.; Peng, Y.; Bradshaw, D. Flotation separation of copper sulphides from arsenic minerals at rosebery copper concentrator. Miner. Eng. 2014, 66–68, 207–214. [Google Scholar] [CrossRef]
- López Valdivieso, A.; Ojeda Escamilla, C.; Song, S.; Baez, I.L.; Martínez, I.G. Adsorption of isopropyl xanthate ions onto arsenopyrite and its effect on flotation. Int. J. Miner. Process. 2003, 69, 175–184. [Google Scholar] [CrossRef]
- Long, G.; Peng, Y.; Bradshaw, D. A review of copper–arsenic mineral removal from copper concentrates. Miner. Eng. 2012, 36–38, 179–186. [Google Scholar] [CrossRef]
- Smith, L.K.; Bruckard, W.J. The separation of arsenic from copper in a northparkes copper–gold ore using controlled-potential flotation. Int. J. Miner. Process. 2007, 84, 15–24. [Google Scholar] [CrossRef]
- You, K.-S.; Kim, H.-S.; Ahn, J.-W.; Lee, S. Arsenic rejection from lead concentrate using aluminosulfate. Int. J. Miner. Process. 2013, 125, 118–121. [Google Scholar] [CrossRef]
- Matveeva, T.N.; Gromova, N.K.; Lantsova, L.B. Effect of tannin on compound collector adsorption and stibnite and arsenopyrite flotation from complex ore. J. Min. Sci. 2018, 53, 1108–1115. [Google Scholar] [CrossRef]
- Tapley, B.; Yan, D. The selective flotation of arsenopyrite from pyrite. Miner. Eng. 2003, 16, 1217–1220. [Google Scholar] [CrossRef]
- Lopez Valdivieso, A.; Orozco, L. The flotation column to control arsenic, zinc and insoluble in lead concentrates. GEOMIMET XXI Epoca 1994, 187, 33–45. [Google Scholar]
- Mu, Y.; Peng, Y.; Lauten, R.A. The depression of pyrite in selective flotation by different reagent systems—A literature review. Miner. Eng. 2016, 96–97, 143–156. [Google Scholar] [CrossRef]
- López Valdivieso, A.; Sánchez López, A.A.; Ojeda Escamilla, C.; Fuerstenau, M.C. Flotation and depression control of arsenopyrite through pH and pulp redox potential using xanthate as the collector. Int. J. Miner. Process. 2006, 81, 27–34. [Google Scholar] [CrossRef]
- Bruckard, W.J.; Kyriakidis, I.; Woodcock, J.T. The flotation of metallic arsenic as a function of pH and pulp potential—A single mineral study. Int. J. Miner. Process. 2007, 84, 25–32. [Google Scholar] [CrossRef]
- Sirkeci, A.A. The flotation separation of pyrite from arsenopyrite using hexyl thioethylamine as collector. Int. J. Miner. Process. 2000, 60, 263–276. [Google Scholar] [CrossRef]
- Chen, J.; Chen, Y.; Wei, Z.; Liu, F. Bulk flotation of auriferous pyrite and arsenopyrite by using tertiary dodecyl mercaptan as collector in weak alkaline pulp. Miner. Eng. 2010, 23, 1070–1072. [Google Scholar] [CrossRef]
- Chimonyo, W.; Corin, K.C.; Wiese, J.G.; O’Connor, C.T. Redox potential control during flotation of a sulphide mineral ore. Miner. Eng. 2017, 110, 57–64. [Google Scholar] [CrossRef]
- Hu, Y.; Sun, W.; Wang, D. Electrochemistry of flotation of sulphide minerals. In Electrochemistry of Flotation of Sulphide Minerals; Springer: Berlin/Heidelberg, Germany, 2009; pp. 142–166. [Google Scholar]
- Ruonal, M.; Heimala, S.; Jounela, S.; Ruonal, M.; Heimala, S.; Jounela, S. Different aspects of using electrochemical potential measurements in mineral processing. Int. J. Miner. Process. 1997, 51, 97–110. [Google Scholar] [CrossRef]
- Wang, D.; Jiao, F.; Qin, W.; Wang, X. Effect of surface oxidation on the flotation separation of chalcopyrite and galena using sodium humate as depressant. Sep. Sci. Technol. 2017, 53, 961–972. [Google Scholar] [CrossRef]
- Ai, G.; Liu, C.; Zhang, W. Utilization of sodium humate as selective depressants for calcite on the flotation of scheelite. Sep. Sci. Technol. 2018, 53, 2136–2143. [Google Scholar] [CrossRef]
- Zhang, J.; Wang, A. Adsorption of Pb(II) from aqueous solution by chitosan-g-poly(acrylic acid)/attapulgite/sodium humate composite hydrogels. J. Chem. Eng. Data 2010, 55, 2379–2384. [Google Scholar] [CrossRef]
- González, M.A.; Pavlovic, I.; Rojas-Delgado, R.; Barriga, C. Removal of Cu2+, Pb2+ and Cd2+ by layered double hydroxide–humate hybrid. Sorbate and sorbent comparative studies. Chem. Eng. J. 2014, 254, 605–611. [Google Scholar] [CrossRef]
- Chen, J.; Li, Y.; Chen, Y. Cu–S flotation separation via the combination of sodium humate and lime in a low pH medium. Miner. Eng. 2011, 24, 58–63. [Google Scholar] [CrossRef]
- Qin, D. Research on Flotation Separation of Chalcopyrite and Pyrite Arsenopyrite; Central South University: Changsha, China, 2014. (In Chinese) [Google Scholar]
- Zeng, K. Study on the Flotation Behavior and Separation of Sulfur-Arsenic Mineral; Central South University: Changsha, China, 2010. (In Chinese) [Google Scholar]
- Fuerstenau, M.C.; Gaudin, A.M. Flotation: A.M. Gaudin Memorial Volume; American Institute of Mining, Metallurgical, and Petroleum Engineers: New York, NY, USA, 1976. [Google Scholar]
- Vreugde, M.J.A. Flotation Characteristics of Arsenopyrite. Ph.D. Thesis, University of British Columbia, Vancouver, BC, Canada, 1982. [Google Scholar]
- Beattie, M.J.V.; Poling, G.W. Flotation depression of arsenopyrite through use of oxidizing agents. In Mineral Processing and Extractive Metallurgy; Institution of Mining and Metallurgy Transactions: Vancouver, BC, Canada, 1987. [Google Scholar]
- Li, G.; Zhang, H. The chemical principles of flotation, activation and depression of arsenopyrite. Process. Complex Ores 1989, 61–70. [Google Scholar] [CrossRef]
- Ma, X.; Bruckard, W.J. Rejection of arsenic minerals in sulfide flotation—A literature review. Int. J. Miner. Process. 2009, 93, 89–94. [Google Scholar] [CrossRef]
- Yigit, O.; Soyuncu, S.; Eray, O.; Enver, S. Inhalational and dermal injury due to explosion of calcium hypochlorite. Cutan. Ocul. Toxicol. 2009, 28, 37–40. [Google Scholar] [CrossRef] [PubMed]
- Reyes-Bozo, L.; Escudey, M.; Vyhmeister, E.; Higueras, P.; Godoy-Faúndez, A.; Salazar, J.L.; Valdés-González, H.; Wolf-Sepúlveda, G.; Herrera-Urbina, R. Adsorption of biosolids and their main components on chalcopyrite, molybdenite and pyrite: Zeta potential and ftir spectroscopy studies. Miner. Eng. 2015, 78, 128–135. [Google Scholar] [CrossRef]
- Rath, R.K.; Subramanian, S.; Sivanandam, V.; Pradeep, T. Studies on the interaction of guar gum with chalcopyrite. Can. Metall. Q. 2001, 40, 1–11. [Google Scholar] [CrossRef]
- Liu, R.-Z.; Qin, W.-Q.; Jiao, F.; Wang, X.-J.; Pei, B.; Yang, Y.-J.; Lai, C.-H. Flotation separation of chalcopyrite from galena by sodium humate and ammonium persulfate. Trans. Nonferr. Met. Soc. China 2016, 26, 265–271. [Google Scholar] [CrossRef]
- Chen, J.; Feng, Q.; Ou, L. The Flotation Separation of Chalcopyrite-Pyrite in the Presence of Sodium Humate. Front. Sep. Sci. Technol. 2004, 1019–1028. [Google Scholar] [CrossRef]
- Park, K.; Choi, J.; Gomez-Flores, A.; Kim, H. Flotation behavior of arsenopyrite and pyrite, and their selective separation. Mater. Trans. 2015, 56, 435–440. [Google Scholar] [CrossRef]
- Pandey, A.K.; Pandey, S.D.; Misra, V. Stability constants of metal-humic acid complexes and its role in environmental detoxification. Ecotoxicol. Environ. Saf. 2000, 47, 195–200. [Google Scholar] [CrossRef] [PubMed]
- Zhang, Y.; Cao, Z.; Cao, Y.; Sun, C. FTIR studies of xanthate adsorption on chalcopyrite, pentlandite and pyrite surfaces. J. Mol. Struct. 2013, 1048, 434–440. [Google Scholar] [CrossRef]
- Mielczarski, J.A.; Mielczarski, E.; Zachwieja, J.; Cases, J.M. In situ and ex situ infrared studies of nature and structure of thiol monolayers adsorbed on cuprous sulfide at controlled potential. Langmuir 1995, 11, 2787–2799. [Google Scholar] [CrossRef]
- Allison, S.A.; Goold, L.A.; Nicol, M.J.; Granville, A. A determination of the products of reaction betweer various sulfide minerals and aqueous xanthate solution, and a correlation of the products with electrode rest potentials. Metall. Trans. 1972, 3, 2613–2618. [Google Scholar] [CrossRef]
- Brion, D. Etude par spectroscopie de photoelectrons de la degradation superficielle de FeS2, CuFeS2, ZnS et PbS a l’air et dans l’eau. Appl. Surf. Sci. 1980, 5, 133–152. [Google Scholar] [CrossRef]
- Ghahremaninezhad, A.; Dixon, D.G.; Asselin, E. Electrochemical and XPS analysis of chalcopyrite (CuFeS2) dissolution in sulfuric acid solution. Electrochim. Acta 2013, 87, 97–112. [Google Scholar] [CrossRef]
- Kalegowda, Y.; Chan, Y.-L.; Wei, D.-H.; Harmer, S.L. X-PEEM, XPS and ToF-SIMS characterisation of xanthate induced chalcopyrite flotation: Effect of pulp potential. Surf. Sci. 2015, 635, 70–77. [Google Scholar] [CrossRef]
- Buckley, A.N.; Woods, R. An X-ray photoelectron spectroscopic study of the oxidation of chalcopyrite. Aust. J. Chem. 1984, 37, 401–414. [Google Scholar] [CrossRef]
- Mcintyre, N.S.; Zetaruk, D.G. X-ray photoelectron spectroscopic studies of iron oxides. Anal. Chem. 1977, 49, 1521–1529. [Google Scholar] [CrossRef]
- Harmer, S.L.; Pratt, A.R.; Nesbitt, W.H.; Fleet, M.E. Sulfur species at chalcopyrite (CuFeS2) fracture surfaces. Am. Mineral. 2004, 89, 1026–1032. [Google Scholar] [CrossRef]
- Klauber, C.; Parker, A.; Bronswijk, W.V.; Watling, H. Sulphur speciation of leached chalcopyrite surfaces as determined by X-ray photoelectron spectroscopy. Int. J. Miner. Process. 2001, 62, 65–94. [Google Scholar] [CrossRef]
- Chen, X.; Peng, Y. The effect of regrind mills on the separation of chalcopyrite from pyrite in cleaner flotation. Miner. Eng. 2015, 83, 33–43. [Google Scholar] [CrossRef]
- Acres, R.G.; Harmer, S.L.; Beattie, D.A. Synchrotron XPS, NEXAFS, and ToF-SIMS studies of solution exposed chalcopyrite and heterogeneous chalcopyrite with pyrite. Miner. Eng. 2010, 23, 928–936. [Google Scholar] [CrossRef]
- Costa, M.C.; Rego, A.M.B.D.; Abrantes, L.M. Characterization of a natural and an electro-oxidized arsenopyrite: A study on electrochemical and X-ray photoelectron spectroscopy. Int. J. Miner. Process. 2002, 65, 83–108. [Google Scholar] [CrossRef]
- Buckley, A.N.; Walker, G.W. The surface composition of arsenopyrite exposed to oxidizing environments. Appl. Surf. Sci. 1988, 35, 227–240. [Google Scholar] [CrossRef]
- Nesbitt, H.W.; Muir, I.J.; Prarr, A.R. Oxidation of arsenopyrite by air and air-saturated, distilled water, and implications for mechanism of oxidation. Geochim. Cosmochim. Acta 1995, 59, 1773–1786. [Google Scholar] [CrossRef]
- Pratt, A.R.; Mcintyre, N.S.; Splinter, S.J. Deconvolution of pyrite marcasite and arsenopyrite XPS spectra using the maximum entropy method. Surf. Sci. 1998, 396, 266–272. [Google Scholar] [CrossRef]
- Beattie, M.J.V.; Poling, G.W. A study of the surface oxidation of arsenopyrite using cyclic voltammetry. Int. J. Miner. Process. 1987, 20, 87–108. [Google Scholar] [CrossRef]


| Water | Depressant | Product | Yield (%) | Grade (%) | Recovery (%) | ||
|---|---|---|---|---|---|---|---|
| Cu | As | Cu | As | ||||
| Ultrapure water | No depressant | Cu Concentrate | 72.89 | 25.93 | 14.32 | 90.93 | 63.40 |
| As Concentrate | 27.11 | 6.96 | 22.23 | 9.07 | 36.60 | ||
| Feed | 100.0 | 20.79 | 16.46 | 100.0 | 100.0 | ||
| Ultrapure water | Combination of SH and Ca(ClO)2 | Cu Concentrate | 52.87 | 34.55 | 3.54 | 88.51 | 11.45 |
| As Concentrate | 47.13 | 5.03 | 30.72 | 11.49 | 88.55 | ||
| Feed | 100.0 | 20.64 | 16.35 | 100.0 | 100.0 | ||
| Tap water | No depressant | Cu Concentrate | 72.12 | 26.07 | 14.67 | 90.88 | 62.98 |
| As Concentrate | 27.88 | 6.77 | 22.31 | 9.12 | 37.02 | ||
| Feed | 100.0 | 20.69 | 16.80 | 100.0 | 100.0 | ||
| Tap water | Combination of SH and Ca(ClO)2 | Cu Concentrate | 51.34 | 34.98 | 3.89 | 87.80 | 11.99 |
| As Concentrate | 48.66 | 5.13 | 30.12 | 12.20 | 88.01 | ||
| Feed | 100.0 | 20.46 | 16.65 | 100.0 | 100.0 | ||
© 2018 by the authors. Licensee MDPI, Basel, Switzerland. This article is an open access article distributed under the terms and conditions of the Creative Commons Attribution (CC BY) license (http://creativecommons.org/licenses/by/4.0/).
Share and Cite
Lin, S.; Liu, R.; Bu, Y.; Wang, C.; Wang, L.; Sun, W.; Hu, Y. Oxidative Depression of Arsenopyrite by Using Calcium Hypochlorite and Sodium Humate. Minerals 2018, 8, 463. https://doi.org/10.3390/min8100463
Lin S, Liu R, Bu Y, Wang C, Wang L, Sun W, Hu Y. Oxidative Depression of Arsenopyrite by Using Calcium Hypochlorite and Sodium Humate. Minerals. 2018; 8(10):463. https://doi.org/10.3390/min8100463
Chicago/Turabian StyleLin, Shangyong, Runqing Liu, Yongjie Bu, Chen Wang, Li Wang, Wei Sun, and Yuehua Hu. 2018. "Oxidative Depression of Arsenopyrite by Using Calcium Hypochlorite and Sodium Humate" Minerals 8, no. 10: 463. https://doi.org/10.3390/min8100463
APA StyleLin, S., Liu, R., Bu, Y., Wang, C., Wang, L., Sun, W., & Hu, Y. (2018). Oxidative Depression of Arsenopyrite by Using Calcium Hypochlorite and Sodium Humate. Minerals, 8(10), 463. https://doi.org/10.3390/min8100463