Article

Two-Stage SART Process: A Feasible Alternative for Gold Cyanidation Plants with High Zinc and Copper Contents

1
Advanced Mining Technology Center (AMTC), University of Chile, Av. Tupper 2007 (AMTC Building), Santiago 8370451, Chile
2
Department of Chemistry, Universidad Tecnológica Metropolitana, Las Palmeras 3360, Ñuñoa, Santiago 7800002, Chile
*
Author to whom correspondence should be addressed.
Minerals 2018, 8(9), 392; https://doi.org/10.3390/min8090392
Submission received: 2 August 2018 / Revised: 3 September 2018 / Accepted: 5 September 2018 / Published: 7 September 2018

Abstract

:
The SART (sulfidization, acidification, recycling, and thickening) process (SP) has been successfully implemented in gold cyanidation plants to address issues associated with high cyanide-soluble copper content ores. However, this process could produce a relatively low grade precipitate, decreasing the sale price when gold plants have high zinc and copper content in their solutions. A potential option in this case would be the use of a two-stage SART process (TSSP) to produce separate zinc and copper precipitates. The additional equipment involved with this process would increase the capital cost, thereby generating concerns about the optimal range of metal contents that could justify this option. This study presents a methodology to quantify the feasible range of Cu/Zn concentrations that would justify a two-stage SART process. The study is based on a thermodynamic model and a simple economic evaluation. Results show the TSSP is preferred when the Cu/Zn ratio ranges between 0.2 and 1.5 with copper concentration higher than 500 mg/L. The TSSP appears to be a viable option to consider for gold plants having concentrations of copper and zinc higher than 200 mg/L for both metals.

1. Introduction

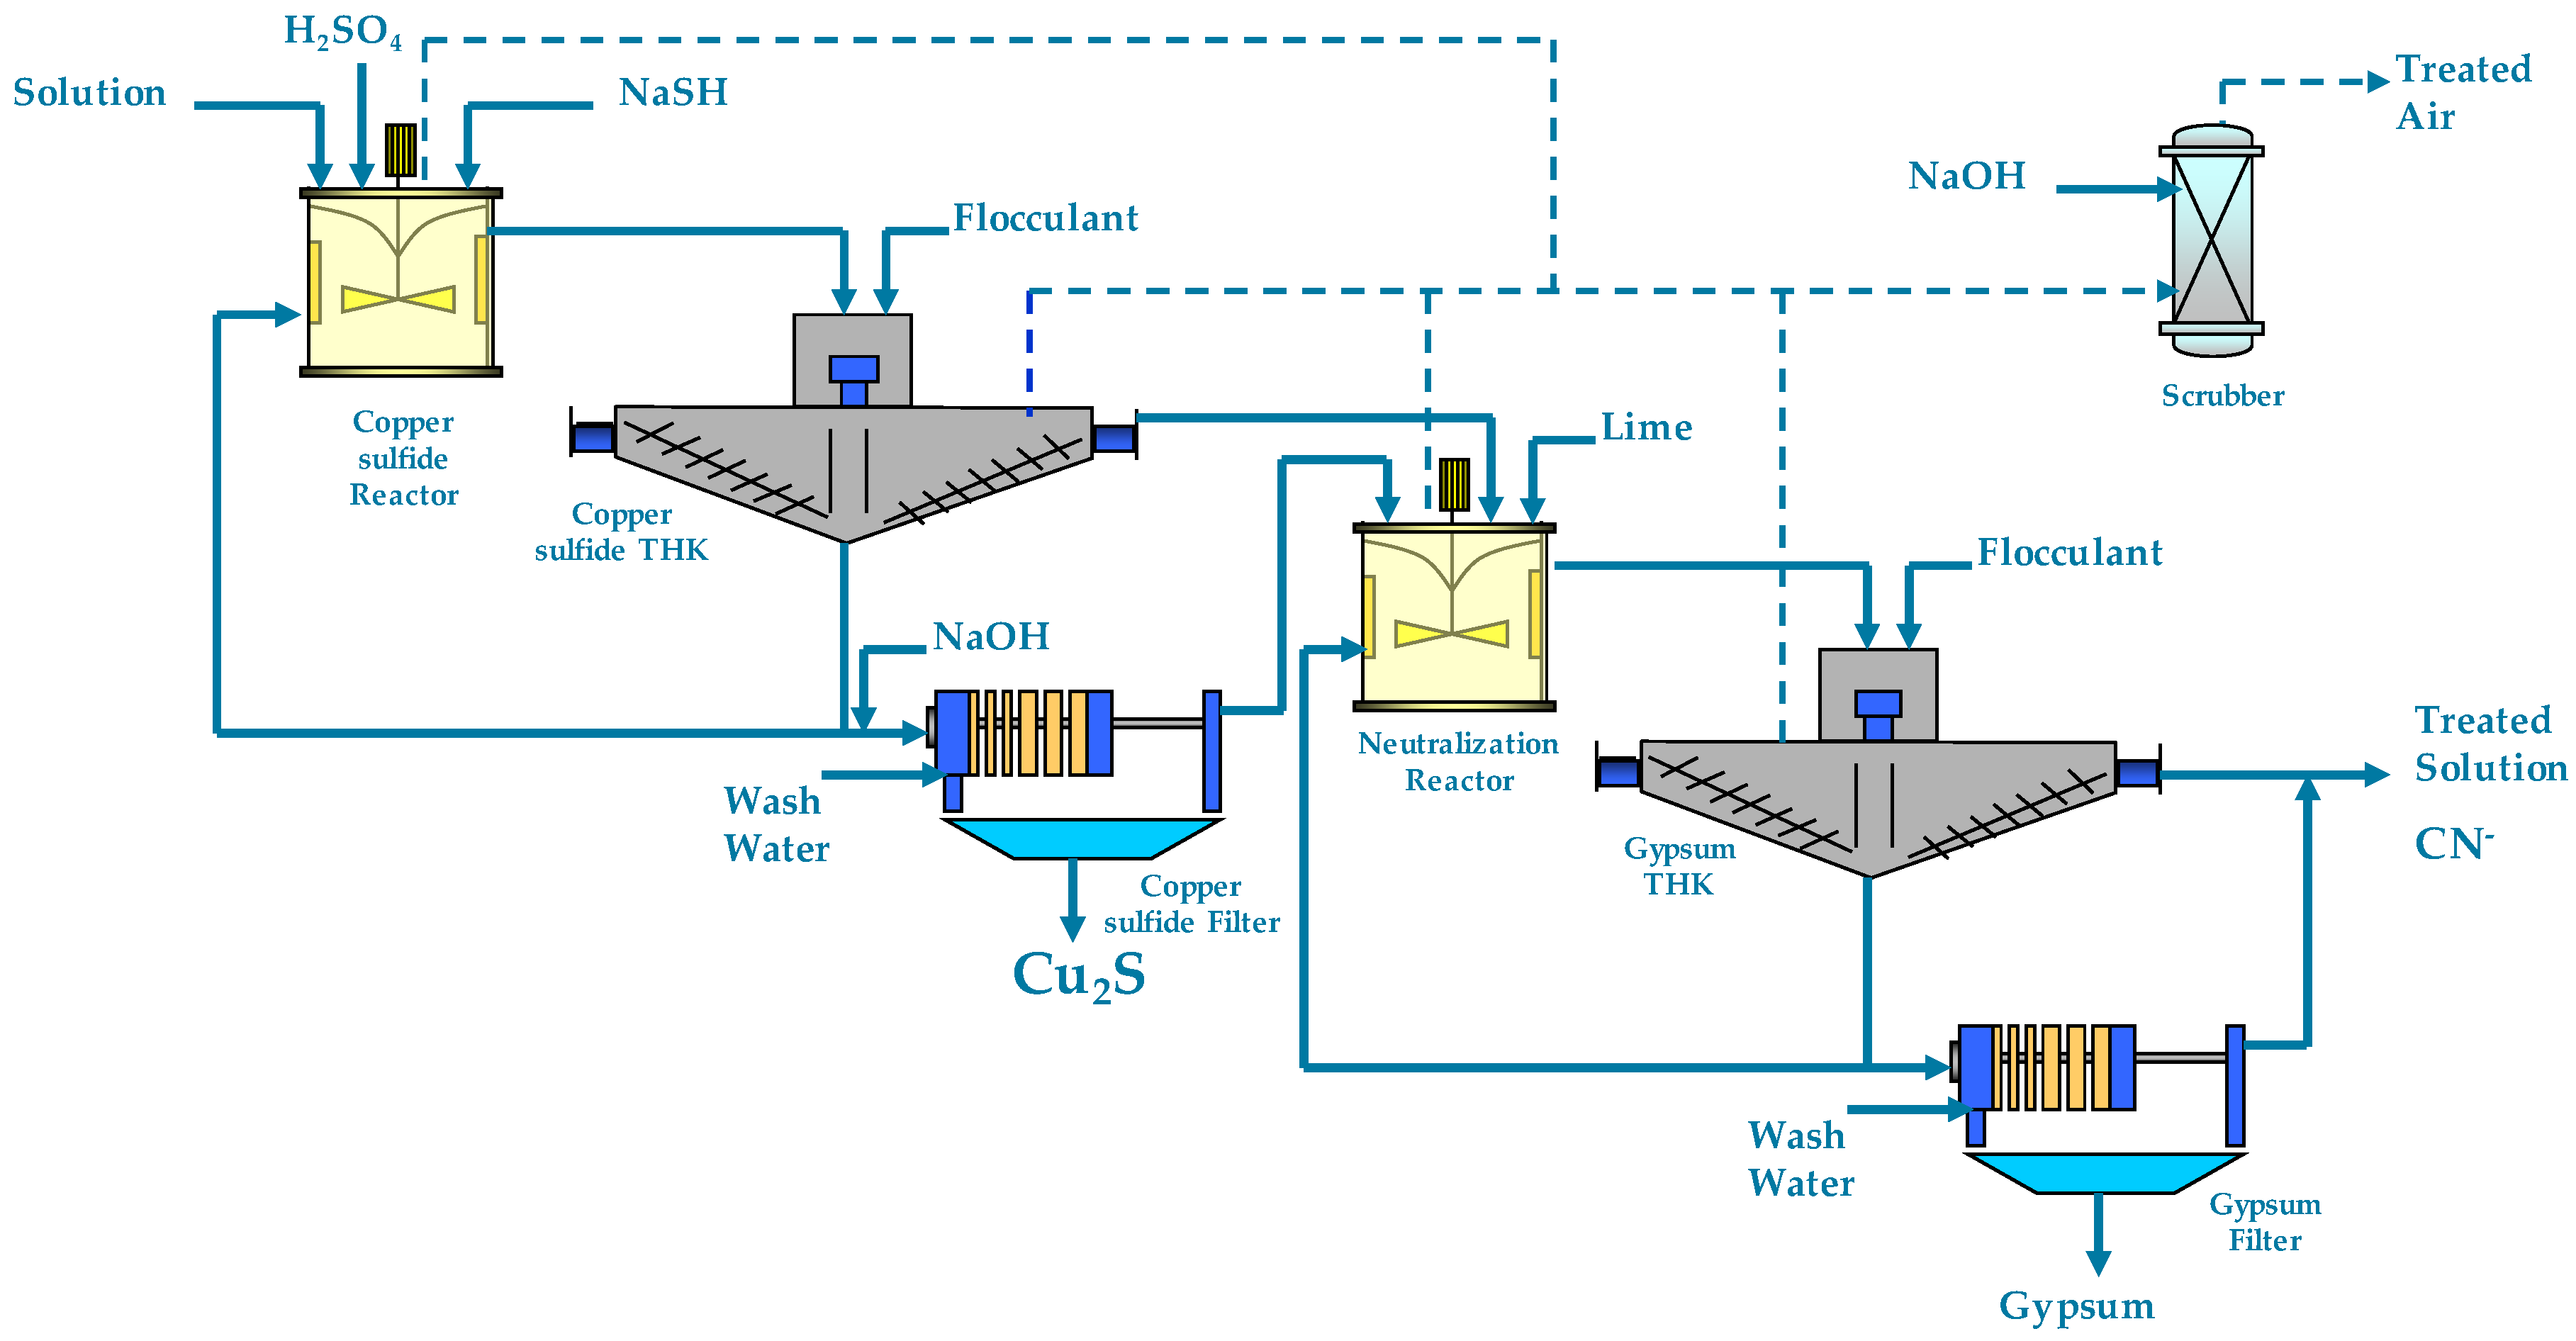
1.1. SART Process Description

The SART (sulfidization, acidification, recycling, and thickening) process has been installed in different gold cyanidation plants worldwide to address the issues associated with high cyanide-soluble copper content ores (additional cyanide consumption in the ore, increasing the cyanide concentration in the leach tails, decreasing gold adsorption efficiency in carbon adsorption stage, contamination of dore metal, wrong measurement of free cyanide and reduction of ore reserves) [1]. The main advantage of this technology is recovering cyanide and copper as a saleable by-product, based on the following reaction [2].
2 Cu ( CN ) 3 2 + 3 H 2 SO 4 + S 2 Cu 2 S ( s ) + 6 HCN ( aq ) + 3 SO 4 2
Equation (1) is based on Cu(I) as the stable ion in cyanide solutions. Furthermore, the Cu(CN)32− is the most stable cyano-copper specie present in cyanide solutions at typical operational pH (10.5–11.0). The main unit operations included in the SART process are reactors and solid-liquid separation stages, as shown in Figure 1.
The sulfidization reaction described in Equation (1) occurs in the copper sulfide reactor under pH conditions ranging between 4 and 5. Copper precipitate produced in this reactor is separated from cyanide solution in thickening (THK) and filtering stages. The treated cyanide solution must be neutralized to return into the cyanidation plant. For this purpose, milk of lime is added in the neutralization reactor to achieve pH 10.5, generating gypsum which is separated in sequential steps of thickening and filtering [1,2,3]. This conventional configuration in the SART flow-sheet has been applied successfully in different gold plants with high copper content in their cyanide solutions, such as Telfer, Lluvia de Oro, Yanacocha, Gedabek, Mastra, Maricunga, and Copler [4,5,6,7,8,9,10]. The unit operations described earlier could also use to recover zinc as ZnS in gold cyanidation plants with high cyanide-soluble zinc content ores, according to the reaction [1,11]
Zn ( CN ) 4 2 + 2 H 2 SO 4 + S 2 ZnS ( s ) + 4 HCN ( aq ) + 2 SO 4 2
When cyanidation plants use gold cementation with zinc, this is known as the Merrill–Crowe (MC) process. Here, the zinc powder is dissolved according to the following equation [12].
Au ( CN ) 2 + Zn 0 + H 2 O + 2 CN Au 0 + OH + 0.5 H 2 + Zn ( CN ) 4 2
Dissolved zinc-cyanide complex is built-up in the cyanidation plant reaching levels that require a bleed from cyanide solutions [12]. In this context, the SART process applied to recover cyanide and zinc could be implemented in cyanidation plants such as Cerro Vanguardia [13], La Coipa [14], El Peñón, and Yanacocha, among others [15]. However, there are some gold mines that have high cyanide-soluble copper content ores and MC process installed in the plant. In these cases, the conventional SART plant described in Figure 1 will produce a blended precipitate of copper and zinc. This fact decreases the copper (or zinc) grade in the precipitate from around 65% to approximately 35–40% in the case of copper, depending on the Cu/Zn molar ratio presence in the cyanide solution. This reduction on the precipitate grade decreases the sales price, due to the increase of transportation costs. Furthermore, the precipitate price is generally applied only for one metal contained, losing incomes associated to the other metal. Therefore, the blended copper–zinc precipitate generated by the conventional SART process loses value in plants with MC and high copper contents. With this in mind, there are some studies [16,17,18] proposing a two-stages SART process, recovering copper and zinc separately, based on the pH conditions where ZnS (Equation (2)) is formed (over pH 5) [1,11].

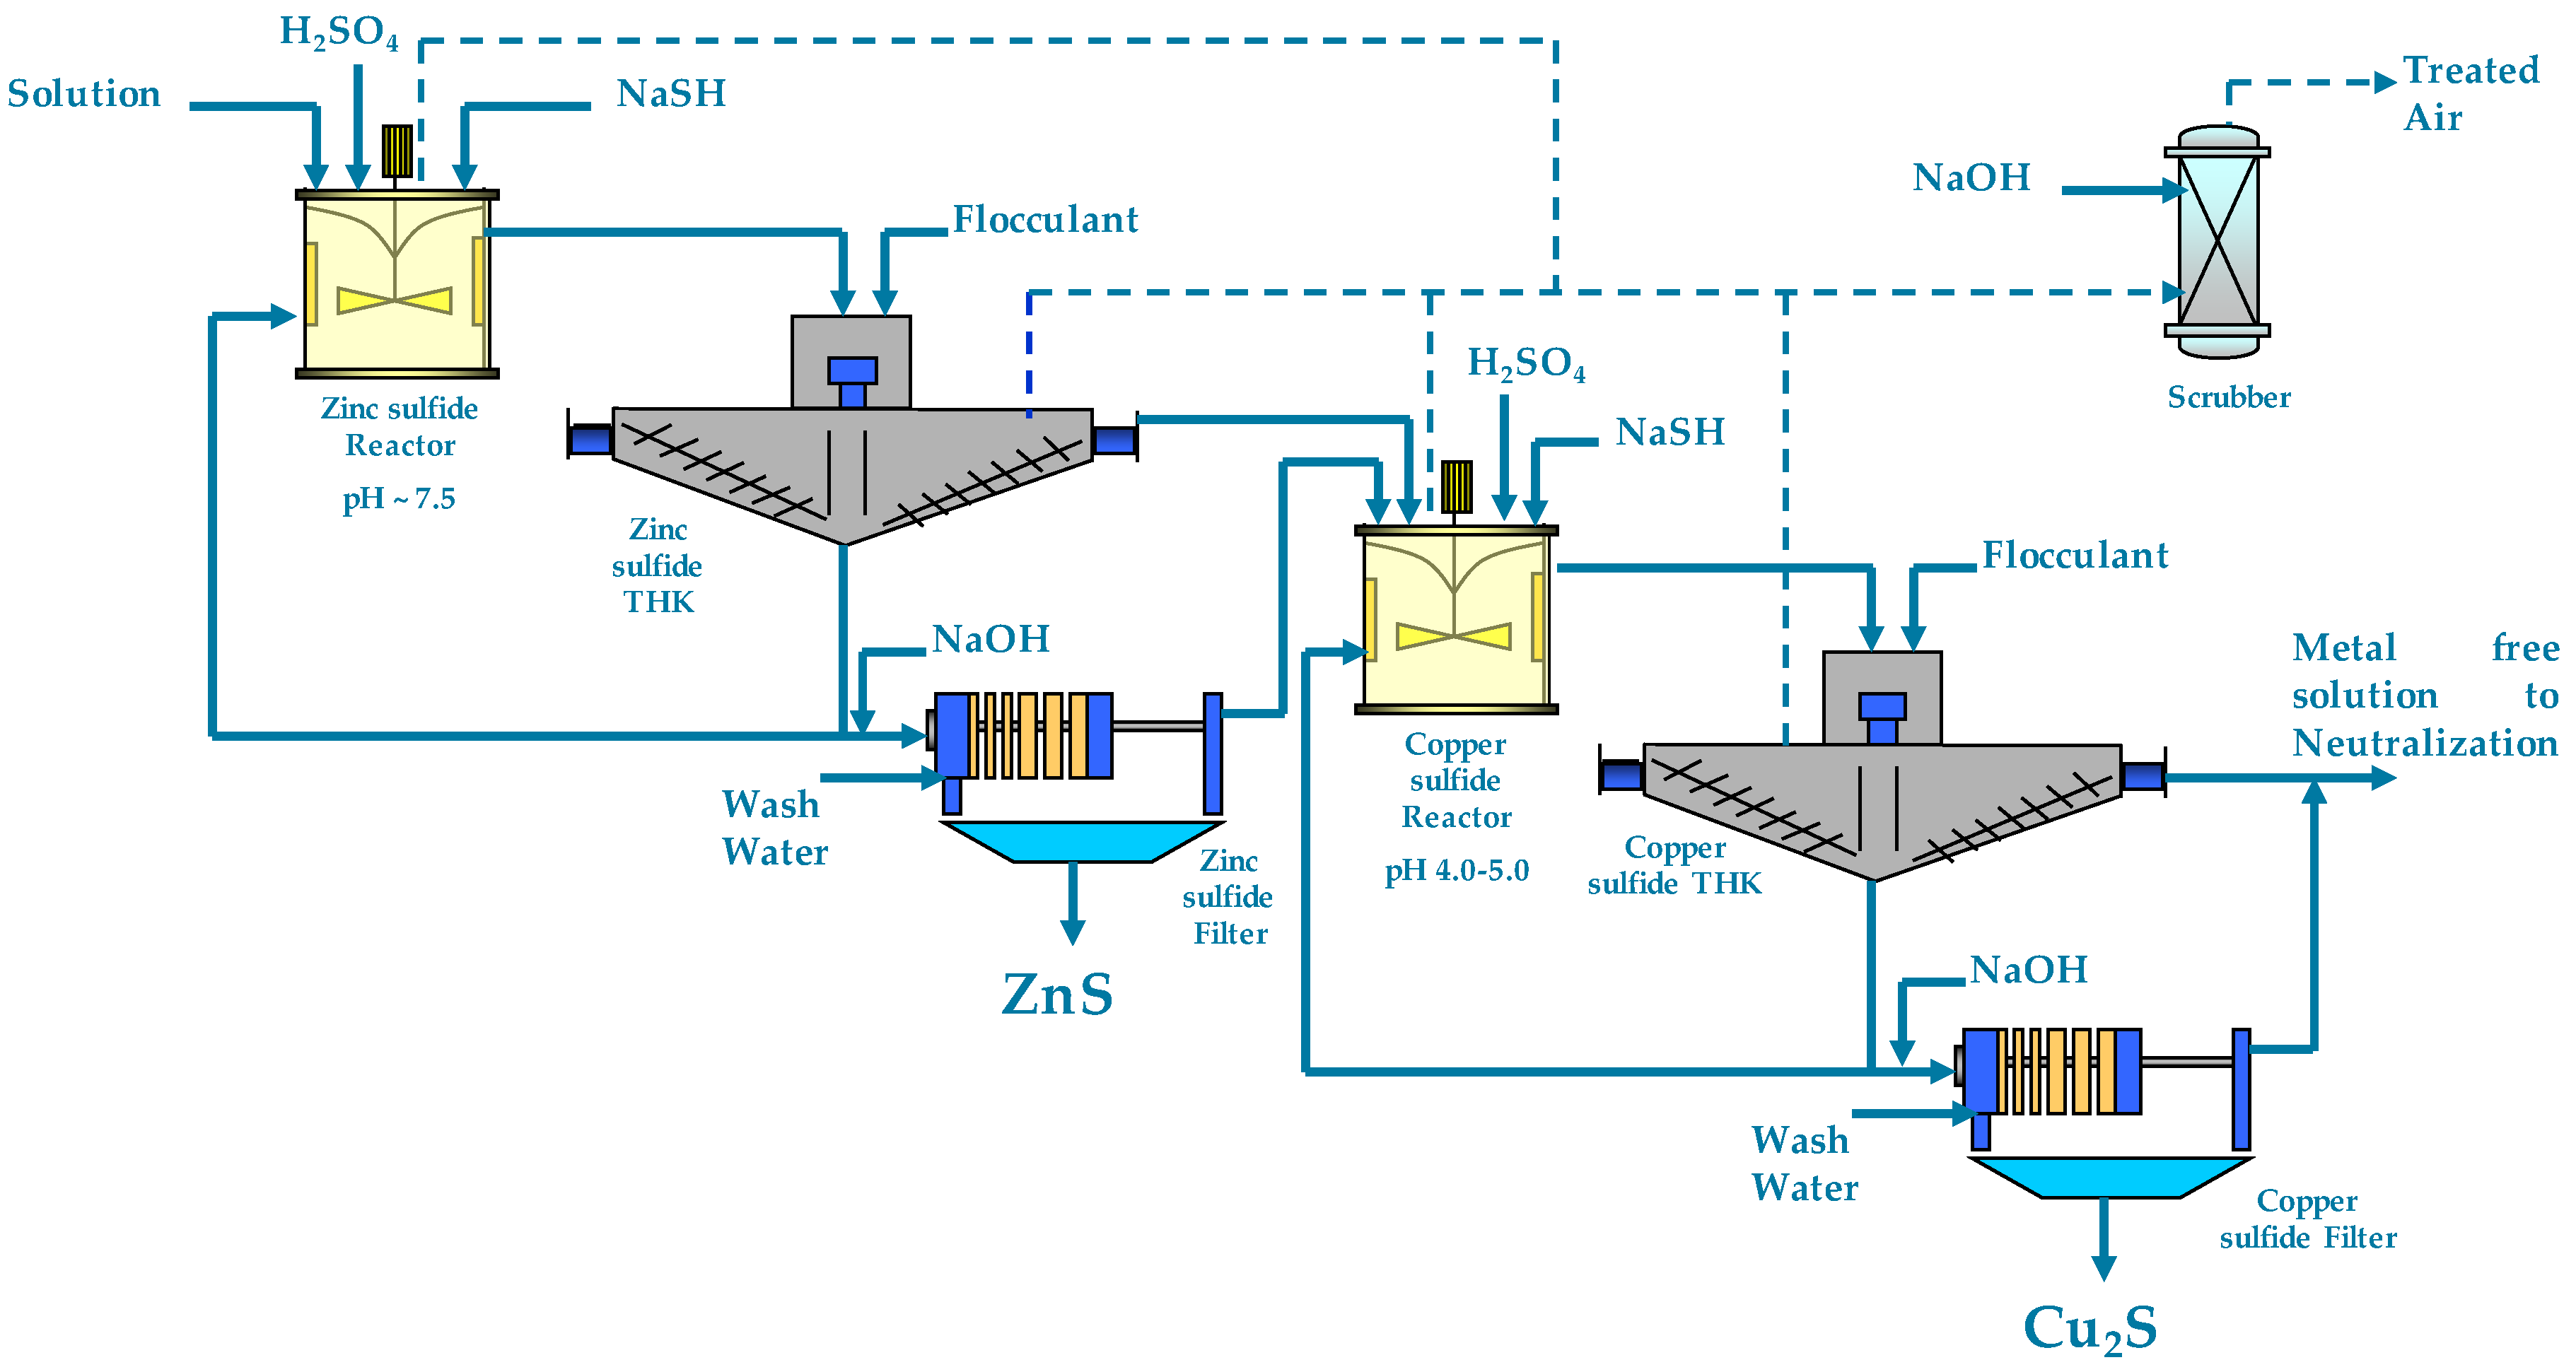
1.2. Two-Stage SART Process

The two-stage SART process includes additional stages such as the agitated reactor, thickening, and filtration for zinc, as shown in Figure 2.
The main background of ZnS precipitation from cyanide solutions is the Velardena process, which, keeping pH, treated a barren solution in order to recover cyanide and bleed zinc from solutions [19]. Furthermore, the recent studies for the two-stage SART process [16,17,18] have achieved zinc precipitation efficiencies over 90% at pH 7.5 with low copper precipitation (below 5%) in the first stage. The second stage was operated as the conventional SART process, treating the overflow of the zinc sulfide thickener at pH 4.5, reaching copper efficiencies higher than 90%. Additionally, the performance separation of the two-stage SART process assessed at pilot scale was successful, obtaining overall recoveries higher than 90% and 99% for copper and zinc respectively, and two separated precipitates having 67% zinc grade and 71% copper grade each [18]. Even though, these results are promising, the two-stage SART process involves the inclusion of extra equipment, increasing the capital and operational costs. Furthermore, the studies published at this moment present results using cyanide solutions containing a specific Cu/Zn molar ratio and fixed pH conditions. Thus, the performance effect of different Cu/Zn molar ratio in the cyanide solution and pH of each sulfidization stage has not been performed.
The aim of this study is to present a methodology which estimates the range of Cu/Zn molar ratio in a cyanide solution where the two-stage SART is feasible, based on a thermodynamic model and an economic evaluation.

2. Methods

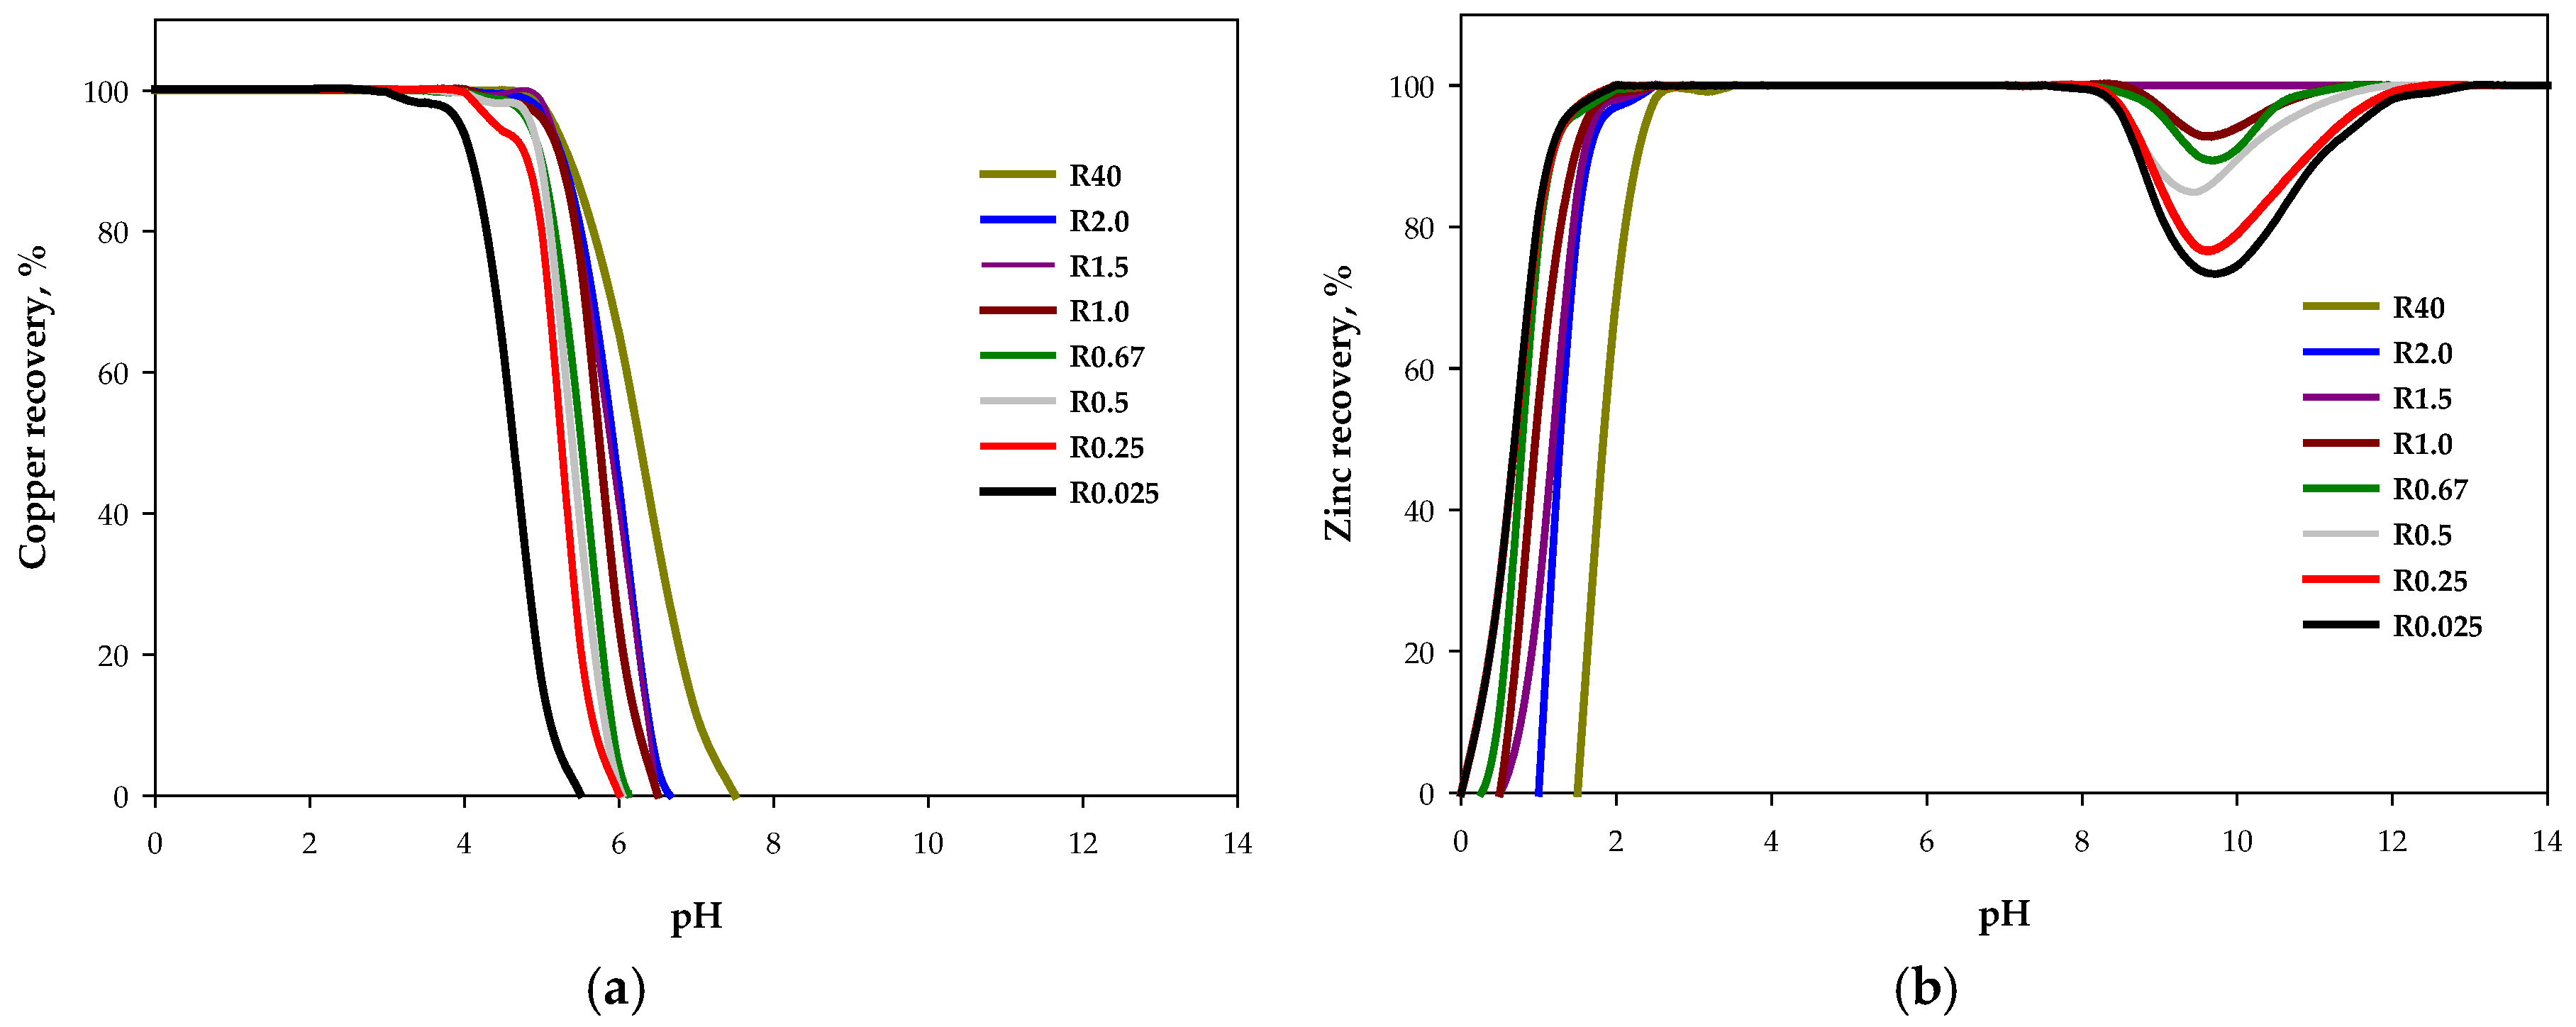
2.1. Estimation of Operational Parameters Using a Thermodynamic Model

The speciation of metal-cyanide complexes can be estimated using the equilibrium constants and a mass balance of each reaction involved in an aqueous solution [20]. Furthermore, sulfidization Equations (1) and (2) can be added to the metal-cyanide complexes equations system in order to establish the speciation of each cyanide complex and metal-sulfide precipitates. Table 1 shows the equilibrium relations involved in the two-stage SART process.
The species distribution in cyanide solution and sulfidization stages has been determined using the Hydra/Medusa software (Version 1) (KTH Royal Institute of Sweden, Stockholm, Sweden) [27]. This model can estimate Eh-pH and speciation diagrams of different compounds and reactions. However, the thermodynamic data base (equilibrium constants, Ki) of Hydra/Medusa has been changed according to Table 1 for those reactions. Therefore, the recoveries and grades for copper and zinc at different pH were predicted using this modified software.
In the presence of HS ions content, speciation curves of metal-cyanide complexes for copper and zinc, were developed. Cu/Zn molar ratios (based on copper and zinc contents in the cyanide solution) ranging between 0.025 and 40 (0.025, 0.25, 0.5, 0.67, 1.0, 1.5, 2.0, and 40) were assessed keeping a free cyanide concentration of 100 mg/L for pH over 10.5 and sulfide stoichiometric addition equivalent to 120% stoichiometric of copper and zinc (based on Equations (1) and (2)). The free cyanide concentration value is a typical concentration set in cyanide solutions by the cyanidation plants in order to ensure gold dissolution [12], while the sulfide stoichiometric addition of 120% in the SART process is based on experimental and operational experience focused on maximizing copper recovery [1].
The results of copper and zinc recoveries and grades in the precipitate are based on the following assumptions:
  • The model did not include other metals—such as iron, mercury, silver, or nickel—because these elements are typically present in low contents of cyanide solutions (<10 mg/L).
  • The main reactions involved in sulfidization stage were Table 1.
  • The estimation of copper and zinc recoveries did not include process inefficiencies such as re-dissolution of metals by oxidation and precipitate lost in the thickener overflow [1,11].
Results of speciation curves at different Cu/Zn molar ratio and pH were analyzed, proposing the best pH conditions to operate the conventional (one-stage) or the two-stage SART process.

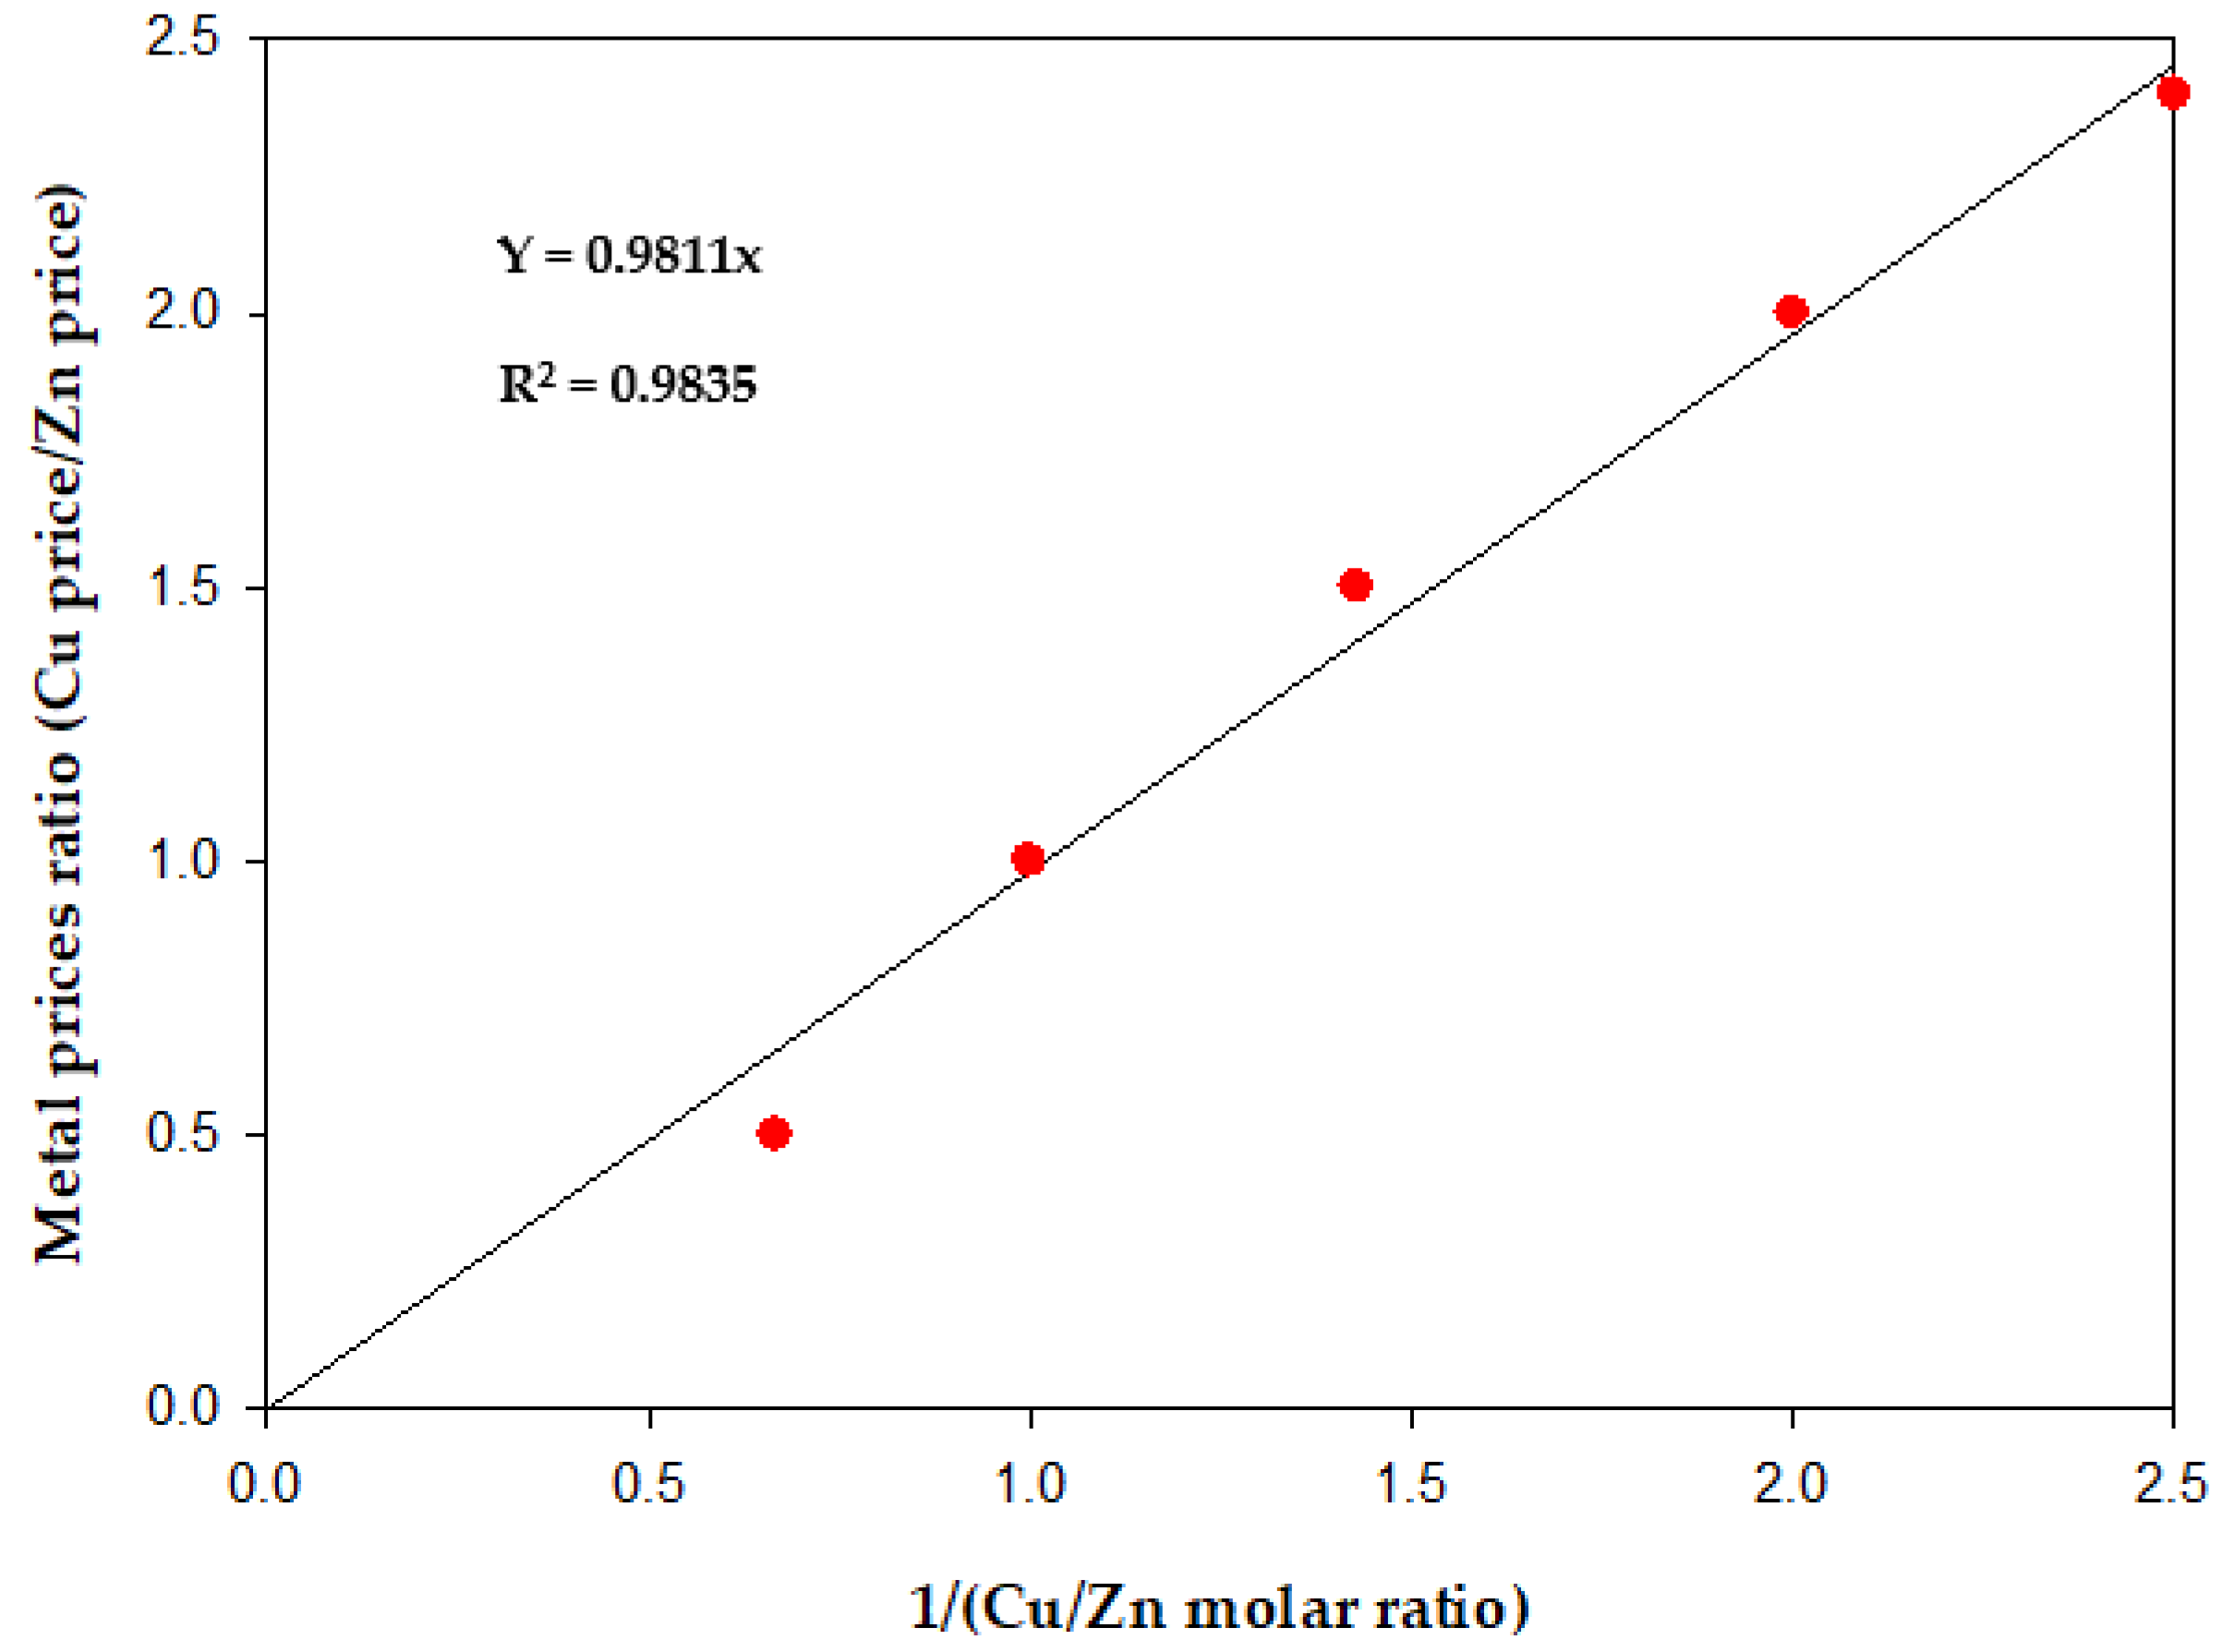
2.2. Economic Comparison between Conventional and Two-Stage SART Process Options

The pH conditions for two SART process options defined in the earlier section determines metal recoveries and grades in the precipitate, for each Cu/Zn molar ratio assessed. These two parameters (recovery and grade) define the incomes expected by both SART process options. On the one hand, metal recovery determines the metal sulfide production. On the other hand, the metal grade in the precipitate defines the total mass of precipitate generated determining the transport cost. In this context, the economic criteria used to estimate the precipitate value (US$/precipitate ton) are shown in Table 2.
Metals prices are defined according to recent prices (March–April 2018 period) by the London metals exchange (LME), while the discount rate of precipitate is an average value of typical discount fixed by refineries treating semi-processed products such as copper concentrates. Additionally, the transport cost is based on truck transport from mining to a refinery or port located at 200 km of distance.
The main issue of a blended copper/zinc precipitate produced by the conventional SART process is that precipitate price is fixed according to the value of one metal (copper or zinc). Therefore, the other metal is considered as an “impurity” in the precipitate. This fact makes the two-stage SART process an interesting option to generate additional incomes based on the incomes by the two metals. Hence, this methodology defines the price of the blended precipitate generated by the conventional SART process as the price of the most valuable metal in the precipitate (metal price × mass of metal recovered). Additionally, the price defined for both precipitates generated by the two-stage SART process is based on the individual recovery of zinc and copper achieved in each stage.
The economic evaluation was performed comparing the conventional and the two-stage SART processes differences. This means that the capital and operational costs have been estimated based only on the differences between two options. Thus, the cash flow included the differential costs (capital and operational) and precipitate incomes, estimating a differential net present value (NPV) of cash flow per SART plant capacity. The parameters values used to assess the economic estimation are shown in Table 3.
The additional equipment defined in the two-stage SART process are the zinc sulfide reactor, the thickener, and the filter. These equipment must also consider instrumentation, piping, electric materials, and vent ducts. The capital cost of a SART plant is very variable, mainly depending on the specific requirements of the gold plant [1]. Nevertheless, a recent study estimated the additional capital costs of the two-stage SART process [18] approximately in 36.0 kUS$/(m3/h). This value is similar to the one used and reported by other SART plants [1]. Energy consumption was estimated based on the additional thickener rake and underflow pumps, and the flocculant consumption has been taken from recent data reported [1]. Furthermore, energy and flocculant prices are based on recent quotations of mining plants operating in Chile. NPV was estimated in a period of 10 years, using 5% of discount rate.
Finally, the differential cash flow was estimated for each Cu/Zn molar ratio. Consequently, the copper concentration in the cyanide solution varied from 100 mg/L to 1200 mg/L.

3. Results and Discussion

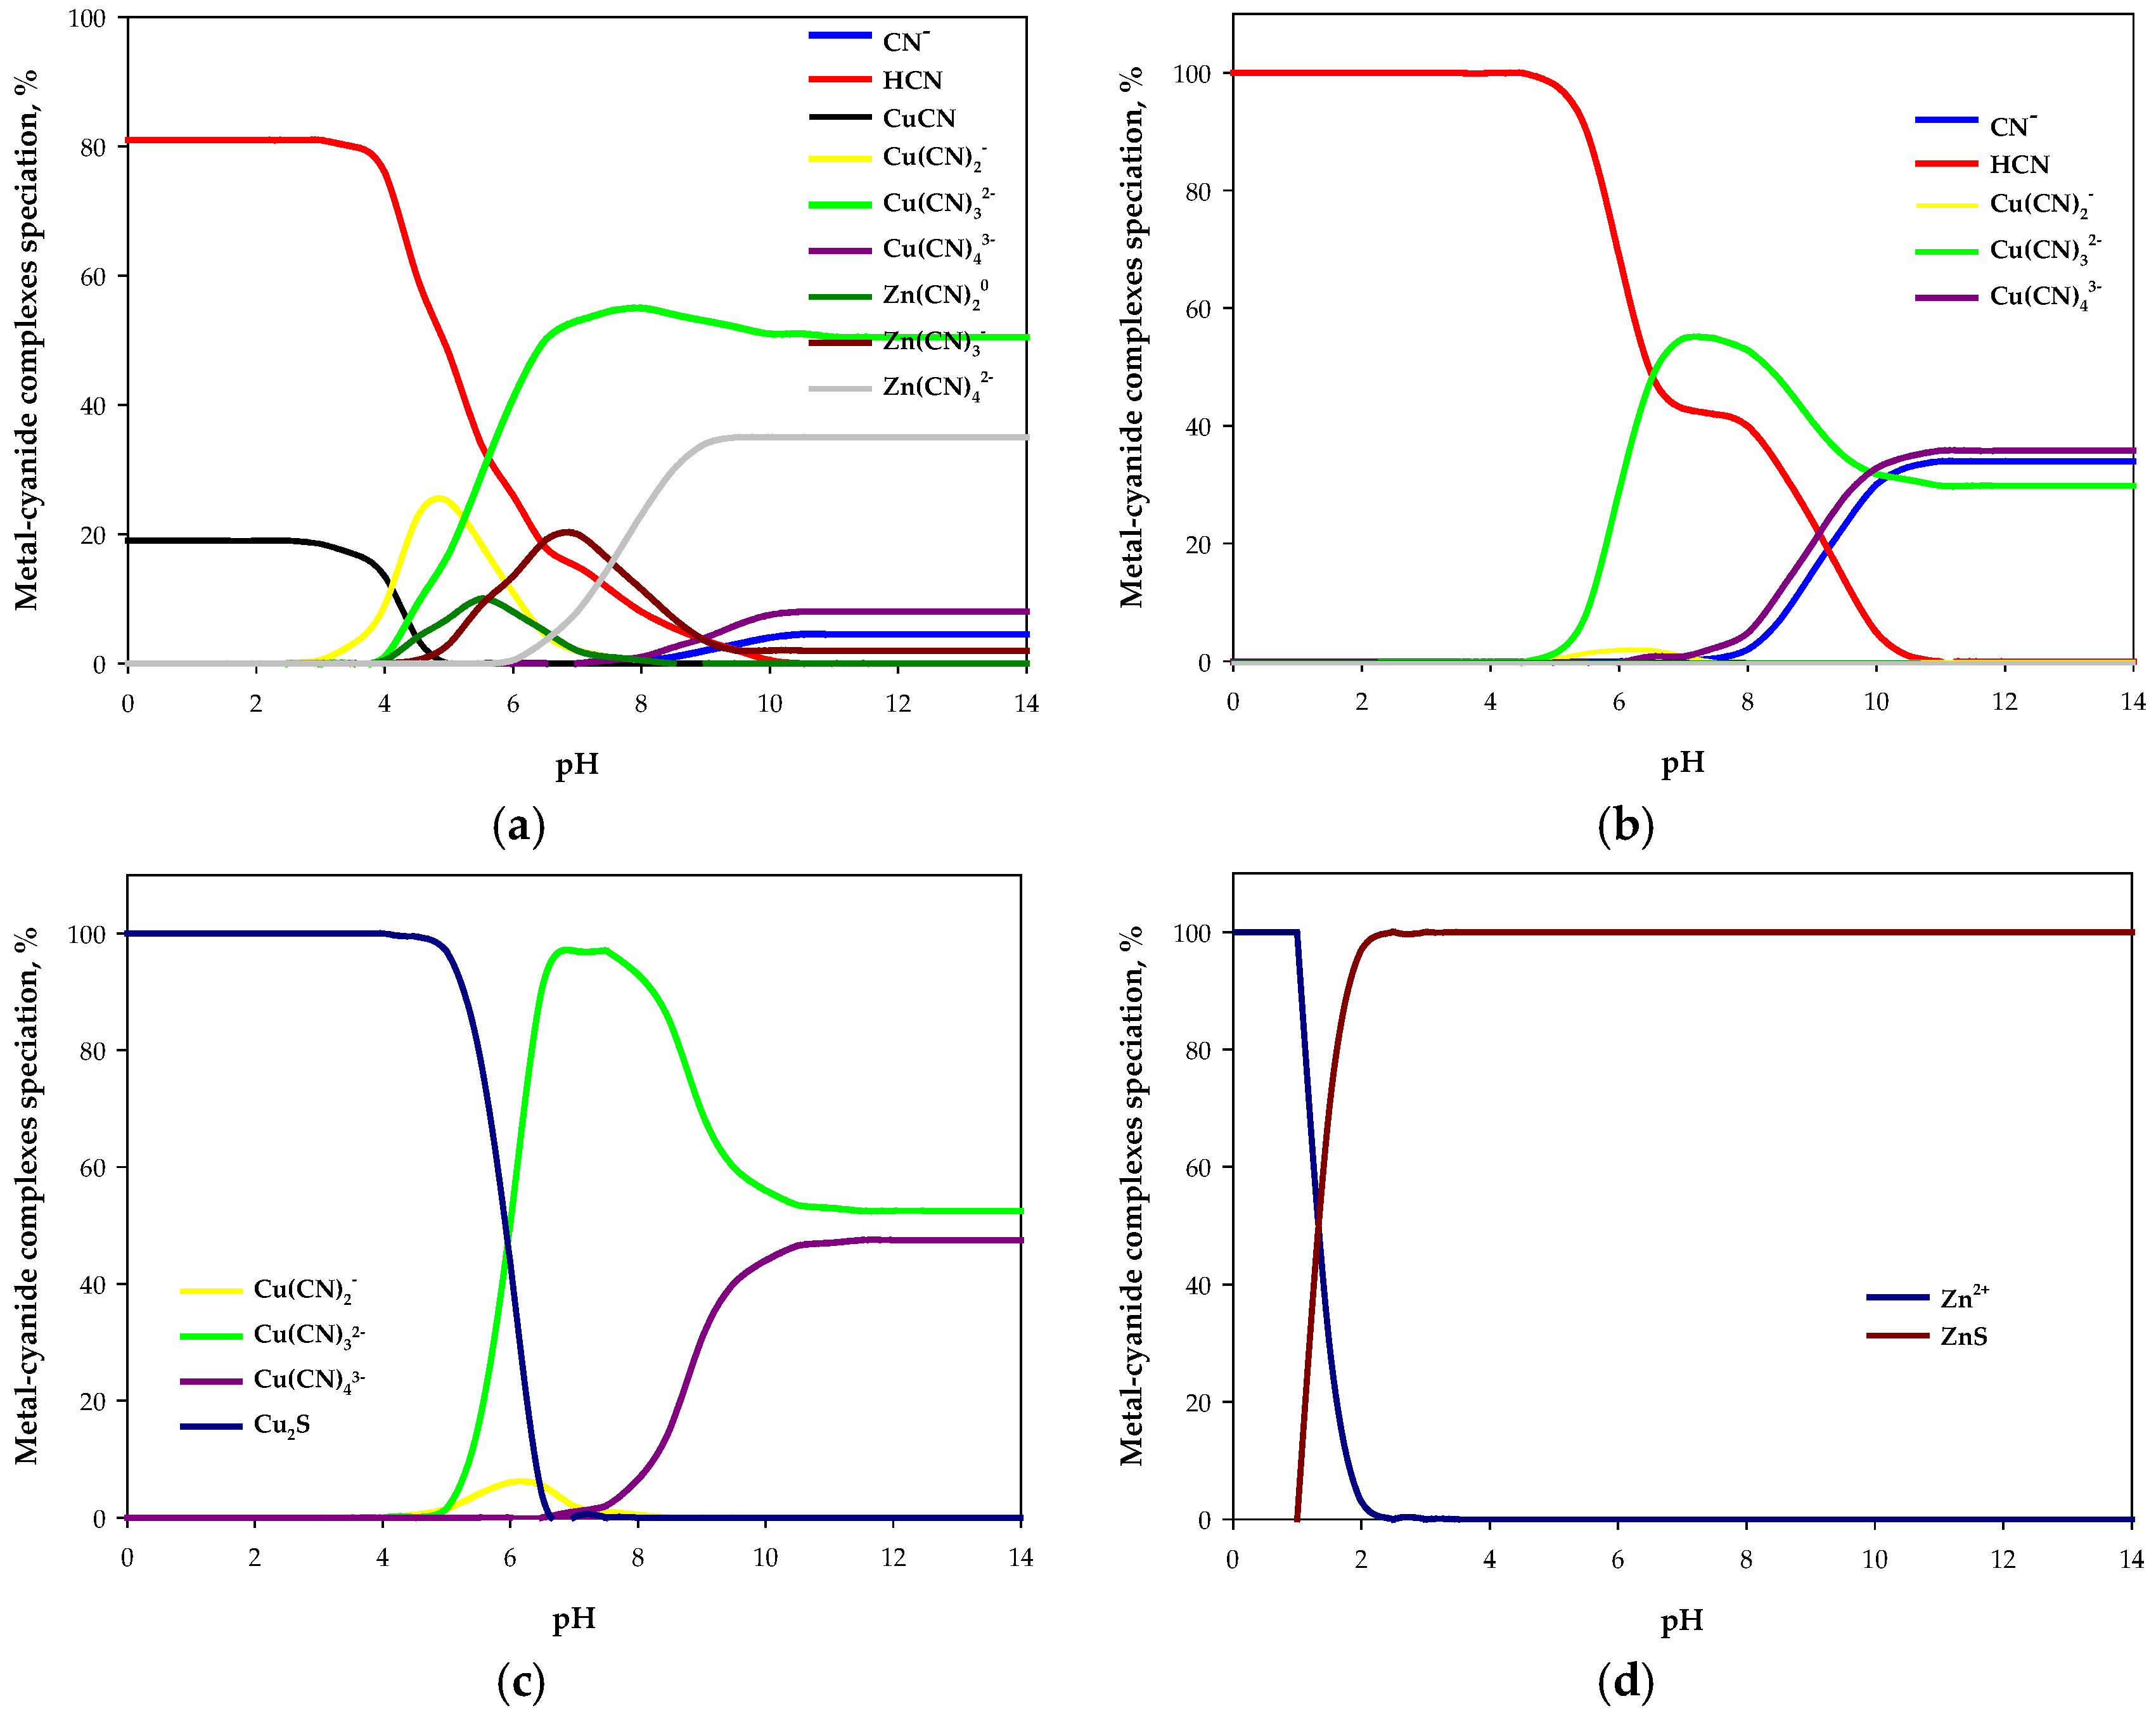
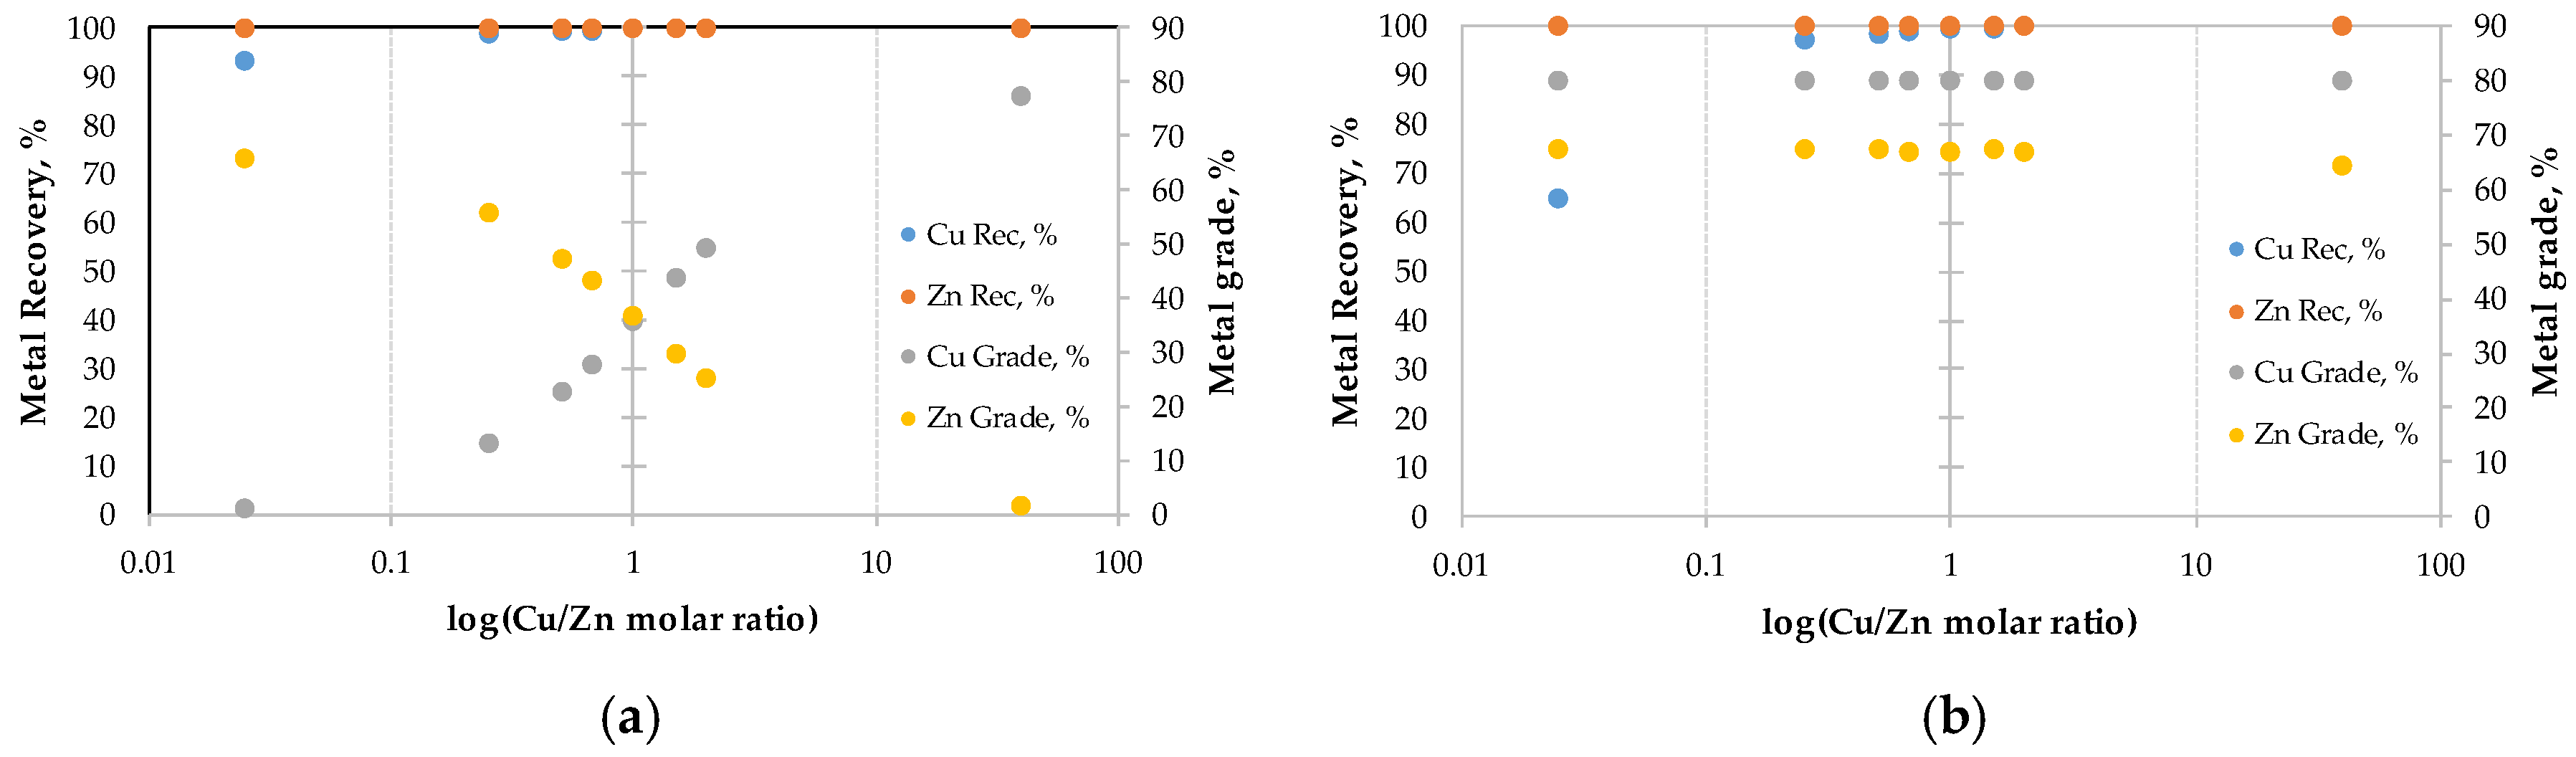
3.1. Operational Conditions and Metal Recoveries

Speciation curves of metal-cyanide complexes and sulfide metals were performed using Hydra/Medusa software, as explained in Section 2.1 Results obtained from this software show the content of each compound as function of pH. Figure 3 shows the speciation curves of a cyanide solution containing a Cu/Zn molar ratio of 2.0, before and after being treated in the conventional one-stage SART process.
These results show the high metal-cyanide complexes present in a cyanide solution when pH values are higher than 10.0 (Figure 3a). Thus, the free cyanide concentration fixed at 100 mg/L—for typical gold cyanidation conditions (Ph = 10.5)—is equivalent to approximately 4% of the weak acid dissolved (WAD) cyanide concentration. In return, when sulfide is added to the cyanide solution, ZnS is formed according to Equation (2) for pH values lower than 12.0 (Figure 3d), since zinc-cyanide complexes are dissociated to free cyanide. In fact, this dissociation generates free cyanide. Figure 3b shows the increase of free cyanide concentration from 4% to around 34% and Cu(CN)43− concentration from 8% to 35%. When pH decreases under 5.0 copper-cyanide complexes are dissociated to form HCN and Cu2S according to Equation (1) (Figure 3c). Therefore, the SART process can recover theoretically 100% of cyanide complexed to zinc and copper for pH values under 5.0. Furthermore, zinc can be completely recovered for pH higher than 2.5, and copper reaches recovery values of 100% for pH lower than 4.0. These results are accordant with experimental and operational results of different SART process studies [1,10,11,16,28] where copper can achieve recovery values higher than 95% at pH, ranging between 4.0 and 5.0, and zinc can reach recovery values higher than 99% when pH is less than 7.5.
Copper and zinc recoveries have been estimated for different Cu/Zn molar ratios using the same methodology presented in Figure 3. Thus, Figure 4 shows copper and zinc recovery for the one-stage SART process.
Figure 4 shows the Cu2S stability under pH values below 7.0, achieving recoveries higher than 90% at pH 4.0 for each Cu/Zn molar ratio simulated. Furthermore, copper recovery increases when Cu/Zn molar ratio has increased, due to the high equilibrium constant of Cu2S—or solubility constant —presented in Table 1. Also, ZnS is very stable for pH values ranging between 2.0 to 12.0, except in the zone between pH values of 8.0 to 12.0, where Zn(CN)42− becomes stable together with ZnS. In this pH area, zinc recovery can decrease under 80%, depending on Cu/Zn molar ratio and free cyanide concentration. When these two parameters increase, zinc recovery decreases. These results allow to define the pH operational conditions that maximize the metals recovery in both SART process options. Therefore, copper recovery can reach values over 95% at pH 4.0. At this condition, ZnS remains stable ensuring zinc recovery over 99%. In the case of the two-stage SART process, the first stage of zinc precipitation can be operated at pH 7.5 or lower, where Zn(CN)43− specie is dissociated to ZnS and HCN in the presence of sulfide. These proposed conditions are similar to the ones found by experimental studies of the two-stage SART process [16,18]. Hence, the theoretical model can predict the optimal conditions of the SART process—conventional and two-stage—maximizing metal recoveries, according to Cu/Zn metal ratio and cyanide concentration in a cyanide solution of a gold plant. Indeed, this theoretical methodology can support an experimental study to extrapolate operational conditions to others Cu/Zn molar ratios, understanding the effect of different parameters involved in a SART process (pH, NaHS addition, cyanide, copper and zinc content). Figure 5 shows copper and zinc recoveries and grades obtained for the conventional and the two-stage SART process for different Cu/Zn molar ratios.
The zinc recovery reaches 100% in both SART process options. Instead copper recovery overcomes 90% in one-stage option for every Cu/Zn molar ratios simulated. However, copper recovery falls up to 65% in the two-stage option for a Cu/Zn molar ratio of 0.025. This fact is explained by the increase of HCN concentration in the solution which fed into the second stage (copper precipitation) promoted by the precipitation reaction of zinc performed in the first stage (Equation (2)). The high HCN content in the feed solution of the second stage allows to keep the Cu(CN)2 complex more stable at lower pH. Therefore, the two-stage SART process must carefully define the operational pH of the second stage in order to maximize the copper recovery, particularly when Cu/Zn molar ratio is low. In terms of metal grades in the precipitate, the two-stage option allows to obtain two different high-grade precipitates for copper and zinc. Finally, the two-stage SART process option achieves higher metal recoveries than the conventional option, and two separated salable high-grade precipitates. Nevertheless, the additional capital and operational costs could limit the implementation of this technology. For this reason, a simple economic evaluation is performed to delimit the feasible range of Cu/Zn molar ratio when the two-stage SART process can be implemented.

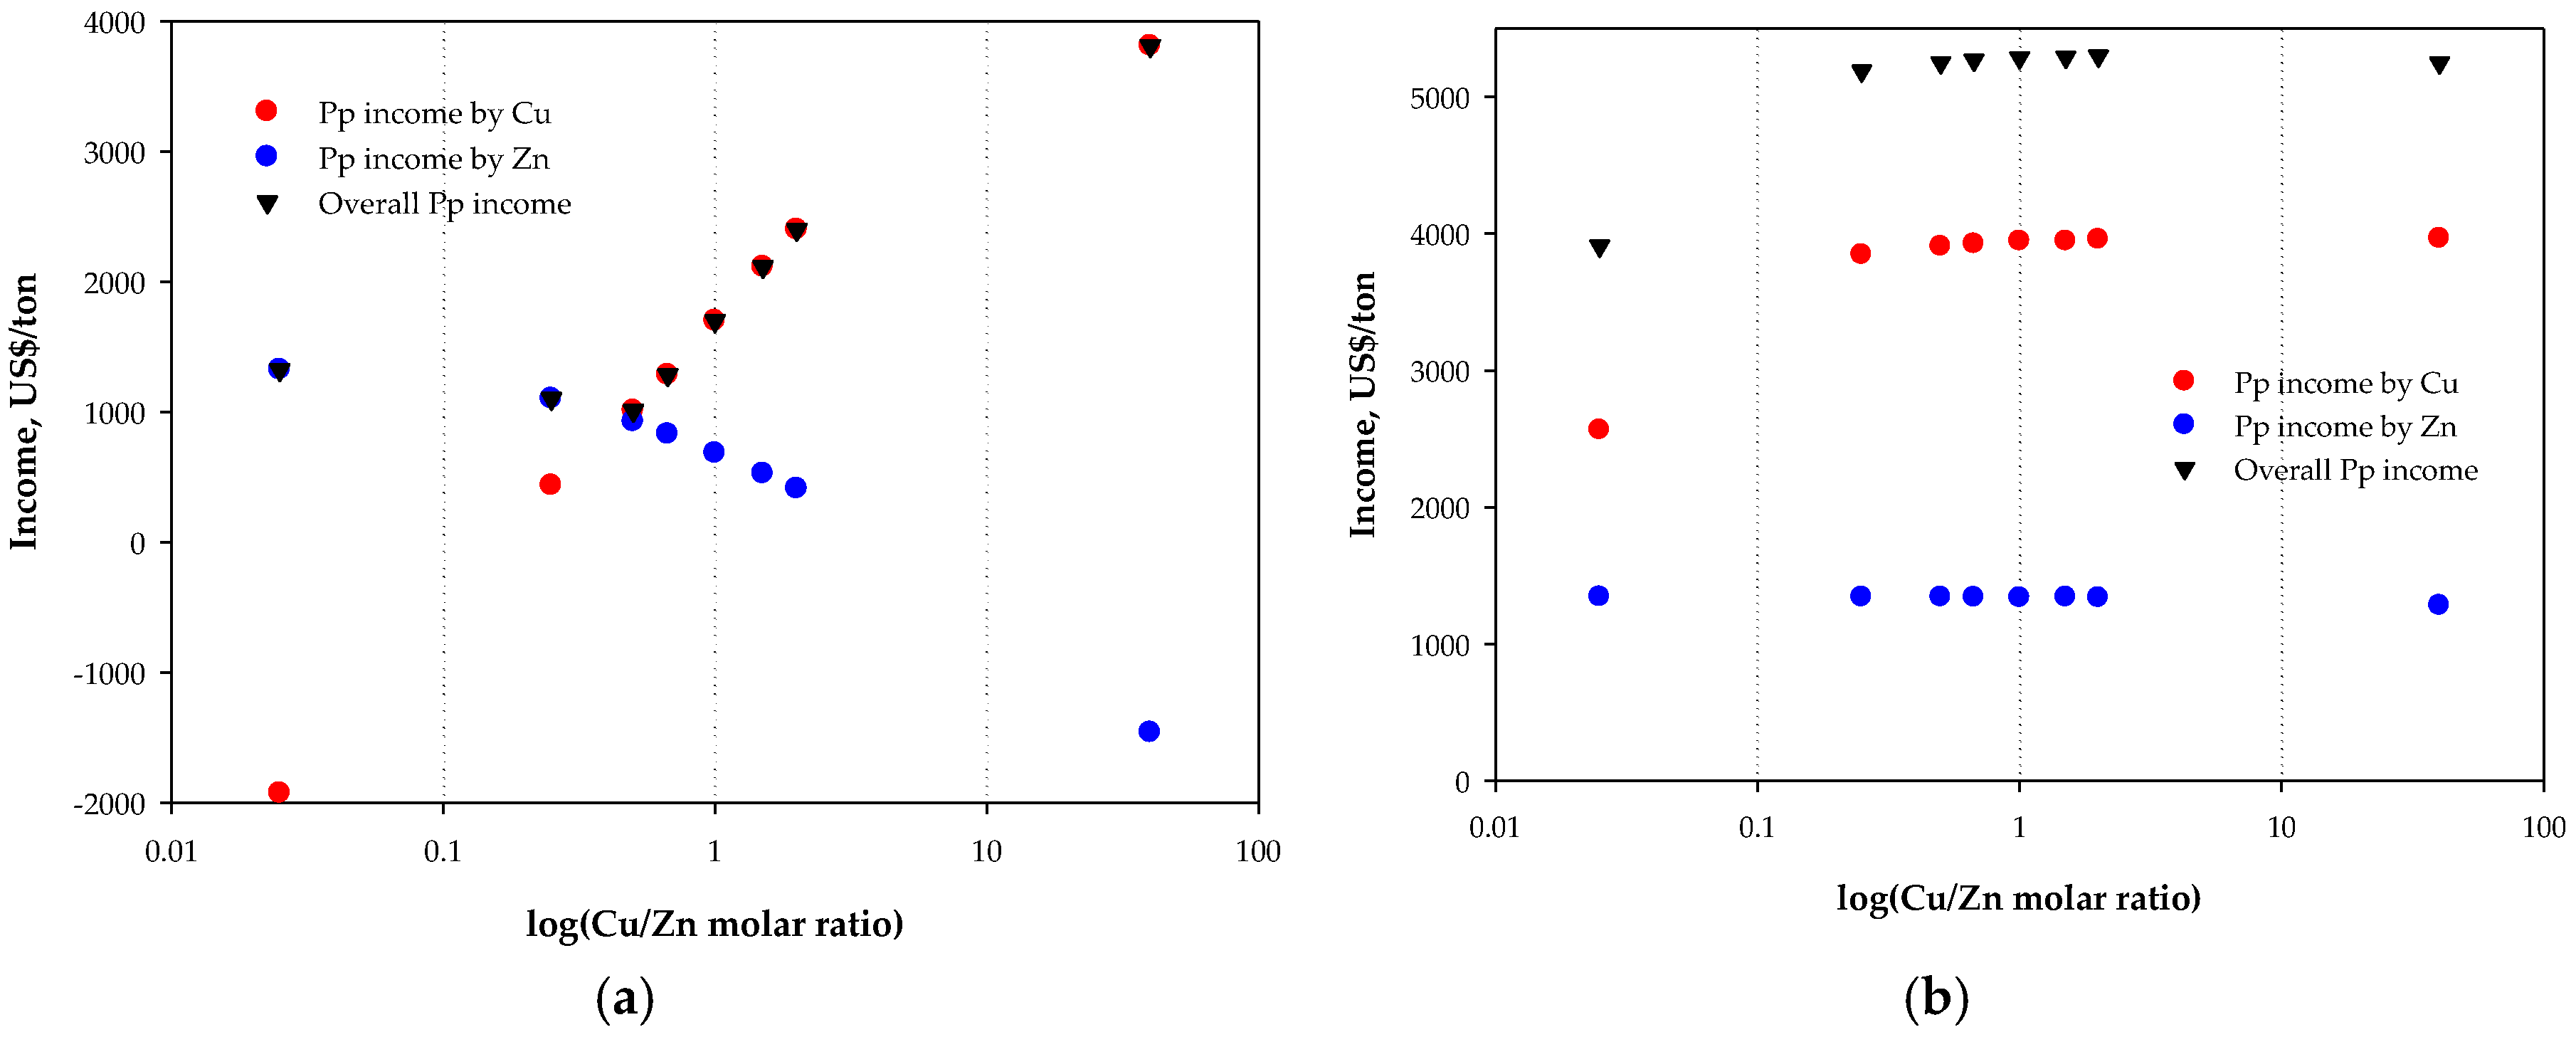
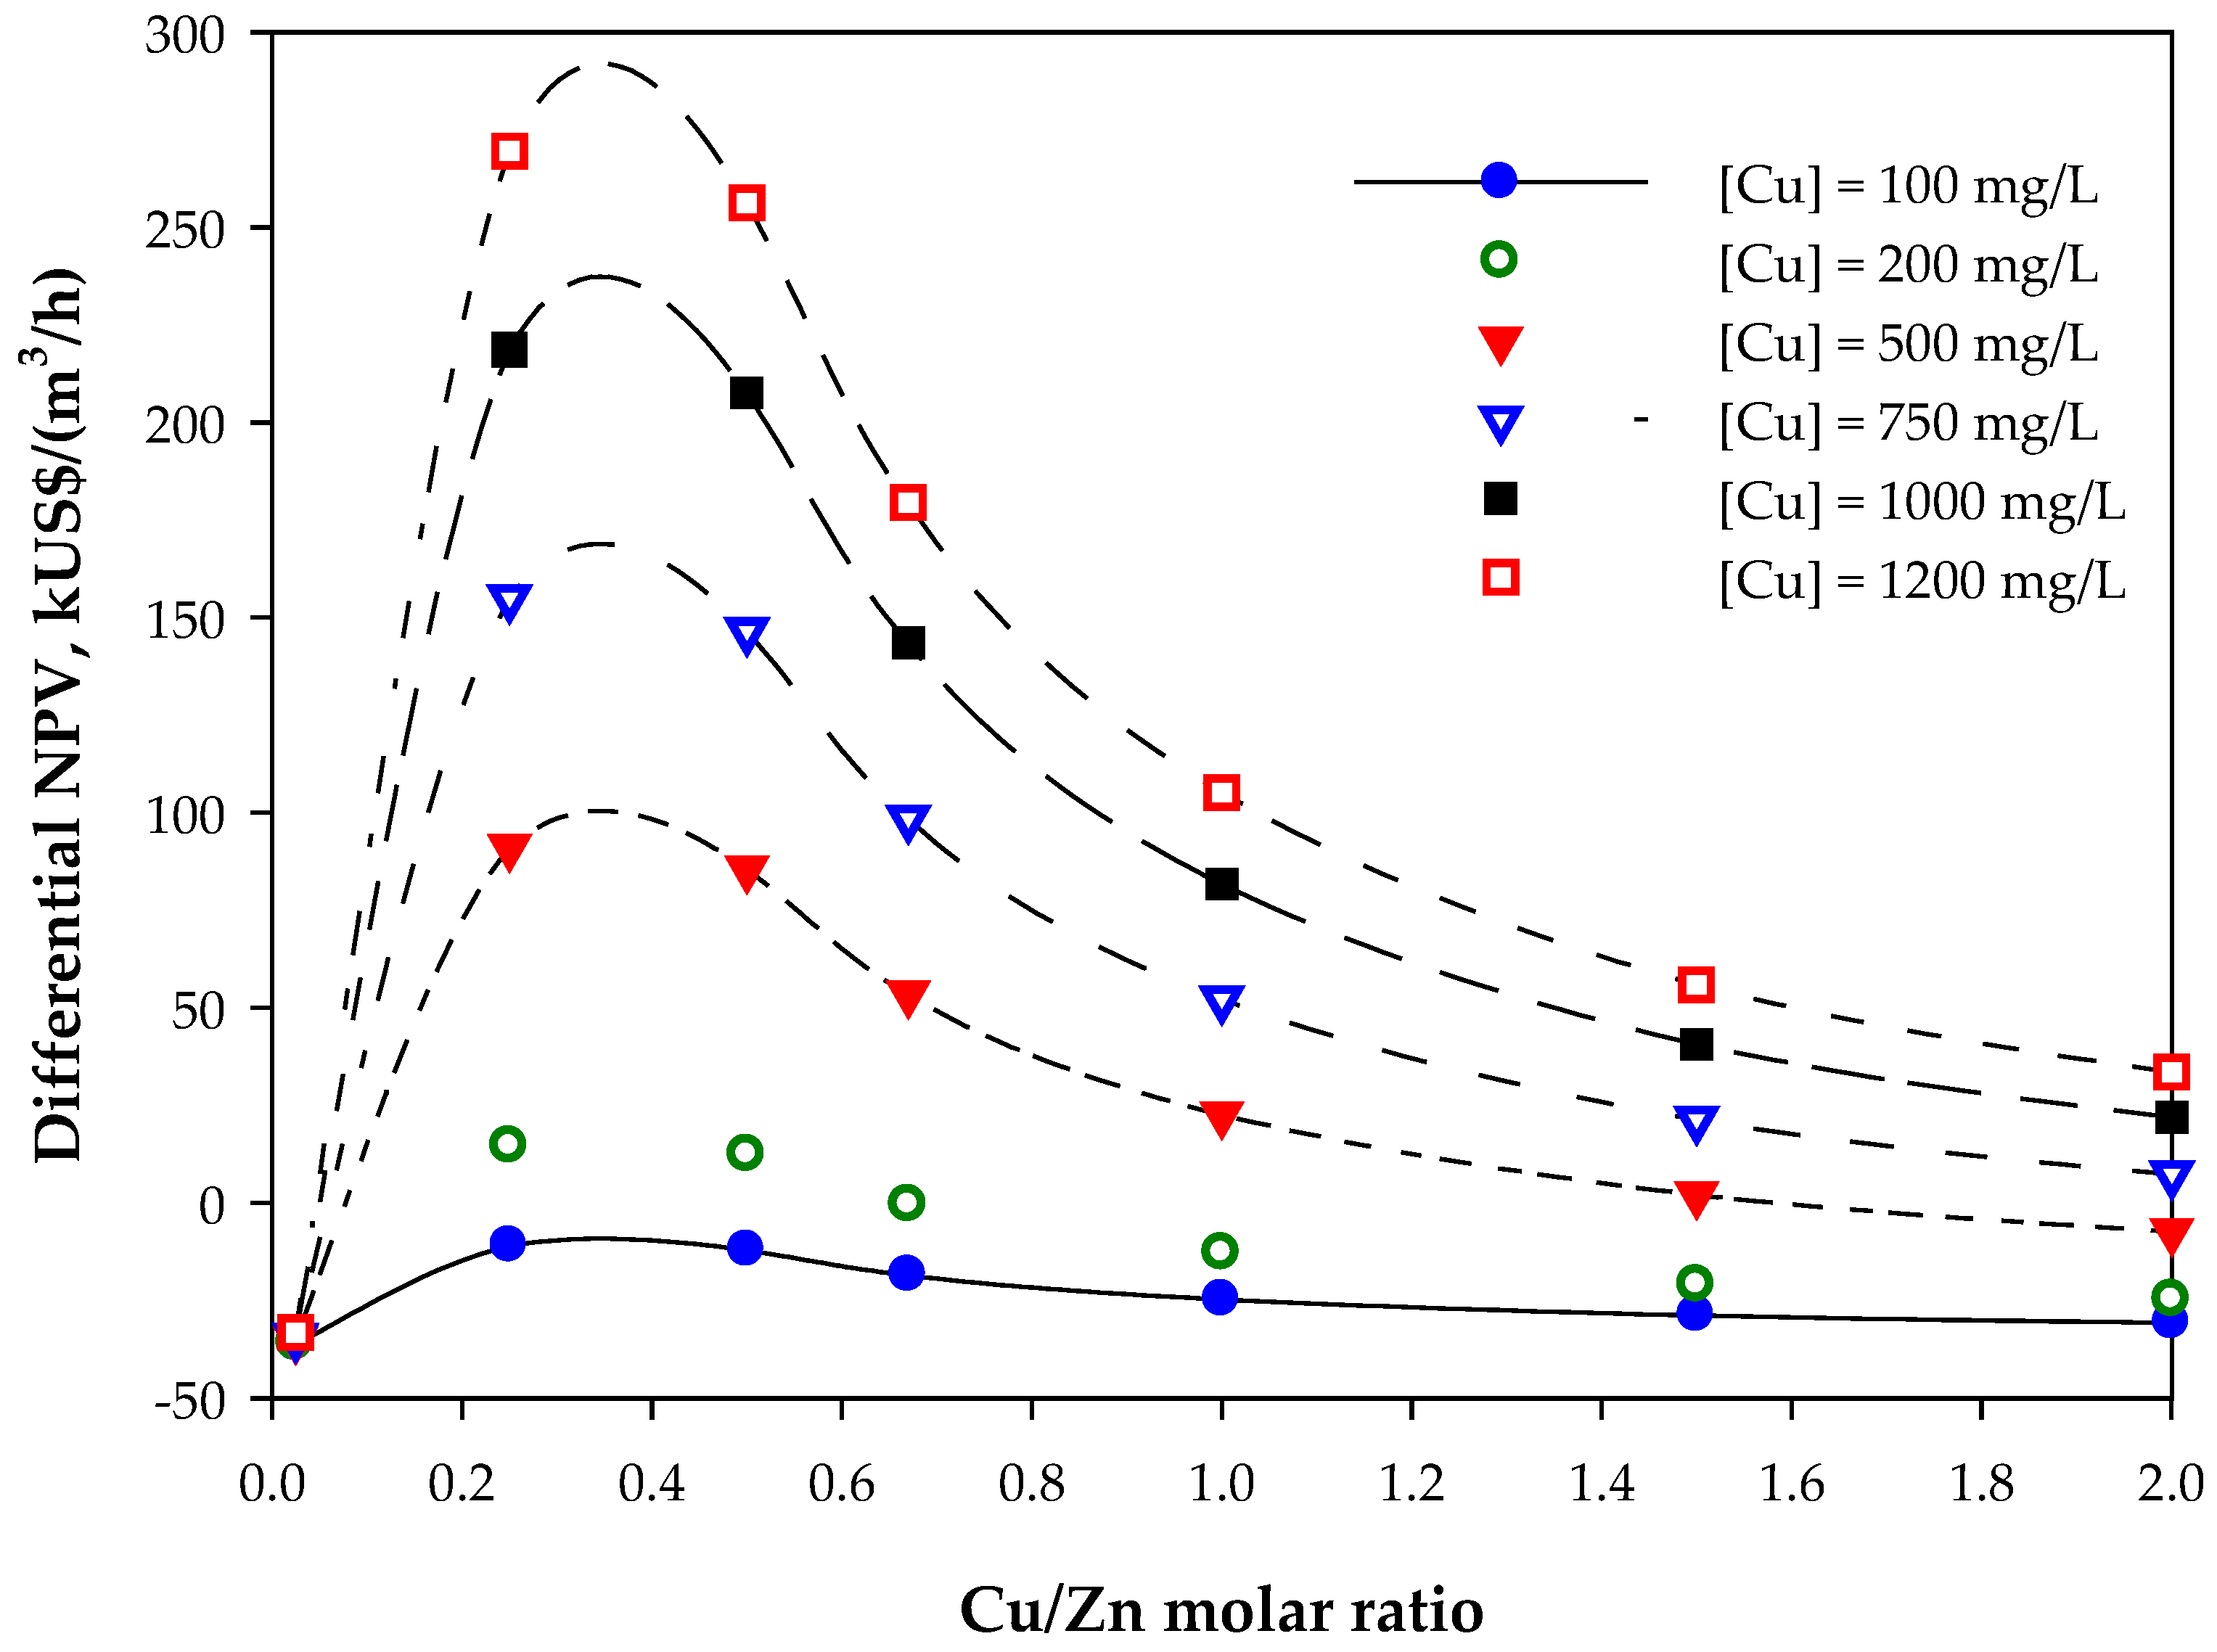
3.2. Economic Results

Economic assessment takes into account an estimation of incomes, operational, and capital costs. In the first place, the income estimation for the one-stage SART option includes a comparison between the precipitate value sold as copper or zinc precipitate. Thus, Figure 6 shows the income estimation developed for both SART options, considering the high value of the metal precipitate for the conventional SART process. In this context, when Cu/Zn molar ratio is less than 0.5, the precipitate income in one-stage SART process is maximized selling the precipitate as a zinc sulfide concentrate. These results are highly dependent on metal grades in the precipitate (Figure 5) and the metal prices. In this study, the ratio of copper/zinc prices is 2.4 (3.0/1.25), according to Table 2.
A differential NPV value is estimated taking into account the income obtained from Figure 6, and capital and operational costs based on parameters defined in Table 3. Nevertheless, the NPV value is expressed by cash flow per SART plant capacity (US$/(m3/h)). Therefore, the income expressed in terms of precipitate produced (US$/ton) must be transferred to US$/(m3/h) using metals concentration in the feed solution. Hence, typical copper and zinc concentrations in a cyanide solution have been defined. Figure 7 shows the differential NPV results of the two-stage SART process with respect to the conventional option. For each Cu/Zn molar ratio, copper concentration in the feed cyanide solution has varied between 100 and 1200 mg/L, except for Cu/Zn molar ratio value of 0.025. Here, instead of copper, zinc has been considered, in order to avoid a zinc concentration that distances from typical gold plant conditions (e.g., copper concentration of 1200 mg/L and Cu/Zn molar ratio of 0.025 determine a zinc concentration of approximately 50,000 mg/L).
Results in Figure 7 show the Cu/Zn molar ratio range where the two-stage SART process can be feasible to install. In this case, for copper concentration in the feed cyanide solutions over 200 mg/L, and Cu/Zn molar ratios ranging approximately between 0.1 and 1.5. When metal concentration is higher than 200 mg/L and Cu/Zn molar ratio is around 0.4, the differential NPV is optimum. This optimum differential NPV value will be modified according to metal prices, although the curve’s tendency will be similar. The optimum NPV value is reached when a factor defined as the optimal ratio (OR = copper price/zinc price × Cu/Zn molar ratio) is approximately 1.0.
A sensitivity analysis varying the price ratio (copper price/zinc price) has been developed to determine the optimum differential NPV value. In this way, Figure 8 shows a slope close to 1.0 where the price ratio is graphed against the Cu/Zn molar ratio inverse when the NPV value is optimum. This slope represents the OR parameter. Therefore, a rapid estimation of the feasible range to apply the two-stage SART process is estimating the OR value. However, when OR value is far from 1.0, the methodology presented here—based on a thermodynamic and economic estimation—is an excellent alternative to evaluate if the two-stage SART process could be a good option in a gold plant with high copper and zinc content in its cyanide solutions. The methodology presented here allows to define the type of SART process that will be include in a cyanidation plant in an early stage of a project. A final economic evaluation of the SART plant must be performed, using the economic criteria of each mining company, in order to establish the economic feasibility to install it.

4. Conclusions

This study has developed a methodology to estimate the feasible conditions to install a two-stage SART process in cyanidation plants having high copper and zinc contents in their solutions. This methodology is based on a theoretical and economic estimation using a modified Hydra/Medusa software. Results suggest operational pH conditions of 7.5 and 4.0 for the first and second stage of the two-stage SART process, respectively. These results are similar to previous experimental studies, validating this theoretical methodology, and thereby contributing to explaining the behavior of speciation in a cyanide solution in presence of sulfide. Furthermore, the economic results show the feasible range of application of the two-stage SART process for high zinc and copper concentration, being more than 200 mg/L for both metals. Indeed, the two-stage SART plant reaches its optimum condition when the OR parameter defined in this study is close to 1.0. Summarizing, this SART option could be an excellent solution for gold cyanidation plants with Merrill–Crowe process installed in their flow-sheets which additionally contains high cyanide-soluble copper ores.

Author Contributions

H.E., M.G.-K. and M.Q. conceived and designed the experiments; M.G.-K. and M.Q. performed the experiments; H.E. analyzed the data and wrote the paper.

Funding

This research was funded by the National Commission for Scientific and Technological Research (CONICYT, Chile) for financial support through Project Fund no. FB0809 PIA CONICYT and the FONDEF/IDeA Program, FONDEF/CONICYT grant number 2017+ID17I10021.

Acknowledgments

The authors appreciate the revision and support of Mike M. Botz, his comments have improved this study. Also, the authors thank the National Commission for Scientific and Technological Research (CONICYT, Chile) for financial support through Project Fund no. FB0809 PIA CONICYT and the FONDEF/IDeA Program, FONDEF/CONICYT 2017+ID17I10021.

Conflicts of Interest

The authors declare no conflict of interest. The funders had no role in the design of the study; in the collection, analyses, or interpretation of data; in the writing of the manuscript, and in the decision to publish the results.

References

  1. Estay, H. Designing the SART process—A review. Hydrometallurgy 2018, 176, 147–165. [Google Scholar] [CrossRef]
  2. MacPhail, P.K.; Fleming, C.A.; Sarbutt, K. Cyanide Recovery by the SART Process for the Lobo-Marte Project, Chile. In Proceedings of the Randol Gold and Silver Forum ‘98, Denver, CO, USA, 26–29 April 1998. [Google Scholar]
  3. Barter, J.; Lane, G.; Mitchell, D.; Kelson, R.; Dunne, R.; Trang, C.; Dreisinger, D. Cyanide management by SART. In Cyanide: Social, Industrial and Economic Aspects; Young, C.A., Twidwell, L.G., Anderson, C.G., Eds.; TMS (The Minerals, Metals & Materials Society): Pittsburgh, PA, USA, 2001; pp. 549–562. [Google Scholar]
  4. Simons, A.; Breuer, P. The impact of residence time on copper recovery in Telfer Gold Mine’s cyanide recycling process. In Proceedings of the World Gold 2013, Brisbane, Australasian Institute of Mining and Metallurgy, Melbourne, QLD, Australia, 26–29 September 2013; pp. 189–196. [Google Scholar]
  5. Lawrence, R.; Lopez, O. Improving the economics of gold–copper ore projects using SART technology. In Proceedings of the World Gold 2011, CIMM, Calgary, AB, Canada, 2–5 October 2011. [Google Scholar]
  6. Vargas, L.; Guzman, G.; Roux, E.; Sevilla, L. Yanacocha Gold Mill and SART/AVR process 2013–2017. In Proceedings of the 1st Arcadis Gold Work, Santiago, Chile, 20 March 2013. [Google Scholar]
  7. Hedjazi, F.; Monhemius, A.J. Copper–gold ore processing with ion exchange and SART technology. Miner. Eng. 2014, 64, 120–125. [Google Scholar] [CrossRef]
  8. Kratochvil, D.; Chan, N.; Hall, A. Integrating SART into metallurgical flowsheets for cyanide recovery. In Proceedings of the ALTA 2013 Gold Conference, Perth, Australia, 25 May–1 June 2013. [Google Scholar]
  9. Ford, K.; Fleming, C.; Henderson, R. Application of the SART process to heap leaching of gold–copper ores at Maricunga, Chile. In Proceedings of the 40th Annual Meeting of the Canadian Mineral Processors, Ottawa, ON, Canada, 23–24 January 2008. [Google Scholar]
  10. Botz, M.; Kaczmarek, A.; Orser, S. Managing copper in leach solution at the copler gold mine: Laboratory testing and process design. Miner. Met. Process. 2011, 28, 133–138. [Google Scholar]
  11. Simons, A. A Fundamental Study of Copper and Cyanide Recovery from Gold Tailing by Sulfidisation. Ph.D. Thesis, Curtin University, Perth, WA, Australia, 2015. [Google Scholar]
  12. Walton, R. Zinc cementation. In Gold Ore Process, 2nd ed.; Adams, M.D., Ed.; Elsevier: Amsterdam, The Netherlands, 2016; pp. 553–560. [Google Scholar]
  13. Botz, M.M.; Scola, J.C.; Fueyo, R.; de Moura, W. Cyanide recovery practice at cerro vanguardia. In Proceedings of the SME Annual Meeting, Denver, CO, USA, 26–28 February 2004. [Google Scholar]
  14. Ford, K.J.; Peacey, J.G.; Sevilla, L.; Villalobos, E. Processing of refractory sulphides at mantos de Oro, Chile. In Proceedings of the 41st Annual Meeting of the Canadian Mineral Processors, Ottawa, ON, Canada, 20–22 February 2009. [Google Scholar]
  15. Marsden, J.O.; House, C.I. The Chemistry of Gold Extraction, 2nd ed.; Society for Mining, Metallurgy, and Exploration, Inc. (SME): Littleton, CO, USA, 2006. [Google Scholar]
  16. Littlejohn, P.; Kratochvil, D.; Hall, A. Sulfidisation-acidification-recycling-thickening (SART) for complex gold ores. In Proceedings of the World Gold 2013, Brisbane, Australasian Institute of Mining and Metallurgy, Melbourne, QLD, Australia, 26–29 September 2013; pp. 149–155. [Google Scholar]
  17. Lopez, O.; Petrovic, N.; Krashenina, S. Copper and cyanide recovery from barren leach solution at the gold processing plant. In Proceedings of the XXVII International Mineral Processing Congress. (IMPC 2014), Santiago, Chile, 20–24 October 2014. [Google Scholar]
  18. Baker, B.; Rodriguez, F.; Littlejohn, P. SART implementation at gold mines in Latin America. In Proceedings of the World Gold 2017, Vancouver, BC, Canada, 27–30 August 2017. [Google Scholar]
  19. Fleming, C.A.; Trang, C.V. Review of options for cyanide recovery at gold and silver mines. In Proceedings of the Randol Gold and Silver Forum ‘98, Denver, CO, USA, 26–29 April 1998; pp. 313–318. [Google Scholar]
  20. Estay, H. Estimating the hydrogen cyanide generation: Thermodynamics and mass transfer. In Cyanide: Occurrence, Characteristics and Applications, 1st ed.; Soto-Blanco, B., Ed.; Nova Publishers: New York, NY, USA, 2013; pp. 47–86. [Google Scholar]
  21. Lu, J.; Dreisinger, D.; Cooper, W. Thermodynamics of the aqueous copper-cyanide system. Hydrometallurgy 2002, 66, 23–36. [Google Scholar] [CrossRef]
  22. Izzat, R.; Dee Johnston, H.; Watt, G.; Christensen, J. Thermodynamics of metalcyanide coordination. VI. Copper(I)-and silver(I)-cyanide systems. Inorg. Chem. 1967, 6, 132–135. [Google Scholar] [CrossRef]
  23. Izzatt, R.M.; Christensen, J.; Hansen, J.; Watt, G. Thermodynamics of metal cyanide coordination. IV. Values for ths Zinc(II)-Cyanide System at 25°. Inorg. Chem. 1965, 2, 718–721. [Google Scholar] [CrossRef]
  24. Izzatt, R.M.; Christensen, J.; Pack, R.; Bench, R. Thermodynamics of metal-cyanide coordination. I. Values as a funtion of temperature for hydrocyanic acid dissociation in aqueous solution. Inorg. Chem. 1961, 1, 828–831. [Google Scholar] [CrossRef]
  25. Banfalvi, G. Removal of insoluble heavy metal sulfides from water. Chemosphere 2006, 63, 1231–1234. [Google Scholar] [CrossRef] [PubMed]
  26. Zhang, Y.; Fang, Z.; Muhammed, M. On the solution chemistry of cyanidation of gold and silver bearing sulphide ores. A critical evaluation of thermodynamic calculations. Hydrometallurgy 1997, 46, 251–269. [Google Scholar] [CrossRef]
  27. Puigdomenech, I. Hydra-Medusa Software (Hydrochemical Equilibrium Constant, Database and Make Equilibrium Diagrams Using Sophisticated Algorithms), version 1; Inorganic Chemistry, Royal Institute of Technology: Stockholm, Sweden, 2004. [Google Scholar]
  28. Botz, M.; Guzman, G.; Sevilla, L. Campaign testing the yanacocha sart plant with high-copper feed solution. In Proceedings of the Society for Mining, Metallurgy, and Exploration, Inc. (SME), Denver, CO, USA, 15–18 February 2015. [Google Scholar]
Figure 1. Schematic flow-diagram of the SART process.
Minerals 08 00392 g001
Figure 2. Schematic flow-diagram of the two-stage SART process.
Minerals 08 00392 g002
Figure 3. Speciation curves obtained from Hydra/Medusa software for a cyanide solution containing a Cu/Zn molar ratio of 2.0. (a) cyanide solution fed into the SART process; (b) treated solution by one-stage SART process using 120% stoichiometric NaHS addition; (c) copper species distribution for the treated cyanide solution in the SART process; (d) zinc species distribution for the treated cyanide solution in the SART process.
Minerals 08 00392 g003
Figure 4. Metals recovery values in the one-stage SART process for different Cu/Zn molar ratio (R0.025–R40, where R is Cu/Zn molar ratio). (a) Copper recovery; (b) zinc recovery.
Minerals 08 00392 g004
Figure 5. Results of copper and zinc recoveries and grades in the precipitate for different Cu/Zn molar ratios. (a) One-stage SART process; (b) two-stage SART process.
Minerals 08 00392 g005
Figure 6. SART precipitate income (Pp: precipitate ) for different Cu/Zn molar ratios. (a) One-stage SART process; (b) two-stage SART process.
Minerals 08 00392 g006
Figure 7. Differential NPV results for two-stage SART process, varying Cu/Zn molar ratio and metals concentration in a feed cyanide solution.
Minerals 08 00392 g007
Figure 8. Price ratio (Cu price/Zn price) vs. 1/(Cu/Zn molar ratio) at optimum NPV value.
Minerals 08 00392 g008
Table 1. Values of equilibrium constants for cyanide and sulfide species involved in the SART process at 25 °C.
ReactionlogKiReference
Cu + + CN CuCN 20[21]
CuCN + CN Cu ( CN ) 2 3.94[22]
Cu ( CN ) 2 + CN Cu ( CN ) 3 2 5.3[22]
Cu ( CN ) 3 2 + CN Cu ( CN ) 4 3 1.5[22]
Zn 2 + + 2 CN Zn ( CN ) 2 0 11.07[23]
Zn ( CN ) 2 0 + CN Zn ( CN ) 3 4.98[23]
Zn ( CN ) 3 + CN Zn ( CN ) 4 2 3.57[23]
H + +   CN HCN 9.21[24]
2 Cu + + S 2 Cu 2 S 47.3[25]
Zn 2 + + S 2 ZnS 23.08[25]
H + + S 2 HS 13.9[26]
H + + HS H 2 S 7.02[26]
Table 2. Economic parameters values to estimate precipitate sales value.
ParameterValueUnit
Copper price3.0US$/lb
Zinc price1.25US$/lb
Precipitate discount rate25%
Transport cost30US$/dry ton
Table 3. Parameter values of additional equipment or supplies in the two-stage SART process, used for the economic evaluation.
ParameterValueUnit
Capital cost of additional equipment36.0kUS$/(m3/h)
Additional energy consumption0.047kWh/m3
Energy price150US$/MWh
Additional flocculant consumption2.0g/m3
Flocculant price3000US$/ton

