Carbonaceous Materials in the Fault Zone of the Longmenshan Fault Belt: 2. Characterization of Fault Gouge from Deep Drilling and Implications for Fault Maturity

 , ,
, ,
Abstract
1. Introduction
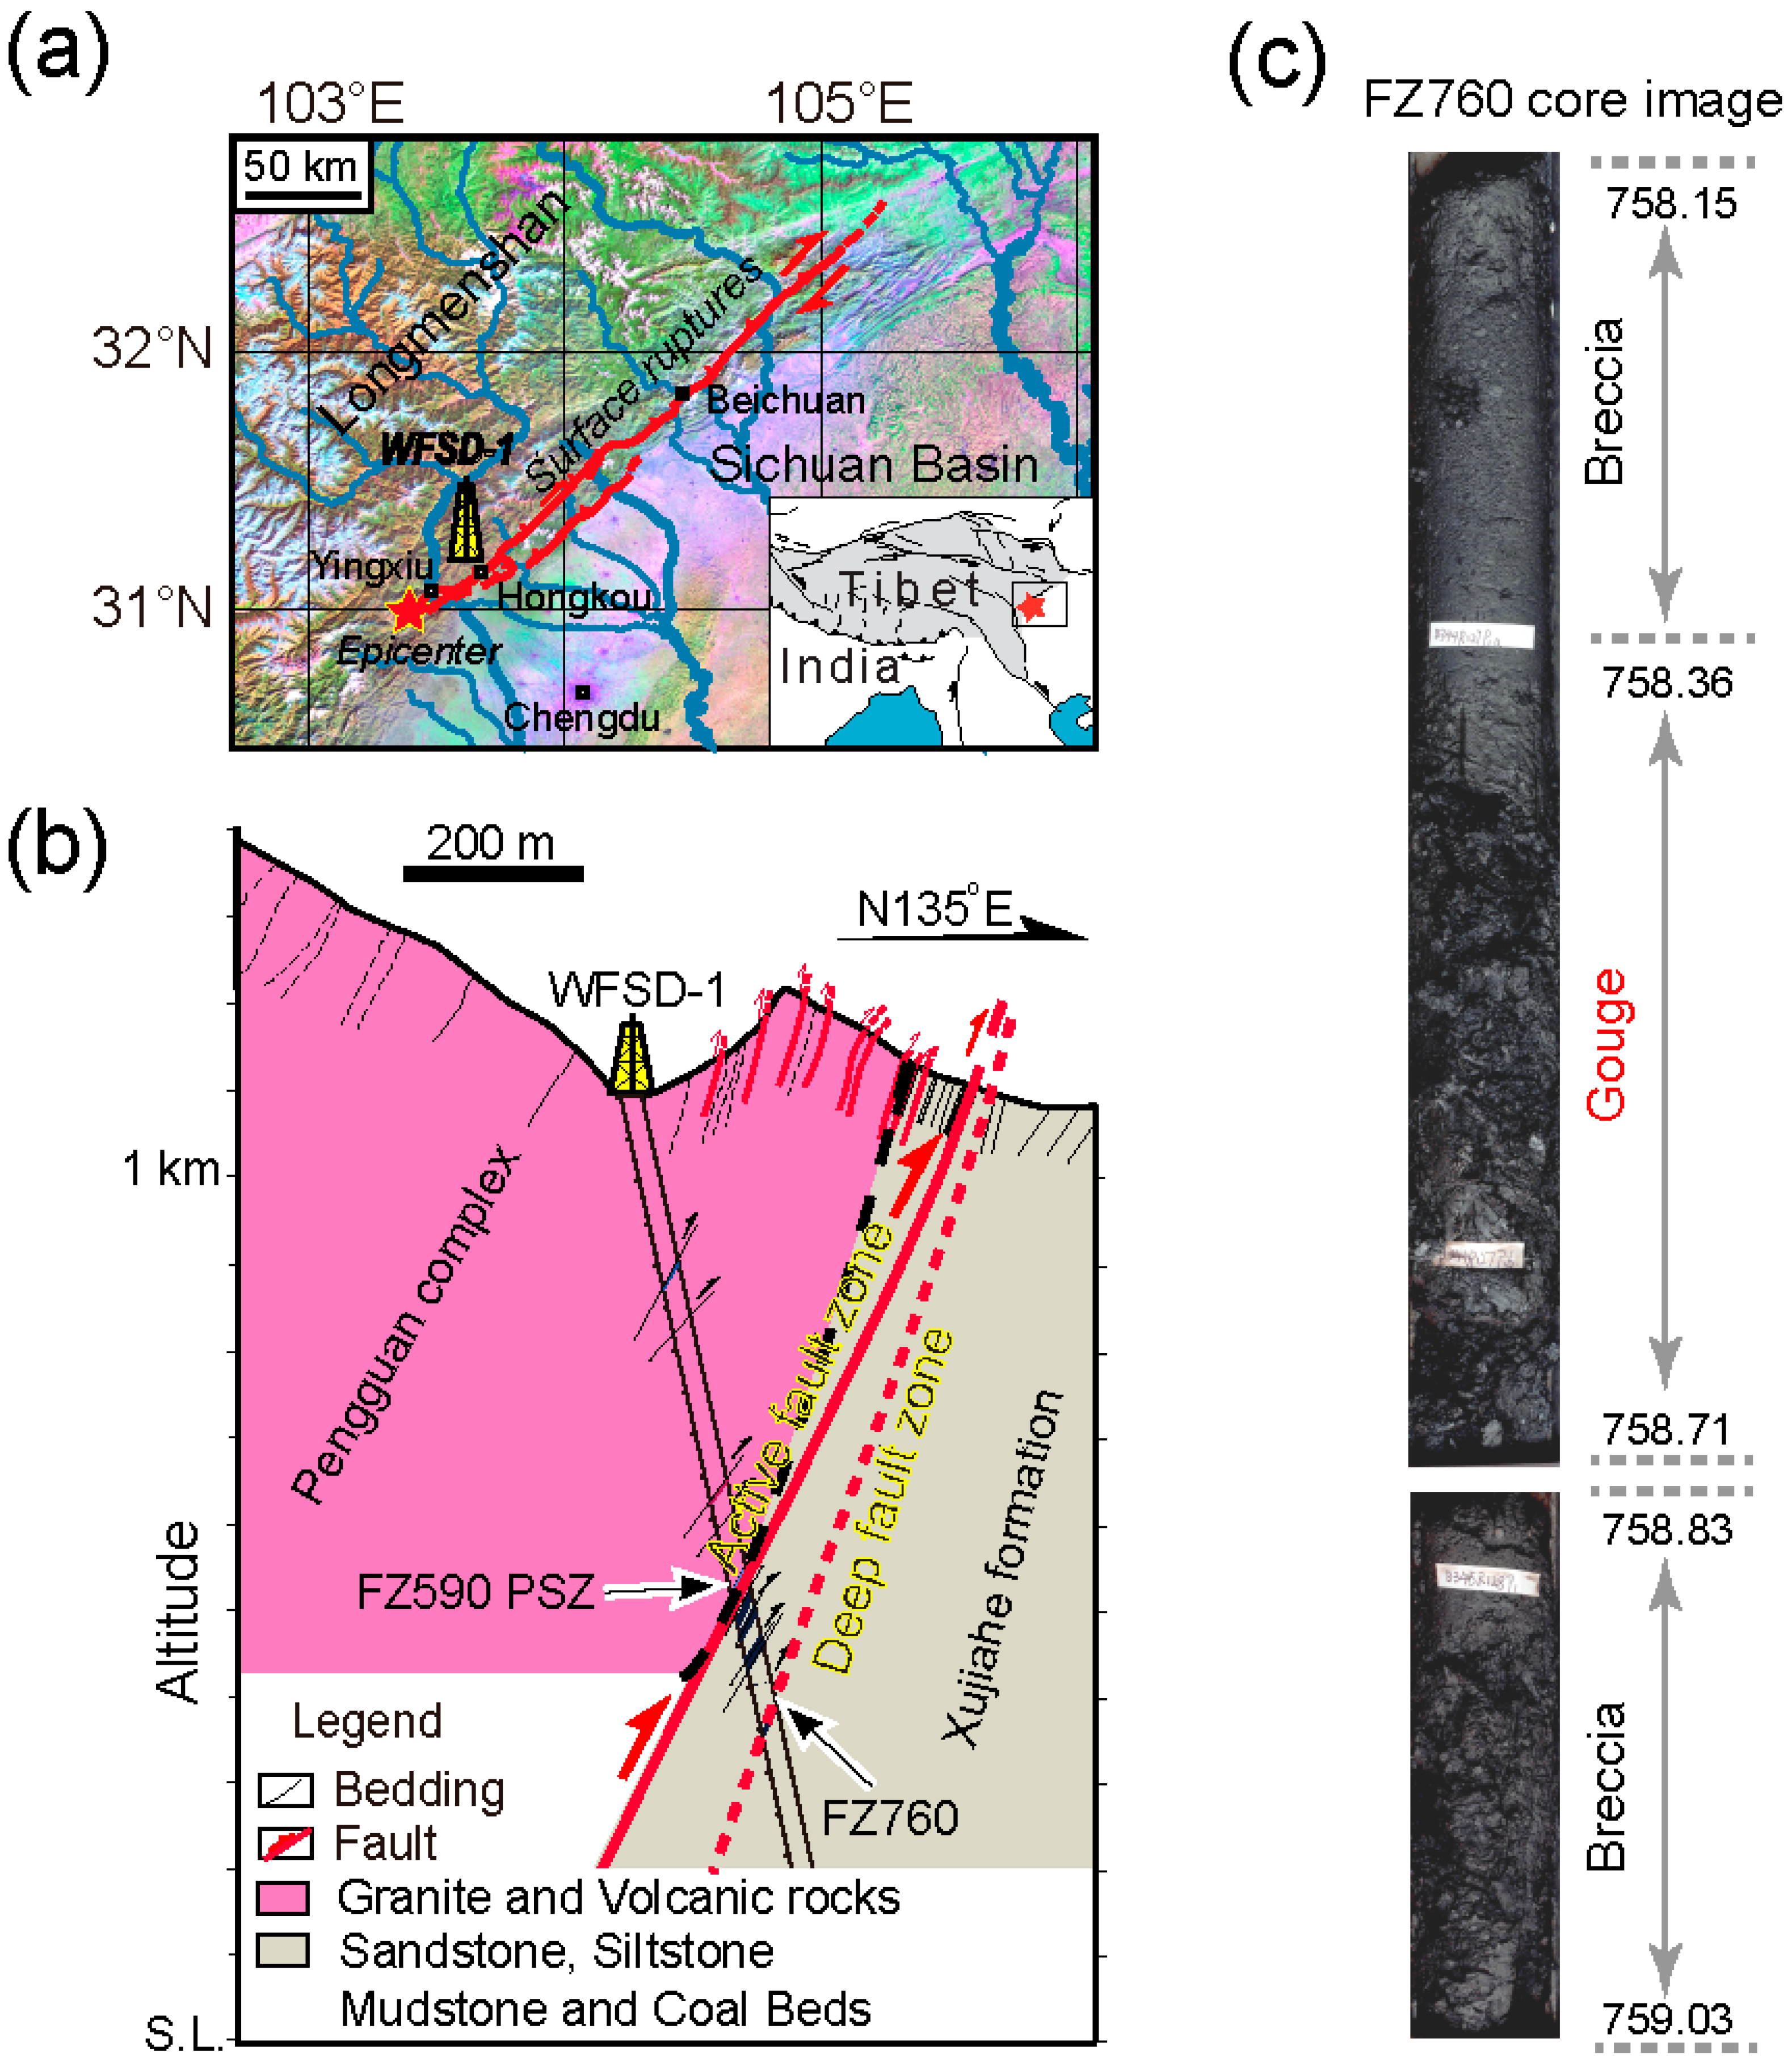
2. Materials and Methods
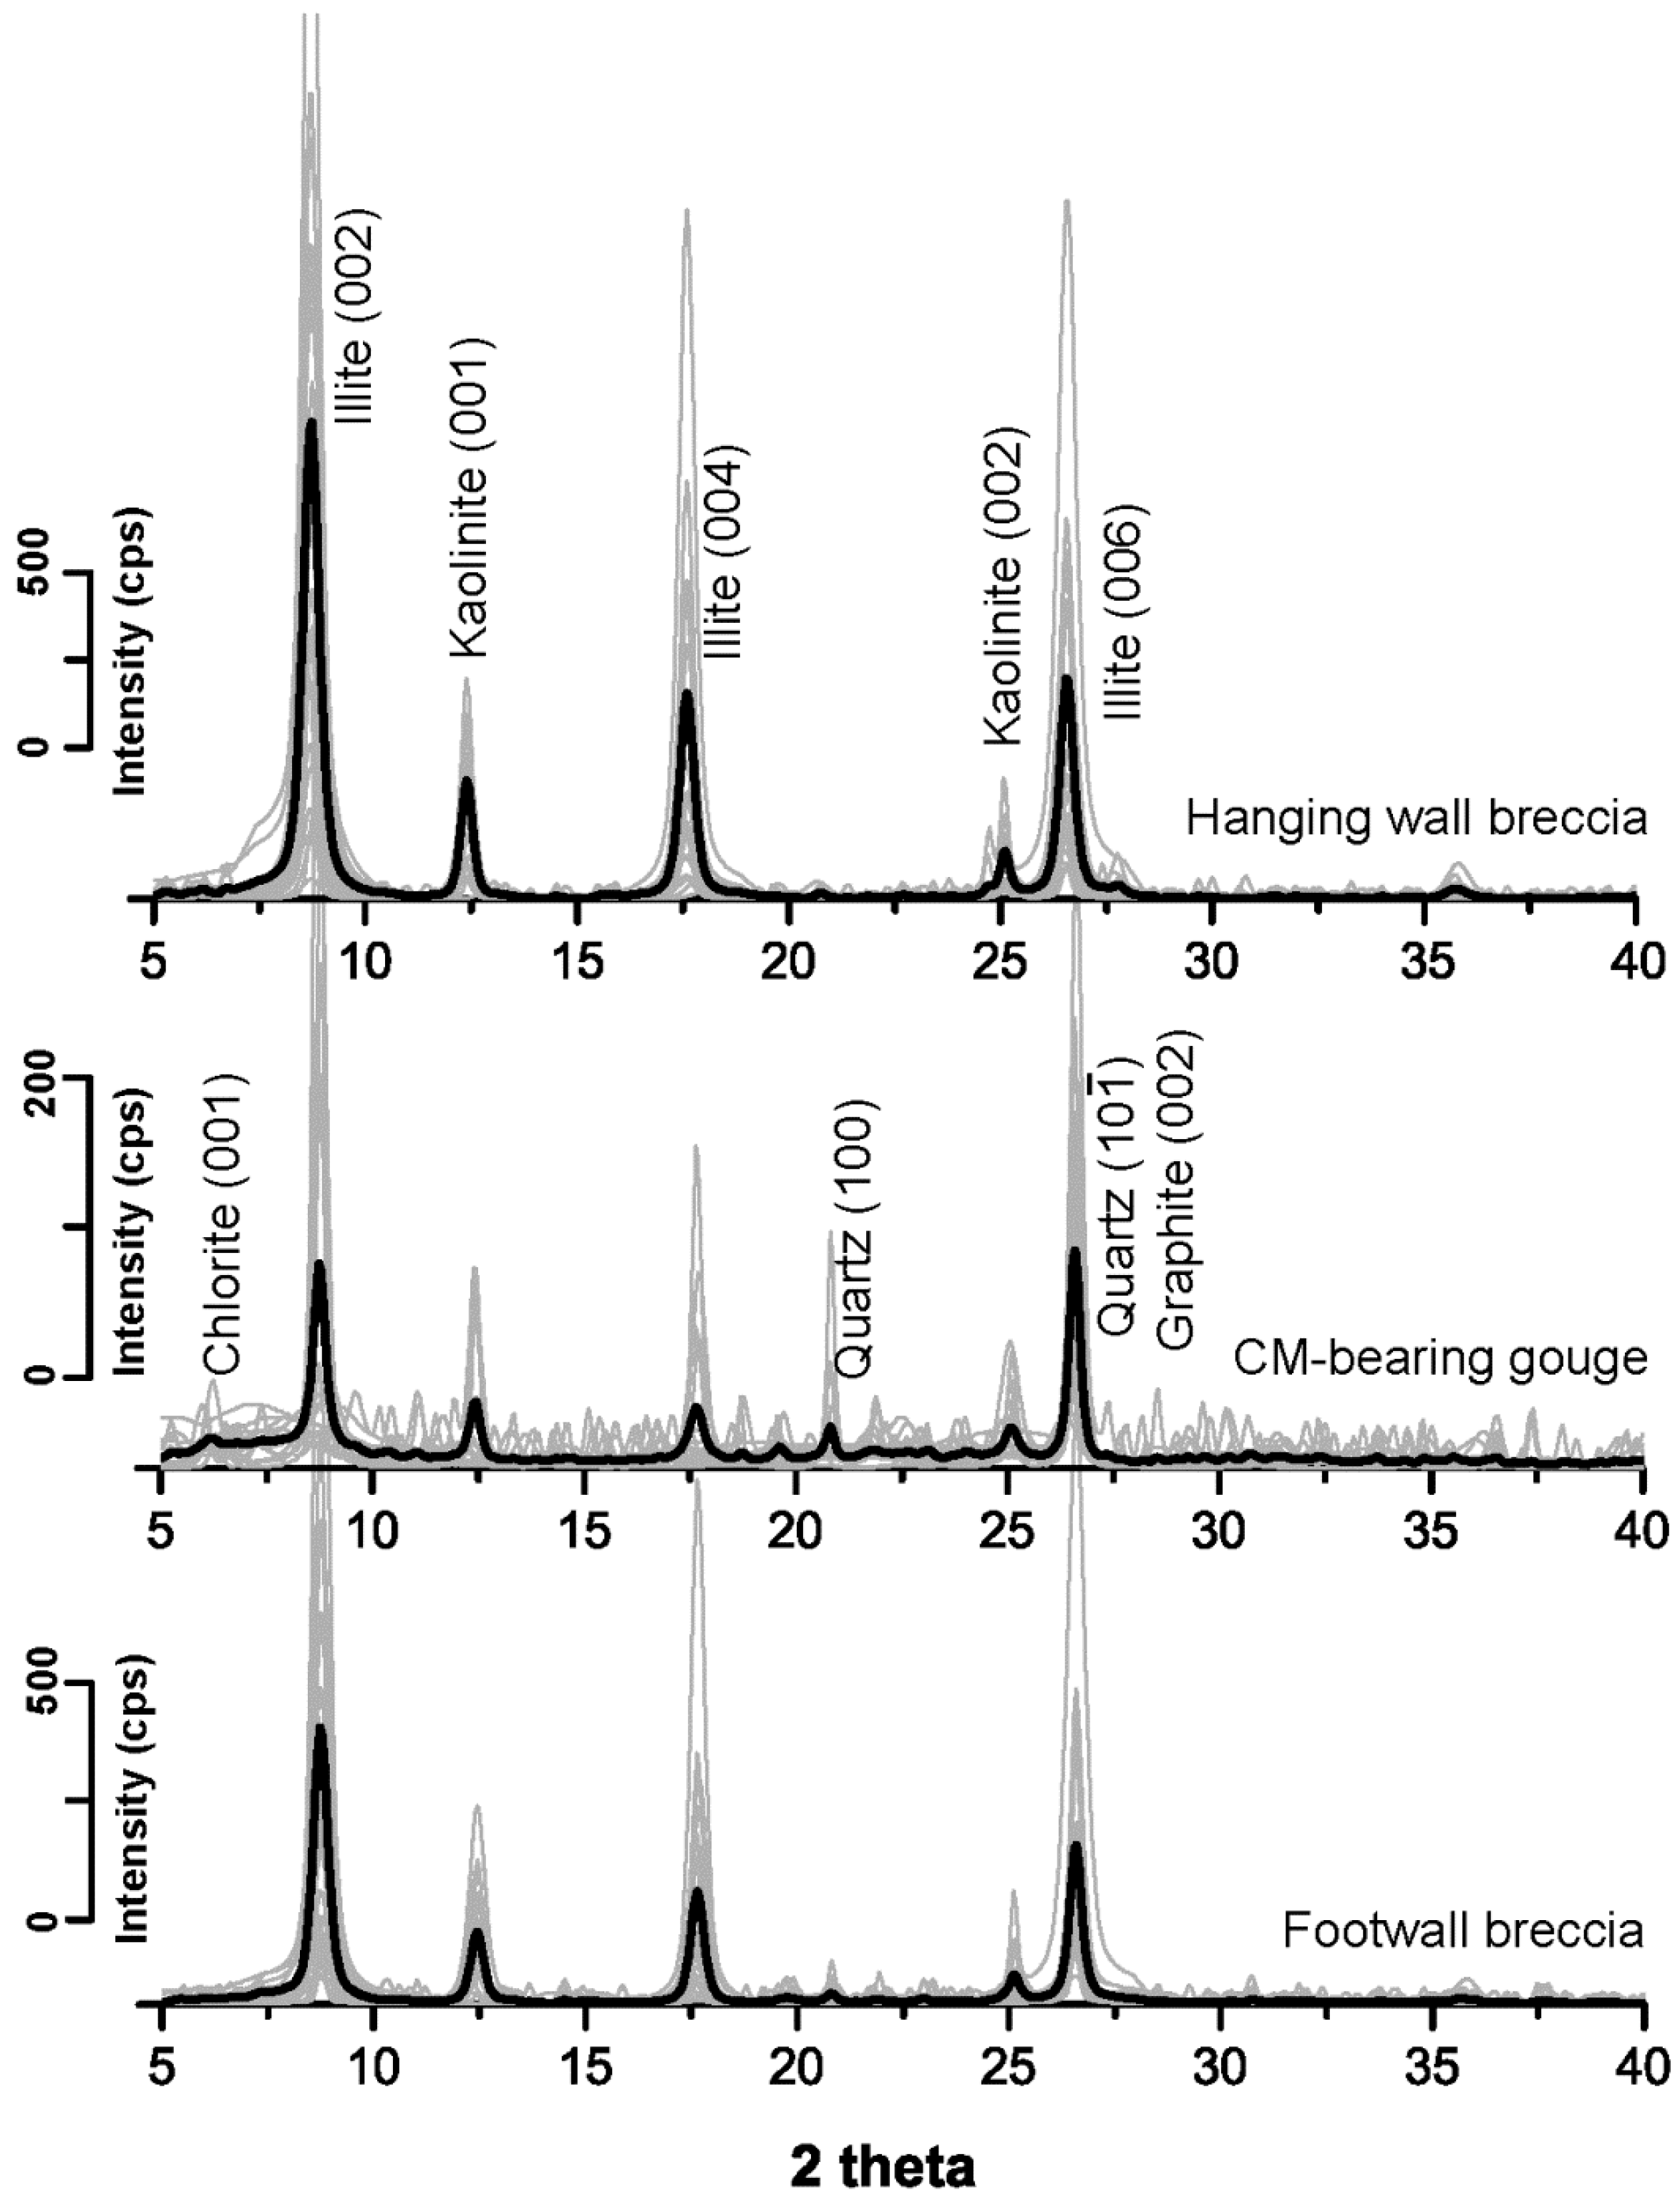
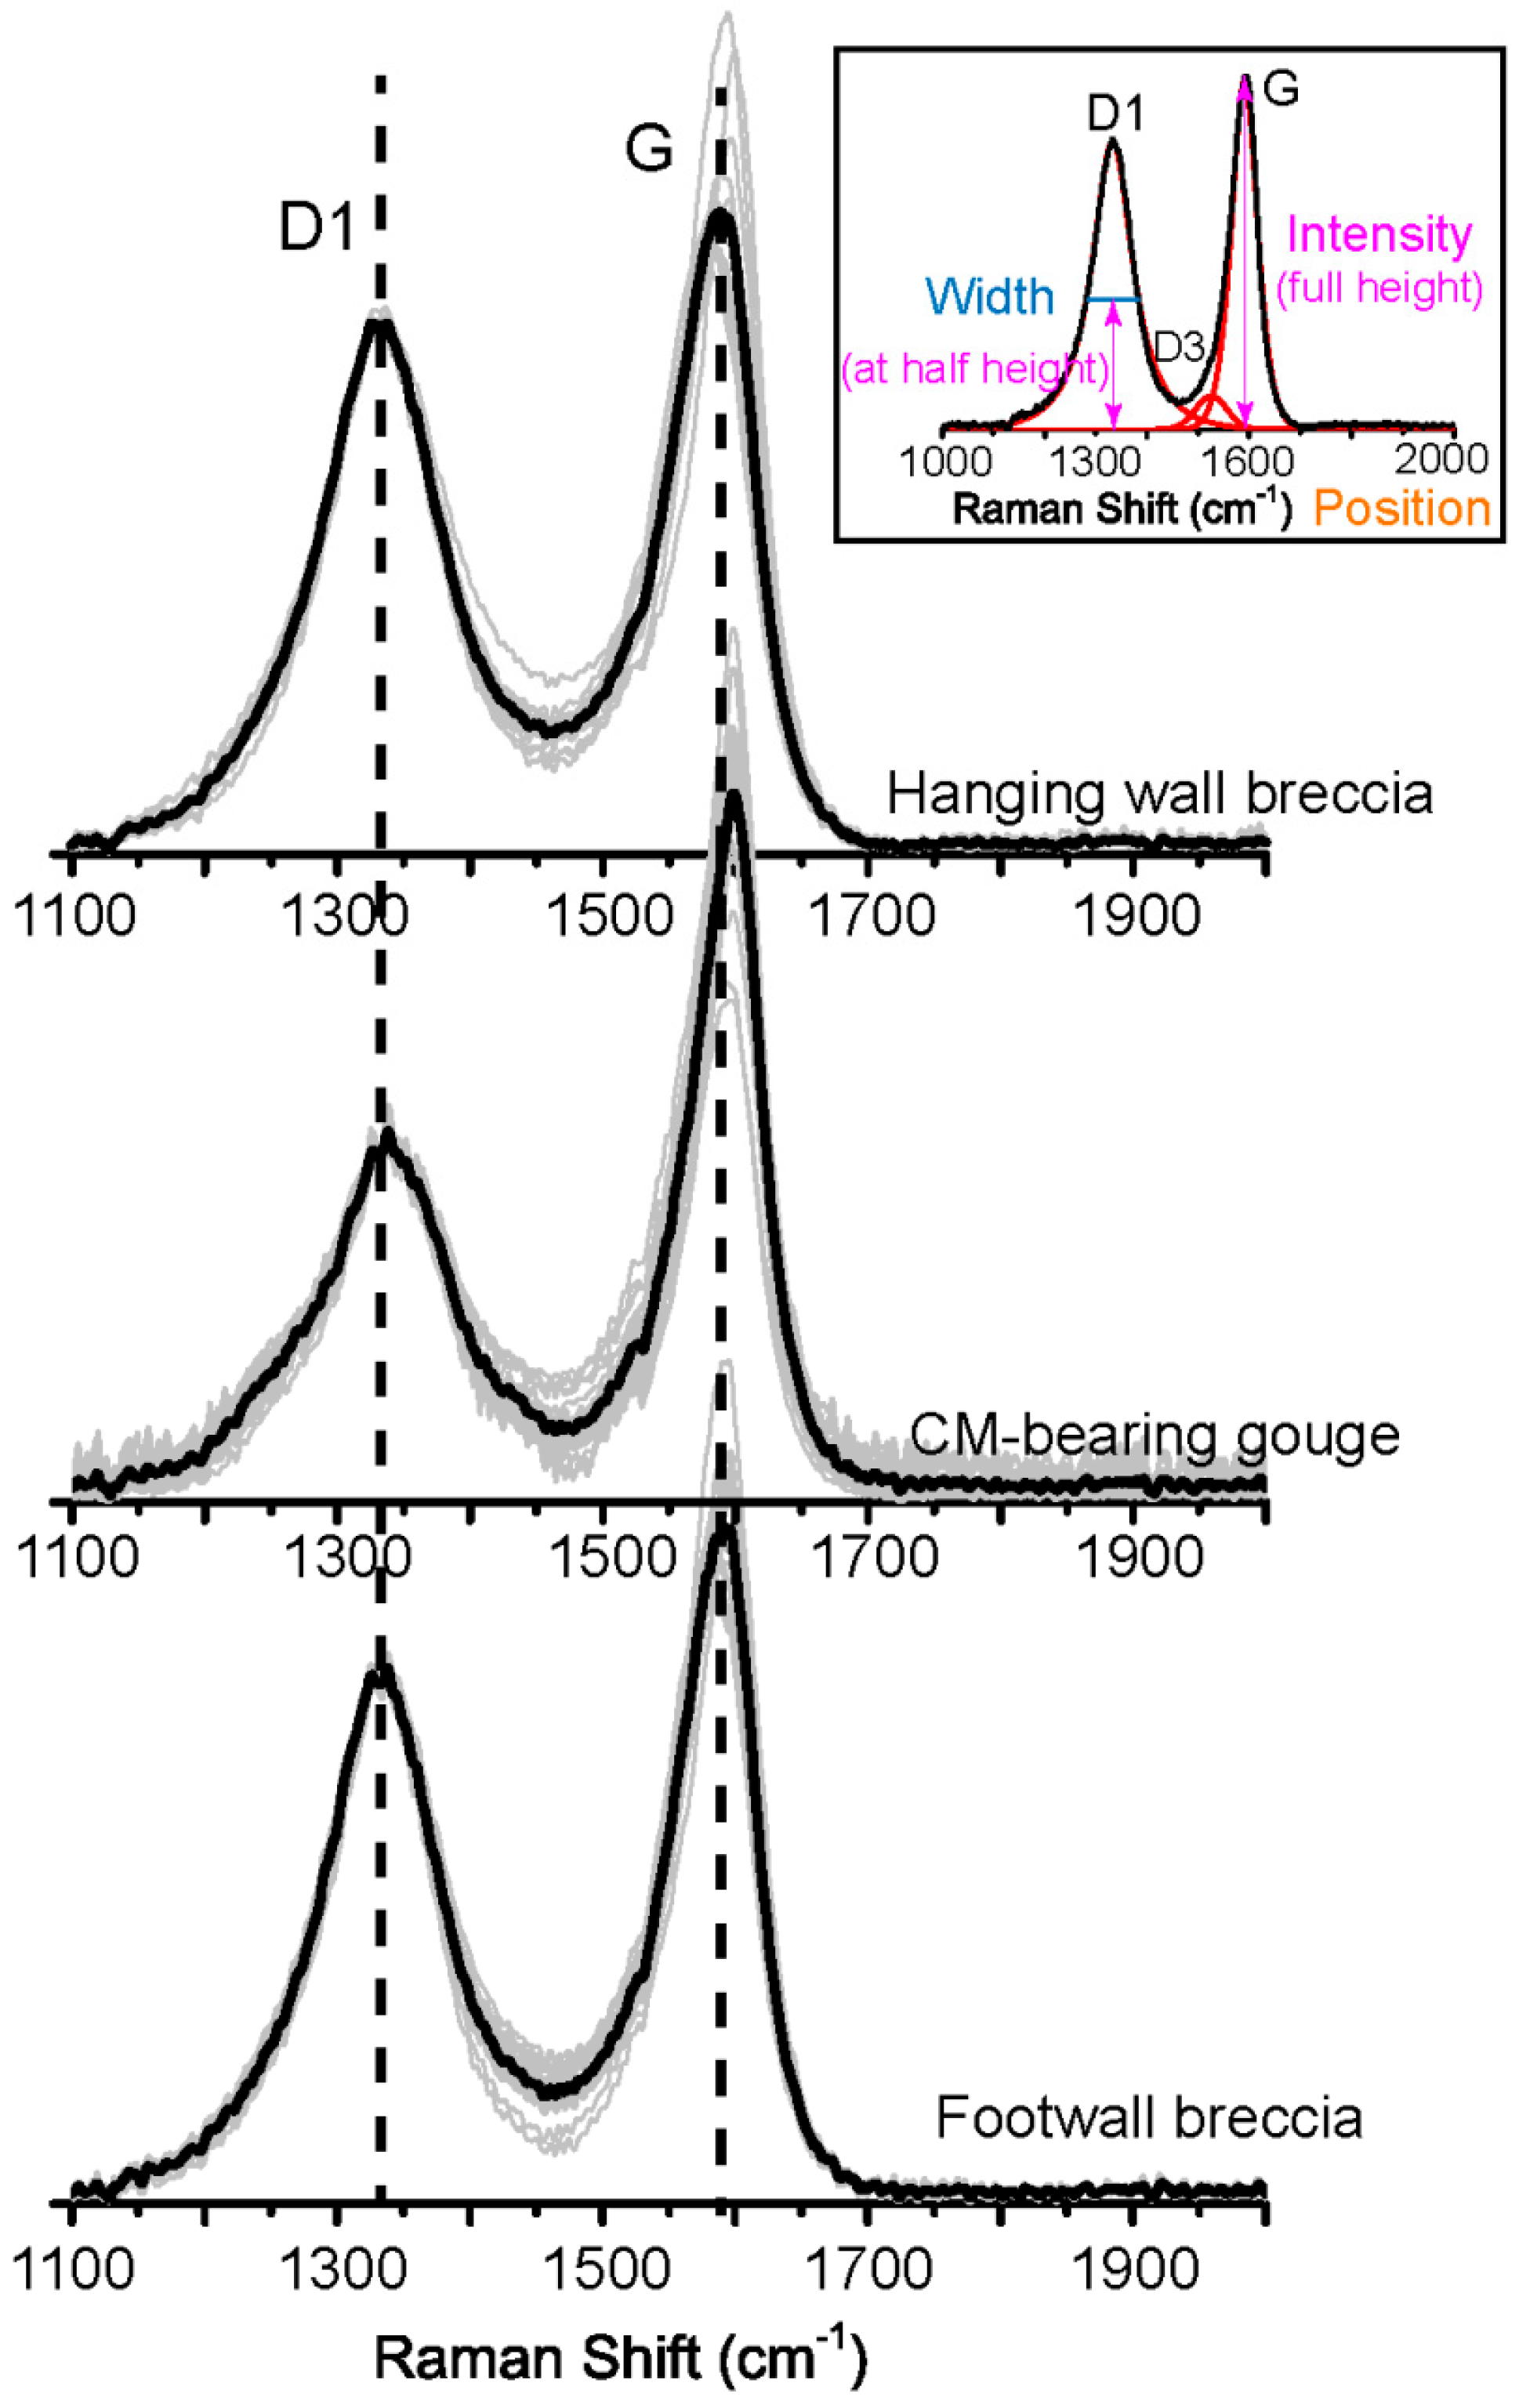
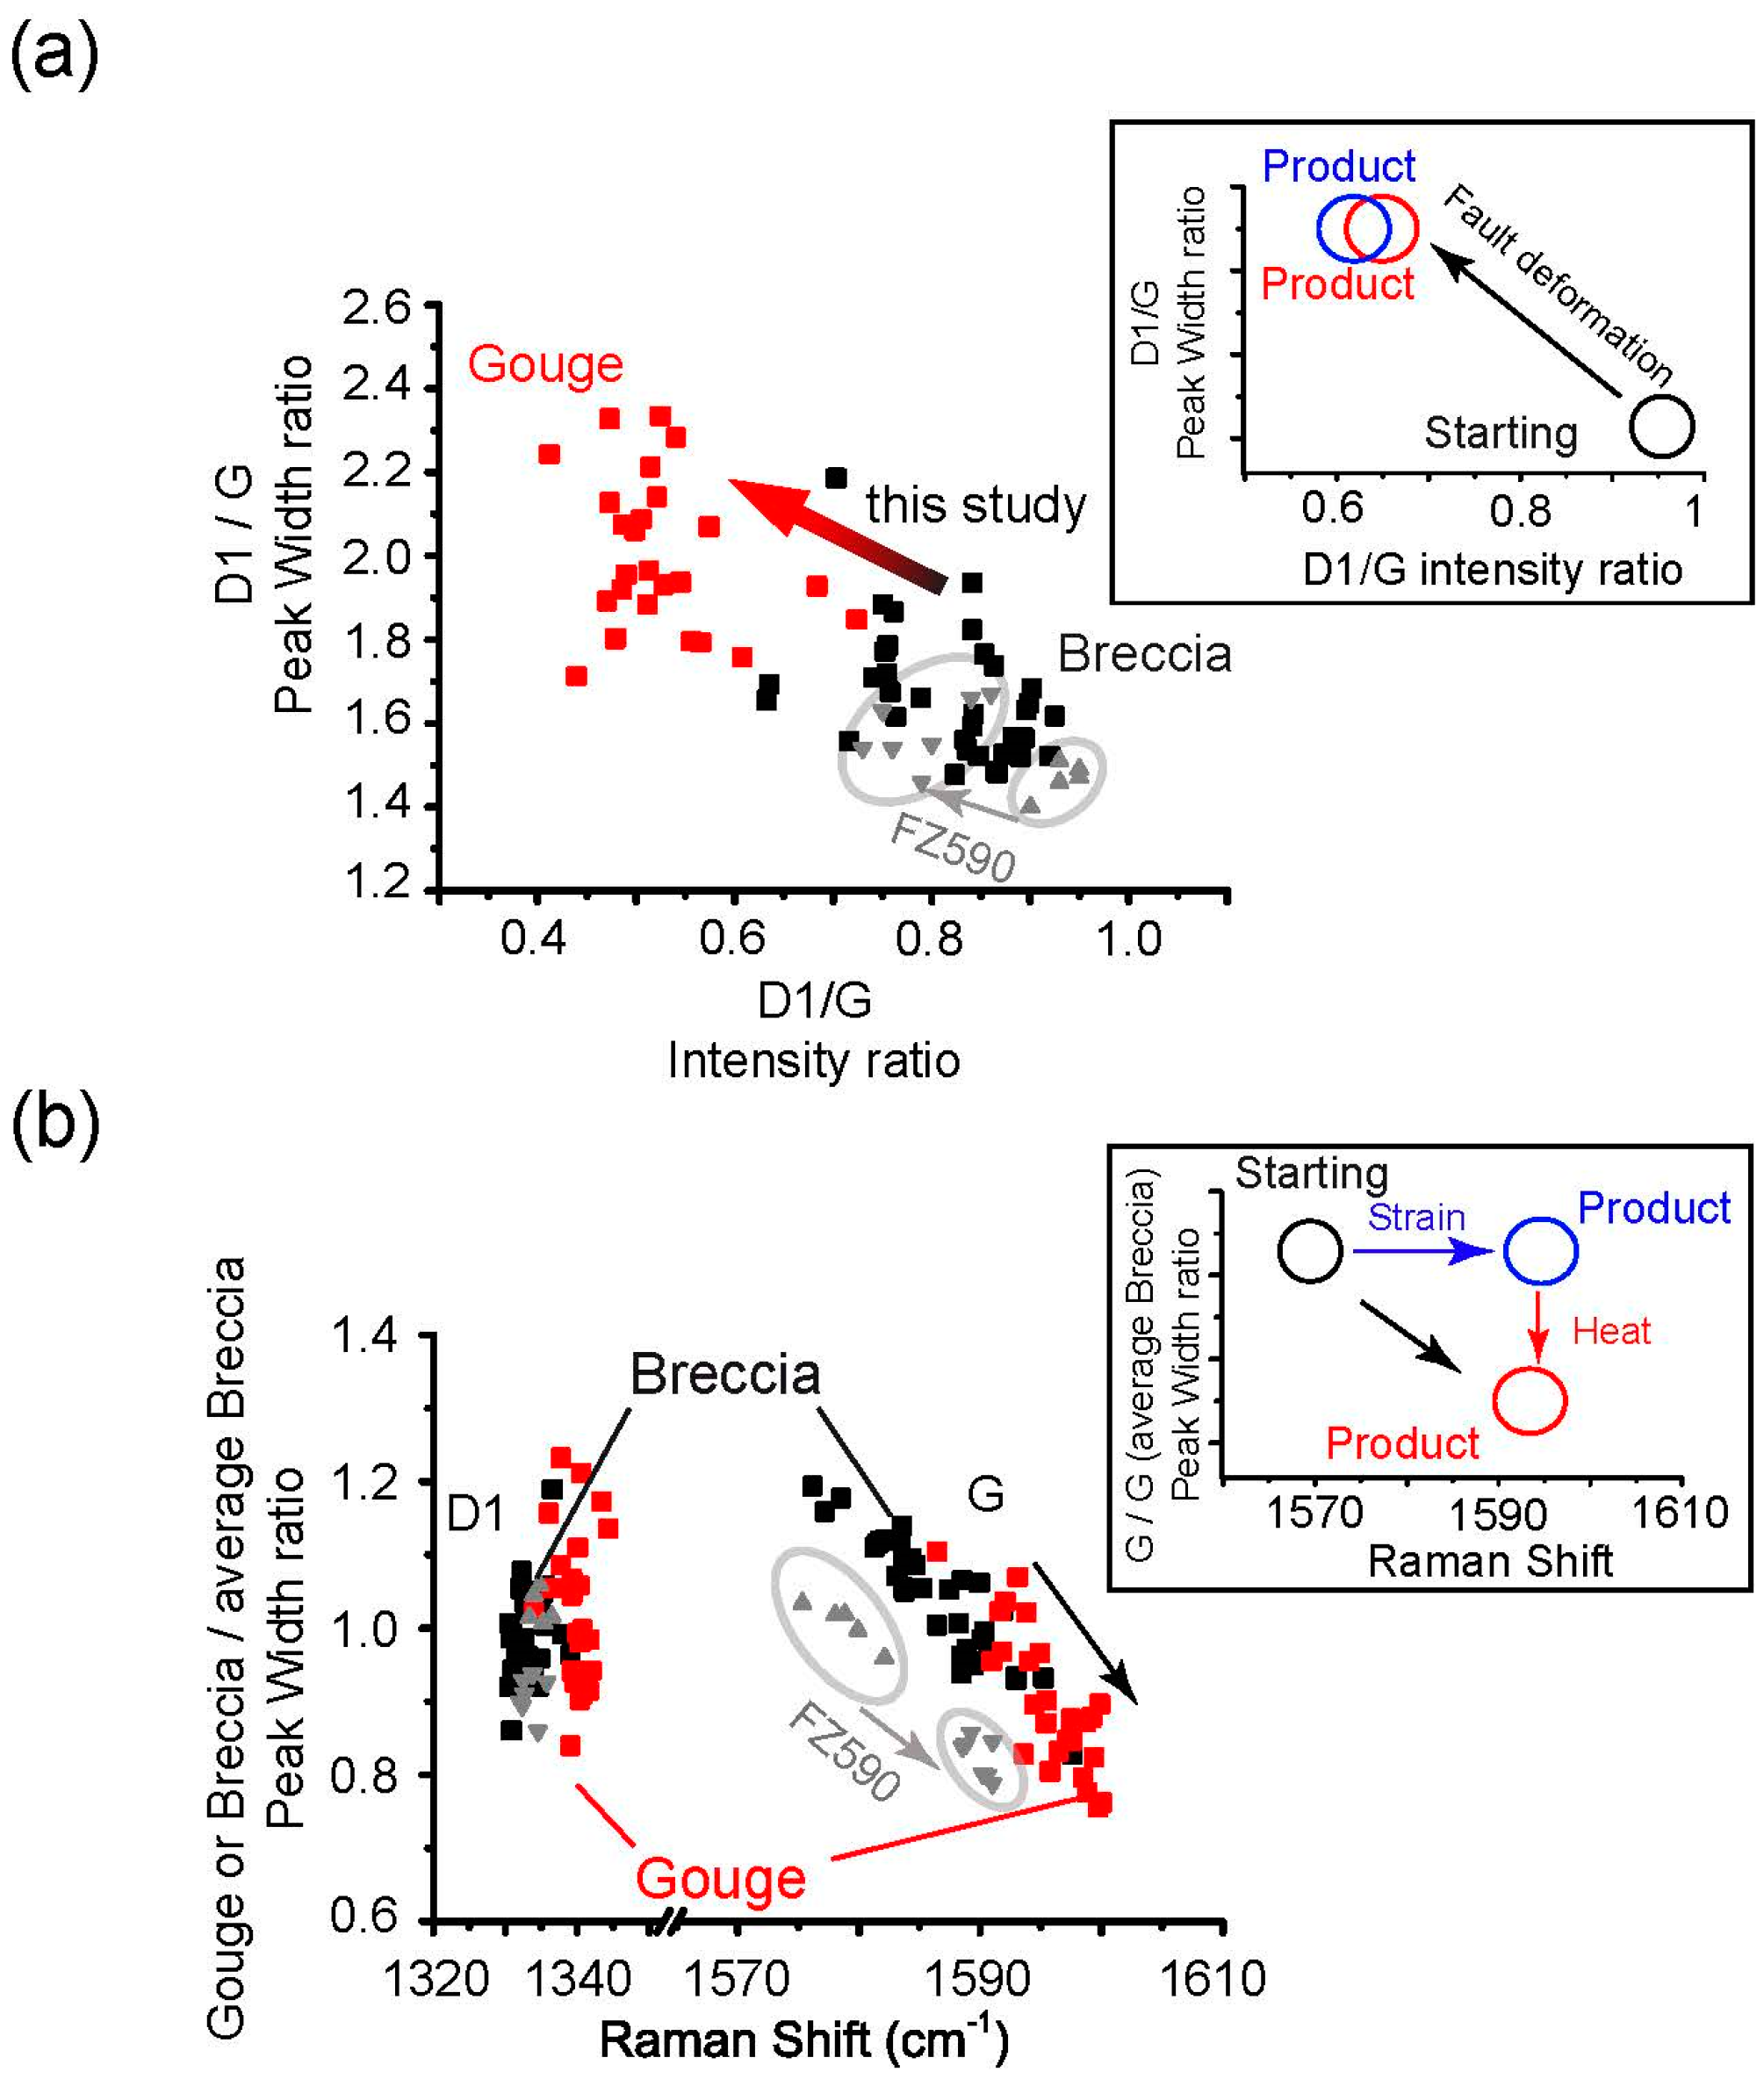
3. Results
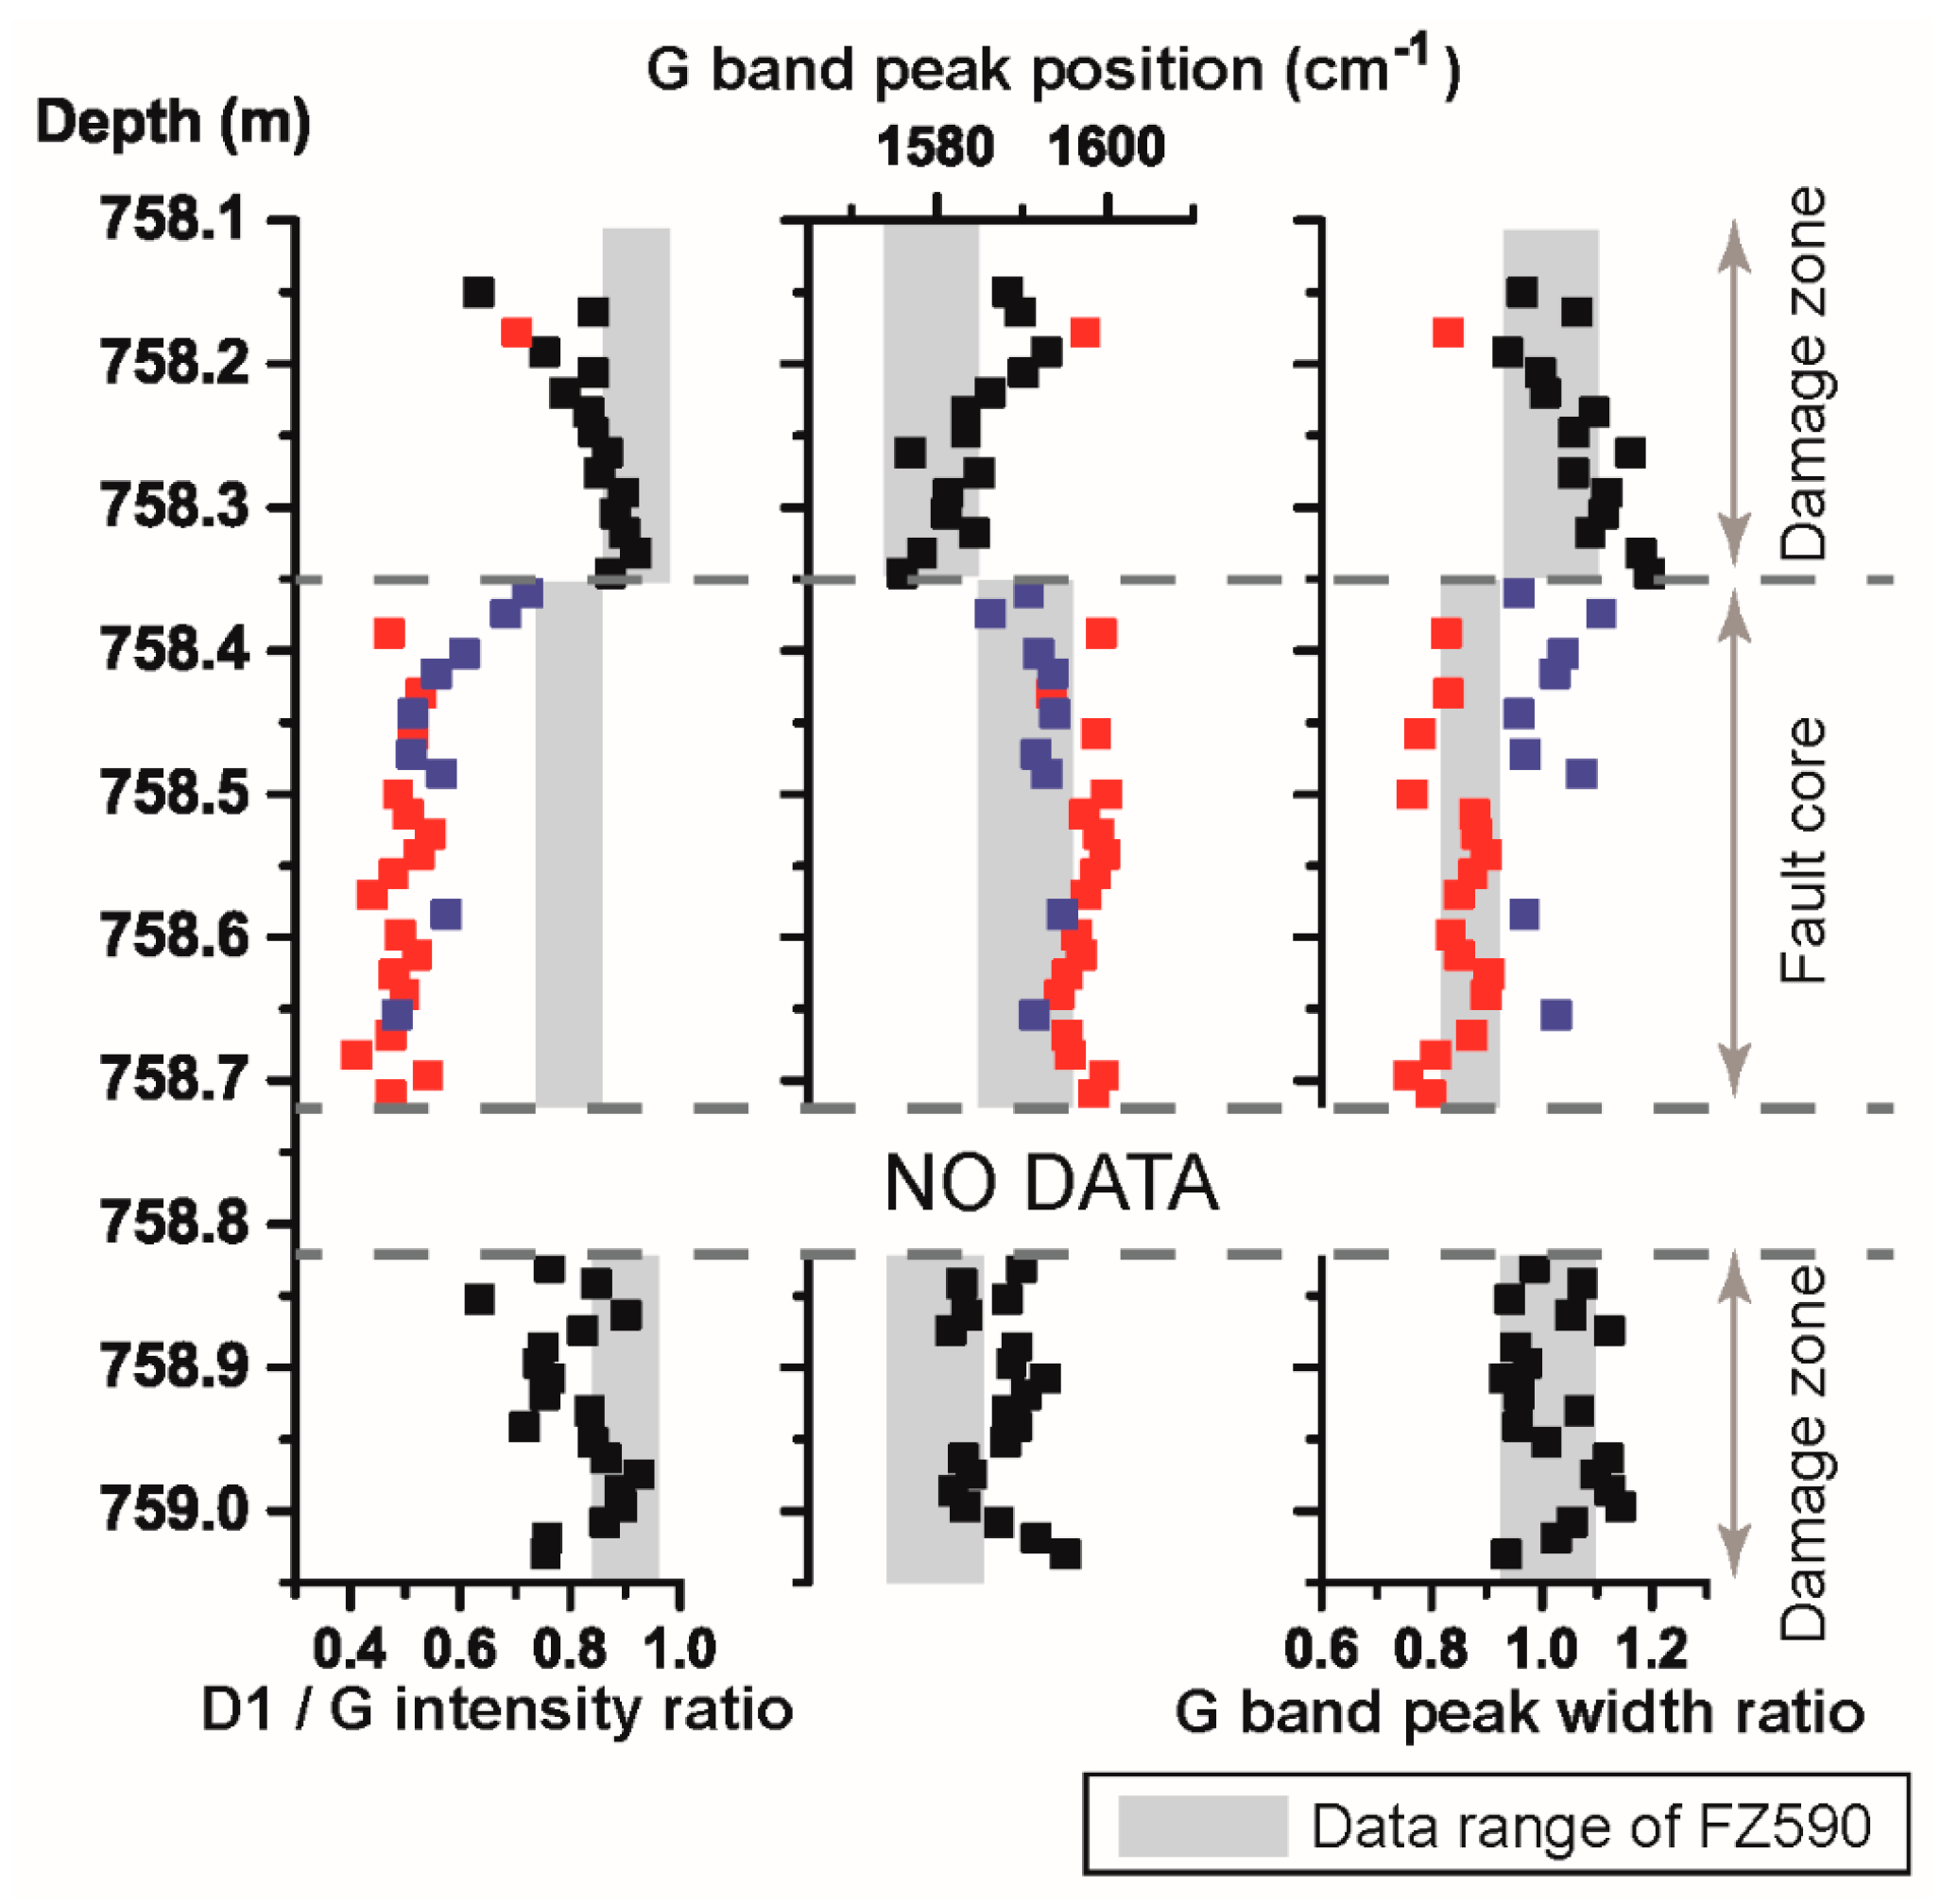
3.1. XRD Analysis
3.2. RSCM
4. Discussion and Conclusions
Author Contributions
Funding
Acknowledgments
Conflicts of Interest
References
- Sibson, R.H. Thickness of the seismic slip zone. Seismol. Soc. 2003, 93, 1169–1178. [Google Scholar] [CrossRef]
- Goldsby, D.L.; Tullis, T.E. Low frictional strength of quartz rocks at subseismic slip rates. Geophys. Res. Lett. 2002, 29, 1844. [Google Scholar] [CrossRef]
- Di Toro, G.; Hirose, T.; Nielsen, S.; Pennacchioni, G.; Shimamoto, T. Natural and experimental evidence of melt lubrication of faults during earthquakes. Science 2006, 311, 647–649. [Google Scholar] [CrossRef] [PubMed]
- Di Toro, G.; Goldsby, D.L.; Tullis, T.E. Friction falls towards zero in quartz rock as slip velocity approaches seismic rates. Nature 2004, 427, 436–439. [Google Scholar] [CrossRef] [PubMed]
- Han, R.; Shimamoto, T.; Hirose, T.; Ree, J.-H.; Ando, J. Ultralow friction of carbonate faults caused by thermal decomposition. Science 2007, 316, 878–881. [Google Scholar] [CrossRef] [PubMed]
- Di Toro, G.; Han, R.; Hirose, T.; De Paola, N.; Nielsen, S.; Mizoguchi, K.; Ferri, F.; Cocco, M.; Shimamoto, T. Fault lubrication during earthquakes. Nature 2011, 471, 494–498. [Google Scholar] [CrossRef] [PubMed]
- Niemeijer, A.; Di Toro, G.; Griffith, W.A.; Bistacchi, A.; Smith, S.A.F.; Nielsen, S. Inferring earthquake physics and chemistry using an integrated field and laboratory approach. J. Struct. Geol. 2012, 39, 2–36. [Google Scholar] [CrossRef]
- Sibson, R.H. Generation of pseudotachylyte by ancient seismic faulting. Geophys. J. R. Astron. Soc. 1975, 43, 775–794. [Google Scholar] [CrossRef]
- Tsutsumi, A.; Shimamoto, T. High-velocity frictional properties of gabbro. Geophys. Res. Lett. 1997, 24, 699–702. [Google Scholar] [CrossRef]
- Di Toro, G.; Pennacchioni, G.; Nielsen, S.; Eiichi, F. Pseudotachylytes and earthquake source mechanics. In International Geophysics; Fukuyama, E., Ed.; Academic Press: Cambridge, MA, USA, 2009; Volume 94, pp. 87–133. [Google Scholar]
- Kuo, L.-W.; Song, S.-R.; Yeh, E.C.; Chen, H.F.; Si, J. Clay mineralogy and geochemistry investigations in the host rocks of the Chelungpu fault, Taiwan: Implication for faulting mechanism. J. Asian Earth Sci. 2012, 59, 208–218. [Google Scholar] [CrossRef]
- Rowe, C.D.; Fagereng, A.; Miller, J.A.; Mapani, B. Signature of coseismic decarbonation in dolomitic fault rocks of the Naukluft Thrust, Namibia. Earth Planet. Sci. Lett. 2012, 333–334, 200–210. [Google Scholar] [CrossRef]
- Kirkpatrick, J.D.; Rowe, C.D.; White, J.C.; Brodsky, E.E. Silica gel formation during fault slip: Evidence from the rock record. Geology 2013, 41, 1015–1018. [Google Scholar] [CrossRef]
- Smith, S.A.F.; Di Toro, G.; Kim, S.; Ree, J.-H.; Nielsen, S.; Billi, A.; Spiess, R. Coseismic recrystallization during shallow earthquake slip. Geology 2013, 41, 63–66. [Google Scholar] [CrossRef]
- Evans, J.P.; Prante, M.R.; Janecke, S.U.; Ault, A.K.; Newell, D. Hot faults: Iridescent slip surfaces with metallic luster document high-temperature ancient seismicity in the Wasatch fault zone, Utah, USA. Geology 2014, 42, 623–626. [Google Scholar] [CrossRef]
- Kuo, L.-W.; Song, S.-R.; Suppe, J.; Yeh, E.C. Fault mirrors in seismically active fault zones: A fossil of small earthquakes at shallow depths. Geophys. Res. Lett. 2016, 43, 1950–1959. [Google Scholar] [CrossRef]
- Xu, X.; Wen, W.; Yu, G.; Klinger, Y.; Hubbard, J.; Shaw, J. Coseismic reverse- and oblique-slip surface faulting generated by the 2008 Mw 7.9 Wenchuan earthquake, China. Geology 2009, 37, 515–518. [Google Scholar] [CrossRef]
- Xu, C.; Liu, Y.; Wen, Y.; Wang, R. Coseismic slip distribution of the 2008 Mw 7.9 Wenchuan earthquake from Join Inversion of GPS and InSAR data. Seismol. Soc. 2010, 100, 2736–2749. [Google Scholar] [CrossRef]
- Li, H.; Wang, H.; Xu, Z.; Si, J.; Pei, J.; Li, T.; Huang, Y.; Song, S.-R.; Kuo, L.-W.; Sun, Z.; et al. Characteristics of the fault-related rocks, fault zones and the principal slip zone in the Wenchuan earthquake Fault Scientific Drilling Hole-1 (WFSD-1). Tectonophysics 2013, 584, 23–42. [Google Scholar] [CrossRef]
- Kuo, L.-W.; Li, H.; Smith, S.A.F.; Di Toro, G.; Suppe, J.; Song, S.-R.; Nielsen, S.; Sheu, H.-S.; Si, J. Gouge graphitization and dynamic fault weakening during the 2008 Mw 7.9 Wenchuan earthquake. Geology 2014, 42, 47–50. [Google Scholar] [CrossRef]
- Kuo, L.-W.; Di Felice, F.; Spagnuolo, E.; Di Toro, G.; Song, S.-R.; Aretusini, S.; Li, H.; Suppe, J.; Si, J.; Wen, C.-Y. Fault gouge graphitization as evidence of past seismic slip. Geology 2017, 45, 979–982. [Google Scholar] [CrossRef]
- Ross, J.V.; Bustin, R.M. The role of strain energy in creep graphitization of anthracite. Nature 1990, 343, 58–60. [Google Scholar] [CrossRef]
- Si, J.; Li, H.; Kuo, L.-W.; Pei, J.; Song, S.-R.; Wang, H. Clay mineral anomalies in the Yingxiu-Beichuan fault zone from the WFSD-1 drilling core and its implication for the faulting mechanism during the 2008 Wenchuan earthquake (Mw 7.9). Tectonophysics 2014, 619–620, 171–178. [Google Scholar] [CrossRef]
- Li, H.; Xue, L.; Brodsky, E.E.; Mori, J.J.; Fulton, R.M.; Wang, H.; Kano, Y.; Yun, K.; Harris, R.N.; Gong, Z.; et al. Long-term temperature records following the Mw 7.9 Wencuhan (China) earthquake are consistent with low friction. Geology 2015, 43, 163–166. [Google Scholar] [CrossRef]
- Sibson, R.H. Fault rocks and fault mechanisms. J. Geol. Soc. Lond. 1977, 133, 191–213. [Google Scholar] [CrossRef]
- Chester, F.M.; Evans, J.P.; Biegel, R.L. Internal structure and weakening mechanisms of the San Andreas fault. J. Geophys. Res. 1993, 98, 771–786. [Google Scholar] [CrossRef]
- Kuo, L.-W.; Song, S.-R.; Huang, L.; Yeh, E.C.; Chen, H.F. Temperature estimates of coseismic heating in clay-rich fault gouges, the Chelungpu fault zone, Taiwan. Tectonophysics 2011, 502, 315–327. [Google Scholar] [CrossRef]
- Wopenka, B.; Pasteris, J.D. Structural characterization of kerogens to granulite-facies graphite: Applicability of Raman microprobe spectroscopy. Am. Mineral. 1993, 78, 533–557. [Google Scholar]
- Beyssac, O.; Rouzaud, J.N.; Goffé, B.; Brunet, F.; Chopin, C. Graphitization in a high-pressure, low-temperature metamorphic gradient: A Raman microspectroscopy and HRTEM study. Contrib. Mineral. Petrol. 2002, 143, 19–31. [Google Scholar] [CrossRef]
- Beyssac, O.; Goffé, B.; Petitet, J.P.; Froigneux, E.; Moreau, M.; Rouzaud, J.N. On the characterization of disordered and heterogeneous carbonaceous materials by Raman spectroscopy. Spectrochim. Acta Part A 2003, 59, 2267–2276. [Google Scholar] [CrossRef]
- Sadezky, A.; Muckenhuber, H.; Grothe, H.; Niessner, R.; Poschl, U. Raman microspectroscopy of soot and related carbonaceous materials: Spectral analysis and structural information. Carbon 2005, 43, 1731–1742. [Google Scholar] [CrossRef]
- Furuichi, H.; Ujiie, K.; Kouketsu, Y.; Saito, T.; Tsutsumi, A.; Wallis, S. Vitrinite reflectance and Raman spectra of carbonaceous material as indicators of frictional heating on faults: Constraints from friction experiments. Earth Planet. Sci. Lett. 2015, 424, 191–200. [Google Scholar] [CrossRef]
- Lunsdorf, N.K.; Dunkl, I.; Schmidt, B.; Rantitsch, G.; von Eynatten, H. Towards a higher comparability of geothermometric data obtained by Raman spectroscopy of carbonaceous material. Part 1: Evaluation of biasing factors. Geostand. Geoanal. Res. 2014, 38, 73–94. [Google Scholar] [CrossRef]
- Lunsdorf, N.K.; Dunkl, I.; Schmidt, B.; Rantitsch, G.; von Eynatten, H. Towards a higher comparability of geothermometric data obtained by Raman spectroscopy of carbonaceous material. Part 2: A revised geothermometer. Geostand. Geoanal. Res. 2017, 41, 593–612. [Google Scholar] [CrossRef]
- Kuo, L.-W.; Song, S.-R.; Yeh, E.-C.; Chen, H.-F. Clay mineral anomalies in the fault zone of the Chelungpu Fault, Taiwan, and their implications. Geophys. Res. Lett. 2009, 36, L18306. [Google Scholar] [CrossRef]
- Ferrari, A.C.; Robertson, J. Interpretation of Raman spectra of disordered and amorphous carbon. Phys. Rev. 2000, 61, 14095–14107. [Google Scholar] [CrossRef]
- Chen, J.; Niemeijer, A.; Yao, L.; Ma, S. Water vaporization promotes coseismic fluid pressurization and buffers temperature rise. Geophys. Res. Lett. 2017, 44, 2177–2185. [Google Scholar] [CrossRef]
- Faulkner, D.R.; Lewis, A.C.; Rutter, E.H. On the internal structure and mechanics of large strike-slip fault zones: Field observations of the Carboneras fault in southeastern Spain. Tectonophysics 2003, 367, 235–251. [Google Scholar] [CrossRef]
- Rouzaud, J.-N.; Oberlin, A. Structure, microtexture, and optical properties of anthracene and saccharose-based carbons. Carbon 1989, 27, 517–529. [Google Scholar] [CrossRef]
- Rumble, D. Hydrothermal graphitic carbon. Element 2014, 10, 427–433. [Google Scholar] [CrossRef]
- Galvez, M.E.; Beyssac, O.; Martinez, I.; Benzerara, K.; Chaduteau, C.; Malvoisin, B.; Malavieille, J. Graphite formation by carbonate reduction during subduction. Nat. Geosci. 2013, 6, 473–477. [Google Scholar] [CrossRef]
- Zheng, Y.; Li, H.; Gong, Z. Geothermal study at the Wenchuan earthquake Fault Scientific Drilling project-hole 1 (WFSD-1): Borehole temperature, thermal conductivity, and well log data. J. Asian Earth Sci. 2016, 117, 23–32. [Google Scholar] [CrossRef]
- Oohashi, K.; Hirose, T.; Shimamoto, T. Graphite as a lubricating agent in fault zones: An insight from low- to high-velocity friction experiments on a mixed graphite-quartz gouge. J. Geophys. Res. 2013, 118, 2067–2084. [Google Scholar] [CrossRef]
- Erdemir, A.; Donnet, C. Tribology of diamond-like carbon films: Recent progress and future prospects. J. Phys. D Appl. Phys. 2006, 39, 311–327. [Google Scholar] [CrossRef]


| Type | Depth (m) | D1/G Intensity (Error Estimate ±0.07) | D1/G Width Ratio (Error Estimate ±0.10) | Peak Position (cm−1) | Gouge or Breccia/Average Breccia | ||
|---|---|---|---|---|---|---|---|
| D1 | G | D1 | G | ||||
| Breccia | 758.15 | 0.63 | 1.66 | 1334 | 1588 | 0.92 | 0.97 |
| Breccia | 758.16 | 0.84 | 1.94 | 1336 | 1590 | 1.19 | 1.06 |
| Breccia | 758.18 | 0.70 | 2.19 | 1335 | 1597 | 1.05 | 0.83 |
| Breccia | 758.19 | 0.75 | 1.77 | 1334 | 1593 | 0.96 | 0.94 |
| Breccia | 758.21 | 0.84 | 1.82 | 1334 | 1590 | 1.05 | 1.00 |
| Breccia | 758.22 | 0.79 | 1.66 | 1331 | 1586 | 0.97 | 1.01 |
| Breccia | 758.23 | 0.83 | 1.56 | 1330 | 1583 | 0.99 | 1.10 |
| Breccia | 758.25 | 0.84 | 1.62 | 1330 | 1583 | 0.99 | 1.06 |
| Breccia | 758.26 | 0.87 | 1.48 | 1331 | 1577 | 1.00 | 1.16 |
| Breccia | 758.28 | 0.85 | 1.77 | 1332 | 1585 | 1.08 | 1.06 |
| Breccia | 758.29 | 0.90 | 1.63 | 1332 | 1581 | 1.06 | 1.12 |
| Breccia | 758.30 | 0.88 | 1.57 | 1330 | 1581 | 1.01 | 1.11 |
| Breccia | 758.32 | 0.90 | 1.65 | 1333 | 1584 | 1.04 | 1.09 |
| Breccia | 758.33 | 0.92 | 1.52 | 1332 | 1578 | 1.04 | 1.18 |
| Breccia | 758.35 | 0.87 | 1.53 | 1332 | 1576 | 1.06 | 1.2 |
| Gouge | 758.36 | 0.72 | 1.85 | 1334 | 1591 | 1.02 | 0.96 |
| Gouge | 758.37 | 0.68 | 1.93 | 1337 | 1586 | 1.24 | 1.11 |
| Gouge | 758.39 | 0.47 | 1.89 | 1340 | 1599 | 0.90 | 0.83 |
| Gouge | 758.40 | 0.61 | 1.76 | 1339 | 1592 | 1.06 | 1.04 |
| Gouge | 758.42 | 0.56 | 1.80 | 1339 | 1594 | 1.06 | 1.02 |
| Gouge | 758.43 | 0.53 | 1.93 | 1339 | 1593 | 0.93 | 0.83 |
| Gouge | 758.44 | 0.51 | 1.97 | 1337 | 1594 | 1.09 | 0.96 |
| Gouge | 758.46 | 0.51 | 2.21 | 1340 | 1599 | 1.00 | 0.78 |
| Gouge | 758.47 | 0.51 | 1.88 | 1336 | 1592 | 1.06 | 0.97 |
| Gouge | 758.49 | 0.57 | 1.79 | 1340 | 1593 | 1.11 | 1.07 |
| Gouge | 758.50 | 0.49 | 2.07 | 1341 | 1600 | 0.92 | 0.76 |
| Gouge | 758.51 | 0.51 | 2.09 | 1340 | 1597 | 1.06 | 0.88 |
| Gouge | 758.53 | 0.54 | 1.94 | 1341 | 1599 | 0.99 | 0.88 |
| Gouge | 758.54 | 0.52 | 2.33 | 1340 | 1600 | 1.21 | 0.90 |
| Gouge | 758.56 | 0.48 | 1.80 | 1340 | 1599 | 0.91 | 0.87 |
| Gouge | 758.57 | 0.44 | 1.71 | 1339 | 1597 | 0.84 | 0.85 |
| Gouge | 758.58 | 0.57 | 2.07 | 1336 | 1595 | 1.16 | 0.97 |
| Gouge | 758.60 | 0.49 | 1.96 | 1341 | 1596 | 0.94 | 0.83 |
| Gouge | 758.61 | 0.52 | 2.14 | 1339 | 1597 | 1.05 | 0.85 |
| Gouge | 758.63 | 0.48 | 1.80 | 1339 | 1595 | 0.94 | 0.90 |
| Gouge | 758.64 | 0.50 | 2.06 | 1339 | 1594 | 1.07 | 0.90 |
| Gouge | 758.65 | 0.49 | 1.92 | 1344 | 1591 | 1.14 | 1.03 |
| Gouge | 758.67 | 0.47 | 2.33 | 1343 | 1595 | 1.18 | 0.87 |
| Gouge | 758.68 | 0.41 | 2.24 | 1339 | 1596 | 1.05 | 0.81 |
| Gouge | 758.70 | 0.54 | 2.28 | 1340 | 1600 | 1.00 | 0.76 |
| Gouge | 758.71 | 0.47 | 2.13 | 1340 | 1598 | 0.98 | 0.80 |
| Breccia | 758.83 | 0.76 | 1.62 | 1334 | 1590 | 0.92 | 0.99 |
| Breccia | 758.84 | 0.85 | 1.52 | 1331 | 1583 | 0.95 | 1.07 |
| Breccia | 758.85 | 0.63 | 1.69 | 1330 | 1588 | 0.92 | 0.94 |
| Breccia | 758.86 | 0.90 | 1.68 | 1332 | 1584 | 1.03 | 1.05 |
| Breccia | 758.87 | 0.82 | 1.48 | 1332 | 1582 | 0.96 | 1.12 |
| Breccia | 758.89 | 0.75 | 1.88 | 1333 | 1589 | 0.96 | 0.97 |
| Breccia | 758.91 | 0.76 | 1.87 | 1335 | 1593 | 1.01 | 0.93 |
| Breccia | 758.92 | 0.75 | 1.72 | 1333 | 1590 | 0.95 | 0.96 |
| Breccia | 758.93 | 0.84 | 1.54 | 1333 | 1588 | 0.95 | 1.07 |
| Breccia | 758.94 | 0.72 | 1.56 | 1330 | 1589 | 0.86 | 0.96 |
| Breccia | 758.95 | 0.84 | 1.59 | 1333 | 1588 | 0.93 | 1.01 |
| Breccia | 758.96 | 0.86 | 1.49 | 1332 | 1583 | 0.96 | 1.12 |
| Breccia | 758.97 | 0.92 | 1.62 | 1333 | 1584 | 1.03 | 1.10 |
| Breccia | 758.99 | 0.89 | 1.52 | 1332 | 1582 | 0.99 | 1.12 |
| Breccia | 759.00 | 0.89 | 1.57 | 1334 | 1583 | 1.03 | 1.14 |
| Breccia | 759.01 | 0.86 | 1.74 | 1335 | 1587 | 1.06 | 1.06 |
| Breccia | 759.02 | 0.76 | 1.68 | 1337 | 1592 | 0.99 | 1.03 |
| Breccia | 759.03 | 0.75 | 1.79 | 1339 | 1595 | 0.97 | 0.93 |
© 2018 by the authors. Licensee MDPI, Basel, Switzerland. This article is an open access article distributed under the terms and conditions of the Creative Commons Attribution (CC BY) license (http://creativecommons.org/licenses/by/4.0/).
Share and Cite
Kuo, L.-W.; Huang, J.-R.; Fang, J.-N.; Si, J.; Song, S.-R.; Li, H.; Yeh, E.-C. Carbonaceous Materials in the Fault Zone of the Longmenshan Fault Belt: 2. Characterization of Fault Gouge from Deep Drilling and Implications for Fault Maturity. Minerals 2018, 8, 393. https://doi.org/10.3390/min8090393
Kuo L-W, Huang J-R, Fang J-N, Si J, Song S-R, Li H, Yeh E-C. Carbonaceous Materials in the Fault Zone of the Longmenshan Fault Belt: 2. Characterization of Fault Gouge from Deep Drilling and Implications for Fault Maturity. Minerals. 2018; 8(9):393. https://doi.org/10.3390/min8090393
Chicago/Turabian StyleKuo, Li-Wei, Jyh-Rou Huang, Jiann-Neng Fang, Jialiang Si, Sheng-Rong Song, Haibing Li, and En-Chao Yeh. 2018. "Carbonaceous Materials in the Fault Zone of the Longmenshan Fault Belt: 2. Characterization of Fault Gouge from Deep Drilling and Implications for Fault Maturity" Minerals 8, no. 9: 393. https://doi.org/10.3390/min8090393
APA StyleKuo, L.-W., Huang, J.-R., Fang, J.-N., Si, J., Song, S.-R., Li, H., & Yeh, E.-C. (2018). Carbonaceous Materials in the Fault Zone of the Longmenshan Fault Belt: 2. Characterization of Fault Gouge from Deep Drilling and Implications for Fault Maturity. Minerals, 8(9), 393. https://doi.org/10.3390/min8090393