Abstract
Trace element (TE) partitioning in the system “mineral-hydrothermal solution” is studied by the method of thermo-gradient crystal growth coupled with internal sampling of a fluid phase. The analytical procedure used enables evaluating of structurally bound and superficially bound modes of TE in crystals and determining corresponding dual partition coefficients. The case of precious metals (PM—Au, Pt, Pd) at 450 and 500 °C and 100 MPa pressure is considered. The minerals are pyrite, As-pyrite, magnetite, Mn-magnetite and hematite and fluids are ammonium chloride-based hydrothermal solutions. The partition coefficients for structural and surficial modes, and , are found to be unexpectedly high (except for Au in pyrite). High concentrations of PM are attributed to superficial nonautonomous phases (NAPs), which can be considered as primary concentrators of PM. We also have studied the co-crystallization (exchange) coefficients (De) of REE (Ce, Eu, Er, Yb) and Fe in magnetite and hematite at 450 °C and 100 MPa. is elevated to two orders of magnitude as compared to . It is shown that not only physicochemical parameters affect REE distribution in hydrothermal systems, but also NAP presence and its composition. The crystal growth mechanism specified by the agency of NAP is suggested. The study of PM distribution in natural pyrite of gold-ore deposits supported the importance of differentiating between structurally and superficially bound TE modes for correct use of experimental D values to determining element concentrations in ore-forming fluids.
1. Introduction
Study of mineral crystals as real structurally imperfect objects suggested that the distribution of trace elements (TE) in the reactions with their participation depends heavily on the admixture interaction with defects and may fail to be in accordance with the known thermodynamic ratios defined by Nernst’s and Henry’s laws [1,2,3,4]. For this reason, at the end of the last century microelements distribution faced a crisis, which was described by J. Jones in a rather emotional manner: “Elements entering crystals at the ppm level (or worse, at the ppb level) might partition into defects, rather than into well-defined crystallographic sites. This was discouraging” [5] (p. 161).
The surface is the most common defect of a real structure of a crystal. Its contribution to the distribution of elements is not hard to evaluate in principle; however, for reasons we do not fully understand, such studies are not popular in geological and mineralogical works. Perhaps this is because many authors published their results without taking into account this factor and explaining anomalies in the distribution of TE by other reasons. More and more of the latter are found with the upgrade of micro-analytical equipment. For example, the STEM/EDX study of high-angle grain boundaries in olivines revealed chemical segregation of some admixture elements [6]. The effect was qualitatively explained by thermodynamic and non-kinetic factors, believing that these elements are better compatible with the boundary than with the bulk structure; their presence at the boundary is associated with a lower strain energy in comparison with that when entering the crystal volume [6]. If TE in “closed” boundaries behaves in such a way, then free surfaces of crystal faces provide much greater opportunities for accommodation of TE, particularly when these elements are incompatible and are practically very scarcely represented in crystal structures. However, studies of quantitative separation of surface and bulk constituents of gold and other incompatible elements are extremely rare in the geological literature. Usually, this separation is not carried out and various concentration modes are associated with different generations of mineral in the sample and not with different grain (crystal) sizes of the same sample.
The accumulation of admixture elements is normally attributed to surface adsorption phenomenon, in particular, chemisorption [7]. However, being an exothermal process, adsorption is ineffective at high temperatures and under the impact of reactive fluid, causing, in contrast, desorption. It has been previously shown [8,9], that minor components such as Hg and Cd in sulfides can be part of the superficial non-autonomous phase (NAP) that is the product of chemical modification and structural reconstruction of the growing crystal surface layer bordering the hydrothermal fluid [10,11]. A later more extensive study of gold distribution in pyrite and other hydrothermal minerals in deposits of different genetic types confirmed the active role of the surface in the absorption of Au, an element, which is incompatible within the structures of most minerals [12]. There are highly determinate exponential dependences of the average content of evenly distributed Au on a specific surface area of an average crystal in the size fraction. The determination coefficients (R2) often reached 0.9–0.99, and it is extremely difficult to reconcile with the existing patterns of Au uptake by mineral surfaces by an adsorption-reduction mechanism [13,14,15]. Incompatible elements are prone to camouflage, that is, to enter minerals, as mentioned above, they opt not for regular positions of atoms in a perfect crystal structure, but for various types of defects and their complexes [16]. It is very difficult to explain how highly deterministic dependencies on crystal specific surface areas appear. With R2 = 0.99, it is difficult to talk about random distribution, which could have been the case with proper (autonomous) mineral forms emerging on the active centers associated with superficial defects [17,18]. This is because the number of randomly occurring defects, on which Au ions are reduced, depends on crystal surface area rather than on crystal specific area. Such clear dependence on the specific surface area will only take place if the element-absorbing NAP is homothetic to crystal (replicates its geometrical shape) and covers a significant portion of its surface.
In hydrothermal systems, the interaction of phase surfaces with the solution is usually faster than between solid phases, and a more soluble phase does not persist in such a system. Nevertheless, in the natural environments, including gold ore deposits [19], associations of such mineral phases are not uncommon. These are difficult to understand, except in one case—if the surface layers of these phases, and not their volumes, are in equilibrium with the solution. A.I. Rusanov [20] considered such layers as non-autonomous virtual phases, the number of which should be included in the extended Gibbs’ phase rule. The detailed study of mineral surfaces by the methods of electron spectroscopy, scanning electron microscopy and scanning probe microscopy allowed us to establish that similar phases do exist, and they are real, because they have certain (albeit variable subject to circumstances) composition and thickness, element valence states differing from the volume [10,21]. They share a common feature with non-autonomous phases introduced by Rusanov—they cannot exist in isolation, without interaction with the matrix crystal. Therefore, they should evolve not by themselves, but together with the growing crystal, which means that NAP takes part in the growth process. Atomic force microscopic images of such phases forming on the surface of synthetic and natural crystals were presented in our numerous previous publications [10,11,21,22].
The emergence of NAP has a number of important implications, two of which are dealt with in this work: dualism of TE distribution coefficient and formation of hidden forms of metal content; the so-called invisible modes of metal occurrence. When considering these interrelated phenomena, we will refer to the results of earlier pilot studies [21,23,24,25], as well as to the data of studies of natural ore minerals with admixtures of precious metals.
2. Background
The philosophy behind our approach is to identify the part of the element concentration, which obeys the regularities for structurally bound impurity in the crystal and conforms to Henry’s law, with minimal and relatively constant value and lower dispersion of distribution coefficient (compared with the dispersion of its total value). A coexisting phase can be either the ambient solution or the so-called reference mineral containing this element as a structurally bound admixture [23]. This approach is primarily aimed at distinguishing between volume and surface-related components of the element content, which is necessary to assess true and apparent (that is dual) distribution coefficient. There are special techniques designed to determine the speciation of the element [9].
Partitioning of TE can be described both by partition coefficient, , and by co-crystallization (exchange) coefficient, . is a simple ratio of TE contents in solid phase (crystal, ) and fluid (solution, ), whereas assumes an exchange reaction between TE and crystal matrix element (ME): , .
In an experiment, there is usually determined the total distribution coefficient, , which contains structural and superficial, nonstructural, component:
where and are mass fractions () of substance in the volume (core) of crystal and surface layer S with the thickness h, depending on the crystal size and shape [23]. Expression (1) allows us to calculate and the corresponding partition coefficient from data on and for each size fraction with the crystal size r, if the concentration of TE structural component is known:
The manifestation of duality is identified by increase in relation to the values that are defined by the law of distribution for isomorphic admixtures. The specific implementation of the approach and method of evaluating of and contributions into TE total concentration for acquiring respective coefficients of dual distribution and will be discussed below (Section 3.2.2).
3. Methods
3.1. Experimental Procedure
The methods of D determination in two series of experiments are described below. The distribution of precious metals (PM) was previously discussed [21,23,24,25] and is only supplemented here with fresh data. The distribution of rare earth elements (REE) in the systems magnetite (hematite) fluid has not been previously considered.
The crystals were obtained by standard techniques of hydrothermal thermogradient synthesis in stainless steel autoclaves of about 200 cm3 [26]. Autoclaves were equipped with titanium alloy (VT–6, VT–8) inserts, with the volume of about 50 cm3 and passivated surface. Ammonium chloride based solutions having demonstrated high efficiency in the course of synthesis of various mineral crystals were used. To obtain data on the composition of high-temperature fluid we applied internal sampling using traps attached to the insert plug (Figure 1).
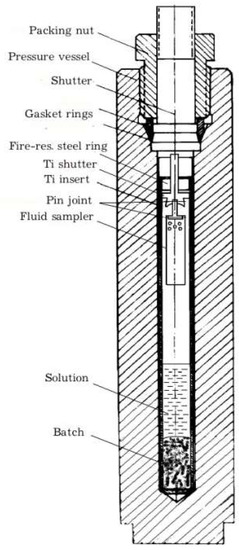
Figure 1.
Schematic of the experiment. Crystals grow on the Ti shutter surface and insert wall.
The temperature in the zone of crystal growth was either 450 or 500 °C, pressure 100 MPa (1 kbar). The experiments were conducted in two stages. At the first stage, lasting 4 days at 450 and 3 days at 500 °C, the isothermal conditions were maintained to homogenize the batch material and ensure close to equilibrium conditions during subsequent thermogradient recrystallization held with 15 °C temperature drop (on the outer wall of the autoclave). The duration of the gradient stage is from 9 to 25 days depending on the temperature of the experiment and the desired size of the crystalline product. The experiments were terminated by autoclave quenching in cold running water at a rate of ~5 °C/s. The elements contained in low concentration in the solution do not persist in it under cooling to room temperature [9]. The method of capturing fluid portions (supercritical hydrothermal solution) by a trap is not strictly isothermal one. However, if the difference between the temperature of the experiment and the critical point of the aqueous-salt solution is not very big, and the cooling rate at quenching is high enough, it is reasonable to believe that the bulk mass of the fluid was captured at the highest density of the fluid, i.e., in the proximity of the experimental temperature [23]. Upon completion of the synthesis, the solution was extracted from the sampler which was rinsed with aqua regia to dissolve the precipitate. The cleaning solution was subsequently combined with the directly extracted one. Thereafter, the special chemical medium was created to determine the elements by appropriate analytical methods.
The batch was made up from domestically produced reagents of high chemical purity (pure reagent-grade). In the course of synthesis of magnetite, manganmagnetite and hematite the initial components were Fe, FeO, Fe2O3, Cr2O3, Mn2O3 and the batch mass was 3 or 5 g. NH4Cl concentration was 8 or 10 wt %, in some experiments 2 wt % HCl or NaOH were added, as well as small quantities of potassium dichromate to improve magnetite growth. In the course of pyrite synthesis the batch weighing 6 g consisted of element substances—Fe, S and As. Solutions were prepared on the basis of NH4Cl, adding in some cases 0.5–1 wt % of Na2S, HCl or NaOH. In the experiments with precious metals, the batch was replenished with 1 wt % of Au, Pd and Pt in various combinations. In experiments with REE, Ce, Eu, Er and Yb were added in the form of oxides for 1 percent each of the batch mass of 5 g. The mineralizer concentration (NH4Cl solution, “high purity” grade) amounted to 5 or 10 wt %.
Nitrogen is considered to be a common component of hydrothermal fluids forming the orogenic gold deposits [27,28]. Pyrite crystals from black shale-hosted gold deposits constantly exhibit nitrogen peaks in Auger spectra obtained from chips and natural crystal facets [29,30]. The ammonium ion is involved in ore formation processes; it is used in precious and non-ferrous metals exploration [31]. However, the main reason for the use of NH4Cl in our experiments is related to its excellent transport properties rather than its geochemical significance.
3.2. Analytical Methods
The bulk of the analytical information on noble metals and other elements (Fe, Mn, As) was obtained by atomic absorption spectrometry (AAS). The measurements were performed on Perkin-Elmer (Model 503 and Analyst 800, The Perkin Elmer corp., Norwalk, CT, USA) devices in the Center of Collective Use (CCU) of isotope-geochemical research of the Institute of Geochemistry, Siberian Branch of Russian Academy of Sciences (SB RAS). REE were determined by inductively coupled plasma-mass spectrometry (ICP-MS) method on Agilent 7500ce unit manufactured by Agilent Technologies (Agilent Tech., Santa Clara, CA, USA) in the CCU “Ul’tramikroanaliz” of the Limnological Institute, SB RAS (Irkutsk, Russia).
3.2.1. Analysis of Precious Metals
When analyzing crystals, we used AAS method with the element electrothermal atomization in graphite furnace (AAS-GF). The analytical data selections for single crystals (ADSSC) version of data processing was applied (see below). If for gold the direct determination from the solution after crystal acid decomposition with minimum detection limit (MDL) of 0.3 ppb and an accuracy of 12% was reliable, Pd, Pt and Ru were determined after preliminary extraction concentrating and separation from the matrix [32]. Tristyrylphosphine (C6H5CH-CH)3P was used as an extracting agent. Extraction was performed in weak (0.5 M) hydrochloric solutions. The extracting agent concentration was 0.05 M (in toluene) and contact time of phases was 30 min. The proportion of aqueous and organic phases was 2:1 (by volume). Extraction was carried out in static mode at room temperature and without labilizing additives. Organic phase was used to measure element concentrations. Measurements were accurate to ±10% with MDL of 5 µg/L (5 ppb) for Pd and 50 µg/L for Pt and Ru.
3.2.2. Analytical Data Selections for Single Crystals (ADSSC)
Experimental observations and the simulation of TE behavior allowed us to propose an approach based on rank-scaled statistical sampling of analytical data for individual TE-containing crystals. As the starting point, we consider the properties of TE uptake by mineral crystals [9]. Although TE can be contained in various binding forms, there exists a finite probability that any representative assemblage of individual (single) crystals involves several that are free from active sites or defects responsible for the non-structure element uptake from slightly oversaturated or undersaturated solutions. It is desirable that such crystals should be regularly facetted and have exclusively perfect faces, and thus they contain only two indiscernible element species: superficially bound and structurally bound. Other forms obviously enhance the total content of the element, so the task is to obtain a statistical sample of single crystals that contain it in minor but significant (above the detection limit) amounts. Let us take for example the gold determination by atomic absorption spectrometry with a graphite furnace (AAS-GF). The procedure of statistical data processing is the following [33]. The initial assemblage N usually contains 40–100 individual crystals. The more analyses, the more reliable the result can be obtained, if their number does not increase at the expense of quality of crystals. Only the reliable values N1 that exceed at least three times MDL are taken for further consideration. The Au detection limit for AAS-GF determination was estimated with a special standard sample as 0.3 µg/L in solution or 0.3 ppb in solid [23]. In processing the data, the whole database of Au concentrations in individual single crystals is subdivided into ranges according to crystal masses in such a manner that all ranges contain roughly equal numbers of crystals and no less than 15. Strictly speaking, the crystal mass mi should be nearly equal for individual crystals subsets but this is an unrealistic requirement. Therefore, we follow the rule of minimum Δm in each subset taking into account both the quality of internal statistics and representatives of size fractions. Then an average concentration is determined for each range, the root-mean-square deviation (s) is evaluated, and values >1 s are rejected. The crystals showing negative deviations (<−1 s) remain in the sample. According to the concept adopted here, in principle, a crystal can contain only the structurally bound mode of TE and any additional forms can only increase the concentration of the element above the value for the structural (isomorphous) form. Because of this, low concentrations should be pre-treated as possible if they are not accounted for by the analytical errors or <3 MDL. Thus, the action described above allows the purification of the subsets of sample N1 from crystals, which contain binding forms distributed non-uniformly between the crystals, first, fine inclusions of native gold. Thereafter for the subsets, we determine the mean and the standard error of the mean ±σ. Finally, we use a procedure to separate structurally bound gold from modes bound to the surface. For this purpose, we introduce the criterion by which every in the size (mass) subset must be rejected if it is higher than . This is a condition for structural mode: the variation coefficient having a maximum value of 20% (without random error) plus in round 10% of analytical uncertainty of AAS-GF [26]. Thereafter, we determine the average concentration of an evenly distributed Au in each subset (), the average mass of crystal () in the subset and then calculate the average crystal size and the specific surface area of the average crystal:
The crystal shape is approximated by a true polyhedron with an edge and form coefficient k. If an adequate number of size fractions (subsets) is available (≥4), we get the possibility to evaluate the structurally bound constituent by the extrapolation of evenly distributed gold content to a zero-specific surface, i.e., to a very large crystal containing only bulk and no surface atoms.
Of course, we cannot exclude some special cases, for instance, gold nanoparticles [34] distributed in the same manner as structurally bound gold (). If this form is related to the surface (as is often the case for fine particles), it can be separated from .
The validity of this procedure has been tested using the data for pyrite crystals of different size fractions [35]. The dependence upon indicated that the amount of structural gold in pyrite is equal to 2.3 ppm, in reasonable agreement with the value of gold solubility in low-arsenic pyrite at the same conditions (3 ± 1 ppm) [26]. However, it is not a simple matter to evaluate the uncertainty of the value obtained by extrapolation. The comparison with X-ray photoelectron spectroscopic (XPS) data within the system Ag2S:Au as well as with the data on other elements and methods showed that structurally bound constituent can be determined precise to ±30% [35,36].
There are two approaches to the evaluation of the surface-associated component of TE. In the works [21,23] calculation performed in respect of NAP, assuming true cubic (pyrite, Py) or octahedral (magnetite, Mt)) crystals uniformly covered by NAP of ~500 and ~330 nm thick, respectively (according to the XPS with ion etching of the surface and atomic force microscopy). Then, accounting for the apparent condition r >> h, where r is the edge of the cube or octahedron, you can define value in the Formula (2):
where dS and dV are the densities of the surface and bulk phases, respectively.
Substituting (4) or (5) into (2) in the light of the values found through extrapolation we acquire evaluation of TE content in NAP in every size fraction, which is then averaged across all the fractions. Formulas, similar to (4) and (5) can be obtained for other shapes of crystals. For example, the pyrite crystals in experiments with As better correlate with the hemispherical shape because of the abundance of vicinal faces.
Thus obtained values , first, are significantly dispersed due to highly simplified NAP model and r variations in size fractions, and, second, they are not directly comparable with , since the latter refers to the whole crystal, while refers to its surface layer. So, papers [21,23] offer a different way of evaluation, where TE content in the superficially bound mode characterizes an average crystal among all size samples; that is, the surface-related excess concentration of element:
where is the average content of TE evenly distributed in each size sample sm with the number of crystals and average crystal mass . The surficial distribution coefficient is attributed to that value, and not to , which is more practical and instrumental in comparing contributions of surface and bulk related modes.
3.2.3. Analysis of Rare Earth Elements
In the experiments with REE, Ce and Eu represented “light” rare earth elements (LREE), Er and Yb “heavy” rare earth elements (HREE). The fluid samples from the traps were analyzed by ICP-MS method on the Agilent 7500ce unit manufactured by Agilent Technologies with quadrupol mass analyzer (Agilent Tech., Santa Clara, CA, USA). Measurements were performed under the following optimal conditions: plasma power 1550 W, reflected power 1 W, the carrying gas flow rate 0.8 L/min, auxiliary gas flow—0.13 L/min, integration time 0.1 s, points on mass—3, oxides (CeO/Ce, 156/140) = 0.3%. The device was tuned by Tuning solution with the concentration of 10 μg/L (10 ppb) Li, Co, Y, Ce, Tl. The calculation of elements concentrations was carried out by external calibration method using multi-element certified solutions 68A, 68A–B (High-purity Standards) containing all of the elements from Li to U. The calibration solutions were diluted with 2% HNO3 down to the concentration 0.5–50 μg/L of each element. The drift tracking of the device was carried out by internal standard In (10 ppb). Calculation of the concentrations was based on the most abundant isotopes, giving signals, free of overlapping or subject to minimum isobar and polyatomic disturbances. Elements detection limits are at the level of 1 ppt, determination error is 5%.
To determine REE in magnetite and hematite crystals the Laser Ablation platform of New Wave Research UP-213 was used. Parameters of the LA-ICP-MS experiment: plasma power 1400 W, carrier gas flow rate 1.18 L/min, plasma forming gas flow rate 15 L/min, cooling gas 1 L/min, laser energy 0.16–0.19 mJ, frequency 10 Hz, laser spot diameter 55 µm. Accumulation time per channel—0.15 s; acquisition time 27 s. Calculation of the concentrations was based on the standard sample NIST 612. The correctness was verified by using the in-house standard sample of hematite with elevated Ce content estimated by EMPA. It is known that synthetic hematite can incorporate up to 1.7 wt % Ce as a structurally bound impurity [37]. Standard deviations are consistent with counting statistic uncertainties at around 20–30 per cent. REE detection limits are estimated at ~0.1 ppm. Error analysis is rated as 30%.
3.2.4. X-ray Photoelectron Spectroscopy (XPS)
The X-ray photoelectron spectra of the samples were obtained on photoelectron spectrometer SPECS (SPECS, Berlin, Germany) equipped with a PHOIBOS 150 MCD 9 energy analyzer (Krasnoyarsk regional Centre for Collective Use, SB RAS). The spectra were acquired at excitation initiated by the radiation of Mg anode of an X-ray tube (Mg Kα = 1253.6 eV), the power was 180 W, voltage on the tube—12.5 kV. The survey spectrum was recorded with a step of 0.5 eV at transmission energy of the energy analyzer 20 eV. The high-resolution spectra of individual elements (narrow scans) were recorded usually with 0.05 eV interval and transmission energy of 8 eV. The line C 1s (285.0 eV) of hydrocarbon contaminants was used as an internal standard to account for electrostatic charging. Ion etching was conducted using raster ion gun PU-IQE112/38, working with accelerating voltage 2.5 kV and ion current of 30 μA. The etching rate was approximately 6 nm/min. The deconvolution of the spectra was performed using the program CasaXPS after subtracting the nonlinear background by Shirley’s method, peak shape was approximated by symmetrical Gauss-Lorentz function. To interpret the spectra, we used NIST XPS database [38], the handbook [39] and publications [21,40]. In addition, some of the work on defining the chemical state of PM was performed on the spectrometer LAS-3000 manufactured by “Riber” (Riber, Bezons, France). Atoms of sample surface were excited by aluminum anode non-monochromatized radiation (Al Kα = 1486.6 eV) emitted by an electron beam accelerated at 10 kV with a current of 20 mA. Vacuum pressure in the analysis chamber typically was 6.7 × 10⁻¹⁰ mbar. The spectrometer was equipped with an OPX-150 hemisphere detector and Auger electron analyzer of the cylindrical mirror type OPC-200.
4. Natural Materials
Pyrite crystals to be analyzed were selected from the four ore sites: Degdekan, Natalkinskoe, Zolotaya Rechka (North-East of Russia) and Krasnoye (Eastern Siberia) (Figure 2). All of them belong to orogenic gold deposits [41]. The native gold in the deposits of ~740‰ to ~920‰ fineness is mainly coarse-grained and disseminated in vein quartz and sulfide mineral aggregates. Another reason for choosing these objects is that ore mineralization is located in carboniferous sediments. Such ore objects within black shale strata that are challenging for diagnostics of Pt occurrence modes. Study of gold deposits platinum content in the rocks of the carbonaceous formations, determination of Pt content in ores and minerals, identification of Pt occurrence forms, hosting entities and concentrators of this element occupy a special place in the investigations and have a significant theoretical as well as practical value. Presence of this noble metal in ores and the possibility of its extraction can significantly complement the range of known platinum-bearing ore formations and considerably increase the value of extracted gold at the fields, where platinoids accompany gold mineralization. The geological setting and mineralogical features of these objects (except for Zolotaya Rechka, see below) are given in detail in [42,43,44,45,46,47].
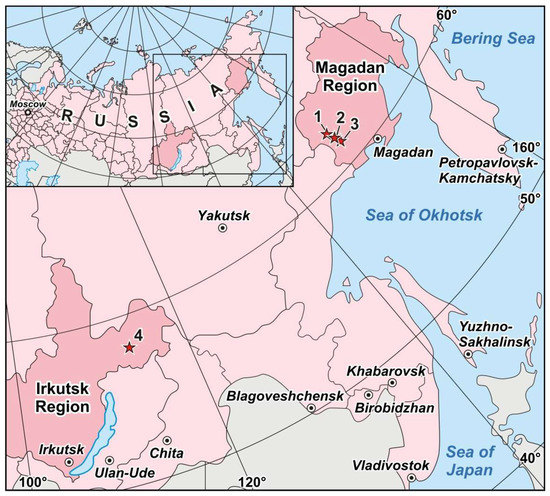
Figure 2.
Location of the Degdekan (1), the Natalkinskoe (2), the Zolotaya Rechka (3) and the Krasnoe (4) deposits within the territories of Magadan and Irkutsk regions of the Russian Federation.
Pyrite is one of the most common sulfide minerals in all the gold deposits we studied. We studied pyrites from the ores with the highest gold grade selected in surface and underground mining workings (quarries, adits) and holes. Large mineralogical–geochemical samples weighing up to 10 kg were used for the study. The samples were crushed, sieved into fractions, washed in distilled water. Pyrite crystals were hand-picked under binocular microscope from fractions of 0.25–0.5, 0.5–1 and 1–2 mm.
4.1. Degdekan, Natalkinskoe and Zolotaya Rechka Deposits
These objects are located in the North-East of Russia (Magadan Region, Tenkinsky ore area) and are within the gold-bearing Yano–Kolyma fold belt being confined to its orogenic zones formed by collision. Their metallogenic characteristics are similar and they are classed as arsenopyrite type of gold-quartz low sulfide formation. The deposits are characterized by complex and long-continued character of development, and, according to most researchers, by metamorphogenic-hydrothermal genesis. For all the deposits, the prevailing non-metallic mineral is quartz, while arsenopyrite and pyrite are most widely spread among ore minerals. Of subordinate significance are pyrrhotite, galena, sphalerite, chalcopyrite, gersdorffite, native gold. Silver as a proper mineral form is extremely rare. It is mainly present in the form of micro-inclusions of argentite (acanthite) and native silver in arsenopyrite and pyrite, freibergite in chalcopyrite. Among the samples considered here, only a few crystals of pyrite selected in the Zolotaya Rechka deposit were found to contain finely dispersed inclusions of argentite or acanthite (microprobe analysis). As regards platinum, with the contents ranging from 12.6 to 61.7 ppm in the pyrites we studied, no proper mineral forms have been identified [42,43,44,45].
4.1.1. Degdekan Deposit
The Degdekan gold deposit is an example of localization of vein zones and veinlet-disseminated sulfide ores in stratified Permian sediments. Ore-hosting sections are largely composed of carbonaceous siltstones and shales with a large number of interlayers of graphitized host rocks. They form a granite-metamorphic dome associated with the North-Western zone of the Tenkinsky deep fault. The time interval of the formation of the dome hosting the deposit amounts to 130–142 million years (m.y.). The absolute age of the gold mineralization by U-Pb SHRIMP is estimated at 133–137 m.y., by the Ar-Ar method—at 137 m.y., that is, according to isotopic geochronology ore formation dates back to the early Cretaceous period. The main vein mineral is quartz. The host rocks, besides silification, demonstrate albitization, sericitization, there are found carbonates (ankerite, calcite) and chlorite. The principal ore minerals are pyrite and its subordinate arsenopyrite. These sulfides amount on average about 3%. Pyrite occurs in the form of small anhedral grains of 1–2 mm in size and large, over 2 mm, euhedral crystals of hydrothermal genesis. In addition to these minerals, there are found sphalerite, galena; less frequent are pyrrhotite, chalcopyrite, there are rare occurrences of gersdorffite. Gold is mainly in native form and <1 mm in size. Its fineness varies from 740 to 800‰. Extremely rare are electrum and kustelite [42,43]. Gold-arsenopyrite-polymetallic (with pyrite) mineral association is identified as productive [42]. The temperature range of its formation (according to the study of fluid inclusions) is estimated at 200–230 °C, the pressure is about 1 kbar. The solutions were weakly mineralized (25 g/L) and had mostly sodium bicarbonate composition, which points to their amagmatogenic (metamorphogenic-hydrothermal) origin. A large part of the pyrite at the Degdekan deposit was selected from the veinlet disseminated ores with gold content from 1.4 to 15.2 ppm.
4.1.2. Natalkinskoe Deposit
Ore mineralization of the unique giant Natalkinskoe ore deposit, despite all the diversity, forms a uniform (by internal constitution) ore lode consisting of quartz, quartz-carbonate, quartz-sulphide veins and veinlets surrounded by a wide halo of sulfidized rocks [44,45]. The geological position of the deposit is mainly due to its closeness to the marginal part of the alleged granite pluton in the central zone of the Tenkinsky deep fault. Overall, the deposit is traced along strike for 5 km, with a width of 1 km. Host rocks are classed as late Permian sediments represented by clay rocks, siltstones, clayey shales with increased carbon content. According to K/Ar dating, the age of gold mineralization was estimated from 135–130 m.y. up to 110–100 m.y., i.e., according to isotope geochronology, this gold mineralization might date back to early Cretaceous period. Such non-metallic minerals as quartz, carbonates, feldspars, sericite and chlorite were identified at the deposit. Ore minerals, along with pyrite and arsenopyrite (amounting to 4–7 wt %), are presented by galena, sphalerite, chalcopyrite, native gold and rutile (less than 1 wt %). Native gold with the fineness from 750 to 900‰, less frequent electrum, mostly coarse-grained, occurs mainly in native state in vein quartz and conglomerates with sulfide minerals. Pyrite-arsenopyrite mineral association with gold and galena is found to be the most productive [44]. Industrial ore formed in the course of interaction of host rocks with low- and medium salty water-bicarbonate fluids within the salinity interval 3–12 wt % NaCl eq., at temperatures of 360–280 °C and approximate pressure of 2.4–1.1 kbar [45]. Pyrites from the richest (1.5–30.2 ppm Au) vein and veinlet-vein ores were studied.
4.1.3. Zolotaya Rechka Deposit
The Zolotaya Rechka deposit has not been sufficiently studied. There are no data on this deposit in the available published sources. Geological description and mineralogy of the deposit are presented here on the basis of unpublished materials of geological foundations; the material composition is supplemented with data provided by the authors of this article. The Zolotaya Rechka deposit is located in the anticline arch made up of weakly metamorphosed and intensely dislocated terrigenous sediments of the Upper Permian. It is dark grey, to black, siltstone clayey carbonaceous shales with streaks and lenses of sandstone and sand tuff. The deposit, as well as Natalkinskoe, is confined to the central zone of the Tenkinsk deep fault, but is located slightly further to the South. In metallogenic relation, it is of the same type as the previously considered ore objects. By structural and morphological characteristics the deposit falls under the category of vein-veinlet and veinlet-mineralized zones. Ore bodies are a combination of mineralized shatter zones and veinlet zones. Veinlet and disseminated sulfide mineralization (no more than 3 wt %) is presented by pyrite and arsenopyrite, with rare occurrences of chalcopyrite. Native gold occurs in vein quartz and conglomerates with sulfide minerals. Native gold with the fineness of 750–800‰, largely fine (up to 0.8 mm), and is mostly in quartz and conglomerates with sulfide minerals. Pyrite-arsenopyrite mineral association with gold is identified as productive. Pyrites were selected mainly from veinlet-mineralized zones with gold content from 1.2 to 15.2 ppm.
4.2. Krasnoye Deposit
The Krasnoye deposit is located in the territory of Eastern Siberia (Irkutsk region, Bodaibo ore area) (Figure 2). Bodaibo ore area as one of the largest gold reserves in Russia is a classic example of orogenic gold deposits in black-shale formations of Proterozoic age. The Krasnoye deposit is situated in the south of the area (Artyomovsk ore node). Structurally, the gold ore mineralization is confined to the core parts of anticlines and fault zones. The genesis is traditionally considered to be metamorphogenic-hydrothermal, with hydrogenic processes being assigned an essential role by a number of researchers [46,47].
The regressive phase of metamorphism, which is associated with gold ore mineralization, is estimated at 330–300 m.y. and is connected with the formation of the Angara-Vitim granitoid batholite. Ore mineralization was formed by moderately saline fluids of sodium bicarbonate composition with salinity range of 7.5–13.0 wt % NaCl eq., at temperatures of 140–300 °C and a pressure of 0.9–1.8 kbar.
The mineral composition of the Krasnoye ores is similar to that of the ore sites of the North East of Russia we considered. Non-metallic minerals are mainly presented by quartz, the primary mineral among metallic minerals being pyrite with the secondary and rare ones presented by arsenopyrite, chalcopyrite, galena, sphalerite, pyrrhotite, fahl ores of tennantite-tetrahedrite group, gersdorffite, gold. No proper mineral forms of silver have been identified [46,47].
Pyrite in ores is presented by two varieties: large crystalline pyrite, and fine dissemination of idiomorphic pyrite. Large crystals of pyrite largely develop in association with chalcopyrite, galena, pyrrhotite, gold and gray copper ores. Chalcopyrite is often closely associated with pyrrhotite and galena. Native gold with a fineness of 860–870‰ is associated with cracks in pyrite, develops as independent occurrences or in association with galena. Gold is mostly fine (<0.1 mm). Gold-pyritic mineral association with polymetals is most productive. Large pyrite crystals were selected from quartz-pyrite veins with gold content of 1.2 ppm up to 11.2 ppm.
4.3. Analysis Procedure
To study pyrite with ADSSC technology, idiomorphic crystals of different sizes with clean surfaces and overwhelming prevalence of cubic facets {100} were selected from ore samples. Each crystal was weighed on the analytical microbalance and transferred into beakers for subsequent dissolution (see analysis methods above). We used only the crystals with the mass exceeding 0.1 mg. According to our long-term experience of work with this method, acquisition of reliable data requires the starting sample to contain at least 70–80 crystals, their screening in the course of data processing being on the order of one third. This enables selection of 4–6 size fractions in the final sample, which provides extrapolation towards zero specific surface area of the average crystal.
For all samples analyzed, we acquired highly deterministic dependences of average sample PM contents on specific surface of the average crystal in size fraction. A structural component of impurity is identified with pre-exponential factor; the surface-bound component is calculated according to the Formula (6).
5. Results
5.1. Distribution of Precious Metals
Table 1 presents the procedure for calculation of PM (Au and Pd) contents in structurally and superficially bound modes by ADSSC method while studying their distribution between hematite crystals and hydrothermal solution.

Table 1.
Example of data acquisition by the ADSSC method (TE = Au and Pd in hematite crystallized at 450 °C and 1 kbar in 10% NH4Cl).
Given the small size interval of the obtained crystals (r ~ 0.3–0.7 mm) it was possible to identify only four size fractions. This is the minimum number of fractions, with which the method of separation of structural and surface modes is efficient. The number of crystals in the final samples is not quite optimal either; it is advisable to have no less than 10, but this is not always easily achievable without compromising the quality of the data because it is influenced by the characteristics of individual crystals, perfect habitus forms and pure face surfaces. The data of Table 1 are graphically presented in Figure 3.
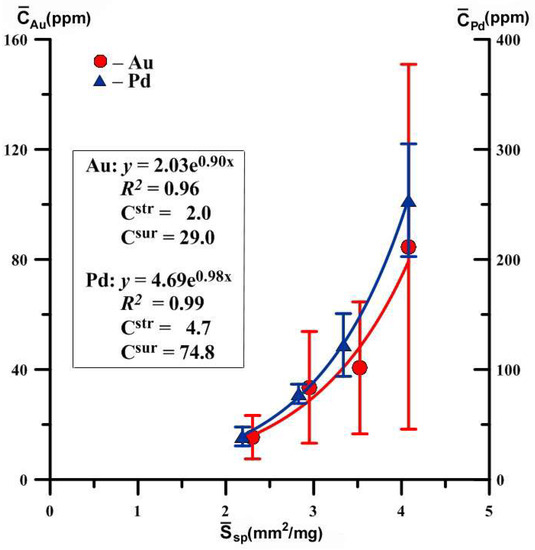
Figure 3.
Dependences of the average concentrations of evenly distributed precious metals on the specific surface area of an average crystal in size fractions. Hematite crystals were obtained at 450 °C and 1 kbar in 10% NH4Cl. The expressions for approximate curves and concentrations of structurally and superficially bound modes are shown (see Table 1 for details).
Despite the large amount of deviations from average values, especially for Au, the coefficients of determination of the dependencies presented here are quite high (0.96 and 0.99). However, error estimation shows that structural Au is determined with great inaccuracy. For Pd, the dependence is more correct and described by the equation , i.e., a structural component of Pd admixture in hematite is 4.7 ± 1.4 ppm. The assessment accuracy is 30%, typical for this method (see Section 3.2.2). It should be also noted that the concentration of elements in the superficially bound mode exceeds by more than an order of magnitude the content in structural mode. Hence, it is clear that the total distribution coefficient will be imposed mainly by surface mode. Table 2 summarizes previously acquired data [21,23,24,25] and the data of the current research on partition coefficients of PM (Au, Pt, Pd) in the systems “mineral-hydrothermal solution”.
Table 2.
Dual partition coefficients of precious metals in the system “mineral–fluid” determined in thermo-gradient hydrothermal experiments at 450 and 500 °C and 1 kbar.
The experiments were conducted with magnetite, its manganese variety (manganomagnetite), hematite, pyrite and As-pyrite at a temperature of 450 and 500 °C in solutions based on ammonium chloride (see Section 3.1). Table 2 demonstrates that the surficial partition coefficient overwhelmingly excels the structural one by an order of magnitude or more. The only exception is Dp Au in pyrite in the absence of As, for which surficial coefficient is only double of the structural one.
The data in Table 2 also indicate one rather unexpected circumstance: except for Au in pyrite, PMs are compatible elements in magnetite, pyrite and hematite, and taking into account superficial component, they are highly coherent elements.
Calculated by Equations (2), (4) and (5) contents of Au in NAP amounted to ~(3–5) × 103 in pyrite, ~(1.5–2) × 103 in As-pyrite and ~(1.5–3) × 103 ppm in magnetite [21,23]. Despite these relatively high values, satisfactory Au 4f XPS spectra were not obtained. However, Pt 4f and Pd 3d spectra, fairly conditioned, though of low intensity, were obtained on magnetite samples (Figure 4). They confirm the presence in the surface of two PM forms; oxidized (likely bivalent state) and elemental metal ones. Their relationship together with other characteristics of the spectral lines are presented in Table 3.
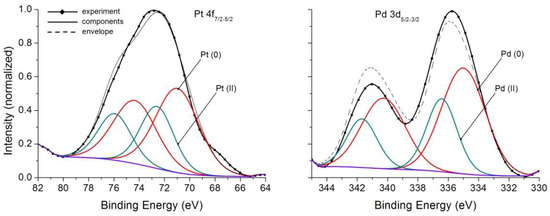
Figure 4.
X-ray photoelectron spectra Pt 4f and Pd 3d of magnetite crystals. See Table 3 for parameters of spectral lines.
Table 3.
XPS data for magnetite crystals containing Pd and Pt.
Thus, in contrast to the widely held view about PM reduction on mineral surfaces to neutral state [13,14,15], in hydrothermal growth systems presence of two forms of each of the elements, PM (0) and PM (II) is registered. This shows that there is not only a reductive adsorption, as at low, close to normal conditions, P,T parameters, but also the uptake of these elements by NAP in chemically bound form. In respect of magnetite, an important fact should be mentioned. Adding Mn to the system and causing crystallization of solid solutions (Fe, Mn) [Fe2O4], it is possible to prevent the formation of NAP, resulting in flattening the curves [21,24]. This is accounted for by the enrichment of the surface with manganese confirmed by layer-by-layer analysis based on LA-ICP-MS method [24]. That is, on the surface there is too little iron to form Fe oxyhydroxide (similar to hydromagnetite) surficial phase. Thus, the development of NAP depends on physicochemical conditions and chemical composition of crystallization medium.
Considering the experimental data presented above, it is necessary to pay attention to one important fact. Spontaneous deposition of substances onto crystals under quenching definitely takes place in the interval from T of experiment to ~380 °C critical point, below which the crystals are no longer in contact with the solution. Simple balance calculations show that precipitation of the substance cannot provide the observed concentrations of trace elements in the surface layer. This may be exemplified by Pt in pyrite. In the previously described experiment [25] under the number D23–4, the value established in the solution from the trap equaled 0.42 mg/kg Pt. Platinum content in the surface form calculated for average crystal mass in the sample was 100 mg/kg. The mass of the obtained crystals was about 900 mg, which yields 0.09 mg of Pt. Even if we assume that the surface of grown crystals (and only it) during quenching uptakes Pt of the entire fluid occupied the insert volume of ~50 mL, with the content of 0.42 mg/kg Pt, we get only 0.02 mg of Pt, i.e., 4.5 times less. If we take into account the real ratio of the surfaces of crystals, insert and trap walls, which are also readily available for deposition of Pt, the difference will attain several orders of magnitude. Therefore, the effect of trace elements enrichment cannot result from the deposition of substances during quenching. In this case, the content of the element would be proportional to the crystal contact area with fluid phase, rather than its specific surface area. Indeed, various sectors to a different degree are available for precipitated substances during quenching, with some part of the crystal surface inside conglomerates being closed from fluid at the time of quenching. Other differences between the NAP (and the products of their evolution) and autonomous quenching phases lie within the presence of ordered surface structures and regular change of the composition with depth, for example, reducing oxygen content in pyrite with crystal depth, difference of morphology and composition of segregations on the faces that belong to different simple forms of crystals [10,22,25].
5.2. Distribution of REE
Rare earth elements are currently viewed as universal indicators of rocks and minerals genesis. The Ce anomaly in REE series is a redox-sensor of oxidative state of magmatic systems [48], the proportion Ce4+/Ce3+ is regarded as a sensitive indicator of the oxygen fugacity [49]. However, REE distribution coefficients of mineral-fluid in hydrothermal systems are still poorly understood. Described below are the results of determination of REE and Fe co-crystallization coefficients (De = DREE/Fe) and modes of their occurrence in magnetite and hematite. In the experiments, these minerals were synthesized with the addition of Ce and Eu oxides as representatives of light REE (LREE), Er, and Yb, as representatives of heavy REE (HREE). NH4Cl solutions were used as growth medium. The information on elements contents in minerals and coexisting fluids is presented in Table 4. Two concentrations of mineralizing solution NH4Cl were used 5 and 10 wt %.
Table 4.
REE contents in the bulk of magnetite and hematite crystals and in coexisting fluids at 450 °C and 1 kbar by ICP-MS (solution) and LA-ICP-MS (crystal interior).
Table 5 presents the De co-crystallization coefficients, which reveal a proper accordance in both solutions used for magnetite (Mt) and a slightly worse accordance for hematite (Hm). Two approaches were used for evaluation of these parameters. The first approach included LA-ICP-MS analysis on crystal sections, pressed in epoxy cartridge and polished, i.e., the data obtained referred to REE volume contents (Table 5). These data show that De values are low, at the level of (1–2) × 10−5–(1–2) × 10−4 for Mt and (1–4) × 10−5 –(2–8) × 10−3 for Hm, and there is a clear tendency towards their increase for HREE, approximately one order of magnitude for Mt and two orders for Hm.
Table 5.
Co-crystallization coefficients of REE and Fe in Mt and Hm at 450 °C and 1 kbar in ammonium chloride solutions.
In the second case, native crystal faces were analyzed, which was possible because the obtained crystals were large enough (up to 2 mm). The analysis showed a strong enrichment of surface in REE in relation to the crystal core and, consequently, a significant increase in as compared to (confer Table 5 and Table 6). The measurements of depth of the hole following laser evaporation of the material by microscopic methods (light microscopy, scanning electron microscopy (SEM)) showed an average of ~20 microns, so the laser-removed material may be presumed to be significantly diluted with the bulk material. However, superficial enrichment even in this version is ~2 orders of magnitude, with De increasing by the same value (Table 6).
Table 6.
REE contents in near-surface regions (up to ~20 μm depth) of Mt and Hm crystals from LA-ICP-MS data, and surficial co-crystallization coefficients REE/Fe.
Unfortunately, of all the studied REE, we managed to fix XPS peaks, which are reliably superior to background, only for Ce. The survey spectra analysis showed that its content in the surface layer could reach several atomic percent. The narrow spectra indicate two forms of the element, III and IV, with a noticeable predominance of the first one (Figure 5).
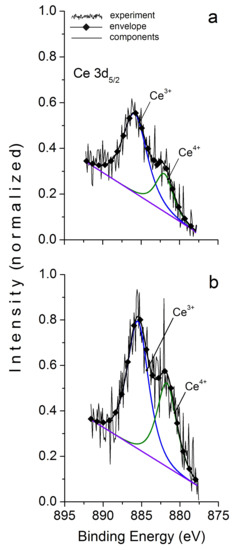
Figure 5.
X-ray photoelectron spectra Ce 3d5/2 in magnetite. (a) initial sample, (b) after Ar+ ion etching. See Table 7, sample 2.
In hematite, Ce content in the surface proved sufficient to articulate well both spin-orbital 3d doublet peaks, 5/2 and 3/2 (Figure 6).
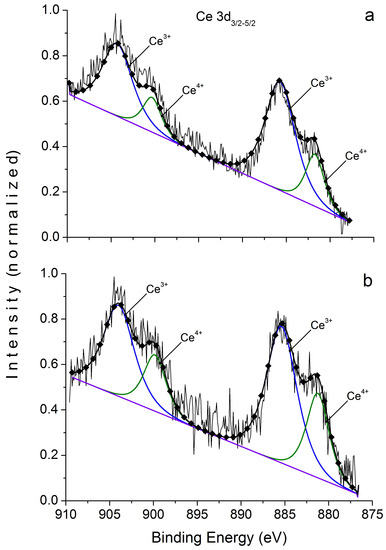
Figure 6.
XPS doublets Ce 3d in hematite crystals. (a) initial sample, (b) after Ar+ ion etching. See Table 7, sample 3.
It is important to note that etching with Ar+ to ~60 nm has little effect on the ratio of Ce valence forms of magnetite and absolutely does not affect it in hematite (see Table 7). Therefore, the presence of two Ce forms is not an artifact; the effect of surface enrichment in REE is not caused by the formation of diffusion zone or normal adsorption, and Ce valence state is not as rigidly associated with fO2 as is commonly believed, because the ratio of Ce3+/Ce4+ is approximately the same for magnetite and hematite. The composition of Mt surface is consistent with the XPS data [24]. The ratio of Fe3+/Fe2+ is approximately 1.1 (Table 8), in the O 1s spectrum there are identified O2− and OH− in the ratio 60:40 for magnetite and 80:20 for hematite. The data obtained show that NAP compositions on Mt and Hm are similar to each other and correspond with oxyhydroxide composition [24]: , where V denotes cation vacancies.
Table 7.
XPS data on chemical state of cerium in synthesized magnetite and hematite crystals.
Table 8.
Binding energies (eV) of Fe 2p3/2 multiple peaks and ratios of iron valence forms on the surface of magnetite and hematite crystals after 5-min Ar+ etching.
5.3. Gold and PGE in Natural Pyrite and Ore-Forming Fluids
Figure 7 exemplifies the dependencies for gold and platinum group elements (PGE—Pt, Pd and Ru) obtained by ADSSC method for pyrite of the black-shale hosted gold ore deposits (namely, Degdekan deposit, see Section 4). In terms of quantity, the superficial mode exceeds by approximately one order the structural one in the content of all the studied elements, and therefore, determines mainly the total content of evenly distributed element. The data obtained (Figure 3 and Figure 7) justify the geochemical role of NAP in TE distribution both in experimental and natural systems.

Figure 7.
Dependences of the average concentrations of evenly distributed precious metals on the specific surface area of an average crystal in size fractions. Pyrite from the pyrite-arsenopyrite association of orogenic gold deposit Degdekan. Note high coefficients of determination of approximative exponents and predominance of superficially bound mode.
Using data in Table 2, it is possible to assess the contents of Au and Pt in the fluid forming pyrite and pyrite-arsenopyrite assemblages (Table 9). For gold, we have accepted the value of 0.1 averaging the data for pure and As-containing pyrite crystals.
Table 9.
Estimates of the precious metal content in pyrite and ore-forming fluids using experimental distribution coefficients (Py/aq).
Such estimates are certainly approximate, as they do not take into account the details of the hydrothermal fluid chemical composition and differences in P, T conditions of the experiment and natural mineral formation. Au/Pt ratios reflect the situation more objectively, as for each sample they refer to the same parameters of the process of crystal formation, and fluid composition.
According to Table 9, Au content in fluids is within the range of 0.4–2.9 ppm, being substantially higher only for the Zolotaya Rechka (up to 34 ppm). However, elevated Ag content characterizing pyrite from this deposit might give rise to the additional to the structurally bound form intrinsic gold concentrator (Ag2S nanoparticles, containing gold) [25]. Pt content generally varies from 0.1 up to 0.6 ppm and at the Natalkinskoe deposit it reaches 1.8 ppm, where the fluid is definitely enriched with both elements as compared to the other samples. Table 9 also demonstrates that the bulk concentration of the element cannot be used to assess its content in the fluid, as the surface component of the element content in most cases considerably exceeds the structural one, thus overestimating the result. However, it is important to note that if we use the data for the surface-associated mode and relevant distribution coefficients (which, as mentioned above, are largely responsible for total values); we will acquire the PM concentrations in fluid close, in certain cases, to those presented in Table 9. This presumes an important circumstance, possible “camouflage” of the true PM distribution by surficial modes of elements. This might prompt an illusion that separation of structural and surficial modes of the element fails to provide new knowledge about the fluid composition. Nevertheless, bearing in mind that NAP characteristics and properties depend on the growth conditions, one may assume a situation where the results of solving the inverse problem of PM content determination in the fluid will vary significantly for bulk and structural PM contents.
It is also important to note that in the course of the hydrothermal experiment, the same reaction vessel may not contain different crystal generations, which are distinguished by PM concentration, since these elements (Au, Pt, Pd) are stored in the batch throughout the run, i.e., their chemical potentials in hydrothermal solution are constant and determined by their solubility. As far as natural crystals are concerned, the issue of generations is not so obvious, but the determination coefficients of size dependencies at the level of 0.9–0.99 (Figure 7) exclude the possibility of crystal formation time being the only affecting factor, since various mineral generations contain crystals of different sizes as well. Such clear dependencies on the specific surface area will only take place if the NAP absorbing the element is homothetic to the crystal (that is, geometrically repeats its shape) and covers a significant portion of its surface. For the same reason, the effect of enrichment with microelements cannot be due to the deposition of a substance in the course of phase nucleation following heterogeneous mechanism; in this case, the content of the element would be proportional to the contact area of the crystal with fluid phase, rather than its specific surface area.
6. Discussion
The peculiarities discussed in the Introduction could be reconciled with the obtained experimental results, assuming that the crystal surface layer contains NAP participates in the growth process. Determining the nature of this participation, we proceed from the following considerations. In the course of crystallization, it is the surface layer of the crystal and not the crystal core that is in equilibrium with the solution. This provision is used in models of crystal zoning formation during fractional crystallization, when “crystallization of minerals in surface equilibrium with the surrounding liquid” is presumed ([50], p. 2143). The equilibrium is to be understood in the sense of equality of chemical potentials, taking into account the difference of chemical potentials Δµ, which is necessary for growth that is as forced equilibrium under the action of extrinsic forcing factor [4]. This layer is structurally reconstructed and chemically modified into NAP, inseparable from the crystal matrix. An altered state of the layer is accounted for by the fact that the solid phase in equilibrium with the oversaturated solution is characterized by a higher chemical potential value than bulk solid phase in a saturated solution. The excess of μ can be realized both in changing the structure of the surface phase (for example, the degree of ordering or type of polymorphic modification), and in the change of its chemical composition (for example, absorption of admixture, which is incompatible with bulk structure). If several phases are jointly formed in the system, it is NAP rather than core sections that are in local phase equilibrium. The relative stability of such systems is due to the principle of continuity of phase formation on coexisting mineral surfaces, according to which NAP at different bulk phases are able to adapt to each other with the change of physicochemical conditions of growth [51]. Another important property of NAP is, as we saw above, the ability to absorb incompatible elements with distribution and co-crystallization coefficients greatly exceeding the equilibrium amounts for the bulk of crystals.
With NAP layer thickness increasing, there comes a time when adjacent to the matrix surface, sections lose their diffusive connection with oversaturated solution, and then part of the layer on the border is transformed into a matrix crystal structure following coherent or semi-coherent solid phase transformation. In the course of this process, structurally incompatible with the crystal matrix admixtures are isolated in the form of nano- and micro-inclusions prone to defects, pores and other imperfections of the transition zone. NAP has additional opportunities for accommodation of incompatible elements that is why the admixture partially remains in it, but its “excessive” part is withdrawn from the boundary layer on the surface, forming its own phases, including PM native forms (Figure 4). However, the admixture does not always reach the surface, so submicron and nano-size particles of the admixture form at the boundary. In any case, the distribution coefficient will be greatly overestimated for both the transition layer and NAP in total, as compared to crystal core. A similar effect is known in physical chemistry, it takes place during the separation of isotopes of simple ions of well-soluble salts, when there seems to be no obstacles to equalizing the composition by diffusion processes in the surface layer [52]. Nevertheless, it produces maximum effect on poorly soluble substances and incompatible admixtures, as shown above on the example of precious metals and rare earth elements in iron sulfides and oxides. It is important to realize that this phenomenon is thermodynamic and not kinetic in nature [52] and surface enrichment in the admixture should not be interpreted as diffusion zones, even if the admixture element forms a wide isomorphic mixture in the matrix crystal. This is a fundamentally important fact explaining the analogy of dependencies (Figure 3 and Figure 7) in laboratory and natural systems. A traditional kinetic interpretation of admixture segregation and micro-zonality (“oscillatory zoning”) of mineral crystals, based on Peclet’s growth number [53,54], unusable in case of incompatible elements such as PM, which may be partially reduced in the course of NAP evolution during aggregation of its nano-size fragments or decomposition caused by changing environment.
For pyrite, with its high nucleation energy, thermodynamically more preferable is growth through NAP represented, depending on the conditions (T, Δµ, fS2, fO2), by the phase close to marcasite, pyrrhotite or oxysulfide containing trivalent iron and sulfoxy-anions [10,55].
With a pyrite crystal growth rate in our experiments of about 5 × 10⁻¹⁰ m/s, ~500 nm thick NAP layer is formed for about 103 s. During this time, in the surface layer equilibrium may be established with oversaturated solution, since the diffusion mobility in surficial areas of crystal is higher than in crystal core. For instance, for pyrite at 500 °C “bulk” diffusion coefficients of Fe, S and sulfur vacancy VS are 3.7 × 10⁻¹⁹ [56], 2.1 × 10⁻²³ [57] and 1.8 × 10⁻¹⁹ m2/s [58], which correspond to the maximum diffusion lengths l of 27, 0.2 and 19 nm respectively. Calculations in density functional theory [58] provide for near-surface vacancies of sulfur the value of 1.5 × 10⁻¹⁶ m2/s, which corresponds to l ~ 550 nm, i.e., comparable with a NAP layer thickness [10]. The diffusion coefficients in the surface layer may be assumed higher for both Fe and S as well, which will ensure a state of chemical equilibrium of surficial NAP layer with oversaturated solution. However, a much lower diffusion coefficient of sulfur is probably the reason for its deficit in the layer and hence “pyrrhotite” stoichiometry of NAP under moderate fS2 values [10]. As regards magnetite, for stoichiometric crystal Fe diffusion coefficient extrapolated from high T to 500 °C is ~2 × 10⁻²¹ m2/s, which corresponds to l ~ 2 nm. However, with the deviation from stoichiometry it increases by several orders of magnitude, both with the rise, and fall of fO2 [59]. In defective oxyhydroxide NAP, it should be even higher to ensure that the ~330 nm thick surface layer establishes equilibrium with oversaturated solution [21].
The distribution of PM and REE is largely dependent on the composition of the NAP, which affects geochemical regularities. We saw above how partition and co-crystallization coefficients increase with superficially bound mode taken into account. On the other hand, the camouflage is possible, which creates an illusion of permanence of total distribution coefficients, since surface constituent mostly determines them. This is important in practical aspect, since higher as compared to determine PM content in surface layers of crystals growing according to the mechanism involving NAP participation. This mechanism appears to be the same for both experimental and natural ore formation systems. In the latter case, we deal with “hidden” metal content, which does not show in distinct forms—presence of proper PM phases and increased contents of PM in bulk samples. The gold and PGE Clarks in the Earth’s rocks are very low, and it is extremely difficult to explain their concentration in the deposits, unless we acknowledge that the mechanism of the process involves, firstly, the metal concentration within NAP, and, secondly, the subsequent NAP transformation with separation of nano-and micro-size PM forms. Thus, NAP are treated here as intermediate modes of concentration of rare and trace elements in geochemical systems.
The accumulation of PGE by NAP can explain the lack of their mineral (visible) forms together with the elevated content in black shale-hosted gold-ore deposits. This is practically important because gives motivation for PGE recovery accompanying gold ore processing.
The aggregation of virtually two-dimensional NAP, as well as their transformation to the bulk crystal structure, is accompanied by removal of the admixtures, which are incompatible with the matrix and preclude this transformation. They largely remain in intermediate meso-crystalline phases of submicron and micron-size [25]. We believe that the effect of surface enrichment in incompatible elements is largely accounted for by these phases. On the other hand, this means that microinclusions in minerals and, especially, on their surface may not reflect adequately the composition of mother liquor due to higher TE partition and co-crystallization coefficients for NAP, as described above.
The NAP sensitivity to the conditions of crystal formation is, on the one hand, an instrumental feature in determining these conditions. For instance, the pyrrhotite-like NAP almost does not occur on the surface of pyrite at high fS2 [10]. The oxyhydroxide NAP is also weakly developed at high Mn content at the surface of magnetite crystals. On the other hand, the observed similarities in surface composition and element valence states on magnetite and hematite reduce indicating capacities of this mineral pair in fO2 assessment, for example, by chemical state of Ce (Table 7). This can be an important consideration when interpreting Ce and Eu anomalies in determining the redox state and hydrothermal fluxes in the ancient oceans [60].
7. Conclusions
We suggest that the crystal growth mechanism specified by the agency of superficial nonautonomous phase operates both in experimental and natural hydrothermal systems because it has a thermodynamic rather than a kinetic nature. The important, although not exclusive, consequences are the dualism of partition and co-crystallization coefficients in the system “mineral–fluid” and so-called “hidden” metal content in hydrothermally grown ore minerals. The surficial D values are much greater than the structural ones for both the PM (Au, Pt and Pd) in pyrite, As-pyrite, hematite, magnetite, Mn-magnetite and REE (Ce, Eu, Er, Yb) in magnetite and hematite. Unexpectedly, except for Au in pyrite, the precious metals are found to be compatible in these minerals (>1) under hydrothermal conditions (450 and 500 °C, 1 kbar, NH4Cl-based solutions) even though only structural constituents are accounted for. The engagement of superficially bound modes makes these elements highly compatible although unsuitable to solving an inverse problem of metal content estimation in ore-forming fluids. This problem can be solved using only structurally bound constituents of element content. However, the comparison of experimental and natural data for pyrite from hydrothermal gold-ore deposits shows that the superficially bound mode can mask the structurally bound one producing the illusion that metal contents estimated from structural and superficial modes of trace element are close to one another. The evolution of NAP containing PM in chemically bound forms is accompanied by the exsolution of nano- and micro-sized phases including native PM forms. Therefore, NAPs can be considered as intermediate members in the chain of the PM concentration process from disseminated state in rocks to nuggets in high-grade deposits. The sensitivity of NAP to growth conditions allows principally predicting crystal surface composition and evaluation of trace element contents in different-size fractions. This is practically important for the analyses of ore samples and recovery processing of ore mineral resources. It should be taken into account that the behavior of indicative trace elements of variable valence like REE are dependent not only on physicochemical varieties (T, P, fO2) but on the presence and composition of NAP as well.
Author Contributions
V.L.T. formulated the problem, organized the research team, and guided the study and interpretation of results. S.V.L. processed and attributed the XPS spectra, organized REE ICP-MS analysis and data handling. N.V.S. participated in experimental program and processed the PM analytical data; R.G.K. provided natural samples and contributed to interpretations. All authors participated in writing the manuscript.
Funding
The research was performed within the frame of the state order project IX.124.3, No. 0350-2016-0025 and partly was funded by the Russian Foundation for Basic Research grants Nos. 18-05-00077, 16-05-00104 and 17-05-00095.
Acknowledgments
We thank Yury L. Mikhlin and Yury V. Shchegol’kov for operational assistance with XPS analyses. Chemical analyses were undertaken at the Common Use Center (CUC) of Isotope and Geochemical Studies in Vinogradov Institute of Geochemistry with assistance of I.Yu.Voronova. ICP-MS analyses were done at CUC of Ultramicroanalysis in Limnological Institute SB RAS with assistance of A.P.Chebykin. We thank the authorities of both centers for providing the possibility of this study. The contributions of D.N.Babkin and T.M.Pastushkova to experimental part of this study are greatly appreciated. The authors would like to thank Galina A. Palyanova and two anonymous reviewers for valuable comments.
Conflicts of Interest
The authors declare no conflicts of interest.
References
- Navrotsky, A. Thermodynamics of element partitioning: (1) Systematics of transition metals in crystalline and molten silicates and (2) Defect chemistry and the Henry’s law problem. Geochim. Cosmochim. Acta 1978, 42, 887–902. [Google Scholar] [CrossRef]
- Abramovich, M.G.; Shmakin, B.M.; Tauson, V.L.; Akimov, V.V. Mineral typochemistry: Anomalous trace-element concentrations in solid solutions with defect structures. Int. Geol. Rev. 1990, 32, 608–615. [Google Scholar] [CrossRef]
- Urusov, V.S.; Dudnikova, V.B. The trace-component trapping effect: Experimental evidence, theoretical interpretation, and geochemical applications. Geochim. Cosmochim. Acta 1998, 62, 1233–1240. [Google Scholar] [CrossRef]
- Tauson, V.L.; Akimov, V.V. Introduction to the theory of forced equilibria: General principles, basic concepts, and definitions. Geochim. Cosmochim. Acta 1997, 61, 4935–4943. [Google Scholar] [CrossRef]
- Jones, J.H. Thoughts and reminiscences on experimental trace element partitioning. Geochem. Perspect. 2016, 5, 147–251. [Google Scholar] [CrossRef]
- Hiraga, T.; Anderson, I.M.; Kohlstedt, D.L. Chemistry of grain boundaries in mantle rocks. Am. Mineral. 2003, 88, 1015–1019. [Google Scholar] [CrossRef]
- Toulhoat, H.; Digne, M.; Arrouvel, C.; Raybaud, P. DFT studies of fluid-mineral interactions at the molecular level: Examples and perspectives. Oil Gas Sci. Technol. Rev. IFP 2005, 60, 417–433. [Google Scholar] [CrossRef]
- Tauson, V.L.; Babkin, D.N.; Parkhomenko, I.Y.; Men’shikov, V.I.; Lipko, S.V.; Pastushkova, T.M. Distribution of heavy-metal (Hg, Cd, and Pb) chemical species between pyrite and hydrothermal solution. Geochem. Int. 2010, 48, 611–616. [Google Scholar] [CrossRef]
- Tauson, V.L.; Parkhomenko, I.Y.; Babkin, D.N.; Men’shikov, V.I.; Lustenberg, E.E. Cadmium and mercury uptake by galena crystals under hydrothermal growth: A spectroscopic and element thermo-release atomic absorption study. Eur. J. Mineral. 2005, 17, 599–610. [Google Scholar] [CrossRef]
- Tauson, V.L.; Babkin, D.N.; Lustenberg, E.E.; Lipko, S.V.; Parkhomenko, I.Y. Surface typochemistry of hydrothermal pyrite: Electron spectroscopic and scanning probe microscopic data. I. Synthetic pyrite. Geochem. Int. 2008, 46, 565–577. [Google Scholar] [CrossRef]
- Tauson, V.L.; Kravtsova, R.G.; Grebenshchikova, V.I.; Lustenberg, E.E.; Lipko, S.V. Surface typochemistry of hydrothermal pyrite: Electron spectroscopic and scanning probe microscopic data. II. Natural pyrite. Geochem. Int. 2009, 47, 231–243. [Google Scholar] [CrossRef]
- Tauson, V.L.; Kravtsova, R.G.; Smagunov, N.V.; Spiridonov, A.M.; Grebenshchikova, V.I.; Budyak, A.E. Structurally and superficially bound gold in pyrite from deposits of different genetic types. Russ. Geol. Geophys. 2014, 55, 273–289. [Google Scholar] [CrossRef]
- Bancroft, G.M.; Jean, G. Gold deposition at low temperature on sulfide minerals. Nature 1982, 298, 730–731. [Google Scholar] [CrossRef]
- Hyland, M.M.; Bancroft, G.M. An XPS study of gold deposition at low temperatures on sulphide minerals: Reducing agents. Geochim. Cosmochim. Acta 1989, 53, 367–372. [Google Scholar] [CrossRef]
- Scaini, M.J.; Bancroft, G.M.; Knipe, S.W. An XPS, AES, and SEM study of the interactions of gold and silver chloride species with PbS and FeS2: Comparison to natural samples. Geochim. Cosmochim. Acta 1997, 61, 1223–1231. [Google Scholar] [CrossRef]
- Tauson, V.L. Isomorphism and endocrypty: New approaches to study the behavior of trace elements in mineral systems. Russ. Geol. Geophys. 1999, 40, 1468–1474. [Google Scholar]
- Guevremont, J.M.; Strongin, D.R.; Schoonen, M.A.A. Thermal chemistry of H2S and H2O on the (100) plane of pyrite: Unique reactivity of defect sites. Am. Mineral. 1998, 83, 1246–1255. [Google Scholar] [CrossRef]
- Tauson, V.L.; Ovchinnikova, O.V.; Bessarabova, O.I.; Smagunov, N.V.; Pastushkova, T.M. Distribution of gold deposited under reducing adsorption from HAuCl4 solution on magnetite, sphalerite, and galena crystals. Russ. Geol. Geophys. 2000, 41, 1427–1430. [Google Scholar]
- Koneev, R.I.; Knalmatov, R.A.; Mun, Y.S. Nanomineralogy and nanogeochemistry of ores of Uzbekistan gold deposits. Zapiski Russ. Mineral. Obshchestva 2010, 139, 1–14. (In Russian) [Google Scholar] [CrossRef]
- Rusanov, A.I. Phase Equilibria and Surface Phenomena; Khimia: Leningrad, Russia, 1967. (In Russian) [Google Scholar]
- Tauson, V.L.; Babkin, D.N.; Pastushkova, T.M.; Krasnoshchekova, T.S.; Lustenberg, E.E.; Belozerova, O.Y. Dualistic distribution coefficients of elements in the system Mineral-Hydrothermal solution. I. Gold accumulation in pyrite. Geochem. Int. 2011, 49, 568–577. [Google Scholar] [CrossRef]
- Tauson, V.L.; Lipko, S.V.; Smagunov, N.V.; Arsent’ev, K.Y.; Loginov, B.A. Influence of surface nanophases on the processes of crystal formation in multiphase mineral systems. Dokl. Earth Sci. 2014, 455, 317–322. [Google Scholar] [CrossRef]
- Tauson, V.L.; Babkin, D.N.; Pastushkova, T.M.; Akimov, V.V.; Krasnoshchekova, T.S.; Lipko, S.V.; Belozerova, O.Y. Dualistic distribution coefficients of elements in the system Mineral-Hydrothermal solution. II. Gold in magnetite. Geochem. Int. 2012, 50, 227–245. [Google Scholar] [CrossRef]
- Tauson, V.L.; Babkin, D.N.; Pastushkova, T.M.; Smagunov, N.V.; Lipko, S.V.; Voronova, I.Y.; Men’shikov, V.I.; Bryanskii, N.V.; Arsent’ev, K.Y. Dualistic distribution coefficients of trace elements in the system Mineral-Hydrothermal solution. III. Precious metals (Au and Pd) in magnetite and manganmagnetite. Geochem. Int. 2016, 54, 149–166. [Google Scholar] [CrossRef]
- Tauson, V.L.; Lipko, S.V.; Arsent’ev, K.Y.; Mikhlin, Y.L.; Babkin, D.N.; Smagunov, N.V.; Pastushkova, T.M.; Voronova, I.Y.; Belozerova, O.Y. Dualistic distribution coefficients of trace elements in the system Mineral-Hydrothermal solution. IV. Platinum and silver in pyrite. Geochem. Int. 2017, 55, 753–774. [Google Scholar] [CrossRef]
- Tauson, V.L. Gold solubility in the common gold-bearing minerals: Experimental evaluation and application to pyrite. Eur. J. Mineral. 1999, 11, 937–947. [Google Scholar] [CrossRef]
- Goldfarb, R.J.; Groves, D.I. Orogenic gold: Common or evolving fluid and metal sources through time. Lithos 2015, 233, 2–26. [Google Scholar] [CrossRef]
- Gaboury, D. Does gold in orogenic deposits come from pyrite in deeply buried carbon-rich sediments? Insight from volatiles in fluid inclusions. Geology 2013, 41, 1207–1210. [Google Scholar] [CrossRef]
- Tauson, V.L.; Akimov, V.V.; Lipko, S.V.; Spiridonov, A.M.; Budyak, A.E.; Belozerova, O.Y.; Smagunov, N.V. Typomorphism of pyrite of the Sukhoi Log deposit (East Siberia). Russ. Geol. Geophys. 2015, 56, 1394–1413. [Google Scholar] [CrossRef]
- Arifulov, C.H.; Arsentieva, I.V.; Shchegolkov, Y.V. About the long-prism pyrite in gold-bearing black shale deposits of the Kirovsko-Kvarkenskiy ore district, East Orenburg region. Rudy I Met. 2011, 5, 78–84. (In Russian) [Google Scholar]
- Bloomstein, E.L.; Kydd, R.A.; Levinson, A.A. Development of ammonium geochemistry as a new technique in precious and base metals exploration. J. Geochem. Explor. 1987, 29, 386. [Google Scholar] [CrossRef]
- Men’shikov, V.I.; Voronova, I.Y.; Proidakova, O.A.; Malysheva, S.F.; Ivanova, N.I.; Belogorlova, N.A.; Gusarova, N.K.; Trofimov, B.A. Preconcentration of gold, silver, palladium, platinum, and ruthenium with organophosphorus extractants. Russ. J. Appl. Chem. 2009, 82, 183–189. [Google Scholar] [CrossRef]
- Tauson, V.L.; Lipko, S.V. Pyrite as a concentrator of gold in laboratory and natural systems: A surface-related effect. In Pyrite: Synthesis, Characterization and Uses; Whitley, N., Vinsen, P.T., Eds.; Nova Science Publishers: Hauppauge, NY, USA, 2013; Chapter 1; pp. 1–40. [Google Scholar]
- Palenik, C.S.; Utsunomiya, S.; Reich, M.; Kesler, S.E.; Wang, L.; Ewing, R.C. Invisible gold revealed: Direct imaging of gold nanoparticles in a Carlin-type deposit. Am. Mineral. 2004, 89, 1359–1366. [Google Scholar] [CrossRef]
- Tauson, V.L.; Lustenberg, E.E. Quantitative determination of modes of gold occurrence in minerals by the statistical analysis of analytical data samplings. Geochem. Int. 2008, 46, 423–428. [Google Scholar] [CrossRef]
- Tauson, V.L.; Babkin, D.N.; Akimov, V.V.; Lipko, S.V.; Smagunov, N.V.; Parkhomenko, I.Y. Trace elements as indicators of the physicochemical conditions of mineral formation in hydrothermal sulfide systems. Russ. Geol. Geophys. 2013, 54, 526–543. [Google Scholar] [CrossRef]
- Bolanz, R.M.; Kiefer, S.; Göttlicher, J.; Steininger, R. Hematite (α-Fe2O3)—A potential Ce4+ carrier in red mud. Sci. Total Envirn. 2018, 622–623, 849–860. [Google Scholar] [CrossRef] [PubMed]
- Naumkin, A.V.; Kraut-Vass, A.; Gaarenstroom, S.W.; Powell, C.J. NIST X-ray Photoelectron Spectroscopy Database. 2012. Available online: https://srdata.nist.gov/xps/EnergyTypeValSrch.aspx (accessed on 25 June 2018).
- Moulder, J.E.; Sticle, W.F.; Sobol, P.E.; Bomben, K.D. Handbook of X-ray Photoelectron Spectroscopy; Perkin-Elmer Corp.: Eden Prairie, MN, USA, 1992. [Google Scholar]
- Grosvenor, A.P.; Kobe, B.A.; Biesinger, M.C.; McIntyre, N.S. Investigation of multiplet splitting of Fe 2p XPS spectra and bonding in iron compounds. Surf. Interface Anal. 2004, 36, 1564–1574. [Google Scholar] [CrossRef]
- Groves, D.I.; Goldfarb, R.J.; Gebre-Mariam, M.; Hagemann, S.G.; Robert, F. Orogenic gold deposits: A proposed classification in the context of their crustul distributoin and relationship to other gold deposit types. Ore Geol. Rev. 1998, 13, 7–27. [Google Scholar] [CrossRef]
- Goncharov, V.I.; Voroshin, S.V.; Sidorov, V.A. Natalkinskoe Gold-Ore Deposit; North-East Complex Research Institute, Far-East Branch of RAS: Magadan, Russia, 2002. (In Russian) [Google Scholar]
- Goryachev, N.A.; Vikent’eva, O.V.; Bortnikov, N.S.; Prokof’ev, V.Y.; Alpatov, V.A.; Golub, V.V. The world-class Natalka gold deposit, Northeast Russia: REE patterns, fluid inclusions, stable oxygen isotopes, and formation conditions of ore. Geol. Ore Depos. 2008, 50, 362–390. [Google Scholar] [CrossRef]
- Mikhailov, B.K.; Struzhkov, S.F.; Natalenko, M.V.; Cimbalyuk, N.V. Multifactor model of large-volume gold-ore deposit Degdekan (Magadan region). Otechestvennaya Geol. 2010, 2, 20–31. [Google Scholar]
- Khanchuk, A.I.; Plyusnina, L.P.; Nikitenko, E.M.; Kuzmina, T.V.; Barinov, N.N. The noble metal distribution in the black shales of the Degdekan gold deposit in Northeast Russia. Russ. J. Pacif. Geol. 2011, 5, 89–96. [Google Scholar] [CrossRef]
- Palenova, E.E.; Belogub, E.V.; Novoselov, K.A.; Zabotina, M.V. Mineralogical and geochemical characteristics of gold-ore hosting carbonaceous series of Artemovskyi ore cluster (Bodaibo region). Izv. SO RAEN. Geol. Prosp. Explor. Ore Depos. 2013, 43, 29–36. (In Russian) [Google Scholar]
- Palenova, E.E.; Kotliarov, V.A.; Belogub, E.V.; Yuminov, A.M.; Zateeva, P.A. Formation conditions of gold-ore objects of Artemovskyi ore cluster (Bodaibo region). Vopr. Estestvoznaniya 2015, 3, 53–56. (In Russian) [Google Scholar]
- Smythe, D.J.; Brenan, J.M. Magmatic oxygen fugacity estimated using zircon-melt partitioning of cerium. Earth Planet. Sci. Lett. 2016, 453, 260–266. [Google Scholar] [CrossRef]
- Smythe, D.J.; Brenan, J.M. Cerium oxidation state in silicate melts: Combined fO2, temperature and compositional effect. Geochim. Cosmochim. Acta 2015, 170, 173–187. [Google Scholar] [CrossRef]
- Nishimura, K. A trace-element geochemistry model for imperfect fractional crystallization associated with the development of crystal zoning. Geochim. Cosmochim. Acta 2009, 73, 2142–2149. [Google Scholar] [CrossRef]
- Tauson, V.L. The principle of continuity of phase formation at mineral surfaces. Dokl. Earth Sci. 2009, 425, 471–475. [Google Scholar] [CrossRef]
- Bochkarev, A.V.; Trefilova, A.N.; Bobrov, M.F.; Tsurkov, N.A. Isotope separation during ionic crystal growth from solution. Russ. J. Phys. Chem. 2003, 77, 1868–1872. [Google Scholar]
- Burton, J.A.; Prim, R.C.; Slichter, W.P. The distribution of solute in crystals grown from the melt. Part I. Theoretical. J. Chem. Phys. 1953, 21, 1987–1991. [Google Scholar] [CrossRef]
- Watson, E.B. Surface enrichment and trace-element uptake during crystal growth. Geochim. Cosmochim. Acta 1996, 60, 5013–5020. [Google Scholar] [CrossRef]
- Graham, U.M.; Ohmoto, H. Experimental study of formation mechanisms of hydrothermal pyrite. Geochim. Cosmochim. Acta 1994, 58, 2187–2202. [Google Scholar] [CrossRef]
- Chen, J.H.; Harvey, W.W. Cation self-diffusion in chalcopyrite and pyrite. Met. Trans. B 1975, 6, 331–339. [Google Scholar] [CrossRef]
- Watson, E.B.; Cherniak, D.J.; Frank, E.A. Retention of biosignatures and mass-independent fractionations in pyrite: Self-diffusion of sulfur. Geochim. Cosmochim. Acta 2009, 73, 4792–4802. [Google Scholar] [CrossRef]
- Zhang, Y.N.; Law, M.; Wu, R.Q. Atomic modeling of sulfur vacancy diffusion near iron pyrite surfaces. J. Phys. Chem. C 2015, 119, 24859–24864. [Google Scholar] [CrossRef]
- Hallström, S.; Höglund, L.; Ågren, J. Modeling of iron diffusion in the iron oxides magnetite and hematite with variable stoichiometry. Acta Mater. 2011, 59, 53–60. [Google Scholar] [CrossRef]
- Alibert, C. Rare earth elements in Hamersley BIF minerals. Geochim. Cosmochim. Acta 2016, 184, 311–328. [Google Scholar] [CrossRef]
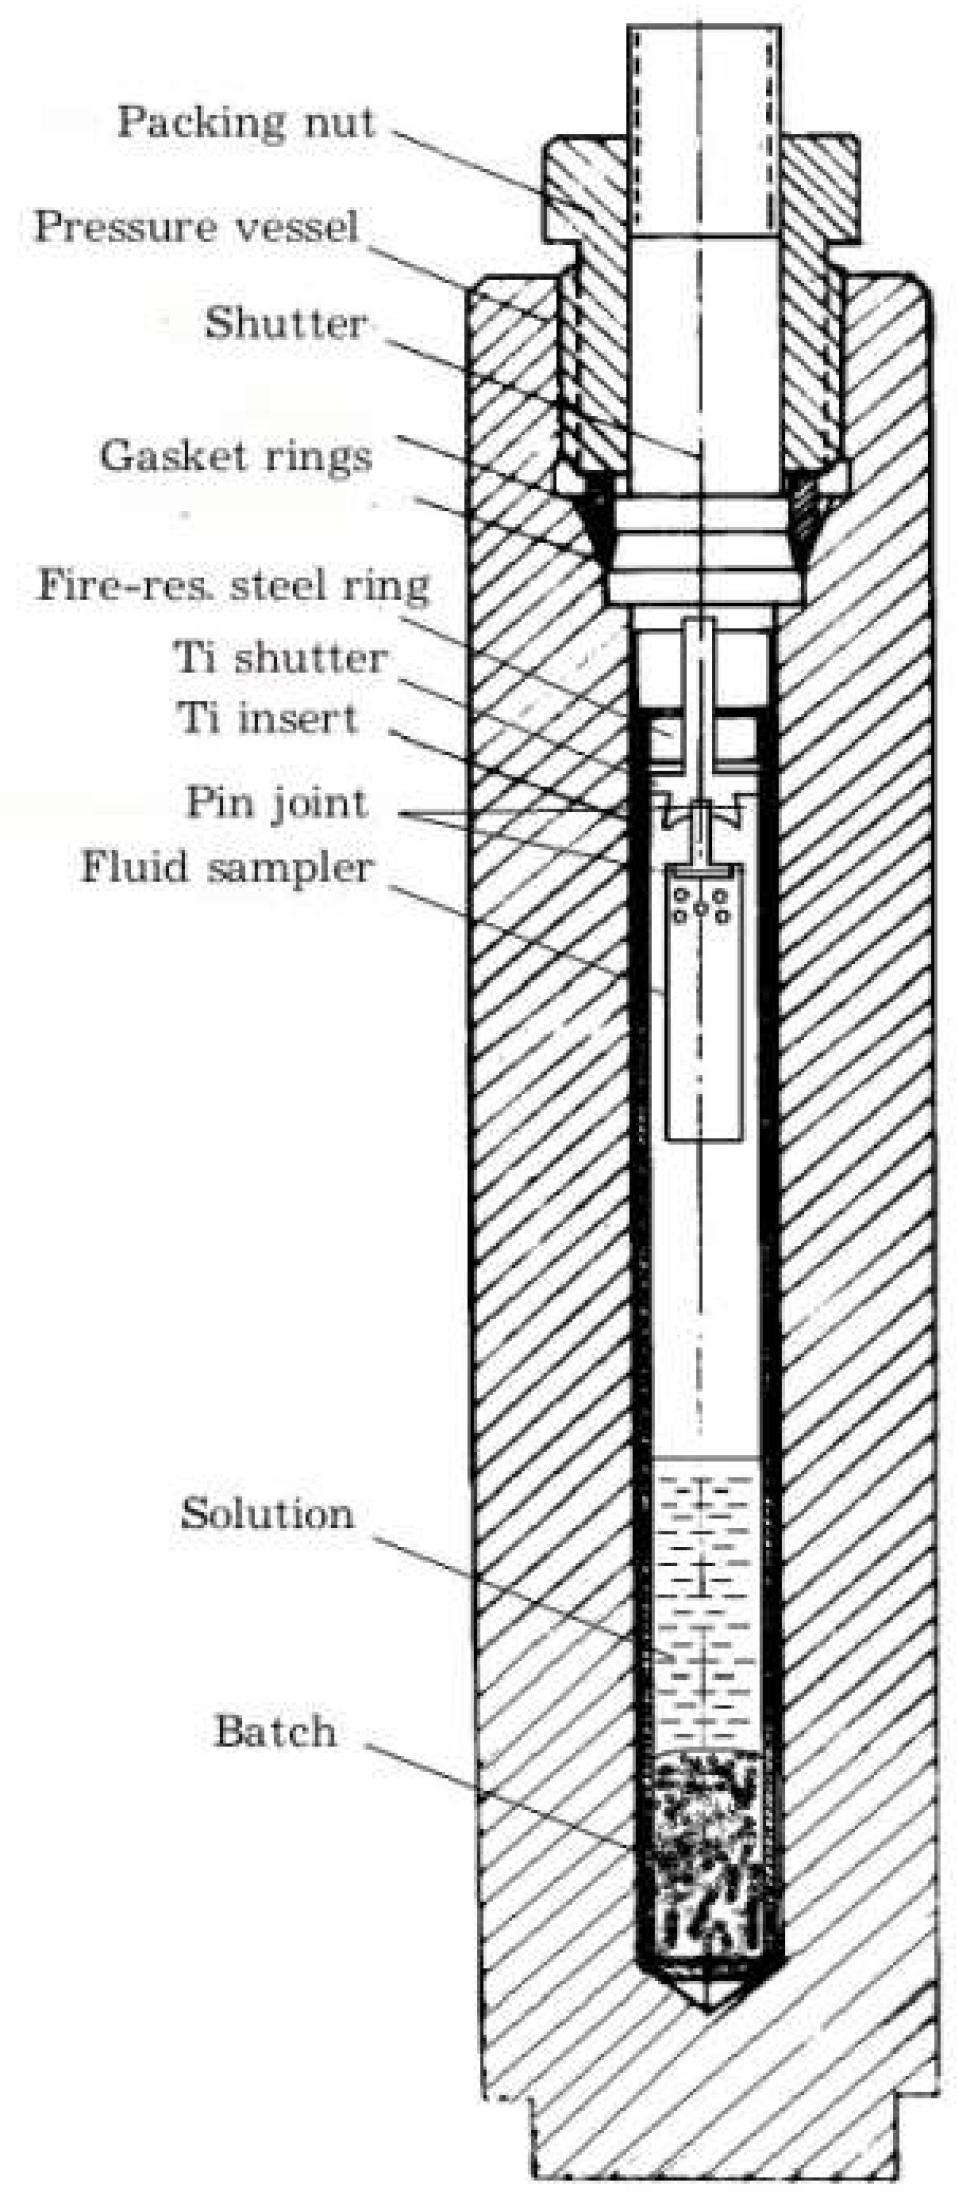
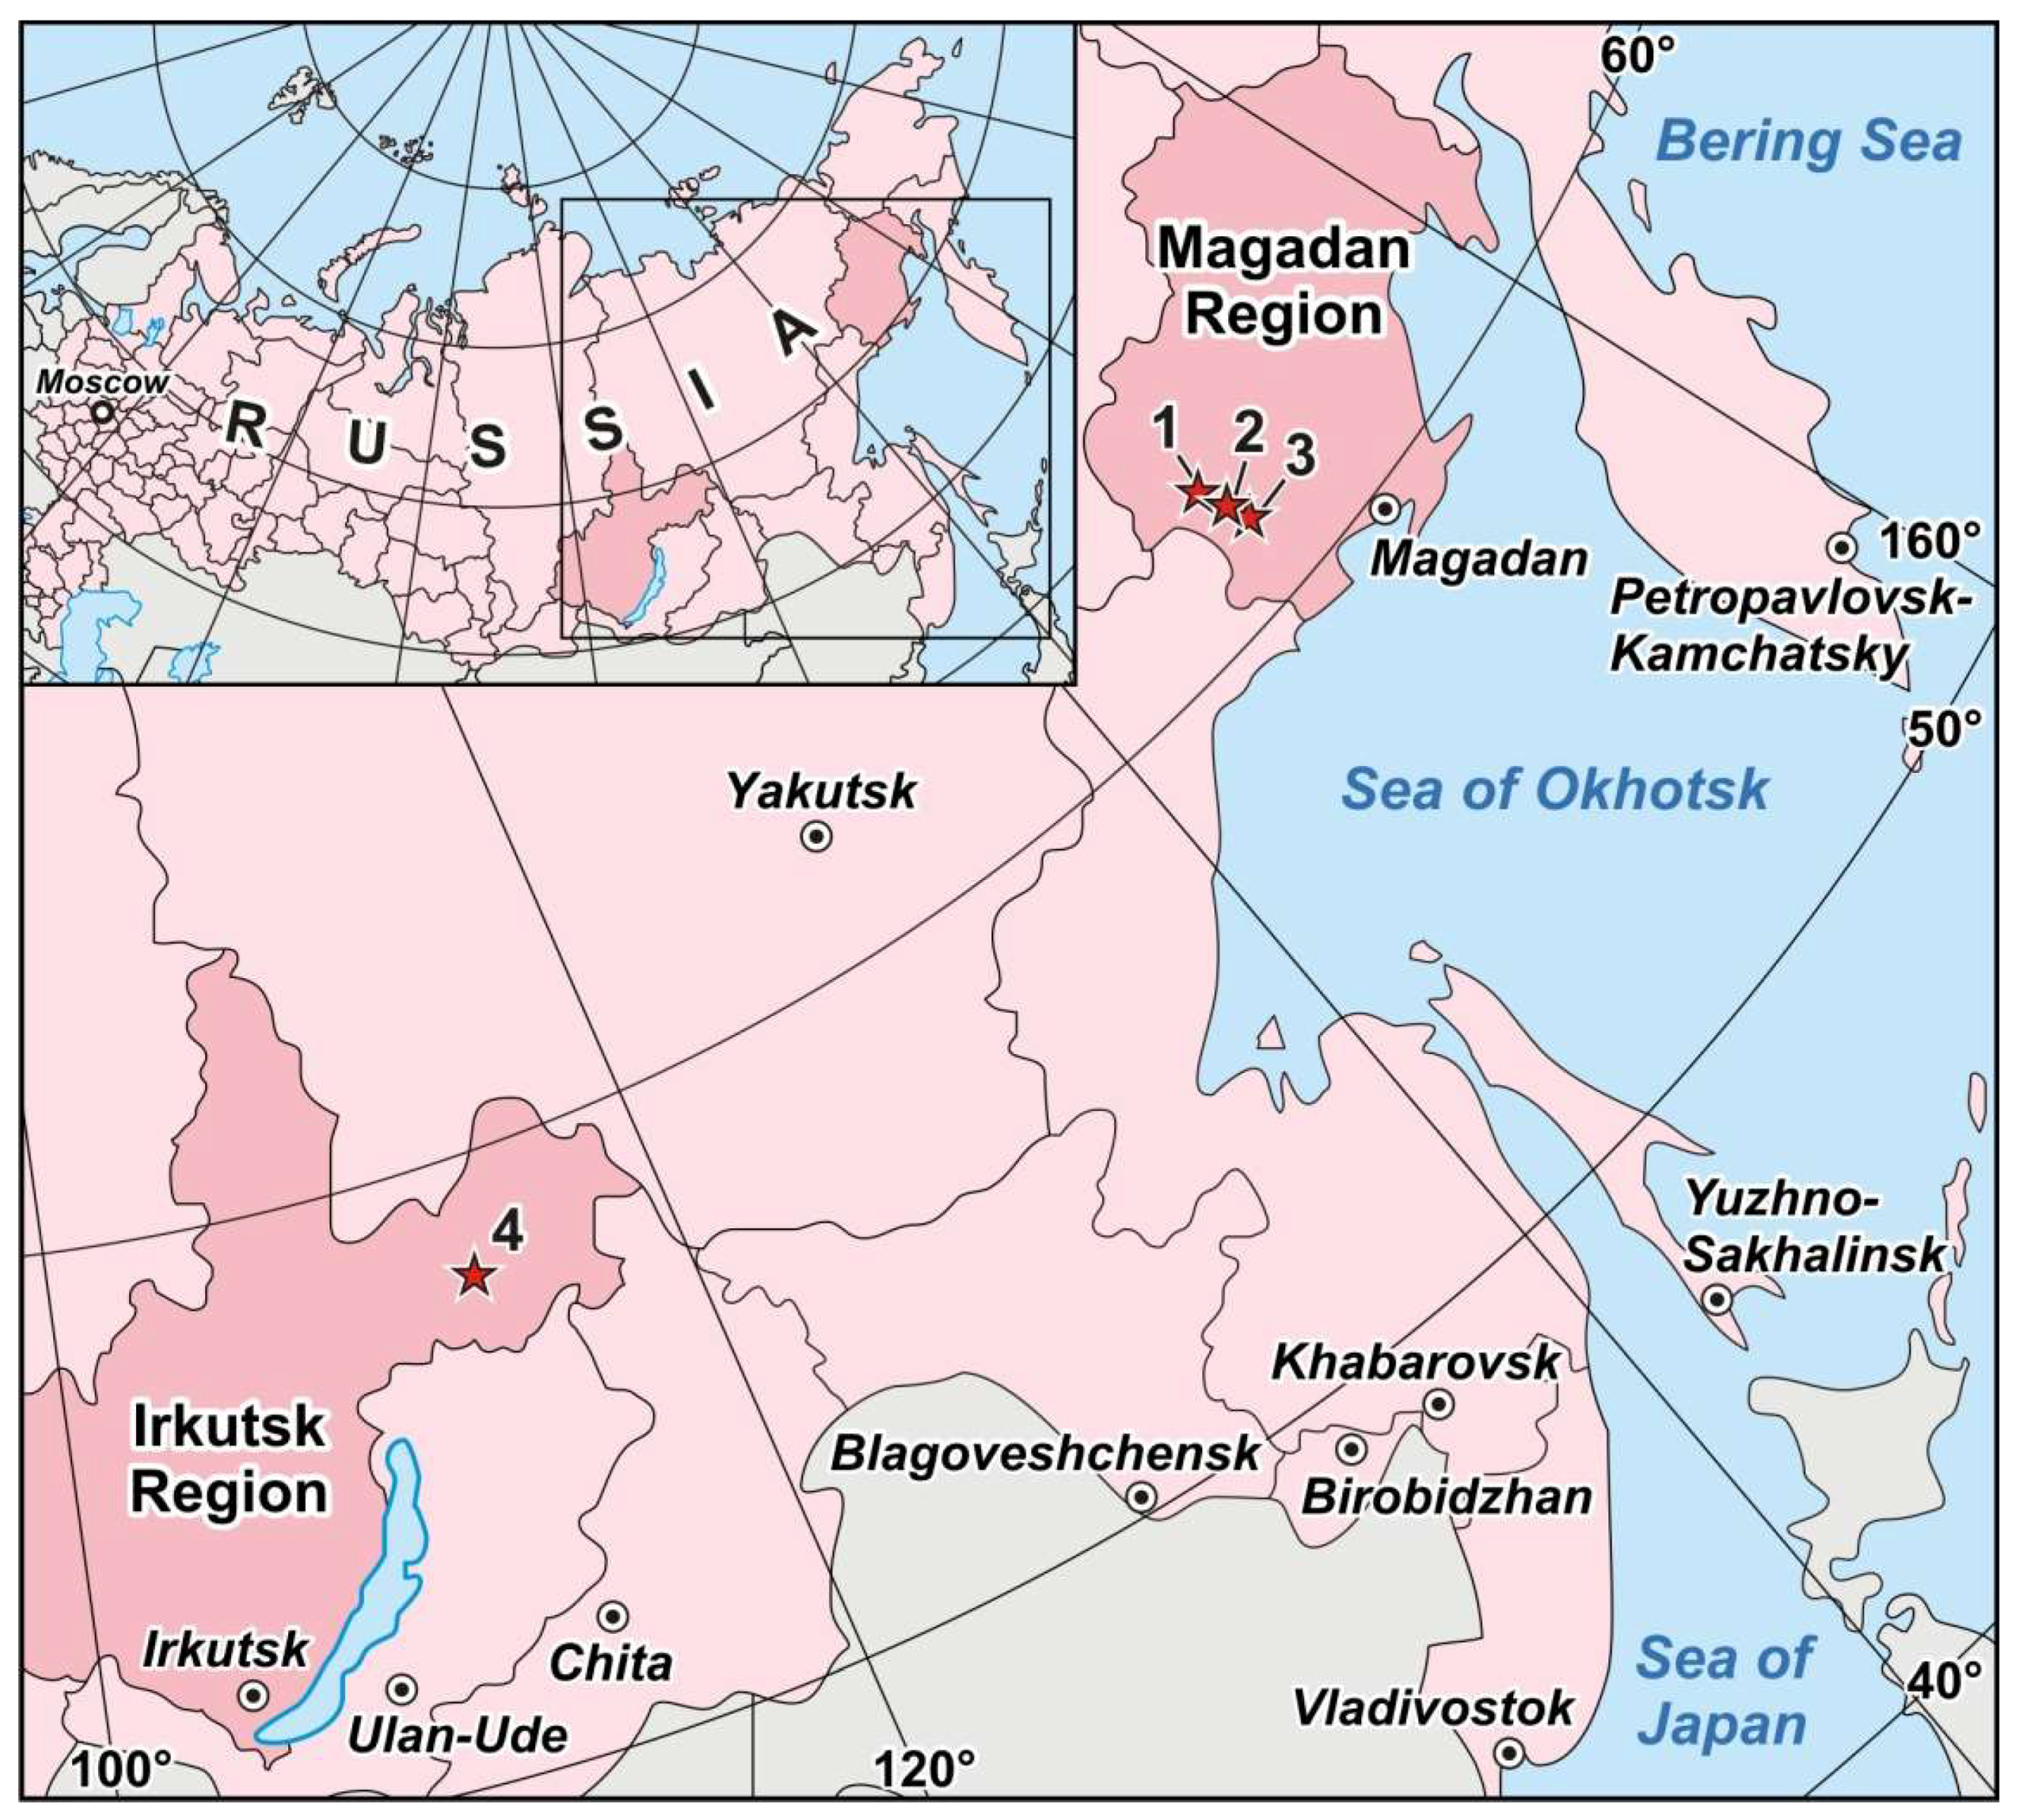

© 2018 by the authors. Licensee MDPI, Basel, Switzerland. This article is an open access article distributed under the terms and conditions of the Creative Commons Attribution (CC BY) license (http://creativecommons.org/licenses/by/4.0/).