3.1. Occurrence and Morphology
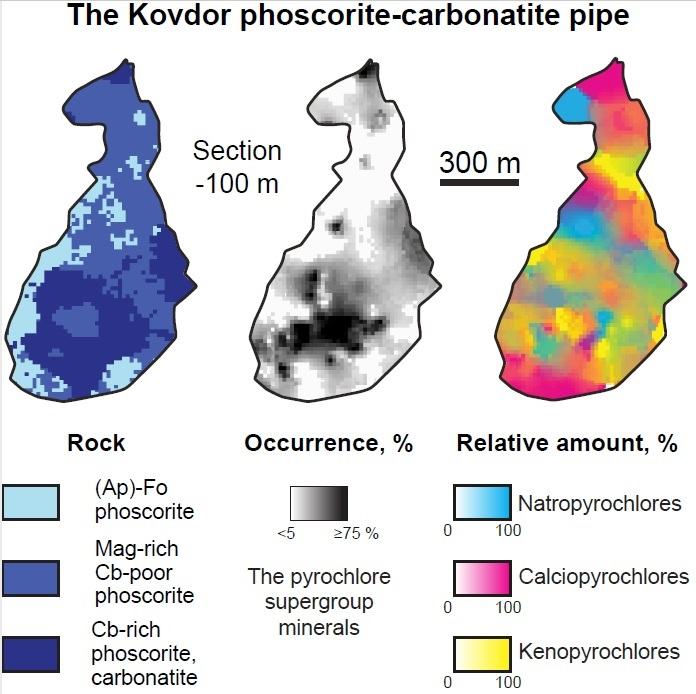
The pyrochlore supergroup minerals are common accessories in all rocks of the Kovdor alkaline-ultrabasic massif. The occurrence and content of PSM decrease from host foidolite and diopsidite–phlogopitite to earlier (apatite)-forsterite phoscorite, and then increase to intermediate phoscorite and, finally, to the latest carbonatites (
Table 2). In the phoscorite-carbonatite complex, the pyrochlore supergroup minerals result mainly from the alteration of Nb-rich baddeleyite formed in the pipe axial zone due to the substitution 2Zr
4+ ↔ Sc
3+Nb
5+. On this reason, the pyrochlore areal coincides with that of Sc-Nb-rich baddeleyite (
Figure 1). Carbonate-rich phoscorite and carbonatites enriched in PSM form an intensive radioactive anomaly (about 200 m in diameter and >900 m in depth), known as the “Anomalous Zone” [
1]. Content of pyrochlore in rocks of the “Anomalous Zone” gradually increases with depth at the account of baddeleyite [
27].
The pyrochlore group minerals, namely oxycalciopyrochlore (OCP), oxynatropyrochlore (ONP), hydroxycalciopyrochlore (HCP), hydroxynatropyrochlore (HNP), hydroxykenopyrochlore (HKP), fluorcalciopyrochlore (FCP), fluornatropyrochlore (FNP) and fluorkenopyrochlore (FKP), are common in foidolite, diopsidite, phlogopitite, phoscorite and carbonatite (OCP, HCP and HNP are predominant). Minerals of microlite and betafite groups play a subordinate role, mainly, as separate parts of PSM inhomogeneous crystals. Oxycalciobetafite (OCB) and its cation-deficient analogue occur in phoscorite and carbonatite of the ore-pipe intermediate and axial zones; while fluorcalciomicrolite (FCM), hydroxycalciomicrolite (HCM) and hydroxykenomicrolite (HKM) are found only in calcite-rich phoscorite and calcite carbonatite.
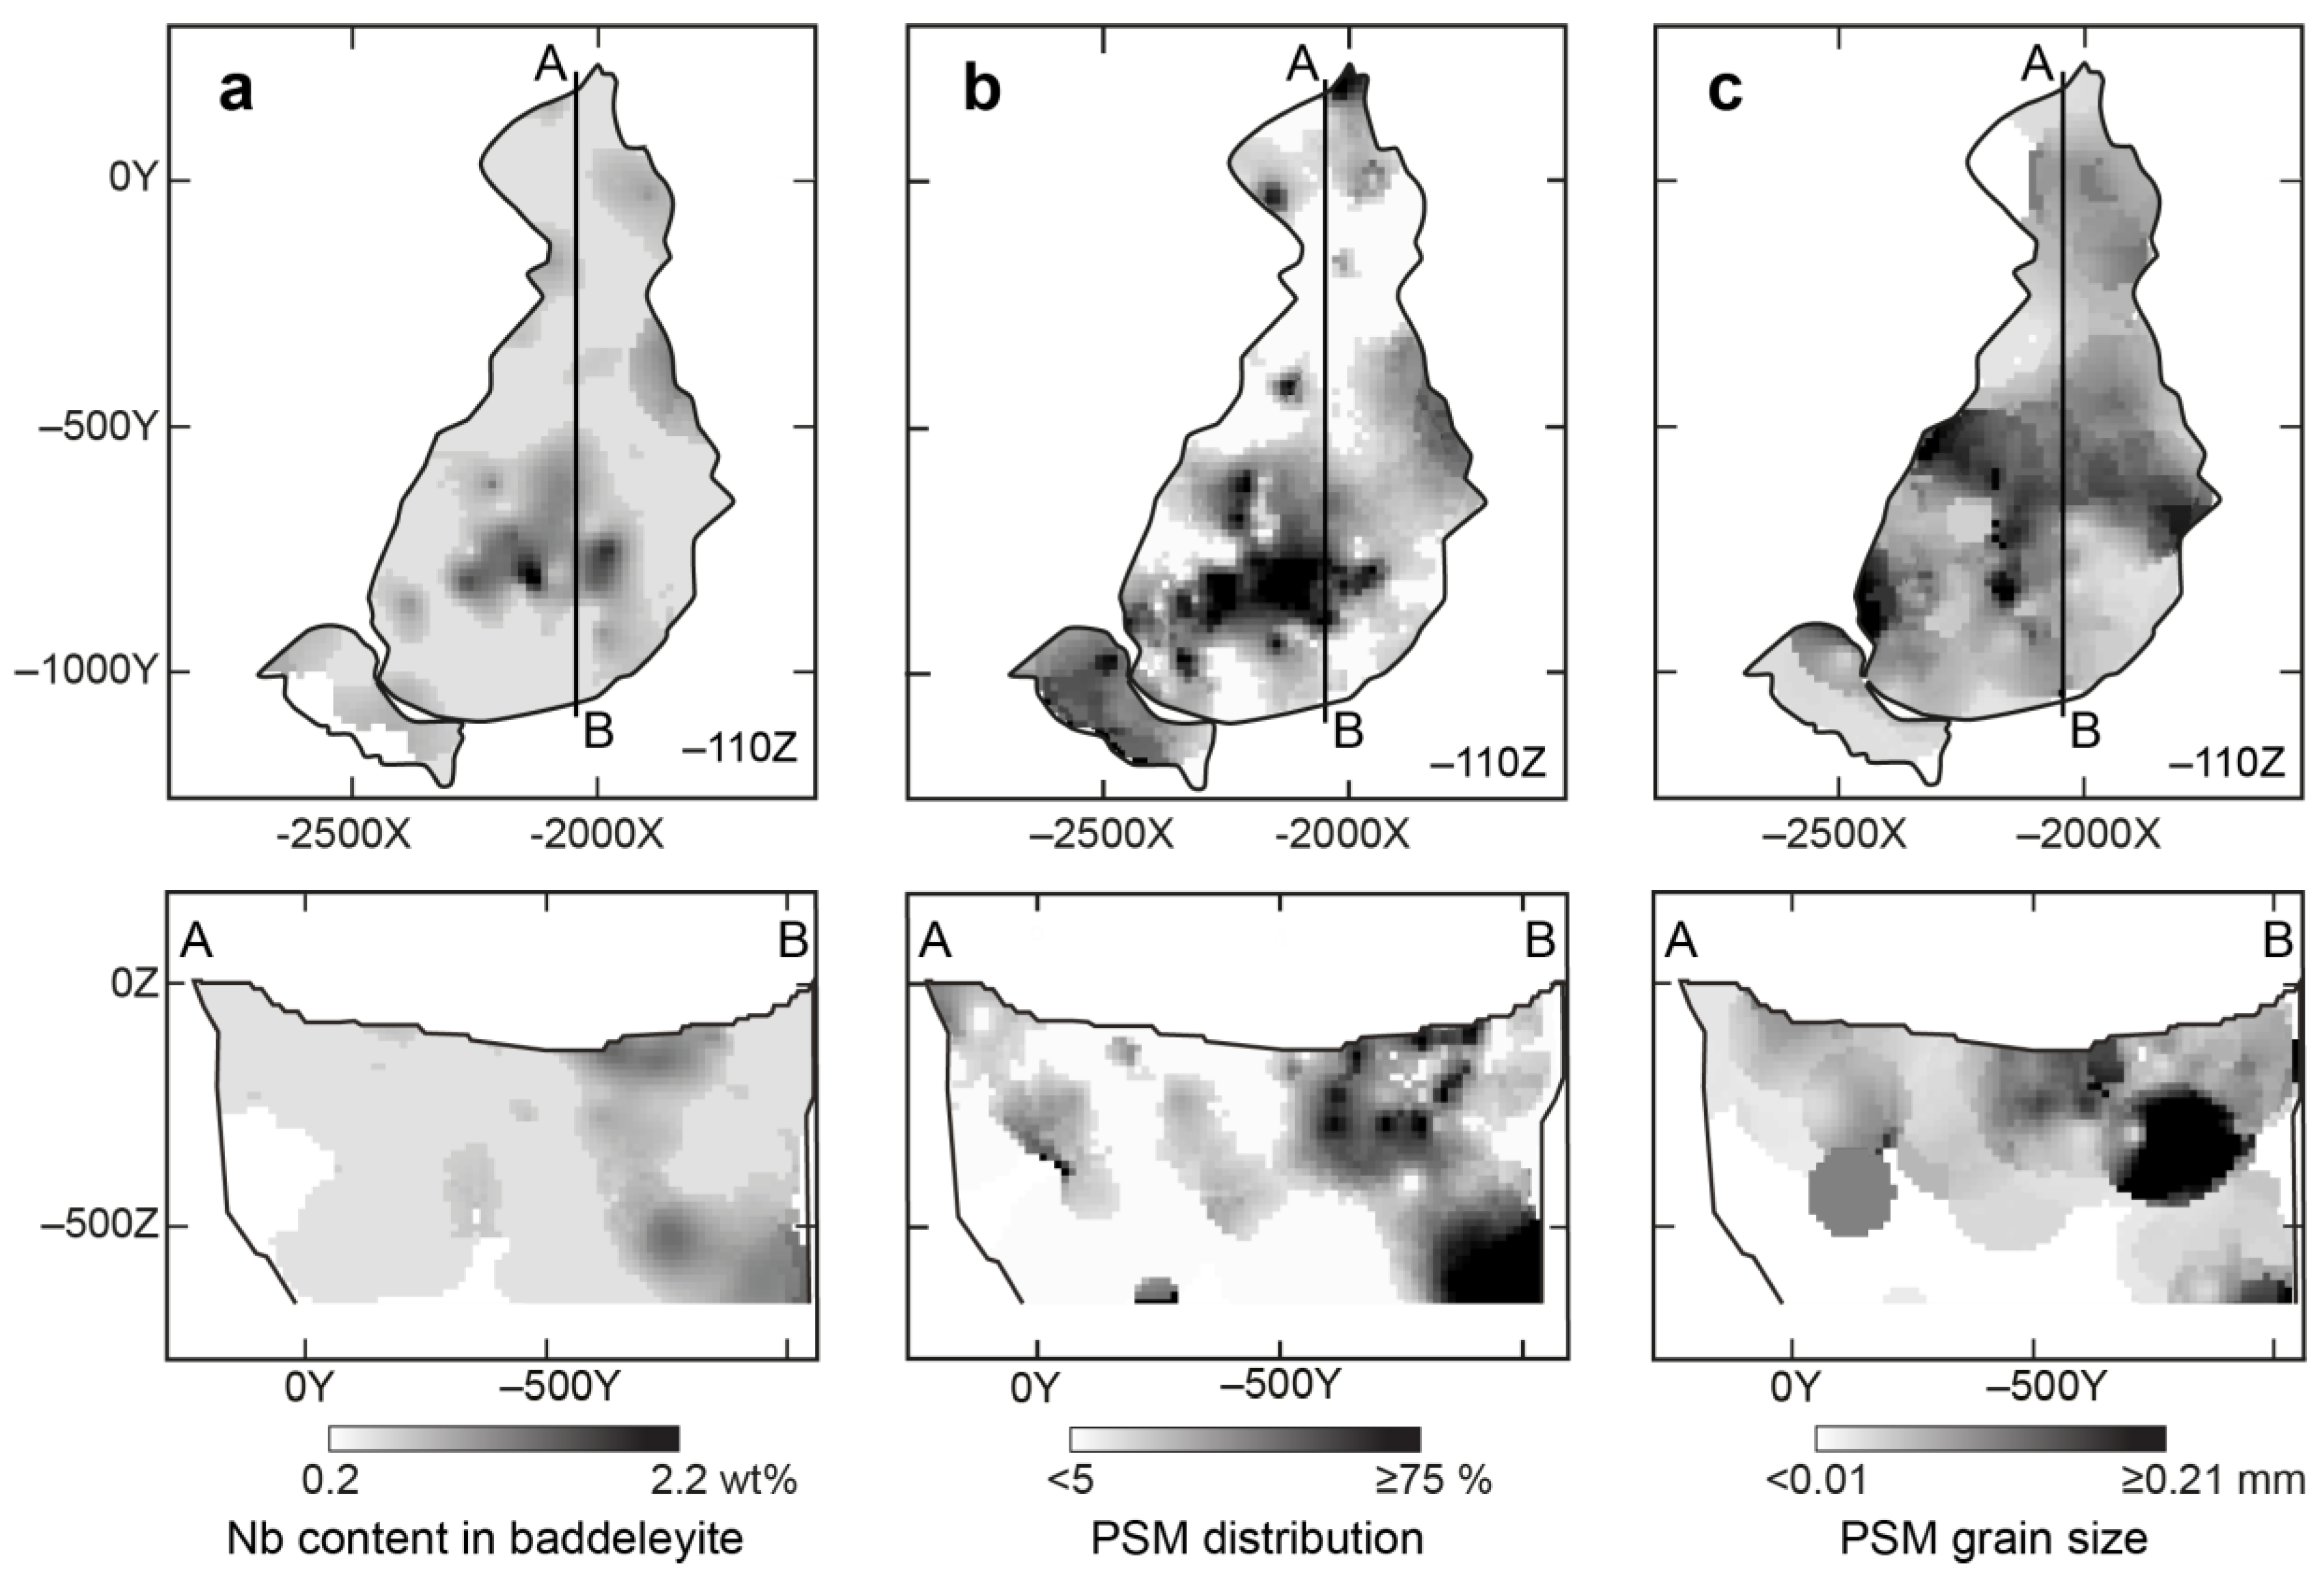
Within the phoscorite-carbonatite complex, the equivalent circle diameter of the analyzed PSM grains widely varies from 1 to 1000 µm (see
Table 2) increasing from host foidolite and diopsidite to marginal (apatite)-forsterite phoscorite, and then to intermediate low-carbonate magnetite-rich phoscorite and axial calcite-rich phoscorite and carbonatite (see
Figure 1c). In fact, the PSM grain size is proportional to their content in the rock: in PSM-poor rocks, there are small (up to 100 µm in diameter) separate grains of these minerals; while PSM-rich rocks contain irregularly-shaped and lens-like segregations, bands and veinlets of much larger (up to 1 mm in diameter) crystals of the pyrochlore supergroup minerals.
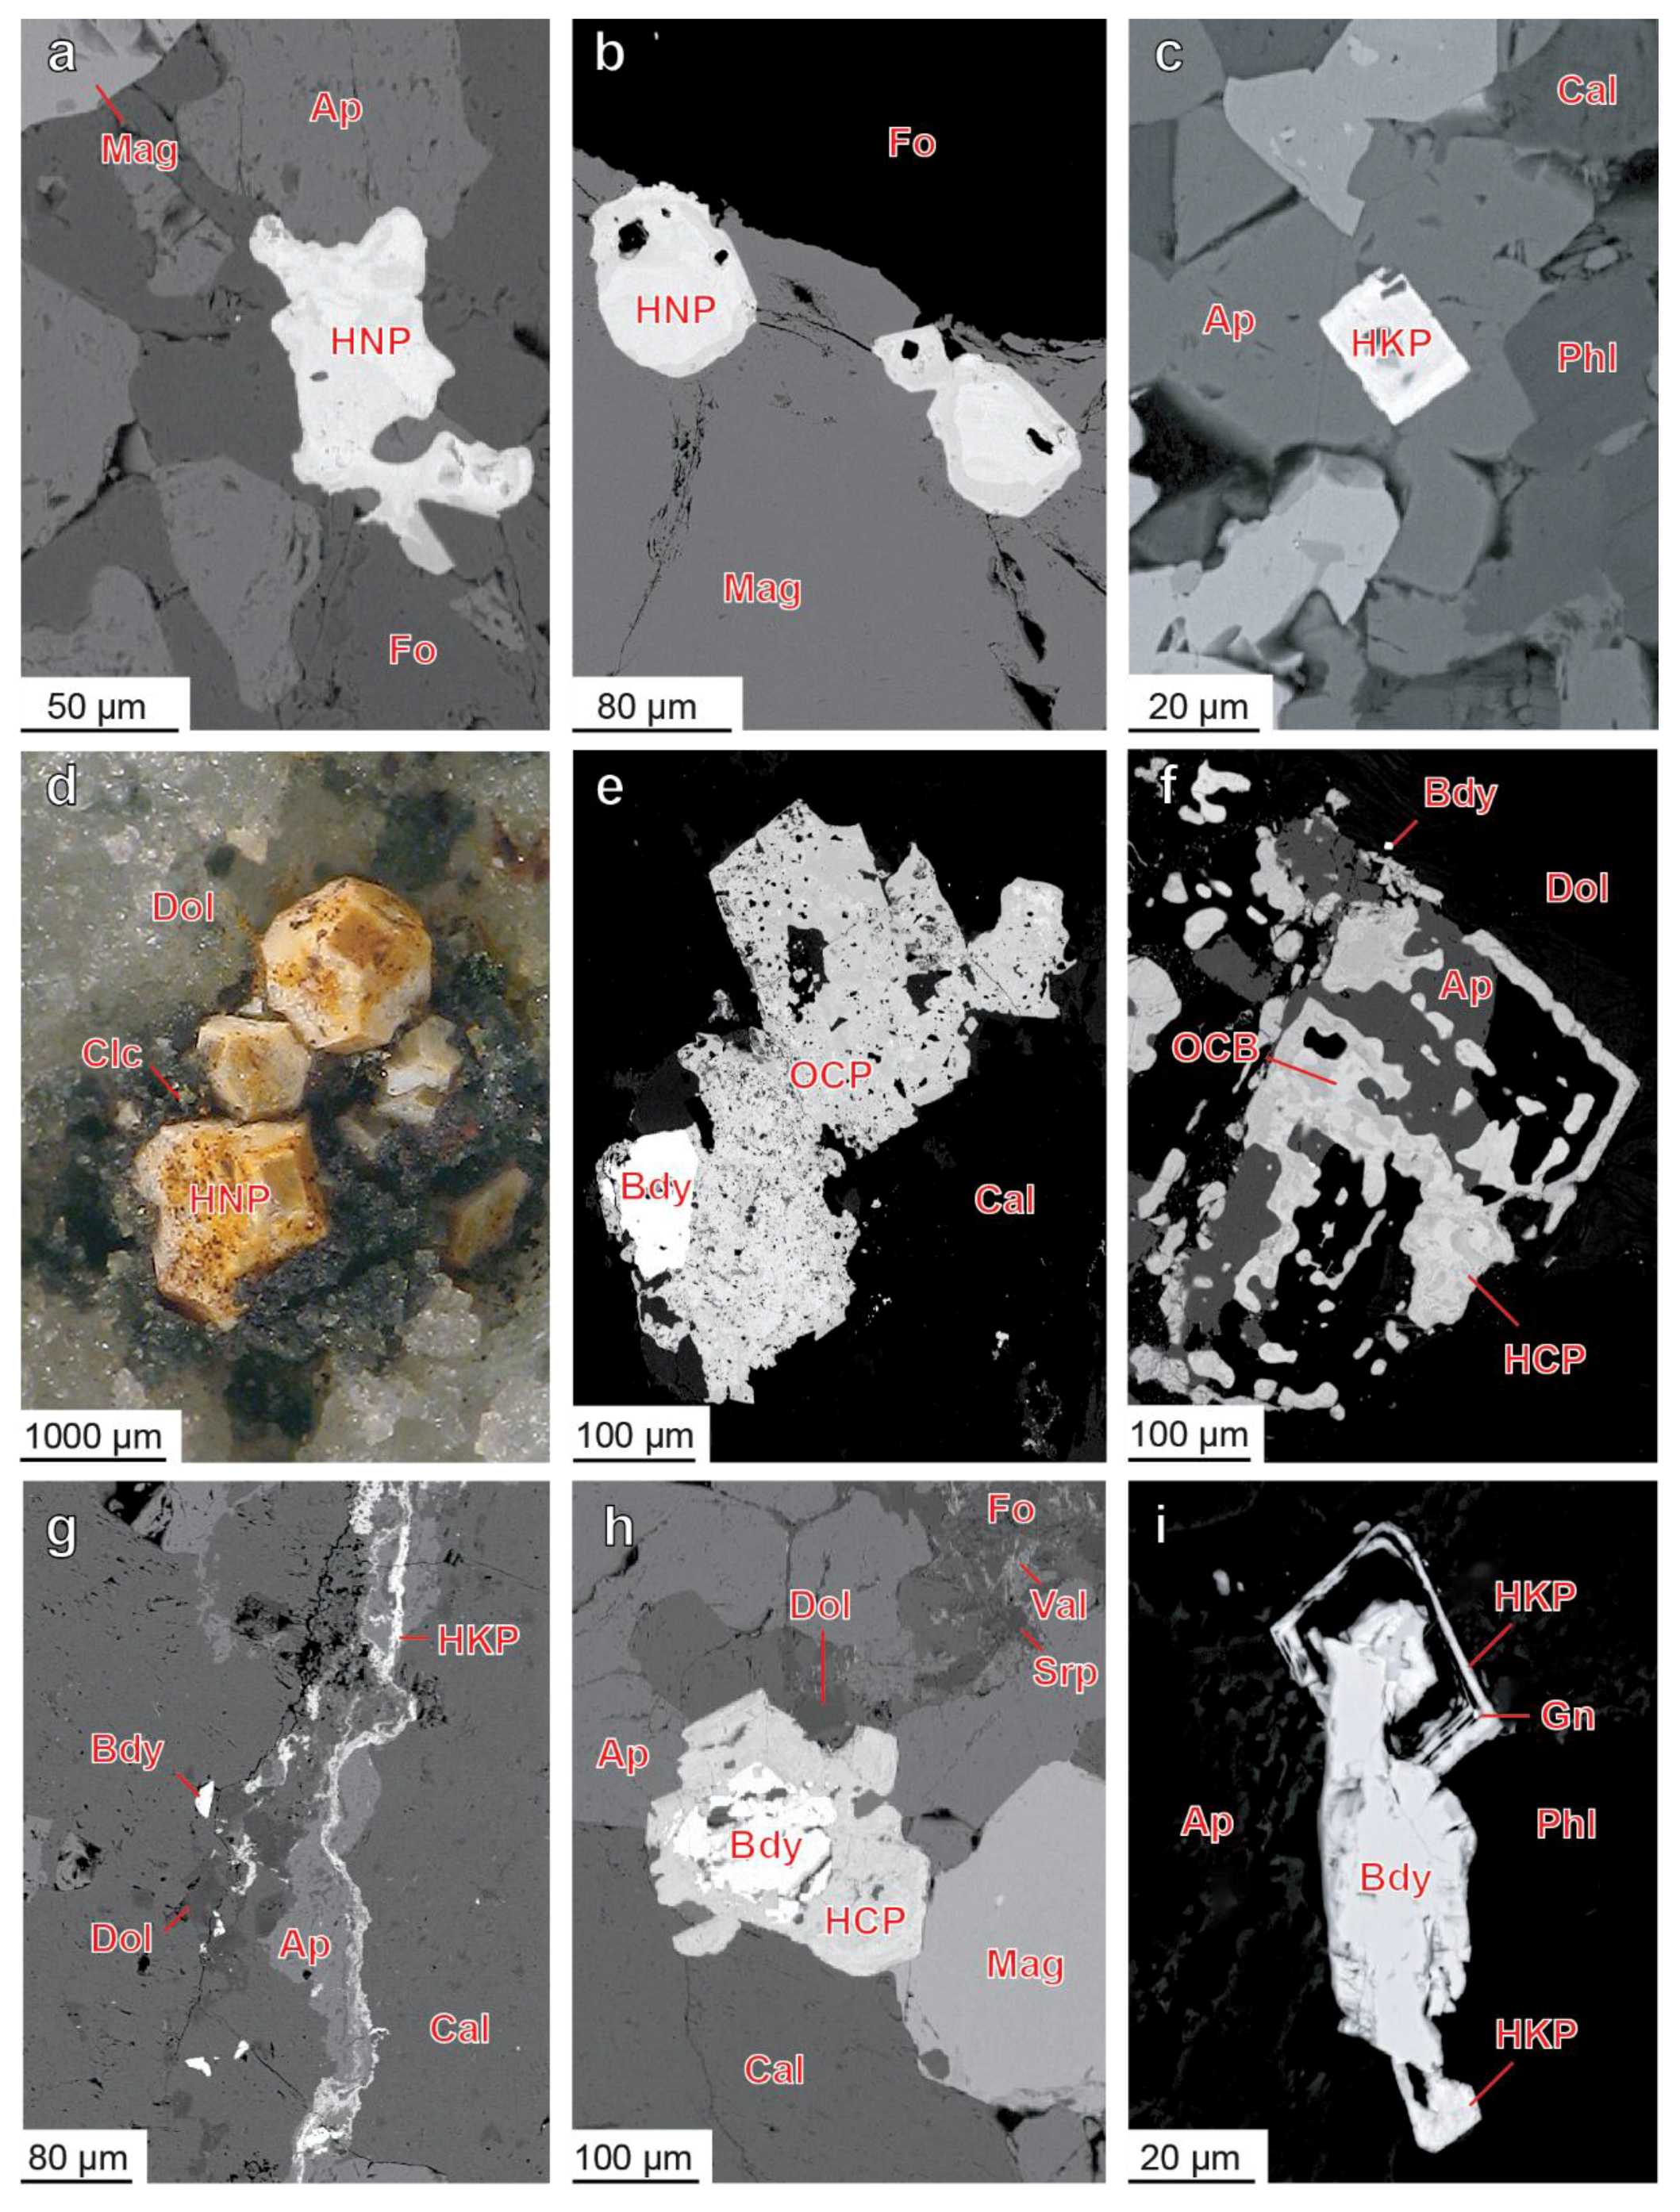
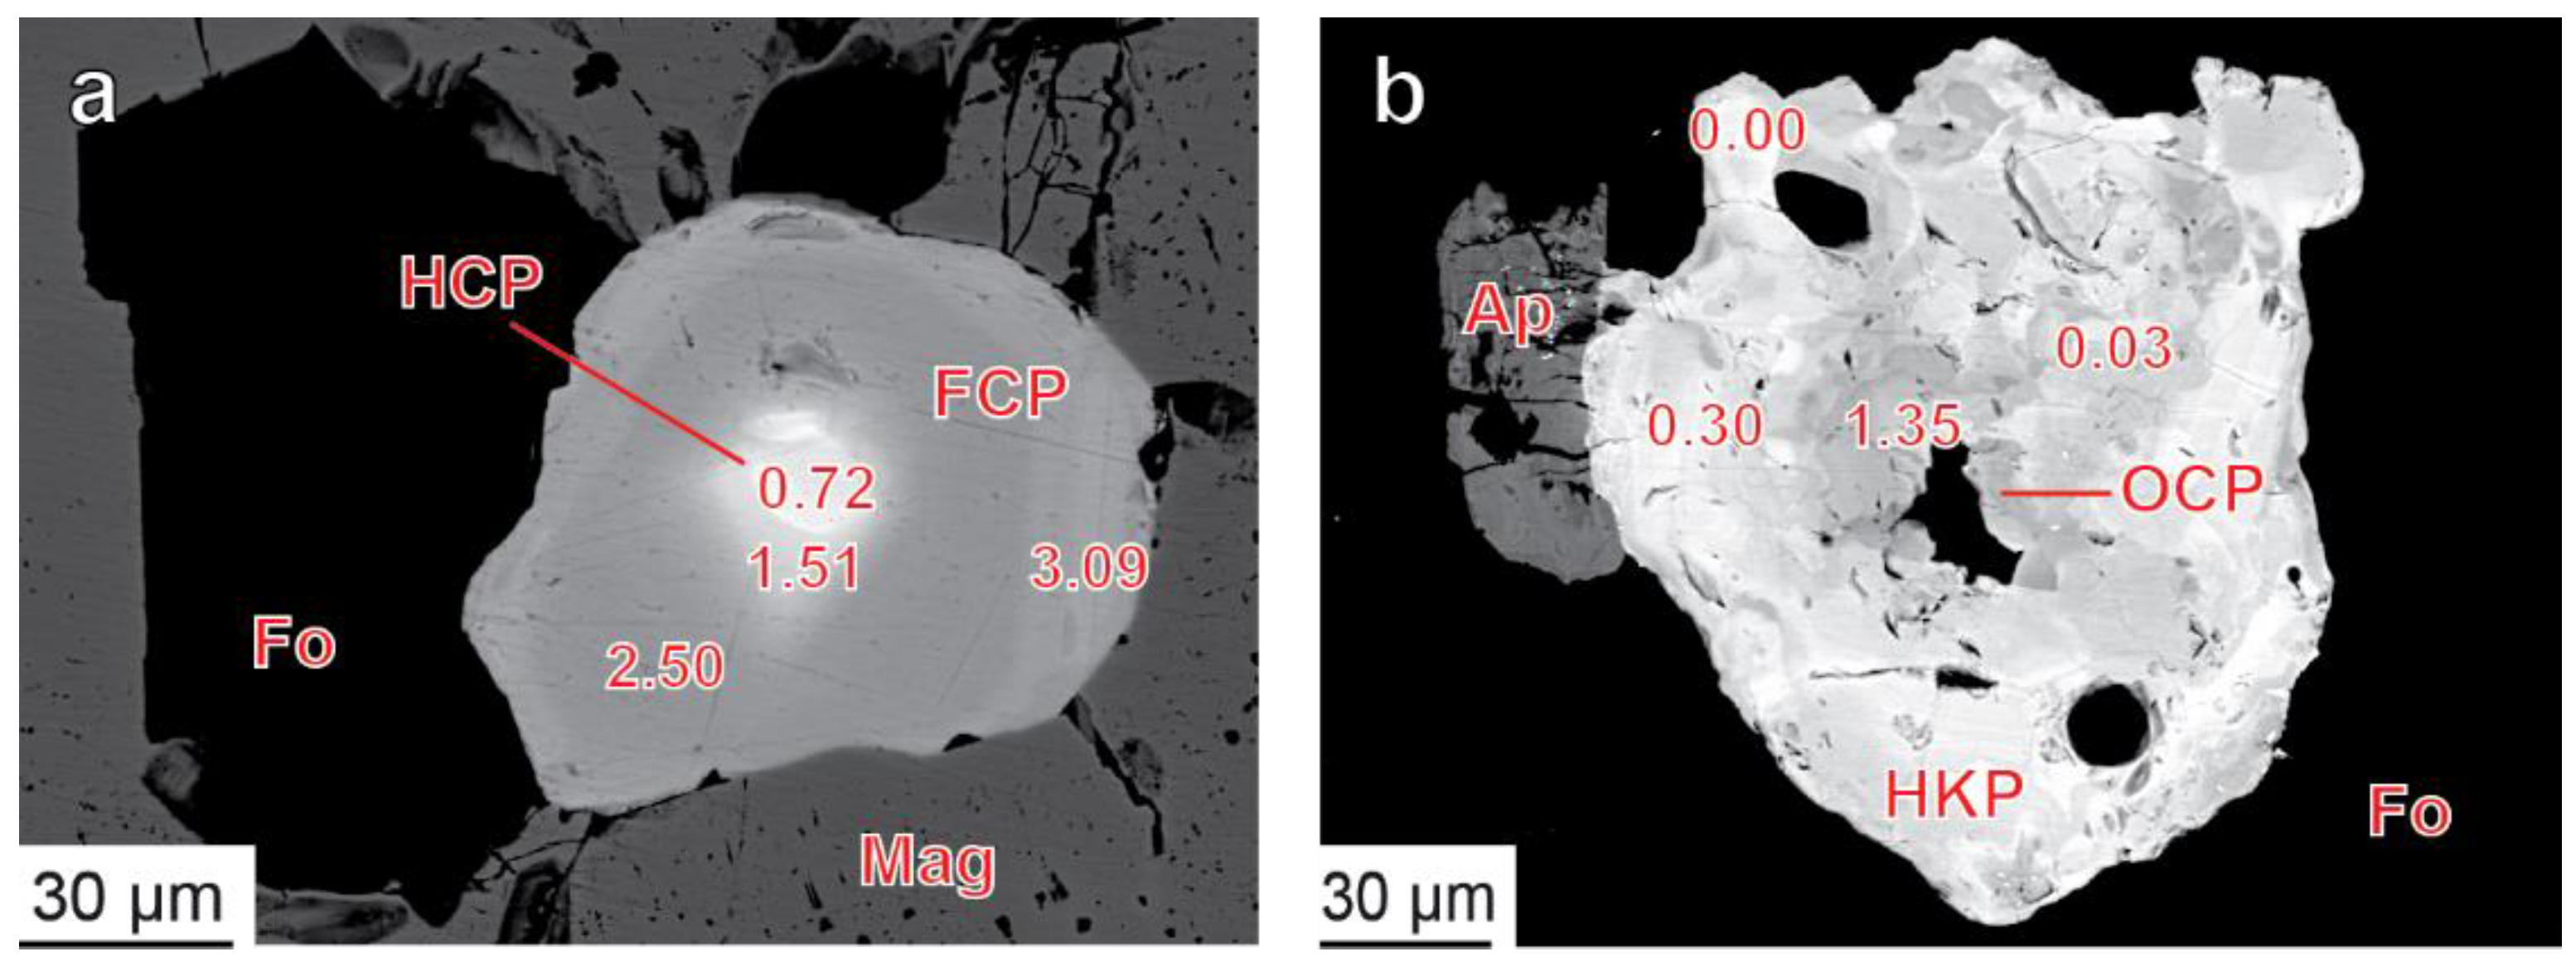
The morphology and microstructure of pyrochlore particles show different aspects, such as irregularly shaped and rounded grains (
Figure 2a,b), idiomorphic octahedral, cubic, cubooctahedral and truncated octahedral crystals (
Figure 2c–e), poikilitic and skeletal (meta)crystals (
Figure 2e,f), veinlets and filling of fractures (
Figure 2g), rims around baddeleyite and lueshite grains followed by partial pseudomorphs (
Figure 2h), epitaxial intergrowth with baddeleyite (
Figure 2i), as well as the finest inclusions in exsolved titanomagnetite. In all rocks of the phoscorite-carbonatite complex, there are zoned PSM crystals with primary regular zonation corresponding to crystal shape, secondary irregular zoning caused by mineral alteration, and both of these zoning types, which is typical for PSM from carbonatites [
28]. The primary zoning is caused usually by increases of Ca, Ta, Ti, Zr and F contents from the crystal core to rim at the expense of Na, Th, U, REE, Nb and (OH) amounts. Secondary zoning appears, first of all, due to leaching of Na, Ca and F from marginal parts of metamict grains of U-Th-rich PSM. Sometimes, separate zones of one crystal are formed by different minerals of the pyrochlore supergroup (see
Figure 2f).
Irregularly shaped and drop-like yellowish-brown pyrochlore grains dominate in host silicate rocks and carbonate-poor phoscorite (see
Figure 2a); while in carbonate-rich phoscorite and related carbonatite, they also form dark brown truncated octahedral crystals, sometimes with baddeleyite relics (see
Figure 2e,i). In calcite carbonatite veins, there are reddish-brown to creamy and yellow octahedral, cubic, truncated octahedral and cubooctahedral crystals of pyrochlores (see
Figure 2c), and their close intergrowth with baddeleyite and zirconolite [
1,
4,
29,
30]. In vein dolomite carbonatite, yellow to brown truncated octahedral to cubic pyrochlore crystals (see
Figure 2d) occur in voids in typical association with zircon and endemic phosphates [
1,
27,
31,
32]. Betafite group minerals occur as separate irregularly shaped, drop-like and ellipsoidal grains (up to 100 µm) or form marginal zones of pyrochlore crystals (see
Figure 2d) and rims around baddeleyite grains. Microlite group members form marginal zones of pyrochlore crystals and inclusions (up to 20 µm in diameter) in zirconolite, titanomagnetite and exsolution ilmenite.
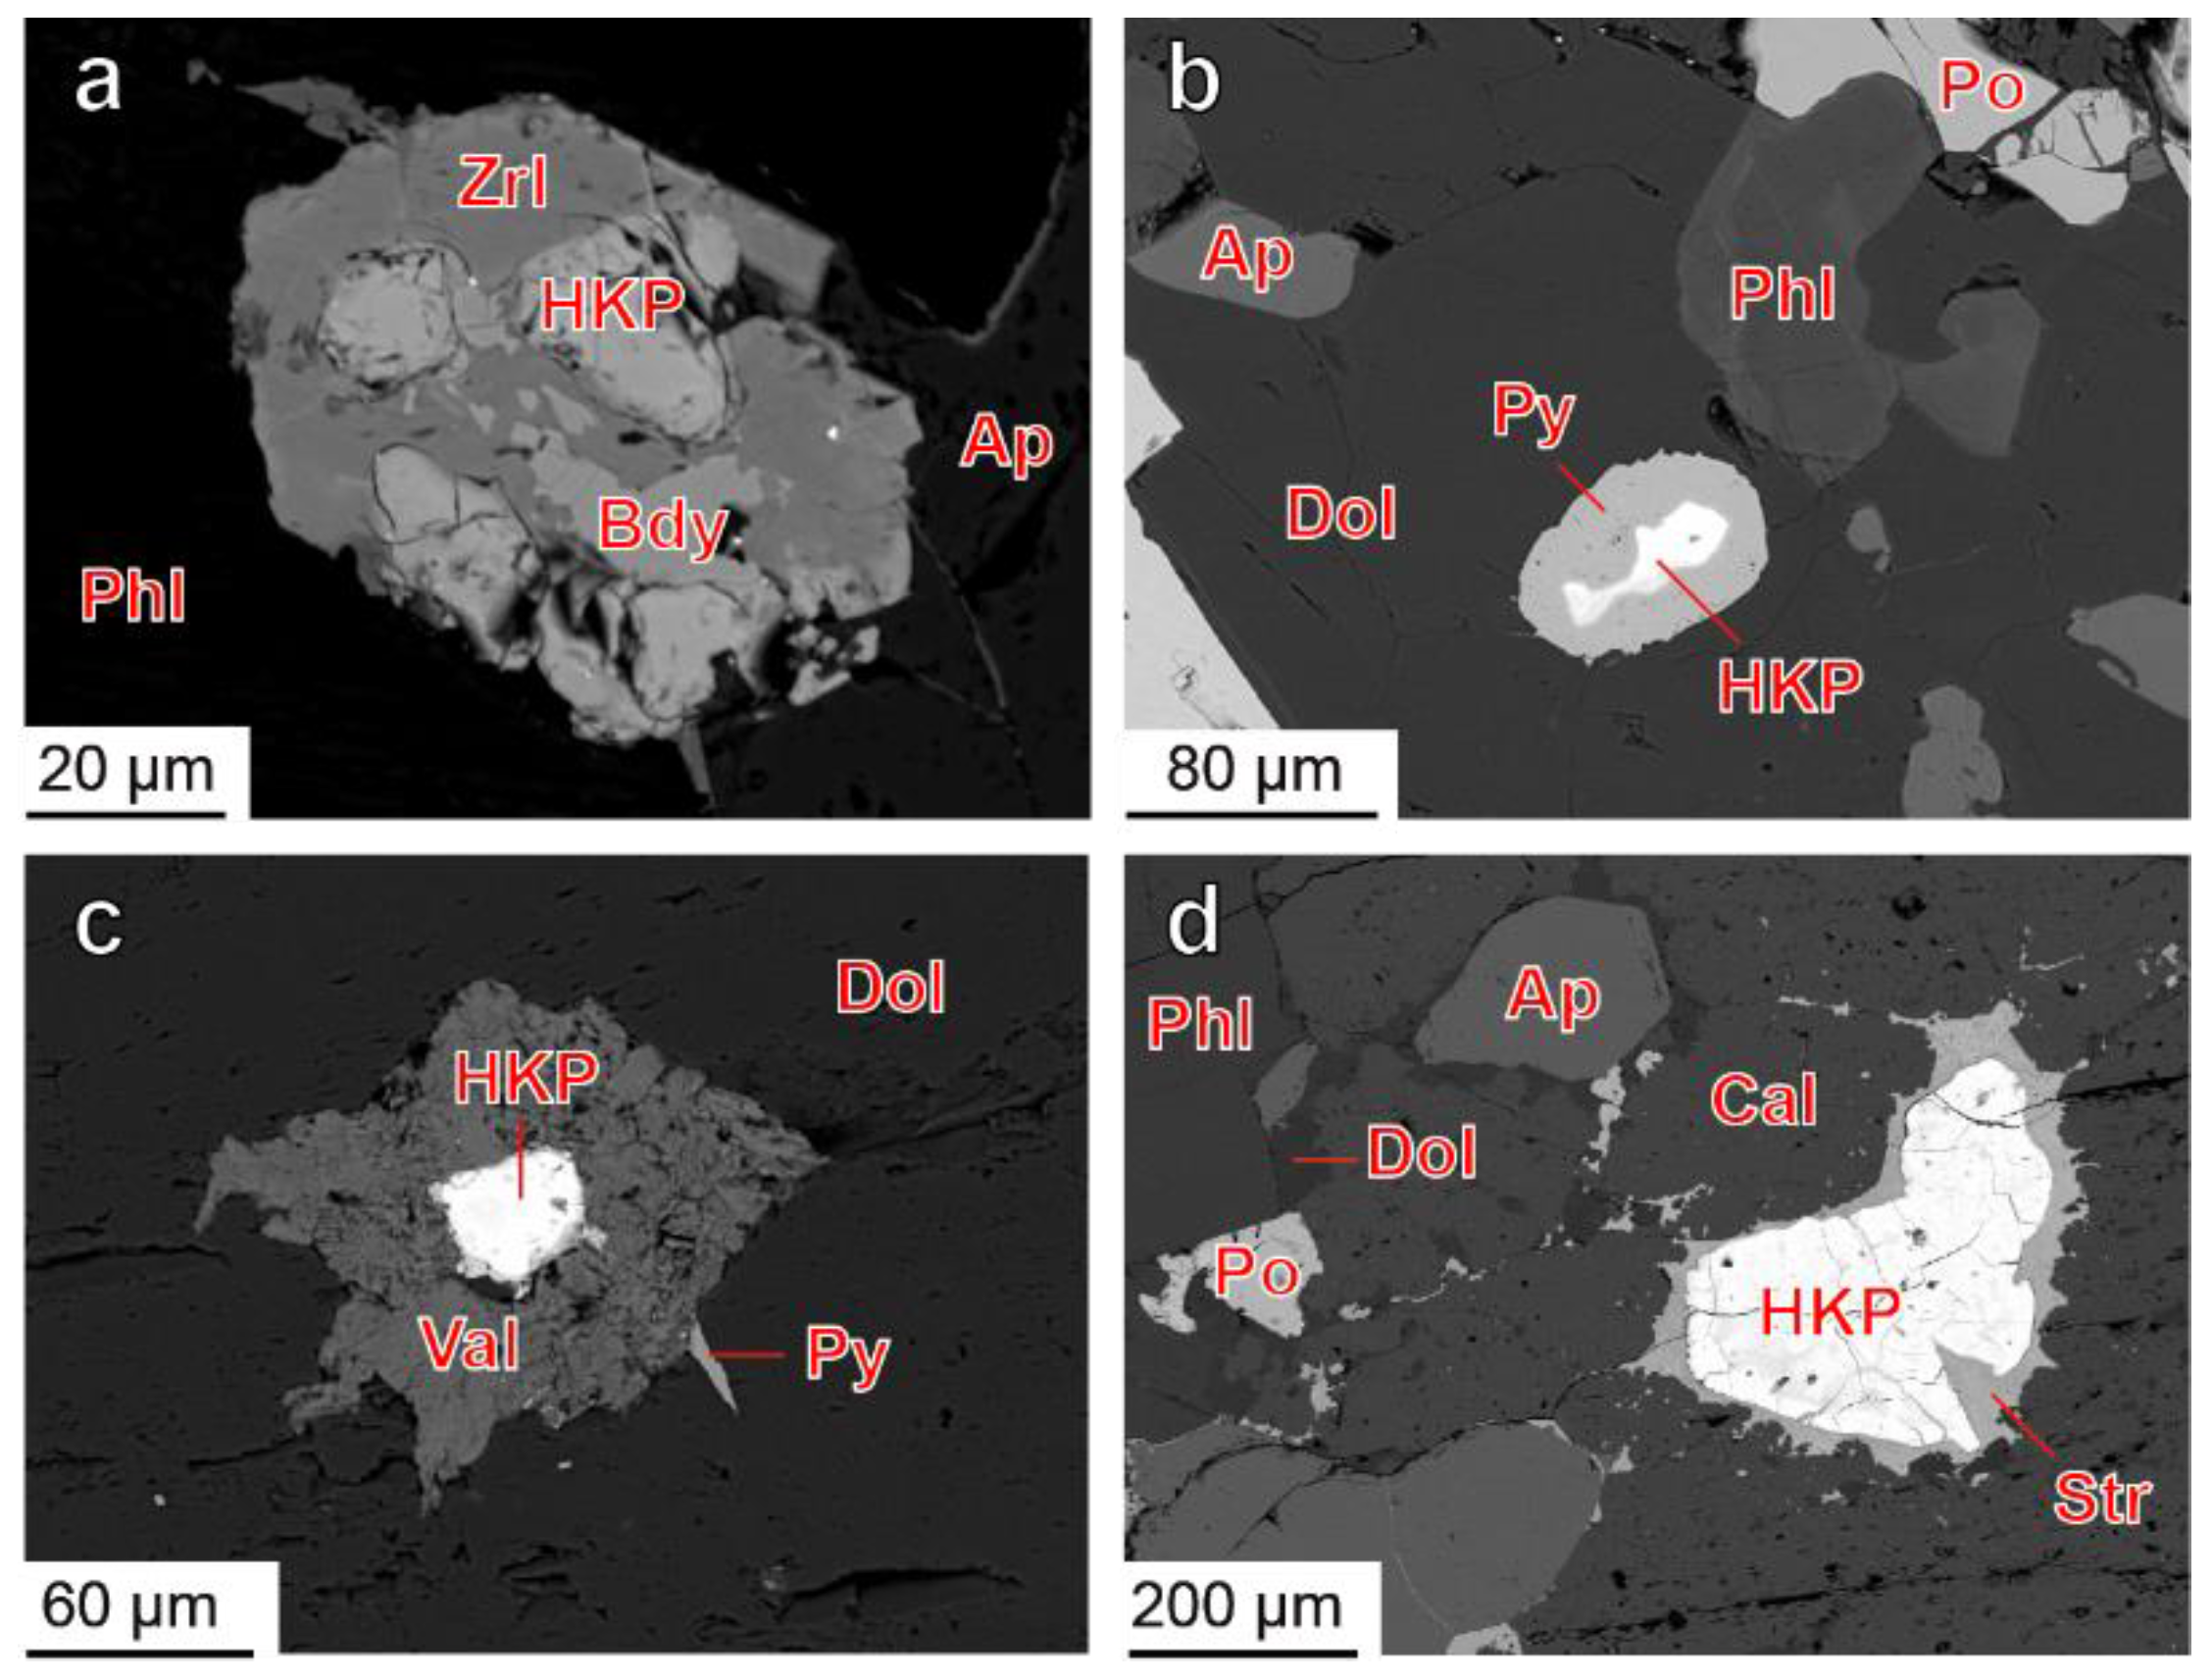
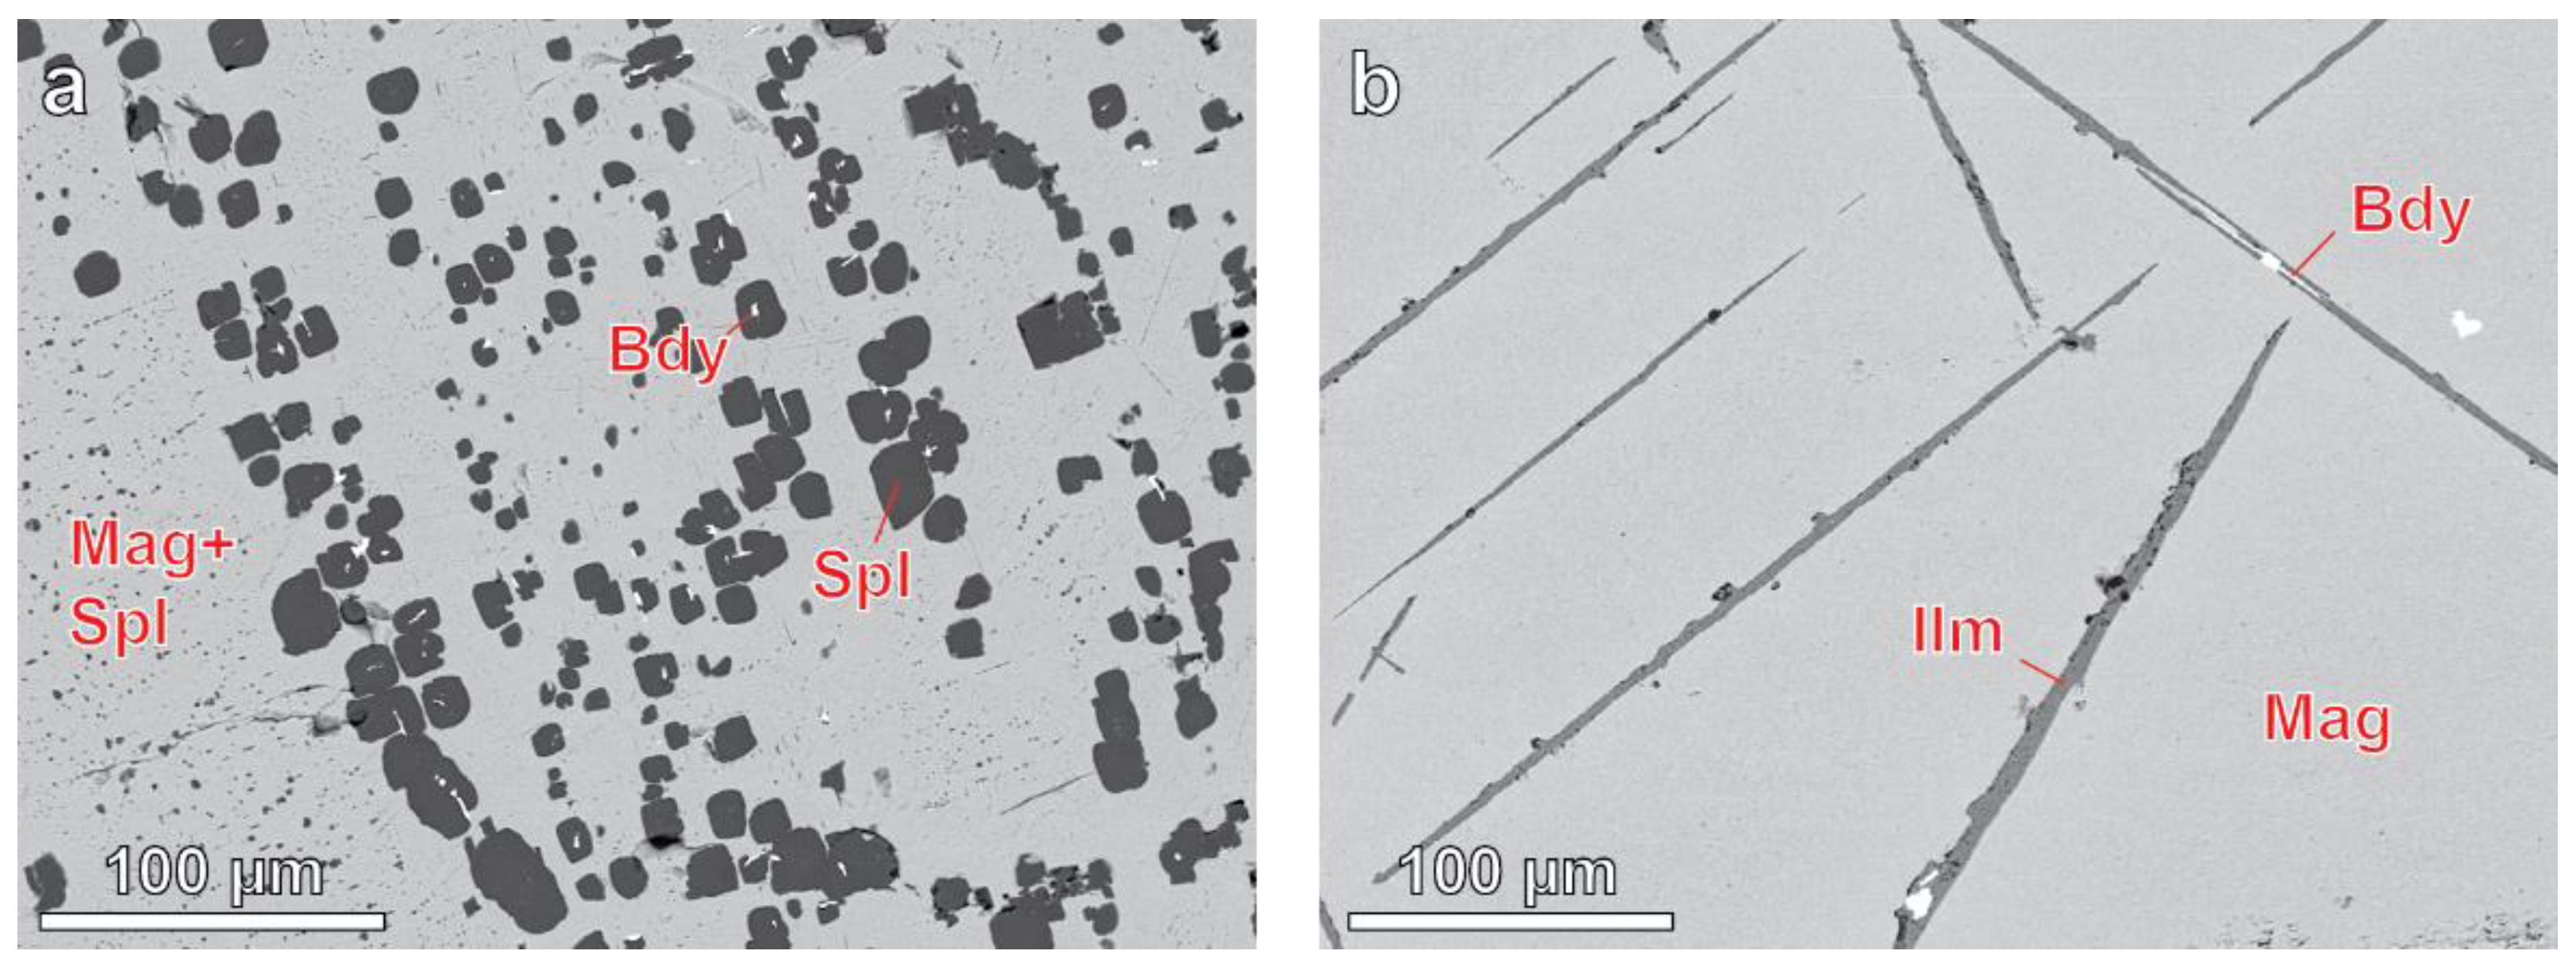
Like PSM, minerals of the zirconolite–laachite series are typical products of baddeleyite alteration; however, they can also replace pyrochlores (
Figure 3a). Besides, grains of U-Th-rich kenopyrochlores are often replaced/rimmed by pyrite (
Figure 3b) and valleriite (
Figure 3c) and sometimes by strontianite (
Figure 3d), probably, due to radiolytic splitting of water into hydrogen peroxide and molecular hydrogen. In particular, with radiation dose growth, a water solution of H
2SO
4 (below 200 °C) becomes significantly rich in H
2 due to H
2O
2 [
33,
34], and this, probably, causes precipitation of sulfides around the radiation source.
3.2. Chemical Composition
Table 3 shows the results of precision EPMA analyses conducted on 12 different members of the pyrochlore supergroup found in the Kovdor massif, and
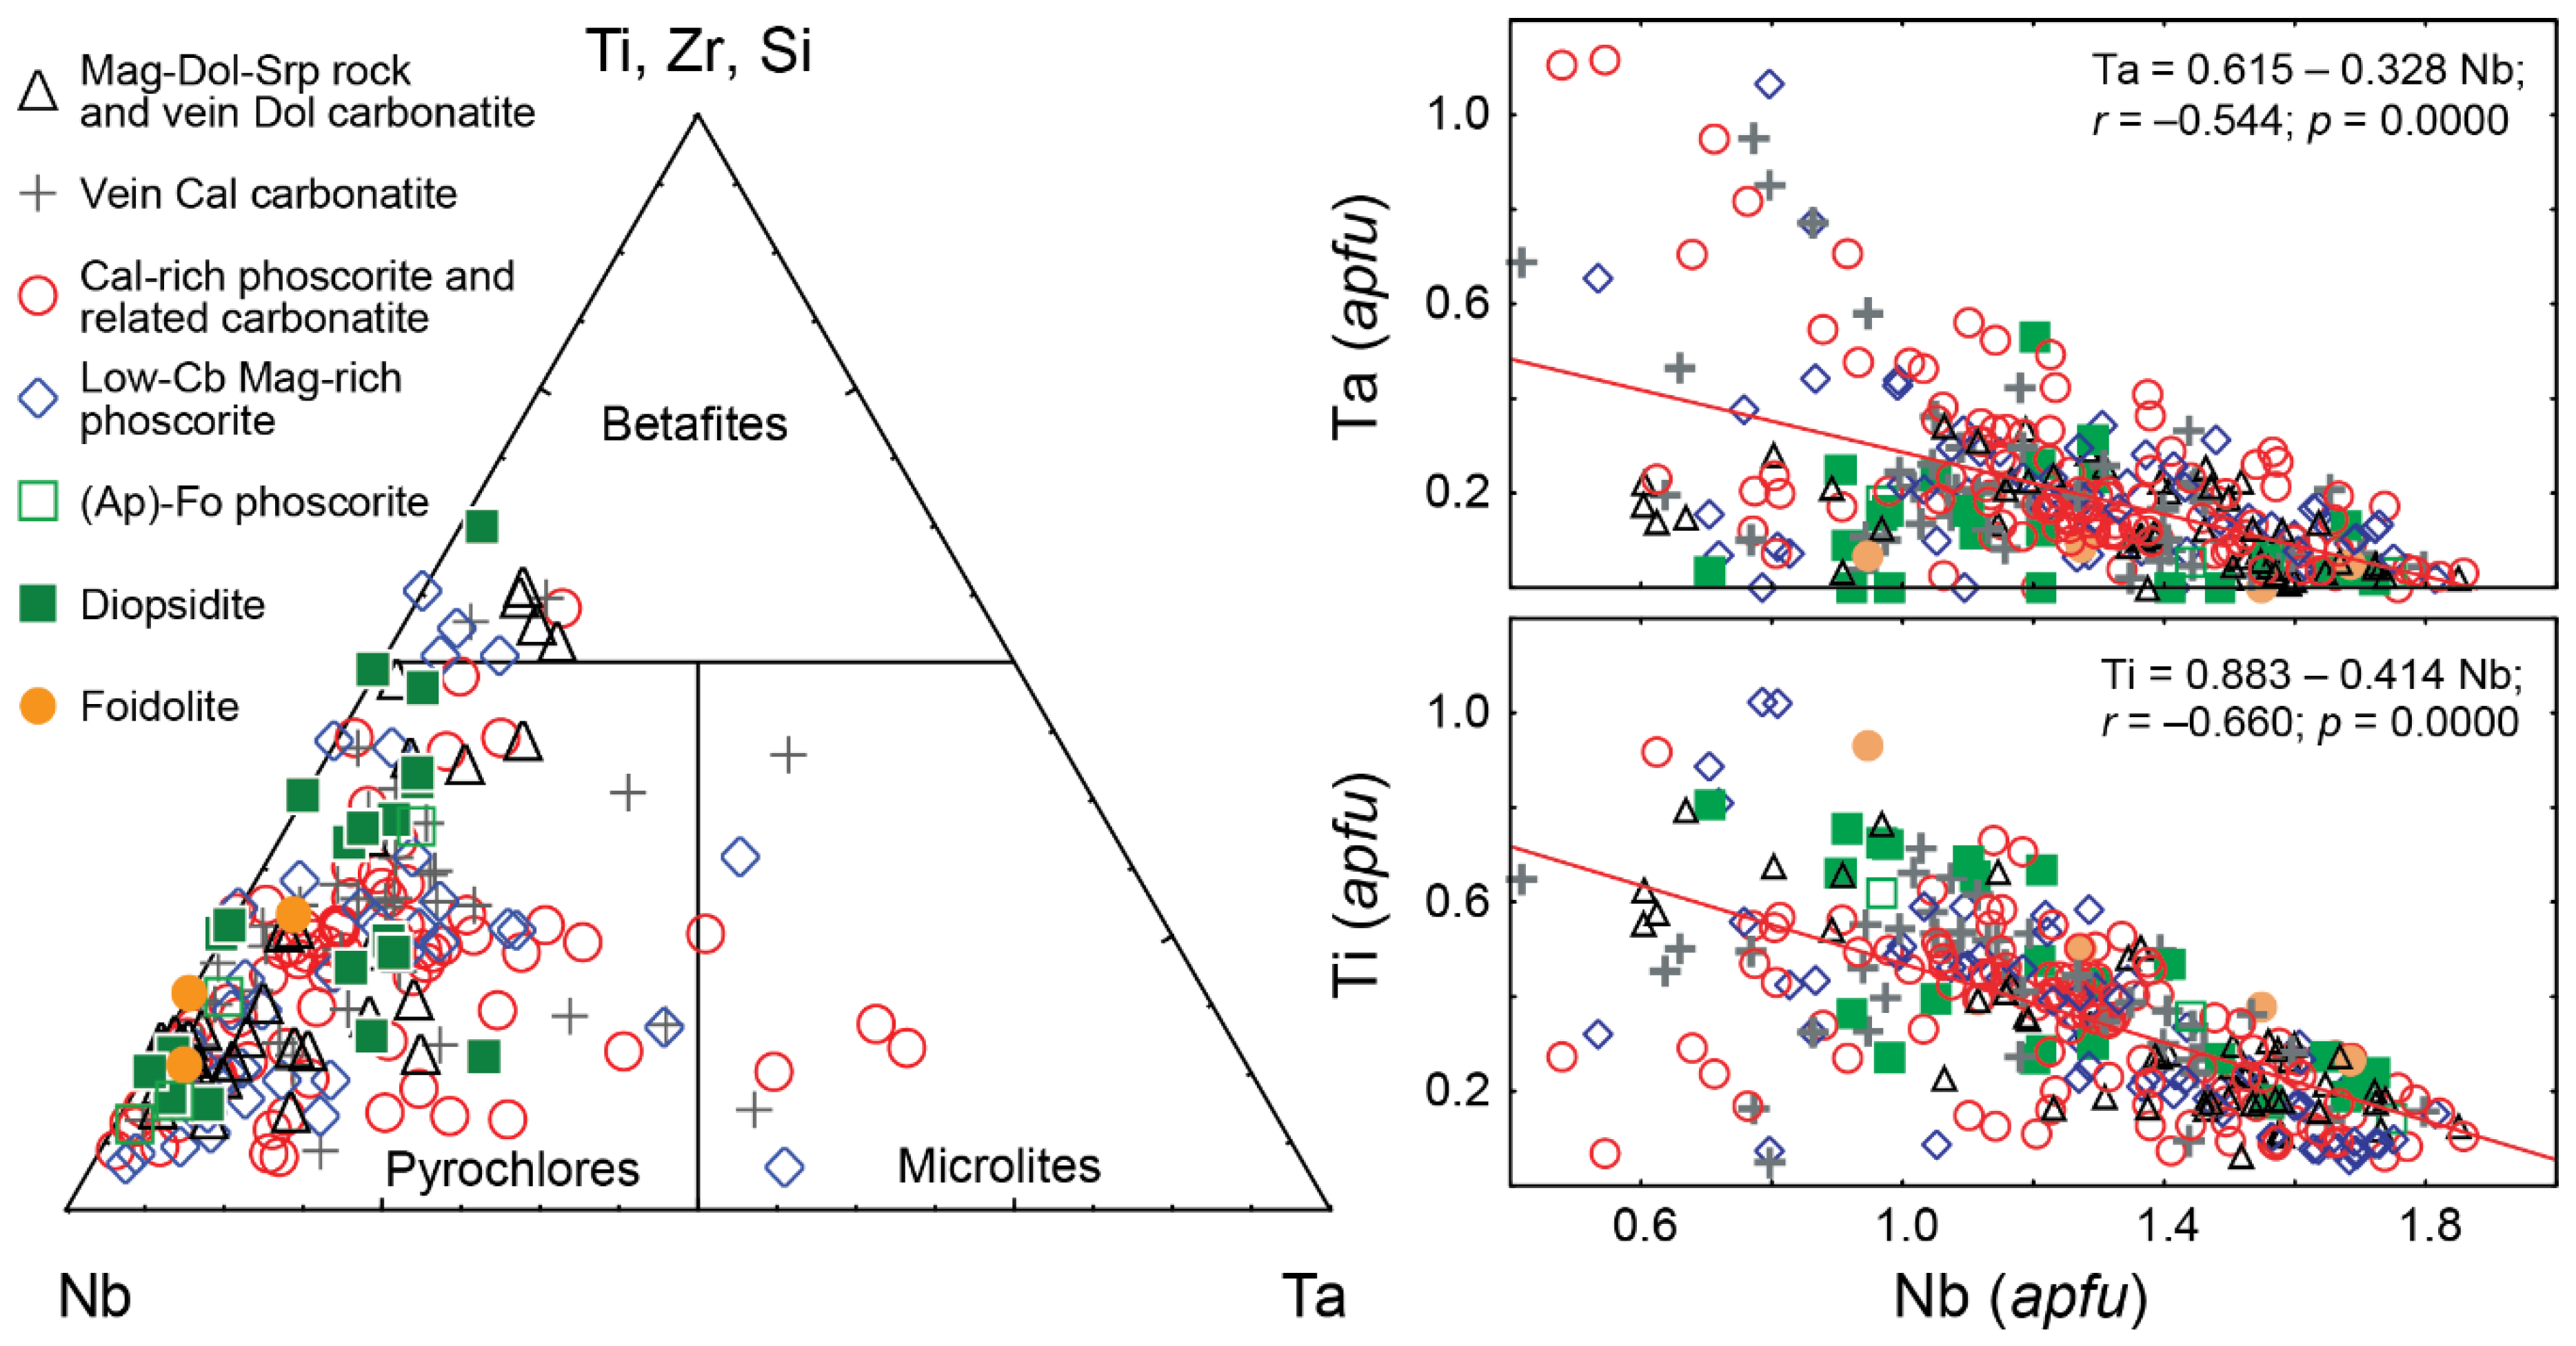
Table 4 presents statistical data on the PSM composition in different rocks of this massif. Most of the analyzed grains (92%) correspond to Ca-, Na- and vacancy-dominant members of the pyrochlore group and the rest 8% are represented by minerals of microlite and betafite groups (about 4% of each). Pyrochlores occur in all rocks of the Kovdor massif (
Figure 4), and microlites and betafites co-exist with pyrochlore in the central part of the phoscorite-carbonatite complex.
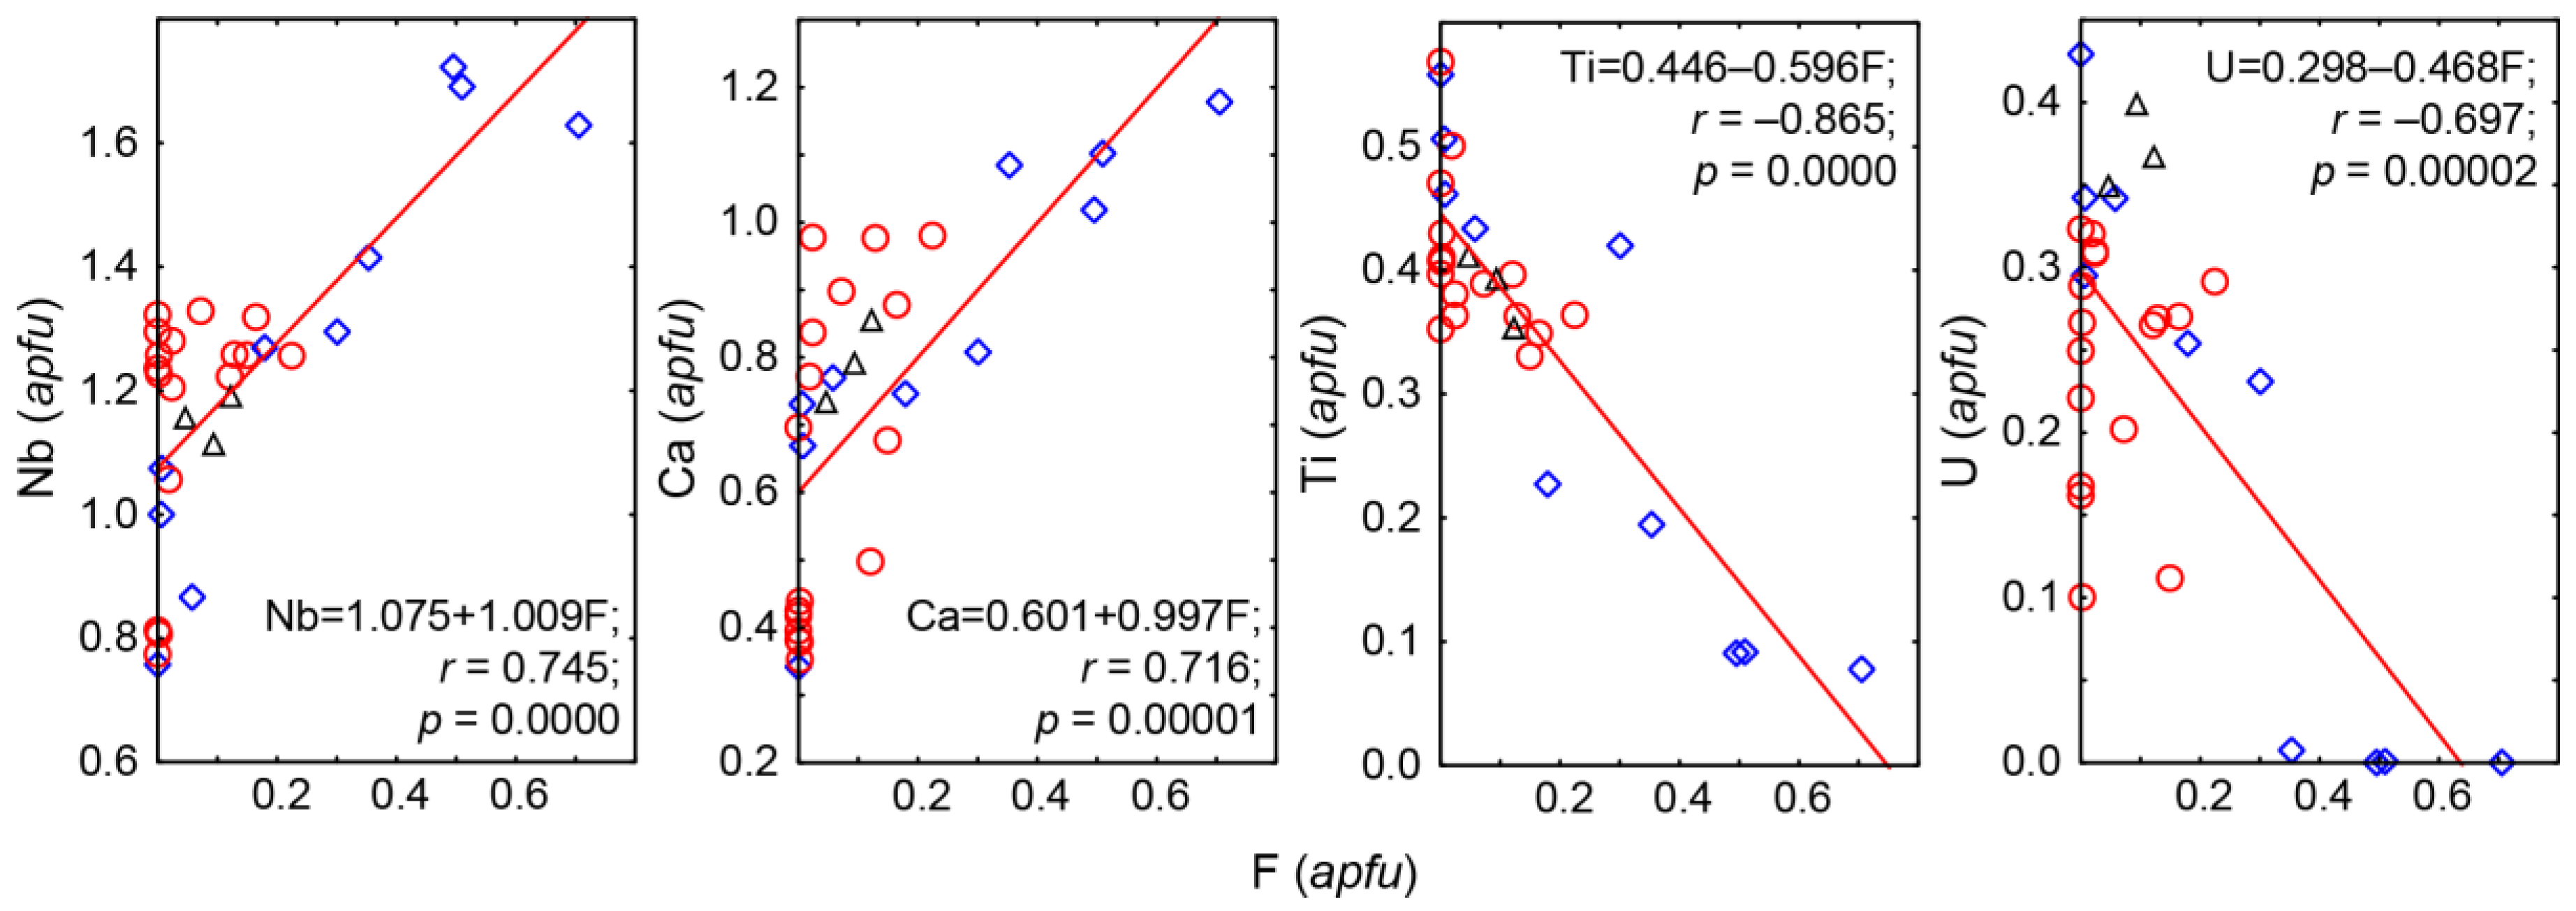
Over 92% of the analyzed PSM are represented by O- and (OH)-dominant phases, and the rest are fluorine-dominant. Fluorine shows positive correlations with Ca and Nb and negative correlations with Ti and U (
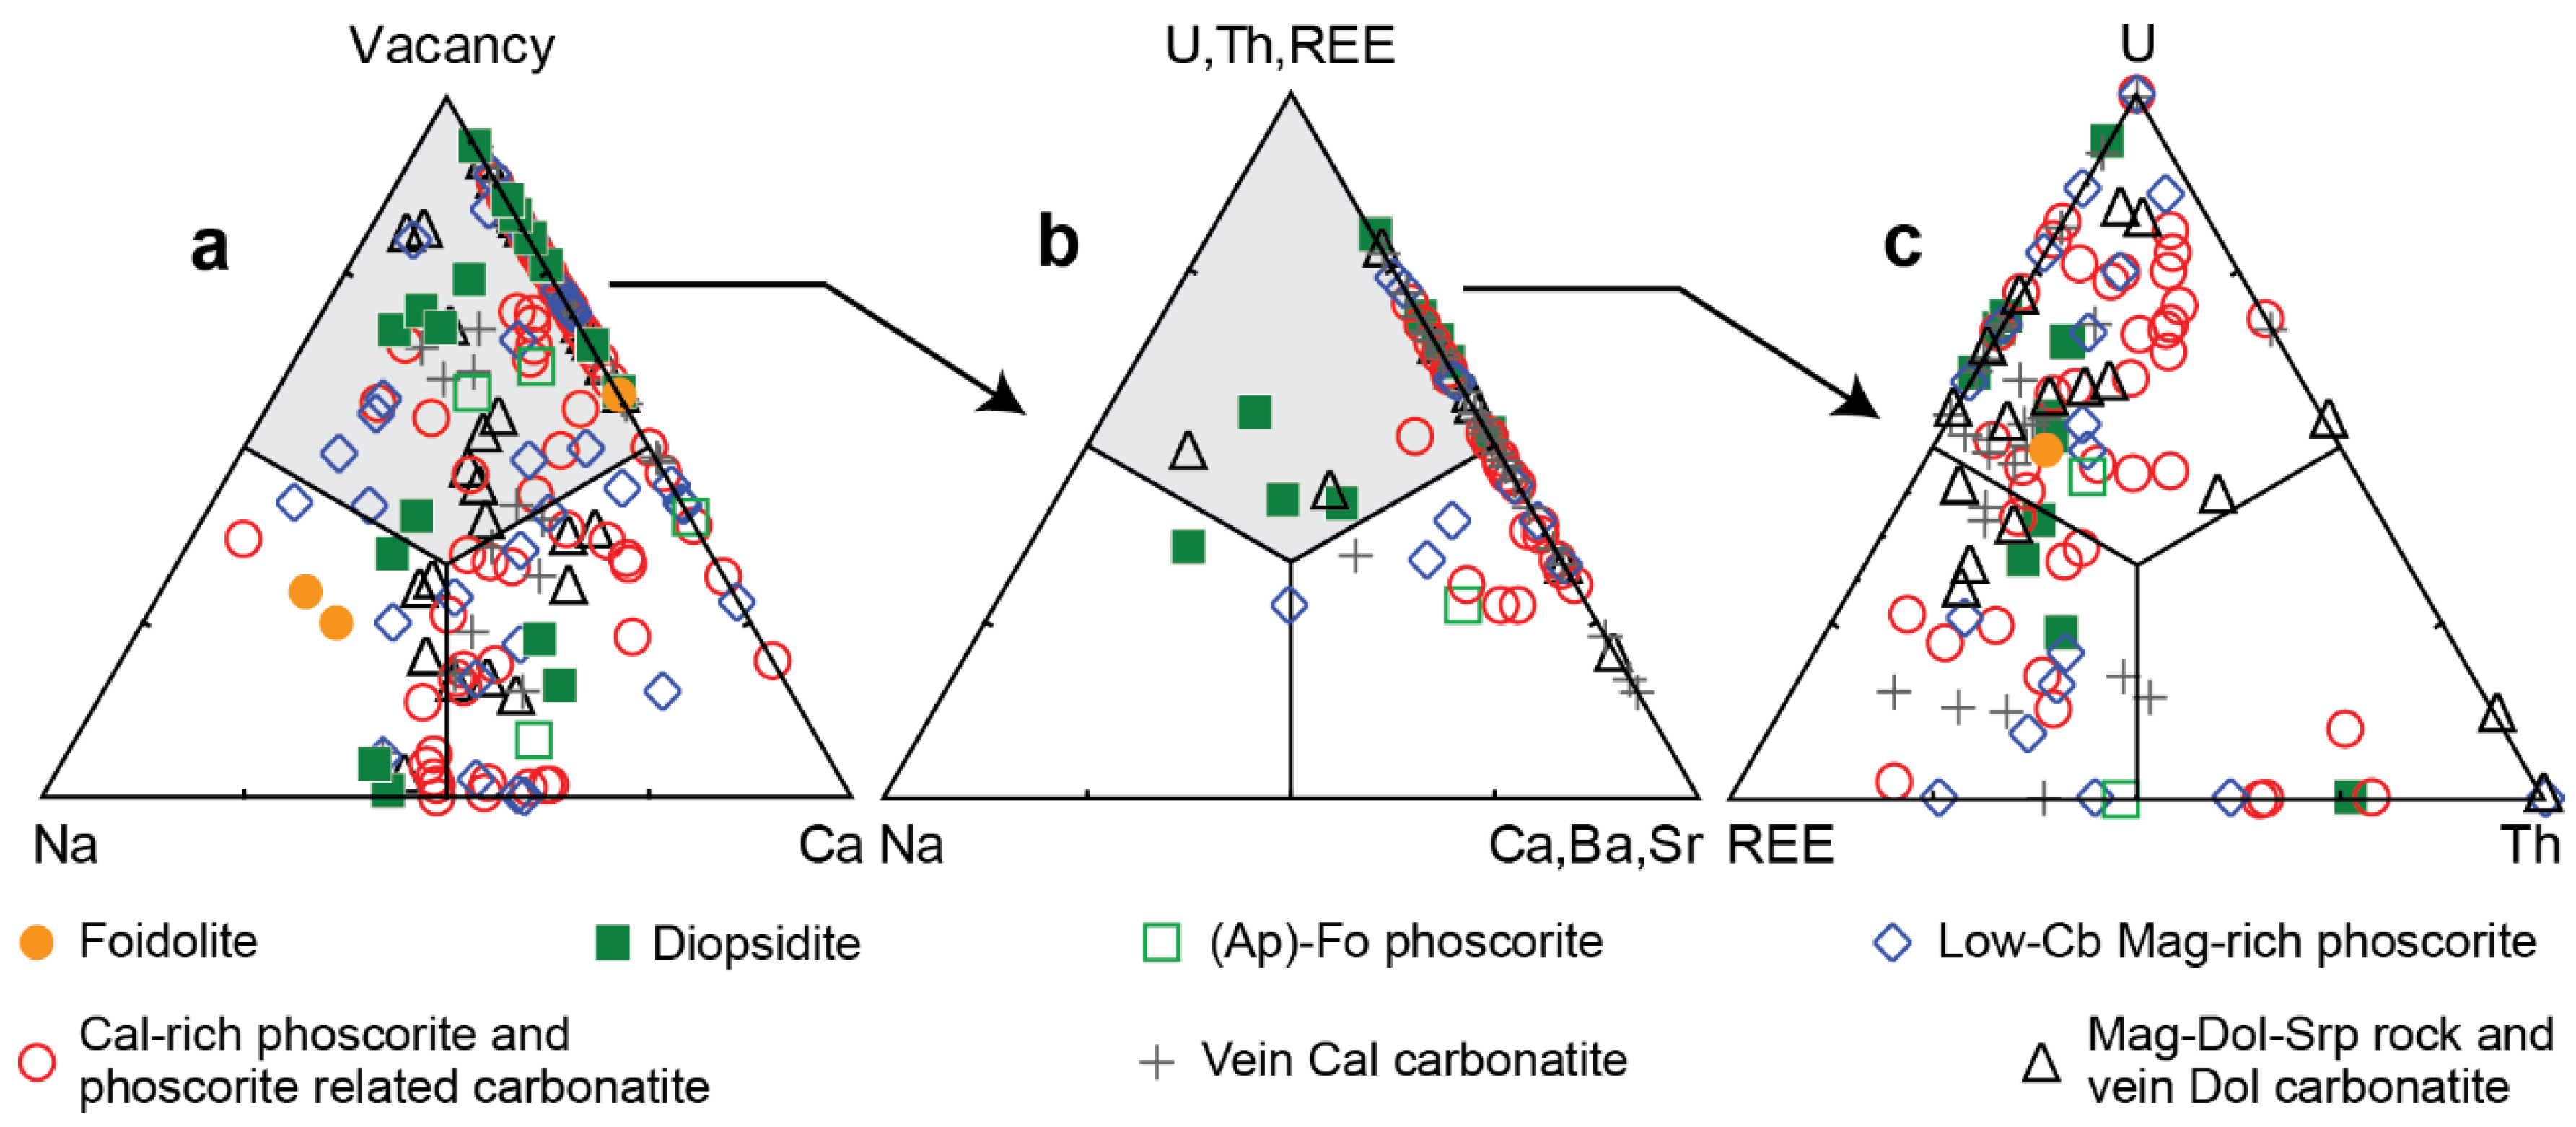
Figure 5). Correspondingly, fluorine-dominant phases occur mainly among calciopyroclores; while natropyrochlores, betafites and microlites are usually represented by hydroxyl-dominant and sometimes oxygen-dominant phases. As for pyrochlore, Ca-dominant phases prevail in ≈45% of the analyzed samples; about 20% of the samples include Na-dominant pyrochlore, and the rest are formed by kenopyrochlore (
Figure 6a) as a result of heterovalent substitutions: 2Ca
2+ → Na
+REE
3+, 2Ca
2+ → ☐U
4+, Ca
2+O
2− → Na
+(OH)
−, etc. Simultaneously, Nb is replaced with Ta and Ti up to the formation of microlite and betafite.
In about 35% of the analyzed PSM, the sum of cations in the
A-position does not exceed 1
apfu (see
Figure 6a). Kenopyrochlores occur in 59% of the analyzed samples of vein calcite carbonatite, 45% of diopsidite and phlogopitite samples, 25% of phoscorite samples, and 23% of vein dolomite carbonatite samples. The deficit of cations in the
A-position is caused by both the presence of high-charge cations of U
4+, Th
4+, REE
3+ instead of Na
+ and Ca
2+ (4N
a+ ↔ 3☐U
4+, 3Ca
2+ ↔ ☐2REE
3+, etc.), and cation loss during pyrochlore metamictization and hydration. The last processes are typical for pyrochlore with >15 wt % of (U,Th)O
2, and accompanied by destruction of the mineral crystal structure and leaching of Na, then Ca, and finally REE, U and Th (
Figure 6b). In kenopyrochlore, uranium is a predominant high-charge cation; while Th-dominant phases occur much rarely (
Figure 6c). Rare-earth elements are represented mainly by light lanthanides La through Nd, with total average content of La and Ce of about 87%. The highest REE content in pyrochlore is typical for host diopsidite and phlogopitite, as well as vein calcite carbonatite.
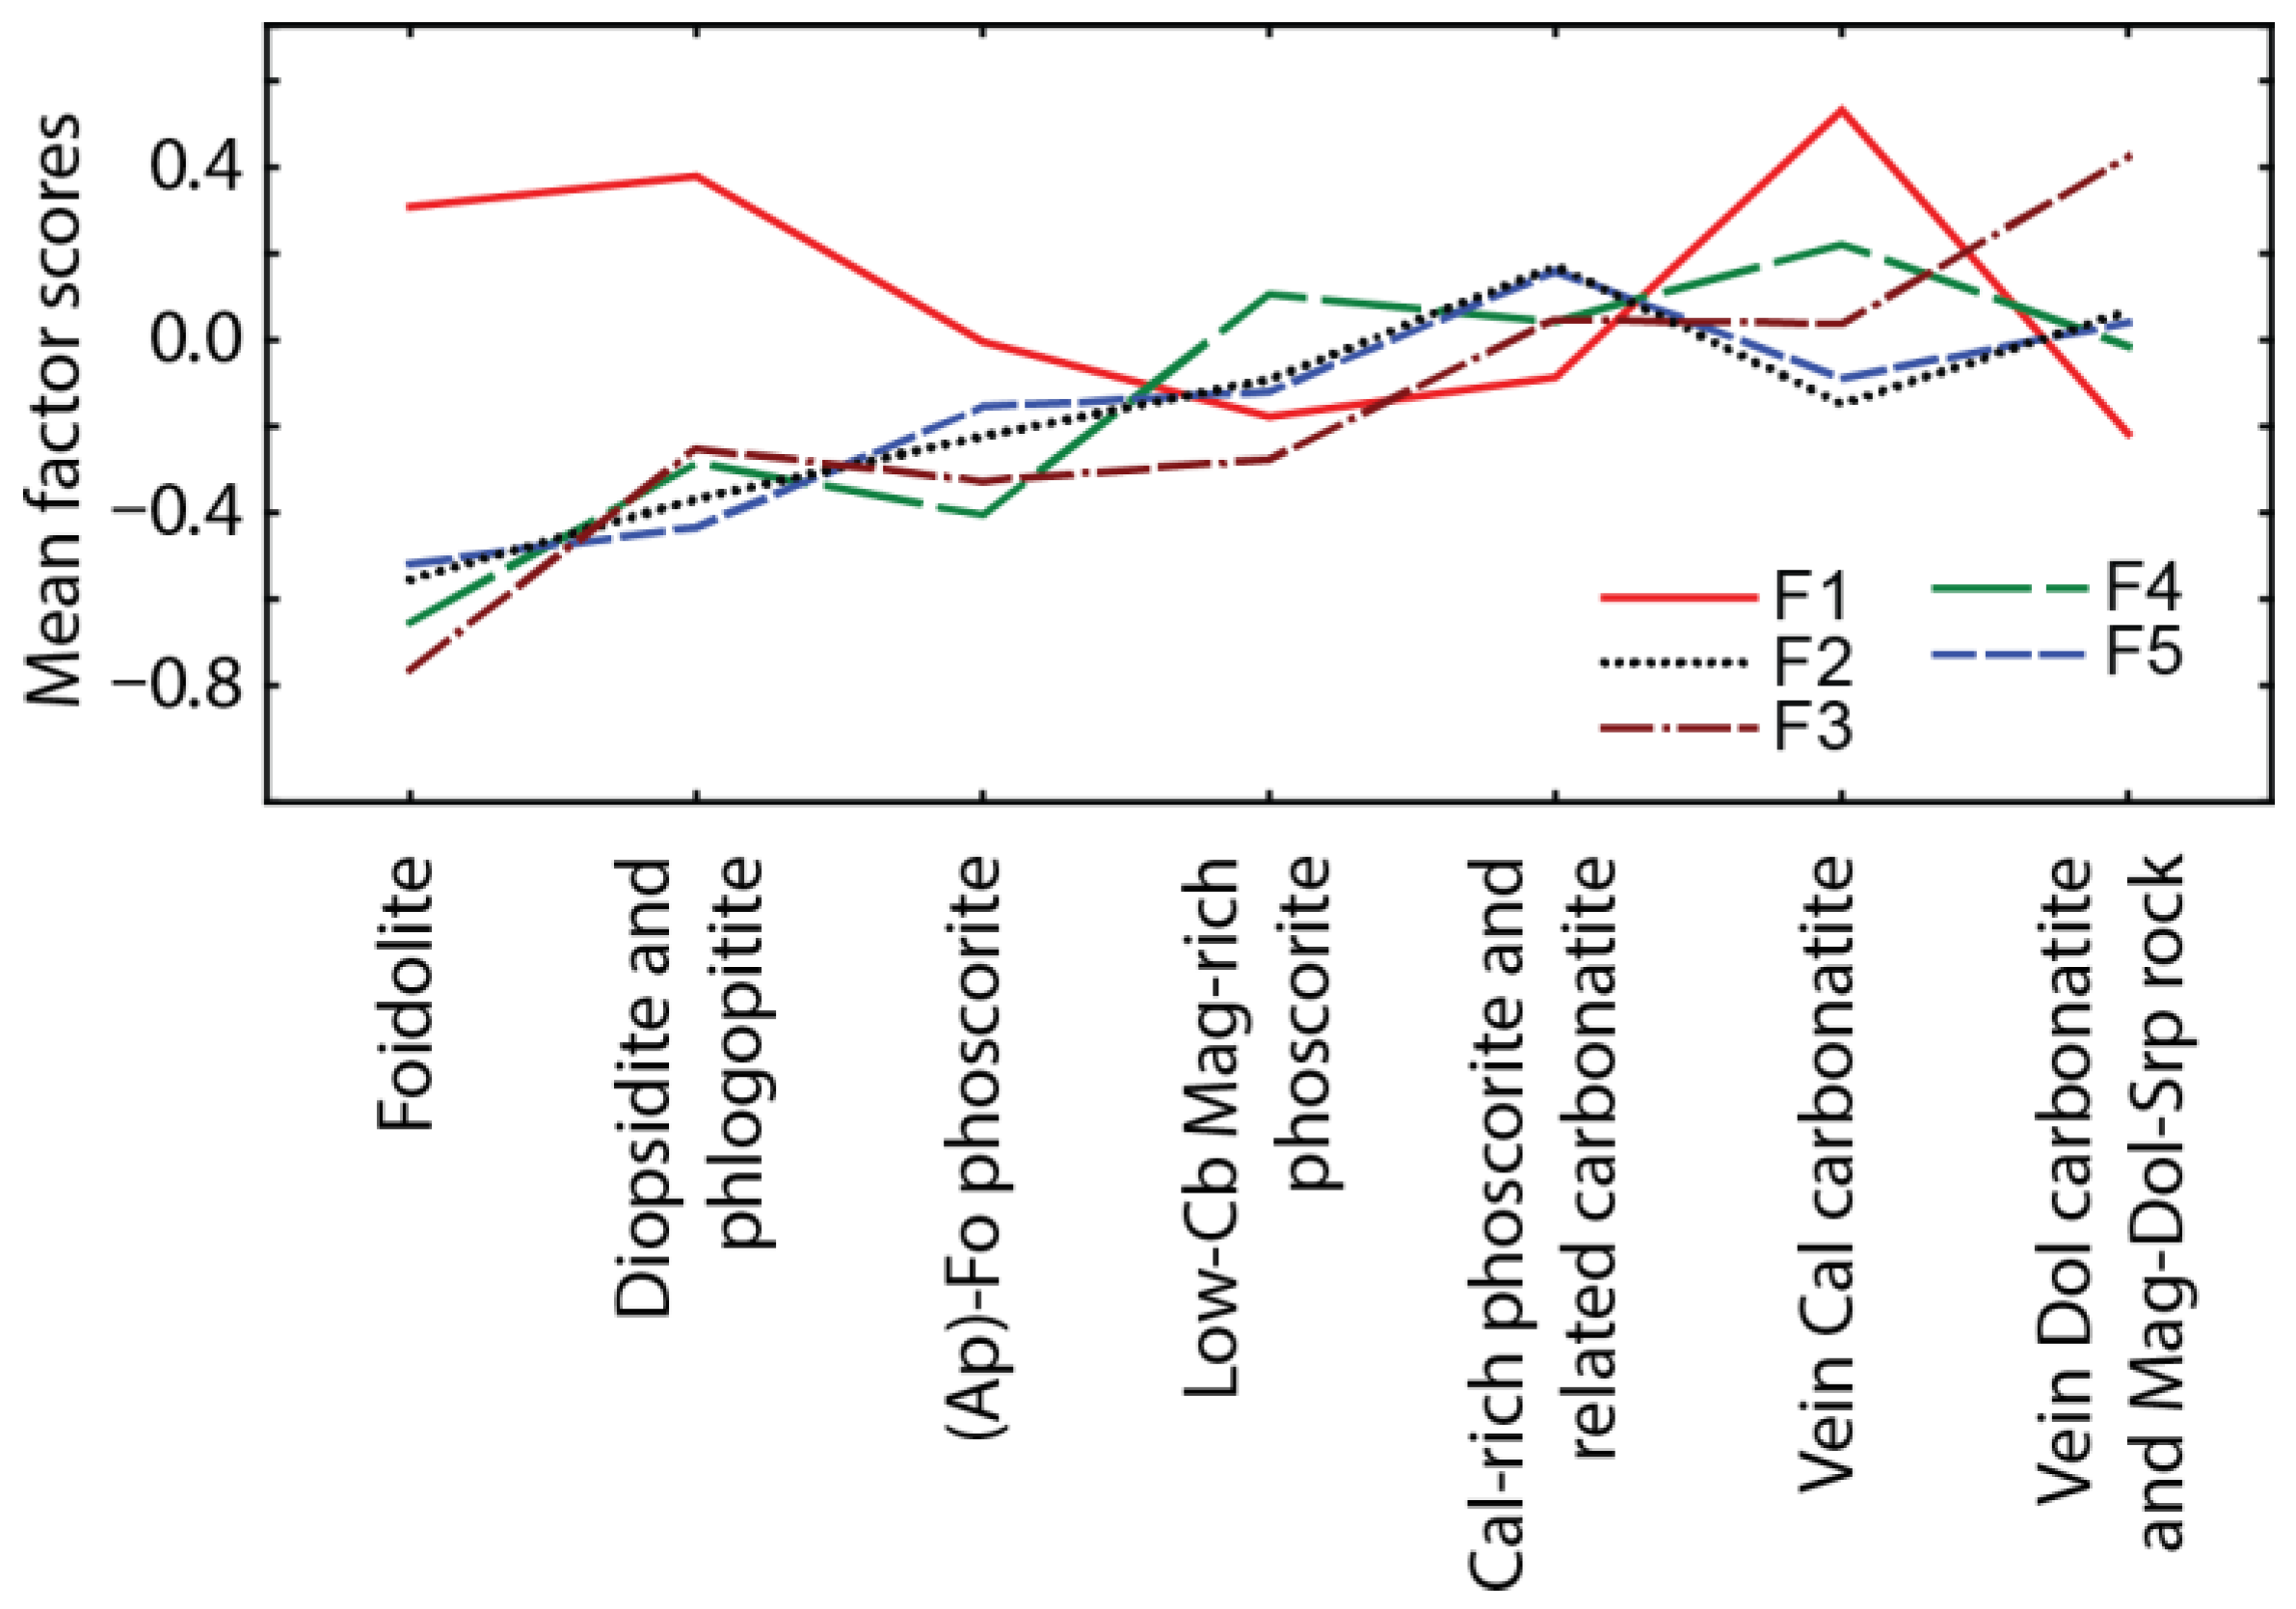
To determine the chemical evolution of the PSM in natural rock sequence, we implemented factor analysis of 314 PSM compositions using the method of principal components (with normalization and varimax rotation of factors) (
Table 5). The resultant factors enable us to specify five schemas of isomorphic substitutions (elements with high factor loadings are bolded): (1)
Na+Ca2+Nb5+ ↔
U4+Ti4+; (2) (
Th4+,
REE3+) ↔
U4+; (3) Na
+Nb
5+ ↔
Sr2+Zr4+; (4)
Nb5+ ↔ (
Ta5+,
Fe3+); (5) Ca
2+ ↔
Ba2+. Correspondingly, in the natural sequence of the Kovdor rocks (
Figure 7), content of Ba, Sr, U, Ta, Fe and Zr in PSM gradually increases due to Na, Ca, REE, Th and Nb (F2–F5), while higher contents of Ti, U and vacancies are observed in host silicate and calcio-carbonatite rocks (F1).
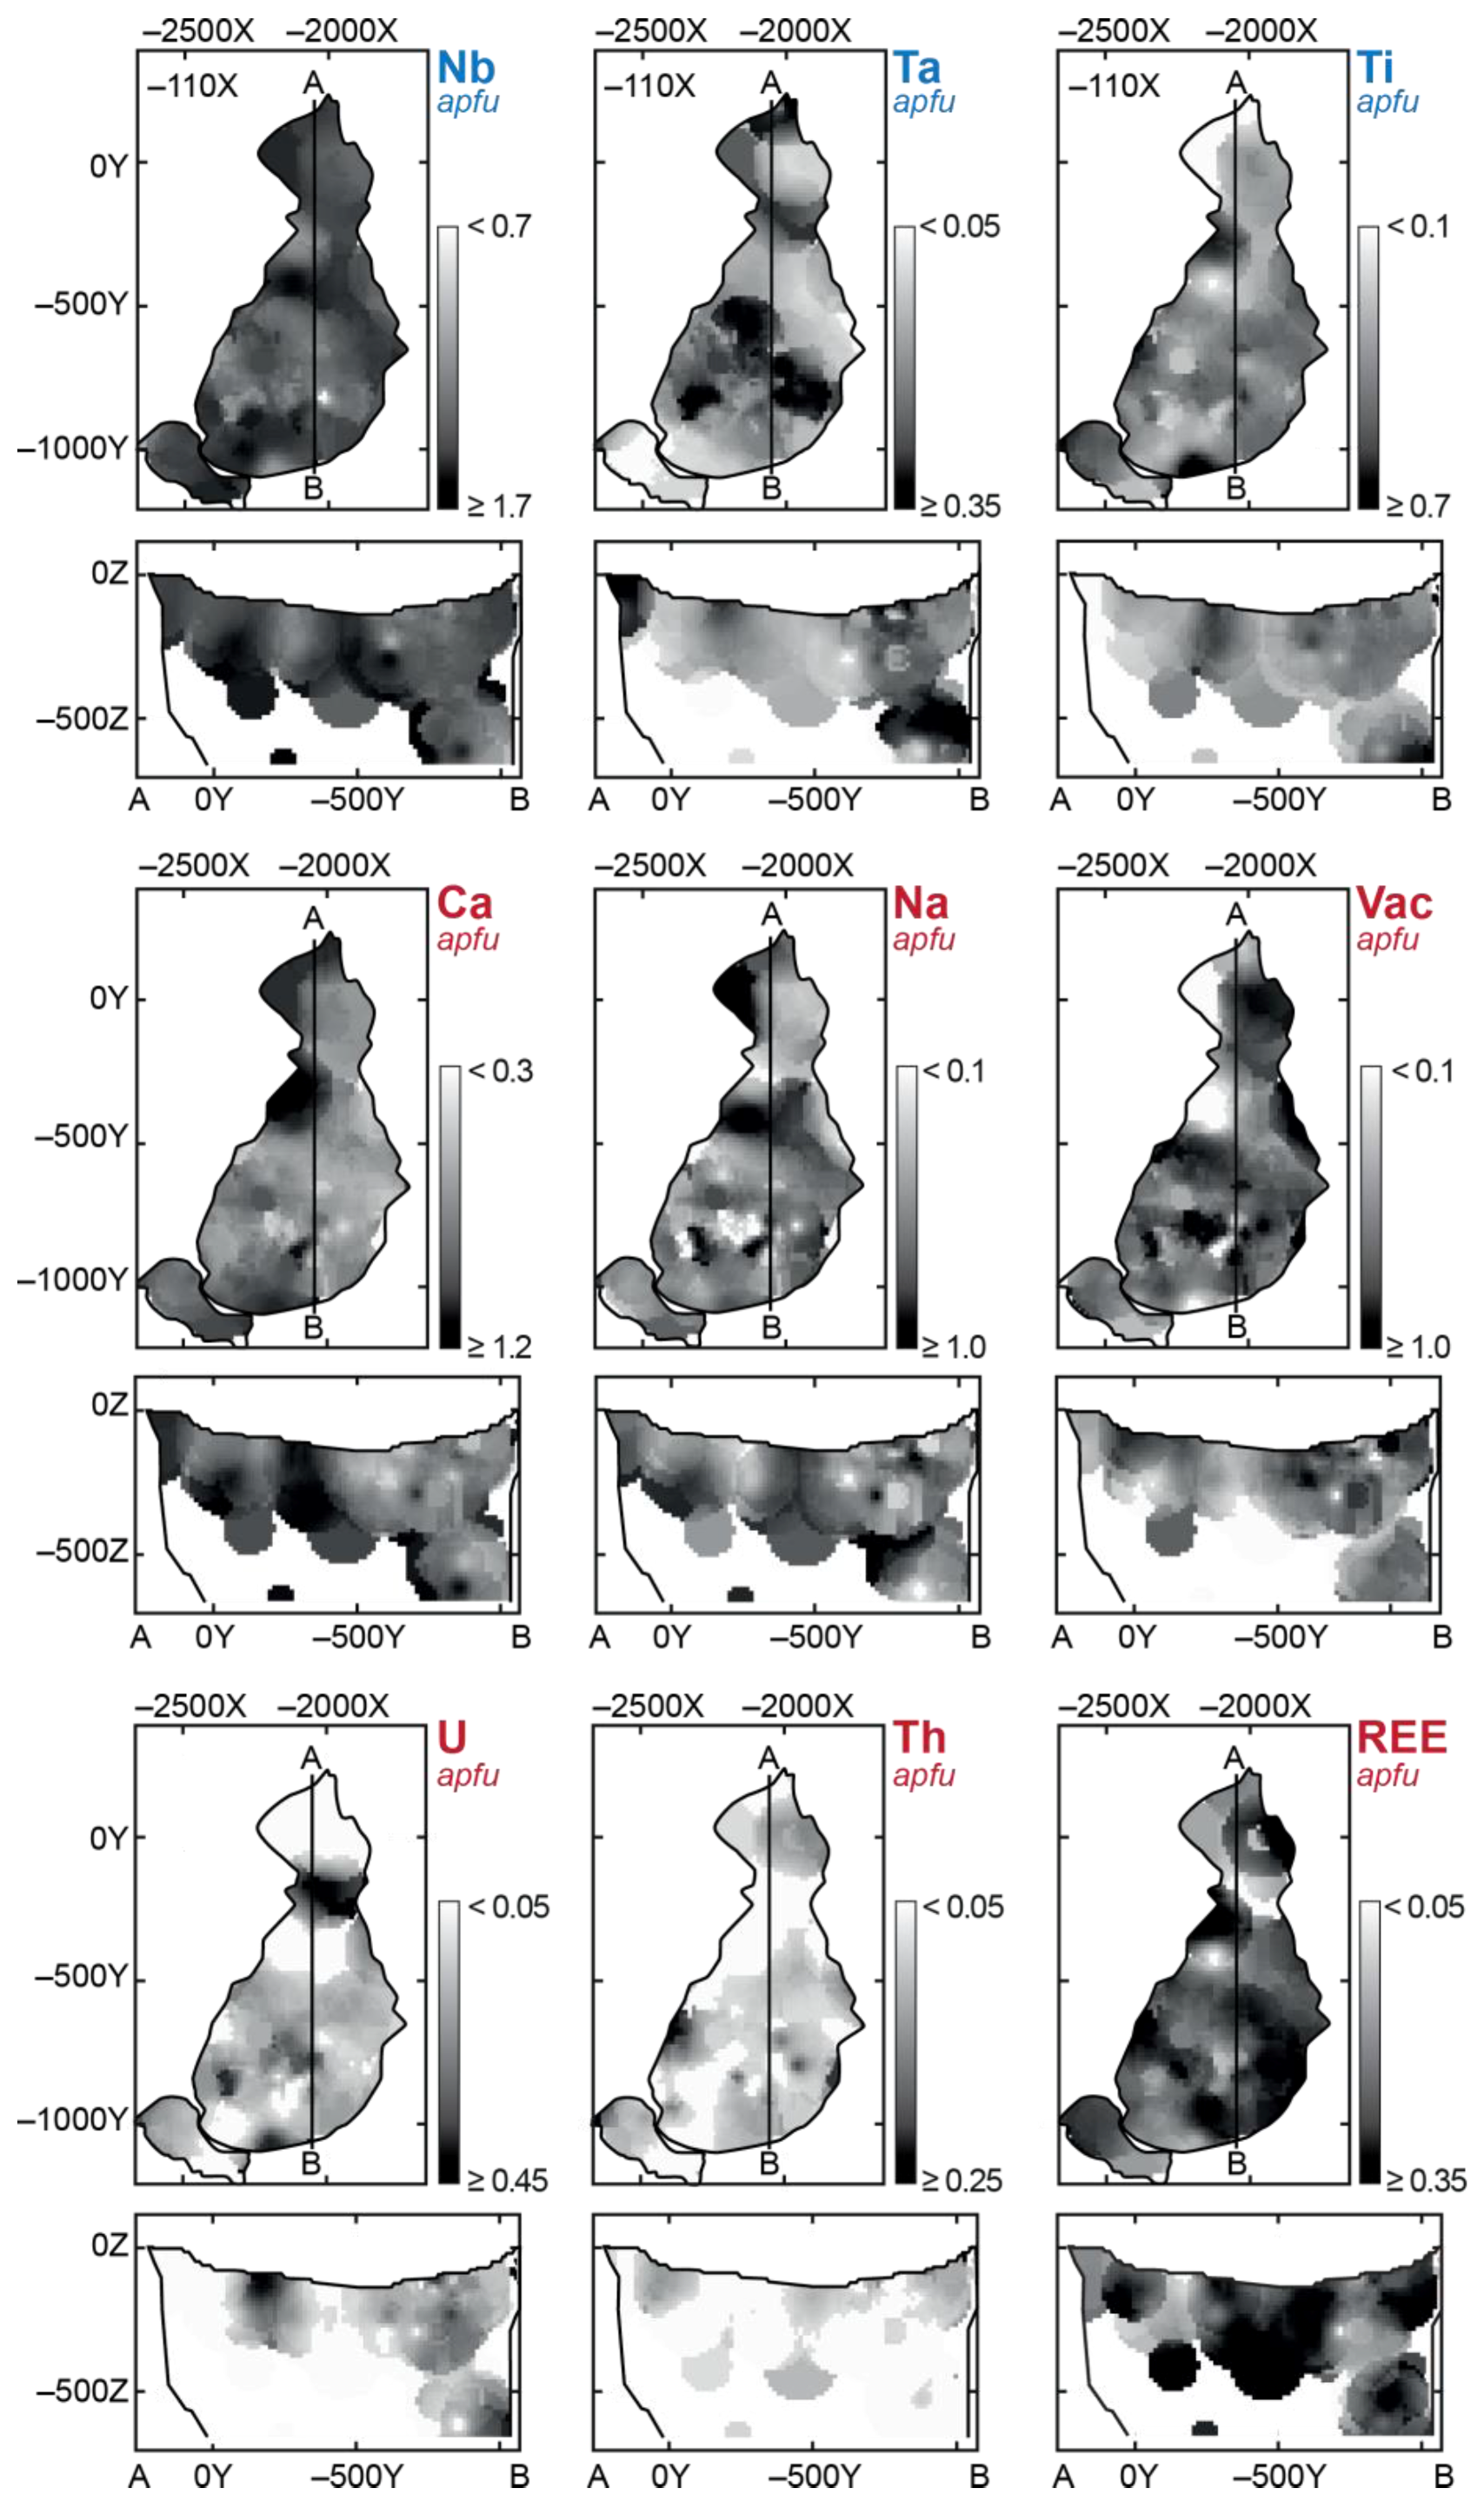
All above substitutions cause complex zonation of the ore-pipe in terms of the PSM composition (
Figure 8): marginal (apatite)-forsterite phoscorite contains Th-REE-rich (keno)pyrochlore and betafite, intermediate low-carbonate magnetite-rich phoscorite comprises pyrochlore with medium content of basic cations, and axial calcite-rich phoscorite and carbonatites accumulate (keno)pyrochlore, (keno)microlite and betafite comparatively enriched in U, Fe, Zr, Ba and Sr.
In the unaltered PSM crystals from diopsidite, phlogopitite, phoscorite and calcite carbonatite, there are irregular variations of chemical composition between separate zones, without any clear trends from cores to margins. However, in host foidolite, marginal zones of pyrochlore crystals are constantly enriched in Ca, Na, Th and Nb in comparison with REE-U-Ta-Ti-rich cores, and the latest dolomite carbonatite, pyrochlore grains have Na-Nb-dominant cores and Ca-U-Zr-rich margins. Besides, U-Th-rich (keno)pyrochlore grains often have secondary zonation due to leaching of
A-cations and then
B-cations from the grain marginal parts. Fluorine content increases from the core to rim in fresh pyrochlore crystals (
Figure 9a). The PSM alteration under the influence of self-irradiation causes loss of fluorine (
Figure 9b); therefore, the content of fluorine in the PSM is directly proportional to the amounts of Ca and Nb, and inversely proportional to the content of U and Th (see
Figure 5).
X-ray powder diffraction of the Kovdor PSM showed good crystallinity of U/Th-poor calcio- and natropyrochlores; while all analyzed kenopyrochlores became amorphous. Therefore, a single-crystal X-ray study was performed only for low-vacant pyrochlore.
3.3. Crystal Structure
Single-crystal X-ray diffraction data were obtained for well-crystalline oxycalciopyrochlore 917-318.5 (see
Figure 2e) and hydroxynatropyrochlore K-017-4 (see
Figure 2d). A quadrant of three-dimensional data was collected with frame widths of 1° in ω, and with 220 s in the range 2θ 6.8°–55°. Scattering factors were calculated from initial model with all Ca and Na at
A, all Nb and Ti at
B, O at O1, and O at
Y1 site. All cation site-occupancies are given in accordance with electron-microprobe-determined values (normalized on a basis of 2
B cations per formula unit), the O-populated sites (O1 and
Y1) was set at full occupancy.
Table 6 shows data collection and refinement parameters for the single-crystal X-ray experiments. Atom coordinates, displacement parameters and site occupancies are given in
Table 7, and bond lengths in
Table 8. Anisotropic displacement parameters are attached in
Supplementary Materials (CIF data is available).
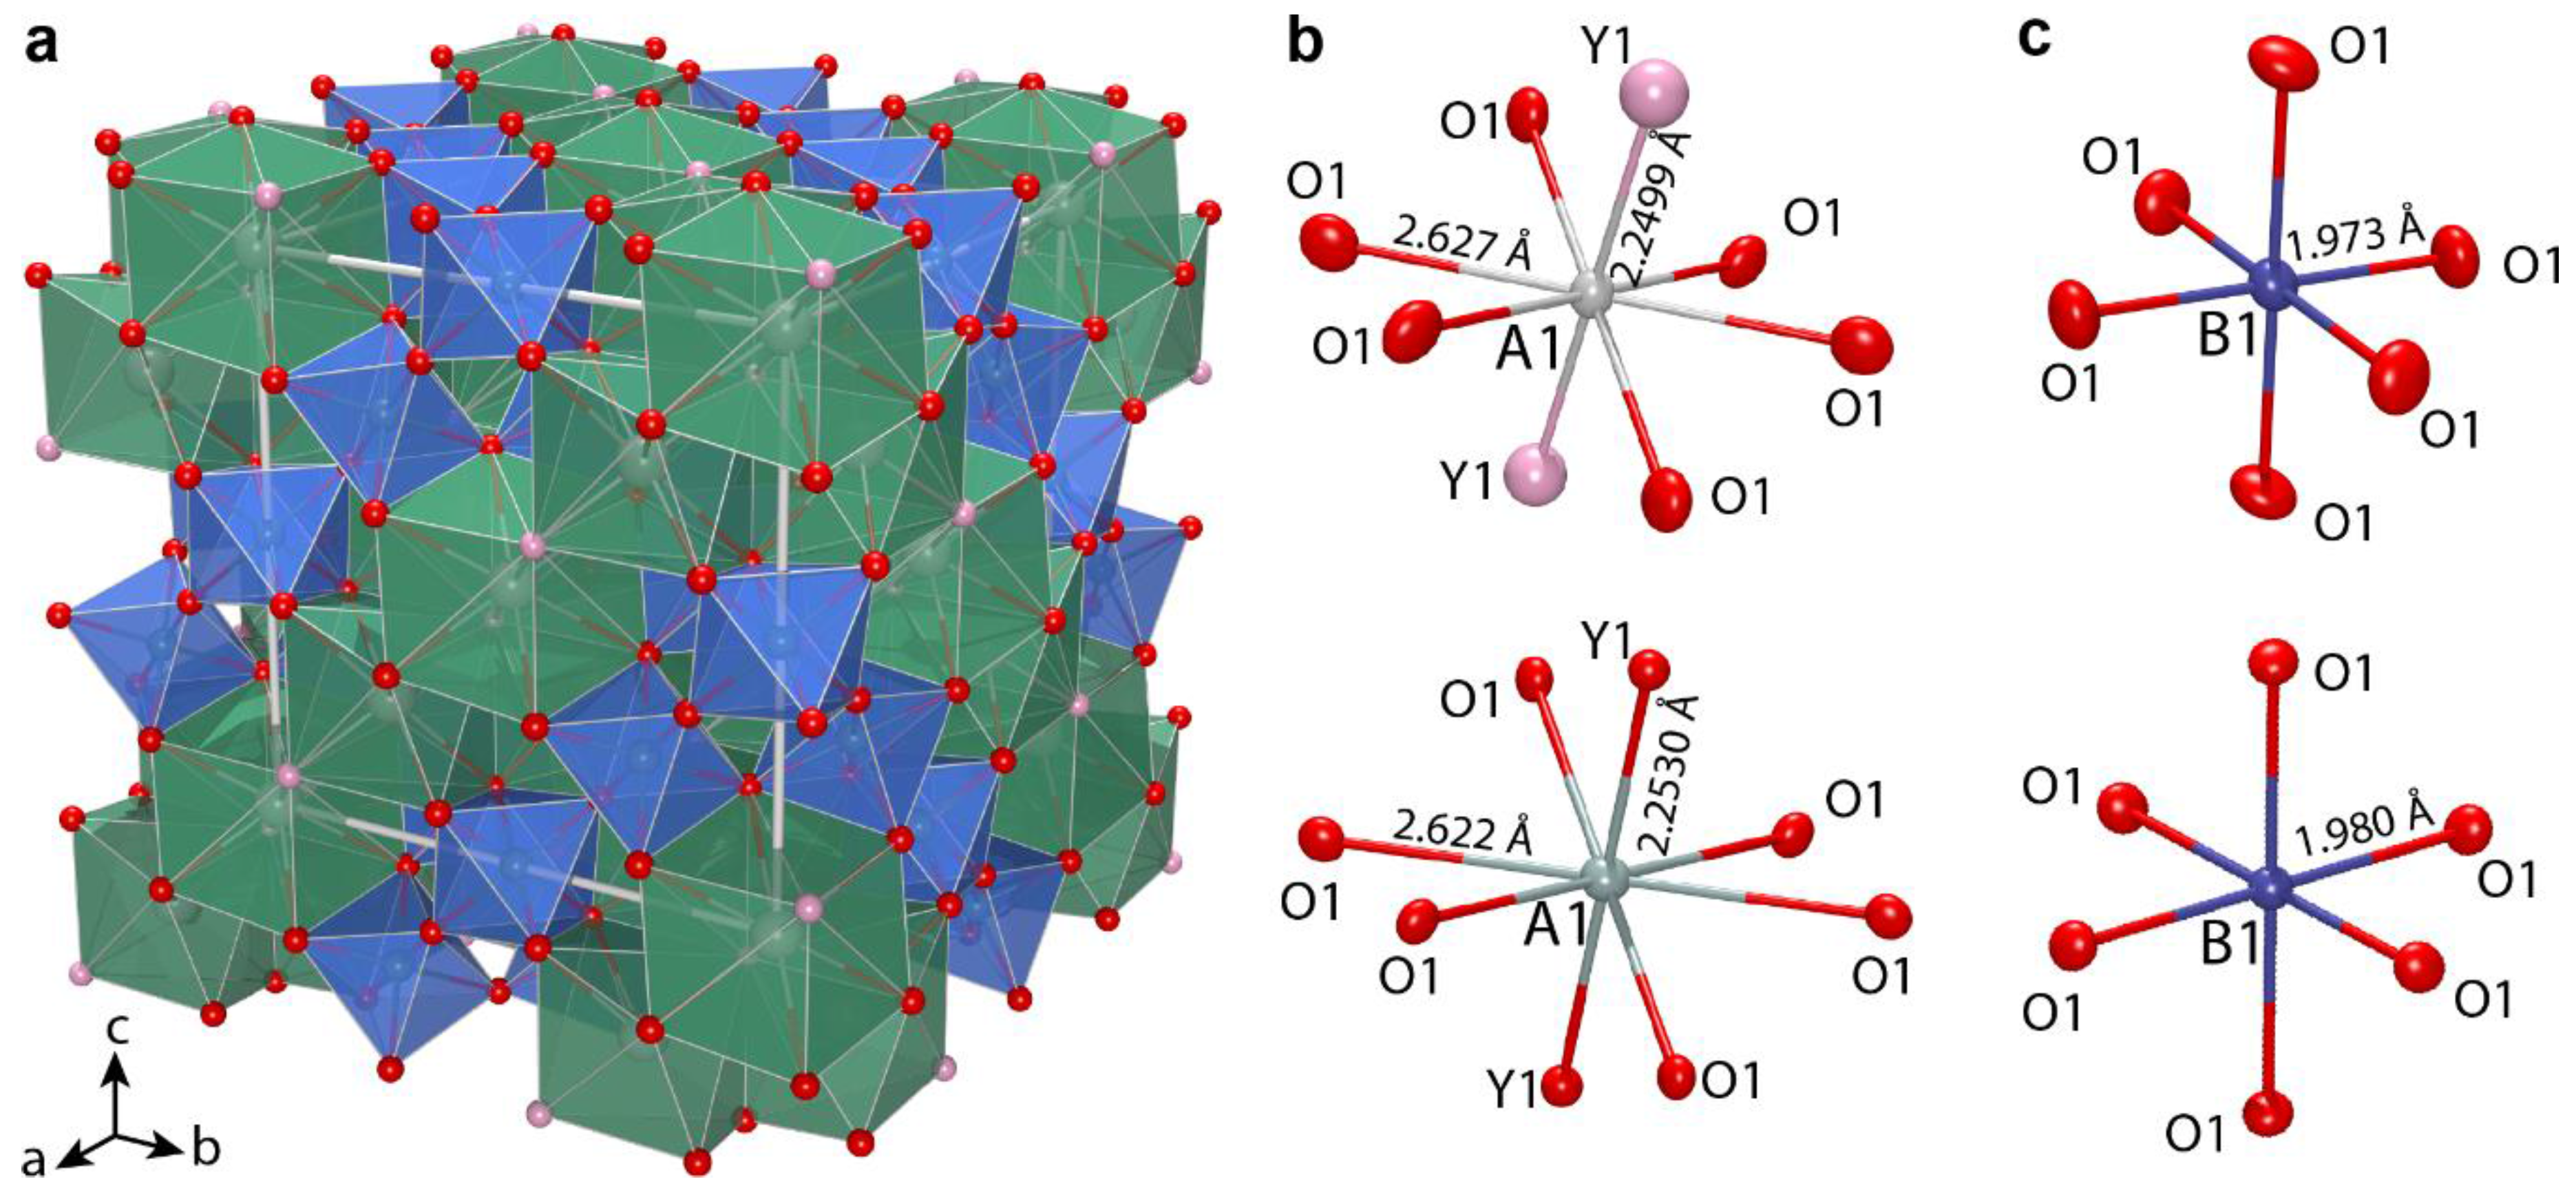
Crystal structures of oxycalciopyrochlore 917/318.5 and hydroxynatropyrochlore K-017-4 (
Figure 10) were refined in the
space group with
R1 values of 0.032 and 0.054, respectively. Octahedral
B site has scattering 39.7 and 33.2
epfu, respectively, which agrees well with occupancies (Nb
0.965Ti
0.02Ta
0.15)
1.00 and (Nb
0.65Ti
0.32Mg
0.02Ta
0.01)
1.00. The calculated scattering factor values of 22.1 and 18.7
epfu for the
A site slightly exceed the observed values of 18.7 and 15.3
epfu, probably, due to variation of Th- and U-content. In the crystal structure of oxycalciopyrochlore 917/318.5 and hydroxynatropyrochlore K-017-4, eight-coordinated
A sites are predominately occupied by calcium and sodium, respectively, and their final occupancies are (Ca
0.59Na
0.25Y
0.09Fe
0.02Th
0.02Ce
0.02La
0.01)
1.00 and (Na
0.49Ca
0.20□
0.13Fe
0.06Sr
0.06Th
0.04U
0.02)
1.00 respectively. The mean
A1‒O bond ranges from 2.530 to 2.533 Å, which is more suitable for ideal Ca‒O distance 2.54 Å than for ideal Na‒O distance 2.60 Å [
35]. For hydroxynatropyrochlore K-017-4, displacement parameters for the
Y site are slightly higher than those for oxygen, and are consistent with its occupancy by (OH)-groups (
Table 7); while for oxycalciopyrochlore 917-318-5, displacement parameters for
Y1 and O1 are almost equal.
Based on the structure refinement, crystal-chemical formulas of oxycalciopyrochlore 917/318.5 and hydroxynatropyrochlore K-017-4 can be determined as A(Ca1.18Na0.50Y0.18Fe0.04Ce0.04Th0.04La0.02)2.00 B(Nb1.93Ti0.04Ta0.015)2.00O6.00Y(O0.78OH0.22)1.00 and A(Na0.98Ca0.40□0.26Fe0.12Sr0.12Th0.08U0.04)2.00 B(Nb1.30Ti0.64Mg0.04 Ta0.02)2.00[O4.98OH1.02]6.00Y(OH0.61F0.39)1.00 respectively. According to the structural data, the common difference in scattering parameters of the B site (39.7 and 33.2 epfu) lies in agreement with the substitution scheme BTi4+ + YOH− = BNb5+ + YO2−. For oxycalciopyrochlore 917/318.5, lower means of Y1 site displacement parameters reflect lesser content of (OH)-groups as compared to hydroxynatropyrochlore K-017-4.
3.4. Raman Spectroscopy
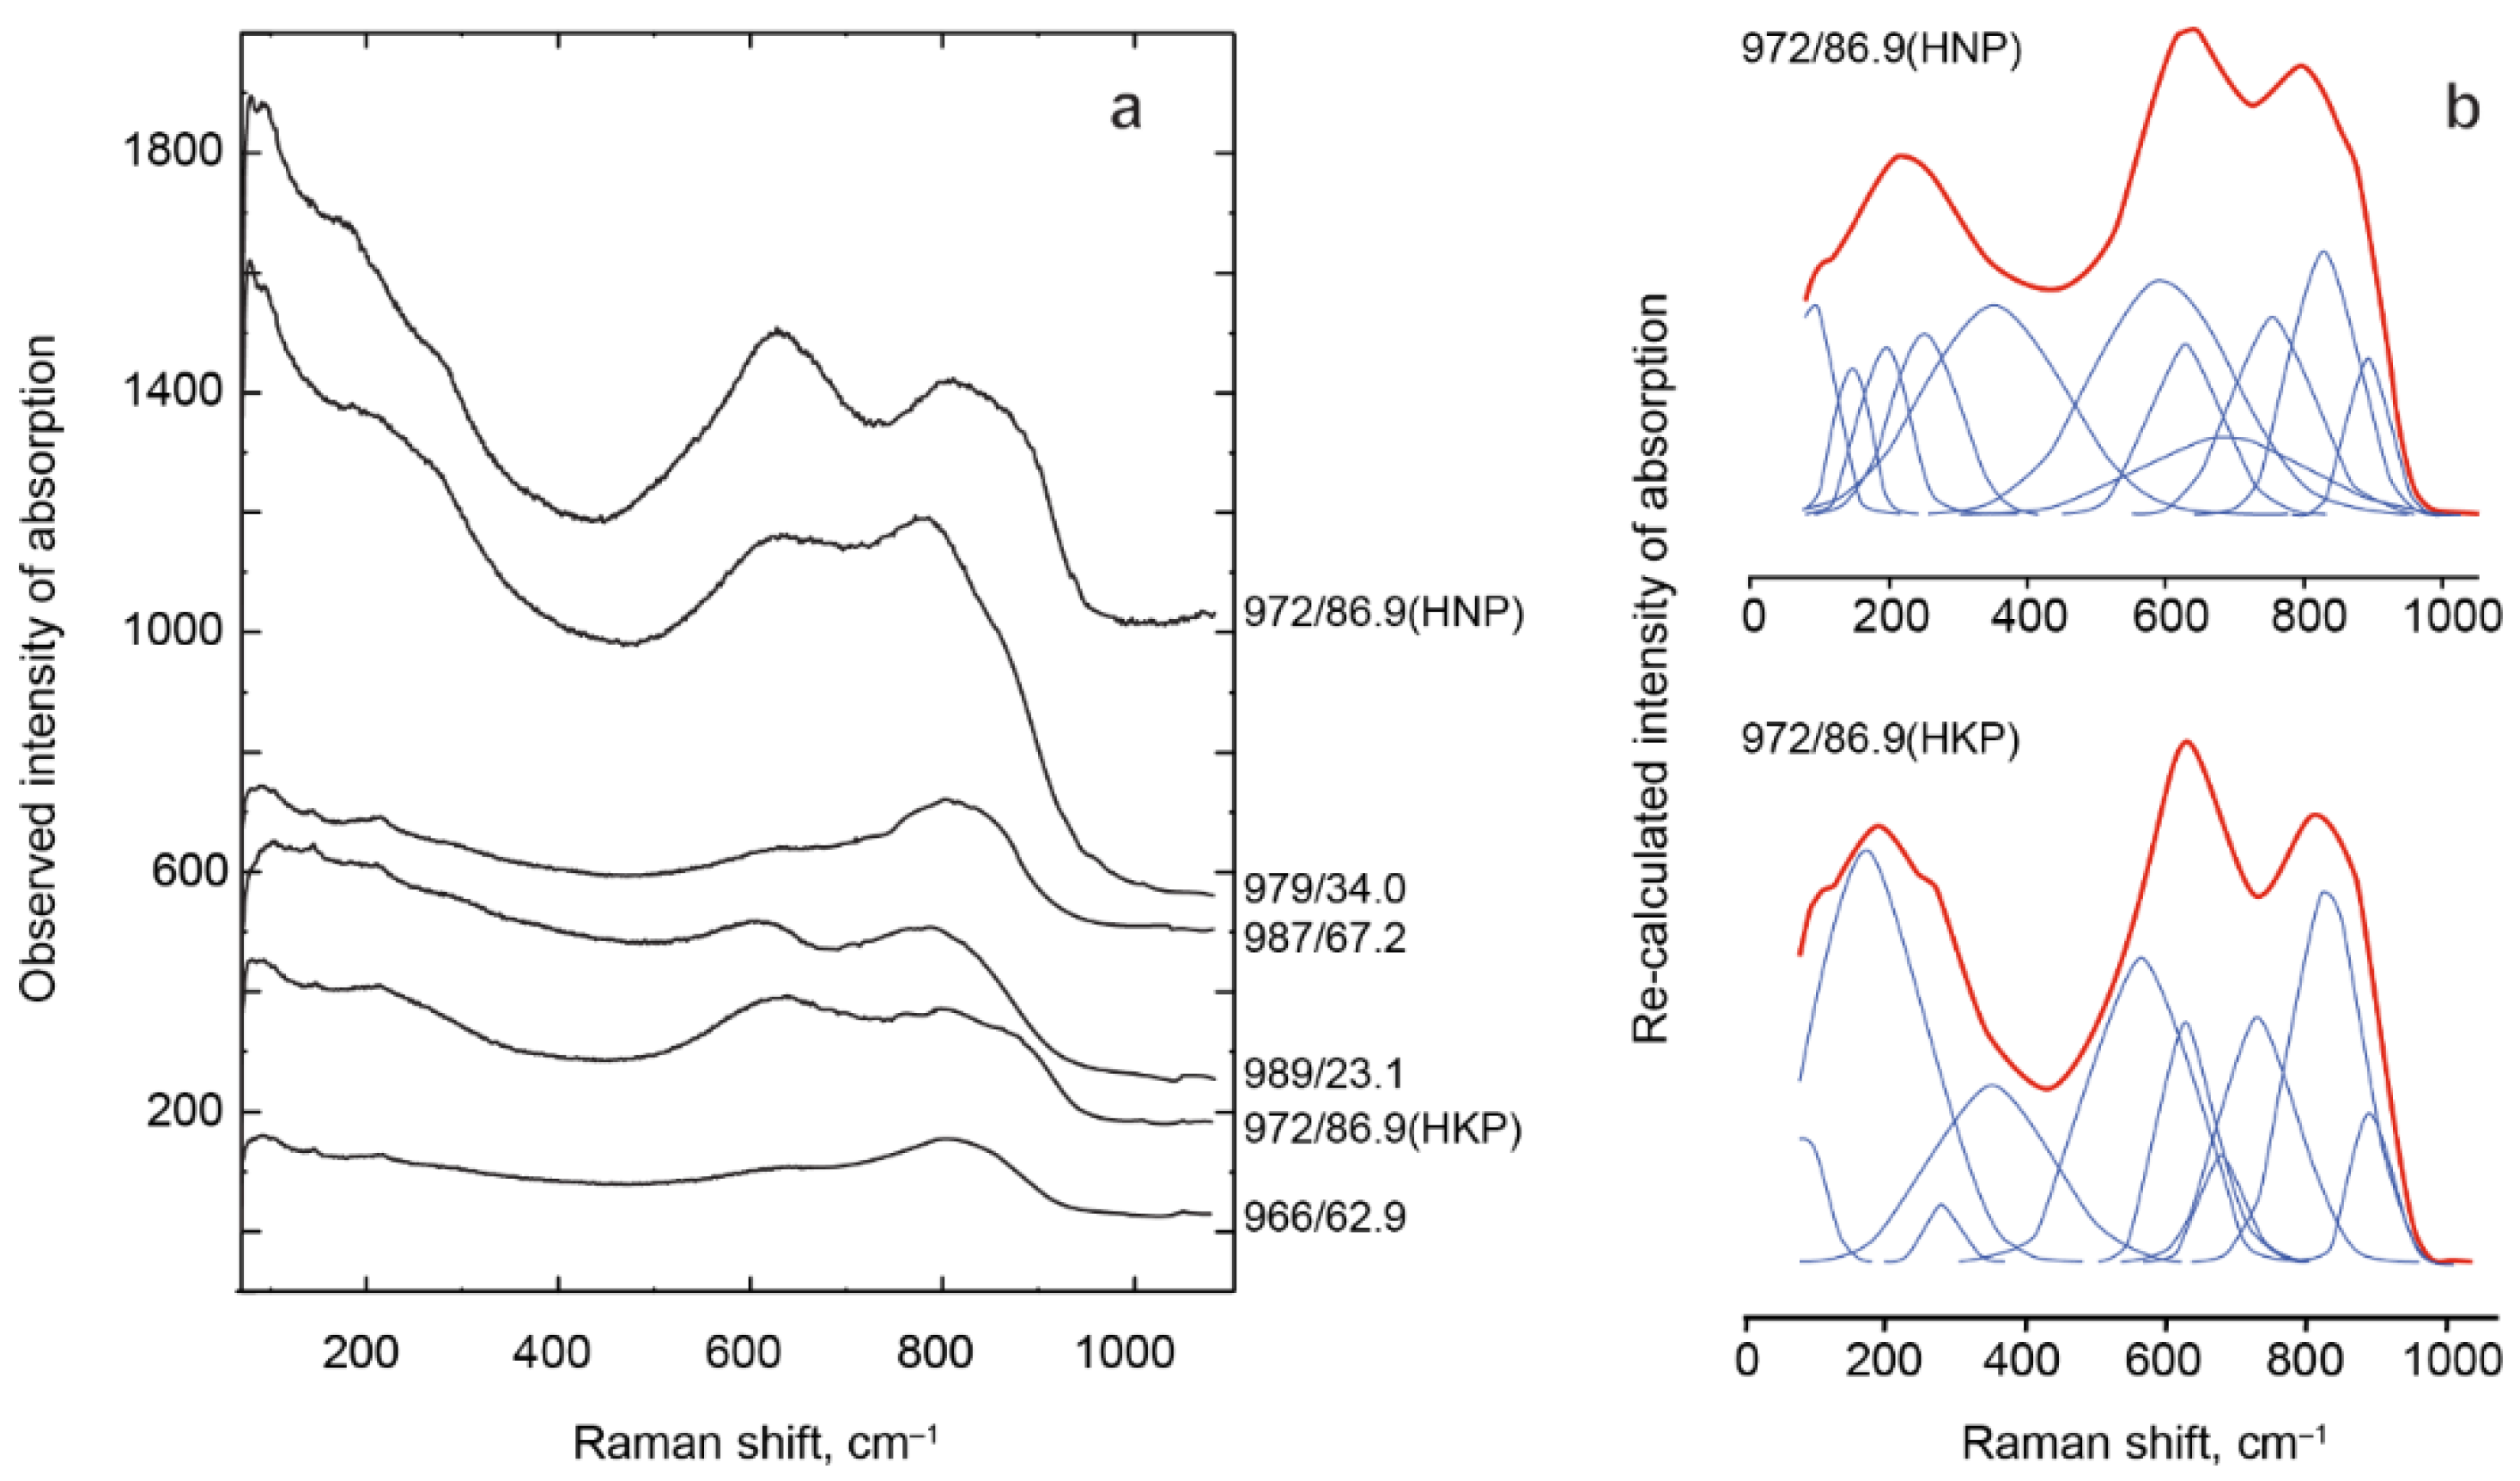
The PSM Raman spectra obtained under the same conditions showed significantly different observed intensities
Iobs of absorption bands (
Figure 11a). The observed intensity of the spectrum depends on mineral crystallinity, which, in turn, gradually decreases with growth of U and Th total content from 0.13
apfu in HNP 972/86.9 to 0.47
apfu in ONP 966/62.9 (
Table 9). For the same reason, the stability of the UTh-rich PSM decreases under the influence of laser beams. Corrected absorption band intensities
I were calculated as
I =
Iobs/(
n(
ω) + 1), where
n(
ω) is the Bose (Einstein factor).
Figure 11b shows the results for a zoned HKP-HNP crystal from calcite carbonatite 972/86.9.
The absorption bands (see
Table 9) were assigned by analogy with other pyrochlore-like compounds [
36,
37,
38] taking into account theoretical considerations by McCauley [
39] and Arenas et al. [
40]. According to McCauley [
39], pyrochlore yields six Raman-active modes and one acoustic. These modes involve four vibrations of
F1u,
F2g,
Eg, and
A1g symmetry. Theoretical calculations by [
40] consider bands in the region of 70–180 cm
−1 as related to acoustic modes (lattice vibrations or bending modes of O-
A-O and stretching modes of
A-BO
6). Bands in the region of 250–400 cm
−1 can be assigned to different modes of
A-O vibrations. The most intensive bands are related to bending vibrations of O-
B-O bonds (400–680 cm
−1) and stretching vibrations of
B-O bonds in
BO
6 octahedra (680–900 cm
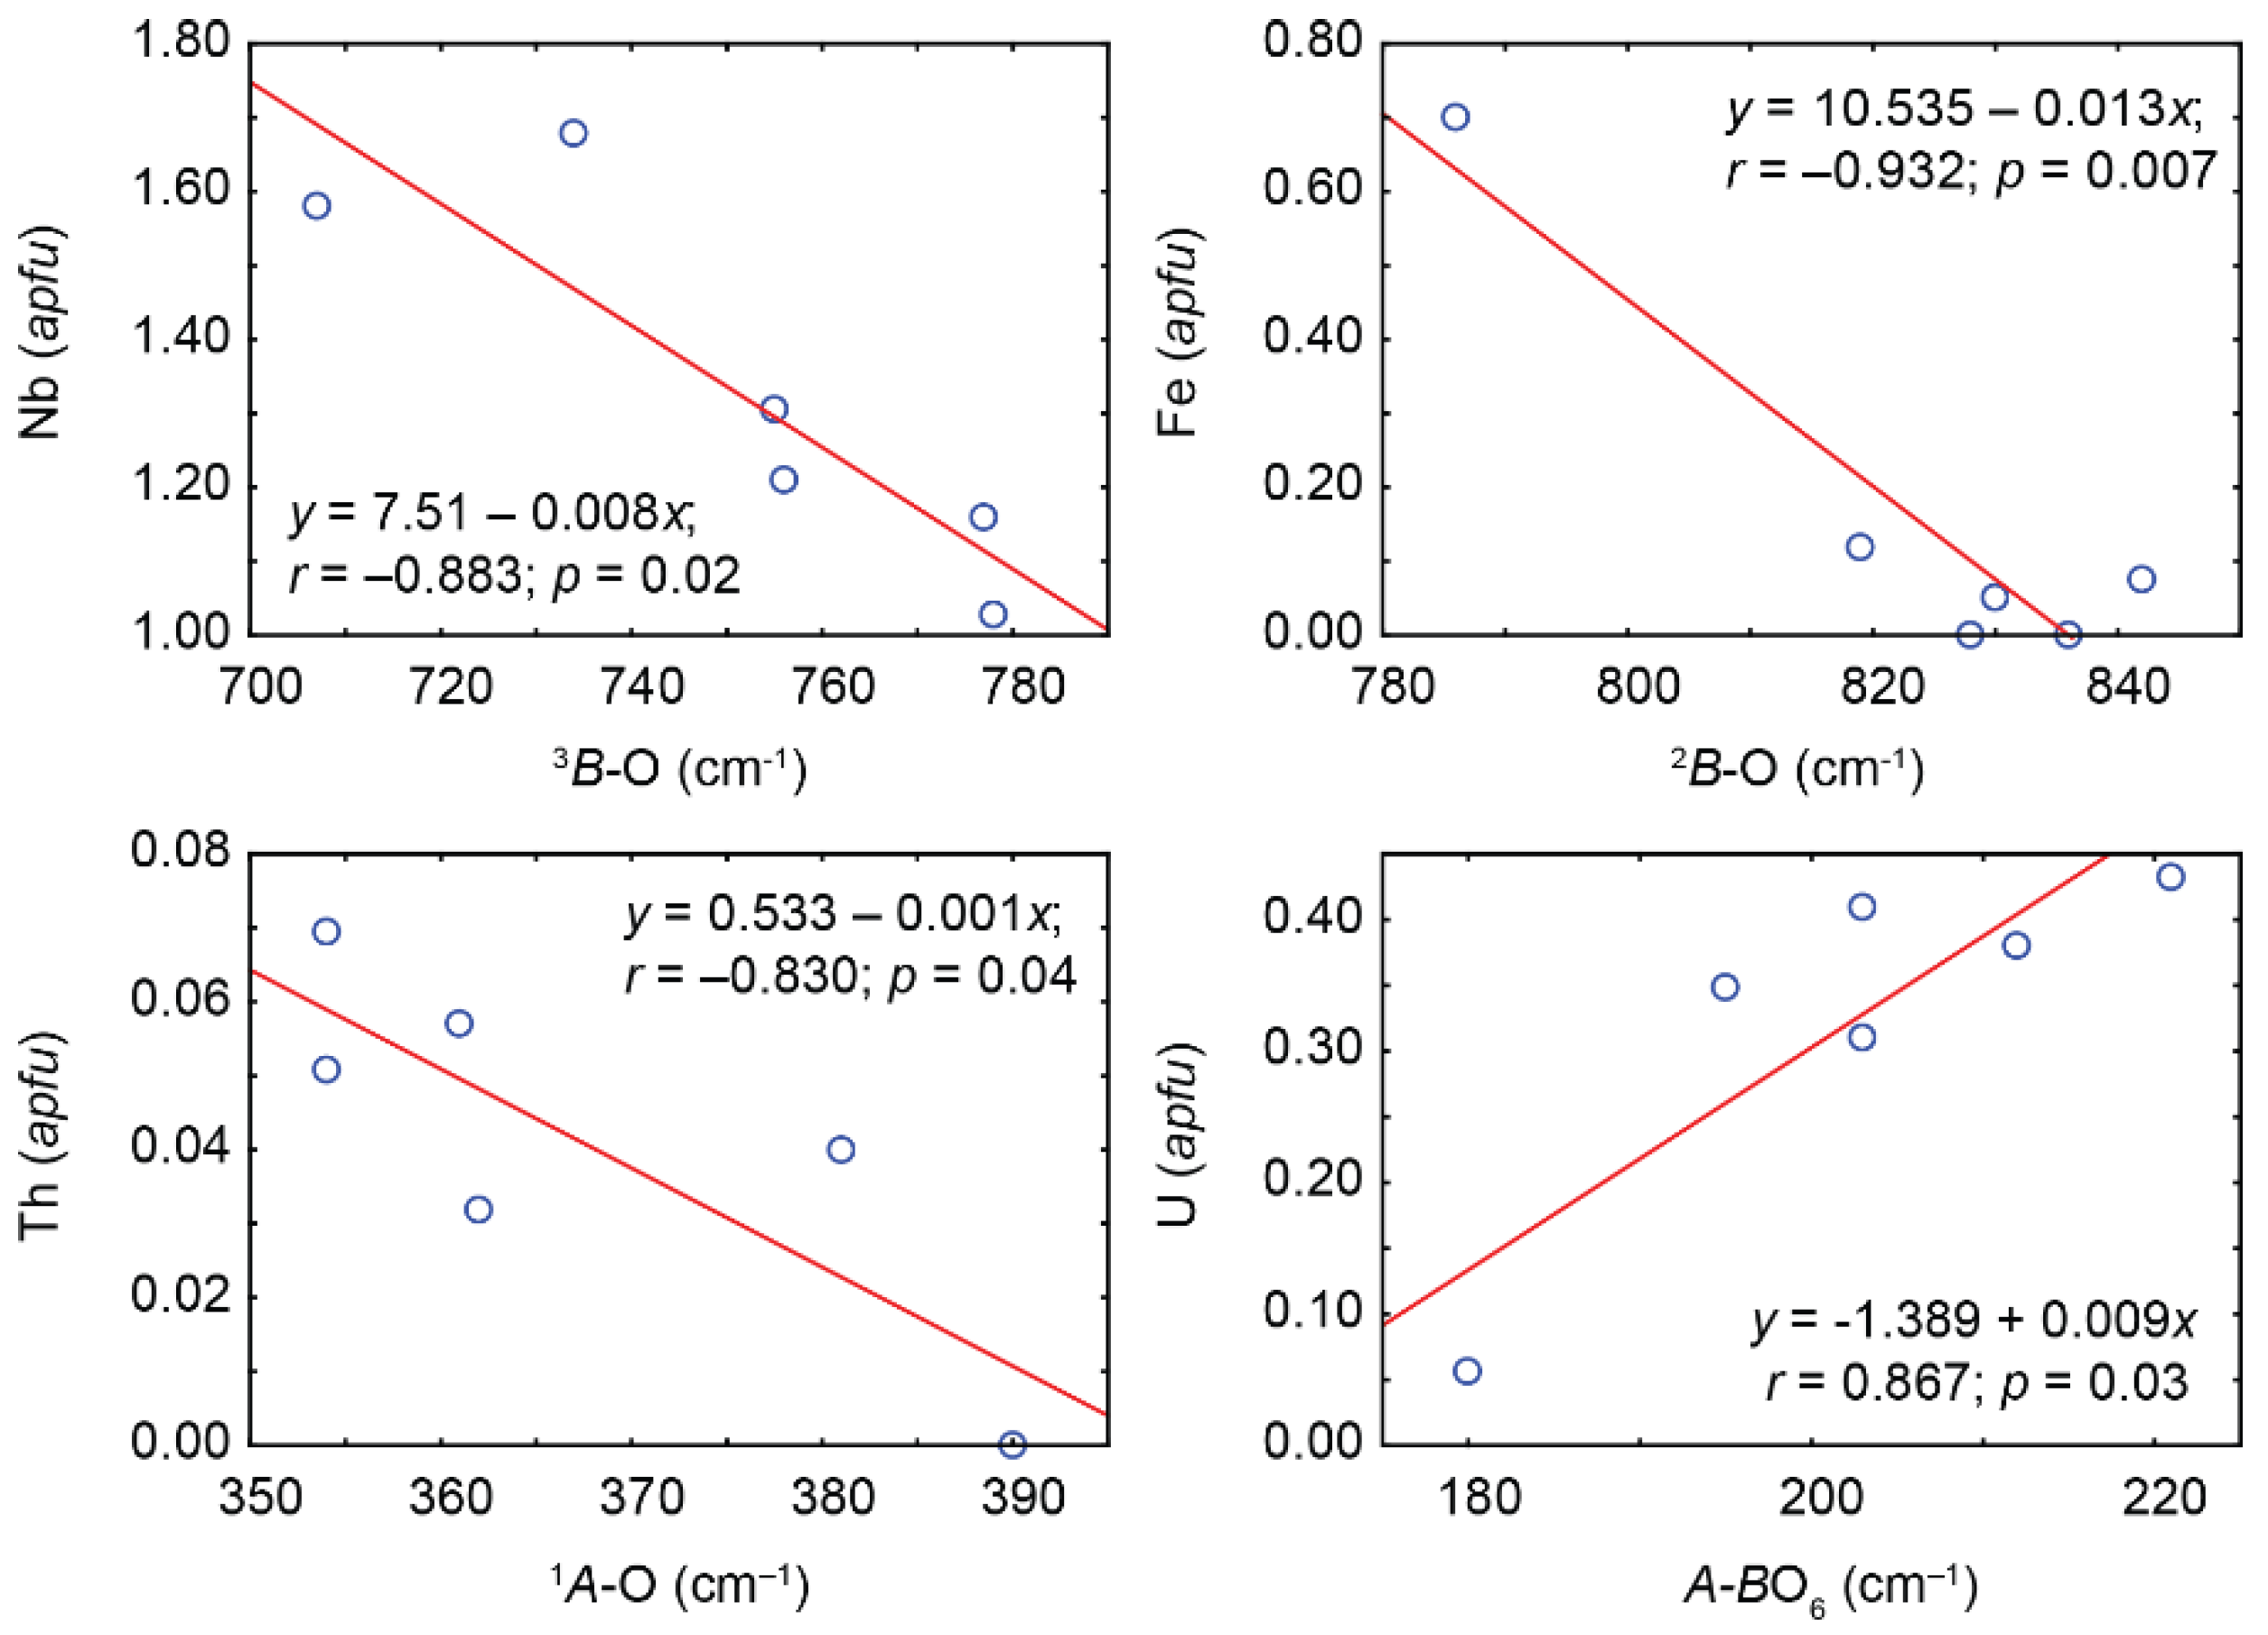
−1). Positions of typical absorption bands caused by different stretching vibrations depend on composition of the corresponding polyhedra (
Figure 12), which enables us to estimate the content of major impurities using the PSM Raman spectra.

 ,
, 


