Article

Dating Metasomatism: Monazite and Zircon Growth during Amphibolite Facies Albitization

1
Department of Earth, Environmental and Planetary Sciences, Rice University, Houston 77005, TX, USA
2
Department of Geological Sciences, University of Colorado, Boulder 80309, CO, USA
3
Department of Geology, The University of Kansas, Lawrence 66045, KS, USA
*
Author to whom correspondence should be addressed.
Minerals 2018, 8(5), 187; https://doi.org/10.3390/min8050187
Submission received: 24 March 2018 / Revised: 20 April 2018 / Accepted: 24 April 2018 / Published: 29 April 2018

Abstract

:
We present coupled textural observations and trace element and geochronological data from metasomatic monazite and zircon, to constrain the timing of high-grade Na-metasomatism (albitization) of an Archean orthogneiss in southwest Montana, USA. Field, mineral textures, and geochemical evidence indicate albitization occurred as a rind along the margin of a ~3.2 Ga granodioritic orthogneiss (Pl + Hbl + Kfs + Qz + Bt + Zrn) exposed in the Northern Madison range. The metasomatic product is a weakly deformed albitite (Ab + Bt + OAm + Zrn + Mnz + Ap + Rt). Orthoamphibole and biotite grew synkinematically with the regional foliation fabric, which developed during metamorphism that locally peaked at upper amphibolite-facies during the 1800–1710 Ma Big Sky orogeny. Metasomatism resulted in an increase in Na, a decrease in Ca, K, Ba, Fe, and Sr, a complete transformation of plagioclase and K-feldspar into albite, and loss of quartz. In situ geochronology on zoned monazite and zircon indicate growth by dissolution–precipitation in both phases at ~1750–1735 Ma. Trace element geochemistry of rim domains in these phases are best explained by dissolution–reprecipitation in equilibrium with Na-rich fluid. Together, these data temporally and mechanistically link metasomatism with high-grade tectonism and prograde metamorphism during the Big Sky orogeny.

1. Introduction

Fluids can significantly influence the chemical characteristics and rheological behavior of the deep crust and lithosphere. Metasomatic alteration can locally affect processes such as strain concentrations and gradients, due to shifts in rheological properties [1,2,3], and material transport via vein formation and ore deposition [4]. Regionally high fluid fluxes can catalyze metamorphism [5], and have much larger scale effects, such as transformation of the density structure of the lithosphere [6,7,8]. Within subduction zone systems, fluids transport large amounts of solute, efficiently silicifying overriding crust (e.g., [9]), a process which can influence mechanical plate behaviors [10].
Establishing the ambient conditions under which alteration occurs, the origin of the fluids, and the timing of metasomatism are all important aspects that facilitate understanding these geologic processes. However, these variables can be difficult to constrain. Obtaining pressure-temperature (P-T) conditions of metasomatism is often a challenge, due to convoluted or unclear overprinting relationships between fluid alteration conditions and prior or subsequent metamorphism, making it problematic to apply traditional thermobarometry to these kinds of rocks [11]. Identifying fluid sources that catalyze these alterations can be difficult, particularly where fluid inclusions of the primary metasomatic agent are lacking [12]. Pinpointing the exact timing of metasomatism also remains a difficult task, often because of the multidomainal nature of metasomatic phases, phase growth via dissolution–precipitation, and the difficulties inherent in distinguishing datable phase (e.g., zircon, monazite) growth as fluid-related, rather than closed system metamorphism [13]. Constraints on the timing of metasomatism are often best provided by integrating textural, morphological, geochronologic, and geochemical analysis of accessory mineral phases [14,15,16]. It is this last challenge that we focus on for this contribution: providing robust geochronological constraints on metasomatism and fluid alteration.
Albitization is a common metasomatic process by which Na-rich fluid infiltration leads to the alteration of granitoids and metasedimentary rocks, transforming feldspar of variable compositions into more albitic feldspar [17]. During the transformation of calcic plagioclase into albite, quartz will also be consumed [18], and marked increases in Na and decreases in K, Rb, Ba, and Ca in the bulk rock composition are common. Albitization can occur over a range of crustal conditions, from diagenetic to upper amphibolite and even granulite facies (e.g., [19]).
In this contribution, we evaluate the origin of an albitite that occurs in the Precambrian rocks of the Northern Madison Range in Southwest Montana. We consider both metasomatic and magmatic mechanisms of formation, and present field observations, geochemical data, and monazite and zircon morphology, textures, geochronology, and geochemistry. The results indicate that fluid flow and localized metasomatism of the margin of an Archean granodioritic orthogneiss occurred at 1750–1735 Ma, and establish a temporal link between albitization, metamorphism, and deformation during the Late Paleoproterozoic (~1800–1710 Ma) Big Sky orogeny [20,21]. This implies that local metasomatism and fluid infiltration was active during peak metamorphism and fabric development within this continental collision, rather than magmatic emplacement.

2. Geologic Background

2.1. Regional Geologic Setting

The Precambrian rocks of Southwestern Montana are exposed predominantly in Laramide uplifts and Basin and Range structures (Figure 1A). These consist of Archean to Paleoproterozoic orthogneiss units with several suites of deformed intrusive mafic dikes and interleaved supracrustal metamorphic rocks [21,22,23,24]. The majority of these lithologies have Archean protoliths, and along the northwestern margin of the Wyoming province, they contain evidence for at least two high temperature thermotectonic events: the enigmatic 2500–2450 Ma Tobacco Roots–Tendoy orogeny [20,25,26,27] and the 1800–1710 Ma Big Sky orogeny [20,22], interpreted as the results of the Wyoming province docking with the rest of the Archean core of Laurentia during the amalgamation of supercontinent Nuna [28,29]. To the southeast of the rocks overprinted by Paleoproterozoic thermotectonism, K-Ar and 40Ar-39Ar thermochronology indicates that the Archean rocks have not been thermally overprinted since the Neoarchean (Figure 1A,B; [30,31,32]).
Rocks in the study area of Bear Basin, located in the Gallatin Peak terrane of the Northern Madison Range (Figure 1B), are composed of quartzofeldspathic orthogneisses, foliated granitoids, amphibolite, quartzite, leucogranite sheet dikes, and intercalated supracrustal schist (Figure 1C; [20,22,33]). Foliated granitoids and orthogneiss units have U-Pb zircon crystallization ages between ~2.8–3.2 Ga [34].
There is evidence of multiple metamorphic events [3], and at least three phases of high-grade deformation in and nearby the northern Gallatin Peak terrane [20,33,35]. The oldest deformation fabrics (D1) are compositional layered surfaces that are subsequently folded and overprinted by the more pervasive second and third deformational phases. This younger deformation includes regional D2 and locally occurring D3 events, both occurring during the late Paleoproterozoic Big Sky orogeny [20]. Major D2 structures in the region, including map scale folds of earlier D1 surfaces (Figure 1C), are Northeast–Southwest striking and moderately to steeply southeast dipping foliations, and strong southeast plunging mineral lineations. D3 structures are limited to local SE-vergent z-folds. These structures developed between ~1740–1720 Ma at metamorphic conditions of ~0.9 GPa and ~700 °C [20].
The rocks of Bear Basin and the surrounding area preserve field and textural evidence for pervasive fluid flow, including coarse-grained orthoamphibole, garbenschiefer textures within multiple units, and the presence of pervasive hydrous phases. Additional evidence for enhanced flow along some lithologic contacts include metasomatic alteration in the form of garnetiferous regions within typically garnet poor rock types, and the local appearance of kyanite-bearing white colored schists, a rock type that has been interpreted to indicate fluid alteration in other regions [19].

2.2. Local Rock Types

Within the Bear Basin region (Figure 1C), the major rock units are dominated by several weakly to moderately foliated Archean orthogneisses. The dates quoted below (at 2σ uncertainty) are from multi-grain zircon U-Pb TIMS analysis by Weyand [34], unless otherwise stated. Along the northern side of the Bear Basin headwall, the oldest unit is a layered tonalitic gneiss with a crystallization age of 3244 ± 19 Ma. Southeast of the tonalitic gneiss is a weakly foliated Hbl + Pl + Qz +Tnt + Zrn monzodiorite with an age of 3195 ± 43 Ma (abbreviations as defined in [37]). The next youngest unit crops out as a broadly tabular NE-trending body of weakly foliated porphyroclastic granodiorite (Figure 2A,B) in the southern part of the map area in Figure 1C. This unit contains Kfs + Pl + Qz + Hbl + Bt + Zrn, and has a zircon U-Pb crystallization age of 3177 ± 36 Ma. It is generally weakly foliated with a fabric defined by elongate K-feldspar phenocrysts and alignment of amphibole and biotite (Figure 2A,B and Figure 3A). Mogk et al. [38] interpreted these units to represent a ca. 3.2 Ga calc-alkaline continental magmatic arc.
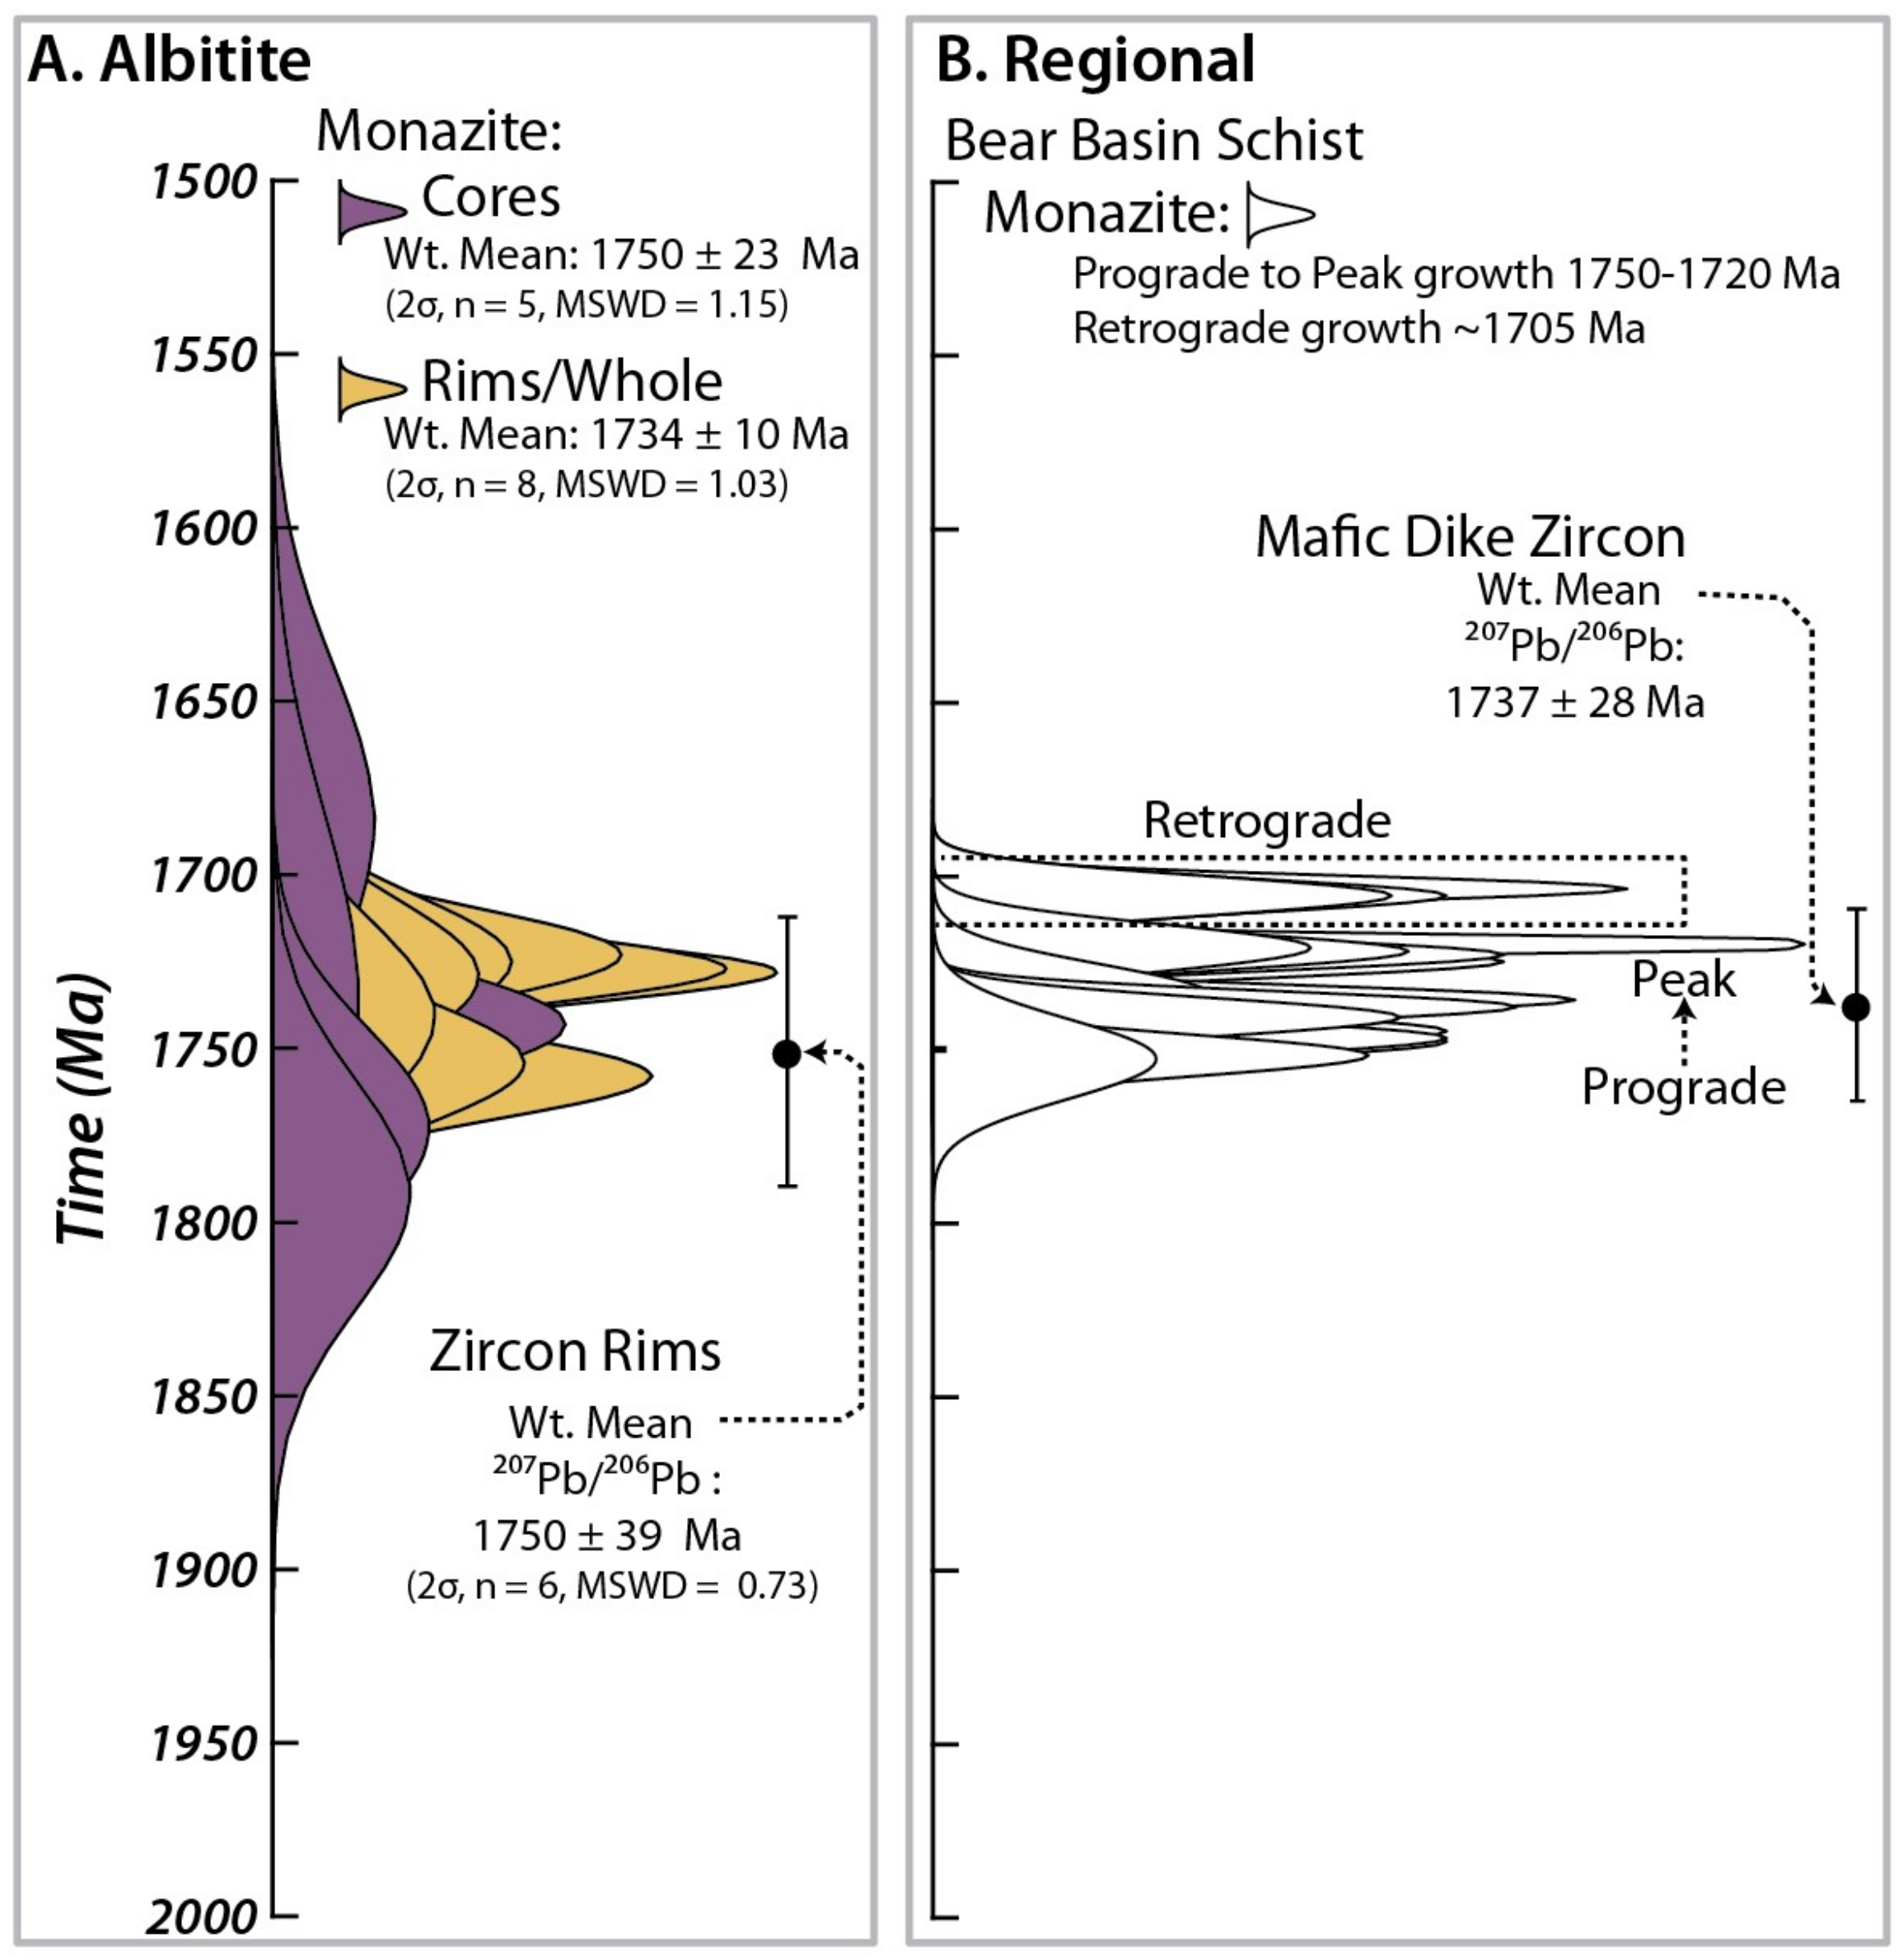
The fourth major unit is comprised of intimately mixed and undifferentiated migmatitic biotite schist, granite, and granitic gneiss (Bt ± Grt gneiss in Figure 1C). No structures suggesting a sedimentary origin were recognized within the map area, and no aluminous metamorphic index minerals, other than local garnet, occur. Weyand [34] interprets this unit’s protolith as igneous and reports a zircon U-Pb date of 2868 ± 34 Ma. Garnet within this unit is generally small (<500 µm) except along the southeastern contact, where porphyroblasts reach >1.5 cm diameter and occur with garbenschiefer-textured amphibole. In contact with the monzodiorite to the southeast is a Bt + Grt ± Ky ± Sil ± St schist, informally called the Bear Basin schist by Condit et al. [20]. U-Th-total Pb chemical analysis of monazite yielded dates between ~1750–1705 Ma, interpreted as growth during prograde to peak to retrograde conditions, during D2 and D3 fabric development [20]. Condit et al. [20] also dated metamorphic zircon from a nearby deformed mafic dike, which yielded a 207Pb/206Pb weighted mean age of 1737 ± 28 Ma.
Minor units that are generally too small to show on the geologic maps include mafic and felsic dikes, as well as the albitite that is the subject of this contribution. This albitite is a lens of white, weakly deformed rock that crops out between the biotite ± garnet gneiss and the porphyroclastic granodiorite (Figure 3 and Figure 4A). Undated leucogranite sheets are 1–5 m wide, generally weakly deformed, and occur locally within the biotite ± garnet gneiss (Figure 1B and Figure 2E). The contacts of these Kfs + Pl + Grt + Bt + Qz + Zrn + Mnz leucogranite sheets are concordant with the regional D2 foliation surfaces within the gneiss.

3. Albitite

3.1. Field Occurrence

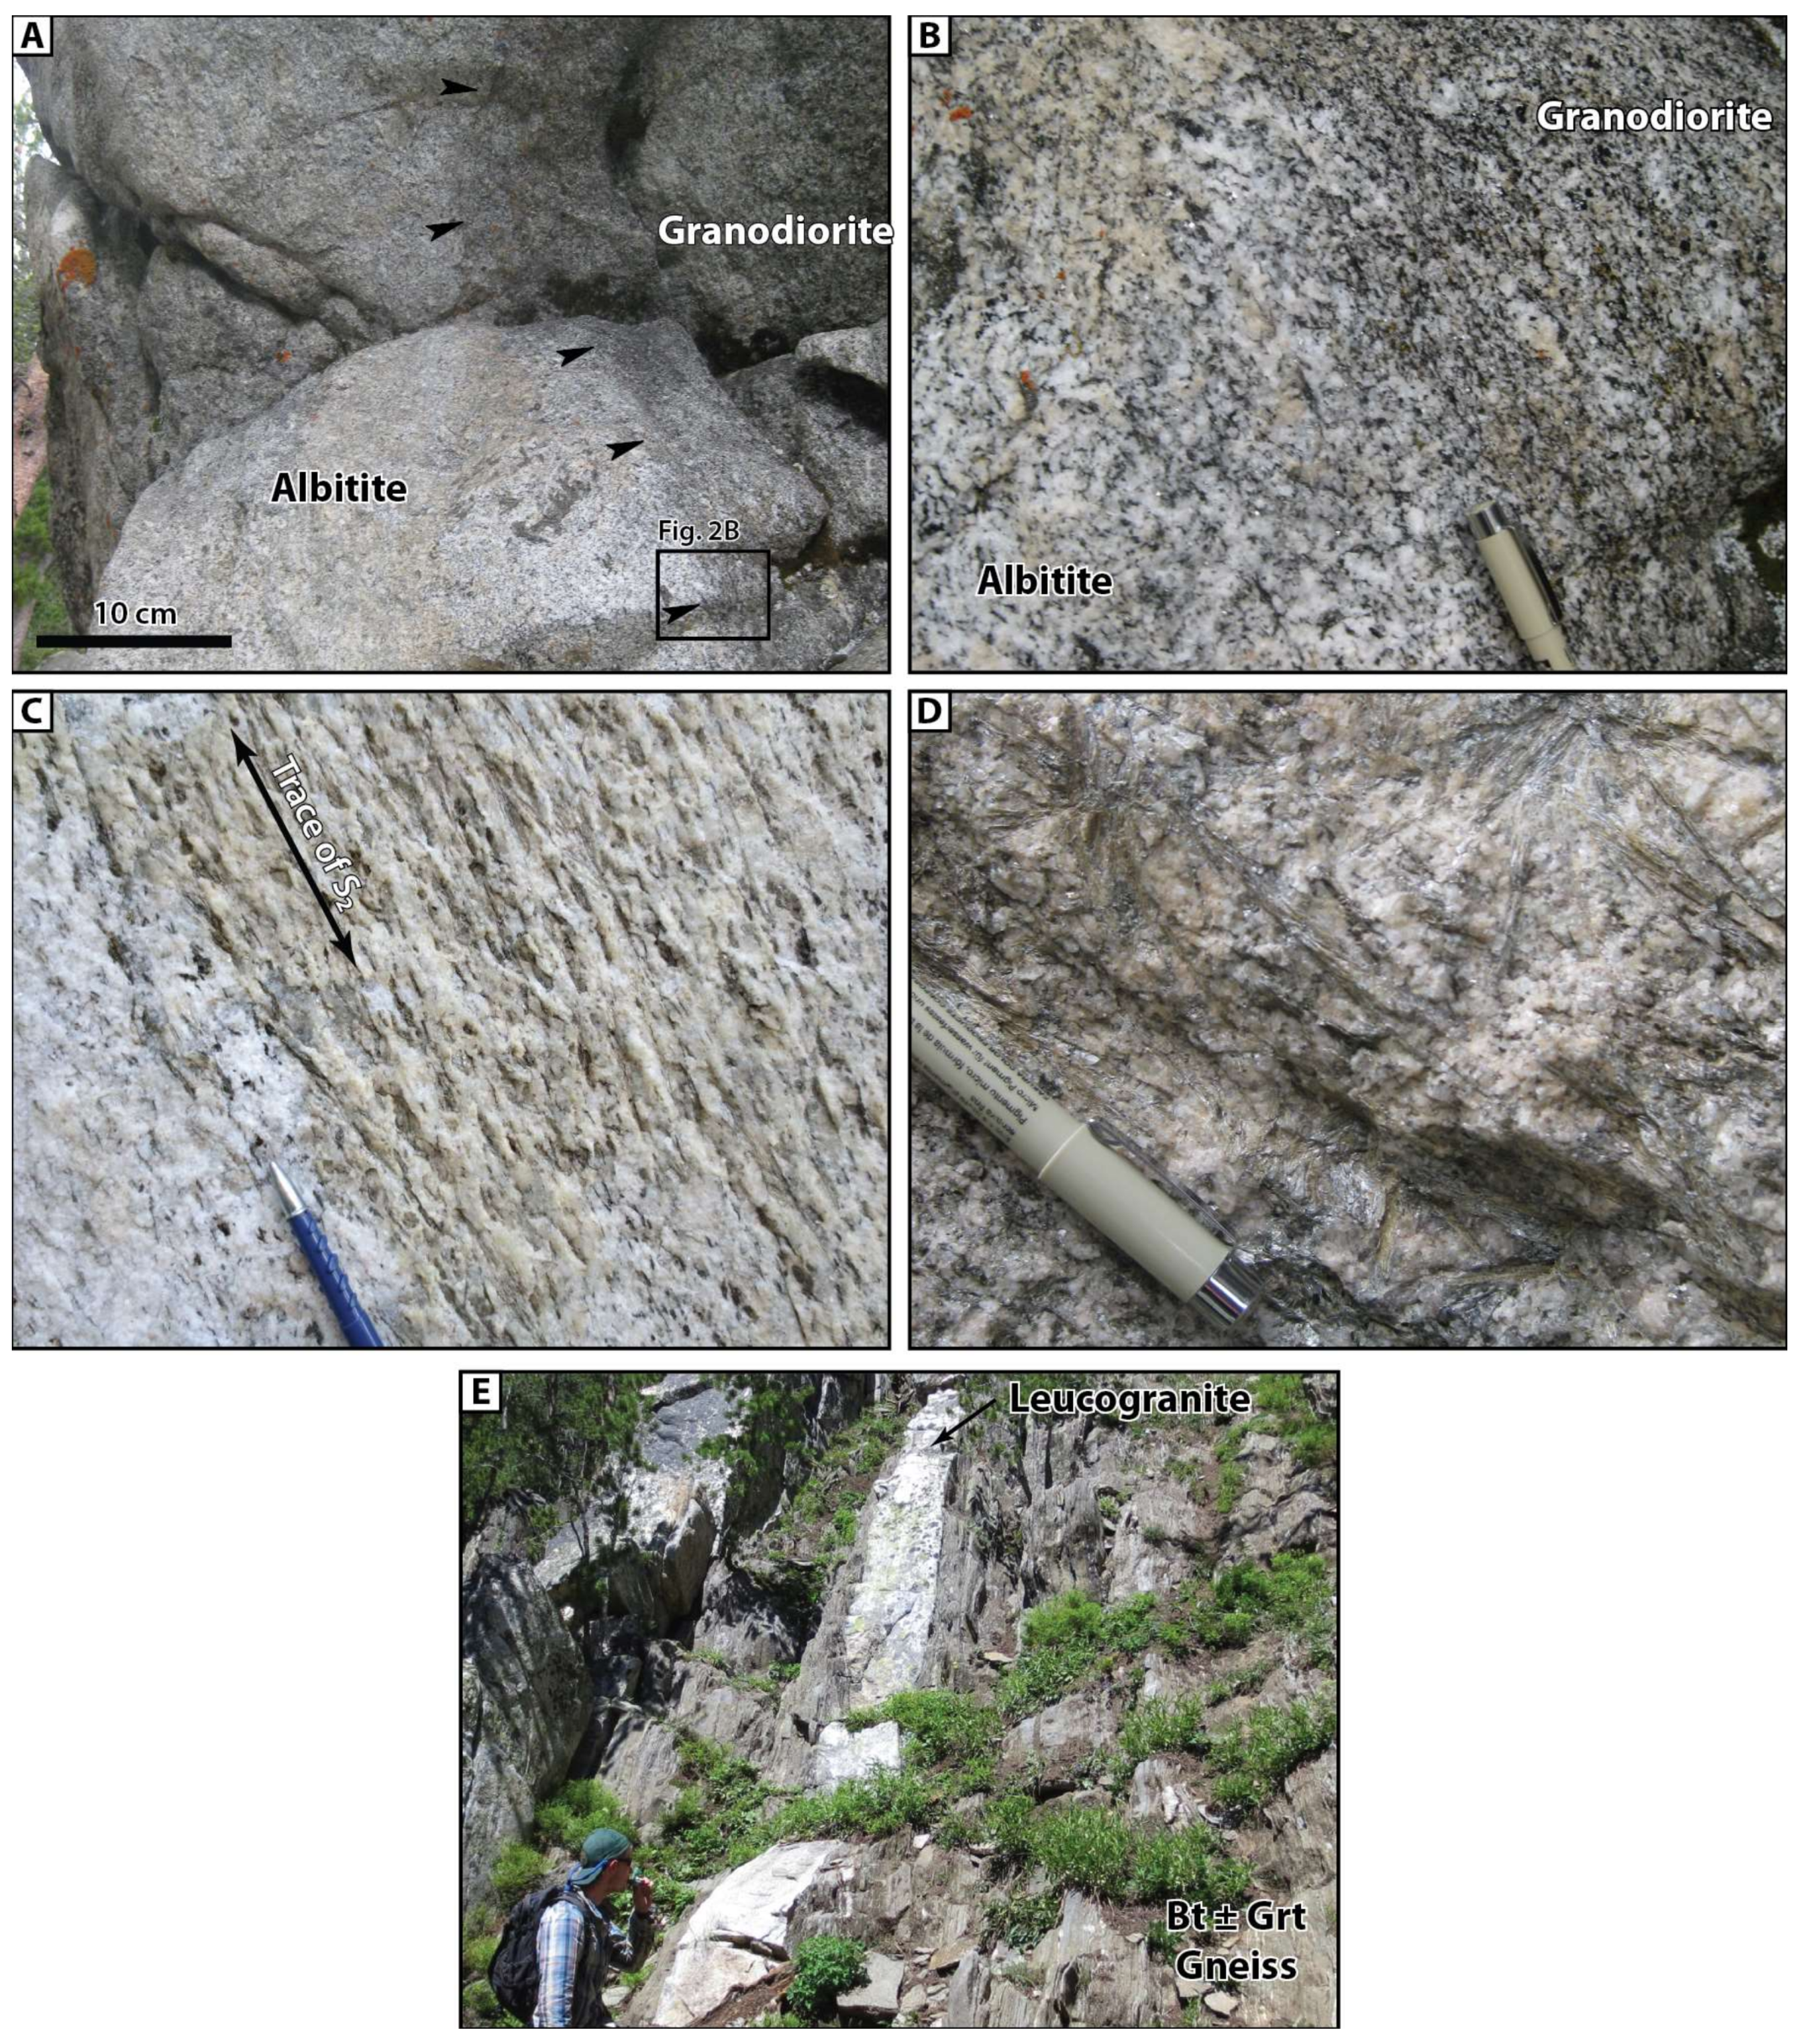
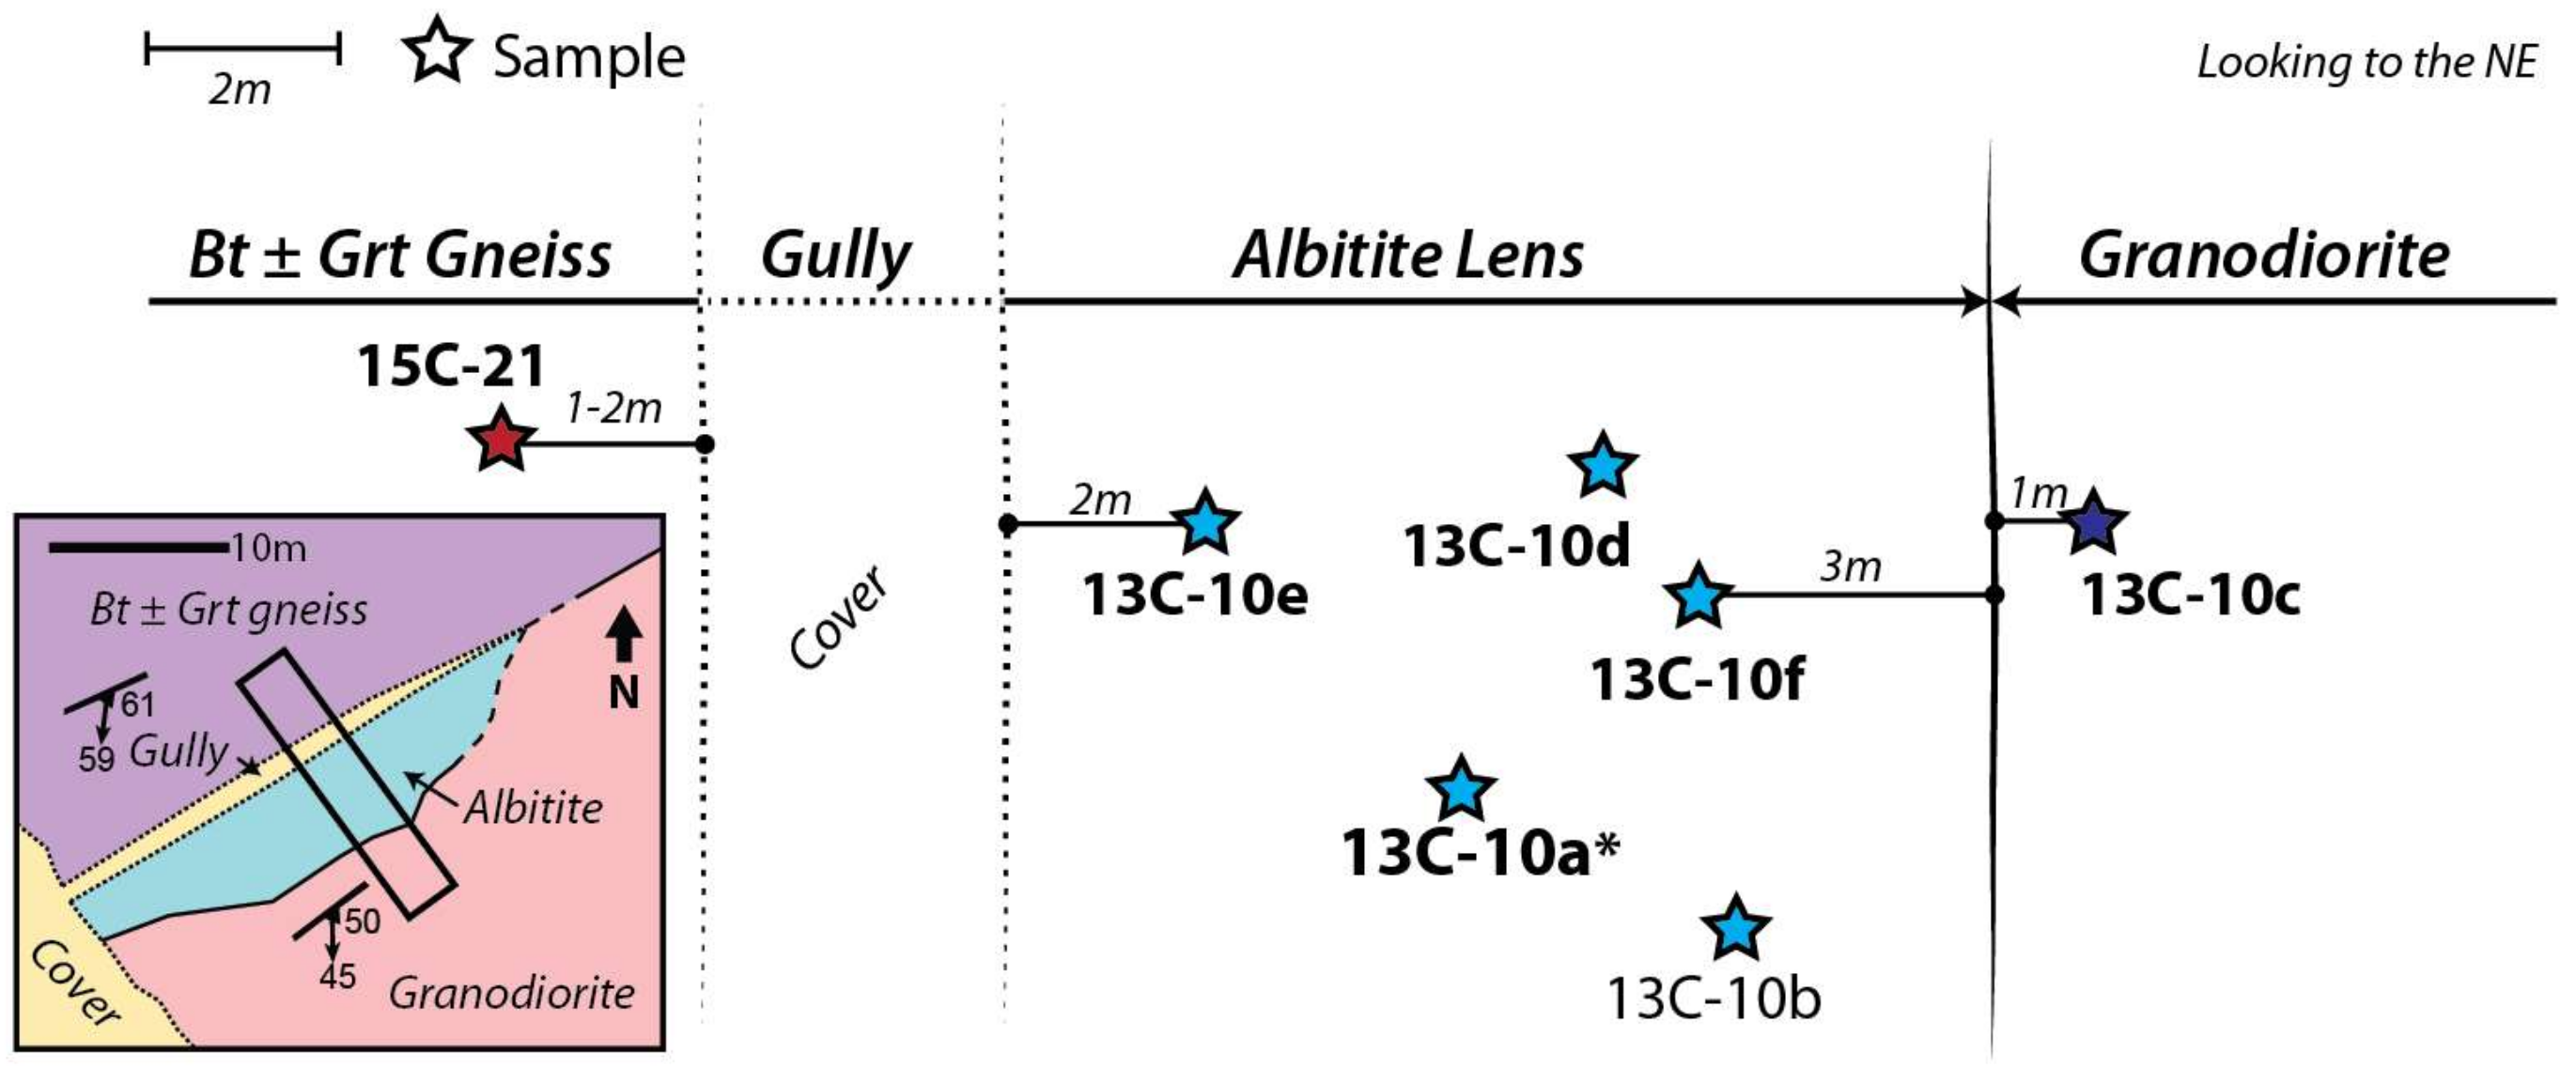
The albitite crops out as a ~10 m wide lens along the northwestern contact of the porphyroclastic granodiorite, locally separating it from the biotite ± garnet gneiss (Figure 1C, Figure 2A,B and Figure 3). Although the contact between the albitite and the gneiss is obscured by a small 2–3 m wide gully, the contact with the granodiorite is well exposed and gradational over several centimeters (Figure 2A,B and Figure 3). Neither unit crosscuts the other, and the contact is approximately parallel to the local orientation of S2. To the northeast along the strike, the albitite apparently pinches out, while the area below the outcrop is obscured by alluvium. Thus, the albitite is interpreted to have a lenticular 3D shape. The albitite has a weakly developed foliation (parallel to regional S2) that strikes northeast and dips moderately to the southeast, and contains a mineral lineation defined by orthoamphibole blades and biotite (Figure 2C). Internally, foliation surfaces contain garbenschiefer textures defined by orthoamphibole blades (Figure 2D). Multiple samples were collected in the albitite to evaluate internal variations across the lens, and samples were also collected from both the Bt ± Grt gneiss and the granodiorite, to compare geochemical composition and mineral assemblages. A schematic diagram of the sample positions is shown in Figure 3.

3.2. Mineralogy and Mineral Compositions

Wavelength dispersive spectroscopy (WDS) maps for Ca, Al, Fe and Si, and mineral compositions were collected using the JEOL 8600 Electron Microprobe (EMP) at the University of Colorado Boulder. Beam conditions for X-ray maps were 15 kV voltage, 90 nA current, dwell time of 45 ms/pixel, step size of 10 μm, and a defocused beam diameter of 10 μm. For quantitative feldspar and orthoamphibole compositions, a 15 kV voltage, 20 nA current, a defocused beam of 5–10 μm, and count times varying from 20–40 s were used. These mineral compositions can be found in Table 1.
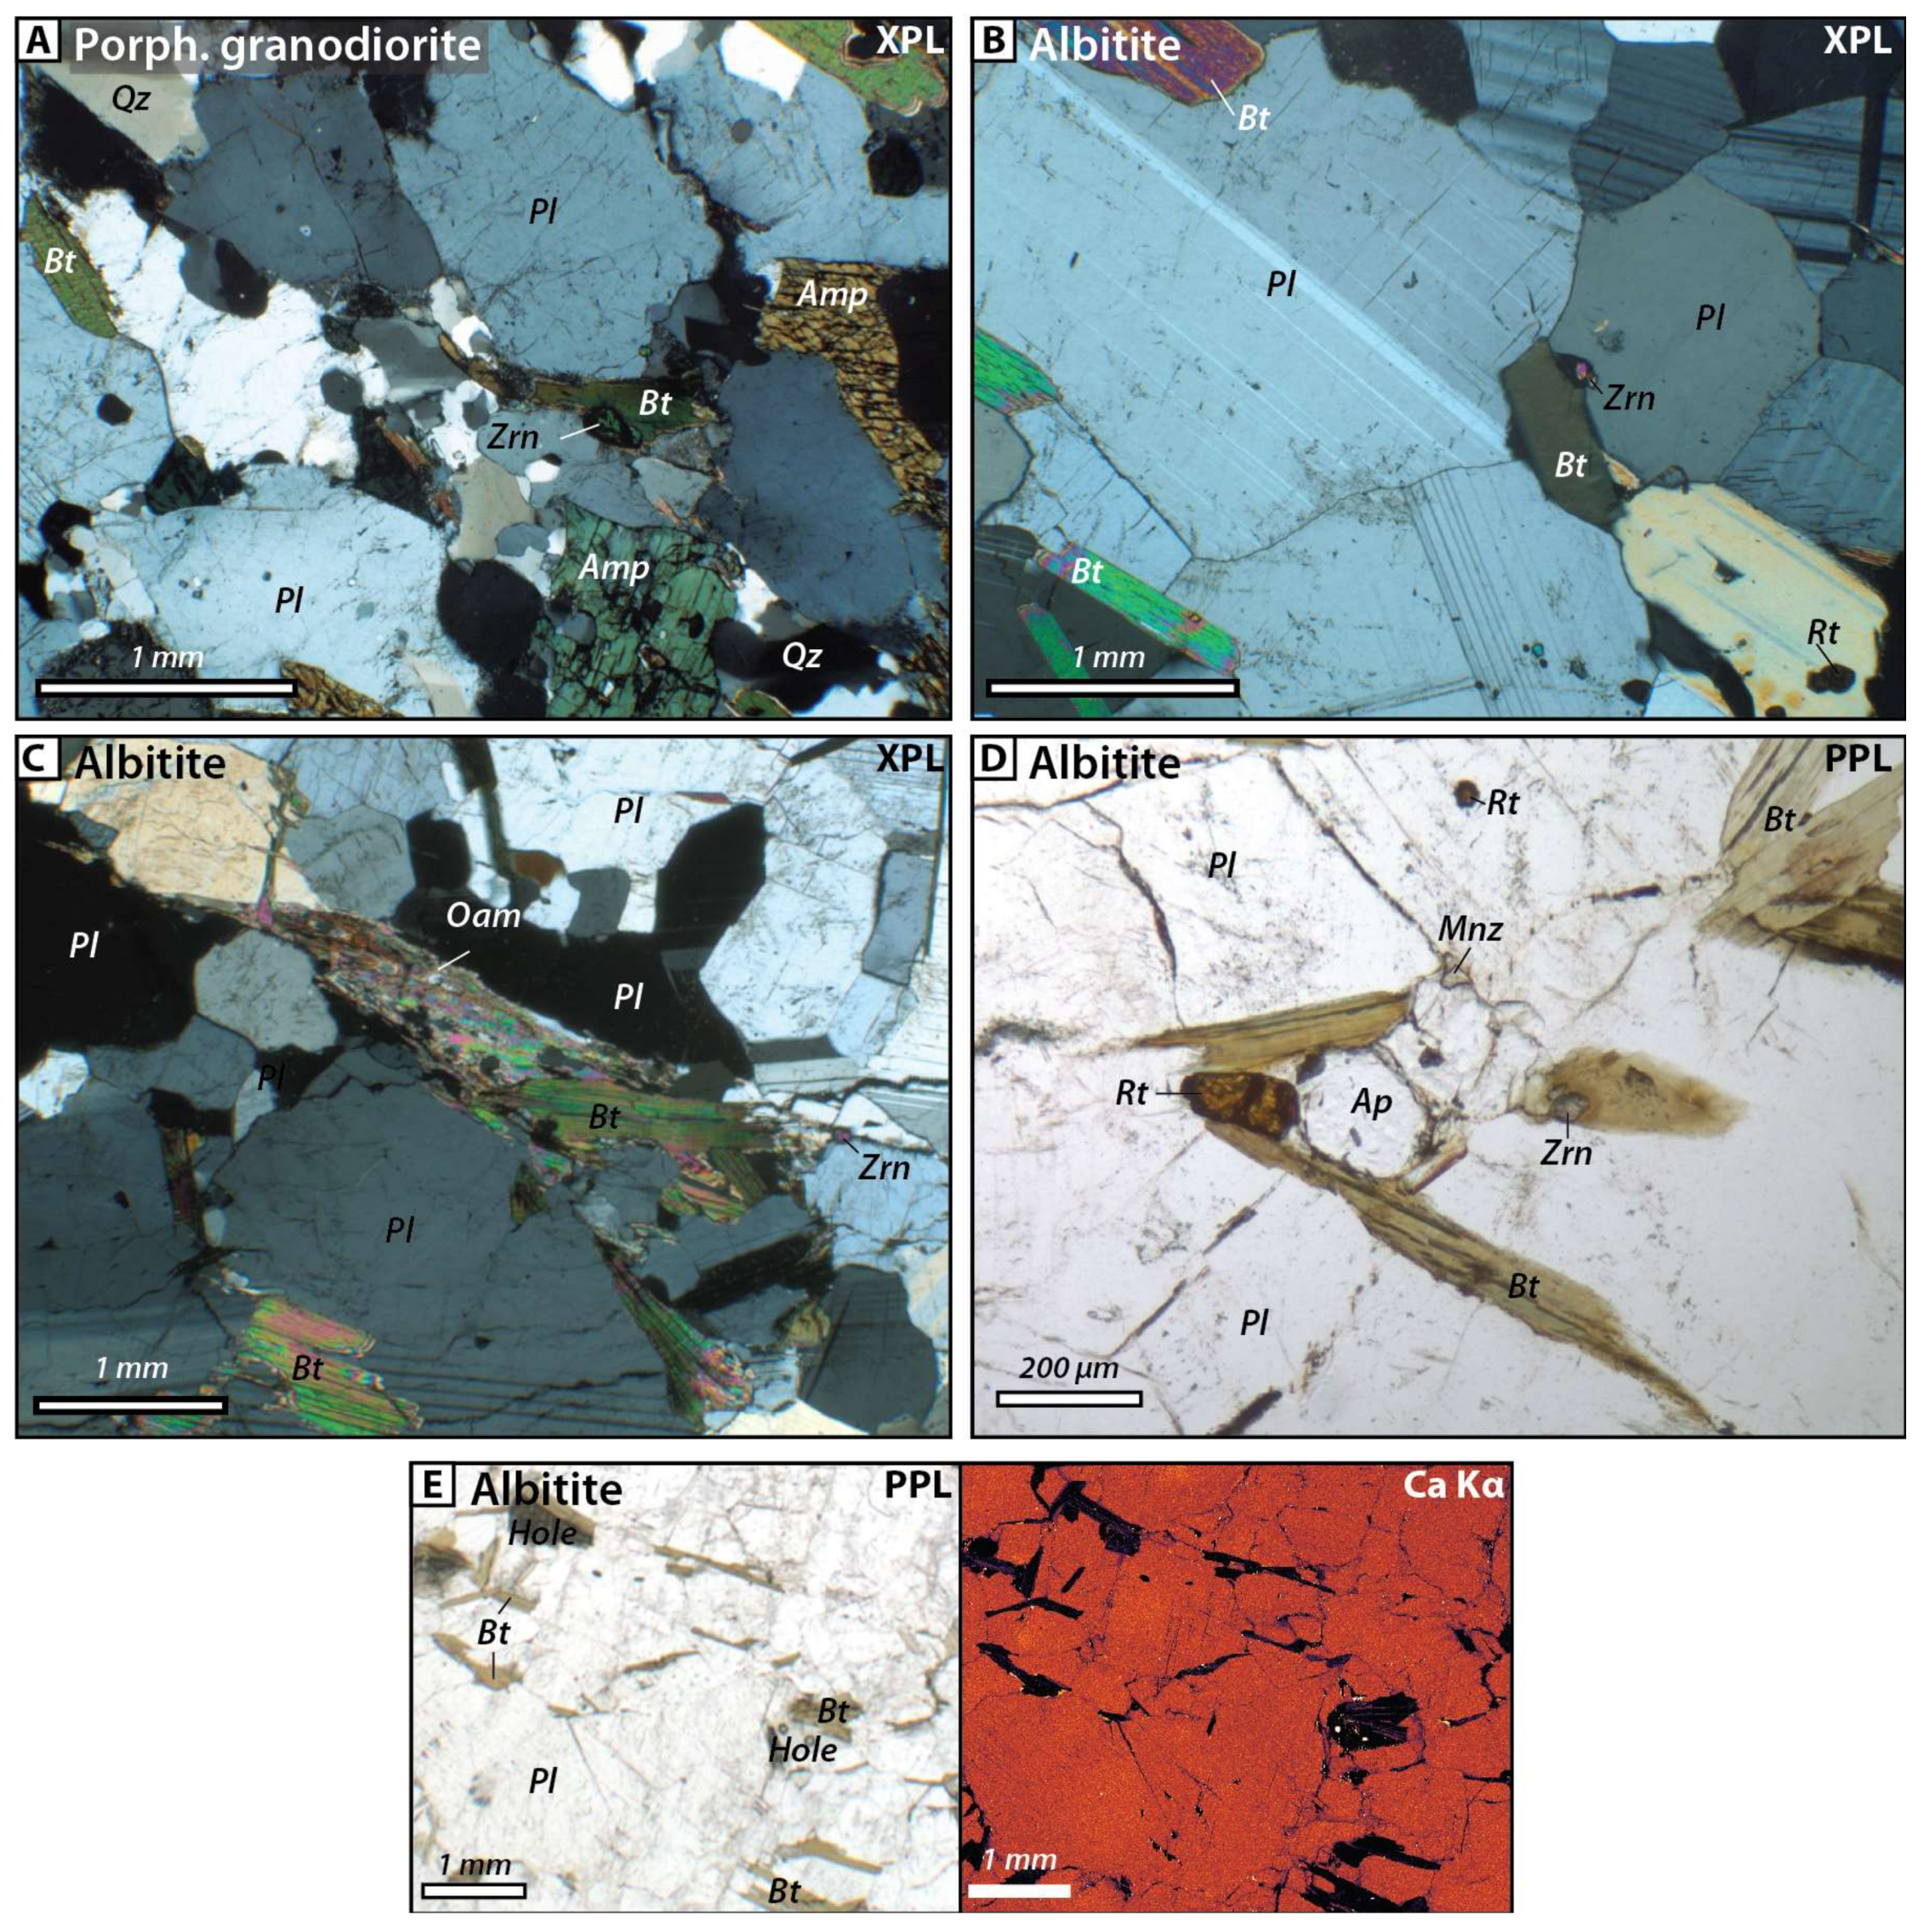
The albitite contains Ab + Bt + Oam + Rt + Ap + Mnz + Zrn. Large ~5 mm-scale interlocking plagioclase crystals are interspersed with aligned biotite and elongate orthoamphibole grains approximately 0.5–4 mm long (Figure 4B,C). Albite grain boundaries are often at a high angle to one another (e.g., Figure 4B). Feldspar is almost pure albite (Ab94) (Table 1) and WDS maps show little to no zoning (e.g., Figure 4E). Orthoamphibole is compositionally anthophyllite to Si-rich gedrite (Si = 7.95–6.66 for 24 O, OH, F), (Table 1). Apatite grains are round, up to 400 µm in diameter, and commonly occur adjacent to rutile, monazite, and/or zircon. The albitite is rich in accessory phases, which commonly occur clustered (Figure 4D). All of these accessory phases also occur locally as inclusions within albite, biotite, and orthoamphibole.

3.3. Bulk Rock Composition

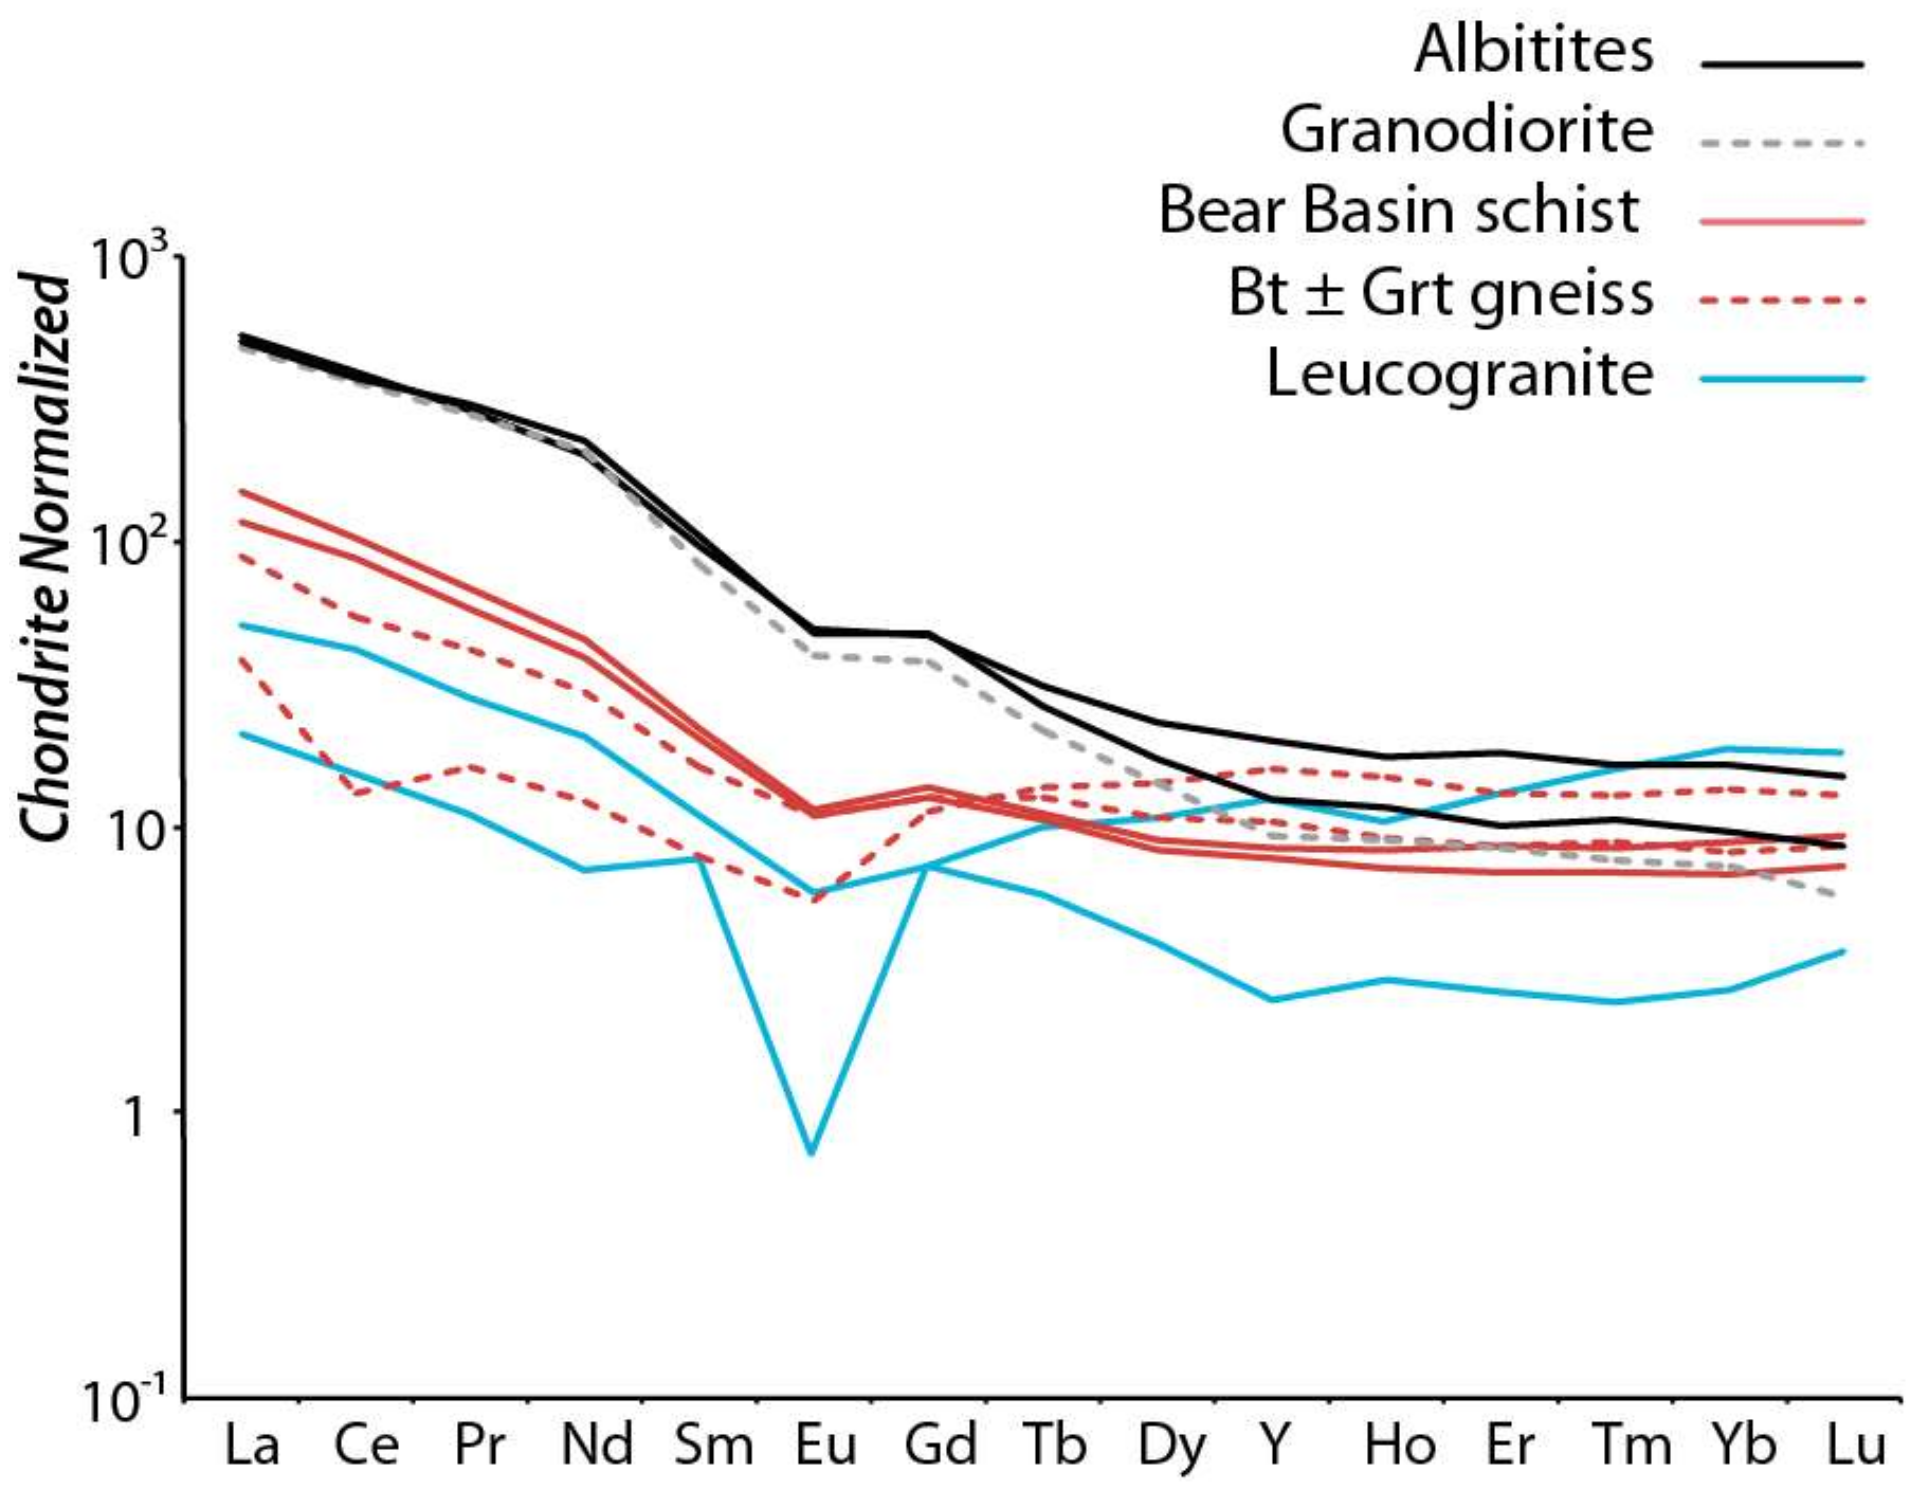
Bulk rock major and trace element compositions of the albitite, porphyroclastic granodiorite, Bear Basin schist, biotite ± garnet gneiss, and leucogranite sheets were acquired using X-ray fluorescence (XRF) analysis and can be found in Table 2. Rare earth element (REE) plots of bulk compositions for these major rock types are shown in Figure 5. The REE plots are normalized to chondrite values from [39], and show similar patterns for the albitite and the granodiorite samples, with general enrichment in all the REEs, and slightly more enrichment in light rare earth elements (LREE) than heavy rare earth elements (HREE). The Bear Basin schist and biotite ± garnet gneiss generally have lower LREE content and similar HREE content to the albitite and the granodiorite. Leucogranite sheet samples both show negative Eu anomalies and lower LREE and lower to similar HREE than the other lithologies examined.

4. Monazite Morphology, Geochronology, and Geochemistry

Dating of zircon and monazite was conducted to understand the timing of crystallization, metamorphism, fluid flow, and metasomatism in the albitite. This work was done predominately in situ, in order to preserve the petrologic context of these phases.
The accessory mineral grains analyzed are commonly chemically zoned, with compositional domains <20 μm thick. For this reason, zircon and monazite grains were imaged before dating, to understand the full spectrum of intragrain domains and compositions. These images also allowed morphological characterization of the accessory minerals. In the case of zircon, morphology was used to understand potential alteration relationships between the albite and the other orthogneiss units within Bear Basin. Grains in all lithologies were identified in thin section by elemental full thin section maps (Y, Al, Zr, Ce, ± P) made on the JEOL 8600 and the JEOL 8230 EMPs at the University of Colorado Boulder. For full section maps, the current was set to 180 nA, acceleration voltage to 15 kV, and beam size to 25–35 μm.

4.1. Monazite Analytical Methods

After monazite grains were identified by WDS full thin section maps, which were registered to full thin section photomicrographs (Figure A1A–D), they were investigated optically to constrain context and textural occurrence. Selected grains encompassing the range of sizes, textural occurrences, and morphologies were targeted for compositional WDS U Mβ, Th Mα, Y Lα, and Si Kα maps collected on the JEOL 8600 EMP at the University of Colorado Boulder. These maps were used to identify compositional variation across the monazite grains, and as guides for quantitative analysis. Backscatter electron (BSE) images were also taken at grain and textural setting scales.
U-Th-total Pb monazite dates and trace element compositions were acquired with the modified Cameca SX-100 (Ultrachron) EMP at the University of Massachusetts Amherst Electron Microprobe and SEM Facility. The details of analytical procedures, including count times, standards, and a list of spectrometers, follow those laid out in Appendix A of Dumond [40], Williams et al. [41], and Jercinovic [42]. Background corrections followed the multipoint background method of Allaz et al., [43]. Homogeneous chemical domains were targeted with the guidance of WDS grain maps, and a weighted mean of 3 to 6 individual spot analyses per domain was calculated and reported with a 2σ uncertainty (Table 3). This uncertainty is the larger of either the propagated analytical uncertainty of trace element compositions through the age equation plus an estimated 1% uncertainty on background intensities [41], or two times the standard error of the mean. Individual point analyses were rejected and excluded from the domain weighted mean calculation if they were inadvertently collected from a compositional domain outside the targeted area. The monazite consistency reference material used is the Moacyr Brazilian pegmatite monazite with weighted mean ID-TIMS ages of 506.4 ± 1.0 Ma (2σ, MSWD = 0.6) for 208Pb/232Th, 506.7 ± 0.8 Ma (MSWD = 0.83) for 207Pb/235U, and 515.2 ± 0.6 Ma (MSWD = 0.36) for 206Pb/238U [44].

4.2. Monazite Size, Morphology, Textural Context, and Compositional Zoning

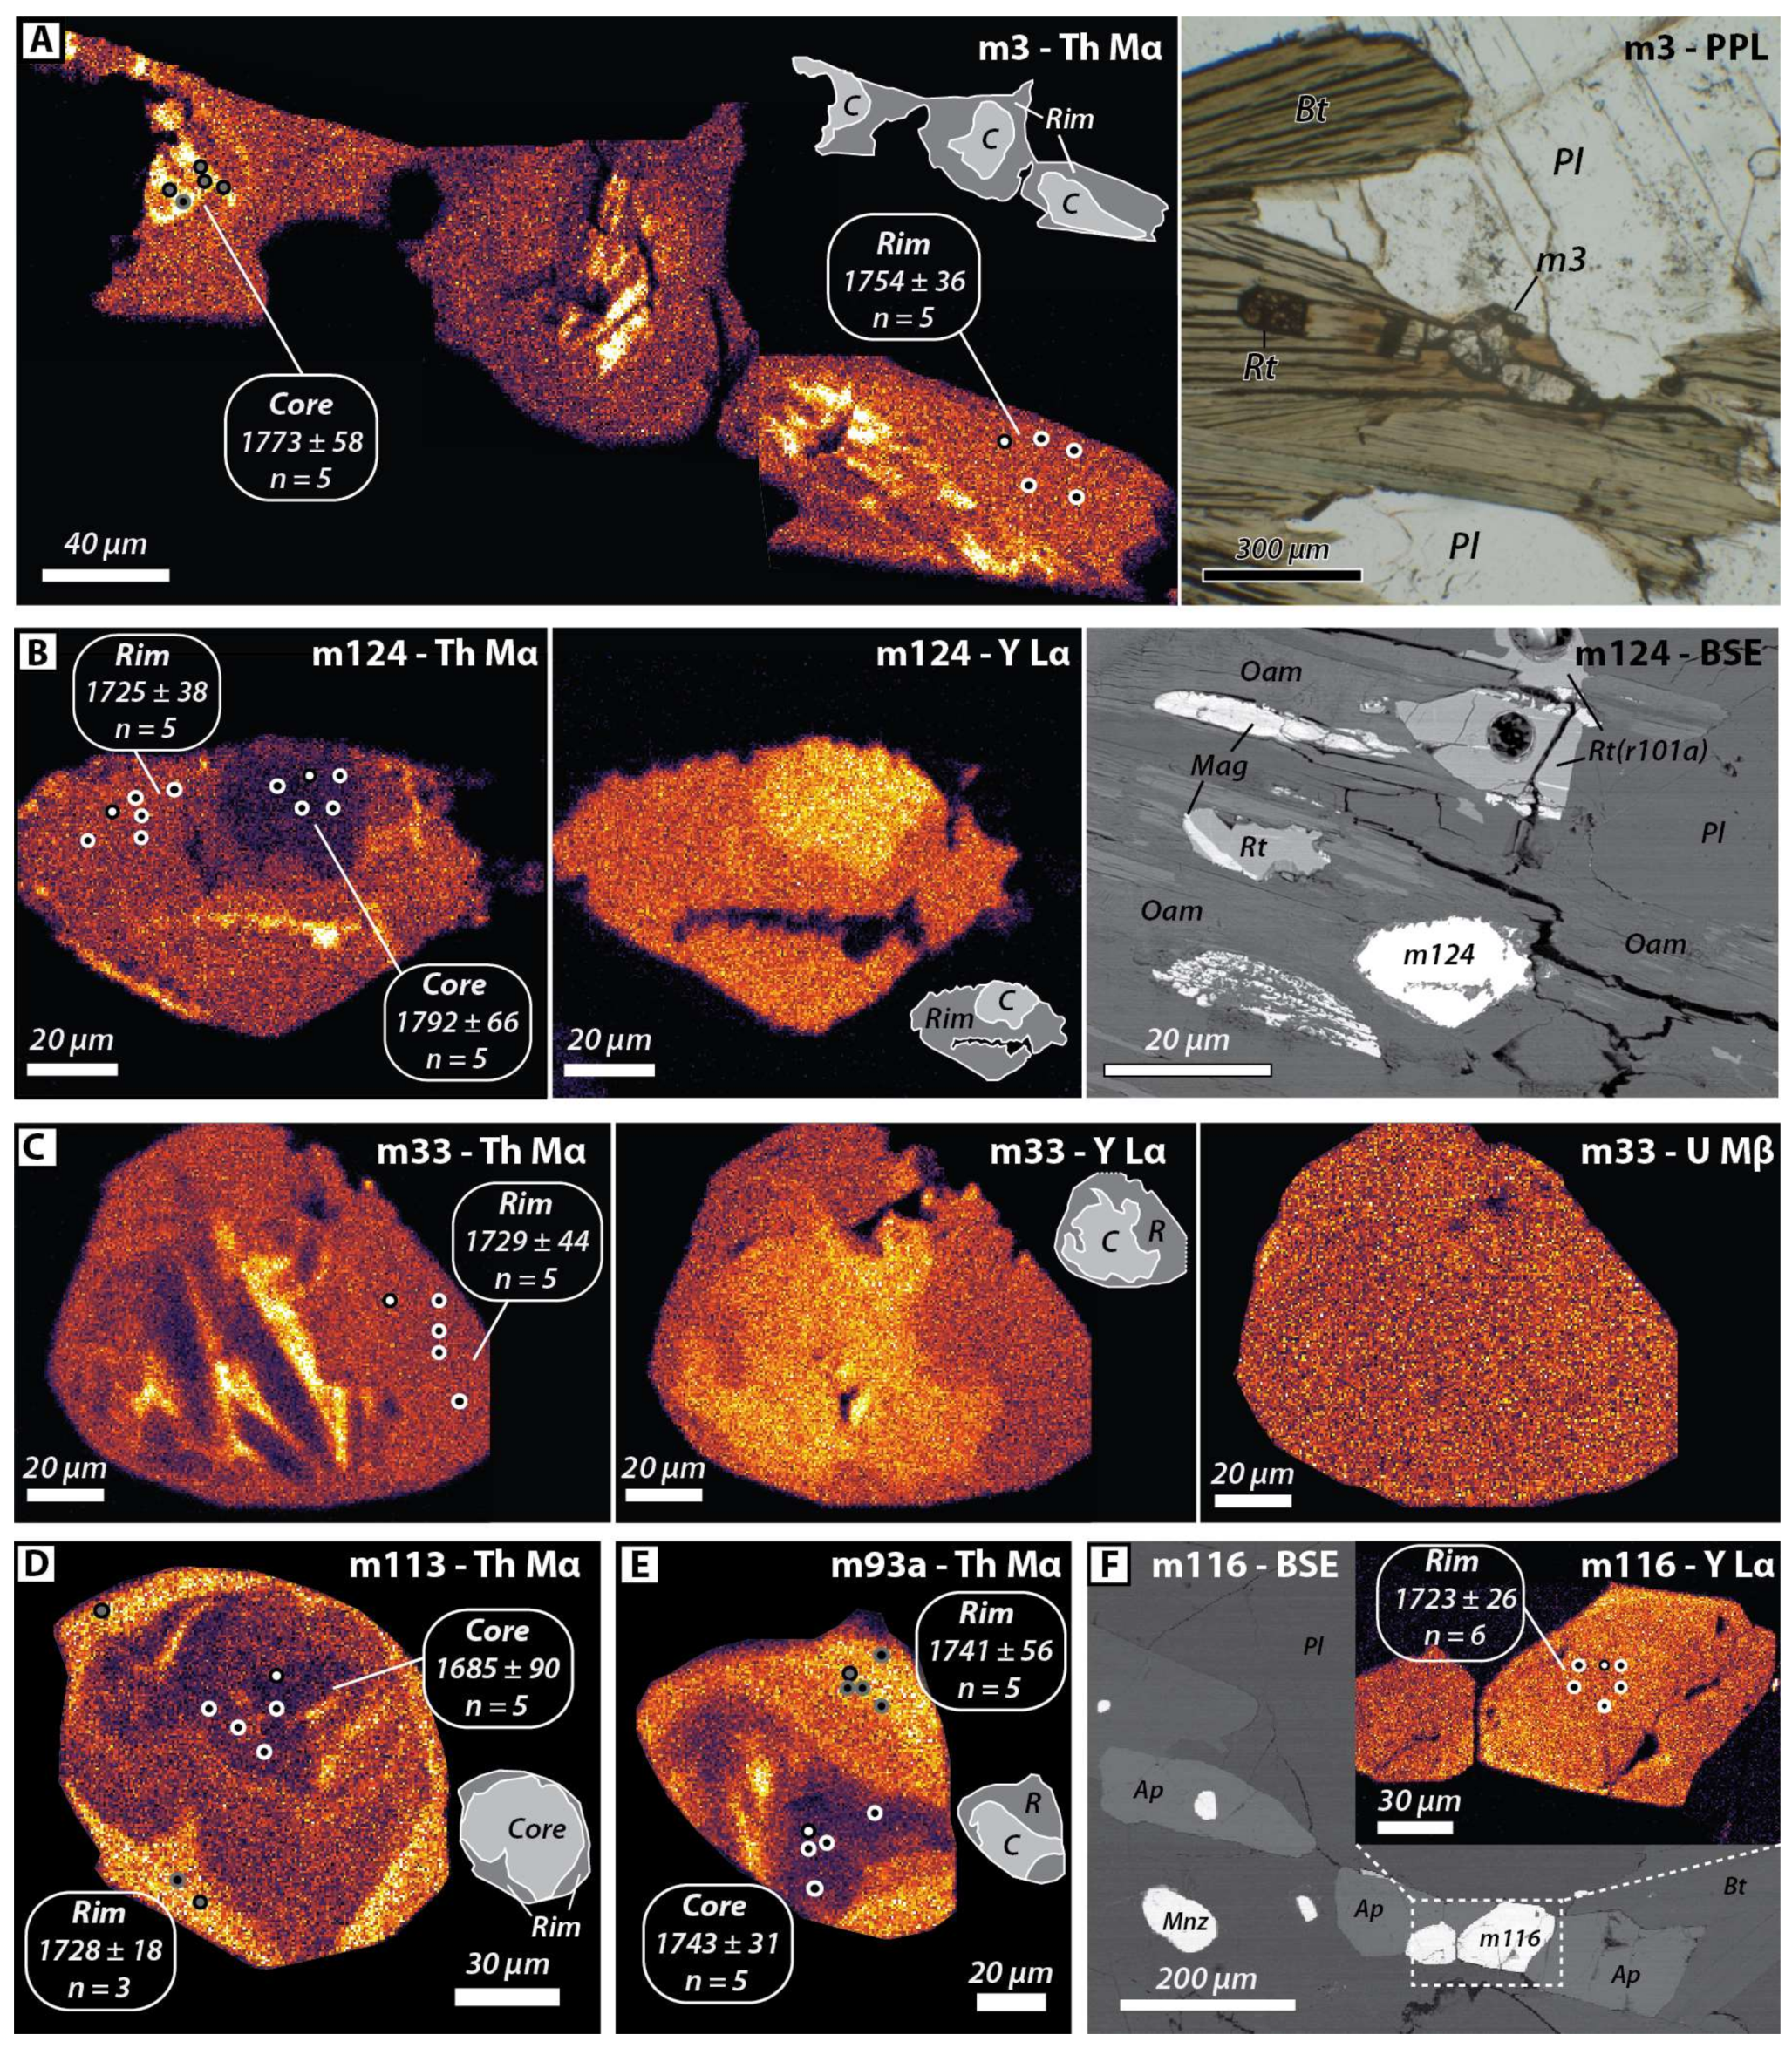
Monazite grains range in size from 35 μm to 200 μm in length. The majority of grains are anhedral to subhedral, and rounded or irregularly shaped. Several grains are elongate and form multi-grain trains (Figure 6A). Monazite occur as single grains included in orthoamphibole (Figure 6B), biotite (Figure 6A), and feldspar (Figure 6C; Table 3), and as clusters of grains associated with apatite, rutile or zircon (Figure 6D,E).
Two distinct monazite textural ± compositional domains occur in this sample, commonly within the same grains (Figure 6A–E). Core domains occur only as internal cores within multidomainal grains, and contain relatively high and uniform Y, uniform and relatively low U (<2100 ppm), and irregularly zoned Th (e.g., Figure 6A), with overall relatively low concentrations down to 0.2 wt %, but with patches as high as 5.5 wt % (Table 3, e.g., Figure 6E). Rim domains consist of either whole grains (Figure 6E) or rims surrounding core domains (Figure 6A–C). These domains contain higher U (>2100 ppm), more uniform and generally higher Th (1.5 wt % < Th < 3.5 wt %), and lower Y than cores (Table 3). In the same grains, the two domains are visually discernable in WDS maps by these compositional differences and jagged boundaries between them, interpreted as resorption (Figure 4B,C).

4.3. Monazite U-Th Total Pb Results

A total of 26 grains were imaged via WDS maps, and nine grains were dated by EMP U-Th-total Pb. Four of these grains contain multiple age domains (with distinct cores and rims), for a total of 13 domains dated within this sample (Figure 7A, Table 3). Of the dated domains, five were high Y cores, and eight were from high Th, low Y rims or whole grains. The oldest two dates are core domains from a grain included in orthoamphibole (1792 ± 66 Ma, 2σ, n = 5, m124 core) and a monazite along a Bt-Ab grain boundary (1773 ± 58 Ma, 2σ, n = 5, m3 core). The youngest date is also from a core domain of a grain included within albite (1685 ± 90 Ma, 2σ, n = 5, m113 core), which has the second largest uncertainty of any domain. The five core domains have a weighted mean of 1750 ± 23 Ma (2σ, n = 5, MSWD = 1.15). The remaining eight analyses are all rims or whole grains, and range from 1758 ± 24 Ma (2σ, n = 6, m7) to 1723 ± 26 Ma (2σ, n = 6, m116). These have weighted means of 1734 ± 10 Ma (2σ, n = 8, MSWD = 1.03). The Moacyr consistency reference monazite analyzed during these data acquisition sessions has a weighted mean age of 503 ± 4 Ma (2σ, n = 6, MSWD = 0.18, Table 3).

4.4. Monazite Geochemistry

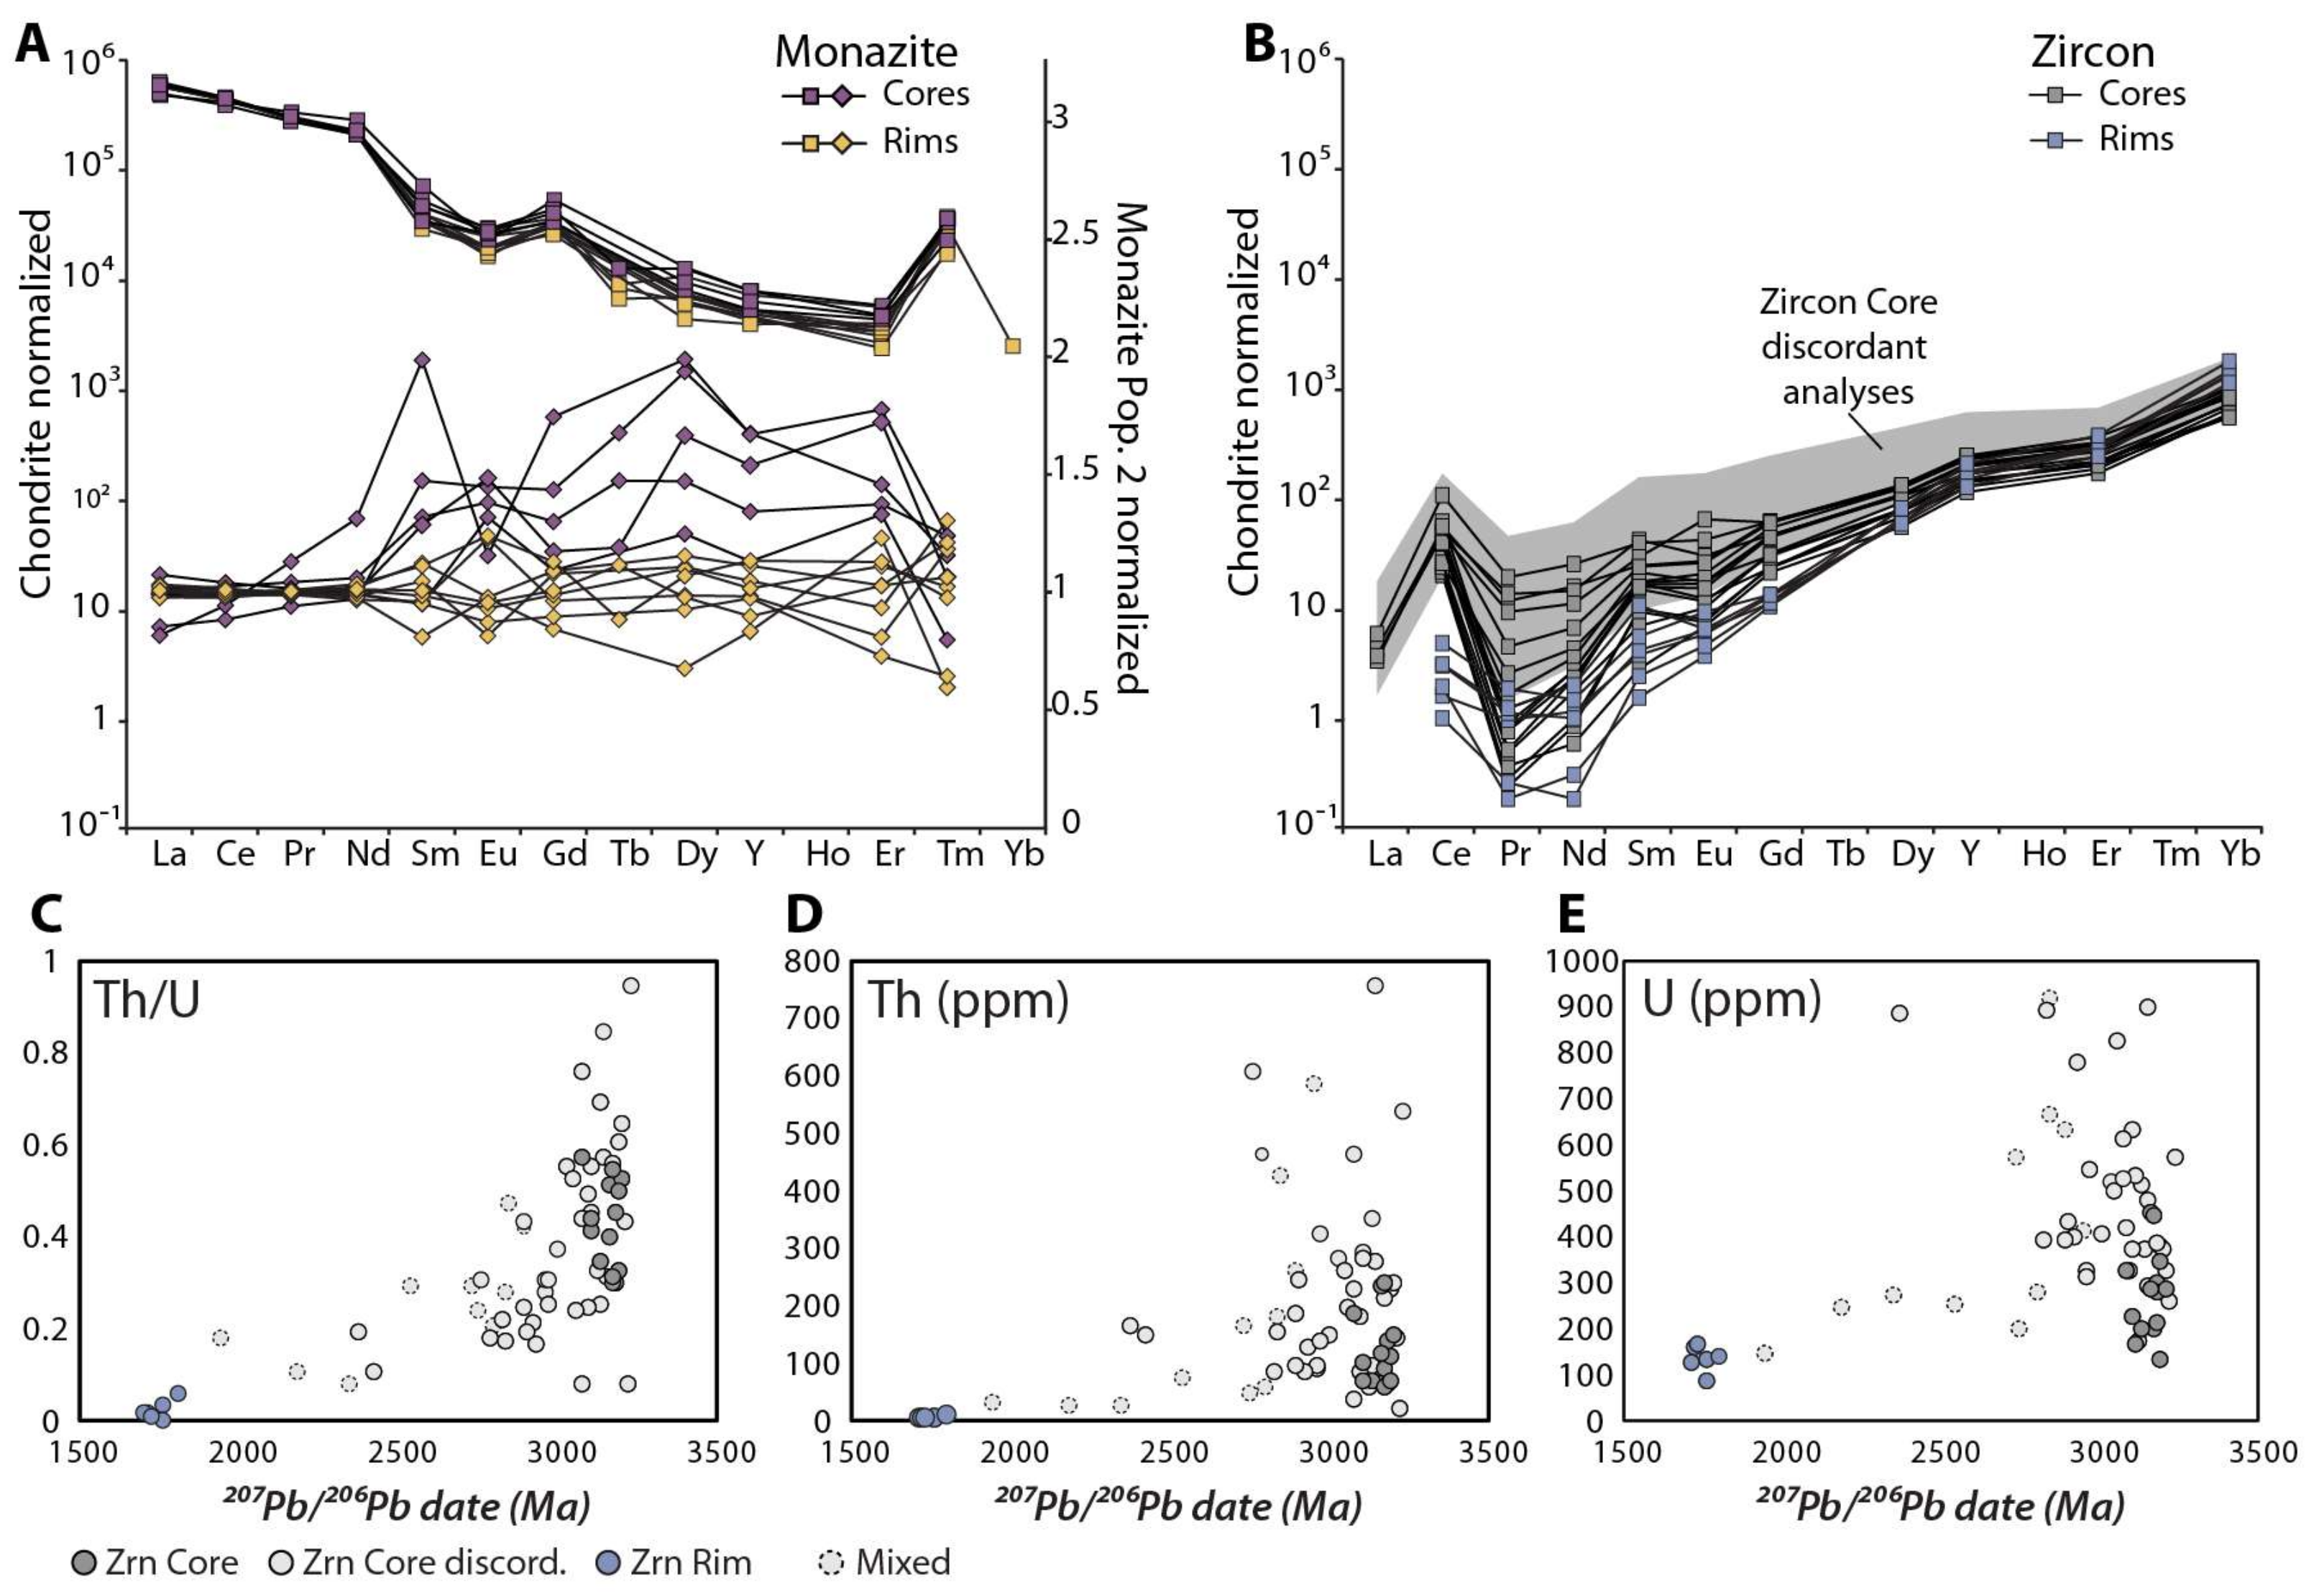
Complete element compositions of monazite were collected simultaneously with the acquisition of U-Th-total Pb data. Compositional data are shown in Table 4, and plots of REE data normalized to (1) chondrite values and (2) the mean of monazite rim domains are shown in Figure 8A. The chondrite normalized plots show that both core and rim domains are enriched in LREE, have minor negative Eu/Eu* anomalies from 0.38 to 0.73 (both domains have a mean Eu/Eu* of ~0.6), and are depleted in HREE. There is a positive Tm anomaly that may be due to an underestimation in the background correction [45]. It is difficult to see any difference in REE patterns between different monazite domains when each is normalized to chondrite values, but core domains show higher enrichment in MREE and HREE than rims when normalized to the mean of monazite rim domains (Figure 8A). Apparent breaks in the data are where the concentration was below detection.

5. Zircon Morphology, Geochronology, and Geochemistry

5.1. Zircon Analytical Methods

Zircon grains were characterized for the albitite, porphyroclastic granodiorite, hornblende monzodiorite, and biotite-garnet gneiss. These grains were identified by full section EMP maps registered to full thin section photomicrographs (Figure A1), investigated optically on a transmitted light microscope, and then selected for microbeam imaging based on representations of the full suite of textural settings and morphologies. For albitite sample 13c-10a cathodoluminescence (CL), BSE and secondary electron (SE) images were taken on the JEOL 6610 LV Scanning electron microscope at the University of Northern Colorado, whereas all other samples were imaged (CL and BSE) on the JEOL 8230 EMP at the University of Colorado Boulder.
A suite of zircon was targeted for in situ trace element and geochronological analyses in thin sections that encompassed the full range of compositions and morphologies. A second suite of grains from sample 13c-10a was separated via standard crushing methods and concentrated in the <250 μm fraction. This fraction was then hand washed to minimize potential loss of small (<20 μm) zircon, magnetically separated, and run through heavy liquids. Grains were then picked and placed on double-sided tape to enable depth profiling on the laser ablation inductively coupled plasma mass spectrometer (LA-ICP-MS). After analysis, these grains were imaged in plane polarized light.
Zircon within the albite sample 13c-10a were dated in situ and as separates via U-Pb by LA-ICP-MS at the University of Kansas, with an Element2 ICP-MS coupled with a Photon Machines Analyte.G2 193 nm ArF excimer laser. A spot size of 15 μm was used for analyses in order to resolve potentially small-scale internal zonation. U-Pb and trace element data were collected within the same pit during a single acquisition. The primary U-Pb reference material used was GJ1 with a TIMS 207Pb/206Pb age of 608.53 ± 0.37 Ma [46]. The trace element primary reference material was NIST612 [47]. Plešovice zircon was used as a secondary reference material for U-Pb dating, which has a ID-TIMS U-Pb age of 337.13 ± 0.37 Ma (2σ, [48]). Elemental fractionation, down-hole fractionation, and calibration drift were corrected by bracketing measurements of unknowns with the reference materials, using the IOLITE software package [49,50]. The VizualAge data reduction scheme was used for U-Pb data reduction [51].

5.2. Zircon Size, Morphology, Textural Context, and Compositional Zoning

5.2.1. Albitite Zircon

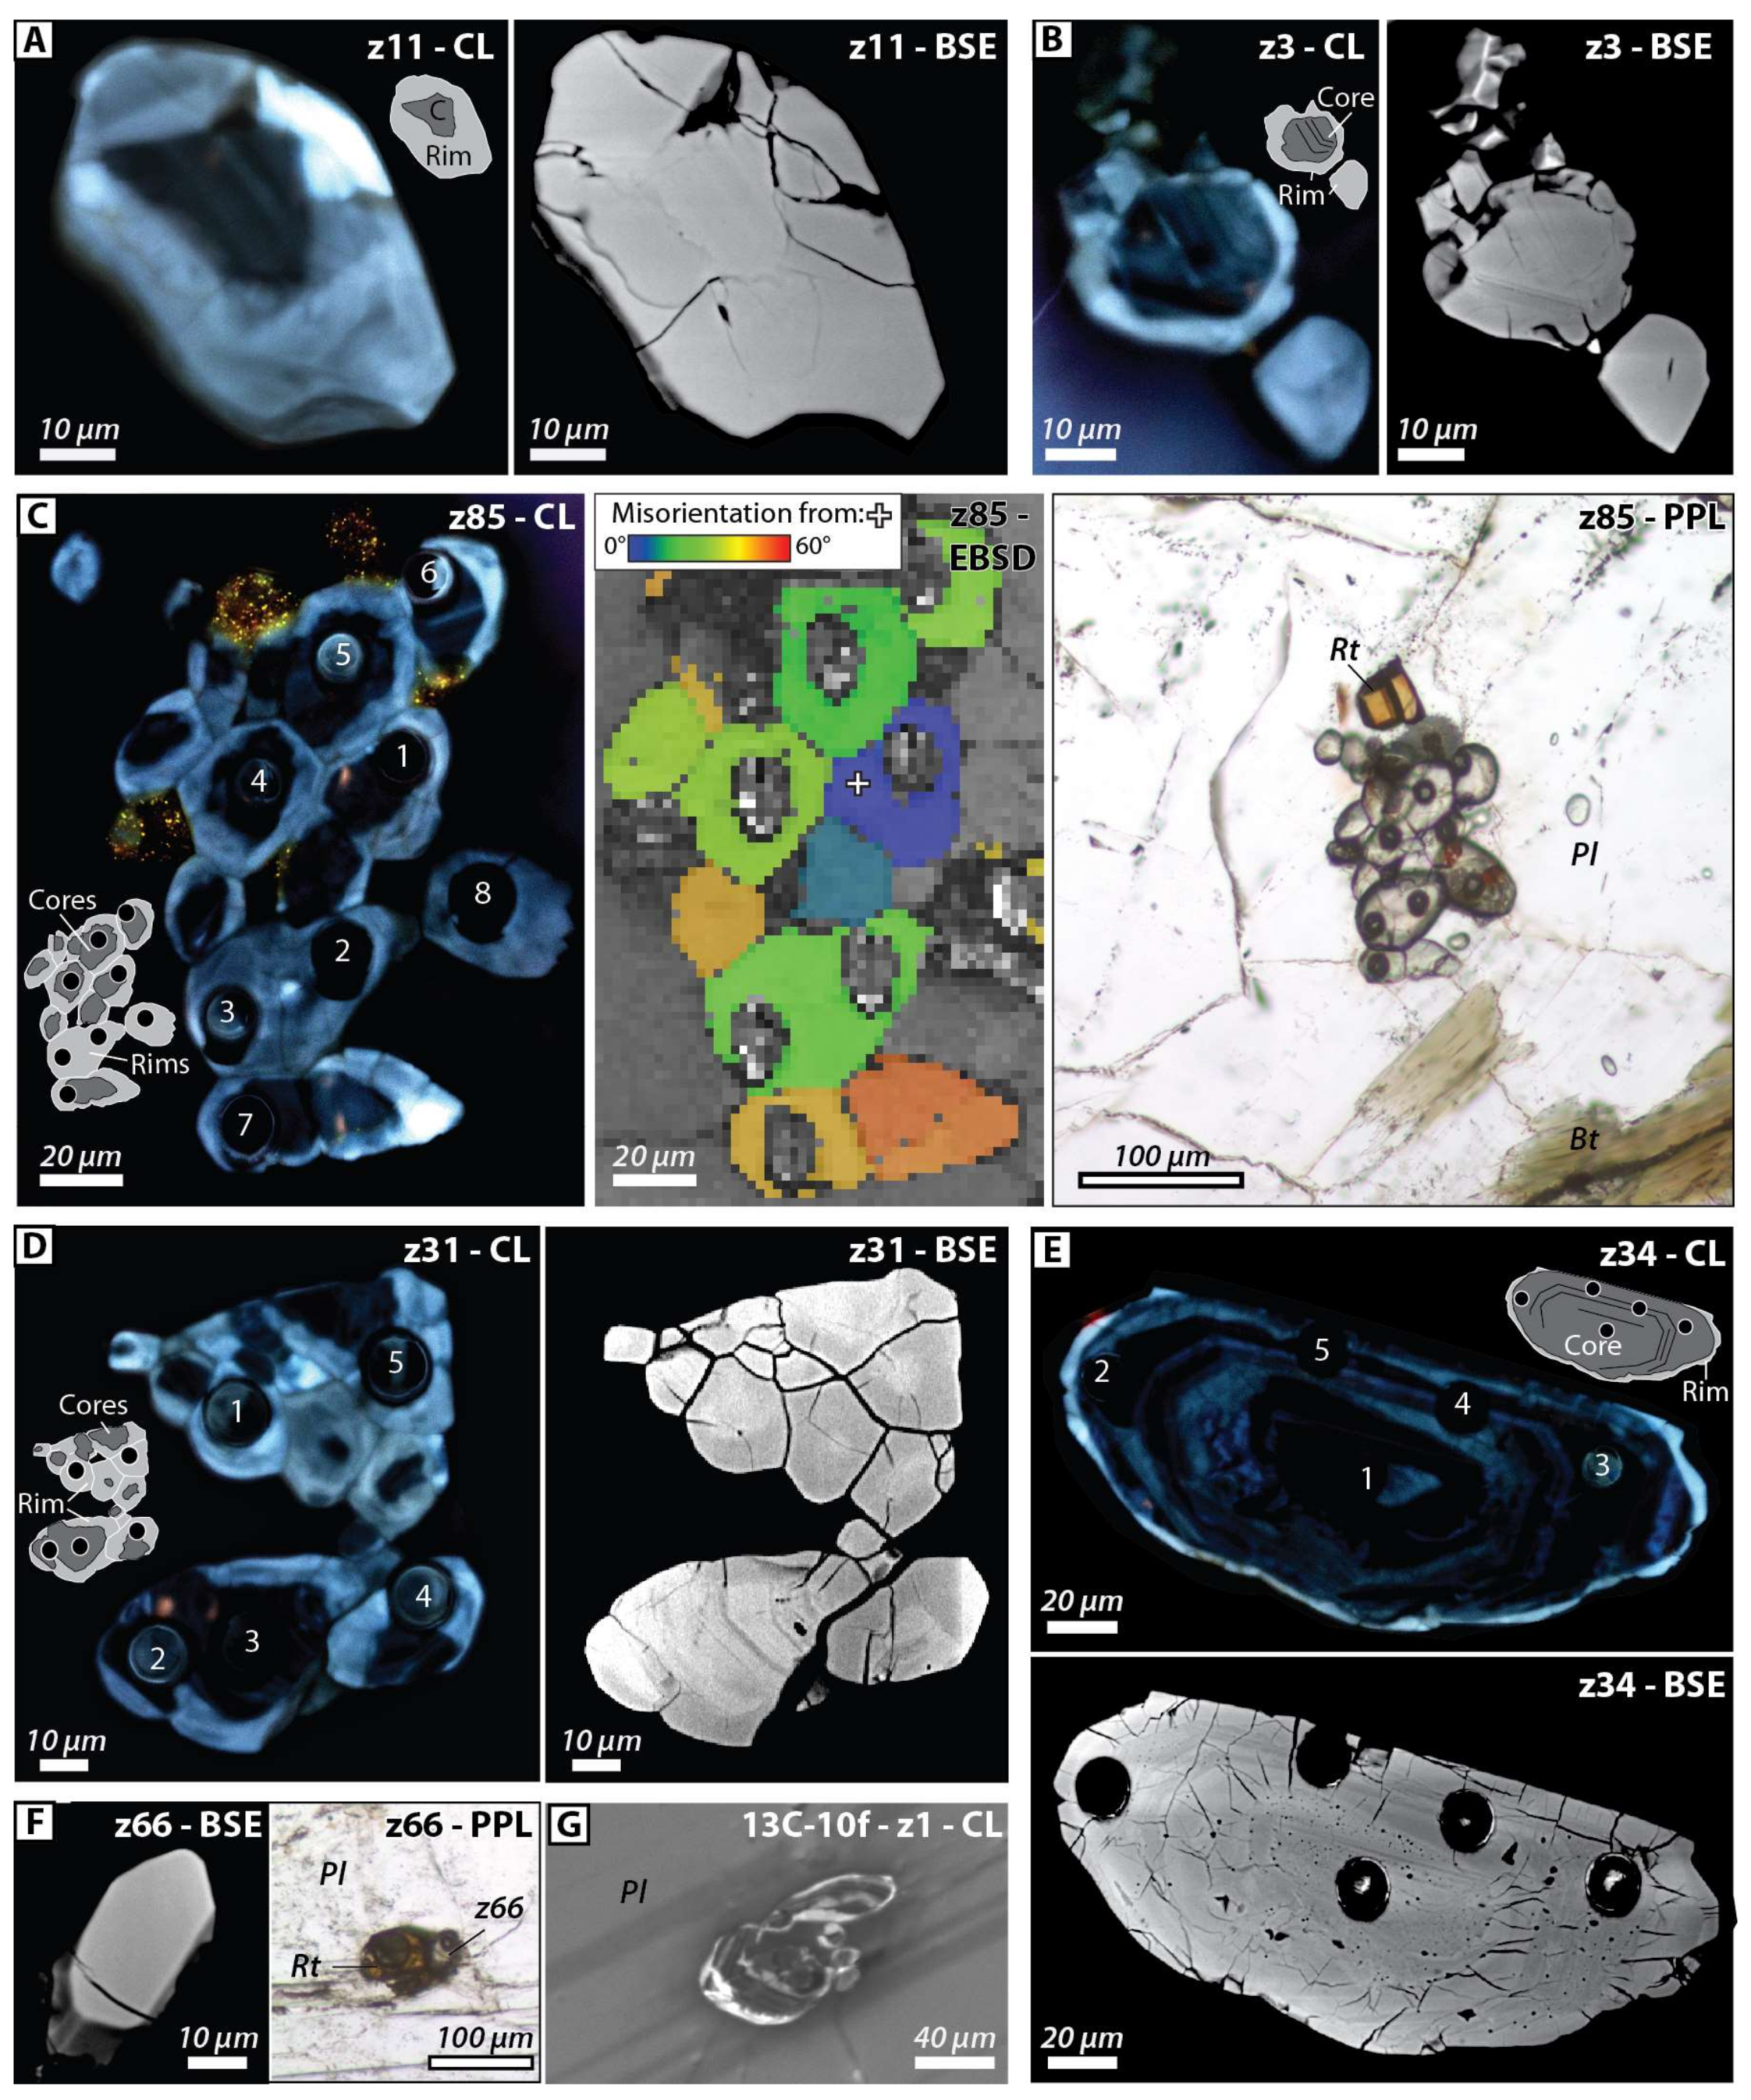
Zircon within albitite samples occur most commonly as single grains (e.g., Figure 9A,B; Figure A2), but also notably as distinct clusters of multiple grains, referred to hereafter as glomerocrysts (Figure 9C,D; Figure A2B). Zircon grains range in length from 200 μm to 20 μm (Table 5), including single grains and glomerocrysts. They are euhedral to anhedral and elongate to rounded. The glomerocrysts consist of three to ten individual grains (~20–40 μm across each) sharing rim domains of bright CL material. CL and BSE images show an internal zoning texture and multiple intragrain domains consisting of bright CL rims and dark CL cores (Figure 9A–E,G; Figure A2B). The bright CL rims are ~5–20 μm thick, do not appear compositionally zoned, and are inclusion-free in BSE images. Dark CL core domains appear to have concentric zoning typical of igneous zircon (Figure 9E; Figure A2). In some grains, this internal concentric zoning is truncated by the bright CL rim, suggesting dissolution–reprecipitation processes (Figure 9B; Figure A2). Electron backscattered diffraction (EBSD) maps of zircon glomerocrysts indicate that the individual subgrains (cores and rims) are oriented differently from one another (Figure 9C).
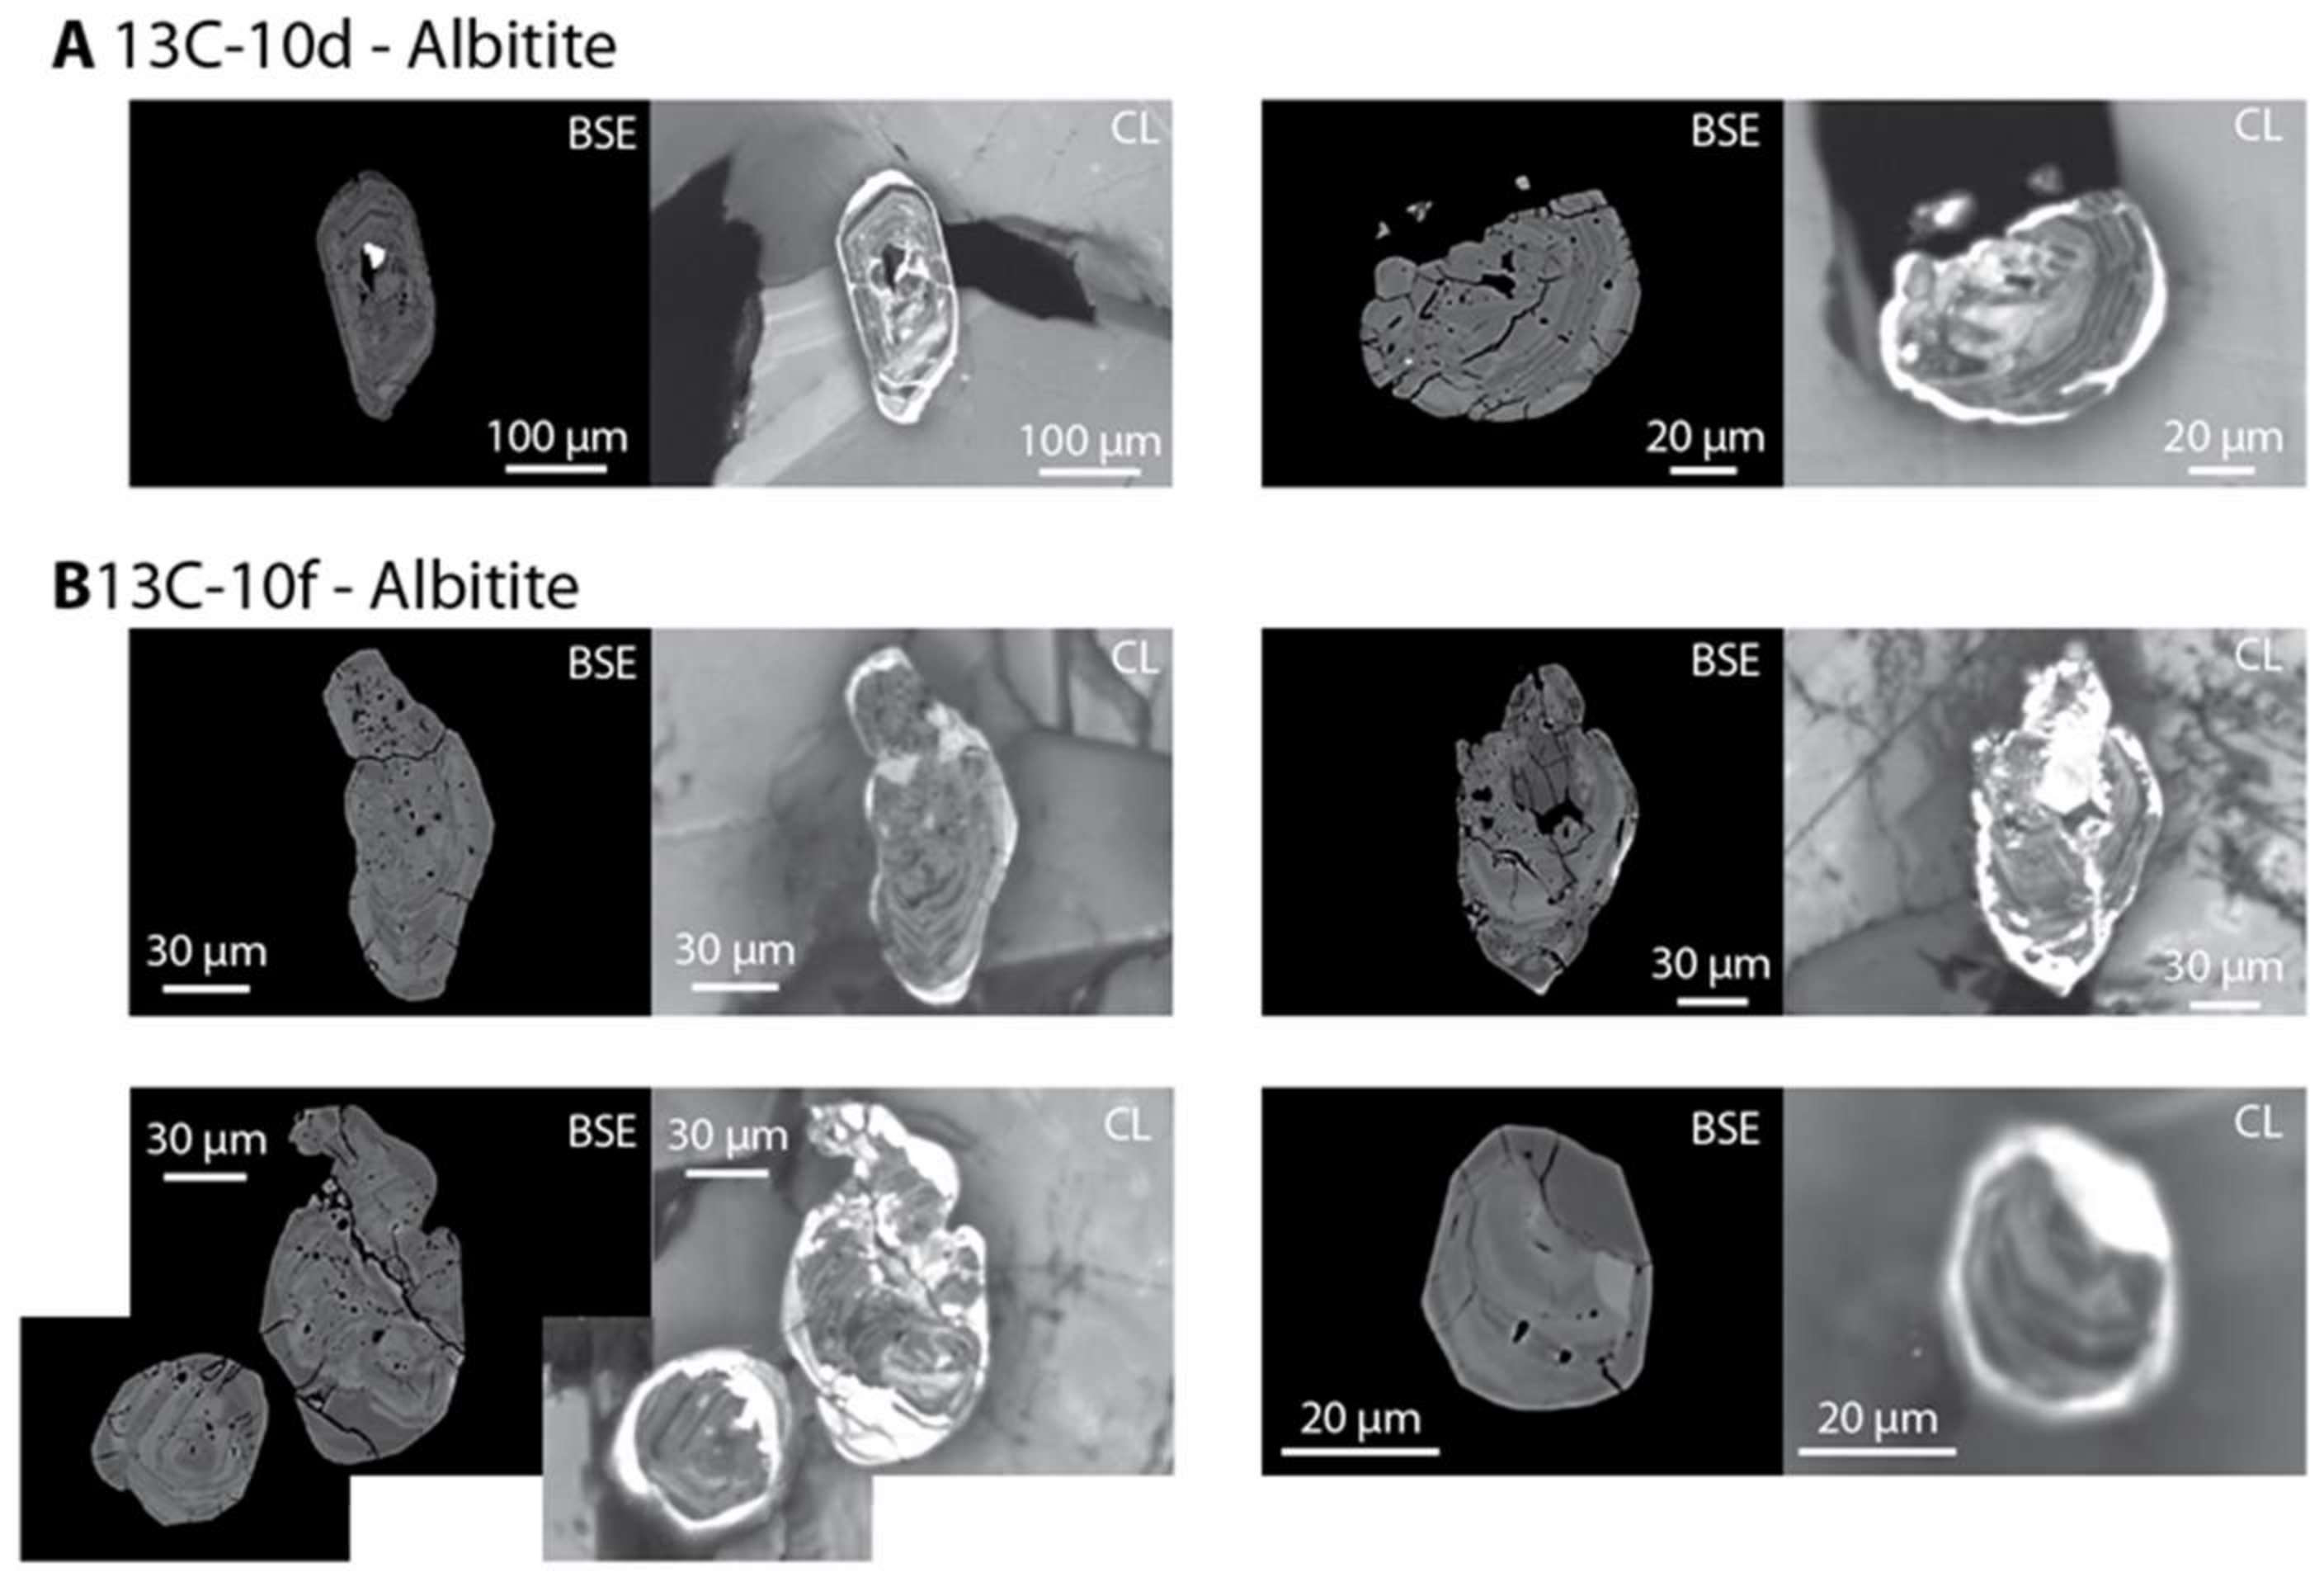
Zircon glomerocrysts and single grains occur as inclusions in plagioclase (Figure 10C,F,G) biotite, rutile, and as clusters with monazite, rutile, and apatite (Figure 10C,F; Table 5). The CL dark cores have Th-U ratios from 0.08 to 1.34, while CL bright rims have Th/U ratios < 0.05 (Table 5). Based on the consistent rim and core domain morphology and clear differences in Th/U ratios, dark CL cores are designated zircon core domains, while bright CL rims are designated zircon rim domains. While the majority of rim domains are actually rims around core domains, several small grains (~30 μm across), comprised completely of bright CL rim material, occur locally in feldspar (Figure 9F).

5.2.2. Other Orthogneiss Zircon Morphology

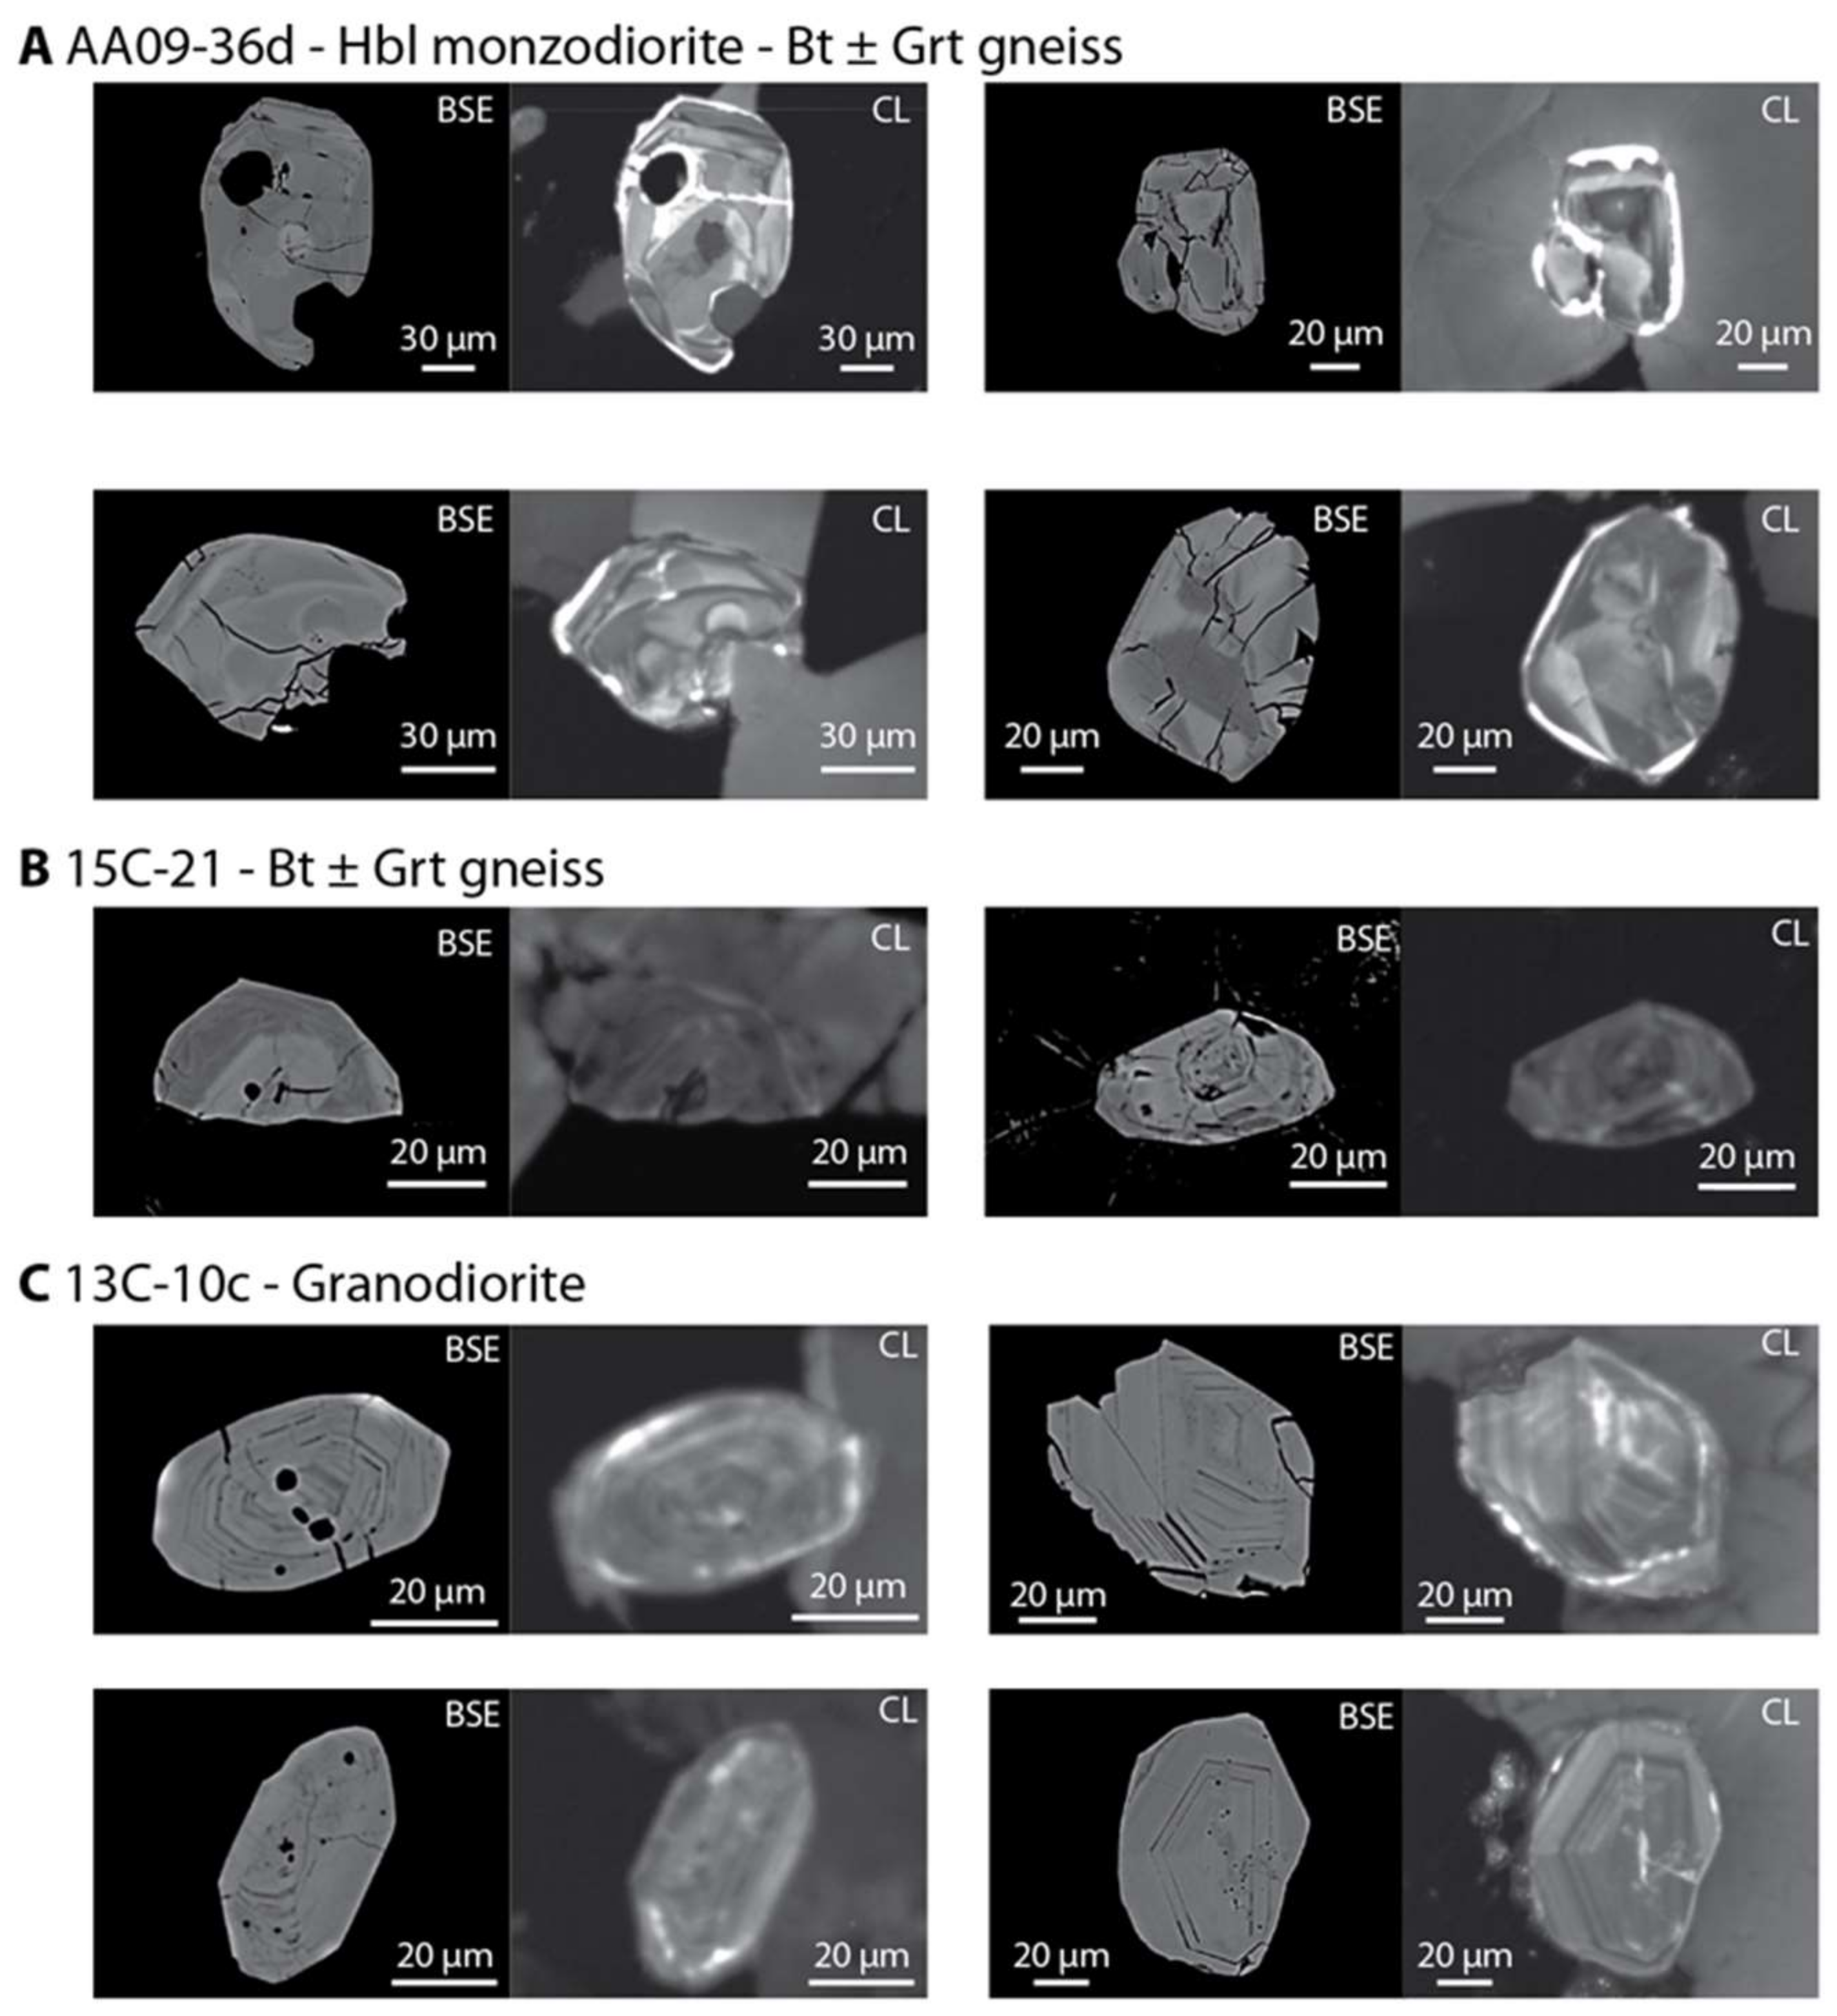
Zircon morphology and zoning were imaged from the hornblende monzodiorite, biotite ± garnet gneiss, and porphyroclastic granodiorite, to directly compare to the zircon morphology and zoning in the albitite. Locations of these accessory minerals within full thin section photomicrographs can be seen in Figure A1E–G. Zircon within the hornblende monzodiorite ranges from 20 to 100 μm with complicated multi-domainal cores and thin ~10 μm bright CL rims (Figure 10A; Figure A3A). Zircon cores in this sample are not concentrically zoned. The zircon within the biotite ± garnet gneiss are 20–40 μm across, and have a wide range of textures from concentrically zoned grains to complicated patchy grains (Figure 10B,C; Figure A3B). There are no bright CL rims around any of the zircon in this rock type. Zircon from the porphyroclastic granodiorite are 15–60 μm across, and concentrically zoned (Figure 10D; Figure A3B) and lack bright CL rims. No zircon glomerocrysts were observed in any of these units.

5.3. Zircon U-Pb Results

A total of 22 zircon grains were analyzed in situ, while 7 were analyzed as separate from albitite sample 13c-10a. Data from a total of 67 spots with a diameter of 15 μm (e.g. Figure 9C–E) were collected (Table 5). Of the 22 grains analyzed in thin section, seven are included in feldspar, 2 grains are included in biotite, and the remaining grains occur along grain boundaries.
Using the LA-ICP-MS technique for complicated multidomain grains is powerful, not only because of the small spatial resolution of the laser beam, but also because of the time (depth) dependent data collected for each laser pit. Thus, it is possible to depth profile and observe chemical and age domains in the z-direction. Several pits drilled through rim domains into cores (e.g., s z1 spot 1a and 1b, Table 5) and the data allow separating different age domains within a single pit. However, some of the depth profiles represent mixes of both rim and core domains (Table 5), where the pit was not perpendicular to the contact between the domains.
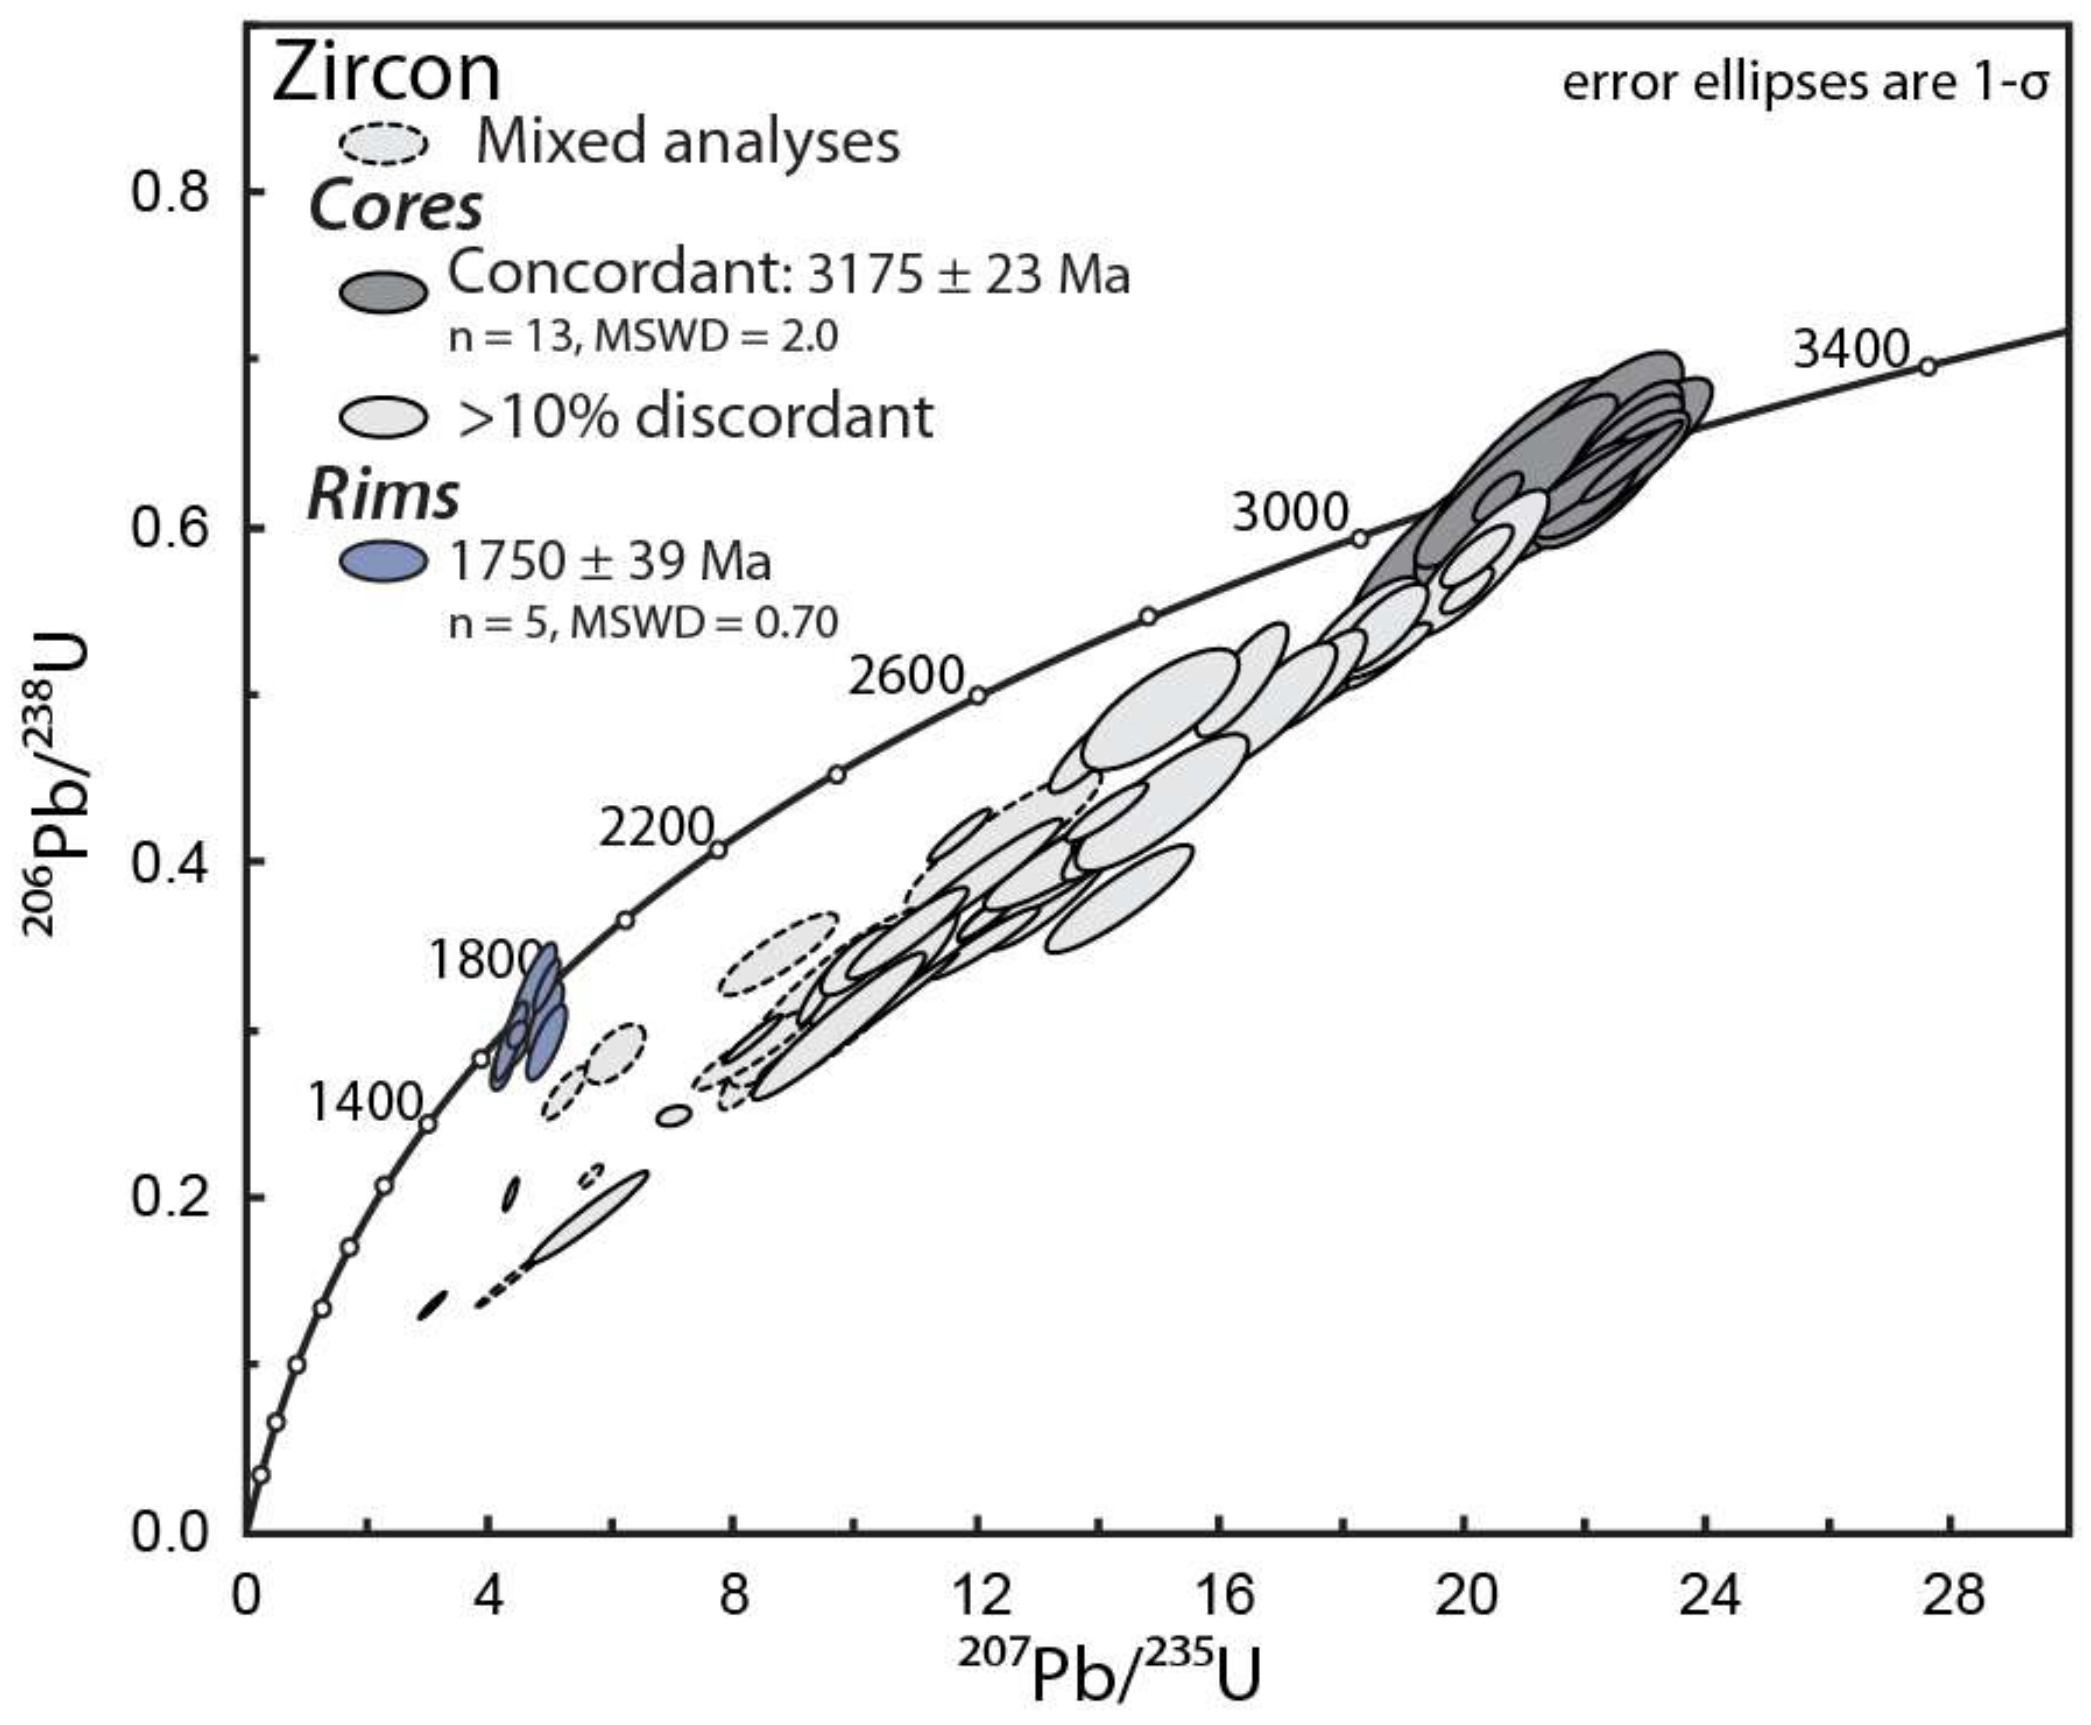
A total of seven analyses of rim domains have 207Pb/206Pb dates ranging from 1722 ± 69 Ma (2σ, z76 spot 1) to 1958 ± 99 Ma (2σ, z31 spot 5). Six of these analyses are concordant at 1σ (Figure 11), and yield a 207Pb/206Pb weighted mean date of 1750 ± 39 Ma (2σ, MSWD = 0.70).
The other 60 analyses are either mixed spots (the pit straddled the boundary between core and rim zircon material, n = 9) or are completely within zircon cores (n = 51). The majority of these analyses are highly discordant (Figure 9, up to ~66% for spots within cores and ~69% for mixed domains). The 51 analyses of core domains have 207Pb/206Pb dates ranging from 2383 ± 68 Ma (2σ, z2 spot 1) to 3243 ± 85 Ma (2σ, z16 spot 1). Of these, 13 analyses are concordant (at 1σ), and yield a 207Pb/206Pb weighted mean date of 3175 ± 23 Ma (2σ, MSWD = 2.0). The Plešovice zircon standard yielded a weighted mean 207Pb-235U age of 340.0 ± 3.4 Ma (2σ, MSWD = 1.6), a weighted mean 206Pb-238U age of 339.3 ± 2.8 Ma (2σ, MSWD = 0.61), a 208Pb-232Th age of 354.0 ± 10 (2σ, MSWD = 1.4), and a 207Pb-206Pb age of 330 ± 18 (2σ, MSWD = 0.91).

5.4. Zircon Trace Element and Thermometry Results

Each zircon laser spot has U-Pb and trace element data from the same aliquot of material. REE data are shown in Table 6, and as chondrite normalized spectra in Figure 8B. Generally, core domain zircon is enriched in HREE and depleted in LREE, with a marked Ce anomaly (Ce/Ce* ranging from 6.75–10.21), and little to no Eu anomaly. Rim domain zircon are more depleted in the LREE, and have a steeper slope and slightly enriched HREE relative to core domains. La content was too low to measure in the rims (detection limit ~0.2 ppm), and in many of the zircon in the core domains. There is a stark difference in Th, U, and Th–U ratios between the two zircon domains. Concordant cores have a mean Th/U of 0.42 ± 0.10, Th mean content of 119 ± 61 ppm, and U mean content of 271 ± 95 ppm (uncertainty at 1σ; Table 5; Figure 8C–E). Rim zircon have a mean Th/U of 0.021 ± 0.017, very low mean Th content of 3 ± 2 ppm, and mean U content of 129 ± 28 ppm (uncertainty at 1σ; Table 5; Figure 8C–E).
Ti-in-zircon thermometry for this sample was calculated using the calibration of Watson et al., [52]. While this sample contains a Ti-phase (rutile), it does not contain quartz, and therefore, the activity of silica (aSi) is not precisely known. Thus, the temperatures reported here are minima [53]. The range of calculated temperatures and Ti contents are listed in Table 7. The mean temperatures for concordant zircon core domains is 708 ± 26 °C (2σ), while the mean for concordant rim domain zircon is 668 ± 26 °C (2σ).

6. Discussion

6.1. Origin of the Albitite

We consider both magmatic and metasomatic potential origins for the albitite within Bear Basin, and evaluate field relationships, geochemistry, and textural and mineralogical data for each mechanism. While igneous albitite has been reported in some localities (e.g., [54]), these occurrences are rare compared to metasomatic albitites [17]. The meter-scale tabular or lenticular geometry of the Bear Basin albitite is quite similar to several other tabular white rock bodies that crop out within the biotite ± garnet gneiss in the region (Figure 2E). However, whereas the latter, which are leucogranite dikes, have sharp contacts with their host, the one exposed contact of the albitite is an undulose gradational contact that transitions to the porphyroclastic granodiorite over ~5 cm (Figure 2A).
Bulk rock geochemical analysis indicates that the albitite composition is quite different than the granite sheets, which are peraluminous leucogranites (Table 2). The albitite has lower SiO2 than the leucogranite sheets (~62 wt % vs >71 wt %, Table 2), and is much more enriched in LREE (Figure 5). Typical granitoid rocks altered by albitization have elevated Na2O content, and low CaO and K2O contents [17], which we observe in the albitite bulk rock geochemistry. By contrast, partial melting of the surrounding orthogneiss (e.g., tonalitic gneiss) or metasedimentary units would result in partial melts with either tonalitic compositions [55] or peraluminous high silica granites [56] similar to the composition of the leucogranite sheets.
Within the albitite, the occurrence of unzoned albitic feldspar, quartz free assemblages, and anthophyllite are uncharacteristic features of magmatic rocks. Albite is a common metasomatic product of Na-rich fluids [17,57,58] moving through the crust and altering granitoids. During this alteration process, quartz can be consumed to facilitate the transformation of Al-rich anorthite feldspar into Si-rich albite (e.g., [17,59]). If this albitization occurred at high temperature conditions, it explains the pristine textural appearance of the albite within the albitite (Figure 4B,C), which facilitated annealing of any porosity that developed during albitization of the feldspar. Anthophyllite is unknown to occur within magmatic rocks, and typically forms during metamorphism or metasomatism [60].
Accessory mineral textures within the albitite and the surrounding rocks also aid in constraining the albitite origin. Zircon glomerocrysts only occur within the albitite, suggesting that perhaps this texture is related to the same processes that produced this rock. The glomerocrysts consist of several small zircon dark CL cores surrounded and welded together by bright zircon rims (e.g., Figure 9C,D,G; Figure A2B). Importantly, EBSD data indicate each small zircon grain welded together has a different orientation (Figure 9C). We envision several potential models for glomerocryst formation. The first possibility is that these textures are inherited from igneous processes, either as a single originally igneous zircon that fractured during syn-magmatic deformation, or as separate zircon grains that amalgamated in a complex fluid dynamic environment at the edge of a cooling pluton. This process could have been similar to velocity-gradient or gravitational sorting mechanisms that have been proposed to explain mafic enclave concentrations at the margins of plutons (e.g., [61]). Regardless of the precise mechanism, the salient point for this scenario is that the glomerocrystic texture is inherited from a syn-zircon core crystallization (e.g., 3.2 Ga) magmatic feature. These core domain fragments or grains were subsequently welded together by bright CL rim material during a later zircon growth event. Inclusion of these glomerocrysts in twinned but otherwise undeformed feldspar (although albitized; e.g., Figure 9G) support this interpretation, and it is our preferred one. A second possibility is that the glomerocrystic texture is a product of deformation of a single zircon dark CL core grain during fluid flow and alteration. In this scenario, the glomerocrysts formed during dissolution and reprecipitation of new bright CL zircon rim material along fractures or cracks (e.g., Figure 9D,G; Figure A2). This may indicate an intermediate step in glomerocryst formation during dissolution–reprecipitation, however, it does not fully explain the variable zircon subgrain orientations. If the albitite has an igneous origin, a third possibility is that the glomerocrysts are sourced from small scale cumulates or locally entrained residue that developed during partial melting of the presumed protolith.
Collectively, we interpret the field relationships, bulk rock composition, and mineral assemblages (e.g., Ab + OAm) and textures, as supporting a metasomatic origin for the albitite. A remaining question is what was the protolith (i.e. what was metasomatized and transformed). Given the location of the albitite along the boundary between the biotite ± garnet gneiss and the granodiorite, which may well have acted as an efficient pathway for fluid infiltration and alteration, it is plausible that one of these lithologies is the protolith. By using zircon geochronology, morphology, and texture, a direct link between the metasomatic product and protolith can be made. We interpret the zircon cores to be inherited from the original protolith and partially preserved during metamorphism and metasomatism. Therefore, core ages and morphologies should fingerprint the rock transformed into the albitite during metasomatism. Zircon cores exhibit oscillatory zoning characteristic of igneous zircon (e.g., [62]) and grew at 3175 ± 23 Ma. This age is identical within error to the crystallization age of the porphyroclastic granodiorite of 3177 ± 36 Ma, and considerably older than the 2868 ± 34 Ma age of zircon in the biotite ± garnet gneiss [34]. This timing of core domain zircon and porphyroclastic granodiorite crystallization also overlaps with crystallization of the Hbl monzodiorite and the tonalitic gneiss from the same area (Figure 1C, [34]). However, the zircon textures preclude either of these lithologies as possible protoliths, with only the porphyroclastic granodiorite exhibiting consistent oscillatory zoned zircon textures (Figure 10; Figure A3).

6.2. Chemical Transformation to Albitite

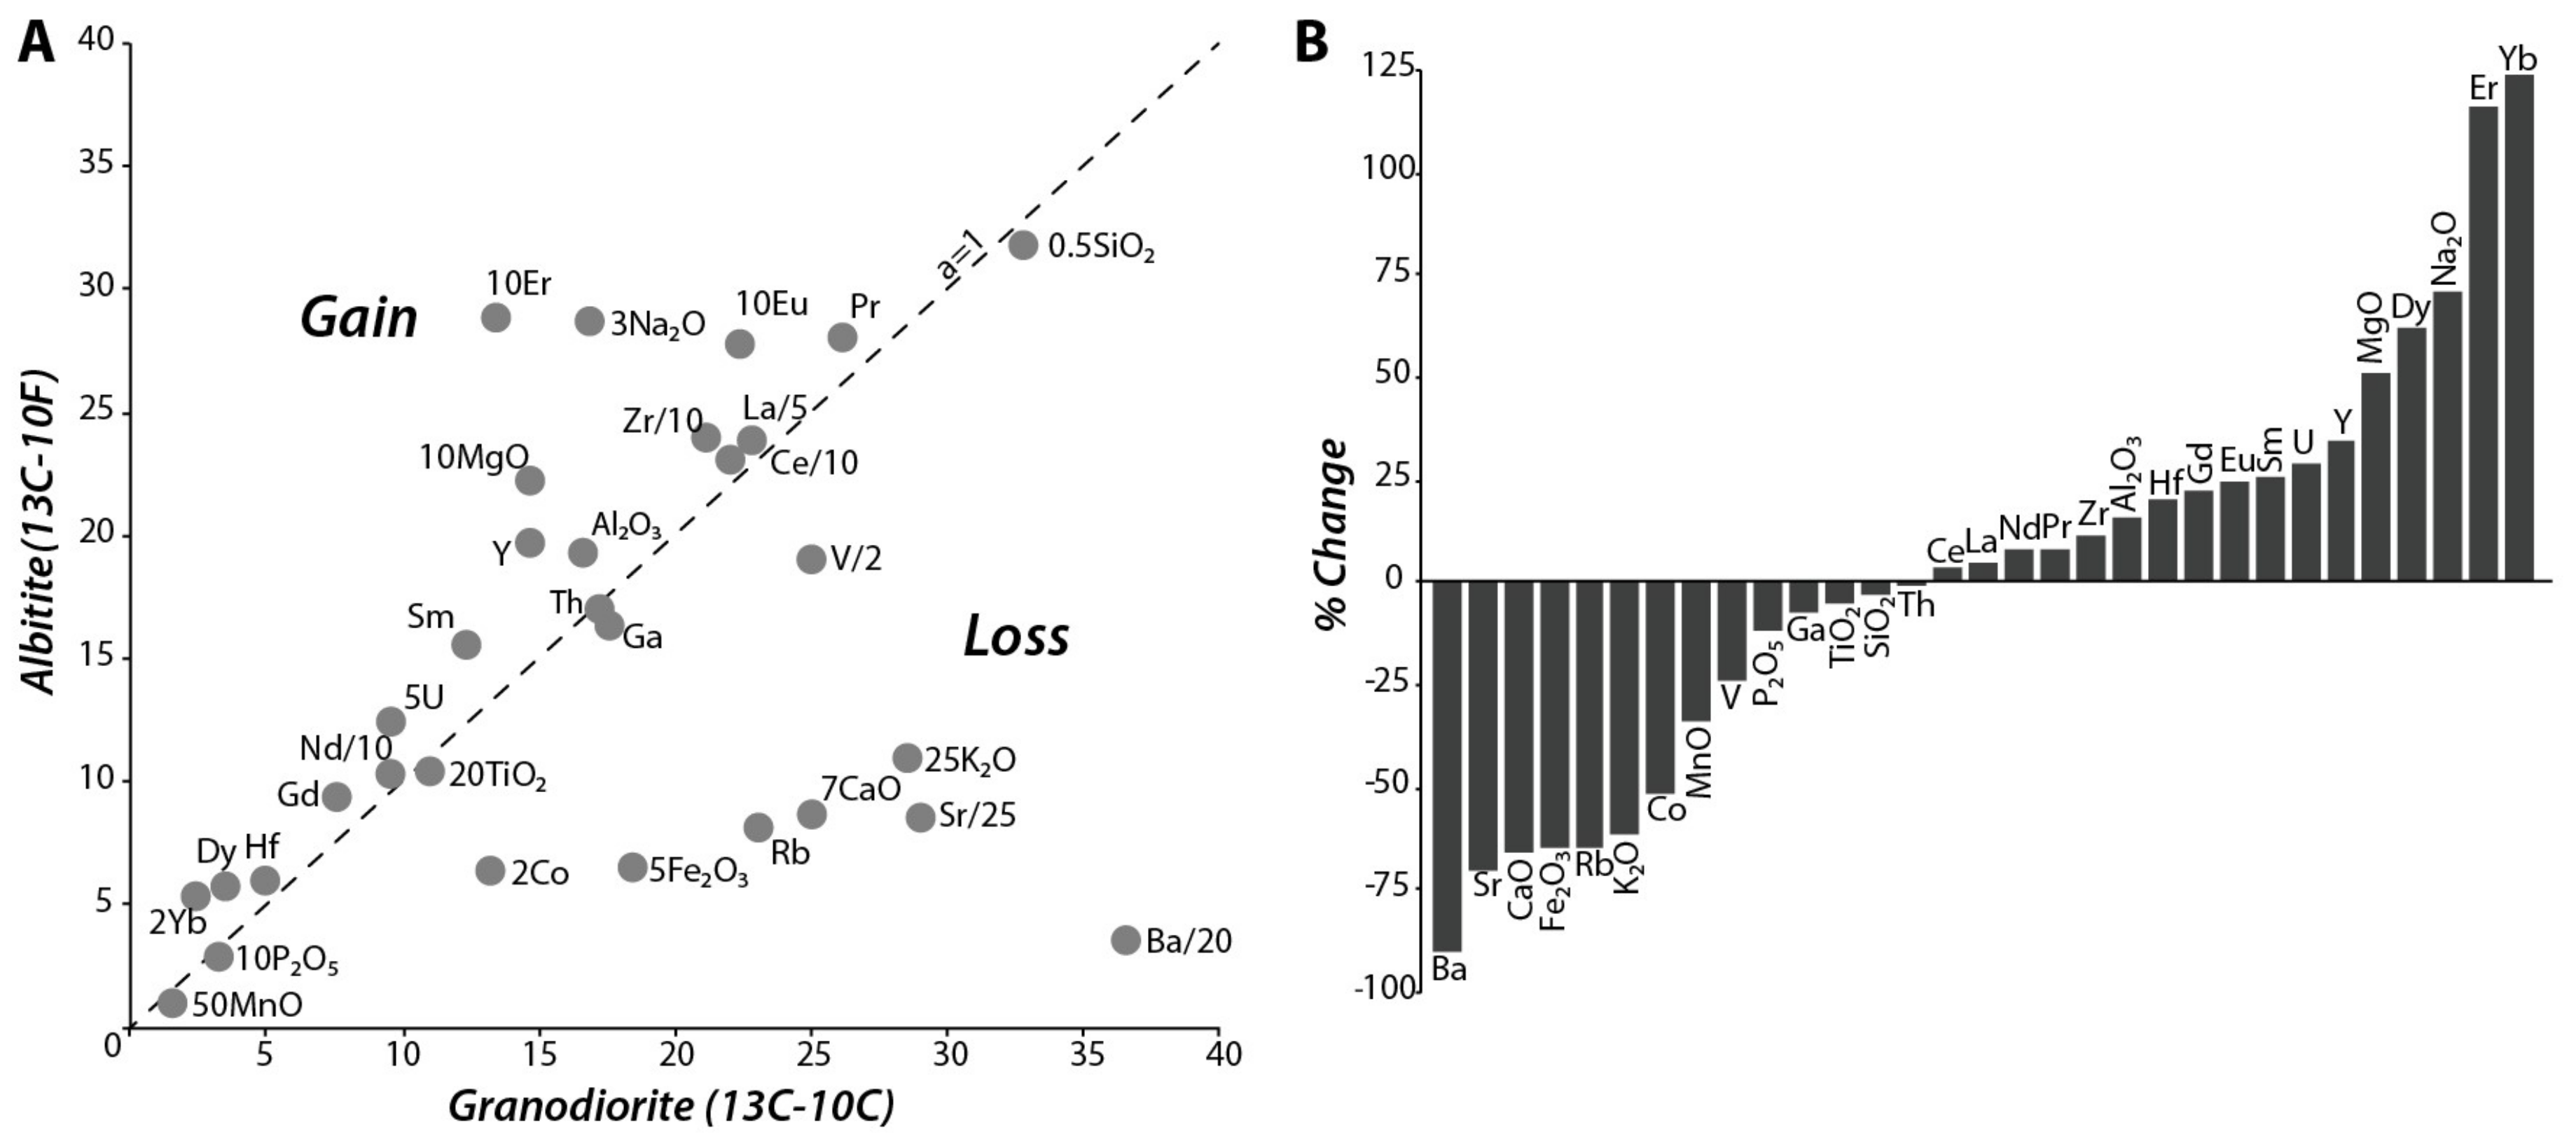
Because metasomatic alteration of the granodiorite is our preferred model for albitite formation, the chemical transformation from the granodiorite to the albitite is plotted as an isocon diagram in Figure 12A. Such diagrams are useful when assessing metasomatic gain or loss of chemical components in altered vs unaltered rock [63,64]. If we assume no volume change, elements that plot above the dashed black line (1:1 line) indicate gain from granodiorite to albitite, while elements plotting below this line indicate loss. It is entirely possible that this system experienced a net volume change. However, there is not an obvious set of immobile elements that plot along a single array that would define an isocon slope. Thus, we feel confident in the trends of elements that experienced the greatest gains or losses. Given this, the isocon analysis shows a loss in CaO, Fe2O3, K2O, Ba, Sr, Rb, Co, and MnO, and a gain of Y, MgO, Dy, Na2O, Er, and Yb (Figure 12A,B).
This transformation is characteristic of the metasomatic effects recognized in other albitized granitoids. For example, Kaur et al., [65] showed major gains in Na and losses of K, Rb, Fe, and Ba between albitites and unaltered protoliths, and similar observations have been made in other albitite studies [59,66]. Thus, the albitite in Bear Basin is interpreted to be a metasomatized, marginal component of the porphyroclastic granodiorite pluton, and mineral textures with high angle grain boundaries (e.g., Figure 4B) indicate that this process likely occurred at relatively high temperatures. To understand when this fluid flow and metasomatism occurred, we turn to the monazite and zircon trace element geochemistry and geochronology data.

6.3. Direct Dating Constraints on Albitization and Fluid Flow

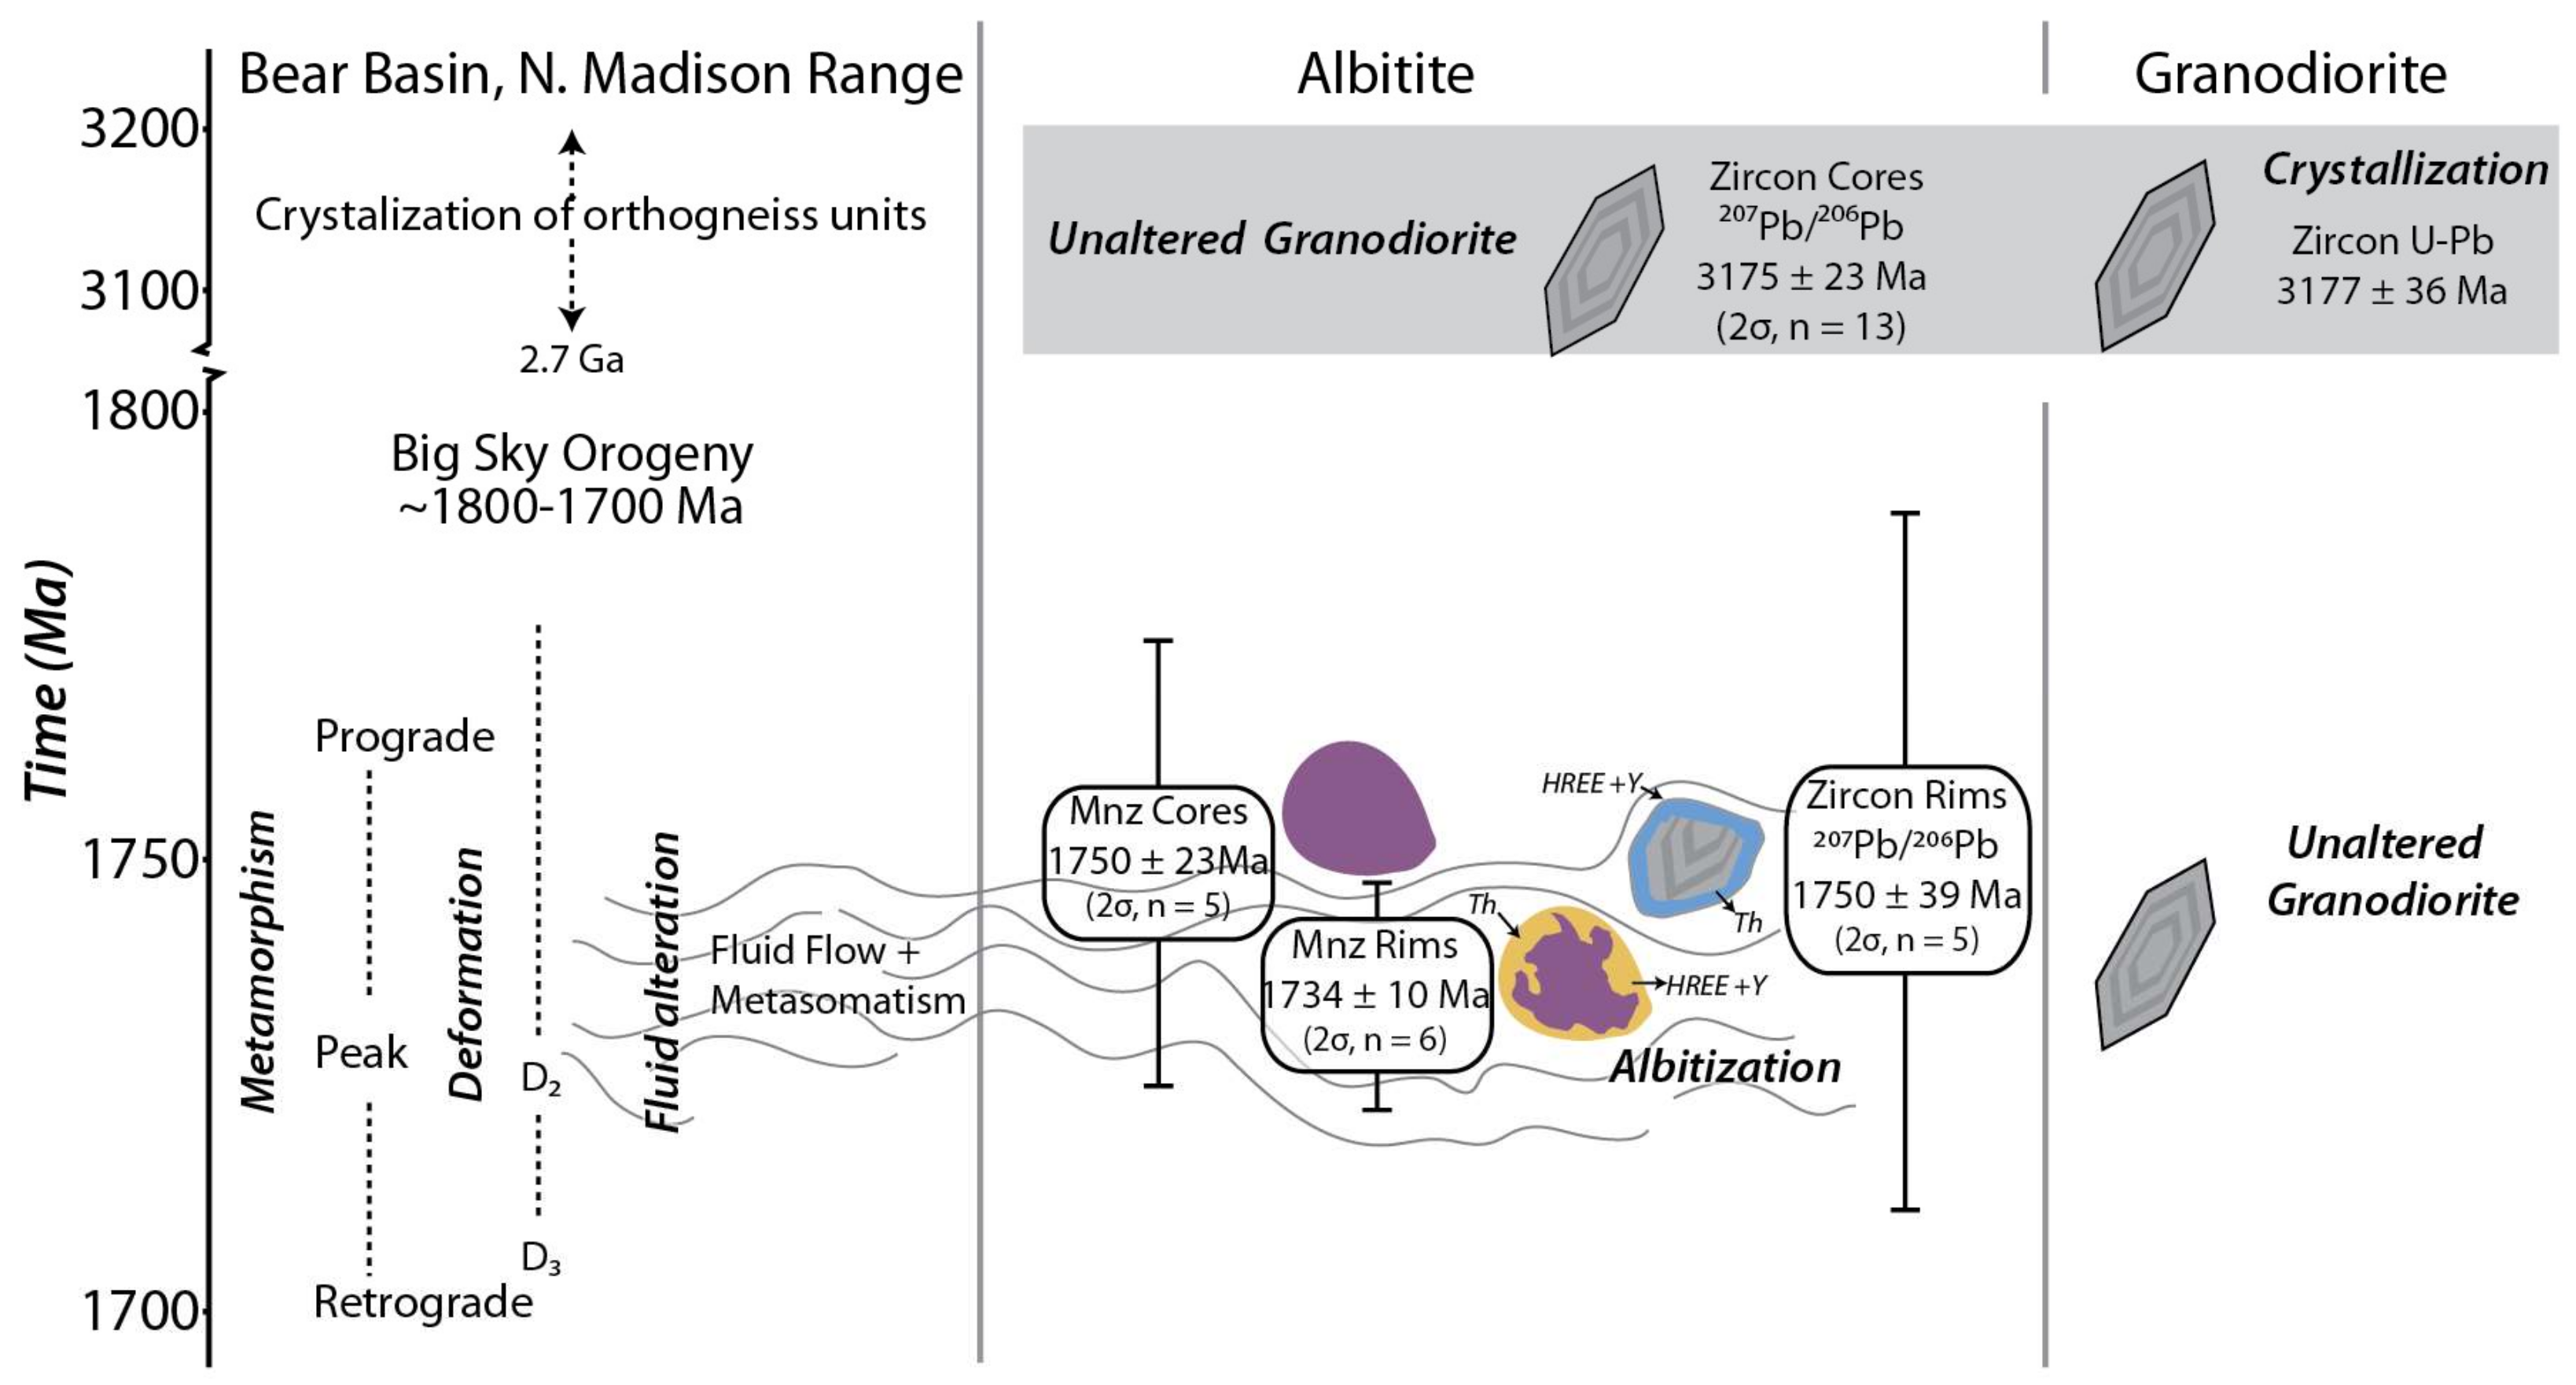
The foliation in the albitite, defined by synmetasomatic anthophyllite and biotite (Figure 2C), is parallel to S2, which formed during the main phase of Paleoproterozoic deformation at ca. 1740–1720 Ma (Figure 13, [20]). However, it is possible that the actual metasomatic process took place before this thermotectonism and the high temperature textures represent annealing during subsequent metamorphism. Therefore, we use accessory mineral geochronology linked to geochemistry and textural appearance to constrain the timing of fluid flow within this rock and, by extension, this region. Zircon cores have a weighted mean age of 3175 ± 23 Ma, and zircon rims have an age of 1750 ± 39 Ma. Monazite cores have a weighted mean age of 1750 ± 23 Ma, and rims a weighted mean age of 1734 ± 10 Ma. Below, we discuss how these two accessory mineral phases can dissolve and reprecipitate during fluid flow, with newly reprecipitated rim domains carrying a geochemical fingerprint of albitization.
Both monazite and zircon are known to readily grow during fluid flow events [13,14,67,68]. In both phases, coupled dissolution of the existing phase and reprecipitation of new zircon or monazite is facilitated by the external fluid, and Pb is generally expelled from the newly reprecipitated domains [69,70,71]. Thus, the geochronological system is reset, and can be used to date the timing of fluid flow.
Experimental and natural studies [69,70,71,72,73] show that new monazite and zircon can grow at high P-T conditions in the presence of sodic fluids. This process is facilitated by the exchange of elements from the fluid, with the existing monazite or zircon by the formation of micrometer scale porosity in the dissolution–reprecipitation reaction front [67,74]. However, these pores may or may not be preserved after formation [75]. Morphologically, the newly precipitated phase generally crosscuts any zoning present in the original grain along sharp dissolution–precipitation fronts, and can occur as patchy growths and psuedomorphs [74,76,77,78,79]; similar textures to those observed here in the multidomainal monazite (e.g., Figure 6A–C) and zircon (e.g., Figure 9A–D,G; Figure A2).
Geochemical signatures of fluid related dissolution–reprecipitation from experimentally grown and naturally investigated monazite and zircon provide useful constraints for identifying new phase growth during sodic fluid flow. Experimentally reprecipitated monazite is typically higher in Th and lower in Y and HREE than the original monazite. Th is less compatible with the Na-rich fluid than monazite, and returns to the mineral during reprecipitation, whereas the Y and HREE are more compatible with the fluid [70]. Reprecipitated zircon growing during Na-Ca rich fluid flow typically has lower Th, REE and other trace elements than the original zircon [67,69,80].
The above chemical patterns are observed in both the monazite and zircon investigated here (Figure 8). Monazite core domains have several zones high in Th, but the majority of the cores have dramatically lower Th concentrations (<9000 ppm) compared to monazite rim domains (>~16,000 ppm). Observed Y content and HREE patterns also match experimental observations; monazite rims generally have lower Y and HREE than cores (Table 3; Figure 6A–C; Figure 8A). Zircon rims have very low Th content (~0–7 ppm) (Table 5; Figure 8D) and lower LREE and MREE and higher HREE than zircon core domains (Table 6; Figure 8B). This can be explained both by coupled dissolution–reprecipitation of zircon with a fluid and with concurrent growth with monazite rims. LREE and MREE released from the pre-existing zircon would have been more compatible with the fluid, and would not have been incorporated into the new zircon rims. Similarly, as monazite rims grew within this same fluid, Y and HREE within the original monazite core domains would not have reprecipitated, and instead, would have moved into the fluid (Figure 13). As zircon rim material grew in the presence of this fluid, it would have preferentially taken up the HREE released by the dissolving monazite. Together, monazite and zircon rim geochemistry and textures indicate that the rim domains grew metasomatically during albitization and Na-fluid flow at 1750–1735 Ma.

6.4. Tectonic Significance of Metasomatism and Regional Fluid Flow

Lithological and field evidence indicate pervasive fluid flow in the Bear Basin region during the late Paleoproterozoic Big Sky orogeny including penetrative regional D2 fabric defined by synkinematic hydrous phases (Figure 2C, [20]) and garbenschiefer textures directly linked to monazite and zircon geochronology. Zircon and monazite from a deformed mafic dike and the Bear Basin pelitic schist, respectively constrain the deformation and associated prograde to peak metamorphism, (0.9 GPa and ~700 °C), to have occurred in the interval of 1750–1720 Ma [20] (Figure 7B; Figure 13). Our new results are consistent with this pattern. Monazite cores from the albitite grew early during this same interval, followed by growth of rims of both monazite and zircon in conjunction with fluid infiltration (Figure 13). The minimum temperatures from Ti concentrations in zircon rims (668 ± 26 °C; 2σ) are consistent with the peak temperature suggested by Condit et al. [20].
The source of the fluids within this region remains unclear. The occurrence of albitization constrains the composition of at least some of the fluids as Na-rich. Within the Big Sky orogeny, a pattern of southeastward propagation of hinterland thermotectonism towards the foreland is recorded in zircon, monazite, and garnet geochronology across ~100 km and over an ~80–40 myr timespan from 1.80–1.78 Ga in the Highland and Ruby Ranges (Figure 1) to 1.75–1.72 Ga in Northern Madison Range [20]. This pattern offers a tectonic framework to begin speculating on the sources of these fluids. As the Big Sky orogen’s metamorphic core grew, thrusting and burial of sedimentary rocks may have resulted in prograde metamorphism and subsequent dehydration below the area of Bear Basin, and these fluid may have infiltrated and facilitated metasomatism and metamorphism. At a more local scale, the metapelitic schist found within Bear Basin itself would be undergoing prograde metamorphism and dewatering during this period, which could cause originally low salinity fluids to become locally enriched [81], resulting in nearby local albitization. The protolith and depositional nature of this heterogeneous schist remains unconstrained. However, observations of conglomeratic layers along its contacts (Figure 1C, [20]) suggest it could have a terrestrial origin. It is possible that thin evaporite layers may have released sodium to increase salinity in the dewatering metamorphic fluids. In the nearby Tobacco Root Mountains (Figure 1A), another package of metavolcaniclastic and metasedimentary rocks, the Spuhler Peak metamorphic suite, preserves similar fluid-related and metasomatic features to those observed in Bear Basin [82]. These rocks appear to record another locus of metasomatism and alteration within the Big Sky orogeny. Regardless of the fluid source, the end result is a region of pervasive metamorphism, areas of metasomatism, and penetrative fabric development during the interval of 1750–1720 Ma in the northern Gallatin Peak terrane.

7. Conclusions

Albitization along the margin of an Archean granodioritic orthogneiss resulted in complete transformation of plagioclase and K-feldspar to almost pure albite. During metasomatism, orthoamphibole and biotite grew synkinematically in alignment with the regional D2 foliation fabric. Na-rich fluids metasomatized this rock, resulting in an increase in Na and a marked decrease in Ca, K, Ba, Fe, and Sr. Monazite and zircon geochronology, morphology, textures and trace element geochemistry link the timing of this metasomatism to prograde peak metamorphism and deformation of the Big Sky orogeny, from 1750–1720 Ma. It is through the coupling of these textural, geochronological, and geochemical techniques that a robust interpretation of the timing of amphibolite facies metasomatism is established.

Author Contributions

C.B.C. and K.H.M. designed the experiments. C.B.C., K.H.M., K.C.C. and A.M. collected and interpreted the data. C.B.C. wrote the paper with significant contributions from K.H.M., A.M. and K.C.C. C.B.C. and K.C.C. prepared the figures.

Acknowledgments

Funding for this work was provided by NSF grant (EAR1252295) to Mahan, USGS EDMAP grant to Mahan and Condit, and the Spetzler Research Award from the University of Colorado, Department of Geological Sciences to Condit. N. Kelly, J. Allaz, and R. Flowers are thanked for their comments on an earlier draft. Invaluable field assistance was provided by K. Kravitz, K. Toenenboehn, and D. Rattanasith. Detailed reviews from Samuel Angiboust and three anonymous reviewers improved the quality of this work and are thanked.

Conflicts of Interest

There are no known conflicts of interest

Appendix

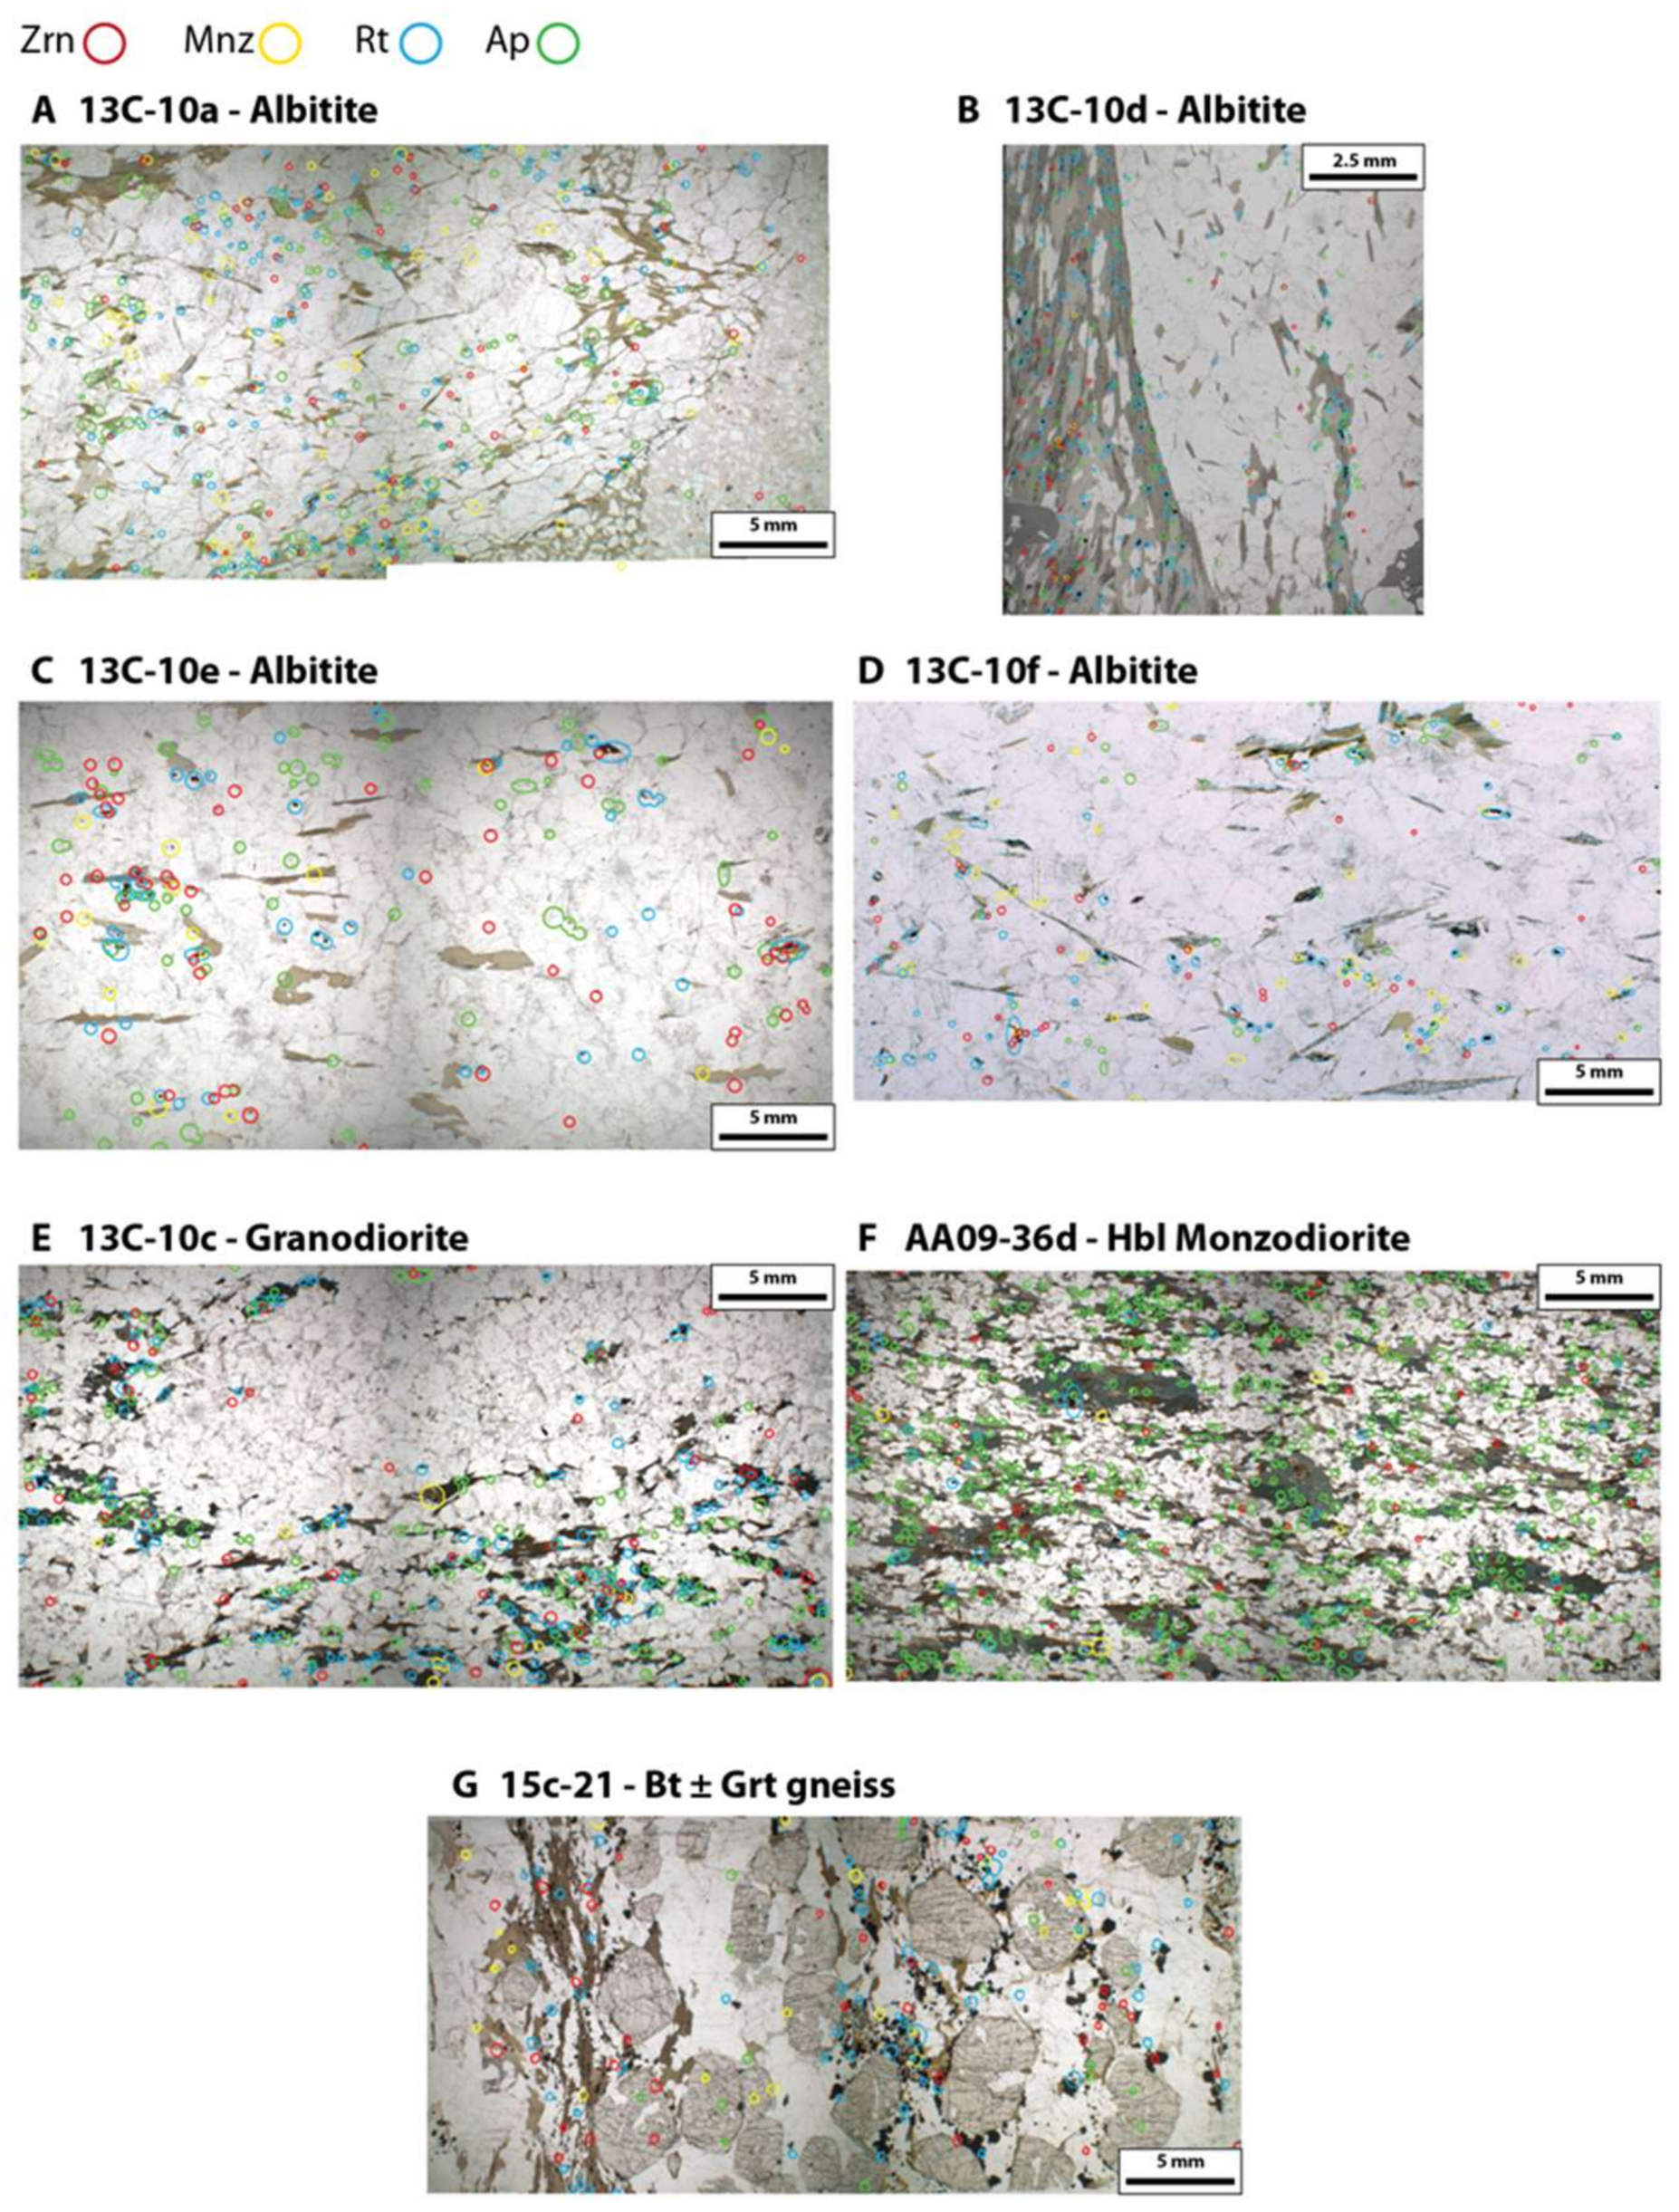
Figure A1. Full thin section photomicrographs showing locations of accessory minerals (zircon, monazite, rutile, and apatite) detected using full thin section WDS search maps (Al, Zr, Ce, Ti, and P) later registered to the photomicrograph. (A) Albitite sample 13c-10a; (B) Albitite sample 13c-10d; (C) Albitite sample 13C-10e; (D) Albitite sample 13c-10f; (E) Porphyroclastic granodiorite sample 13c-10c. (F) Hbl Monzodiorite sample AA09-36d; (G) biotite ± garnet gneiss sample 15c-21.
Minerals 08 00187 g0a1
Figure A2. BSE and CL images of zircon from albitite samples (A) 13c-10d and (B) 13c-10f. All zircon grains show dark CL cores with concentric zoning and bright CL rims that truncate core zoning.
Minerals 08 00187 g0a2
Figure A3. BSE and CL image of zircon from non-albitite samples. (A) Hbl monzodiorite sample AA09-36 zircon show complicated internal sector zoning with bright CL rims; (B) Biotite ± garnet sample 15c-21 zircon show complicated internal zoning and no bright CL rims; (C) Porphyroclastic granodiorite sample 13c-10c show well developed concentric zoning, rational crystal faces, and little to no bright CL rim materials.
Minerals 08 00187 g0a3

References

  1. Jamtveit, B.; Austrheim, H.; Putnis, A. Disequilibrium metamorphism of stressed lithosphere. Earth Sci. Rev. 2016, 154, 1–13. [Google Scholar] [CrossRef]
  2. Goncalves, P.; Oliot, E.; Marquer, D.; Connolly, J.A.D. Role of chemical processes on shear zone formation: An example from the Grimsel metagranodiorite (Aar massif, Central Alps). J. Metamorph. Geol. 2012, 30, 703–722. [Google Scholar] [CrossRef]
  3. Condit, C.B.; Mahan, K.H. Fracturing, fluid flow and shear zone development: Relationships between chemical and mechanical processes in Proterozoic mafic dykes from southwestern Montana, USA. J. Metamorph. Geol. 2018, 36, 195–223. [Google Scholar] [CrossRef]
  4. Penniston-Dorland, S.C.; Ferry, J.M. Element mobility and scale of mass transport in the formation of quartz veins during regional metamorphism of the Waits River Formation, east-central Vermont. Am. Mineral. 2008, 93, 7–21. [Google Scholar] [CrossRef]
  5. Ague, J.J. Mass-transfer during Barrovian metamorphism of pelites, south-central Connecticut I: Evidence for changes in composition and volume. Am. J. Sci. 1994, 294, 989–1057. [Google Scholar] [CrossRef]
  6. Jones, C.H.; Mahan, K.H.; Butcher, L.A.; Levandowski, W.B.; Farmer, G.L. Continental uplift through crustal hydration. Geology 2015, 43, 355–358. [Google Scholar] [CrossRef]
  7. Fischer, K.M. Waning buoyancy in the crustal roots of old mountains. Nature 2002, 417, 933–936. [Google Scholar] [CrossRef] [PubMed]
  8. Humphreys, E.; Hessler, E.; Dueker, K.; Farmer, G.L.; Erslev, E.; Atwater, T. How Laramide-Age Hydration of North American Lithosphere by the Farallon Slab Controlled Subsequent Activity in the Western United States. Int. Geol. Rev. 2003, 45, 575–595. [Google Scholar] [CrossRef]
  9. Breeding, C.M.; Ague, J.J. Slab-derived fluids and quartz-vein formation in an accretionary prism, Otago Schist, New Zealand. Geology 2002, 30, 499–502. [Google Scholar] [CrossRef]
  10. Audet, P.; Bürgmann, R. Possible control of subduction zone slow-earthquake periodicity by silica enrichment. Nature 2014, 510, 389–392. [Google Scholar] [CrossRef] [PubMed]
  11. Goncalves, P.; Marquer, D.; Oliot, E.; Durand, C. Thermodynamic Modeling and Thermobarometry of Metasomatized Rocks. In Metasomatism and Chemical Transformation of Rock; Harlov, D.E., Austrheim, H., Eds.; Springer: Berlin, Germany, 2013; pp. 53–92. ISBN 978-3-642-28393-2. [Google Scholar]
  12. Yardley, B. The Chemical Composition of Metasomatic Fluids in the Crust. In Metasomatism and the Chemical Transformation of Rock; Harlov, D.E., Austrheim, H., Eds.; Springer: Berlin, Germany, 2013; pp. 17–51. [Google Scholar]
  13. Villa, I.M.; Williams, M.L. Geochronology of Metasomatic Events. In Metasomatism and the Chemical Transformation of Rock SE—8; Springer: Berlin, Germany, 2013; pp. 171–202. ISBN 978-3-642-28393-2. [Google Scholar]
  14. Mahan, K.H.; Goncalves, P.; Williams, M.L.; Jercinovic, M.J. Dating metamorphic reactions and fluid flow: Application to exhumation of high-P granulites in a crustal-scale shear zone, western Canadian Shield. J. Metamorph. Geol. 2006, 24, 193–217. [Google Scholar] [CrossRef]
  15. Butcher, L.; Mahan, K.H.; Allaz, J.M. Late Cretaceous crustal hydration in the Colorado Plateau, USA, from xenolith petrology and monazite geochronology. Lithosphere 2017, 9, 561–578. [Google Scholar] [CrossRef]
  16. Rubatto, D.; Angiboust, S. Oxygen isotope record of oceanic and high pressure metasomatism: A P-T-time-fluid path for the Monviso eclogite (Italy). Cont. Min. Pet. 2015, 170. [Google Scholar] [CrossRef]
  17. Engvik, A.K.; Putnis, A.; Fitz Gerald, J.D.; Austrheim, H. Albitization of granitic rocks: The mechanism of replacement of oligoclase by albite. Can. Mineral. 2008, 46, 1401–1415. [Google Scholar] [CrossRef]
  18. Petersson, J.; Stephens, M.B.; Mattsson, H.; Möller, C. Albitization and quartz dissolution in Paleoproterozoic metagranite, central Sweden-Implications for the disposal of spent nuclear fuel in a deep geological repository. Lithos 2012, 148, 10–26. [Google Scholar] [CrossRef]
  19. Touret, J.; Nijland, T. Prograde, Peak and Retrograde Metamorphic Fluids and Associated Metasomatism in Upper Amphibolite to Granulite Facies Transition Zones. In Metasomatism and the Chemical Transformation of Rock; Harlov, D.E., Austrheim, H., Eds.; Springer: Berlin, Germany, 2013; pp. 415–469. ISBN 978-3-642-28393-2. [Google Scholar]
  20. Condit, C.B.; Mahan, K.H.; Ault, A.K.; Flowers, R.M. Foreland-directed propagation of high-grade tectonism in the deep roots of a Paleoproterozoic collisional orogen, SW Montana, USA. Lithosphere 2015, 7, 625–645. [Google Scholar] [CrossRef]
  21. Mueller, P.A.; Burger, H.R.; Wooden, J.L.; Heatherington, A.L.; Mogk, D.W.; D’Arcy, K. Age and evolution of the Precambrian Crust of the Tobacco Root Mountains, Montana. Geol. Soc. Am. Spec. Pap. 2004, 377, 181–202. [Google Scholar]
  22. Harms, T.A.; Brady, J.B.; Burger, H.R.; Cheney, J.T. Advances in the geology of the Tobacco Root Mountains, Montana and their implications for the history of the northern Wyoming province. Geol. Soc. Am. Spec. Pap. 2004, 377, 227–243. [Google Scholar]
  23. Mueller, P.A.; Burger, H.R.; Wooden, J.L.; Brady, J.B.; Cheney, J.T.; Harms, T.A.; Heatherington, A.L.; Mogk, D.W. Paleoproterozoic Metamorphism in the Northern Wyoming Province: Implications for the Assembly of Laurentia. J. Geol. 2005, 113, 169–179. [Google Scholar] [CrossRef]
  24. Cheney, J.; Brady, J. Proterozoic metamorphism of the Tobacco Root Mountains, Montana. Geol. Soc. Am. Spec. Pap. 2004, 377, 105–129. [Google Scholar]
  25. Krogh, T.E.; Kamo, S.L.; Hanley, T.B.; Hess, D.F.; Dahl, P.S.; Johnson, R.E. Geochronology and geochemistry of Precambrian gneisses, metabasites, and pegmatite from the Tobacco Root Mountains, northwestern Wyoming craton, Montana. Can. J. Earth Sci. 2011, 48, 161–185. [Google Scholar] [CrossRef]
  26. Cheney, J.; Webb, A.; Coath, C.; McKeegan, K. In situ ion microprobe 207Pb/206Pb dating of monazite from Precambrian metamorphic suites, Tobacco Root Mountains, Montana. Geol. Soc. Am. Spec. Pap. 2004, 377, 151–179. [Google Scholar] [CrossRef]
  27. Mueller, P.A.; Wooden, J.L.; Mogk, D.W.; Foster, D.A. Paleoproterozoic evolution of the Farmington zone: Implications for terrane accretion in southwestern Laurentia. Lithosphere 2011, 3, 401–408. [Google Scholar] [CrossRef]
  28. Foster, D.A.; Mueller, P.A.; Mogk, D.W.; Wooden, J.L.; Vogl, J.J. Proterozoic evolution of the western margin of the Wyoming craton: Implications for the tectonic and magmatic evolution of the northern Rocky. Can. J. Earth Sci. 2006, 43, 1601–1619. [Google Scholar] [CrossRef]
  29. Whitmeyer, S.; Karlstrom, K. Tectonic model for the Proterozoic growth of North America. Geosphere 2007. [Google Scholar] [CrossRef]
  30. Giletti, B. Isotopic ages from southwestern Montana. J. Geophys. Res. 1966, 71, 4029–4036. [Google Scholar] [CrossRef]
  31. Giletti, B. Discordant isotopic ages and excess argon in biotites. Earth Planet. Sci. Lett. 1971, 10, 157–164. [Google Scholar] [CrossRef]
  32. Hames, W.E.; Harms, T.A. Laser 40Ar/39Ar thermochronology of single crystals from Paleoproterozoic and Archean rocks of the norther Wyoming Province, Big Sky orogen, and Great Falls Tectonic Zone: Giletti’s Line revisted. In Proceedings of the GSA’s 125th Anniversary Annual Meeting & Exposition, Denver, CO, USA, 27–30 October 2013. [Google Scholar]
  33. Salt, K.J. Archean Geology of the Spanish Peaks Area, Southwestern Montana, Montana State University. Master Thesis, Montana State University, Bozeman, MT, USA, March 1987. [Google Scholar]
  34. Weyand, E.L. U-Pb Zircon geochronology of Archean Rocks from the Spanish Peaks area, Madison Range. Master’s Thesis, Univeristy Of Florida, Gainesville, FL, USA, 1989. [Google Scholar]
  35. Spencer, E.; Kozak, S. Precambrian evolution of the Spanish Peaks area, Montana. Geol. Soc. Am. Bull. 1975, 86, 785–792. [Google Scholar] [CrossRef]
  36. Ault, A.K.; Flowers, R.M.; Mahan, K.H. Quartz shielding of sub-10μm zircons from radiation damage-enhanced Pb loss: An example from a metamorphosed mafic dike, northwestern Wyoming craton. Earth Planet. Sci. Lett. 2012, 339–340, 57–66. [Google Scholar] [CrossRef]
  37. Whitney, D.L.; Evans, B.W. Abbreviations for names of rock-forming minerals. Am. Mineral. 2009, 95, 185–187. [Google Scholar] [CrossRef]
  38. Mogk, D.W.; Mueller, P.A.; Wooden, J.L. The nature of Archean terrane boundaries: An example from the northern Wyoming Province. Precambrian Res. 1992, 55, 155–168. [Google Scholar] [CrossRef]
  39. McDonough, W.F.; Sun, S.S. The composition of the Earth. Chem. Geol. 1995, 120, 223–253. [Google Scholar] [CrossRef]
  40. Dumond, G.; Mclean, N.; Williams, M.; Jercinovic, M.; Bowring, S. High-resolution dating of granite petrogenesis and deformation in a lower crustal shear zone: Athabasca granulite terrane, western Canadian Shield. Chem. Geol. 2008, 254, 175–196. [Google Scholar] [CrossRef]
  41. Williams, M.L.; Jercinovic, M.J.; Goncalves, P.; Mahan, K. Format and philosophy for collecting, compiling, and reporting microprobe monazite ages. Chem. Geol. 2006, 225, 1–15. [Google Scholar] [CrossRef]
  42. Jercinovic, M.; Williams, M.; Lane, E. In-situ trace element analysis of monazite and other fine-grained accessory minerals by EPMA. Chem. Geol. 2008, 254, 197–215. [Google Scholar] [CrossRef]
  43. Allaz, J.M.; Williams, M.L.; Jercinovic, M.J.; Donavan, J. A new technique for electron microprobe trace element analysis: The multipoint background method. In Proceedings of the EMAS Annual Meeting, Angers, France, 15–19 May 2011; pp. 319–320. [Google Scholar]
  44. Davis, W.J. (Geological Survey of Canada). Personal communication, 2007. [Google Scholar]
  45. Allaz, J.M. (ETH, Zurich, Switzerland). Personal communication, 2015. [Google Scholar]
  46. Jackson, S.E.; Pearson, N.J.; Griffin, W.L.; Belousova, E.A. The application of laser ablation-in ductively coupled plasma-mass spectrometry to in situ U-Pb zircon geochronology. Chem. Geol. 2004, 211, 47–69. [Google Scholar] [CrossRef]
  47. Jochum, K.P.; Weis, U.; Stoll, B.; Kuzmin, D.; Yang, Q.; Raczek, I.; Jacob, D.E.; Stracke, A.; Birbaum, K.; Frick, D.A.; et al. Determination of reference values for NIST SRM 610-617 glasses following ISO guidelines. Geostand. Geoanal. Res. 2011, 35, 397–429. [Google Scholar] [CrossRef]
  48. Sláma, J.; Košler, J.; Condon, D.J.; Crowley, J.L.; Gerdes, A.; Hanchar, J.M.; Horstwood, M.S.A.; Morris, G.A.; Nasdala, L.; Norberg, N.; et al. Plešovice zircon—A new natural reference material for U–Pb and Hf isotopic microanalysis. Chem. Geol. 2008, 249, 1–35. [Google Scholar] [CrossRef]
  49. Paton, C.; Woodhead, J.D.; Hellstrom, J.C.; Hergt, J.M.; Greig, A.; Maas, R. Improved laser ablation U–Pb zircon geochronology through robust downhole fractionation correction. Geochem. Geophys. Geosyst. 2010, 11. [Google Scholar] [CrossRef]
  50. Paton, C.; Hellstrom, J.; Paul, B.; Woodhead, J.; Hergt, J. Iolite: Freeware for the visualisation and processing of mass spectrometric data. J. Anal. At. Spectrom. 2011, 26, 2508. [Google Scholar] [CrossRef]
  51. Petrus, J.A.; Kamber, B.S. VizualAge: A Novel Approach to Laser Ablation ICP-MS U-Pb Geochronology Data Reduction. Geostand. Geoanal. Res. 2012, 36, 247–270. [Google Scholar] [CrossRef]
  52. Watson, E.B.; Wark, D.A.; Thomas, J.B. Crystallization thermometers for zircon and rutile. Contrib. Mineral. Petrol. 2006, 151, 413–433. [Google Scholar] [CrossRef]
  53. Fu, B.; Page, F.Z.; Cavosie, A.J.; Fournelle, J.; Kita, N.T.; Lackey, J.S.; Wilde, S.A.; Valley, J.W. Ti-in-zircon thermometry: Applications and limitations. Contrib. Mineral. Petrol. 2008, 156, 197–215. [Google Scholar] [CrossRef]
  54. Pin, C.; Monchoux, P.; Paquette, J.L.; Azambre, B.; Wang, R.C.; Martin, R.F. Igneous albitite dikes in orogenic lherzolites, western Pyrénées, France: A possible source for corundum and alkali feldspar xenocrysts in basaltic terranes. II. Geochemical and petrogenetic considerations. Can. Mineral. 2006, 44, 843–856. [Google Scholar] [CrossRef]
  55. Nédélec, A.; Minyem, D.; Barbey, P. High-P-high-T anatexis of Archaean tonalitic grey gneisses: The Eseka migmatites, Cameroon. Precambr. Res. 1993, 62, 191–205. [Google Scholar] [CrossRef]
  56. Thompson, A.B. Dehydration melting of pelitic rocks and the generation of H2O-undersaturated granitic liquids. Am. J. Sci. 1982, 282, 1567–1595. [Google Scholar] [CrossRef]
  57. Rubenach, M.J.; Lewthwaite, K.A. Metasomatic albitites and related biotite-rich schists from a low-pressure polymetamorphic terrane, Snake Creek Anticline, Mount Isa Inlier, North-Eastern Australia: Microstructures and P-T-d paths. J. Metamorph. Geol. 2002, 20, 191–202. [Google Scholar] [CrossRef]
  58. Engvik, A.K.; Ihlen, P.M.; Austrheim, H. Characterisation of Na-metasomatism in the Sveconorwegian Bamble Sector of South Norway. Geosci. Front. 2014, 5, 659–672. [Google Scholar] [CrossRef]
  59. Boulvais, P.; Ruffet, G.; Cornichet, J.; Mermet, M. Cretaceous albitization and dequartzification of Hercynian peraluminous granite in the Salvezines Massif (French Pyrenees). Lithos 2007, 93, 89–106. [Google Scholar] [CrossRef]
  60. Deer, W.; Howie, R.; Zussman, J. The Rock Forming Minerals, 2nd ed.; Pearson Education Limited: London, UK, 1992. [Google Scholar]
  61. Tobisch, O.T.; McNully, B.A.; Vernon, R.H. Microgranitoid enclave swarms in granitic pluton, central Sierra Nevada, California. Lithos 1997, 40, 321–339. [Google Scholar] [CrossRef]
  62. Corfu, F.; Hanchar, J.M.; Hoskin, P.W.; Kinny, P. Atlas of Zircon Textures. Rev. Mineral. Geochem. 2003, 53, 469–500. [Google Scholar] [CrossRef]
  63. Grant, J.A. The isocon diagram; a simple solution to Gresens’ equation for metasomatic alteration. Econ. Geol. 1986, 81, 1976–1982. [Google Scholar] [CrossRef]
  64. Grant, M.L.; Wilde, S.A.; Wu, F.; Yang, J. The application of zircon cathodoluminescence imaging, Th–U–Pb chemistry and U–Pb ages in interpreting discrete magmatic and high-grade metamorphic events in the North China Craton at the Archean/Proterozoic boundary. Chem. Geol. 2009, 261, 155–171. [Google Scholar] [CrossRef]
  65. Kaur, P.; Chaudhri, N.; Hofmann, A.W. New evidence for two sharp replacement fronts during albitization of granitoids from northern Aravalli orogen, northwest India. Int. Geol. Rev. 2015, 57, 1660–1685. [Google Scholar] [CrossRef]
  66. Jaguin, J.; Boulvais, P.; Poujol, M.; Bosse, V.; Paquette, J.L.; Vilbert, D. Albitization in the Antimony Line, Murchison Greenstone Belt (Kaapvaal Craton): A geochemical and geochronological investigation. Lithos 2013, 168–169, 124–143. [Google Scholar] [CrossRef]
  67. Geisler, T.; Schaltegger, U.; Tomaschek, F. Re-equilibration of zircon in aqueous fluids and melts. Elements 2007, 3, 43–50. [Google Scholar] [CrossRef]
  68. Petrík, I.; Konečný, P. Metasomatic replacement of inherited metamorphic monazite in a biotite-garnet granite from the Nízke Tatry Mountains, Western Carpathians, Slovakia: Chemical dating and evidence for disequilibrium melting. Am. Mineral. 2009, 94, 957–974. [Google Scholar] [CrossRef]
  69. Harlov, D.E.; Dunkley, D.J. Experimental high-grade alteration of zircon using alkali- and Ca-bearing solutions. Am. Mineral. 2011, 96, 716–731. [Google Scholar] [CrossRef]
  70. Harlov, D.E.; Hetherington, C.J. Partial high-grade alteration of monazite using alkali-bearing fluids: Experiment and nature. Am. Mineral. 2010, 95, 1105–1108. [Google Scholar] [CrossRef]
  71. Williams, M.L.; Jercinovic, M.J.; Harlov, D.E.; Budzyń, B.; Hetherington, C.J. Resetting monazite ages during fluid-related alteration. Chem. Geol. 2011, 283, 218–225. [Google Scholar] [CrossRef]
  72. Hetherington, C.J.; Harlov, D.E.; Budzyń, B. Experimental metasomatism of monazite and xenotime: Mineral stability, REE mobility and fluid composition. Mineral. Petrol. 2010, 99, 165–184. [Google Scholar] [CrossRef]
  73. Hurai, V.; Paquette, J.L.; Lexa, O.; Konečný, P.; Dianiška, I. U-Pb-Th geochronology of monazite and zircon in albitite metasomatites of the Rožňava-Nadabula ore field (Western Carpathians, Slovakia): Implications for the origin of hydrothermal polymetallic siderite veins. Mineral. Petrol. 2015, 109, 519–530. [Google Scholar] [CrossRef]
  74. Putnis, A. Mineral Replacement Reactions. Rev. Mineral. Geochem. 2009, 70, 87–124. [Google Scholar] [CrossRef]
  75. Putnis, A. Mineral replacement reactions: From macroscopic observations to microscopic mechanisms. Mineral. Mag. 2002, 66, 689–708. [Google Scholar] [CrossRef]
  76. Tomaschek, F. Zircons from Syros, Cyclades, Greece-Recrystallization and Mobilization of Zircon During High-Pressure Metamorphism. J. Petrol. 2003, 44, 1977–2002. [Google Scholar] [CrossRef]
  77. Taylor, R.J.M.; Clark, C.; Fitzsimons, I.C.W.; Santosh, M.; Hand, M.; Evans, N.; McDonald, B. Post-peak, fluid-mediated modification of granulite facies zircon and monazite in the Trivandrum Block, southern India. Contrib. Mineral. Petrol. 2014, 168, 1–17. [Google Scholar] [CrossRef]
  78. Taylor, R.J.M.; Kirkland, C.L.; Clark, C. Accessories after the facts: Constraining the timing, duration and conditions of high-temperature metamorphic processes. Lithos 2016, 264, 239–257. [Google Scholar] [CrossRef]
  79. Peterman, E.M.; Snoeyenbos, D.R.; Jercinovic, M.J.; Kylander-Clark, A. Dissolution-reprecipitation metasomatism and growth of zircon within phosphatic garnet in metapelites from western Massachusetts. Am. Mineral. 2016, 101, 1792–1806. [Google Scholar] [CrossRef]
  80. Soman, A.; Geisler, T.; Tomaschek, F.; Grange, M.; Berndt, J. Alteration of crystalline zircon solid solutions: A case study on zircon from an alkaline pegmatite from Zomba-Malosa, Malawi. Contrib. Mineral. Petrol. 2010, 160, 909–930. [Google Scholar] [CrossRef]
  81. Yardley, B.W.D.; Graham, J.T. The origins of salinity in metamorphic fluids. Geofluids 2002, 2, 249–256. [Google Scholar] [CrossRef]
  82. Burger, H.; Peck, W.; Johnson, K.; Tierney, K.; Pouslen, C.; Cady, P.; Lowell, J.; MacFarlane, W.; Sincock, M.; Archuleta, L.; et al. Geology and geochemistry of the Spuhler Peak Metamorphic Suite. Geol. Soc. Am. Spec. Pap. 2004, 377, 47–70. [Google Scholar] [CrossRef]
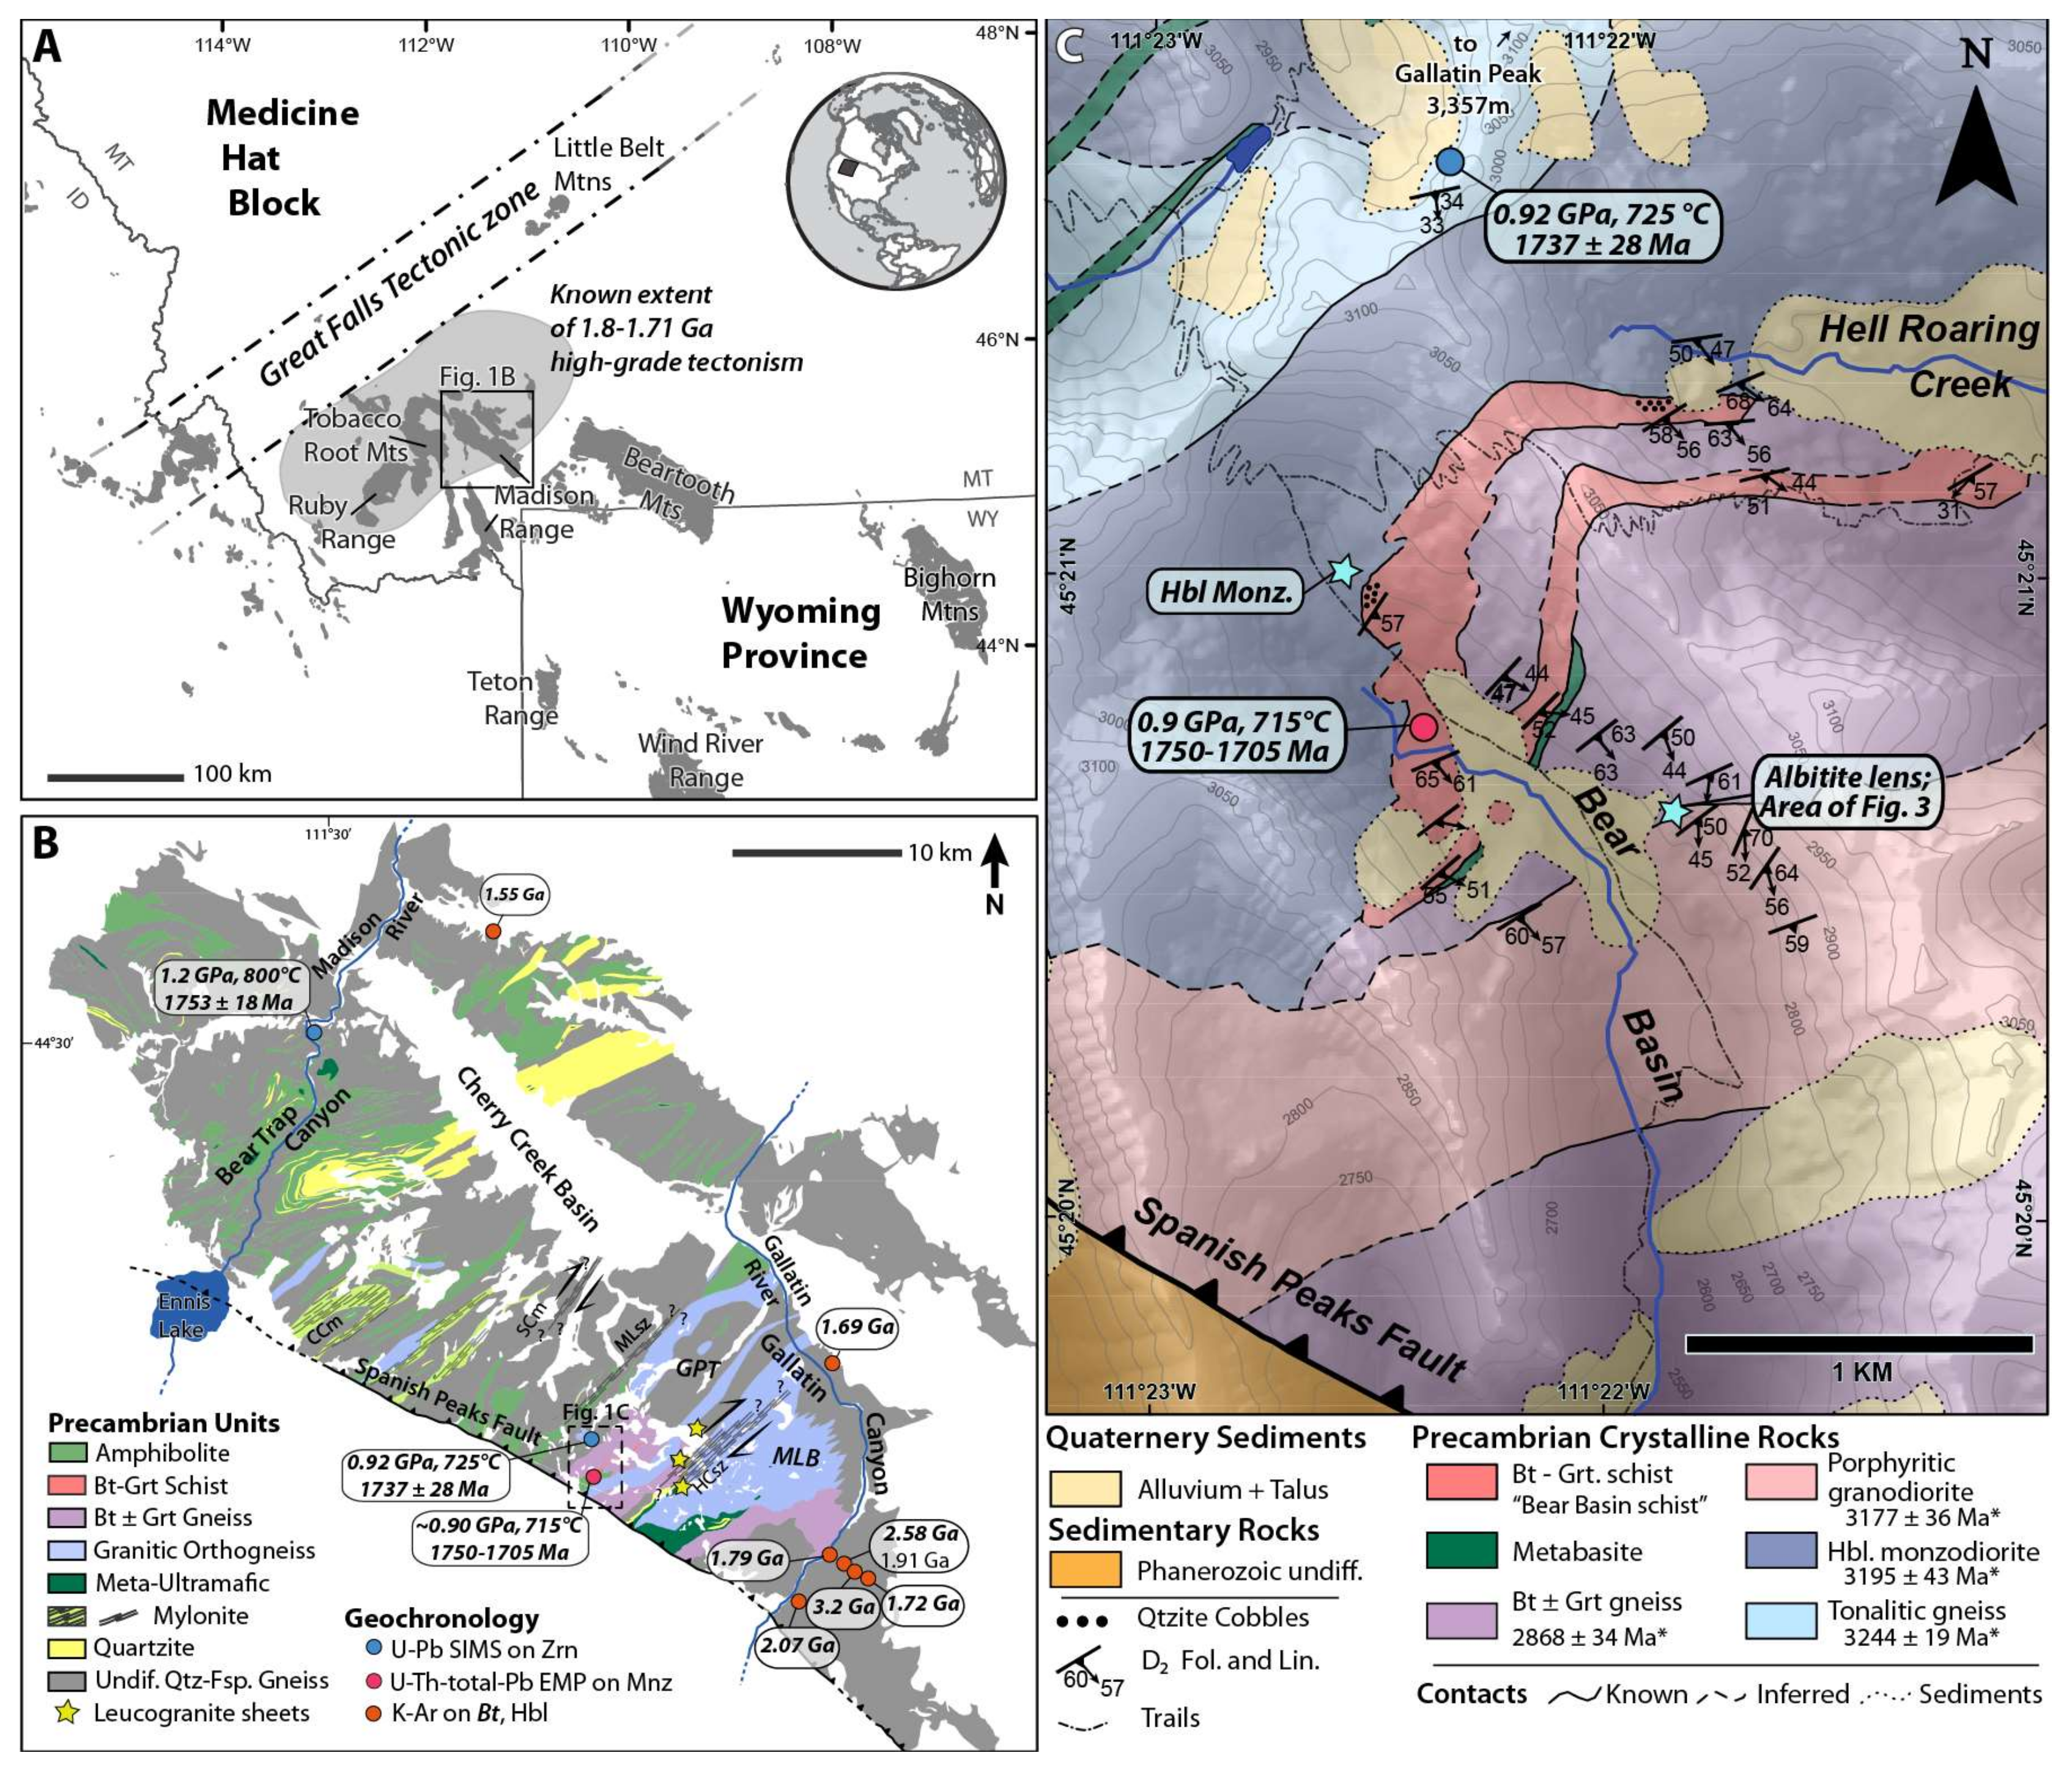
Figure 1. (A) Simplified regional geologic map of the northwestern margin of the Wyoming Province, the Great Falls Tectonic zone, and the Medicine Hat Block. Grey shapes are Precambrian-cored basement uplifts; (B) Simplified geologic map of the Precambrian-aged rocks in the Northern Madison Range (location inset from (A)). U-Pb geochronologic data from [20] and [36], K-Ar data from [30,31]. CCm—Crooked Creek mylonite, SCm—Spanish Creek mylonite, HCsz—Hellroaring Creek shear zone, MLsz—Mirror Lake shear zone, GPT—Gallatin Peak Terrane, MLB—Moon Lake Block; (C) Bedrock geologic map of the Bear Basin region within the Northern Madison Range (location inset from (B)). Red and blue circles show metamorphic pressure–temperature (P-T)-t conditions from [20]. Big Sky-related deformation (D2 surfaces and lineations) from [20]. Colored stars show locations for samples investigated here, including Hbl monzodiorite and a sequence of samples within and surround the albitite lens spatially detailed further in Figure 3.
Minerals 08 00187 g001
Figure 2. Field photographs of key field relationships and textures: (A) Contact between albitite and porphyroclastic granodiorite with black arrows indicating contact location; (B) Close up of the contact between the albitite and granodiorite at location indicated in part (A); (C) Field photograph of general albitite appearance showing trace of S2 defined by orthoamphibole and biotite; (D) Orthoamphibole garbenschiefer texture within albitite; (E) Leucogranite sheets within the Bt ± Grt gneiss. Contacts are concordant with S2.
Minerals 08 00187 g002
Figure 3. Simplified geologic map and schematic diagram of samples collected across the albitite lens and within the surrounding Bt ± Grt gneiss and porphyroclastic granodiorite. Inset shows geometry of albitite lens, nearby D2 structural orientations, and location of schematic transect. In the schematic diagram, bold labels indicate samples investigated for accessory mineral (zircon ± monazite) morphology. * indicates sample for which we collected monazite and zircon geochronology and trace element data.
Minerals 08 00187 g003
Figure 4. (A) Cross polarized (XPL) photomicrograph of porphyroclastic granodiorite igneous texture; (B) XPL photomicrograph of albitic plagioclase, biotite, and accessory minerals with albitite lens; (C) XPL photomicrograph of typical albitite texture and mineralogy, including orthoamphibole, biotite, plagioclase, and apatite grains; (D) Plane polarized (PPL) photomicrograph of typical accessory mineral phase cluster including rutile, apatite, monazite and zircon bounded by biotite along two sides; (E) PPL photomicrograph and Ca Kα WDS map of the same area showing flat zoning in Ca within albite.
Minerals 08 00187 g004
Figure 5. Rare earth element (REE) spectra for albitite, Bear Basin schist, Bt ± Grt gneiss, leucogranite sheets, and granodiorite bulk rock trace element data. Chondrite normalization uses the CI chondrite from McDonough and Sun, 1995 [39].
Minerals 08 00187 g005
Figure 6. Monazite morphology, textural context, and compositional zoning shown in WDS maps, plane polarized light (PPL), and BSE imagery from albitite sample 13c-10a. Calculated EMP U-Th-total Pb dates (Ma) are based on the locations of each individual EMP analyses, which are shown as circles on each dated monazite domain. Sketches of domain identifications placed where applicable. C annotates monazite core domains, R annotates monazite rim or whole domains. (A) Th Mα WDS map and PPL photomicrograph of monazite grain m3; (B) Th Mα and Y Lα WDS maps and BSE textural image of monazite grain m124; (C) Th Mα, Y Lα WDS map of m33; (D) Th Mα WDS map of m113; (E) Th Mα WDS map of m93a; (F) Y Lα WDS map and BSE images of m116.
Minerals 08 00187 g006
Figure 7. Gaussian normalized histograms of Monazite EMP U-Th-total Pb data and timing of zircon geochronology. (A) Monazite results for this study. Each histogram curve is the calculated weighted date for a single domain composed of multiple individual EMP data acquisition points (see Table 2). Zircon rims 207Pb/206Pb weighted mean age also shown; (B) Monazite and zircon geochronologic data from the Bear Basin schist and a deformed mafic dike from the Gallatin Peak terrane [20].
Minerals 08 00187 g007
Figure 8. REE spectra for (A) monazite separated by domains normalized to chondrite (squares) on the left axis and to the mean of monazite rims on the right (diamonds); REE spectra for (B) zircon separated by domain and secondarily by discordance. Chondrite normalizations use the CI chondrite from [39]; (C) Zircon Th/U vs 207Pb-206Pb date color coded by domain; (D) Zircon Th content in ppm vs 207Pb-206Pb date color coded by domain; (E) Zircon U content in ppm vs 207Pb-206Pb date color coded by domain.
Minerals 08 00187 g008
Figure 9. Zircon morphology and compositional zoning shown in CL, BSE, secondary electron (SE) and plane polarized light (PPL) photomicrographs for albitite samples 13c–10a (AF) and 13c-10f (G). LA-ICP-MS analysis pits numbered where applicable. Sketches of rim and core domains shown when needed. (A) CL and BSE image of zircon grain z11 showing clear rim and core structure; (B) CL and BSE images of z3 which contains truncation of the core by bright CL rim; (C) CL, BSE, EBSD misorientation map, and PPL images of zircon glomerocryst z85; (D) CL and BSE images of zircon glomerocryst z31; (E) CL and BSE images of z34 showing clear oscillatory zoning within the core zone surrounded by thin bright CL rims; (F) BSE and PPL images of z66, a grain completely composed of bright CL material; (G) CL image of z1 from sample 13C-10f, a partial glomerocryst contained completely in plagioclase.
Minerals 08 00187 g009
Figure 10. CL images of zircon from major units in the Bear Basin region. (A) Hornblende monzodiorite; (B) and (C) Bt ± Grt gneiss; (D) Porphyroclastic granodiorite.
Minerals 08 00187 g010
Figure 11. Concordia diagram showing U-Pb data from zircon from albitite sample 13c-10a. Ellipses are separated by domain designation of the analysis. Weighted mean 207Pb/206Pb dates based on concordant analyses from each domain are labeled in the top left corner.
Minerals 08 00187 g011
Figure 12. (A) Isocon diagram showing relative loss and gain of chemical constituents between the protolith granodiorite (sample 13c-10c) and the albitite (sample 13c-10f) assuming no volume change. Elements gained during metasomatism generally plot above the 1:1 dashed line (a = 1), and elements lost during metasomatism generally plot below this line. Scaling factors have been added to some elements; (B) Calculated percent change for elements between the protolith and metasomatized product assuming no volume change.
Minerals 08 00187 g012
Figure 13. Schematic time-process diagram of the evolution of the Bear Basin region, the albitite, and the porphyroclastic granodiorite from Mesoarchean crystallization of major orthogneiss units to the end of the Late Paleoproterozoic Big Sky Orogeny. See text for discussion. Granodiorite U-Pb zircon data from [34]. Timing of processes from the Big Sky orogeny from [20].
Minerals 08 00187 g013
Table 1. Feldspar and orthoamphibole mineral compositions.
FeldsparOrthoamphibole
Point1231 of 72 of 73 of 74 of 75 of 76 of 77 of 71-Ath2-Ath4-Ath
SiO264.7566.2766.3465.9866.2565.8866.5066.5666.5266.5956.5156.0455.43
TiO2n.m. n.m.n.m.n.m.n.m.n.m.n.m.n.m.n.m.n.m.0.000.000.05
Al2O320.6720.6820.6119.6419.8319.4620.0520.3220.4720.021.091.331.61
FeO0.030.020.010.060.030.000.030.030.010.0414.3514.3414.24
MgO0.000.000.000.000.000.000.000.000.000.0023.9824.0523.89
MnO0.000.000.000.010.000.000.010.010.000.000.580.600.67
CaO1.131.201.171.141.141.131.211.311.240.640.140.130.12
Na2O10.7610.8911.0010.9410.9010.7710.7110.7910.7711.120.070.120.17
K2O0.100.040.040.040.040.040.030.050.030.010.000.000.00
H2O----------2.132.132.11
Total97.4599.0999.1797.8198.1897.2998.5599.0799.0598.4398.8698.7498.30
An0.050.060.060.060.060.050.060.060.060.06
Ab0.940.940.940.940.940.940.940.930.940.94
Or0.010.000.000.000.000.010.000.010.000.00
Si p.f.u.* 7.957.907.86
Mg# 0.750.750.75
n.m. = not measured; p.f.u.* = Per formula unit; Mg# = (Fe + Mg)/Mg.
Table 2. Major and trace element bulk rock data.
AlbititesPorph.Bt ± GrtBear BasinLeucogranites
Grano.GneissSchist
Major Elements (wt %)
Sample13c-10a13c-10d13c-10e13c-10f13c-10c15c-21a8KRB-7c11C-06aKM13-27
SiO263.263.0966.8063.6565.4557.6273.6971.8177.07
TiO20.540.480.510.520.550.260.310.1bdl
Al2O319.2918.9118.6619.3616.6612.0813.4116.6313.69
Fe2O31.381.610.691.303.7023.503.91.321.15
MgO2.333.311.242.221.473.982.620.550.07
MnO0.020.020.000.020.030.180.070.020.06
CaO1.391.051.161.243.570.370.541.451.06
Na2O9.239.249.379.565.611.193.114.026
K2O0.570.790.420.441.140.691.492.650.71
LOI1.51.10.71.21.2-0.10.51.20.1
Total99.8199.8699.8999.8499.7299.8699.7999.8299.94
Trace elements (ppm)
Ba10910677727323418708397
Be3bdl32bdl31bdl2
Co3.84.81.43.26.614.912.620.5
Cs11.50.50.70.50.80.70.80.3
Ga16.817.314.816.417.613.815.718.720.7
Hf5.25.25.96.05.02.03.81.41.1
Nb10.37.79.49.79.16.36.12.45.1
Rb1117.87.38.223.119.140.557.521.6
Sn22122bdl1bdlbdl
Sr254.5181.4222.3212.3726.233.3118.4230.916
Ta0.90.70.91.00.60.60.5bdl0.3
Th18.111.214.817.017.29.516.41.27.3
U2.81.32.03.12.45.74.50.52.7
V535622385071421611
W8.44.61.57.1bdlbdlbdlbdlbdl
Zr209202.6238.5237.8214.077.5125.445.418.5
Y31.616.918.119.714.716.513.25.119.6
La124.559.758.4119.2114.221.135.88.65
Ce243.2109.7114.8230.1221.333.563.515.19.4
Pr26.6812.8213.5028.0825.933.876.351.621.03
Nd91.846.648.5103.695.813.620.963.2
Sm14.377.217.1715.4912.342.413.260.891.14
Eu2.781.641.442.692.240.620.650.270.04
Gd9.315.125.049.567.612.542.750.861.45
Tb1.120.600.650.950.780.460.400.140.36
Dy5.683.153.424.283.512.672.230.862.62
Ho0.960.580.620.640.490.500.450.160.57
Er2.891.891.671.621.341.381.370.492.08
Tm0.410.270.230.260.190.220.210.080.39
Yb2.641.911.531.561.181.311.430.473.02
Lu0.370.270.210.210.140.210.230.070.45
Table 3. Monazite EMP U-Th total-Pb data.
GrainDateText. SettingDomainTrace Element Concentrations (ppm)N(n)†Date
Analyzed * YUThPb (Ma)(Ma)
Cores
m312/22/14g.b. Bt/PlCore12612134419304025472717792508616065(5)177358
m1212/22/13g.b. Pl/Zrn/RtCore117331898209413417645338020371745(5)1735106
m93a12/22/14ApCore1016313982000492286212508222205(5)174331
m11312/22/14PlCore858510041397736411338227194825(5)168590
m12412/22/14OamCore126426881513142899799012101485(5)179266
Wt. Mean:175023
MSWD:1.15
Rims/Whole
m312/22/14g.b. Bt/PlRim7921890266018225424169428581385(5)175436
m712/26/14BtWhole8404590313447419846120625531386(6)175824
m3312/26/14PlRim6788658259919018976154422801465(5)172944
m93a12/22/14ApRim7430718255063015963168220412325(5)174156
m9612/26/14g.b. Rt/PlWhole8571266280114018192114222731006(6)172720
m11312/22/14PlRim6301842250564818859360822424203(5)172818
m11612/23/14g.b. Ap/PlWhole76791124282059020858171224862306(6)172326
m12412/22/14OamRim73631264277024219977153824052046(6)172538
Wt. Mean:173410
MSWD:1.03
Consistency Standard
12/22/14 1109014293358608312221455564(4)50719
12/22/14 110301061189144611574601482646(6)50722
12/23/14 1134317496780609352161443366(6)50112
12/23/14 1141217693294609122361449326(6)50416
12/26/14 11336236993100610502761456186(6)5046
12/26/14 11176144932122607943761434326(6)50010
Wt. Mean:5034
MSWD:0.18
* Dates are month/day/year; †N is number of points used for domain date, n is total number acquired; g.b., Grain Boundary. Wt. mean, weighted mean.
Table 4. Monazite REE data.
Element (ppm)Monazite Cores
m3 corem93a corem113 corem124 core
La119,068141,130149,867113,933
Ce238,550275,997280,911254,699
Pr25,83228,66227,91531,054
Nd96,513105,26298,427130,413
Sm79047036509510,652
Eu1656155915081323
Gd88528129673710,762
Tb468436--
Dy3146238120263231
Y12,68410,150857312,656
Ho----
Er777759710948
Tm834904576895
Yb----
Element (ppm)Monazite Rims
m3 rimm93a rimm113 rimm124 rimm12m116m7m96m33
La136,363144,043143,050139,348138,438139,458136,420136,288140,532
Ce263,718274,811272,628269,086266,595270,552266,161269,439272,556
Pr27,41427,18727,41527,28627,14927,49927,67427,73727,580
Nd97,69496,18897,10298,83199,080100,171101,508102,750100,543
Sm561551544346510368985282602659665402
Eu9331408111799916991066112014181094
Gd665059435206553072366098672469706208
Tb----332--247311
Dy179916021098150427051786187517361590
Y794374446315738011,6597697842385896803
Ho---------
Er498432656389919593549602548
Tm941853429464768738767704874
Yb----408----
“-” indicates value below detection limit of EMP or LA-ICP-MS; n/a indicates element not measured.
Table 5. Zircon U-Pb LA-ICP-MS data.
Long AxisSidhort Axis Dates (Ma)%
Grain(μm)(μm)SpotDomain207Pb/235U206Pb/238 U207Pb/206PbTh (ppm)U (ppm)Th/U206Pb/238U207Pb/235U207Pb/206Pbdisco.
z17110701Core22.51.40.6450.0570.2540.015571940.293210230321260318190-2.6
z840302Core21.82.30.6420.0840.2490.021671960.34312032031201103140130-2
z2160453Core20.82.20.630.0680.2350.0121823230.563120270312296308883-1.6
s* z1740251Core22.91.50.6560.0470.250.0111322960.453240180321362319172-1.5
z840301Core20.82.20.6270.0840.2460.02661610.41308033030901103120120-1
z17110704Core22.41.50.6390.0560.2550.013622090.303180220319171319278-0.9
s z21100551Core20.520.550.620.020.2390.0055972230.43310878311526311137-0.2
z8860501Core22.71.30.6420.0390.25150.0087842710.313180150320454318654-0.1
s z261201001Core22.71.10.6410.0310.25240.00421103400.3231801303206523198260.3
z2160452Core221.20.6250.0380.2480.0112294500.5131101503170533171640.9
s z16100501Core22.21.50.6280.0510.2570.0141472810.5231302003184643215852
z2070453Core21.720.6220.0490.25250.0056651310.5031102003188793199372.3
s z18100601Core20.170.750.5840.0240.24920.00711112830.392958993093353172455.7
z945402Core19.41.80.5820.0680.2520.0162364380.54290028030529631801007
z5345452Core20.21.50.5820.0580.2580.0151383240.4329102303076713220947.5
s z1740252Core20.010.540.5640.0170.25290.00562253770.6028807130902632003510
z17110702Core151.70.4930.0480.2180.015883240.2725502102820110297013010.7
z1640302Core18.21.40.5330.0510.2460.0133475070.68273021030077331438210.8
z2160451Core16.310.510.0450.230.0122805130.55263019029016230428511.1
z5480702Core18.610.5420.0350.24820.0091882860.31278015030294931625813
s z1100501bCore18.730.940.5280.0220.25430.00652333640.6427289130215032084115.4
z5940304Core17.51.10.5110.0390.2490.0132704760.57264017029476131577716
z34200805Core18.720.880.5250.0260.25770.0049202540.08272011030244432313016.1
z5480701Core13.830.910.4690.0340.22030.0077943100.30246015027296229725616.2
z5480703Core16.81.40.4950.050.2460.014913670.25256021028968831478916.5
z89L50301Core16.350.790.4780.020.24640.00517508900.8425148929044831583319.6
z270604Core11.690.670.4180.0210.20140.0046823860.2122469425665528333720.7
z85150506Core14.10.870.4320.0230.2250.00641474010.37231011027665130144520.9
z945401Core151.90.4380.0540.2420.0171773650.4823502502790120311011023.3
z85150502Core13.940.540.4240.0230.24230.0077541660.32228010027524131315026.7
z5940303Core14.41.40.4260.0460.240.0112895300.55230021027618731207427.1
z2070451Core13.51.90.4060.0420.22090.008232310860.302190190269013029836027.3
s z2460601Core13.41.70.4010.0450.2350.012324160.082200220270012030887427.7
z85150505Core11.91.90.3890.0520.2140.01823930.212070240252017029297830
z5940301Core13.21.40.3850.0450.2370.0132806240.452160230266010031149530.9
z85150504Core10.81.30.360.0350.20690.0069923850.241990170247011029035633.4
z3160603Core10.010.830.3430.0270.2110.0111834290.43189013024197629058134.1
s z1100502Rim12.180.720.3710.0210.23560.00492255170.4420259926025530863334.6
z1970451Core12.180.680.3690.020.23640.0073793240.2420399226195031074834.6
z1640301Core14.31.60.380.0430.2560.0145355690.942050200272011032438535.8
z5345451Core10.960.880.3490.0340.2360.0142574940.52191016024917630589736.1
s z1100503Core12.520.460.3670.0160.2510.00582103790.5520127726463731873737.4
z1970452Core12.11.20.3540.0290.23520.00574616100.76194014025749030833937.5
z34200802Core9.390.460.3240.0240.21540.00571247700.16180012023834829434238.6
z270601Core8.280.630.2970.0190.20290.00451498840.1717069922627328453740
s z261201002Core9.120.950.2890.0220.22130.00721365430.25163011023489229805942.8
z34200804Core10.31.80.3110.0490.23330.00611918200.231700230233016030684245.3
z34200803Core9.71.90.3040.0570.21340.009924213000.191650280217023029117746.8
z2070452Core70.360.2510.00860.1950.01145825800.18144345210747280010047.1
z270603Core4.310.170.2050.0130.15460.00621638800.1911976916903223836850.6
z34200801Core5.61.30.190.0360.19570.009360019800.301130190176018027707760.5
z270602Core3.040.280.1380.0110.15910.004214414050.108296014017424384565.8
z85150503Rim4.920.280.3290.020.10640.004131530.02182798181249173568-6.9
z3160604Rim4.620.560.3170.0490.1110.012820.03175024017501101770160-5
z6630201Whole4.320.370.2950.0310.10970.007201250.00165015016756817701200
z7660201Rim4.420.190.2990.010.10590.003921190.021683501712361722692.8
z3160601Rim4.870.420.3090.0290.11190.00671360.0517301401781741813954
s z1100501aRim4.170.220.280.0190.1070.006111610.01158796166444174010010
z3160605Rim4.910.440.2950.0290.12220.0071251440.18165014017907719589916.1
z5940302Mix12.42.10.4150.0560.20.019542720.2022002502510180281016020.1
z3160602Mix8.71.30.3470.0330.1750.015722480.2919001602230140255016022.6
z85150507Mix6.010.650.2870.0230.1490.011212700.0816201101980100236014028.8
z85150501Mix5.180.480.2650.020.13630.0066242430.10151010018798021938130.5
z740301Mix9.72.30.320.0740.2120.0291796590.2717503502290240285020038
z85150508Mix8.31.30.290.0320.1950.014461930.2416501702160150276012040.2
z17110703Mix8.580.90.290.0290.2120.0152596300.411620140227490290012042.3
z7340251Mix8.330.750.2810.0350.2190.0125804051.43159017022528529598946.9
z89U50401Mix5.630.260.21420.00860.19080.00551625670.2912504519133927414753.8
s z261201003Mix4.290.770.1530.0230.20340.00634249100.47900130165015028555269
* s before grain indicates zircon separate analyses; g.b. grain boundary; Bold 207Pb/206Pb dates used for core domain weighted mean age of 3175 ± 23 (2σ, MSWD = 2.0); Bold Italic 207Pb/206Pb dates used for rim domain weight mean age of 1750 ± 39 (2σ, MSWD = 0.70).
Table 6. Zircon REE data.
ElementRim ZirconCore Concordant Zircon
(ppm)z85 3z31 4z66 1z76 1z31 1s z1 1az17 1z8 2z21 3s z17 4z8 1z17 4s z21 1z88 1s z26 1z 21 2s z16 1z20 3s z18 1z9 2z53 2s z17 2
La--------634------4----
Ce223153202610957522234242651404739634057
Pr1010210319121401001192115
Nd10201114261615121232114327
Sm421126410174025439173717153022181624
Eu64759681943273181271017126618211526
Gd13111311131124316363472424223247316247554561
Tbn/an/an/an/an/an/an/an/an/an/an/an/an/an/an/an/an/an/an/an/an/an/a
Dy61676083816669781351301066983579311181126111127109135
Y154169130212181169130145241252173141171117199201152248211231210252
Hon/an/an/an/an/an/an/an/an/an/an/an/an/an/an/an/an/an/an/an/an/an/a
Er292306248384309299191209304373223221245173294274204331296323295318
Tmn/an/an/an/an/an/an/an/an/an/an/an/an/an/an/an/an/an/an/an/an/an/a
Yb13791354116118261491138568374588810505847457266099508765638949101012901852
Table 7. Ti-in zircon thermometry.
GrainLong AxisShort AxisTexturalSpotDomainTi (ppm)Ti-in-Zrn Thermometry
(μm)(μm)SettingT (C°)
z1711070Pl/Bt g.b1Core4.81.3680
z84030Pl g.b2Core5.51.6691
z216045Pl3Core13.23.8766
s* z174025n/a1Core8.92.6731
z84030Pl1Core8.82.5730
z1711070Pl/Bt g.b4Core4.31.1672
s z2110055n/a1Core7.31.4714
z886050Pl1Core4.31.3672
s z26120100n/a1Core4.61.3677
z216045Pl g.b2Core7.41.3715
s z1610050n/a1Core6.22.2701
z207045Pl3Core8.12.5723
s z1810060n/a1Core6.91.2709
z94540Pl2Core7.71.8719
z534545Pl2Core7.11.6712
s z174025n/a2Core8.32.6725
z1711070Pl/Bt g.b2Core153.8778
z164030Pl/Mnz/Rt g.b.2Core16001300n/a
z216045Pl g.b1Core172.2790
z548070Pl g.b2Core28.33.1841
s z110050n/a1bCore82.5722
z594030Bt w/Mnz4Core18.22796
z3420080Pl/Bt g.b5Core1840490n/a
z548070Pl g.b1Core14.11.9772
z548070Pl g.b3Core18.12.4796
z89L5030Pl1Core347.7861
z27060Pl/Bt g.b4Core24.65.6827
z8515050Pl6Core19.34.4802
z94540Pl1Core10.42.3744
z8515050Pl2Core8.31.7725
z594030Bt w/Mnz3Core7435954
z207045Pl1Core31.35.6852
s z246060n/a1Core7.82.3720
z8515050Pl5Core17.23.7791
z594030Bt w/Mnz1Core20.42.9808
z8515050Pl4Core19.13801
z316060Pl g.b3Core192.3801
s z110050n/a2Rim26.76835
z197045Pl1Core5.71.6694
z164030Pl/Mnz/Rt g.b.1Core6923945
z534545Pl1Core57.17.7921
s z110050n/a3Core3.31.4652
z197045Pl2Core15.92.9783
z3420080Pl/Bt g.b2Core17.22.6791
z27060Pl/Bt g.b1Core49.56.8904
s z26120100n/a2Core8.31.9725
z3420080Pl/Bt g.b4Core157791059
z3420080Pl/Bt g.b3Core6513937
z207045Pl2Core9512987
z27060Pl/Bt g.b3Core8725975
z3420080Pl/Bt g.b1Core8315969
z27060Pl/Bt g.b2Core62.34.1932
z8515050Pl3Rim3.81.6663
z316060Pl g.b4Rim6.22.7701
z663020Pl/Rt g.b1Rim/whole3.51.5656
z766020Bt1Rim2.51.5632
z316060Pl g.b1Rim5.91.3697
s z110050n/a1aRim3.71.4661
z316060Pl g.b5Rim13.71.9769
z594030Bt w/Mnz2Mix3501801193
z316060Pl g.b2Mix13.71.9769
z8515050Pl7Mix6112929
z8515050Pl1Mix6112929
z74030Pl1Mix6100036000n/a
z8515050Pl8Mix162481064
z1711070Pl/Bt g.b3Mix3902401213
z734025Pl/Bt g.b1Mix3703001203
z89U5040Pl/Bt g.b1Mix6123929
s z26120100n/a3Mix32.27.7855
* s before grain indicates zircon separate analyses; g.b. grain boundary.