Article

Washability and Distribution Behaviors of Trace Elements of a High-Sulfur Coal, SW Guizhou, China

1
College of Mining, Guizhou University, Guiyang 550025, China
2
National & Local Joint Laboratory of Engineering for Effective Utilization of Regional Mineral Resources from Karst Areas, Guiyang 550025, China
3
Guizhou Key Laboratory of Comprehensive Utilization of Non-metallic Mineral Resources, Guiyang 550025, China
4
College of Resources and Environmental Engineering, Guizhou University, Guiyang 550025, China
*
Authors to whom correspondence should be addressed.
Minerals 2018, 8(2), 59; https://doi.org/10.3390/min8020059
Submission received: 27 December 2017 / Revised: 2 February 2018 / Accepted: 5 February 2018 / Published: 11 February 2018
(This article belongs to the Special Issue Toxic Mineral Matter in Coal and Coal Combustion Products)

Abstract

:
The float-sink test is a commonly used technology for the study of coal washability, which determines optimal separation density for coal washing based on the desired sulfur and ash yield of the cleaned coal. In this study, the float-sink test is adopted for a high-sulfur Late Permian coal from Hongfa coalmine (No.26), southwestern Guizhou, China, to investigate its washability, and to analyze the organic affinities and distribution behaviors of some toxic and valuable trace elements. Results show that the coal is difficult to separate in terms of desulfurization. A cleaned coal could theoretically be obtained with a yield of 75.50%, sulfur 2.50%, and ash yield 11.33% when the separation density is 1.57 g/cm3. Trace elements’ distribution behaviors during the gravity separation were evaluated by correlation analysis and calculation. It was found that Cs, Ga, Ta, Th, Rb, Sb, Nb, Hf, Ba, Pb, In, Cu, and Zr are of significant inorganic affinity; while Sn, Co, Re, U, Mo, V, Cr, Ni, and Be are of relatively strong organic affinity. LREE (Light rare earth elements), however, seem to have weaker organic affinity than HREE (Heavy rare earth elements), which can probably be attributed to lanthanide contraction. When the separation density is 1.60 g/cm3, a large proportion of Sn, Be, Cr, U, V, Mo, Ni, Cd, Pb, and Cu migrate to the cleaned coal, but most of Mn, Sb and Th stay in the gangue. Coal preparation provides alternativity for either toxic elements removal or valuable elements preconcentration in addition to desulfurization and deashing. The enrichment of trace elements in the cleaned coal depends on the predetermined separation density which will influence the yields and ash yields of the cleaned coal.

1. Introduction

The coal washing operation is a process that depends on gravity and the difference in density between coal and its impurities, which is widely carried out as a primary coal preparation technology due to its versatility, relatively low cost, and environmental friendliness [1,2]. Generally, coal washing is conducted to remove minerals from the Run-of-Mine (ROM) coal, with the purpose of improving the coal quality and reducing the emissions of contaminants (such as SO2 and PM 2.5) from coal burning and conversion. Actually, recent research [3] shows that China’s SO2 emission in 2016 was 8.4 Mt, which was only 26% of that in 2005 (31.8 Mt). This might have benefited greatly from the enhancement of the country’s coal washing rate of ROM coal (from 32% in 2005 to 66% in 2015) [4,5]. However, severe environmental and health problems have been related to various toxic trace elements other than sulfur in coal during coal utilization [6,7]. For example, As, F, Hg, and Se in Chinese coal have drawn much attention in recent years as they have been considered as culprits in coal burning endemic diseases [8,9,10,11,12]. This puts forward new requirements for coal washing, specifically to remove hazardous trace elements from coal while reducing the sulfur contents and ash yields [13,14].
The effect of coal washing on trace elements removal can be effectively investigated by examining the elements’ variation in washed and untreated coal that is sampled directly from coal preparation plants [15,16]. These studies are imperfect as a coal washing plant may have a blended supply of ROM coals, and the processing technology may also vary for coal with distinct properties. Lab-scale float-sink tests and correlation analysis, by contrast, have been adopted by more studies and are considered to be effective in determining the affinity of elements for organic or mineral matter in coals [17,18,19]. However, most of the float-sink tests mentioned in such literature were conducted with ROM coal characterized by its uniform and fine size and a relatively small sample amount. With the perspective of coal preparation engineering, this research adopts a normative float-sink test for a Late Permian high-sulfur coal, aiming to investigate the distribution behaviors and cleaning potentials of toxic elements based on a washability study.

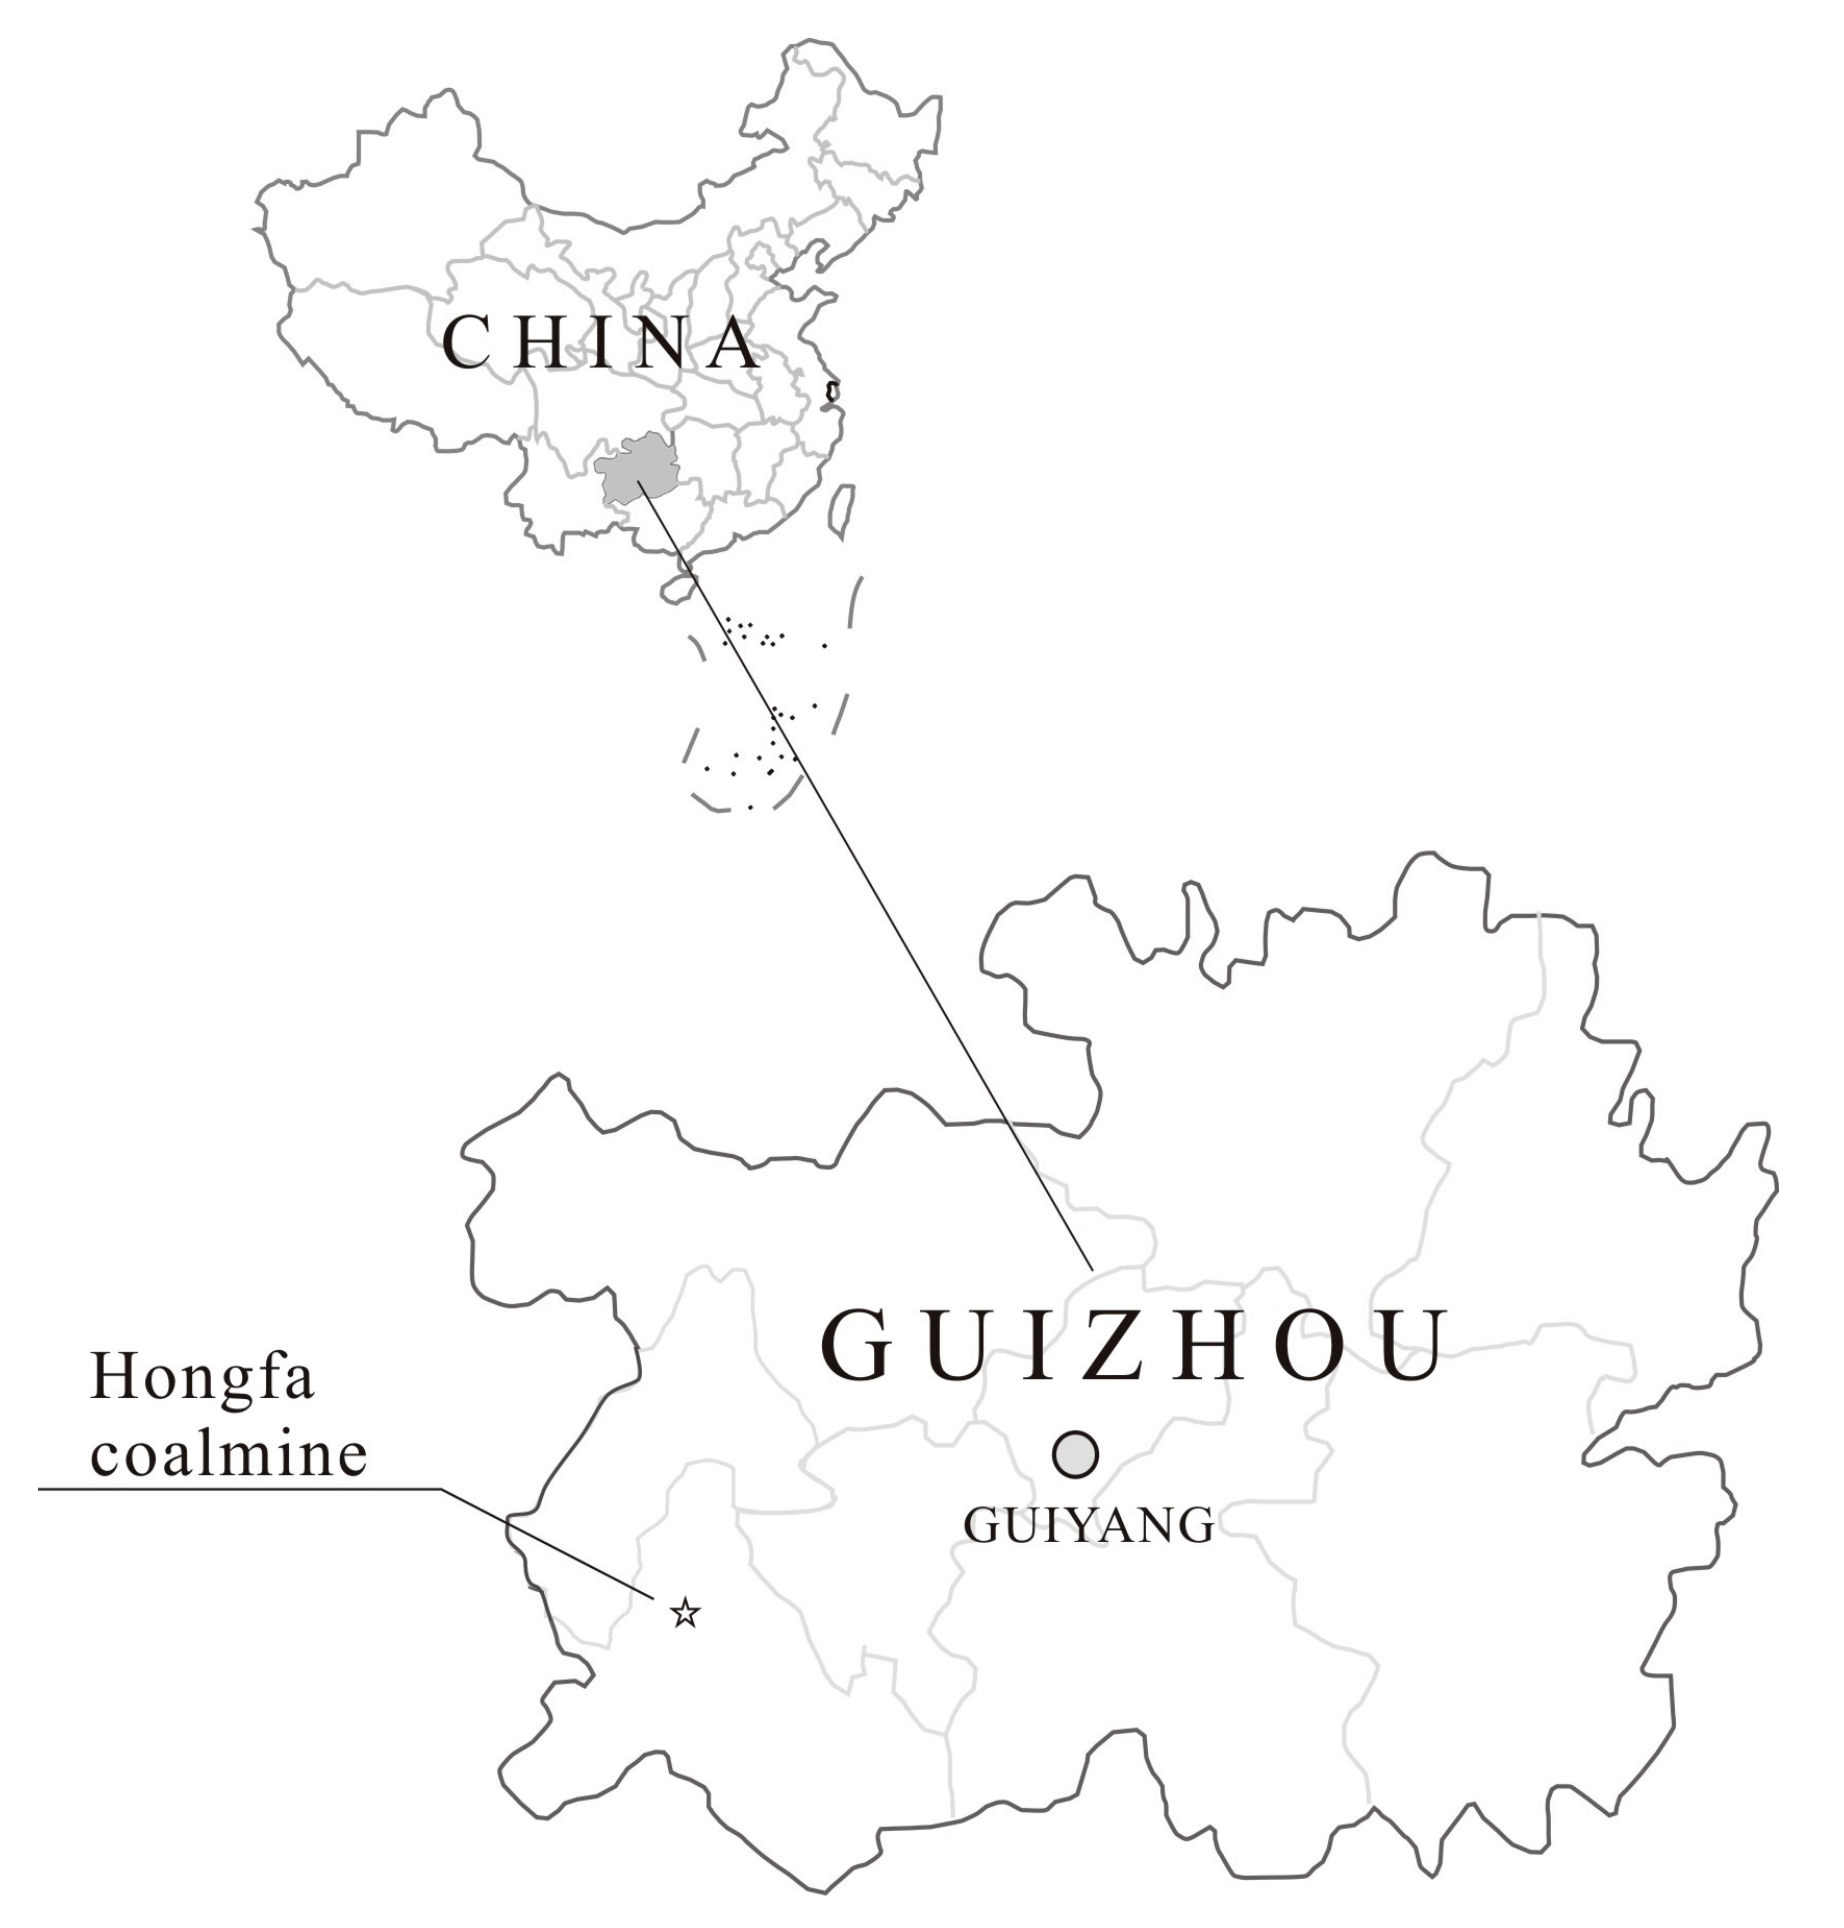
2. Geological Setting

The Hongfa coalmine is near the town of Digua in Pu’an County, southwestern Guizhou Province, China (Figure 1). The coal-bearing stratum in the mining area is the Upper Permian Longtan (the equivalent of Wuchiapingian) Formation, which is mainly composed of siltstone, argillaceous siltstone, mudstone, fine sandstone, clay, limestone, and coal seam. The coal seam in the Longtan Formation was interpreted to have been formed in a transitional zone, with the sedimentary environment varying between alluvial and fluvial plains, deltas and tidal flats, and carbonate platforms [20]. The No.26 coal seam occurs at the bottom of the Longtan Formation, with a thickness of 1.75–4.66 m (with an average of 3.55 m). The dip of the coal is 15°–29°. Both the roof and the floor are composed of siltstone and argillaceous siltstone.

3. Samples and Analytical Methods

About 200 kg of the No.26 coal (the ROM coal) was sampled from the underground workface of Hongfa coalmine. After blending and dividing, 119.66 kg of the coal was preliminarily crushed to an upper limit particle size of 50 mm and split into seven size fractions: <0.5 mm (primary coal sludge), 0.5~3 mm, 3~6 mm, 6~13 mm, 13~25 mm and 25~50 mm, which were all dried at 50 °C for 24 h and then cooled down to room temperature.
The float-sink test was carried out for each individual size fraction. ZnCl2 aqueous solution serves as the dense liquid, the density of which varies from 1.30 g/cm3 to 1.80 g/cm3 with a step size of 0.1 g/cm3. A certain amount of dense liquid was loaded individually in different barrels, which had a height of 500–600 mm and a volume of more than 50 L. A smaller barrel with a mesh bottom with apertures of 0.5 mm was used to separate the coal sludge and to transport the coal from one barrel to another. All the barrels were made of corrosion-resistant material. For each size fraction, the ROM coal was first put into the mesh-bottomed barrel, and washed with tap water before being put into the barrel containing dense liquid. The waste water was stored in a container and the settling was recovered as the coal sludge (the secondary coal sludge). Then, the mesh-bottomed barrel with washed ROM coal was put into the barrel with dense liquid of 1.3 g/cm3. After slight stirring and resting for about 2 min (the time was extended to 5 min for size fraction 0.5–1.0 mm), the float coal was collected and the mesh-bottomed barrel was taken out and put into the barrel with dense liquid of 1.4 g/cm3. The rest were done in the same manner. Thus, each size fraction of the ROM coal was furtherly separated into 7 fractions: <1.30 g/cm3, 1.30~1.40 g/cm3, 1.40~1.50 g/cm3, 1.50~1.60 g/cm3, 1.60~1.70 g/cm3, 1.70~1.80 g/cm3, >1.80 g/cm3 and a coal sludge product which is less than 0.5 mm. Finally, samples of the same density range from different size fractions were blended to make a single density fraction, thus 7 density fraction samples were obtained.
Proximate analysis and sulfur content determination were conducted by using an air oven, a muffle furnace and a Coulomb sulfur meter (CLS-5), respectively, in the National & Local Joint Laboratory of Engineering for Effective Utilization of Regional Mineral Resources from Karst Areas, Guiyang, China. Proximate analysis (moisture, ash yield, and volatile) was conducted according to Chinese National Standard GB/T 212-2008 [21] (based on international standard ISO 11722:1999). Specifically, the moisture content analysis procedure is as follows: 1.0 ± 0.1 g coal sample was put into a capsule (25 mm in height, 40 mm in diameter) with a grinding cover; after removing the cover the capsule was quickly placed in a preheated air oven at 105–110 °C for 1.5 h; the capsule was then taken out and closed with the cover, cooled in a desiccator, and weighed as soon as the capsule reached room temperature. The percentage loss of weight is the moisture content. The ash yield analysis procedure is as follows: 1.0 ± 0.1 g moisture-free coal sample was put into a capsule (45 mm in length, 25 mm in width, 14 mm in depth); the capsule was placed in a cold muffle furnace and heated gradually at such a rate that the temperature reached 500 ± 10 °C at the end of 0.5 h; it was heated at this temperature for 0.5 h; the temperature was then increased to 815 ± 10 °C and it was heated for 1 h. The percentage loss of weight is the ash yield. The volatile analysis procedure is as follows: 1.0 ± 0.1 g moisture free coal sample was put into a crucible (with a volume of 25 mL), closed with a cover; the capsule was put directly into a muffle furnace chamber which was maintained at 900 ± 10 °C; after heating for a total of exactly 7 min, the crucible was removed from the furnace, and weighed as soon as it was cold. The percentage loss of weight minus the percentage of ash equals the dry ash-free basis volatile. Total sulfur content analysis was conducted according to GB/T 214-2007 [22] (based on international standard ISO 334:1992, ISO 351:1996). The analysis procedure is as follows: 50 ± 5 mg coal sample and a certain amount of WO3 (catalyst) were placed in a boat shaped crucible, and put into a high-temperature tube furnace which was maintained at 1150 ± 10 °C; the sulfur fumes were then adsorbed by potassium iodide solution (the electrolyte) and formed iodine. The total sulfur in the coal is calculated by the amount of electricity consumed during electrolysis. The coal sample for the aforementioned proximate analysis and sulfur determination should have been pulverized to pass 180 μm before the test. Standard coal samples were used as reference material and the relative standard deviation for the analysis was less than 2%. The concentrations of 46 trace elements were determined by using an Inductively Coupled Plasma Mass Spectrometer (ICP-MS, ELAN DRC-e, Perkin Elmer, Waltham, MA, USA) in ALS Chemex Co Ltd (Guangzhou, China). Before analysis, 50 mg of the sample was calcined at 750 °C for 2 h and put into a polytetrafluoroethylene crucible, together with 1 mL HF and 1 mL HNO3; sealed in a steel bushing and kept in an oven at 190 °C for 36 h; then cooled and evaporated to dryness; 1 mL HNO3 was added and it was then dried again. After that, 500 ng Rh (interior label), 2 mL HNO3, and 3 mL deionized water was added into the crucible; placed into the steel bushing again; heated at 140 °C for 5 h; then cooled and diluted, ready for the test. The relative standard deviation was less than 10%.

4. Results and Discussion

4.1. Float-Sink Test

The proximate and sulfur content analysis shows that the ROM coal belongs to bituminite characterized by low volatiles (14.66%, dry ash-free basis), low moisture (4.41%, air dry basis), high-sulfur (4.52%, dry basis), and medium ash (22.65%, dry basis), which therefore has to be processed for desulfurization and deashing before being supplied to power stations.
Screen tests were conducted for the ROM coal which had been primarily crushed to a particle size of less than 50 mm. Moisture content, ash yield, and sulfur content of each size fraction were analyzed (Table 1). It can be found that smaller size fractions tend to have a lower sulfur content and ash yield than larger ones, and that a positive correlation exists between ash yield and sulfur content with the variation of particle sizes (Figure 2), indicating that a majority of the sulfur in the coal is of inorganic occurrence, rather than organic association.
As mentioned above, a series of blended density fractions were obtained based on a float-sink test conducted for each size fraction. As shown in Table 2, the weighted average ash yield of different density fractions is calculated as 22.33%, the absolute error of which is 0.32% when compared with the ROM coal (22.65%), which is less than the upper-bound error of 1.50% according to the Chinese National Standard GB/T478-2008 [23]. Besides, the total weight of the sample before and after the float-sink test was 119.66 kg and 117.57 kg, with a mass-loss ratio of 1.75%, less than the 2.00% that is required by GB/T478-2008 [23]. Therefore, the float-sink test is considered as valid.

4.2. Coal Washability

It was found that both density fractions of 1.30~1.40 and 1.40~1.50 g/cm3 occupy relatively larger proportions of the ROM coal, followed by the density fraction of >1.80 g/cm3 with a yield of 16.25%, whereas the yields of <1.30 g/cm3 and 1.70~1.80 g/cm3 are much lower. Besides, both sulfur content and ash yield rise steadily as the density increases from <1.30 g/cm3 to >1.80 g/cm3 (Figure 3), and the linear regression correlation coefficient between ash yield and sulfur content among different density fractions is 0.95 (Figure 4), indicating that sulfur largely occurred in the heavier proportions which contained more dense inorganic matter [24].
The H–R curve—which consist of a sulfur curve (λ), float curve (β), sink curve (θ), density curve (δ), and δ ± 0.1 curve (ε)—is commonly used to characterize the washability of a given coal. Notably, the high gradient of the δ ± 0.1 curve (γδ±0.1 = γδ+0.1 − γδ-0.1, where γ is the yield) means a great amount of proximal materials near the separation density, therefore indicating great separation difficulty of the coal [2]. As the dotted auxiliary lines shown in Figure 5, if the sulfur content of the cleaned coal is set as 2.50% (a), which is the current upper limit of sulfur in coal for local thermal power stations, the yield of the float and sink will be 75.50% (b) and 24.50% (e), respectively; the extremum sulfur for the cleaned coal is 4.75% (c); the sulfur content of the gangue is 10.51% (d); the theoretical separation density is 1.57 g/cm3 (f); and the corresponding δ ± 0.1 is above 20.10% (g), indicating a relatively bad washability of the coal. What’s worse, if the sulfur content of the cleaned coal is required to be 2.00% or less, satisfactory desulfurization through coal washing would scarcely be possible.

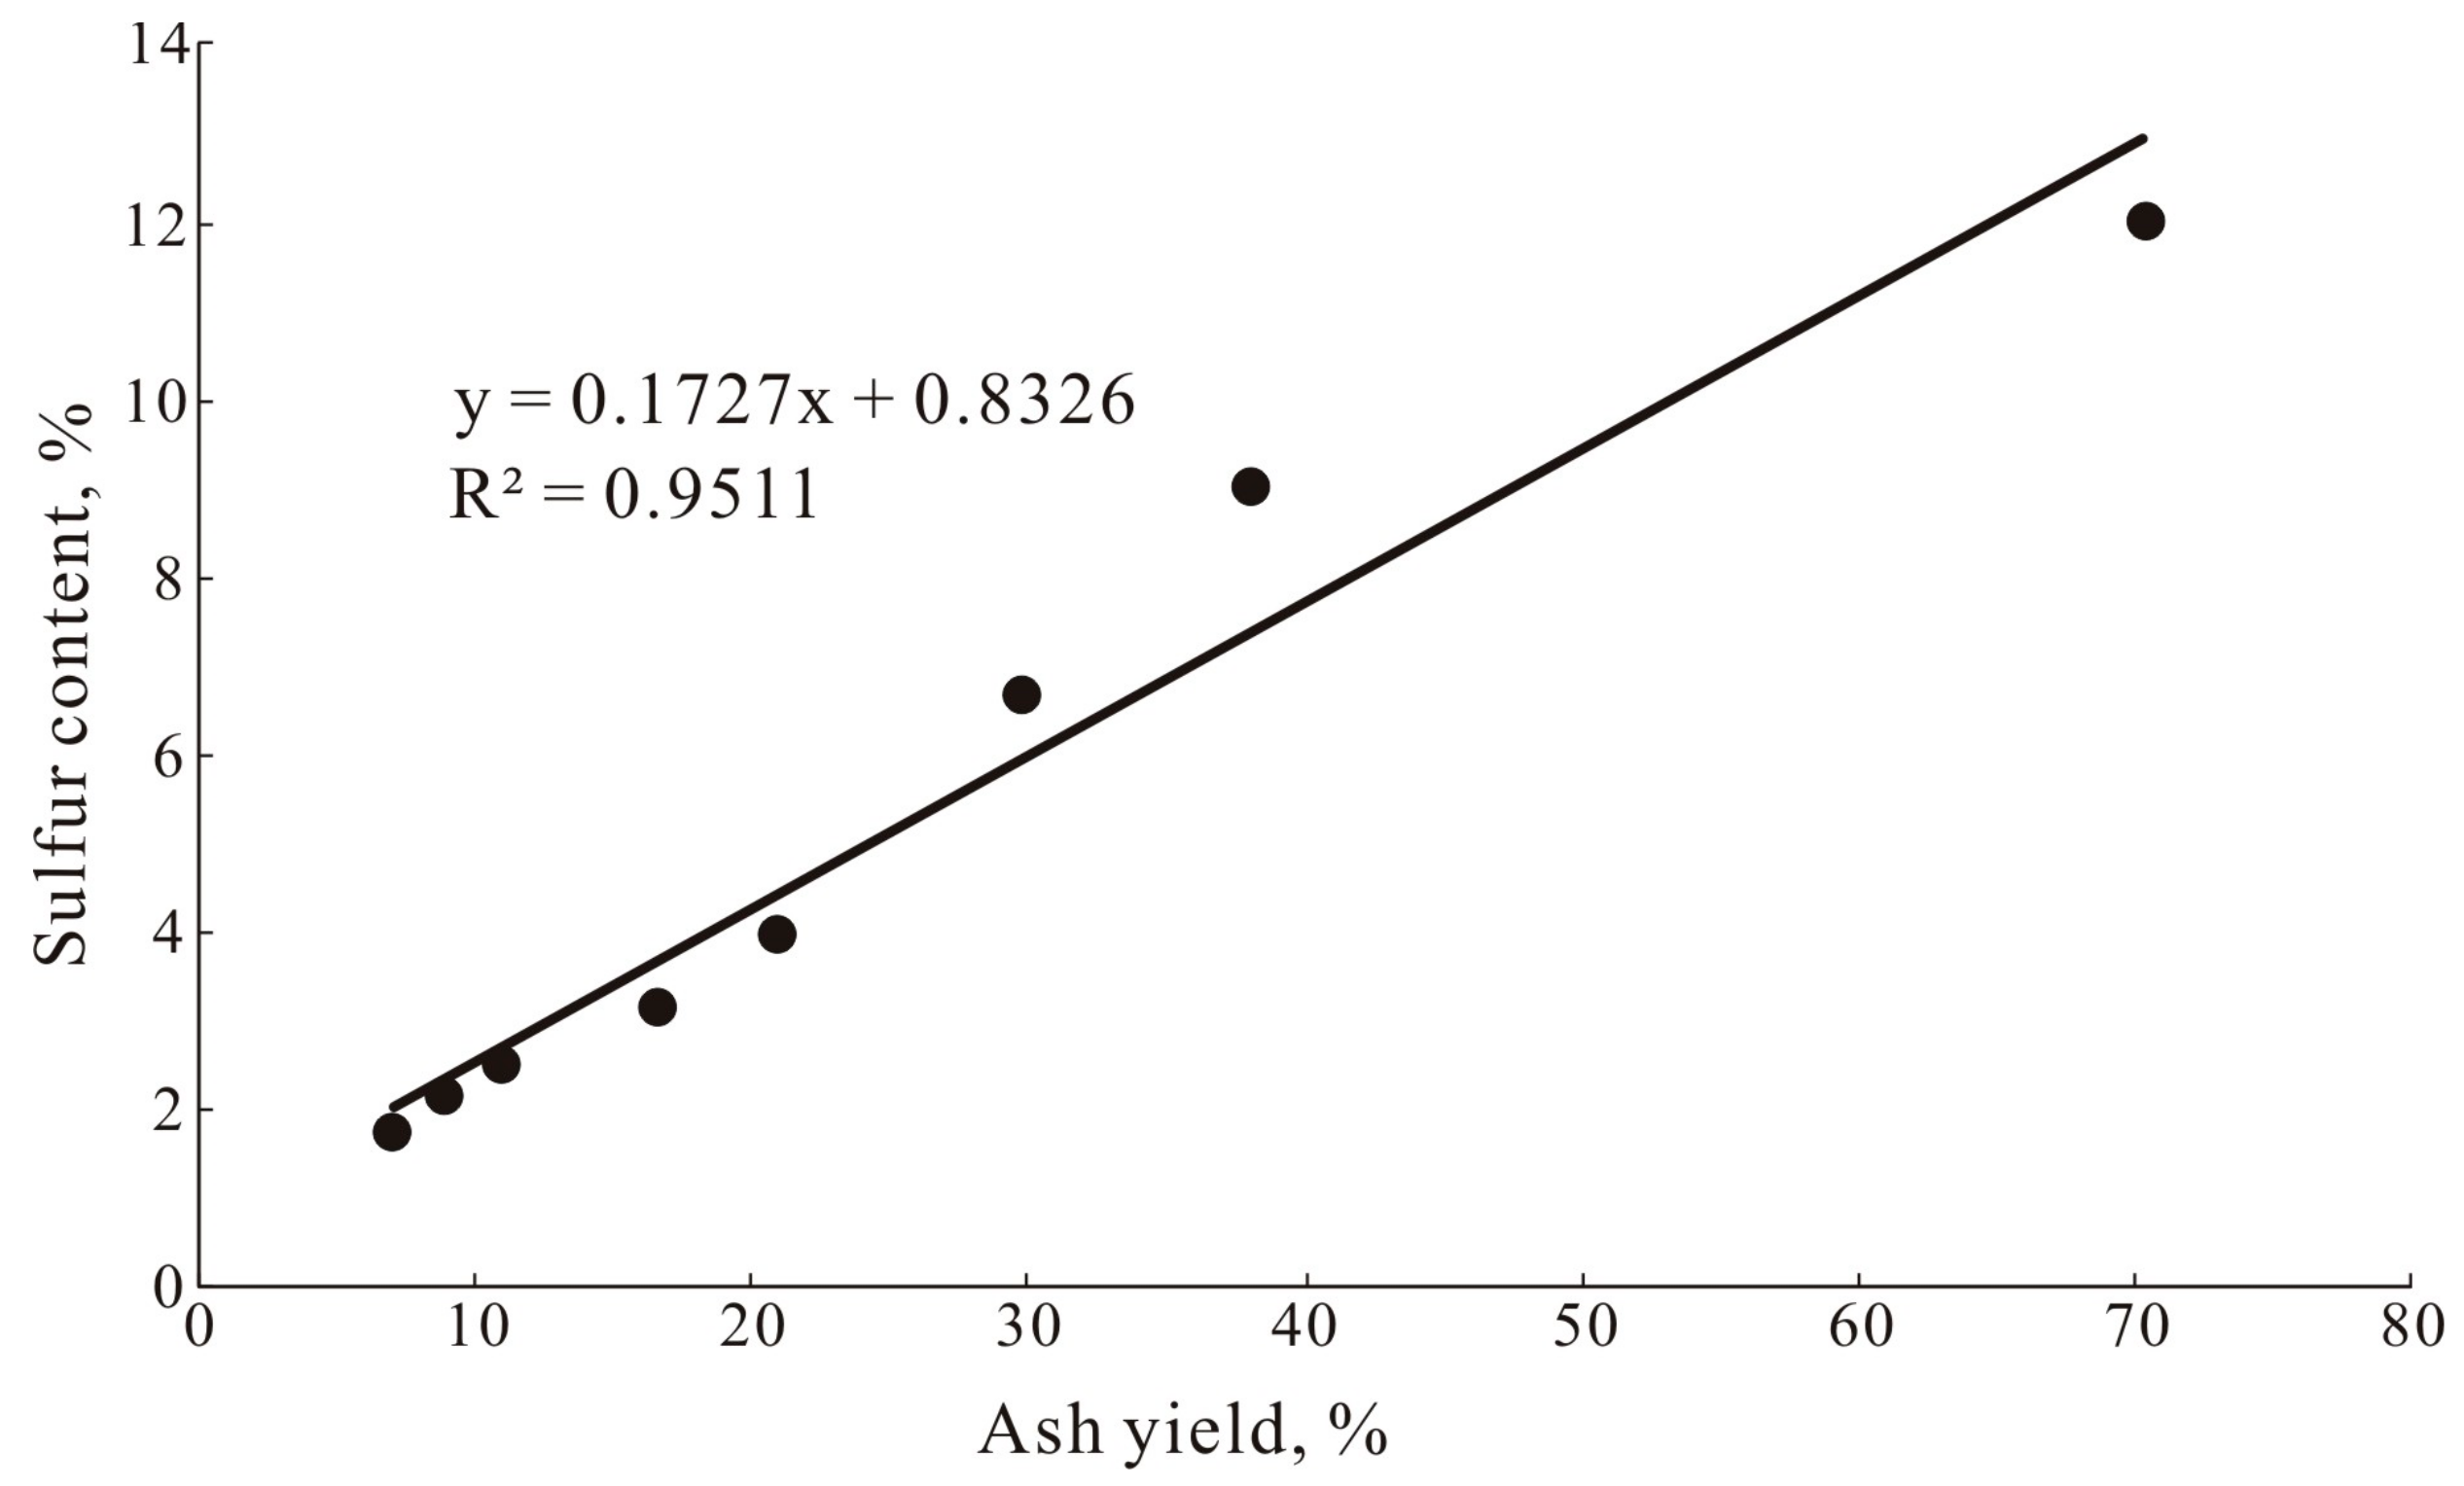
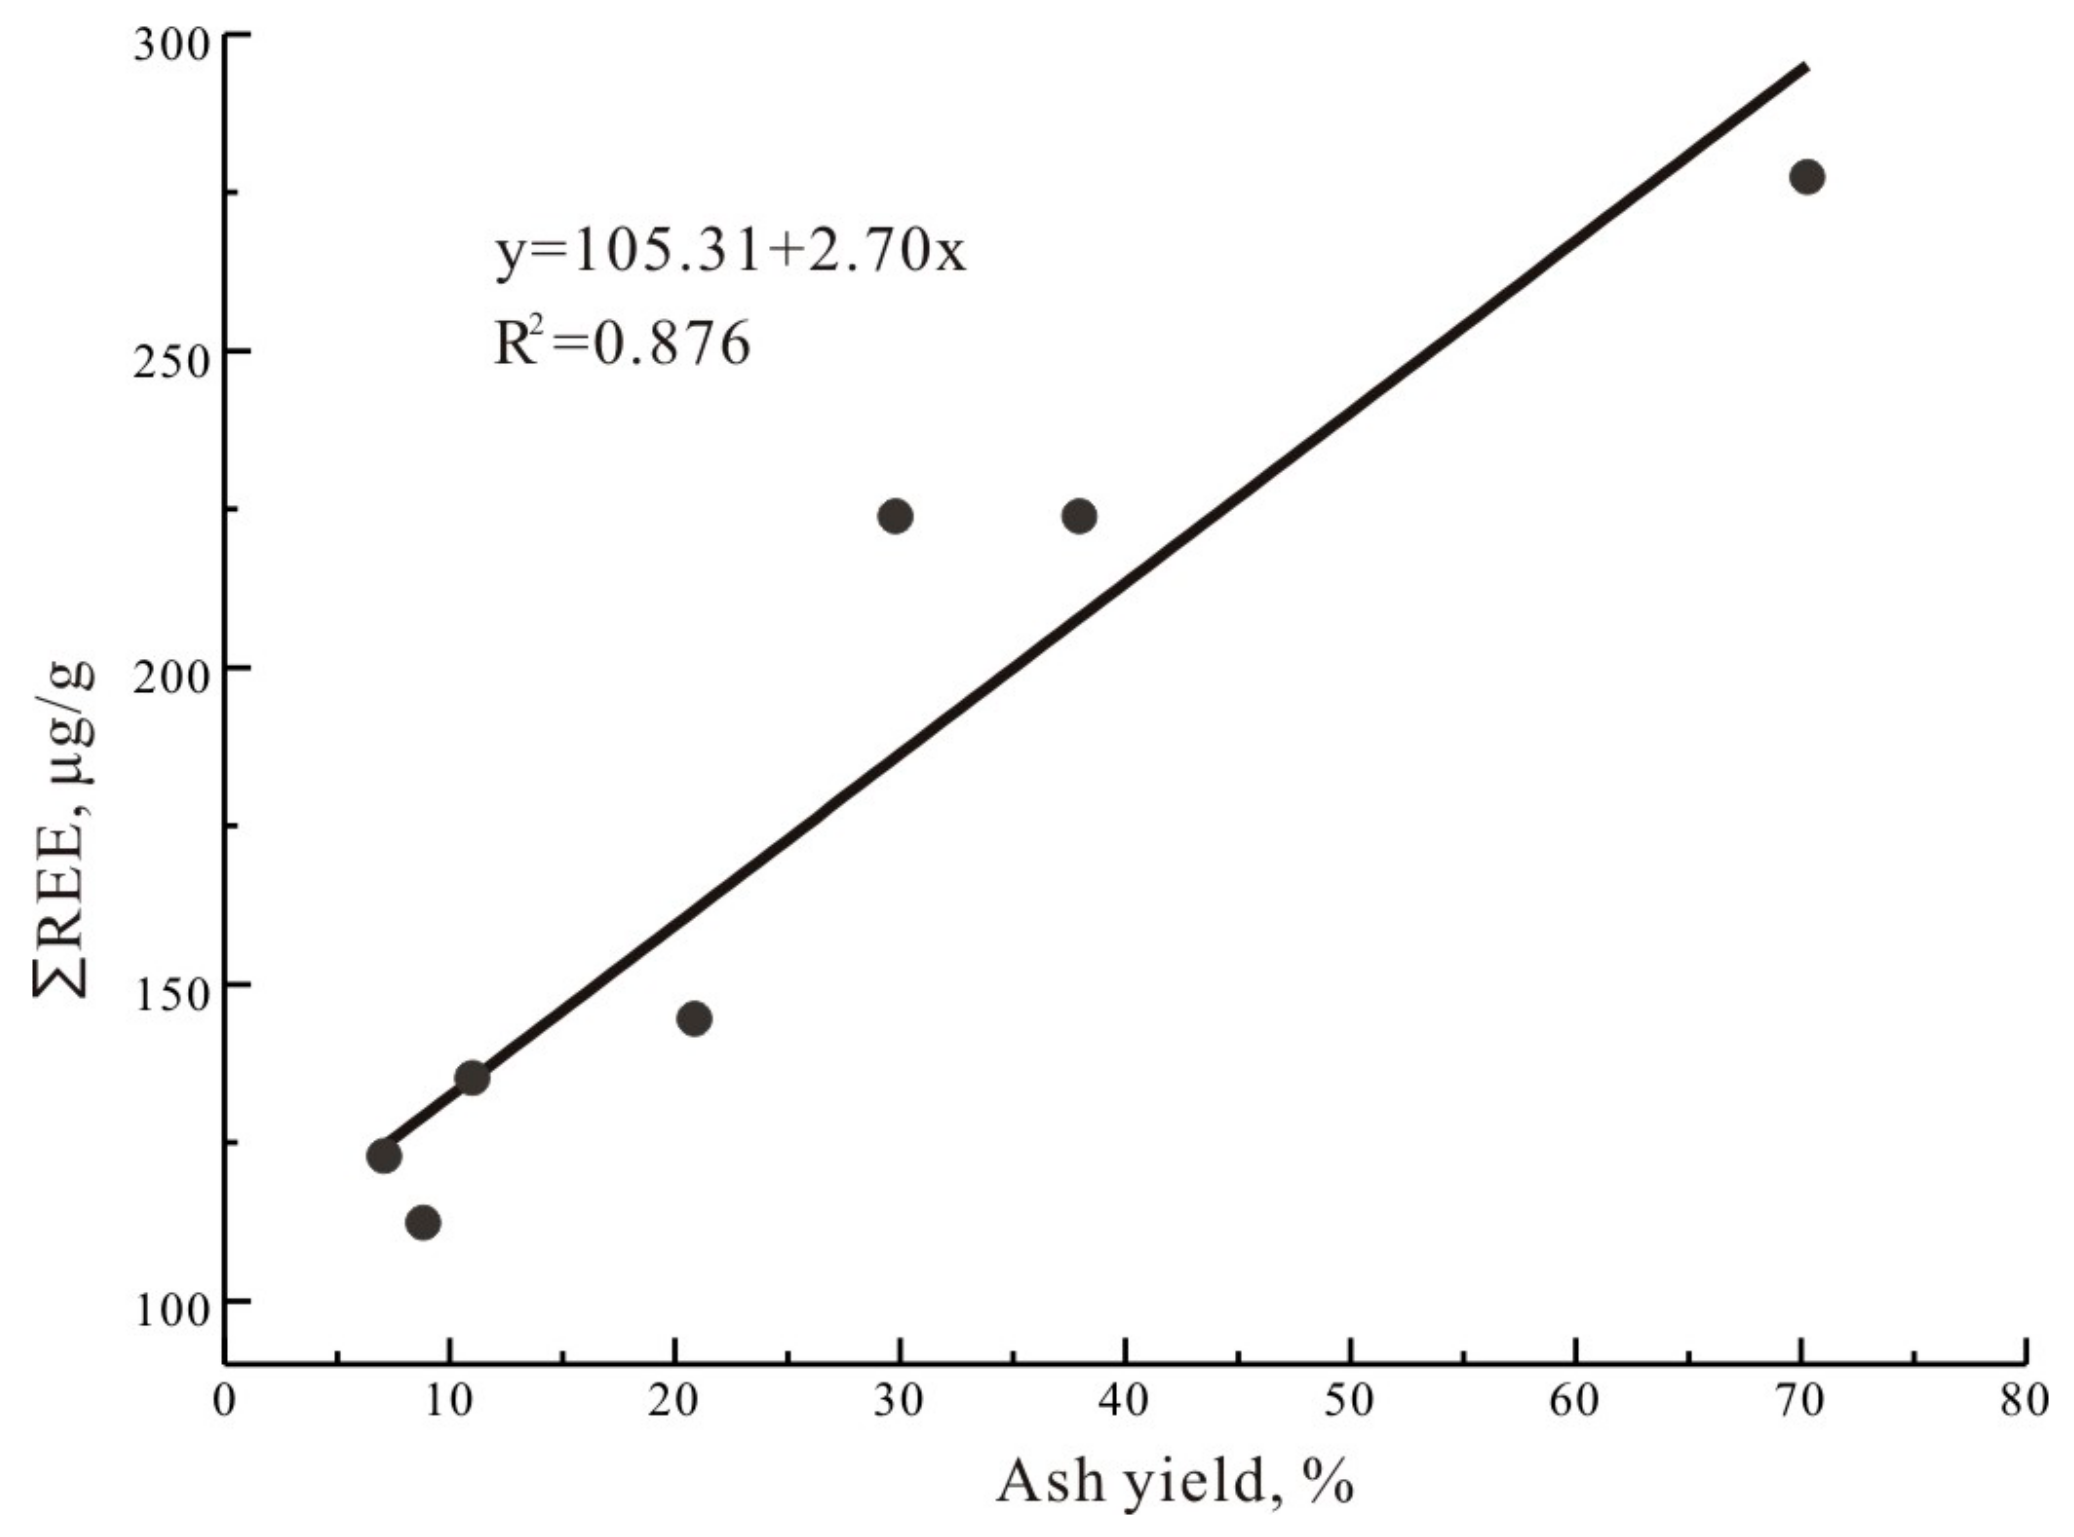
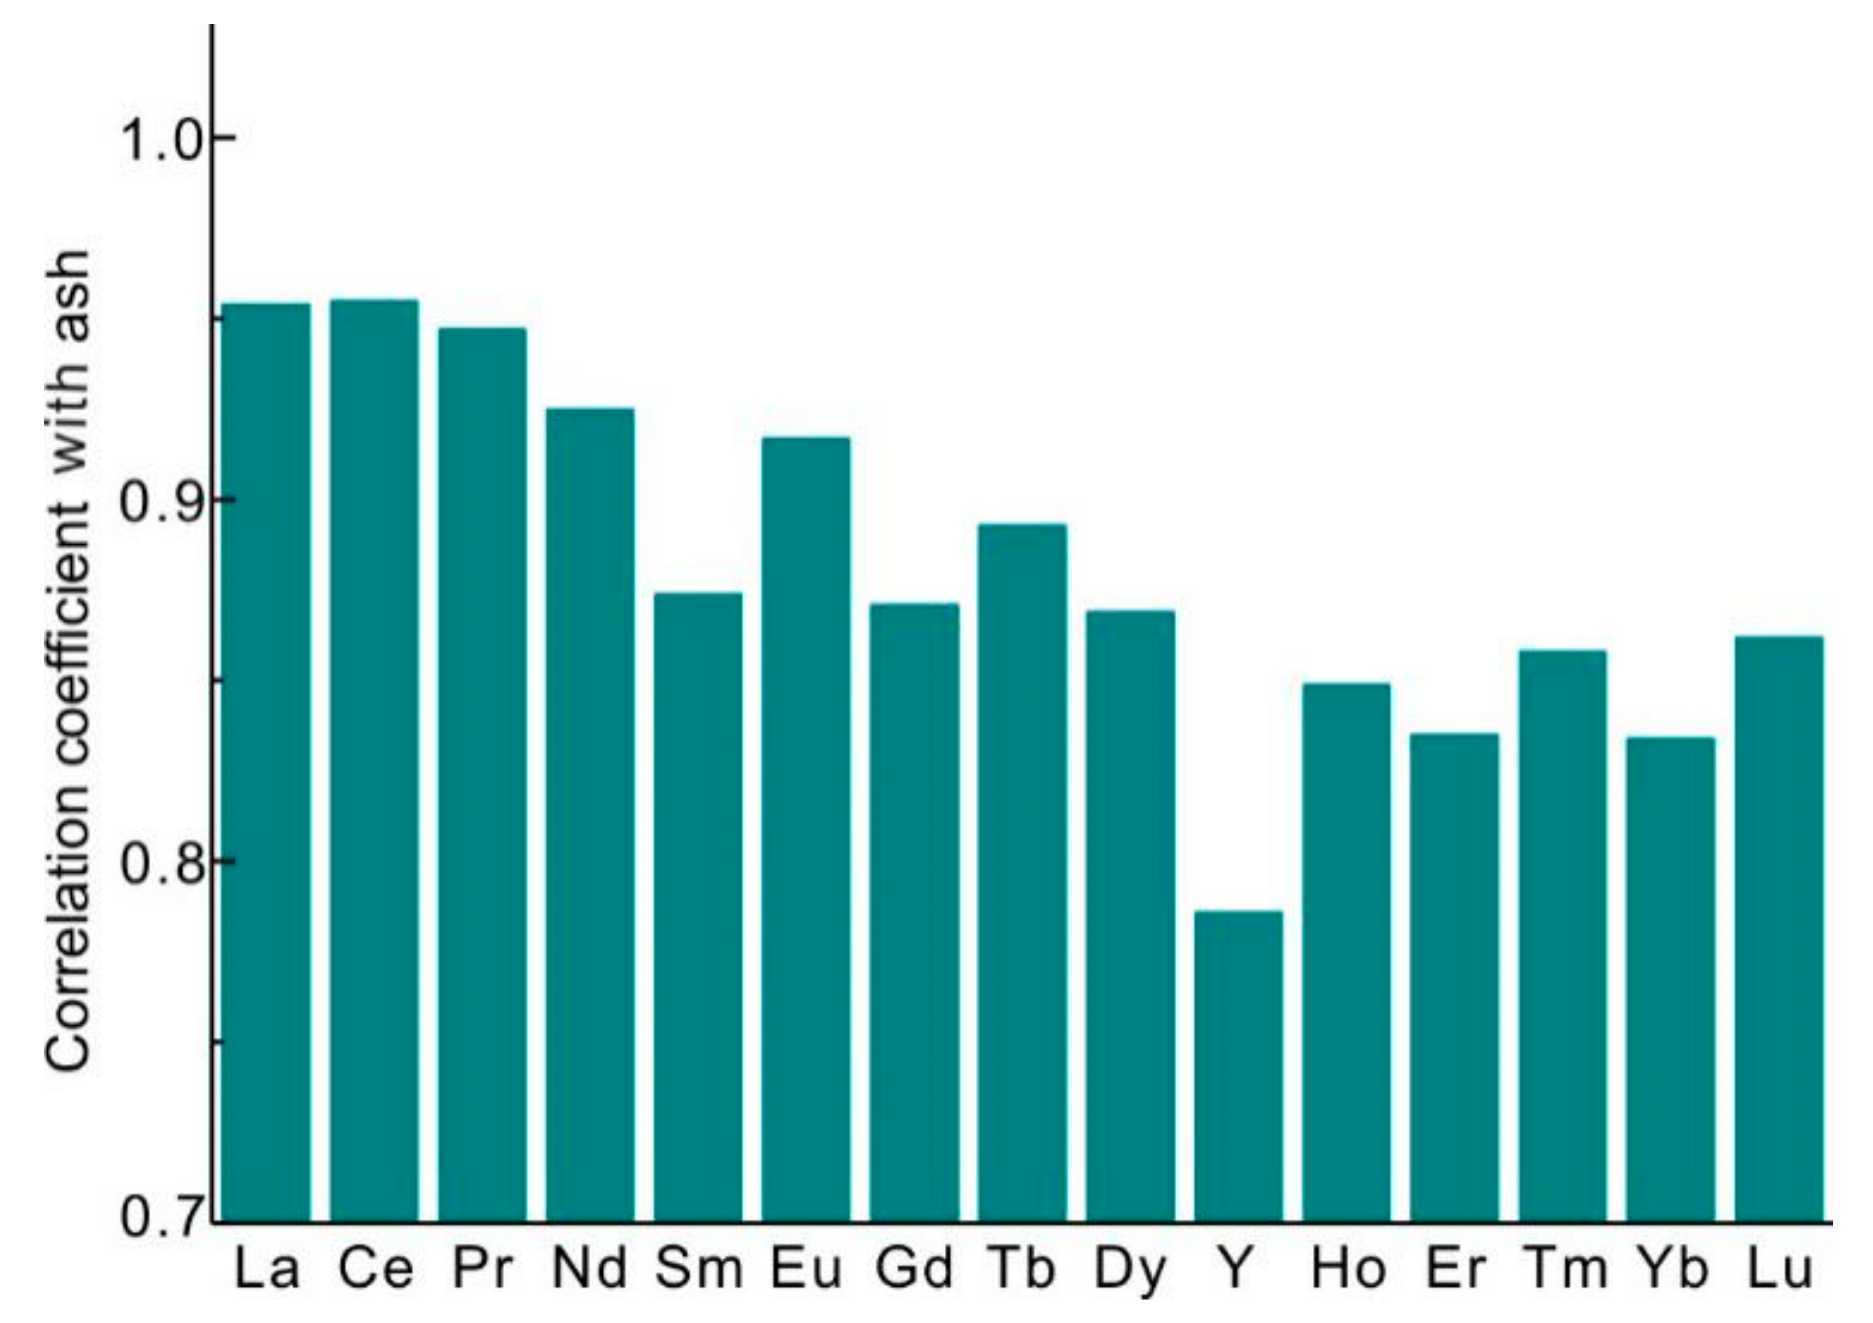
4.3. Organic Affinities of Trace Elements

The float-sink test provides not only a reference for determining the washability of a given coal, but also an effective tool for evaluation of the affinities of various trace elements [25]. The ash yields, the contents of sulfur, and various trace elements in the sludge, the ROM coal, and the seven density fractions were all determined and listed in Table 3.
Theoretically, if not perfectly, ash yield can represent the content of inorganic matter in the coal. Thus, the correlation between the ash yield and element concentration can be considered as an indicator for the element’s organic affinity; the lower the correlation coefficient, the stronger the corresponding organic affinity [26,27]. Calculation shows that the trace elements could be divided into three groups according to the Pearson’s correlation coefficients with ash yield (Table 4). Group 1 are Cs, Ga, Ta, Th, Rb, Sb, Nb, Hf, Ba, Pb, In, Cu, and Zr with correlation coefficients varying from 0.983 to 0.884, showing significant correlation with ash yield at the 0.01 level (2-tailed); group 2 includes P, Li, Bi, Sr, Mn, Cd, Ag, and W, with correlation coefficients varying from 0.825 to 0.725, showing significant correlation with ash yield at the 0.05 level (2-tailed); while group 3 consists of Sn, Co, Re, U, Mo, V, Cr, Ni, and Be, whose correlation coefficients are −0.448 to 0.596, indicating no significant correlation with ash yield. This implies that the organic affinities of elements in groups 1 and 2 are weaker when compared with elements in group 3, where the elements exhibit a relatively stronger organic affinity. Dai et al. [26] studied the modes of occurrence of trace elements in Late Permian coal based on 71 samples from western Guizhou, and the results shows that Co, Ni, U, Mo, V, Cr, Cd, W, etc., have low positive or negative relation with ash yield. Cheng et al. [13] investigated the Late Permian coal from the same region and also suggested that Mo, Ni, and Cd have relatively strong organic affinity. Finkelman et al. [28] studied the modes of occurrence of 42 trace elements in coal by using sequential leaching and found that most of the elements in high rank coal are of inorganic modes of occurrence (such as clays, carbonates, sulfides, oxides, phosphates, silicates, etc.), but more Ba, Br, Be, Co, Se, Sr, W, V and REE are of organic association and/or other phases. The result of this study is largely in accordance with those previous studies, with some difference probably due to different coal ranks [28] and place of origin.
The sum of all rare earth elements (∑REE) as a whole largely has a positive correlation with ash yield with a R2 value of 0.876 (Figure 6), suggesting that inorganic matter in the ROM coal holds more REE than that of the organic part [28,29]. Actually, REE includes 15 lanthanide elements and Y and Sc, which can be divided into two groups as the Light rare earth elements (LREE: La, Ce, Pr, Nd, Sm and Eu) and the Heavy rare earth elements (HREE: Gd, Tb, Dy, Y, Ho, Er, Tm, Yb and Lu). For the coal in this research, the correlation coefficients between individual REE and ash yields were found to decline gradually from La to Lu (Figure 7), and the LREE/HREE is lower in light fractions (average at 3.29 for density from <1.60 g/cm3) while much higher in heavy fractions (average at 4.29 for density >1.60 g/cm3) (Table 3), showing that LREE are more likely to be associated with inorganic matters. In other words, HREE have a stronger organic affinity than that of LREE [28,30,31].
Eskenazy [32,33] proposed that the formation of organometallic compounds by sorption on the coagulating humic and fulvic might be the bound mechanism for REE and organic matters in coal. This idea is further confirmed by Sonke and Salters [34] and Wang et al. [35]. We may assume that it is the replacement of metallic cations, such as Ca2+, Mg2+, etc., by REE cations in groups like –COOH or –OH that determines the affinity of REE to organic matter. Since smaller cation radius has an advantage in bonding with other negatively charged sites [36], REE’s organic affinity increases from La to Lu as the cation radius decreases.
A number of previous studies compared the difference in organic affinity between LREE and HREE, but the results are controversial. Some indicate that LREE have stronger organic affinity than HREE [13,37]; some found HREE have stronger organic affinity than LREE [28,29]; some suggest ignorable difference between LREE and HREE [33]; while Yang [38] found that REE’s organic affinity increases from La to Eu, but decreases from Gd to Lu. Finkelman (2018) [28] suggested that HREE have stronger organic affinity than LREE. The study also found that the difference in organic affinity between LREE and HREE is even bigger in high rank coal than that in low rank coal, which means coal rank influences the REE’s modes of occurrence. These controversial results, based on calculations or experiments, might be attributed to various modes of occurrence of REE in different coals. Additional investigations are needed to address this issue.

4.4. Distribution of Trace Elements during Gravity Separation

As discussed in 4.2, in order to obtain a cleaned coal with a sulfur content of no more than 2.50%, the optimal separation density was found to be 1.57 g/cm3. To simplify the problem, the theoretical separation density is assumed to be 1.60 g/cm3 for the following discussion. Thus, the ROM coal could theoretically be separated into four products: the “cleaned coal” (<1.60 g/cm3), the “middling” (1.60–1.80 g/cm3), the “gangues” (>1.80 g/cm3), and the “sludge”. It should be noted that the sludge proportion includes both the primary sludge and the secondary sludge mentioned above. A weighted sum of element concentration of different density fractions is considered as the theoretical value for elements in the ROM coal, which is calculated by Equation (1):
C w t = [ ( C 1 × γ 1 + C 2 × γ 2 + C 7 × γ 7 100 ) × γ c + C s × γ s ] / 100
where Cwt is the theoretical value of element concentration in the ROM coal; C1, C2, …C7 are element concentrations of density fractions <1.30 g/cm3, 1.30–1.40 g/cm3, … >1.80 g/cm3, respectively μg/g; γ1, γ2, … γ7 are the corresponding sub-yields of those density fractions, %; γc is the yield of coarse coal (particle size >0.5 mm) relative to the sludge proportion, %; Cs is the element concentration of the sludge, μg/g; γs is the yield of the sludge, %, which can be calculated by Equation (2), where γs1 and γs2 are the yield of the primary sludge and the secondary sludge, respectively (γs1 = 15.76, see Table 1; γs2 = 1.19, see Table 2). Thus, γs is 16.76.
γ s = γ s 1 + ( ( 100 γ s 1 ) × γ s 2 ) / 100
γc can be calculated as 83.24 by Equation (3).
γ c = ( 100 γ s )
Thus, for a given element, we assume the total quantity of which in the ROM coal is 100%, and the distribution of different density fractions and the sludge can be calculated by Equation (4) to (7):
D c = ( C 1 × γ 1 + C 2 × γ 2 + C 3 × γ 3 + C 4 × γ 4 ) × γ c C w t   × 100
D m = ( C 5 × γ 5 + C 6 × γ 6 ) × γ c C w t   × 100
D g = ( C 7 × γ 7 ) × γ c C w t   × 100
D s = C s × γ s C w t   × 100
where Dc, Dm, Dg and Ds are distributions of an element in the cleaned coal, the middling, the gangue and the sludge in %, respectively.
As a result, the distribution percentages of 45 trace elements in different theoretical coal washing products were calculated, and the results are listed in Table 5 (no data for Te as the result is uncertain). Swaine (1990) [39] suggested that Be, B, F, Cl, V, Cr, Mn, Co, Ni, Cu, Zn, As, Se, Mo, Cd, Sn, Sb, Hg, Tl, Pb, Th, and U are harmful or potentially harmful elements in coal. In this study, the distribution of toxic elements Be, V, Cr, Mn, Co, Ni, Cu, Mo, Cd, Sn, Sb, Pb, Th and U are evaluated and discussed. In addition, Zr, Nb, and REE have also been taken into consideration because the concentrations of these are relatively higher than the average levels of Chinese coal and World coal [40,41].
As can be seen from Table 5, the cleaned coal accounts for a large proportion of most of the elements mentioned above, followed by the gangue and the sludge. The percentages for the middling are relatively small, which is partly due to lower yields. Since the middling tends to go back to the feed in the coal preparation process, the sum of distribution percentages of the gangue and sludge can be considered as the removal ratios of the elements. As a result, all the trace elements can be roughly classified into 3 groups, Group 1: removal ratio is more than 50%, such as Ta, Co, Sb, Cs, Mn, Ba, W, Ag, Rb, Nb, P and Th; Group 2: removal ratio is 40–50%, such as Hf, Sr, Zr, Cu, Ga, Ni, Pb, Cd, In and REE; Group 3 includes V, Mo, Cr, Bi, U, Re, Be, Li and Sn with a removal ratio of less than 40%. Specifically, toxic trace elements, Sn (13.87%), Be (33.36%), U (35.21%), Cr (38.24%), V (38.30%), Mo (38.25%), Ni (45.26%), Cd (42.04%), Pb (44.92), Cu (46.69%) all have relatively lower removal ratios, indicating that the removal ratios of these toxic elements during coal washing would be very low. On the contrary, less of Mn (60.37%), Sb (62.39%) and Th (52.69%) migrated to the cleaned coal and middling, showing higher removal ratios. Duan (2018) [42] suggests that Co, Ni, Cu, As, Se, Cd, and Pb can be easily removed by gravity separation, which is distinct from this study. However, Duan (2018) [42] also shows that V, Cr and Mo are difficult to remove, which is in accordance with the result of this study. Generally, the distribution tendency of these toxic trace elements during gravity separation is in line with their organic affinity. Specifically, if an element has a strong organic affinity, it would be difficult to remove it from coal by gravity separation. Besides, some toxic elements (such as Pb, Cu, Cd, Ni, etc.) have a high positive relation with sulfur content, indicating that they may occur in pyrite. Thus, the relatively lower removal ratios of these elements can be attributed to a lower removal ratio of sulfur.
Another issue we should pay attention to is the “further enrichment” of those toxic elements in coal ash after combustion, which is primarily owing to the relatively low ash yield of the cleaned coal. For example, the concentration of Sn in the cleaned coal is 2.24 μg/g, the figure would be as high as 19.76 μg/g in the coal ash as the ash yield of the cleaned coal is 11.33%. While in the case of combustion of the ROM coal, the concentration of Sn in coal ash would be only 4.47 μg/g. This illustrates that coal washing may be a detrimental influence on toxic element pollution control if a certain proportion of the elements still stay in the cleaned coal.
Some valuable trace elements are enriched in some coals or coal-bearing strata, and can be recovered as resources [41]. Previous studies showed that coal can be considered as an economic source of Ge, Ga, U, V, Se, REE, Sc, Nb, Au, Ag, Re and base metals Al and Mg [43,44]. Recovery of those critical elements from coal or coal ash could result in many benefits both economically and environmentally. Therefore, from a different angle, goal-directed gravity separation could also be a preconcentration process for potential extraction of valuable elements from coal. According to the analysis above, the concentrations of REE, Zr and Nb in the coal ash of the cleaned coal will be 1127.25 μg/g, 1023.52 μg/g and 121.30 μg/g, respectively. More importantly, the separation density can be adjusted to an even lower level to magnify the enrichment of the desired elements in cleaned coal. For example, when the separation density is assumed to be 1.50 g/cm3, the concentration of REE, Zr and Nb in the ash of cleaned coal would be up to 1248.87 μg/g, 1126.23 μg/g and 134.19 μg/g, respectively. REE, Nb, Ta, Zr, Hf and U were found to have been enriched in volcanic-ash-influenced Late Permian coal [45,46] and coal-bearing strata [47] from southwestern China, showing potential as a rare metal resource for industrial extraction [48]. Therefore, more attention should be given to the enrichment of these elements in coal from this region. Meanwhile, it is of great significance to keep the distribution behaviors of both toxic and valuable trace elements in mind when designing an appropriate coal washing process.

5. Conclusions

(1) Float-sink test based washability analysis reveals that the Hongfa No.26 coal is difficult to separate. To obtain a cleaned coal with a sulfur content of less than 2.50%, the theoretical separation density should be lower than 1.57 g/cm3; the yield of the floated (cleaned) coal would be 75.50%, with an ash yield of 11.33%.
(2) The correlation coefficient of Cs, Ga, Ta, Th, Rb, Sb, Nb, Hf, Ba, Pb, In, Cu, and Zr with the ash yield varies from 0.983 to 0.884, showing significant inorganic affinity; while for Sn, Co, Re, U, Mo, V, Cr, Ni, and Be, the correlation coefficient ranges from −0.448 to 0.596, indicating relatively strong organic affinity. REE as a whole have strong inorganic affinity, but LREE seem to have weaker organic affinity than that of HREE. This can be probably attributed to the decreasing cationic radius from La to Lu.
(3) Supposing the separation density is 1.60 g/cm3, most of Sn, Be, Cr, U, V, Mo, Ni, Cd, Pb, and Cu tends to move to the cleaned coal, while a large proportion of Mn, Sb, and Th will be in the gangue. This would create severe problems with toxic element accumulation in coal ash after the combustion of the cleaned coal, because the ash yield of the cleaned coal is relatively low. However, goal-designed coal washing will also be helpful in enriching valuable elements, such as REE, Zr, and Nb whose concentration in the ash will be as high as 1248.87 μg/g, 1126.23 μg/g, and 134.19 μg/g respectively, if the separation density is 1.50 g/cm3.

Acknowledgements

This study was supported by Guizhou provincial Science and Technology Foundation (Qian Ke He J-[2015]-2048), Guizhou Provincial Young Scientific and Technologic Talent Project (Qian Jiao He KY-[2016]-128) and Guizhou Province Science and Technology Innovation Team Project (2018-005).

Author Contributions

Y.R. and Z.Q. conceived and designed the experiments; C.W., L.B. and J.Y. performed the experiments; C.W. and L.B. analyzed the data; C.W., L.B. and J.Y. contributed the coal samples collection; C.W. wrote the paper.

Conflicts of Interest

The authors declare no conflict of interest.

References

  1. Zhang, Q.; Tian, Y.Z.; Qiu, Y.Q.; Cao, J.X.; Xiao, T.C. Study on the washability of the Kaitai coal, Guizhou province China. Fuel Process. Technol. 2011, 92, 692–698. [Google Scholar] [CrossRef]
  2. Xie, G.Y.; Zhang, M.X.; Bian, B.X.; Fan, M.Q. Mineral Processing Technology; China University of Mining and Technology Press: Xuzhou, China, 2012. [Google Scholar]
  3. Li, C.; McLinden, C.; Fioletov, V.; Krotkov, N.; Carn, S.; Joiner, J.; Streets, D.; He, H.; Ren, X.R.; Li, Z.Q.; et al. India Is Overtaking China as the World’s Largest Emitter of Anthropogenic Sulfur Dioxide. Sci. Rep. 2017. [Google Scholar] [CrossRef] [PubMed]
  4. National Development and Reform Commission (NDRC). The Eleventh Five-Year Development Plan of Coal Industry; NDRC: Beijing, China, 2007. [Google Scholar]
  5. National Development and Reform Commission (NDRC). The Thirteenth Five-Year Development Plan of Coal Industry; NDRC: Beijing, China, 2016. [Google Scholar]
  6. Yang, R.D.; Liu, L.; Wei, H.R.; Cui, Y.C.; Cheng, W. Geochemical characteristics of Guizhou Permian coal measure strata and analysis of the control factors. J. Coal Sci. Eng. 2011, 17, 55–68. [Google Scholar] [CrossRef]
  7. Cheng, W.; Yang, R.D.; Zhang, Q.; Cui, Y.C.; Gao, J.B. Distribution characteristics, occurrence modes and controlling factors of trace elements in Late Permian coal from Bijie City, Guizhou Province. J. China Coal Soc. 2013, 38, 103–113. [Google Scholar]
  8. Dai, S.F.; Ren, D.Y.; Ma, S.M. The cause of endemic fluorosis in western Guizhou Province, Southwest China. Fuel 2004, 83, 2095–2098. [Google Scholar] [CrossRef]
  9. Dai, S.F.; Li, W.W.; Tang, Y.G.; Zhang, Y.; Feng, P. The sources, pathway, and preventive measures for fluorosis in Zhijin County, Guizhou, China. Appl. Geochem. 2007, 22, 1017–1024. [Google Scholar] [CrossRef]
  10. Wang, L.; Ju, Y.W.; Liu, G.J.; Chou, C.-L.; Zheng, L.G.; Qi, C.C. Selenium in Chinese coal: Distribution, occurrence and health impact. Environ. Earth Sci. 2010, 60, 1641–1651. [Google Scholar] [CrossRef]
  11. Yang, N.; Tang, S.H.; Zhang, S.H.; Huang, W.H.; Chen, P.; Chen, Y.Y.; Xi, Z.D.; Yuan, Y.; Wang, K.F. Fluorine in Chinese Coal: A Review of Distribution, Abundance, Modes of Occurrence, Genetic Factors and Environmental Effects. Minerals 2017, 7, 219. [Google Scholar] [CrossRef]
  12. Finkelman, R.B.; Tian, L.W. The health impacts of coal use in China. Int. Geol. Rev. 2017. [Google Scholar] [CrossRef]
  13. Cheng, W.; Zhang, Q.; Yang, R.D.; Tian, Y.Z. Occurrence modes and cleaning potential of sulfur and some trace elements in a high-sulfur coal from Pu’an coalfield, SW Guizhou, China. Environ. Earth Sci. 2014, 72, 35–46. [Google Scholar] [CrossRef]
  14. Vejahati, F.; Xu, Z.H.; Gupta, R. Trace elements in coal: Association with coal and minerals and their behavior during coal utilization. Fuel 2010, 89, 904–911. [Google Scholar] [CrossRef]
  15. Quick, W.J.; Irons, R.M.A. Trace element partitioning during the firing of washed and untreated power station coals. Fuel 2002, 81, 665–672. [Google Scholar] [CrossRef]
  16. Wang, W.F.; Qin, Y.; Jiang, B.; Fu, X.H. Modes of Occurrence and Cleaning Potential of Trace Elements in Coals from the Northern Ordos Basin and Shanxi Province, China. Acta Geol. Sin. 2004, 78, 960–969. [Google Scholar]
  17. Li, J.; Zhuang, X.G.; Querol, X. Trace element affinities in two high-Ge coals from China. Fuel 2011, 90, 240–247. [Google Scholar] [CrossRef]
  18. Wagner, N.J.; Tlotleng, M.T. Distribution of selected trace elements in density fractioned Waterberg coals from South Africa. Int. J. Coal Geol. 2012, 94, 225–237. [Google Scholar] [CrossRef]
  19. Kolker, A.; Senior, C.; Alphen, C.; Koenig, A.; Geboy, N. Mercury and trace element distribution in density separates of a South African Highveld (#4) coal: Implications for mercury reduction and preparation of export coal. Int. J. Coal Geol. 2017, 170, 7–13. [Google Scholar]
  20. Wang, H.; Shao, L.Y.; Hao, L.M.; Zhang, P.; Glasspool, I.J.; Wheeley, J.R.; Hilton, J. Sedimentary and sequence stratigraphy of the Lopingian (Late Permian) coal measures in southwestern China. Int. J. Coal Geol. 2011, 85, 168–183. [Google Scholar] [CrossRef]
  21. GB/T 212-2008. Proximate Analysis of Coal. (GB: National Standard of P.R. China). Available online: https://www.chinesestandard.net/Default.aspx?PDF-English-ID=GB/T%20212-2008 (accessed on 12 November 2017).
  22. GB/T 214-2007. Determination of Total Sulfur in Coal. (GB: National Standard of P.R. China). Available online: https://www.chinesestandard.net/Default.aspx?StdID=22.%09GB/T%20214-2007 (accessed on 12 November 2017).
  23. GB/T 478-2008. Method for float and sink analysis of coal. (GB: National Standard of P.R. China). Available online: https://www.chinesestandard.net/Default.aspx?StdID=23.%09GB/T%20478-2008 (accessed on 12 November 2017).
  24. Chou, C.L. Sulfur in coals: A review of geochemistry and origins. Int. J. Coal Geol. 2012, 100, 1–13. [Google Scholar] [CrossRef]
  25. Vassilev, S.V.; Eskenazy, G.M.; Vassilev, C.G. Behaviour of elements and minerals during preparation and combustion of the Pernik coal, Bulgaria. Fuel Process. Technol. 2001, 72, 103–129. [Google Scholar] [CrossRef]
  26. Dai, S.F.; Ren, D.Y.; Tang, Y.G.; Yue, M.; Hao, L.M. Concentration and distribution of elements in Late Permian coals from western Guizhou Province, China. Int. J. Coal Geol. 2005, 61, 119–137. [Google Scholar] [CrossRef]
  27. Geboy, N.J.; Engle, M.A.; Hower, J.C. Whole-coal versus ash basis in coal geochemistry: A mathematical approach to consistent interpretations. Int. J. Coal Geol. 2013, 113, 41–49. [Google Scholar] [CrossRef]
  28. Finkelman, R.B.; Palmer, C.A.; Wang, P.P. Quantification of the modes of occurrence of 42 elements in coal. Int. J. Coal Geol. 2018, 185, 138–160. [Google Scholar] [CrossRef]
  29. Seredin, V.V.; Dai, S.F. Coal deposits as potential alternative sources for lanthanides and yttrium. Int. J. Coal Geol. 2012, 94, 67–93. [Google Scholar] [CrossRef]
  30. Kang, J.; Zhao, L.; Wang, X.; Song, W.; Wang, P.; Wang, R.; Li, T.; Sun, J.; Jia, S.; Zhu, Q. Abundance and geological implication of rare earth elements and yttrium in coals from the Suhaitu Mine, Wuda Coalfield, northern China. Energy Explor. Exploit. 2014, 32, 873–889. [Google Scholar] [CrossRef]
  31. Lin, R.H.; Bank, T.L.; Roth, E.A.; Granite, E.J.; Soong, Y. Organic and inorganic associations of rare earth elements in central Appalachian coal. Int. J. Coal Geol. 2017, 179, 295–301. [Google Scholar] [CrossRef]
  32. Eskenazy, G.M. Rare earth elements in a sampled coal from the Pirin deposit, Bulgaria. Int. J. Coal Geol. 1987, 7, 301–314. [Google Scholar] [CrossRef]
  33. Eskenazy, G.M. Aspects of the geochemistry of rare earth elements in coal: An experimental approach. Int. J. Coal Geol. 1999, 38, 285–295. [Google Scholar] [CrossRef]
  34. Sonke, J.E.; Salters, V.J. Lanthanide–humic substances complexation. I. Experimental evidence for a lanthanide contraction effect. Geochim. Cosmochim. Acta. 2006, 70, 1495–1506. [Google Scholar] [CrossRef]
  35. Wang, W.F.; Qin, Y.; Sang, S.S.; Zhu, Y.M.; Wang, C.Y.; Weiss, D.J. Geochemistry of rare earth elements in a marine influenced coal and its solvent extracts from the Antaibao mining district, Shanxi, China. Int. J. Coal Geol. 2008, 76, 309–317. [Google Scholar] [CrossRef]
  36. Wang, Z.G.; Yu, X.Y.; Zhao, Z.H. Rare Earth Geochemistry; Science Press: Beijing, China, 1989; pp. 46–278. [Google Scholar]
  37. Dai, S.F.; Li, D.; Chou, C.-L.; Zhao, L.; Zhang, Y.; Ren, D.Y.; Ma, Y.W.; Sun, Y.Y. Mineralogy and geochemistry of boehmite-rich coals: New insights from the Haerwusu Surface Mine, Jungar Coalfield, Inner Mongolia, China. Int. J. Coal Geol. 2008, 74, 185–202. [Google Scholar] [CrossRef]
  38. Yang, J.Y. The periodic law of trace elements in coal—A case study of the 5# coal from the Weibei Coalfield. Sci. China Earth Sci. 2011, 54, 1542–1550. [Google Scholar]
  39. Swaine, D.J. Trace Elements in Coal; Butterworths: London, UK, 1990. [Google Scholar]
  40. Ketris, M.P.; Yudovich, Y.E. Estimation of Clarkes for Carbonaceous biolithes: Word averages for trace element contents in black shales and coals. Int. J. Coal Geol. 2009, 78, 135–148. [Google Scholar] [CrossRef]
  41. Dai, S.F.; Ren, D.Y.; Chou, C.-L.; Finkelman, R.B.; Seredin, V.V.; Zhou, Y.P. Geochemistry of trace elements in Chinese coals: A review of abundances, genetic types, impacts on human health, and industrial utilization. Int. J. Coal Geol. 2012, 94, 3–21. [Google Scholar] [CrossRef]
  42. Duan, P.P.; Wang, W.F.; Sang, S.S.; Qian, F.C.; Shao, P.; Zhao, X. Partitioning of hazardous elements during preparation of high-uranium coal from Rongyang, Guizhou, China. J. Geochem. Explor. 2018, 185, 81–92. [Google Scholar] [CrossRef]
  43. Dai, S.F.; Finkelman, R.B. Coal as a promising source of critical elements: Progress and future prospects. Int. J. Coal Geol. 2017. [Google Scholar] [CrossRef]
  44. Dai, S.F.; Yan, X.; Ward, C.R.; Hower, J.C.; Zhao, L.; Wang, X.; Zhao, L.; Ren, D.; Finkelman, R.B. Valuable elements in Chinese coals: A review. Int. Geol. Rev. 2016. [Google Scholar] [CrossRef]
  45. Dai, S.F.; Luo, Y.B.; Seredin, V.V.; Ward, C.R.; Hower, J.C.; Zhao, L.; Liu, S.D.; Zhao, C.L.; Tian, H.M.; Zou, J.H. Revisiting the late Permian coal from the Huayingshan, Sichuan, southwestern China: Enrichment and occurrence modes of minerals and trace elements. Int. J. Coal Geol. 2014, 122, 110–128. [Google Scholar] [CrossRef]
  46. Dai, S.F.; Liu, J.; Ward, C.R.; Hower, J.C.; French, D.; Jia, S.; Hood, M.M.; Garrison, T.M. Mineralogical and geochemical compositions of Late Permian coals and host rocks from the Guxu Coalfield, Sichuan Province, China, with emphasis on enrichment of rare metals. Int. J. Coal Geol. 2016, 166, 71–95. [Google Scholar] [CrossRef]
  47. Dai, S.F.; Zhou, Y.P.; Zhang, M.Q.; Wang, X.B.; Wang, J.M.; Song, X.L.; Jiang, Y.F.; Luo, Y.B.; Song, Z.T.; Yang, Z.; et al. A new type of Nb (Ta)–Zr(Hf)–REE–Ga polymetallic deposit in the late Permian coal-bearing strata, eastern Yunnan, southwestern China: Possible economic significance and genetic implications. Int. J. Coal Geol. 2010, 83, 55–63. [Google Scholar] [CrossRef]
  48. Dai, S.F.; Ward, C.R.; Graham, I.T.; French, D.; Hower, J.C.; Zhao, L.; Wang, X.B. Altered volcanic ashes in coal and coal-bearing sequences: A review of their nature and significance. Earth-Sci. Rev. 2017, 175, 44–74. [Google Scholar] [CrossRef]
Figure 1. The location of the Hongfa coalmine, southwestern Guizhou, China.
Minerals 08 00059 g001
Figure 2. The relation between ash yield and sulfur content among different size fractions.
Minerals 08 00059 g002
Figure 3. Ash yield and sulfur content in different density fractions.
Minerals 08 00059 g003
Figure 4. The relation between ash yield and sulfur content among different density fractions.
Minerals 08 00059 g004
Figure 5. Sulfur based washability curve (H–R) for the Run-of-Mine (ROM) coal. λ—sulfur content curve, β—floats curve, θ—sinks curve, δ—density curve, ε—δ ± 0.1 curve.
Minerals 08 00059 g005
Figure 6. The relation between ash yield and ∑REE among different density fractions.
Minerals 08 00059 g006
Figure 7. Correlation coefficients between individual REE and ash yield.
Minerals 08 00059 g007
Table 1. Size distribution and contents of moisture, sulfur, and ash yields of each size fraction.
Size Grade/mmYield/%Oversize Accumulation Yield/%Moisture/%Ash/%Sulfur/%
50~2521.6321.634.5727.456.74
25~1317.5739.204.1624.214.72
13~616.8556.054.4622.103.66
6~310.8166.864.4718.683.35
3~0.517.3884.244.5016.863.04
−0.515.76100.004.5616.583.23
Total100 4.4522.484.50
Table 2. Float-sink test of the coal sample sieved from Hongfa natural-sized coal.
Density(g/cm3)Yield%Ash%Sulfur%AccumulationΔ ± 0.1(g/cm3)
FloatSink
Yield%Ash%Sulfur%Yield%Ash%Sulfur%Density(g/cm3)Yield%
<1.300.997.111.800.997.111.80100.0022.404.471.3029.15
1.30~1.4028.168.832.1929.158.772.1899.0122.554.501.4066.56
1.40~1.5038.4011.022.5667.5510.052.3970.8528.005.411.5047.49
1.50~1.609.0920.884.0076.6411.332.5932.4548.108.791.6014.07
1.60~1.704.9829.806.7381.6212.462.8423.3658.6910.651.707.11
1.70~1.802.1337.979.0783.7513.113.0018.3866.5211.711.80
>1.8016.2570.2612.06100.0022.404.4716.2570.2612.06
Sub-total100.0022.404.47
Sludge1.1916.543.21
Sum100.0022.334.45
Table 3. Contents of sulfur and trace elements and ash yields in sludge, ROM coal, and various density fractions (in μg/g unless noted as % or g/cm3).
SampleHF-001HF-002HF-003HF-004HF-005HF-006HF-007HF-008HF-009
Density, g/cm3ROM<1.301.30–1.401.40–1.501.50–1.601.60–1.701.70–1.80>1.80Sludge
Yield, %1000.9928.1638.49.094.982.1316.251.19
Ash, %22.38 7.11 8.83 11.02 20.88 29.80 37.97 70.26 16.54
Sulfur, %4.451.802.192.564.006.739.0712.063.21
Li35.436.133.941.142.532.355.456.833.4
Be1.571.431.341.691.481.21.751.911.62
P12080508070100150230170
V1096775108146151208136163
Cr301719363634514145
Mn9211922127400279296128
Co13.65.45.51216.91717.623.259.8
Ni16.46.39.617.127.121.233.628.932.4
Cu26.011.312.417.138.827.444.152.827.0
Ga7.666.065.886.608.808.6712.8518.859.49
Rb3.90.722.25.65.58.812.64.8
Sr62.632.831.240.764.3124.0116.0115.092.8
Y18.617.61619.822.826.228.328.526.6
Zr14411074142137208257324228
Nb19.815.110.016.015.724.541.461.928.4
Mo26.68.114.220.841.737.052.525.437.4
Ag0.060.010.010.010.030.020.010.050.03
Cd0.320.080.170.270.630.470.820.660.37
In0.0530.0540.0480.0440.0550.0790.0740.0880.061
Sn213321111
Sb0.550.20.180.240.550.591.031.620.72
Te<0.05<0.050.05<0.050.120.050.050.070.05
Cs0.450.080.220.220.710.631.071.900.56
Ba44.49.410.733.554.788.8195.519254.3
La26.523.421.324.924.541.842.855.929.7
Ce52.645.641.549.552.485.584.6112.060.9
Pr6.024.914.545.566.139.609.5812.156.95
Nd20.416.616.019.021.334.733.341.024.0
Sm3.853.122.953.814.227.336.517.714.62
Eu0.710.560.540.600.761.201.191.410.85
Gd3.732.922.933.623.725.995.816.474.48
Tb0.480.430.370.460.540.750.820.910.66
Dy3.082.642.483.193.264.194.855.124.07
Ho0.640.570.520.70.690.810.970.990.81
Er1.741.551.441.781.892.202.512.572.23
Tm0.250.230.210.250.270.320.370.390.33
Yb1.631.551.401.781.792.022.362.392.06
Lu0.260.240.210.270.270.300.350.370.31
Hf3.42.71.93.63.54.76.59.35.2
Ta1.20.60.50.61.0 1.83.65.61.8
W1324710111313
Re0.0520.0050.010.040.1320.1170.1430.0250.082
Pb9.25.14.86.59.89.315.816.49.4
Bi0.270.180.160.200.210.160.250.270.21
Th5.513.382.804.614.886.4211.2516.506.57
U20.86.010.018.031.433.043.216.927.4
REE140.49121.92112.39135.22144.54222.91224.32277.88168.57
L/H3.623.403.403.253.104.213.844.823.06
Note: L/H is the ratio of LREE/HREE (Light rare earth elements/Heavy rare earth elements).
Table 4. Correlation coefficients between the ash yield and various trace elements.
CsGaTaThRbSbNbHfBaPb
0.9830.9740.9690.9690.9670.9620.9500.9430.9030.901
InCuZrPLiBiSrMnCdAg
0.8920.8870.8840.8250.7780.7690.7560.7400.7370.735
WBeNiCrVMoUReCoSn
0.7250.5960.5930.5480.4860.3540.2930.1600.150-0.488
Table 5. The distribution of trace elements among different theoretical products (Unit %).
ElementCwtDcDmDgDs
Li40.2061.195.7719.1113.93
Be1.5961.565.0816.2617.09
P109.6639.446.2128.3725.98
V119.3653.378.3315.4122.89
Cr34.2355.006.7616.2022.04
Mn101.8618.5021.1339.3121.06
Co20.6331.264.9315.2148.59
Ni20.6347.597.1518.9526.32
Cu24.9945.637.6828.5818.11
Ga8.9347.076.5828.5517.81
Rb4.4935.638.5437.9217.90
Sr63.7639.9311.2924.4024.39
Y21.8554.697.2717.6420.40
Zr169.2343.737.7925.9022.58
Nb23.6537.087.4035.4020.12
Mo25.3752.039.7213.5424.71
Ag0.0238.154.8632.6924.30
Cd0.3648.509.4624.8117.24
In0.0652.838.1021.0218.05
Sn2.1883.422.716.197.67
Sb0.5429.777.8440.2322.15
Cs0.5730.807.8844.9116.40
Ba59.6529.2211.9843.5415.26
La30.0349.958.3025.1816.58
Ce60.2949.588.3725.1316.93
Pr6.7249.778.4524.4517.33
Nd23.1749.958.7623.9417.36
Sm4.4950.209.3423.2217.24
Eu0.7848.509.0324.3118.16
Gd4.1352.098.5121.2118.19
Tb0.5649.908.1822.0819.84
Dy3.5053.357.4119.7719.47
Ho0.7255.687.0218.5218.78
Er1.9255.357.0718.1119.47
Tm0.2854.227.1018.8819.80
Yb1.8456.836.8317.5718.77
Lu0.2856.696.6917.9718.65
Hf4.3243.567.1729.1020.16
Ta1.5924.558.7247.7219.01
W6.8533.618.9025.6831.81
Re0.0550.6514.876.8127.67
Pb8.4547.207.8826.2718.65
Bi0.2058.935.4918.1217.46
Th6.3339.957.3635.2817.41
U19.5453.8710.9211.7023.51
REE160.5750.768.2323.4117.60

