Classification of Flotation Frothers


Abstract
:1. Introduction
2. Frothers in Pure State
2.1. Feature-Type (no-Numerical Value) Classification
2.2. One-Numerical Value Classification
2.3. Two-Numerical Value Classification
3. Frother in Aqueous Solutions
3.1. Feature-Type (no Numerical Value) Classification
3.2. One-Numerical Value Classification
4. Frother in Aqueous Solutions/Gas System
4.1. Feature and Trend-Type (no Numerical Value) Classification
4.2. One-Numerical Value Classification
4.2.1. Surface Tension versus Frother Concentration, σ∠ or cσ50
4.2.2. Bubble Size versus Frother Concentration, CCC
4.2.3. Gas Hold-up versus Frother Concentration, GH0.2
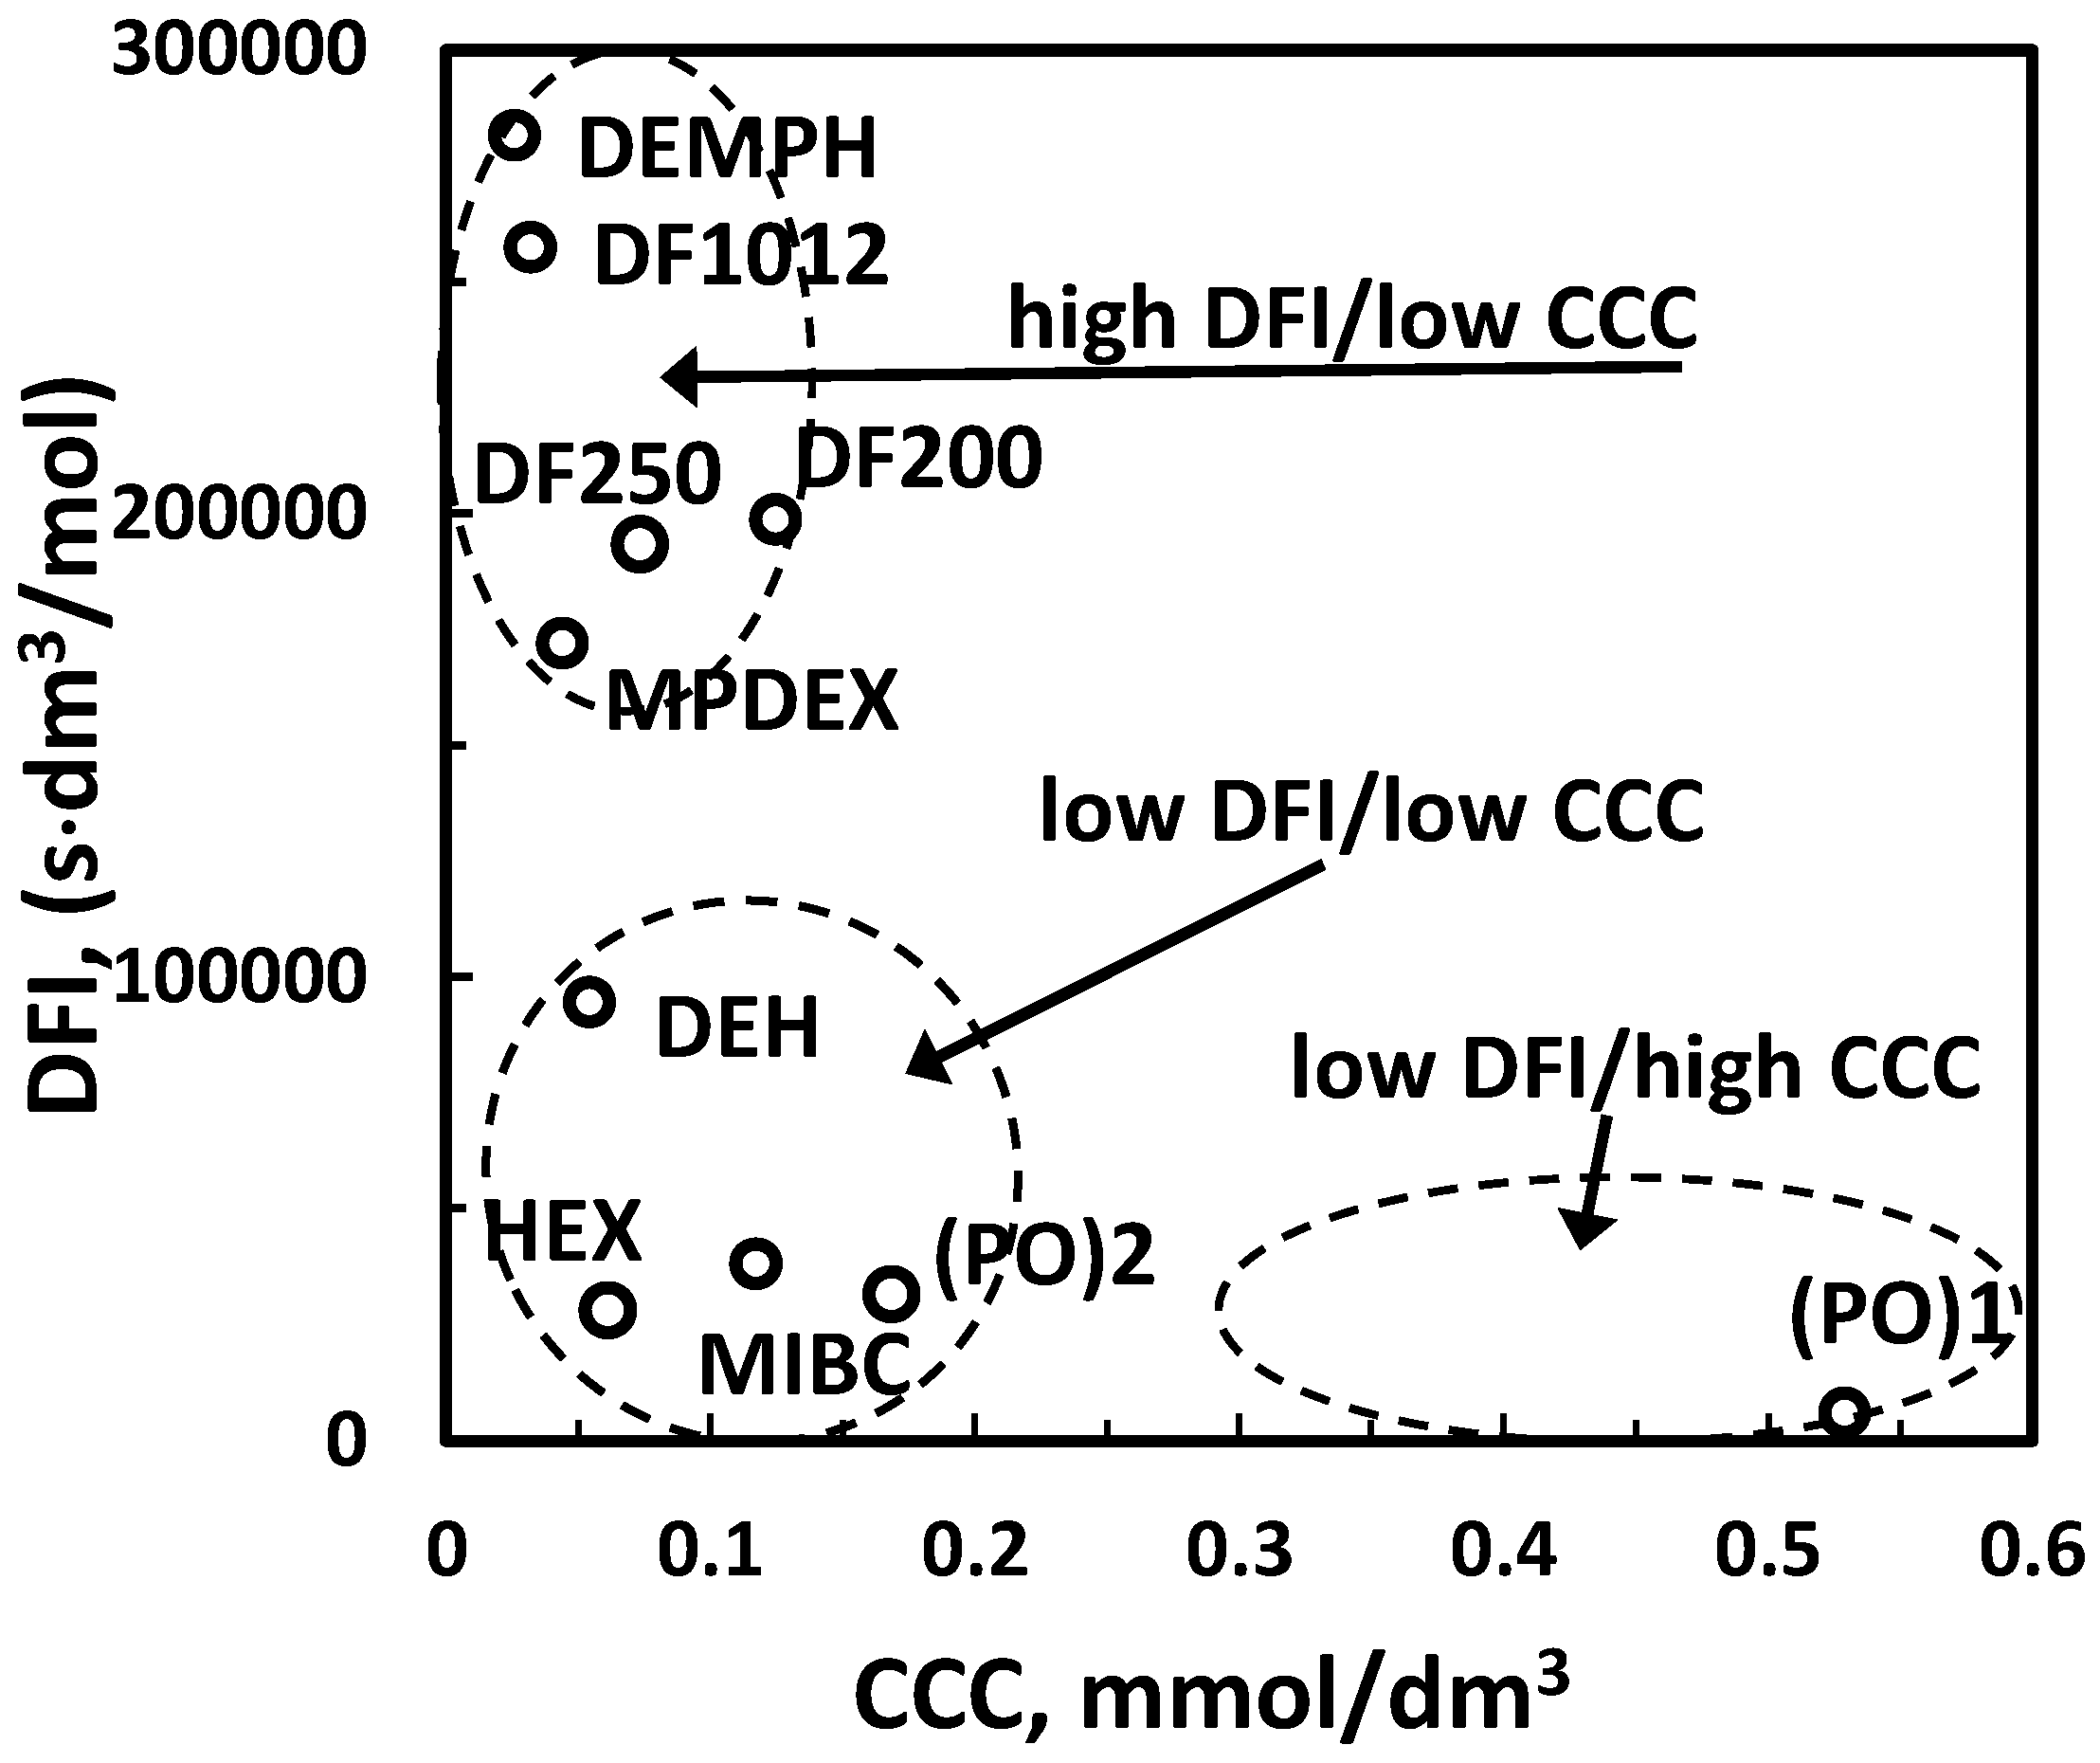
4.2.4. Retention Time versus Frother Concentration, DFI
4.2.5. Other Parameters Used for Frother Classification
4.3. Two-Numerical Value Classification
5. Three-Phase (Liquid/Gas/Solid) System
5.1. Trend-Type Classification
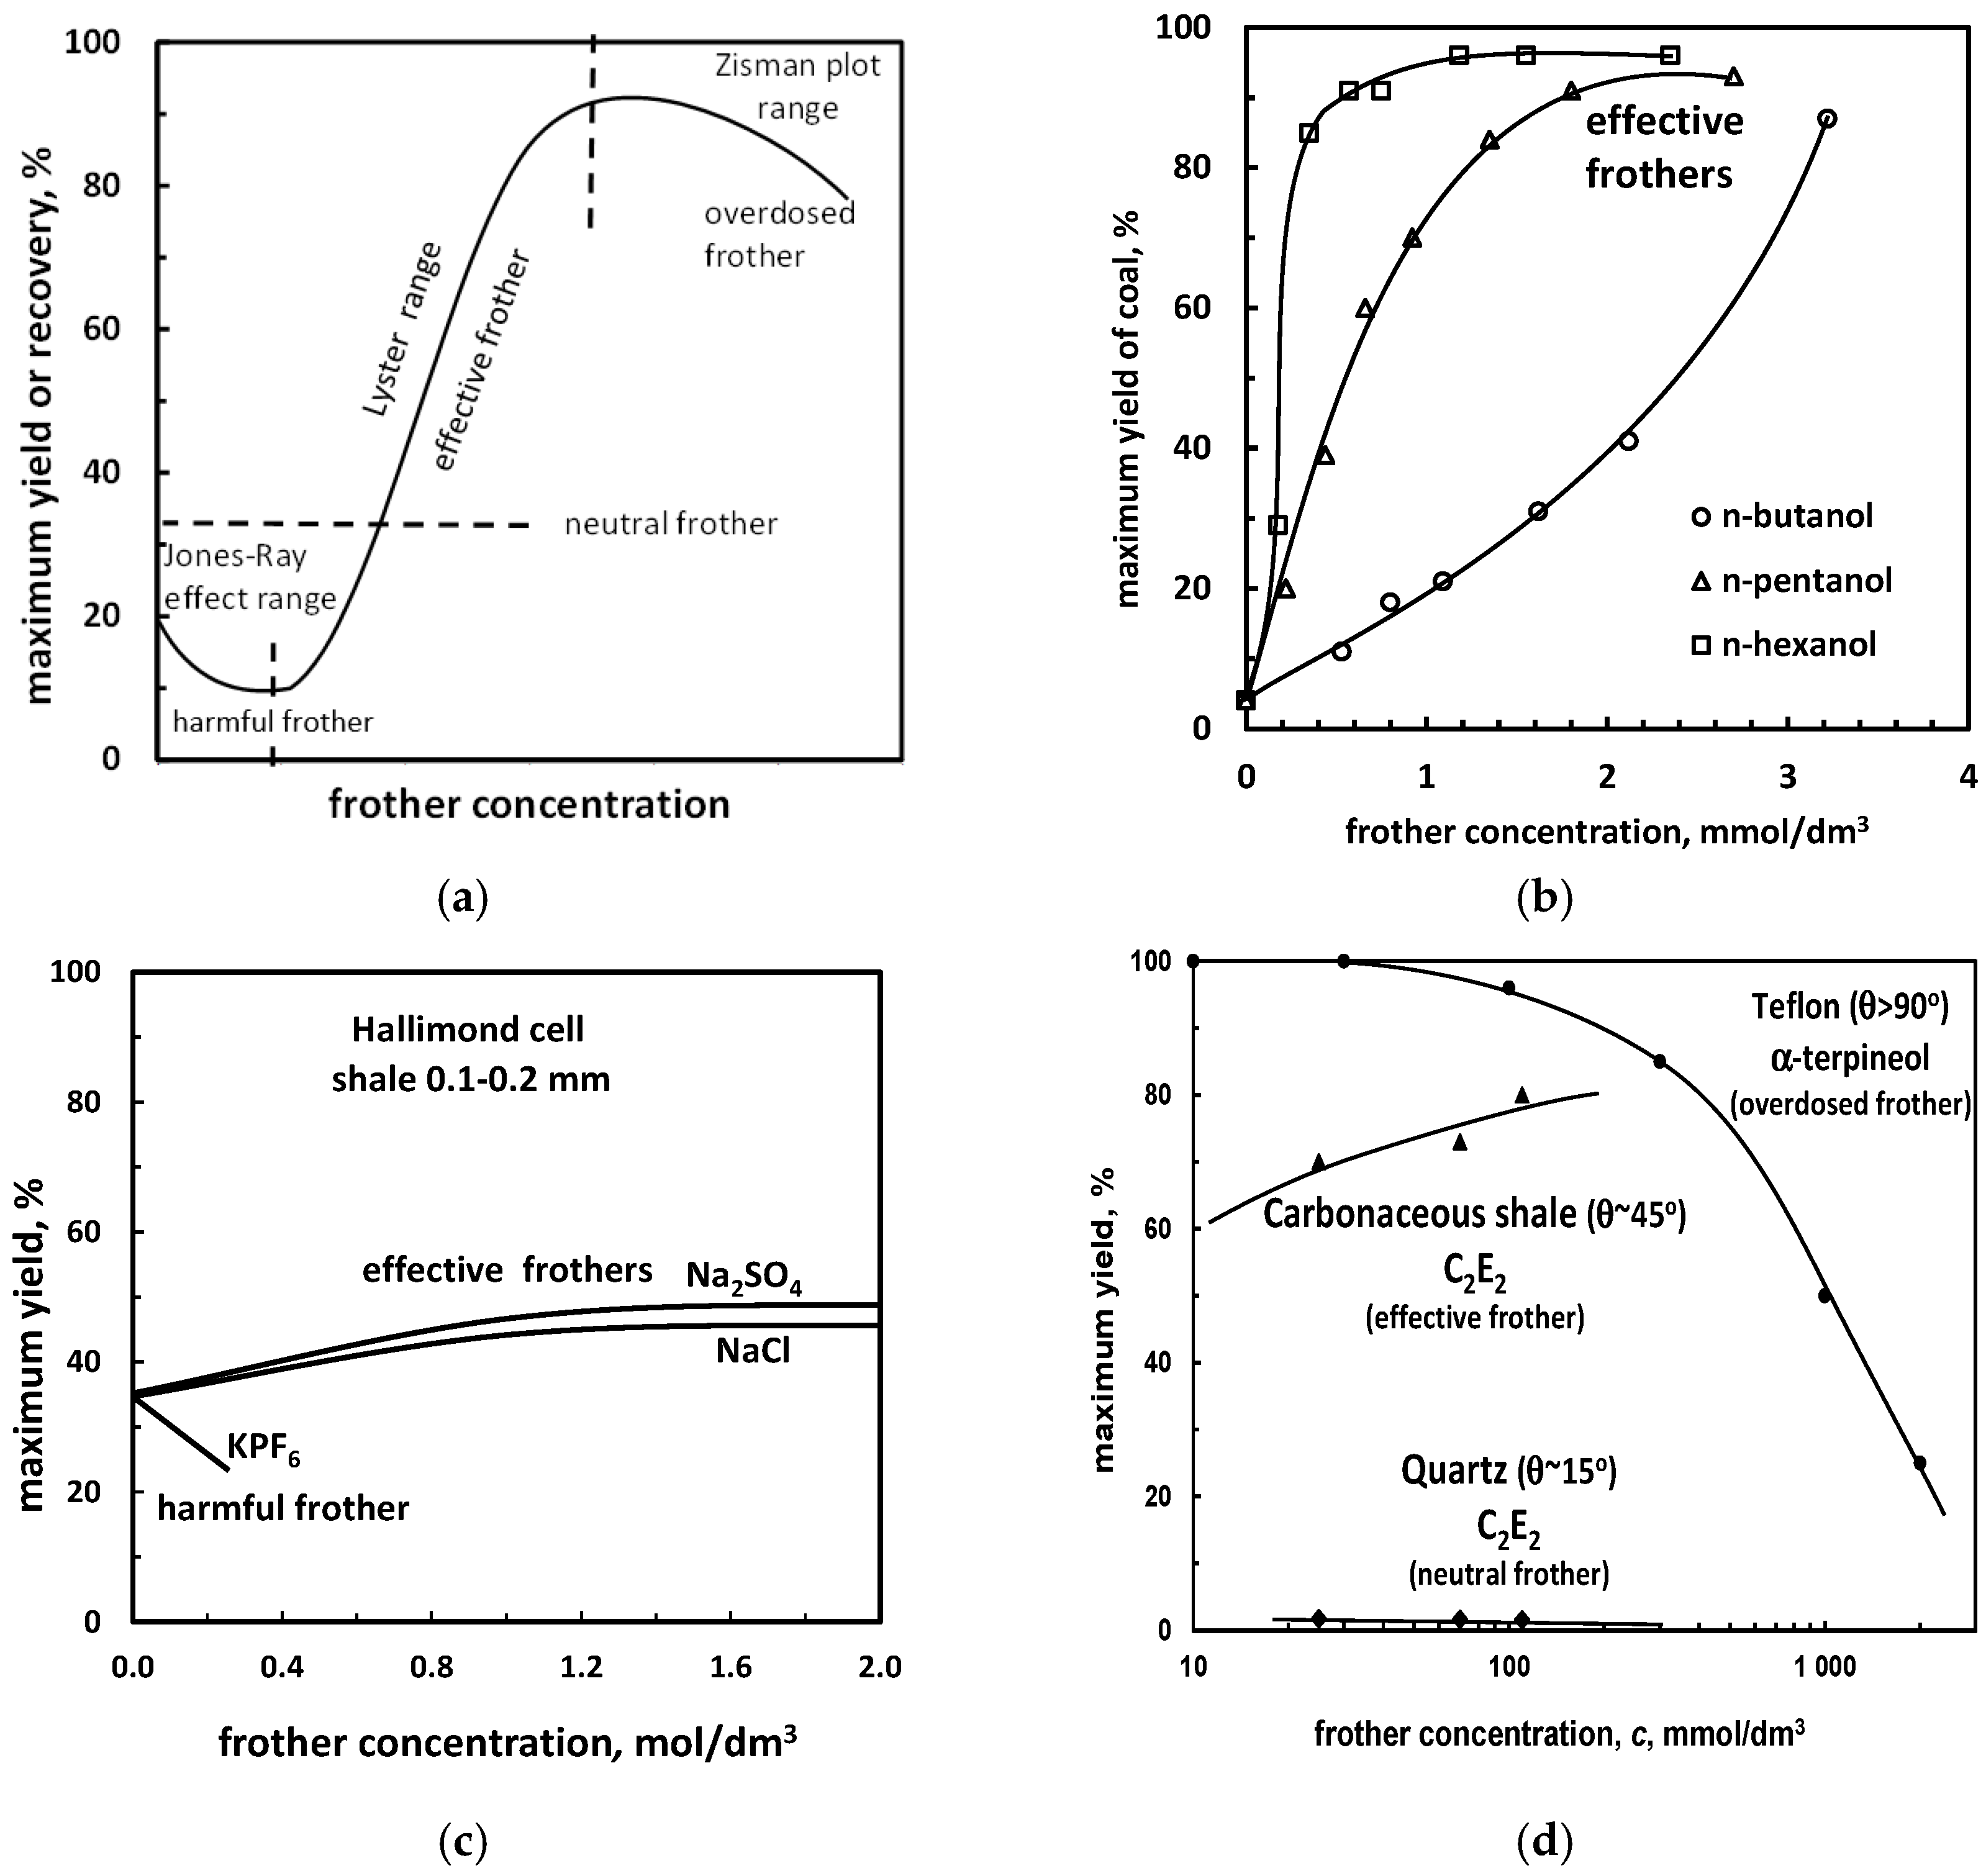
5.1.1. Flotation Yield (Recovery) vs. Frother Concentration. Effective, Neutral, Harmful and Overdosed Frothers
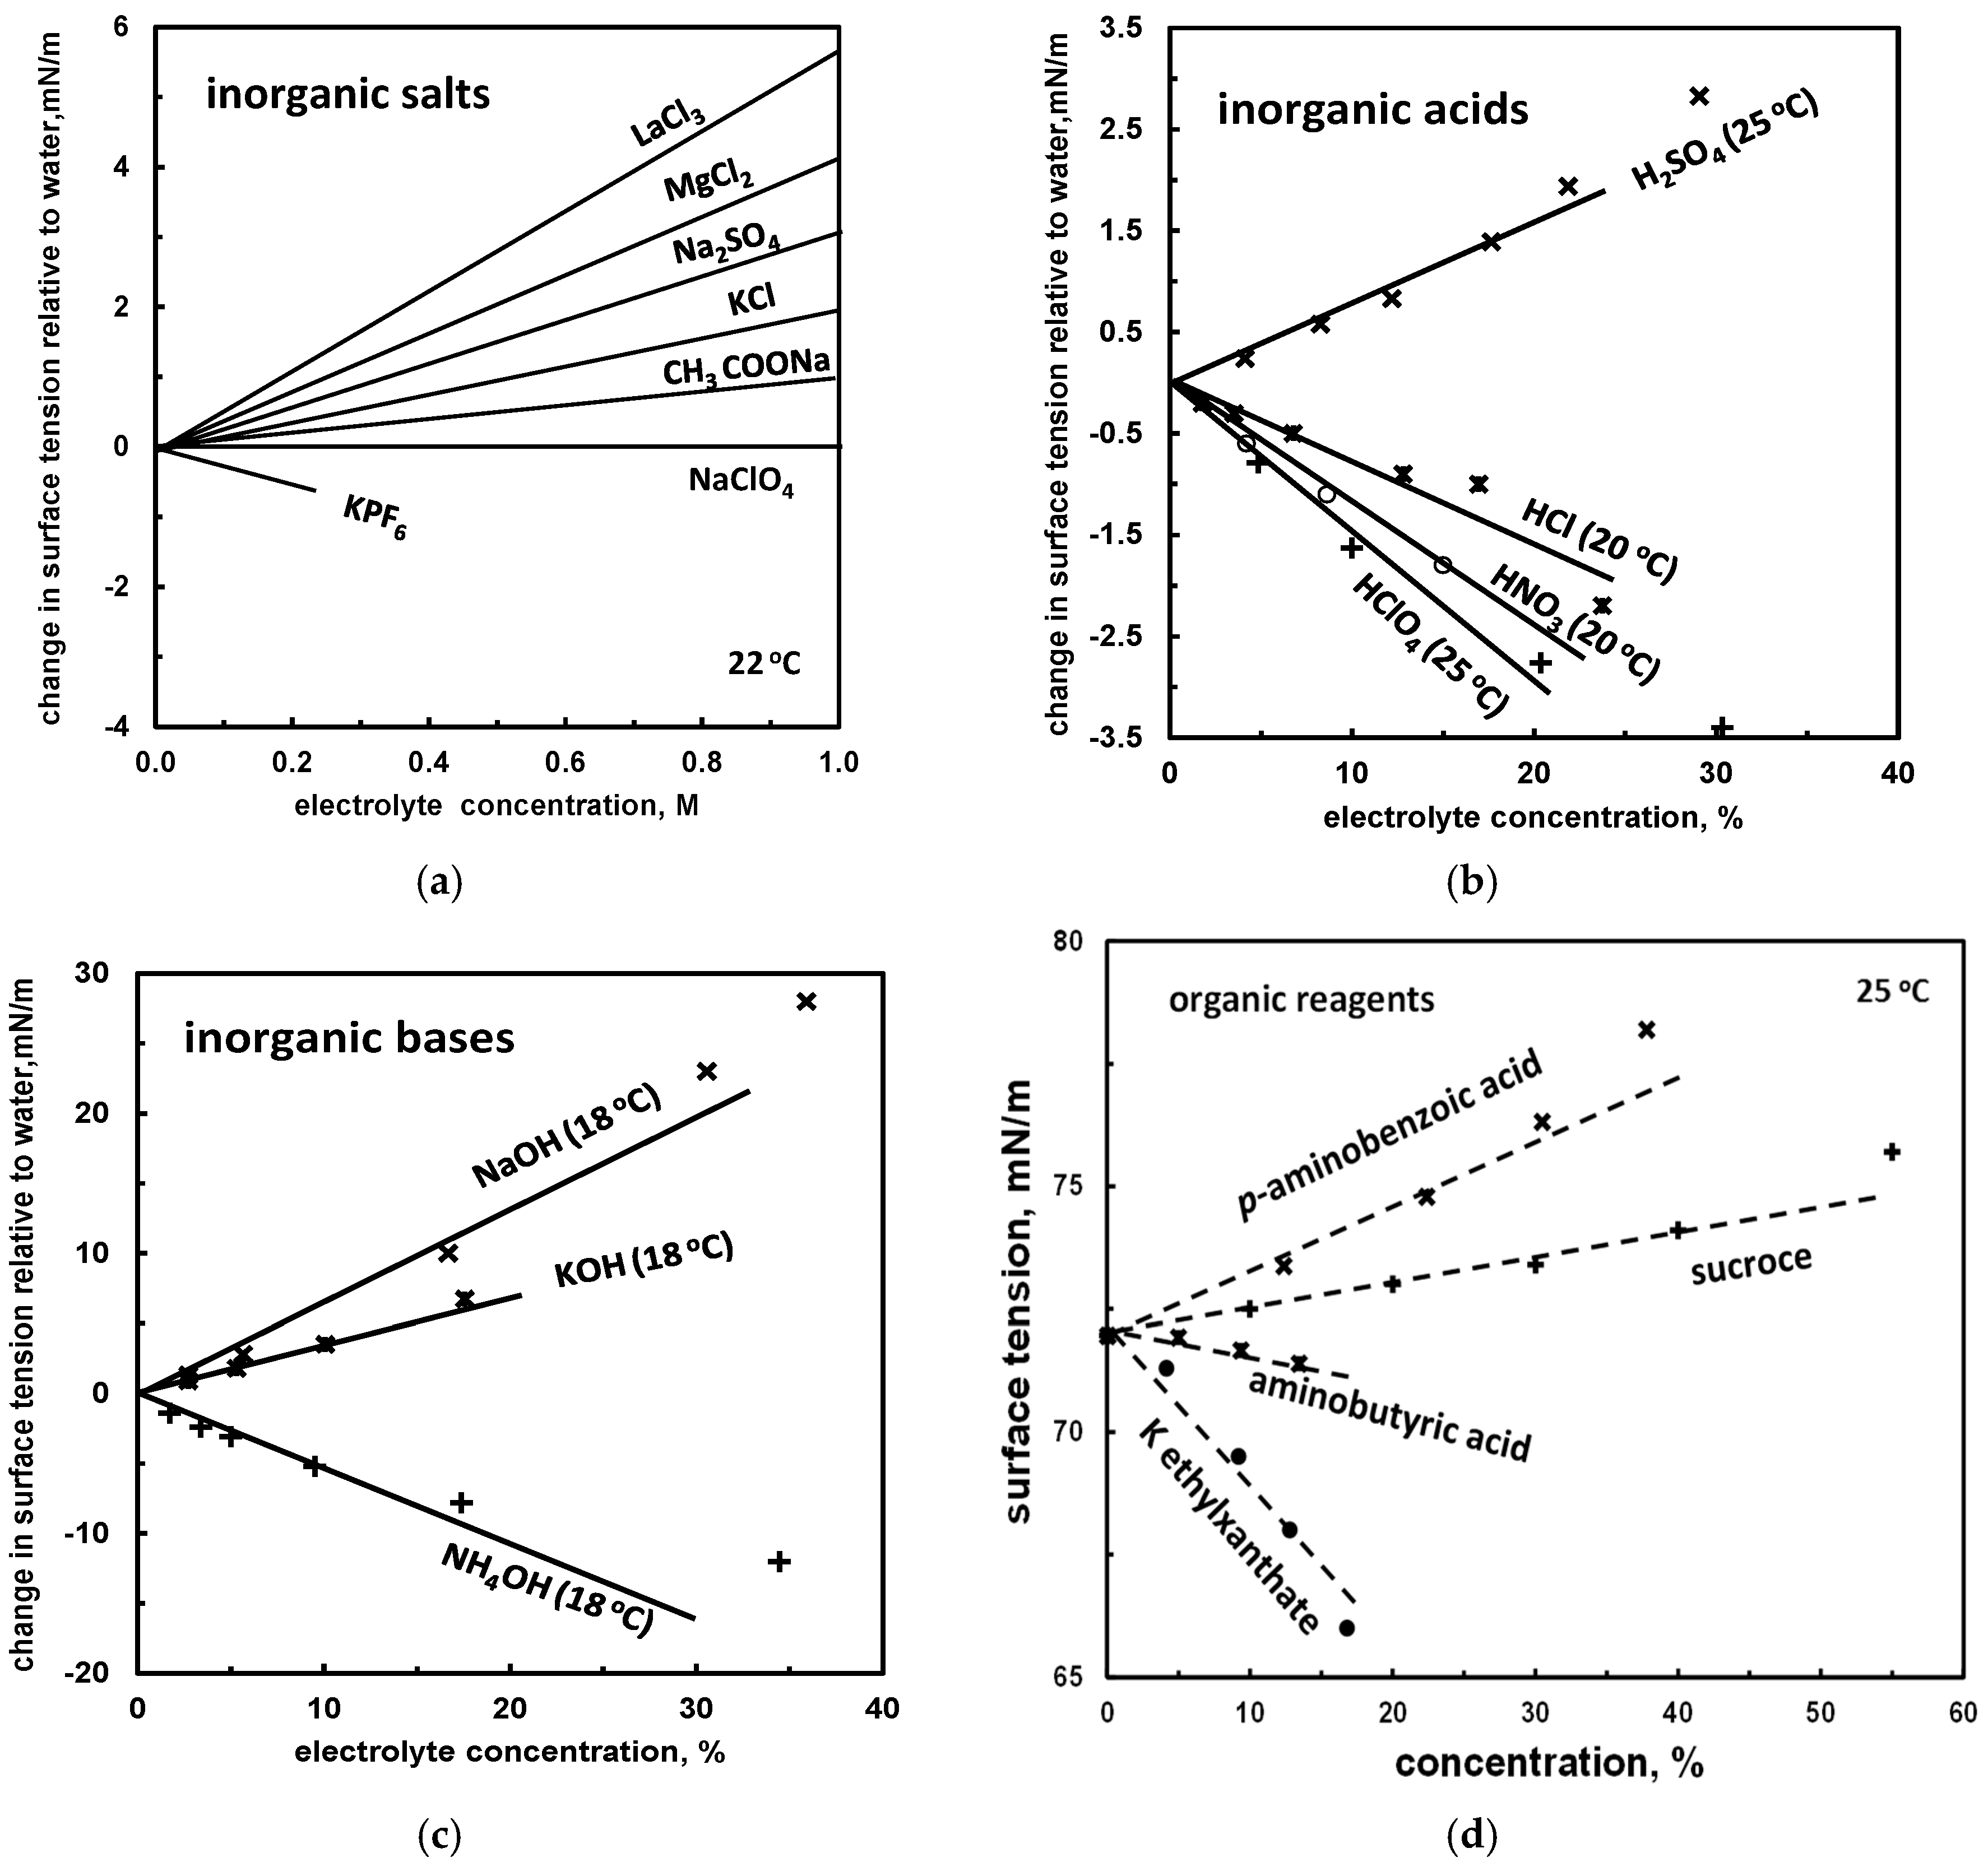
5.1.2. Flotation Performance Versus Surface Tension. Surface Tension Effective, Neutral and Harmful Inorganic Frothers
5.2. One Numerical Value Classification
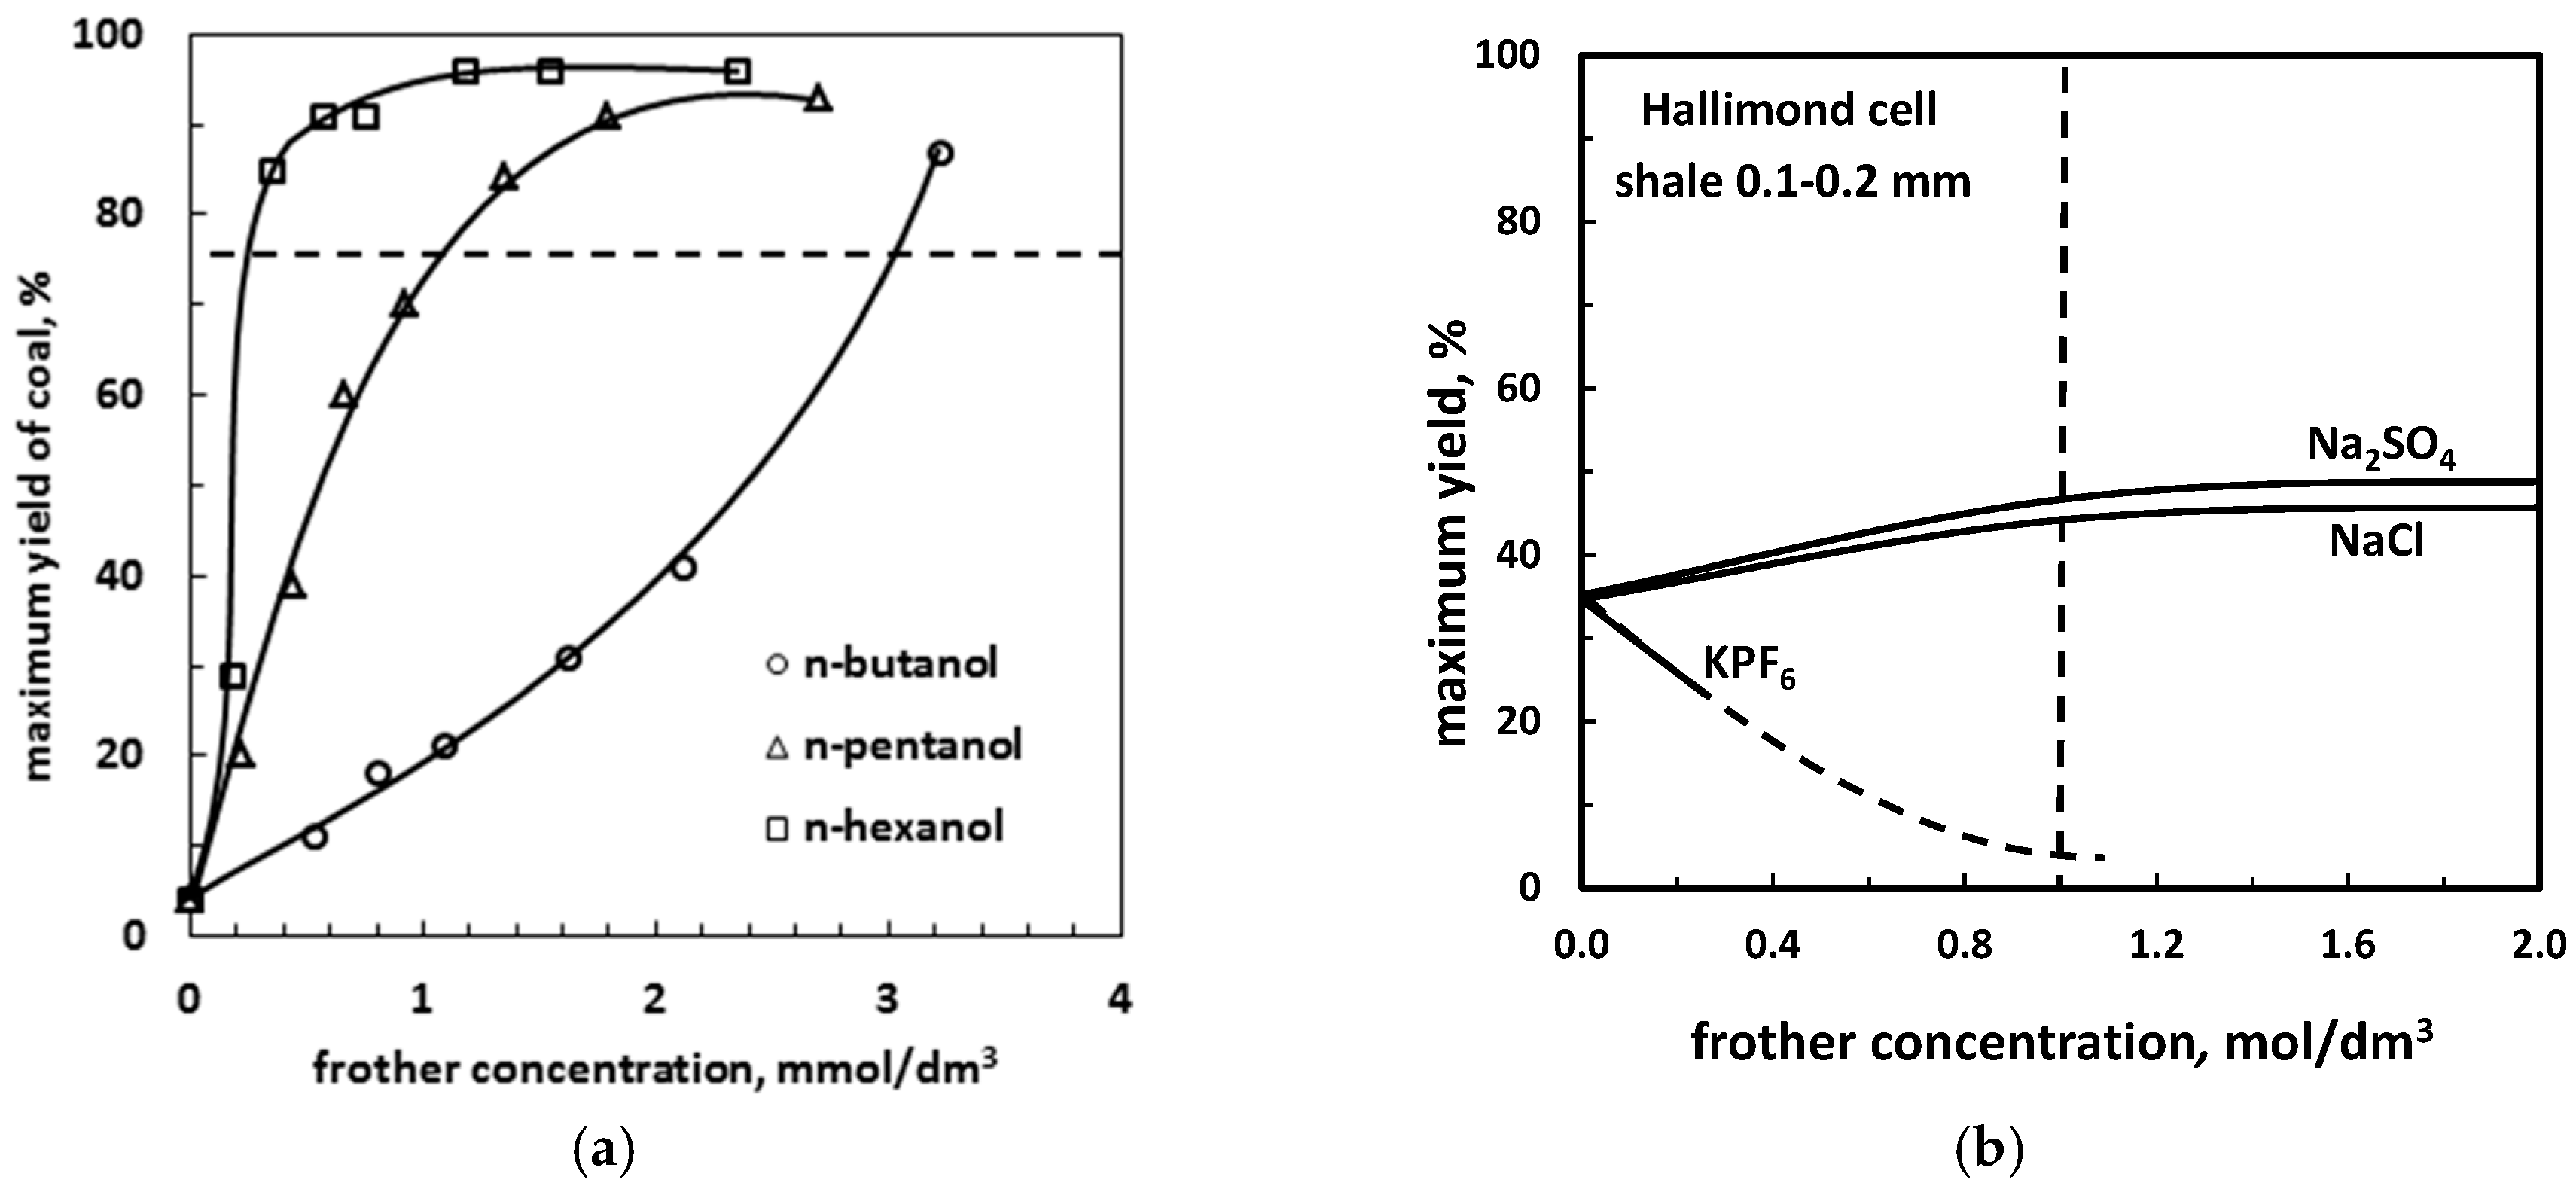
5.2.1. Maximum Flotation Yield versus Frother Concentration. Frother Strength cγ75 and Molar Effectiveness γ1M
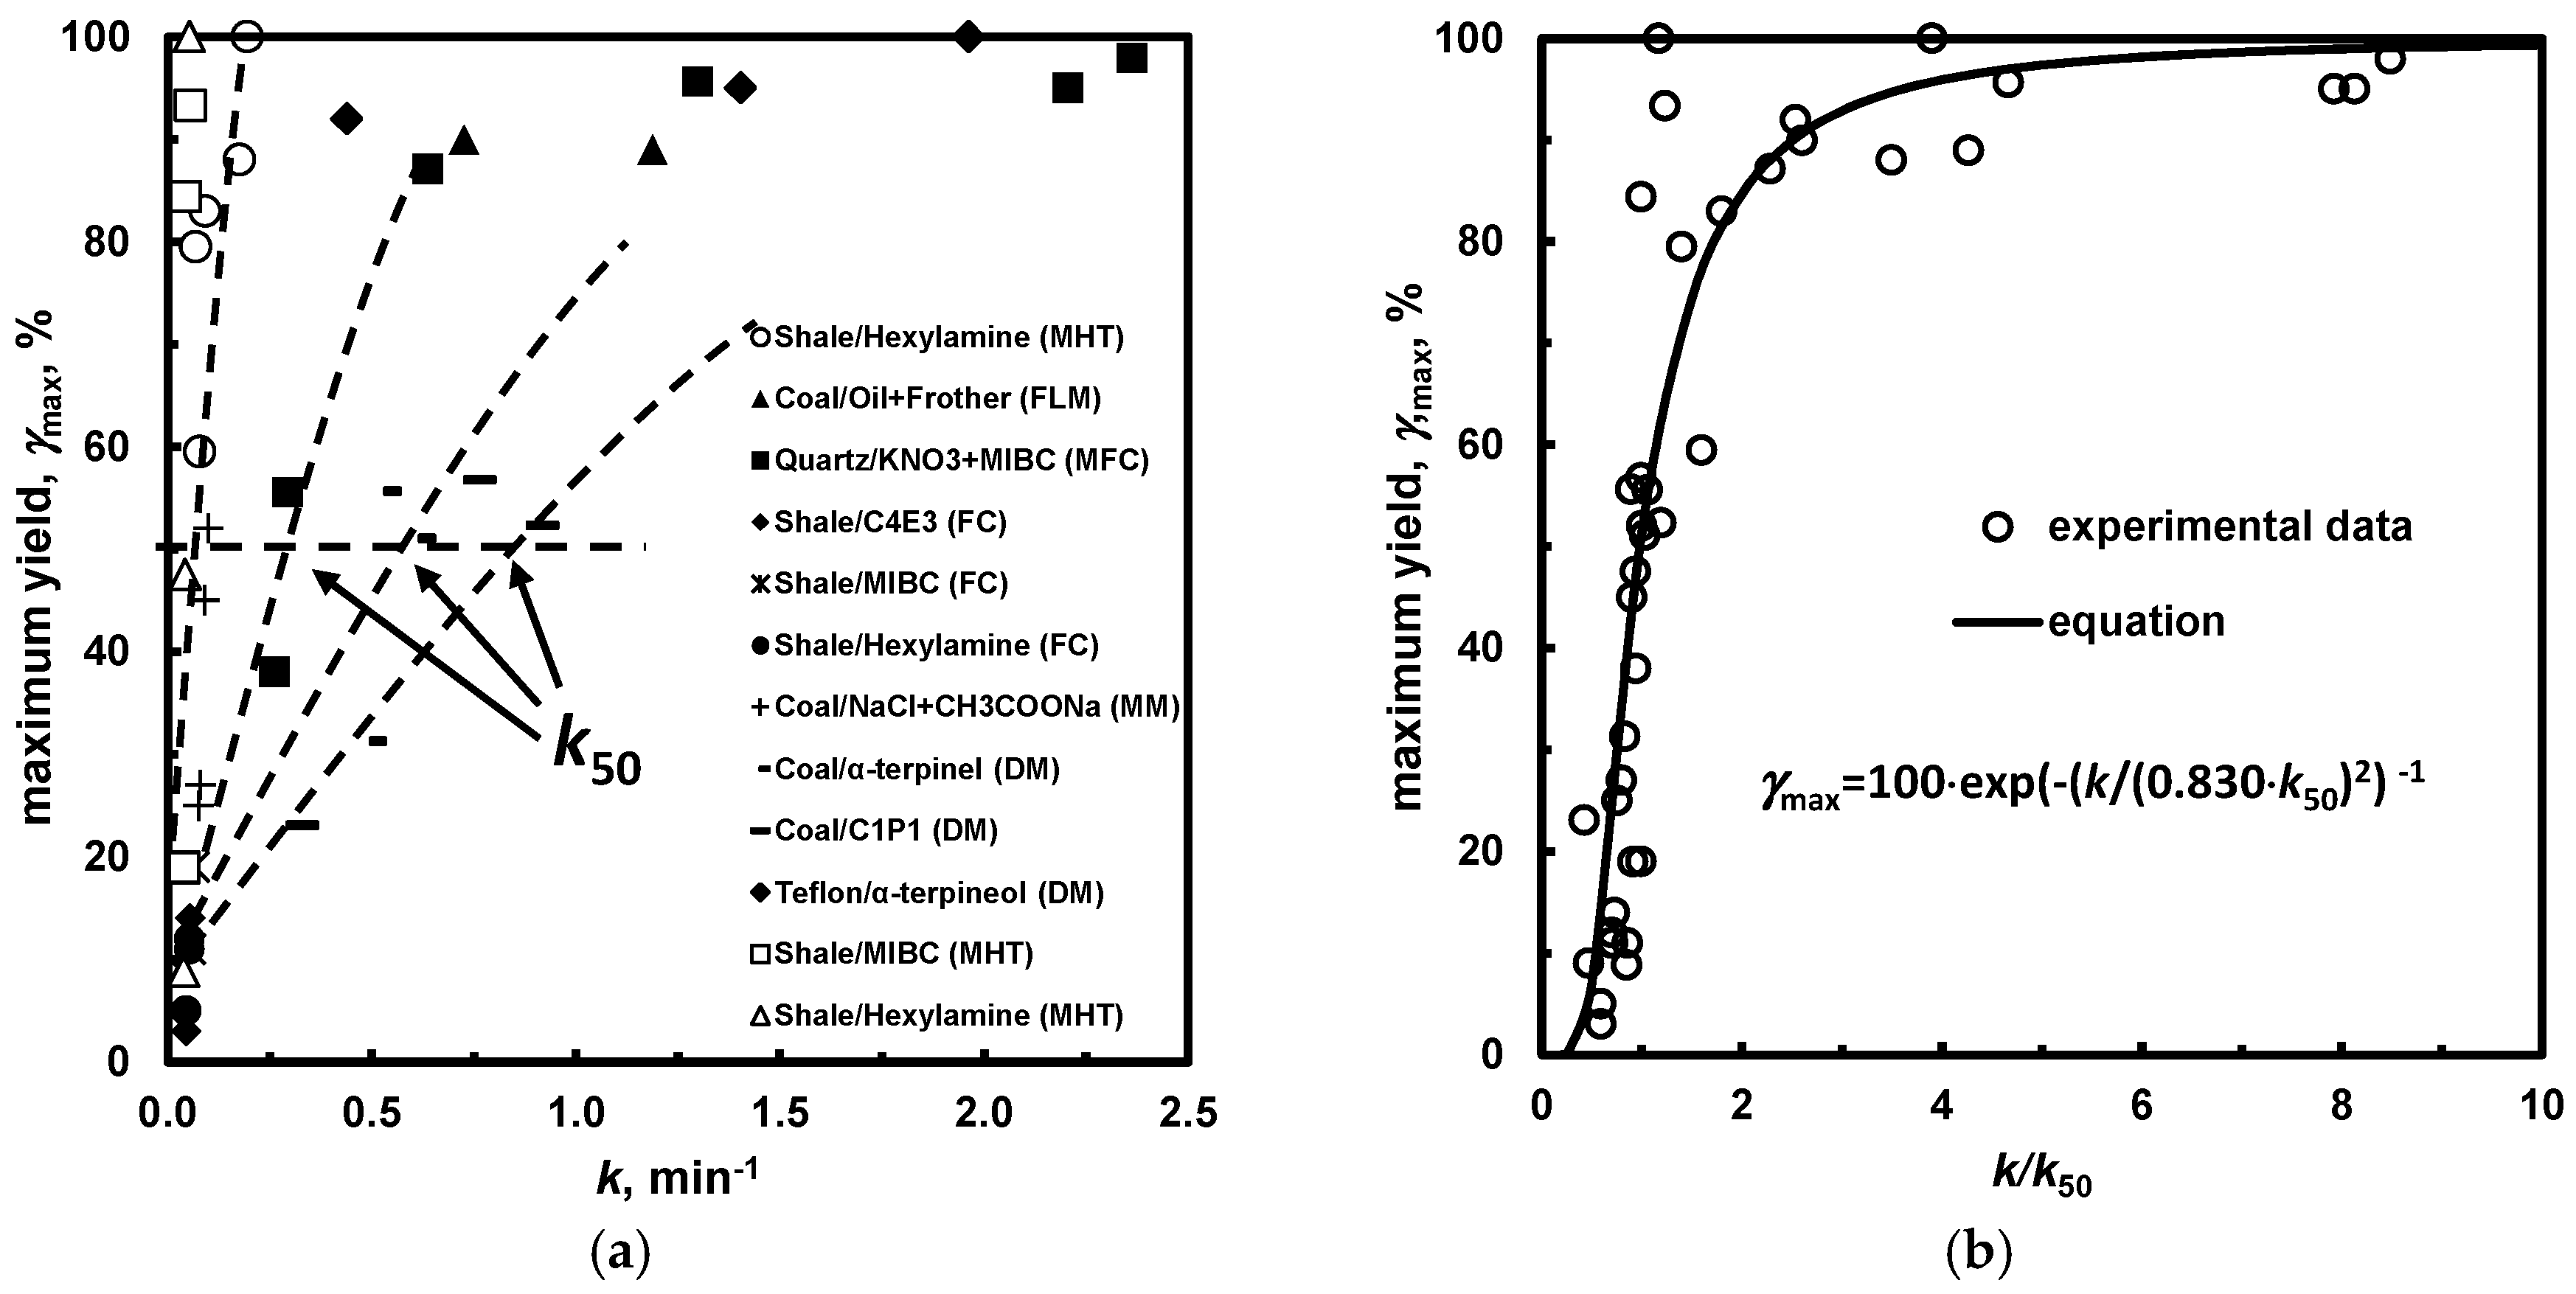
5.2.2. Maximum Yield (Recovery) versus Kinetic Constant, k50
5.2.3. Power P and Selectivity F of Frothers Based on Upgrading Curves
5.3. Two-Numerical Value Classification
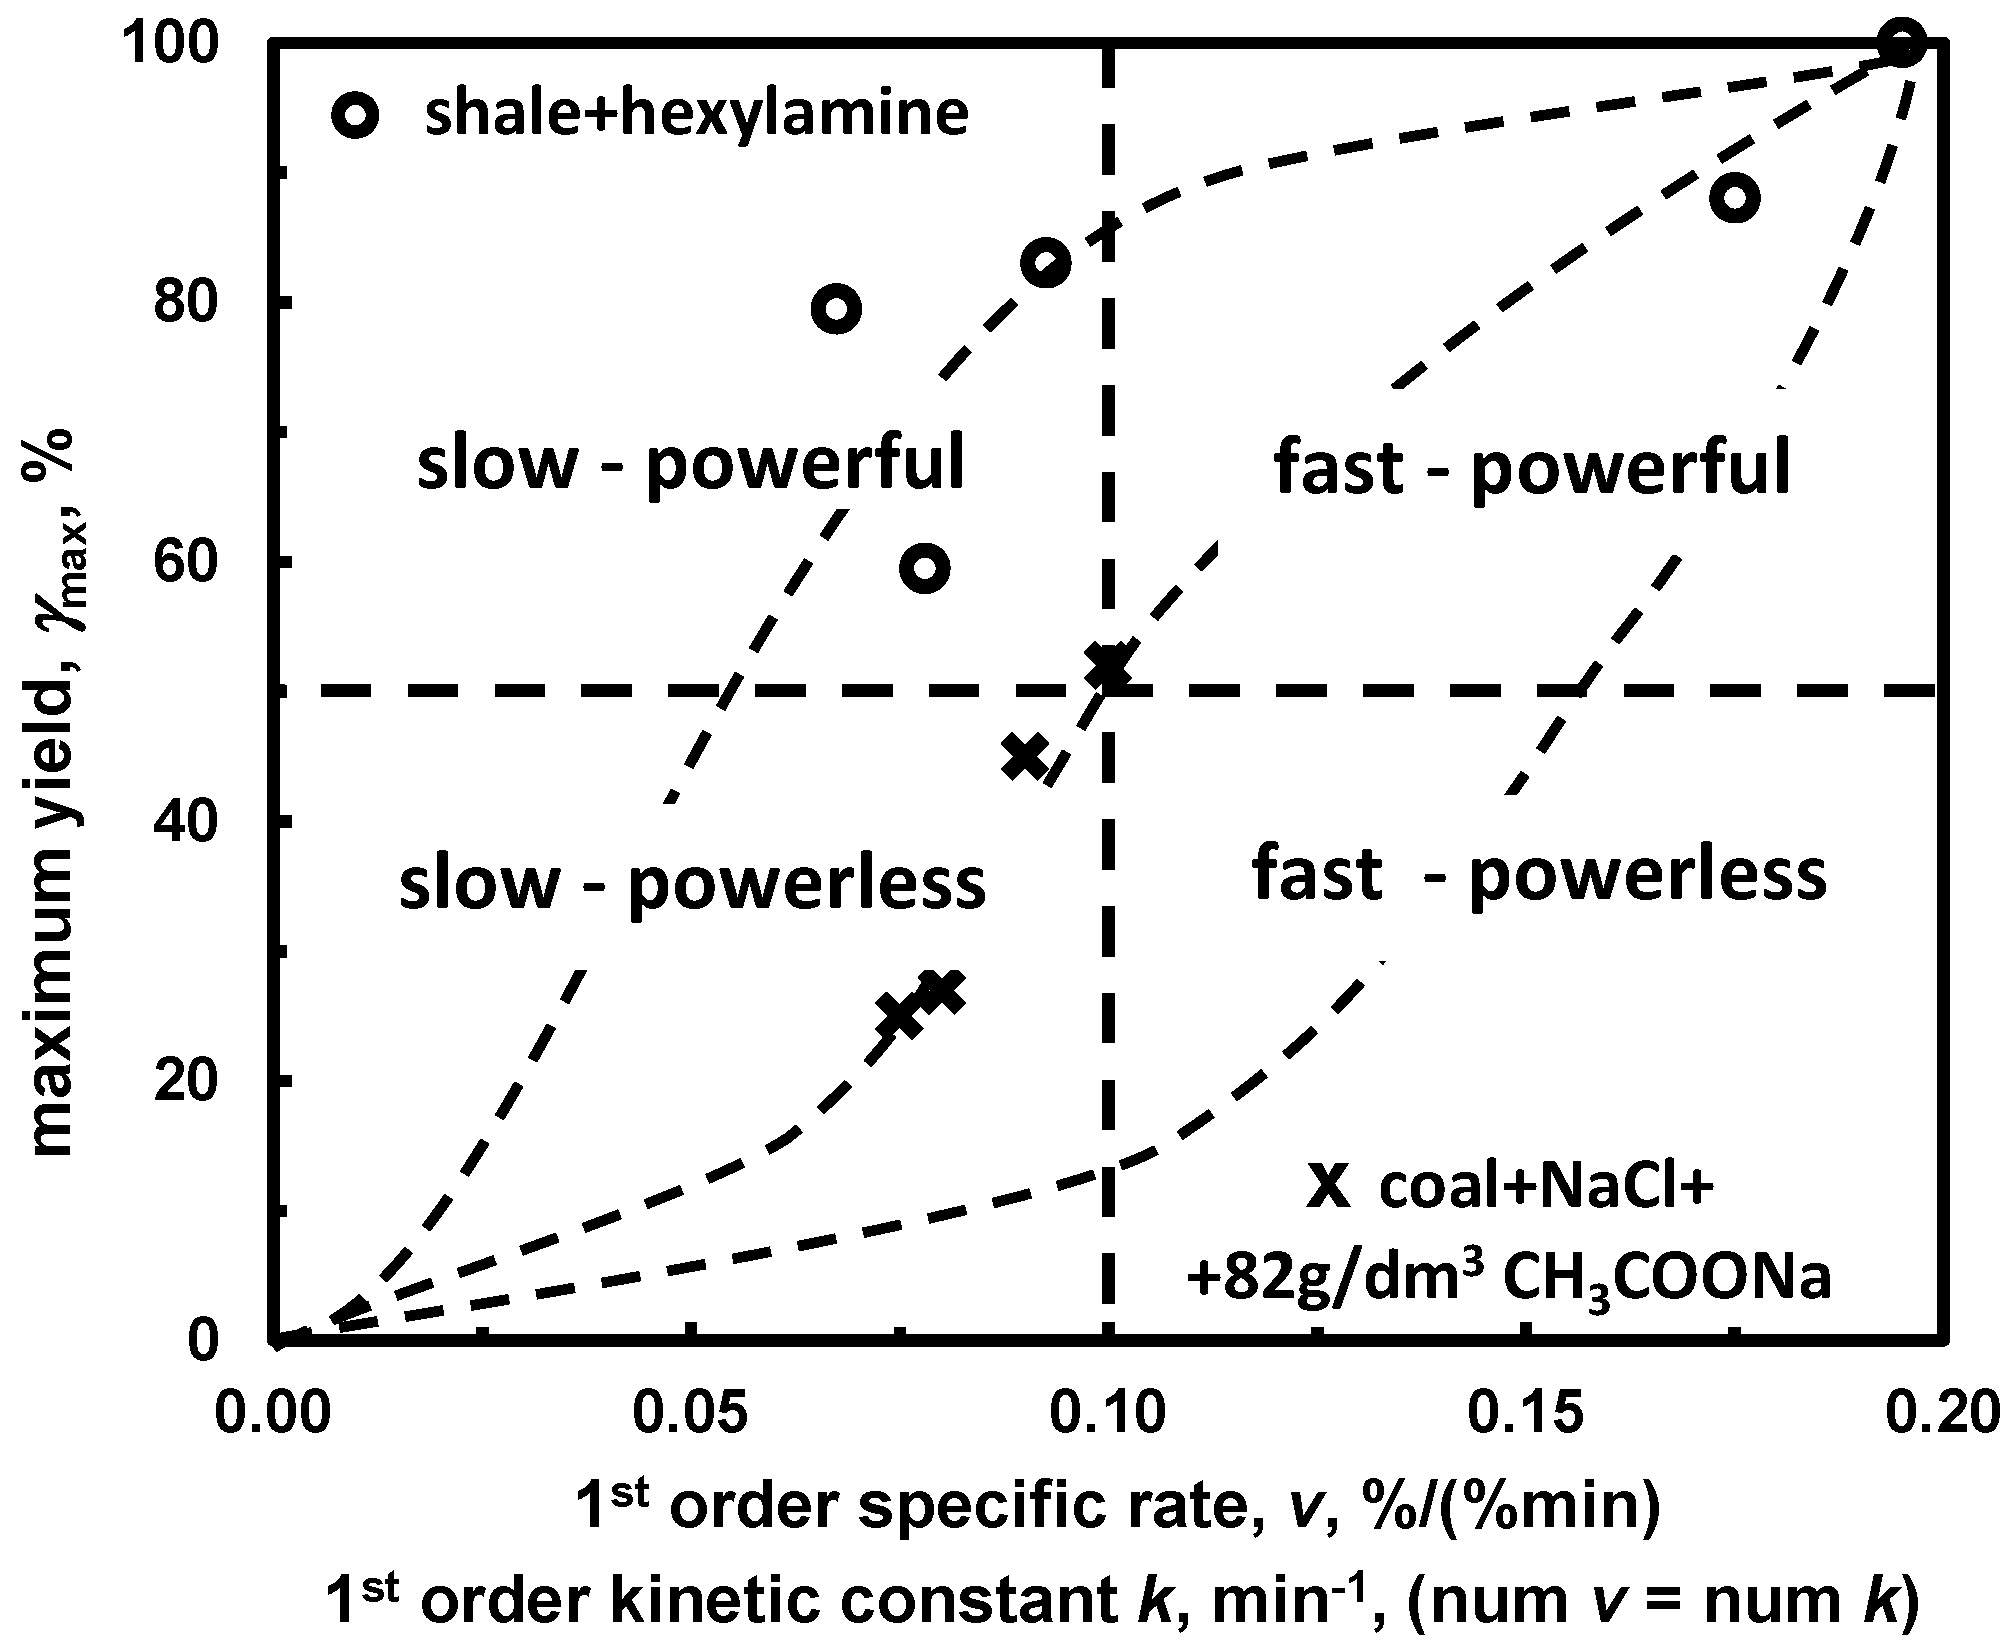
5.3.1. Maximum Yield versus Specific Rate Constant. Slow/Powerful, Fast/Powerful, Slow/Powerless, Fast/Powerless Frothers
5.3.2. Special Trend–Type Classifications Based on Relationship between Selectivity and Other Parameters
5.4. Three-Numerical Value Classification
6. Conclusions
Acknowledgments
Author Contributions
Conflicts of Interest
References
- Czarnecki, J.; Malysa, K.; Pomianowski, A. Dynamic frothability index. J. Colloid Interface Sci. 1982, 86, 570–572. [Google Scholar] [CrossRef]
- Cho, Y.S.; Laskowski, J.S. Effect of flotation frothers on bubble size and foam stability. Int. J. Miner. Process. 2002, 64, 69–80. [Google Scholar] [CrossRef]
- Mobius, D.; Miller, R. Studies in Interface Science. Novel Methods to Study Interfacial Layers; Elsevier Science: Amsterdam, The Netherlands, 2001; Volume 11, pp. 1–521. [Google Scholar]
- Fuerstenau, M.C.; Jameson, G.J.; Yoon, R-H. Froth Flotation: A Century of Innovation; SME Inc.: Littleton, CO, USA, 2007. [Google Scholar]
- Drzymala, J. Mineral Processing. Foundations of Theory and Practice of Minerallurgy, 1st ed.; Oficyna Wydawnicza Politechniki Wroclawskiej: Wroclaw, Poland, 2007. [Google Scholar]
- Kosior, D.; Zawala, J.; Krasowska, M.; Malysa, K. Influence of n-octanol and α-terpineol on thin film stability and bubble attachment to hydrophobic surface. Phys. Chem. Chem. Phys. 2013, 15, 2586–2595. [Google Scholar] [CrossRef] [PubMed]
- Wills, B.A.; Finch, J.A. Wills’ Mineral Processing Technology: An Introduction to the Practical Aspects of Ore Treatment and Mineral Recovery, 8th ed.; Elsevier Ltd.: Amsterdam, The Netherlands, 2016. [Google Scholar]
- Leja, J.; Schulman, J.H. Flotation Theory: Molecular interactions between frothers and collectors at solid-liquid-air interfaces. Trans. AIME 1954, 199, 221–228. [Google Scholar]
- Nguyen, A.; Schulze, H.J. Colloidal Science of Flotation; Surfactant Science Series; Marcel Dekker: New York, NY, USA, 2004; Volume 118. [Google Scholar]
- Kowalczuk, P.B.; Drzymala, J. Some remarks on attachment of a gas bubble to another phase both immersed in a water. Physicochem. Probl. Miner. Process. 2016, 52, 147–154. [Google Scholar] [CrossRef]
- Drzymala, J. Hydrophobicity and collectorless flotation of inorganic materials. Adv. Colloid Interface Sci. 1994, 50, 143–186. [Google Scholar] [CrossRef]
- Kowalczuk, P.B.; Drzymala, J. Contact angle of bubble with an immersed-in-water particle of different materials. Ind. Eng. Chem. Res. 2011, 50, 4207–4211. [Google Scholar] [CrossRef]
- Ozdemir, O. Specific ion effect of chloride salts on collectorless flotation of coal. Physicochem. Probl. Miner. Process. 2013, 49, 511–524. [Google Scholar] [CrossRef]
- Kowalczuk, P.B.; Buluc, B.; Sahbaz, O.; Drzymala, J. In search of an efficient frother for pre-flotation of carbonaceous shale from the Kupferschiefer stratiform copper ore. Physicochem. Probl. Miner. Process. 2014, 50, 835–840. [Google Scholar] [CrossRef]
- Khoshdast, H.; Sam, A. Flotation frothers: Review of their classifications, properties and preparation. Open Miner. Process. J. 2011, 4, 25–44. [Google Scholar] [CrossRef]
- Laskowski, J.S. Testing flotation frothers. Physicochem. Probl. Miner. Process. 2004, 38, 13–22. [Google Scholar]
- Gaudin, A.M. Flotation, 2nd ed.; McGraw-Hill Book Company, Inc.: New York, NY, USA, 1957. [Google Scholar]
- Laskowski, J. Frothers and frothing. In Frothing in Flotation II; Laskowski, J.S., Woodburn, E.T., Eds.; Gordon and Breach: Amsterdam, The Netherlands, 1998; pp. 1–49. [Google Scholar]
- Chain Reaction Cycles (CRC). Handbook of Chemistry AND Physics, 67th ed.; CRC Press: Boca Raton, FL, USA, 1986–1987. [Google Scholar]
- Davies, J.T. A quantitative kinetic theory of emulsion type, I. Physical chemistry of the emulsifying agent, Gas/Liquid and Liquid/Liquid Interface. In Proceedings of the International Congress of Surface Activity, London, UK, 20–31 July 1957; pp. 426–438. [Google Scholar]
- Tanaka, K.; Igarashi, A. Determination of nonionic surfactants. In Handbook of Detergents Part C: Analysis; Waldhoff, H., Spilker, R., Eds.; CRC Press: Boca Raton, FL, USA, 2005; pp. 149–214. [Google Scholar]
- Zhang, W.; Nesset, J.E.; Rao, R.; Finch, J.A. Characterizing frothers through critical coalescence concentration (CCC)95-hydrophile-lipophile balance (HLB) relationship. Minerals 2012, 2, 208–227. [Google Scholar] [CrossRef]
- Dudenkov, S.V.; Galikov, A.A. Theory and Practice of Application of Flotation Reagents; Nedra: Moscow, Russia, 1969. [Google Scholar]
- Bulatovic, S.M. Handbook of Flotation Reagents: Chemistry, Theory and Practice; Elsevier Science: Amsterdam, The Netherlands, 2007. [Google Scholar]
- Crozier, R.D. Properties of Flotation Froths: Flotation—Theory, Reagent and Ore Testing; Pergamon: New York, NY, USA, 1992. [Google Scholar]
- Yaws, C.L.; Hopper, J.R.; Sheth, S.D.; Han, M.; Pike, R.W. Solubility and Henry’s law constant for alcohols in water. Waste Manag. 1997, 17, 541–547. [Google Scholar] [CrossRef]
- Li, J.; Perdue, E.M. Physicochemical properties of selected monterpenes. Environ. Int. 1998, 24, 353–358. [Google Scholar] [CrossRef]
- Wang, S. Flotation Reagents: Applied Surface Chemistry on Minerals Flotation and Energy Resources Beneficiation; Springer: Singapore, 2016. [Google Scholar]
- Technical Data & Safety Bulletin. 2017. Available online: http://www.monumentchemical.com/documents/MIBC-Data_and_Safety_Sheet.pdf (accessed on 1 November 2017).
- Inoue, T.; Ohmura, H.; Murata, D. Cloud point temperature of polyoxyethylene–type nonionic surfactants and their mixtures. J. Colloid Interface Sci. 2003, 258, 374–382. [Google Scholar] [CrossRef]
- Lekki, J.; Laskowski, J. A new concept of frothing in flotation systems and general classification of flotation frothers. In Proceedings of the XIth International Mineral Processing Congress, Cagliari, Italy, 20–26 April 1975; pp. 429–448. [Google Scholar]
- Pugh, R.J.; Weissenborn, P.; Paulson, O. Flotation in inorganic electrolytes: The relationship between recovery of hydrophobic particles, surface tension, bubble coalescence and gas solubility. Int. J. Miner. Process. 1997, 51, 125–138. [Google Scholar] [CrossRef]
- DeWitt, C.C.; Roper, E.E. The surface relations of potassium ethyl xanthate and pine oil. J. Am. Chem. Soc. 1932, 54, 444–455. [Google Scholar] [CrossRef]
- Tuckermann, R. Surface tension of aqueous solutions of water-soluble organic and inorganic compounds. Atmos. Environ. 2007, 41, 6265–6275. [Google Scholar] [CrossRef]
- Tamaki, K. The surface activity of the lower homologues of n-alkylammonium chlorides in aqueous solutions. Effect of hydrophobic hydration. Colloid Polyme. Sci. 1974, 252, 547–550. [Google Scholar]
- Lyklema, J. Fundamentals of Interface and Colloid Science; Academic Press: London, UK, 1993; Volume 1. [Google Scholar]
- Burczyk, B.; Sokolowski, A. Relations between chemical structure and surface activity—1. Synthesis and properties of aqueous solutions of acetals formed from aliphatic aldehydes and monoalkyl ethers of ethylene glycols. Tenside Deterg. 1978, 15, 68–71. [Google Scholar]
- Aston, J.R.; Drummond, C.J.; Scales, F.J.; Healy, T.W. Frother chemistry in fine coal processing. In Proceedings of the 2nd Australian Coal Preparation Congress, Brisbane, Australia, 10–14 October 1983; Whitmore, R.I., Ed.; Westminster Press: Brisbane, Australia, 1983; pp. 148–160. [Google Scholar]
- Takata, Y.; Tagashira, H.; Hyono, A.; Ohshima, H. Effect of counterion and configurational entropy on the surface tension of aqueous solution of ionic surfactants and electrolyte mixtures. Entropy 2010, 12, 983–995. [Google Scholar] [CrossRef]
- Warszynski, P.W.; Barzyk, W.; Lunkenheimer, K.; Fruhner, H. Surface tension and surface potential of Na n-dodecyl sulfate at the air−solution interface: Model and experiment. J. Phys. Chem. B 1998, 102, 10948–10957. [Google Scholar] [CrossRef]
- Karraker, K.A.; Radke, C.J. Disjoining pressure, zeta potential and surface tension of aqueous non-ionic surfactant/electrolyte solution: Theory and comparison to experiment. Adv. Colloid Interface Sci. 2002, 96, 231–264. [Google Scholar] [CrossRef]
- Kowalczuk, P.B. Determination of critical coalescence concentration and bubble size for surfactants used as flotation frothers. Ind. Eng. Chem. Res. 2013, 52, 11752–11757. [Google Scholar] [CrossRef]
- Kowalczuk, P.B.; Zawala, J.; Drzymala, J. Concentration at the minimum bubble velocity (CMV) for various types of flotation frothers. Minerals 2017, 7, 118. [Google Scholar] [CrossRef]
- Sweet, C.; van Hoogstraten, J.; Harris, M.; Laskowski, J.S. The effect of frothers on bubble size and frothability of aqueous solutions. In Processing of the Complex Ores, Proceedings of the 2nd UBC-McGill International Symposium, Montreal, QC, Canada, 17–19 August 1997; Finch, J.A., Rao, S.R., Holubec, I., Eds.; Metallurgical Society of CIM: Montreal, QC, Canada, 1997; pp. 235–245. [Google Scholar]
- Laskowski, J.S.; Tlhone, T.; Williams, P.; Ding, K. Fundamental properties of the polyoxypropylene alkyl ether flotation frothers. Int. J. Miner. Process. 2003, 72, 289–299. [Google Scholar] [CrossRef]
- Gupta, A.K.; Banerjee, P.K.; Mishra, A.; Satish, P.; Pradip. Effect of alcohol and polyglycol ether frothers on foam stability, bubble size and coal flotation. Int. J. Miner. Process. 2007, 82, 126–137. [Google Scholar] [CrossRef]
- Finch, J.; Zhang, W. Frother function-structure relationship: Dependence of CCC95 on HLB and H-ratio. Miner. Eng. 2014, 61, 1–8. [Google Scholar] [CrossRef]
- Azgomi, F.; Gomez, C.O.; Finch, J.A. Characterizing frothers using gas hold-up. Can. Metall. Q. 2007, 46, 237–242. [Google Scholar] [CrossRef]
- Tan, Y.H.; Finch, J.A. Frother structure–property relationship: Effect of alkyl chain length in alcohols and polyglycol ethers on bubble rise velocity. Miner. Eng. 2016, 95, 14–20. [Google Scholar] [CrossRef]
- Malysa, E.; Malysa, K.; Czarnecki, J. A method of comparison of the frothing and collecting properties of frothers. Colloids Surfaces 1987, 23, 29–39. [Google Scholar] [CrossRef]
- Khoshdast, H.; Mirshekari, S.; Zahab-Nazouri, A. A model for predicting dynamic frothability index value for dual-frother blends. J. Min. Environ. 2015, 6, 119–124. [Google Scholar] [CrossRef]
- Kowalczuk, P.B.; Siedlarz, M.; Szczerkowska, S.; Wojcik, M. Facile determination of foamability index of non-ionic and cationic frothers and its effect on flotation of quartz. Sep. Sci. Technol. 2017, 38, 1–9. [Google Scholar] [CrossRef]
- Tan, Y.H.; Rafiei, A.A.; Elmahdy, A.; Finch, J.A. Bubble size, gas holdup and bubble velocity profile of some alcohols and commercial frothers. Int. J. Miner. Process. 2013, 119, 1–5. [Google Scholar] [CrossRef]
- Barbian, N.; Ventura-Medina, E.; Cilliers, J.J. Dynamic froth stability in froth flotation. Miner. Eng. 2003, 16, 1111–1116. [Google Scholar] [CrossRef]
- Smolska, M.; Ratajczak, T. Flotacja mechaniczna łupka miedzionośnego we flotowniku Hallimonda w roztworach soli podwyzszających i obnizajacych napiecie powierzchniowe wody. In Lupek Miedzionosny III; Kowalczuk, P.B., Drzymala, J., Eds.; WGGG PWr: Wroclaw, Poland, 2017; pp. 97–102. (In Polish) [Google Scholar]
- Kowalczuk, P.B.; Mroczko, D.; Drzymala, J. Influence of frother type and dose on collectorless flotation of copper-bearing shale in a flotation column. Physicochem. Probl. Miner. Process. 2015, 51, 547–558. [Google Scholar] [CrossRef]
- Kowalczuk, P.B.; Zawala, J.; Kosior, D.; Drzymala, J.; Malysa, K. Three-phase contact formation and flotation of highly hydrophobic polytetrafluoroethylene in the presence of increased dose of frothers. Ind. Eng. Chem. Res. 2016, 55, 839–843. [Google Scholar] [CrossRef]
- Lyklema, J. Fundamentals of Interface and Colloid Science: Liquid-Liquid Interfaces; Academic Press: London, UK, 2000; Volume III. [Google Scholar]
- Deschenes, L.; Lyklema, J.; St-Germain, F. Entropy of aqueous surfaces. Application to polymeric Langmuir films. Adv. Colloid Interface Sci. 2017, 247, 149–162. [Google Scholar] [CrossRef] [PubMed]
- Okur, H.I.; Chen, Y.; Wilkins, D.M.; Roke, S. The Jones-Ray effect reinterpreted: Surface tension minima of low ionic strength electrolyte solutions are caused by electric field induced water-water correlations. Chem. Phys. Lett. 2017, 684, 433–442. [Google Scholar] [CrossRef]
- Lynch, A.J.; Watt, J.S.; Finch, J.A.; Harbort, G.E. History of flotation technology. In Froth Flotation: A Century of Innovation; Fuerstenau, M.C., Jameson, G.J., Yoon, R.-H., Eds.; SMME Inc.: Littleton, CO, USA, 2007. [Google Scholar]
- Ratajczak, T.; Drzymala, J. Flotacja Solna; Oficyna Wydawnicza Politechniki Wrocławskiej: Wroclaw, Poland, 2003. (In Polish) [Google Scholar]
- Grabowski, B.; Drzymala, J. Graphite flotation in the presence of sodium acetate. Ann. UMCS Chem. 2008, 6, 58–72. [Google Scholar] [CrossRef]
- Lipniarski, M.; Ratajczak, T.; Drzymała, J. Weryfikacja hipotez o roli soli we flotacji na przykładzie węgla kamiennego w wodnych roztworach NaCl I KPF6. In Proceedings of the III Polski Kongres Gorniczy, Mineralurgia I Wykorzystanie Surowcow Mineralnych, Wroclaw, Poland, 14–16 September 2015; Drzymała, J., Kowalczuk, P.B., Eds.; WGGG PWr: Wroclaw, Poland, 2015; pp. 35–39. (In Polish). [Google Scholar]
- Weissenborn, P.K.; Pugh, R.J. Surface tension of aqueous solutions of electrolytes: Relationship with ion hydration, oxygen solubility, and bubble coalescence. J. Colloid Interface Sci. 1996, 184, 550–563. [Google Scholar] [CrossRef] [PubMed]
- Paulson, O.; Pugh, R.J. Flotation of inherently hydrophobic particles in aqueous solutions of inorganic electrolytes. Langmuir 1996, 12, 4808–4813. [Google Scholar] [CrossRef]
- Drzymala, J.; Ratajczak, T.; Kowalczuk, P.B. Kinetic separation curves based on process rate considerations. Physicochem. Probl. Miner. Process. 2017, 53, 983–995. [Google Scholar] [CrossRef]
- Drzymala, J.; Stodulski, M. Moc i kineza heksyloaminy we flotacji lupka miedzionosnego. In Lupek Miedzionosny III; Kowalczuk, P.B., Drzymala, J., Eds.; WGGG PWr: Wroclaw, Poland, 2017; pp. 167–171. (In Polish) [Google Scholar]
- Szajowska, J.; Wejman, K.; Kowalczuk, P.B. Froth flotation of shale and quartz the in Hallimonda tube. In Kupferschiefer; Kowalczuk, P.B., Drzymala, J., Eds.; WGGG: Wroclaw, Poland, 2014; pp. 91–97. (In Polish) [Google Scholar]
- Kudlaty, T. Maximum Size of Floating Particles of Copper-Bearing Shale in the Presence of Frothers. Bachelor’s Thesis, Wroclaw University of Science and Technology, Wroclaw, Poland, January 2016. (In Polish). [Google Scholar]
- Merta, P.; Drzymala, J. Influence of sodium chloride and sodium acetate on flotation of anthracite coal as a model substance rich in kerogen. In Kupferschiefer II; Kowalczuk, P.B., Drzymala, J., Eds.; WGGG PWR: Wroclaw, Poland, 2016; pp. 195–200. (In Polish) [Google Scholar]
- Kowalczuk, P.B.; Zawala, J. A relation between time of the three-phase contact formation and flotation kinetics of naturally hydrophobic solids. Colloids Surfaces A Phys. Eng. Asp. 2016, 506, 371–377. [Google Scholar] [CrossRef]
- Kalinowski, K.; Kaula, R. Verification of flotation kinetics model for triangular distribution of density function of floatabilities of coal particles. Arch. Min. Sci. 2013, 58, 1279–1287. [Google Scholar] [CrossRef]
- Chipfunhu, D.; Zanina, M.; Grano, S. Flotation behaviour of fine particles with respect to contact angle. Chem. Eng. Res. Des. 2012, 90, 26–32. [Google Scholar] [CrossRef]
- Janicki, M.; Bartkowicz, L.; Zakrecki, B.; Kowalczuk, P.B. Collectorless coal flotation in the presence of foaming agents. In Proceedings of the III Polish Mining Congress, Minerallurgy and Utilization of Mineral Resources, Wroclaw, Poland, 14–16 September 2015; Drzymala, J., Kowalczuk, P.B., Eds.; WGGG PWR: Wroclaw, Poland, 2015; pp. 52–60. (In Polish). [Google Scholar]
- Kowalczuk, P.B.; Drzymala, J. Selectivity and power of frothers in copper ore flotation. Physicochem. Probl. Miner. Process. 2017, 53, 515–523. [Google Scholar] [CrossRef]
- Fuerstenau, D.W. Coal Surface Control for Advanced Fine Coal Flotation; Final Report DOE/PC/88878-T12; University of California: Berkeley, CA, USA, July 1991. [Google Scholar]
- Drzymala, J. Atlas of upgrading curves used in separation and mineral science and technology. Part I. Physicochem. Probl. Miner. Process. 2006, 40, 19–29. [Google Scholar]
- Drzymala, J.; Ahmed, H.A.M. Mathematical equations for approximation of separation results using the Fuerstenau upgrading curves. Int. J. Miner. Process. 2005, 76, 55–65. [Google Scholar] [CrossRef]
- Raghavan, V. On the Gibbs Triangle. J. Phase. Equilib. Diff. 2008, 29, 213–215. [Google Scholar] [CrossRef]


| System | Classification | Details |
|---|---|---|
| Pure state | (a) organic, inorganic (elemental composition) | Table 2 |
| (b) alcohol, non-alcohol (chemical structure) | Table 3 | |
| (c) solid, liquid, gas (state of pure frother) | ||
| (d) hydrophilic-lipophilic balance (HLB) *1 | Table 4 | |
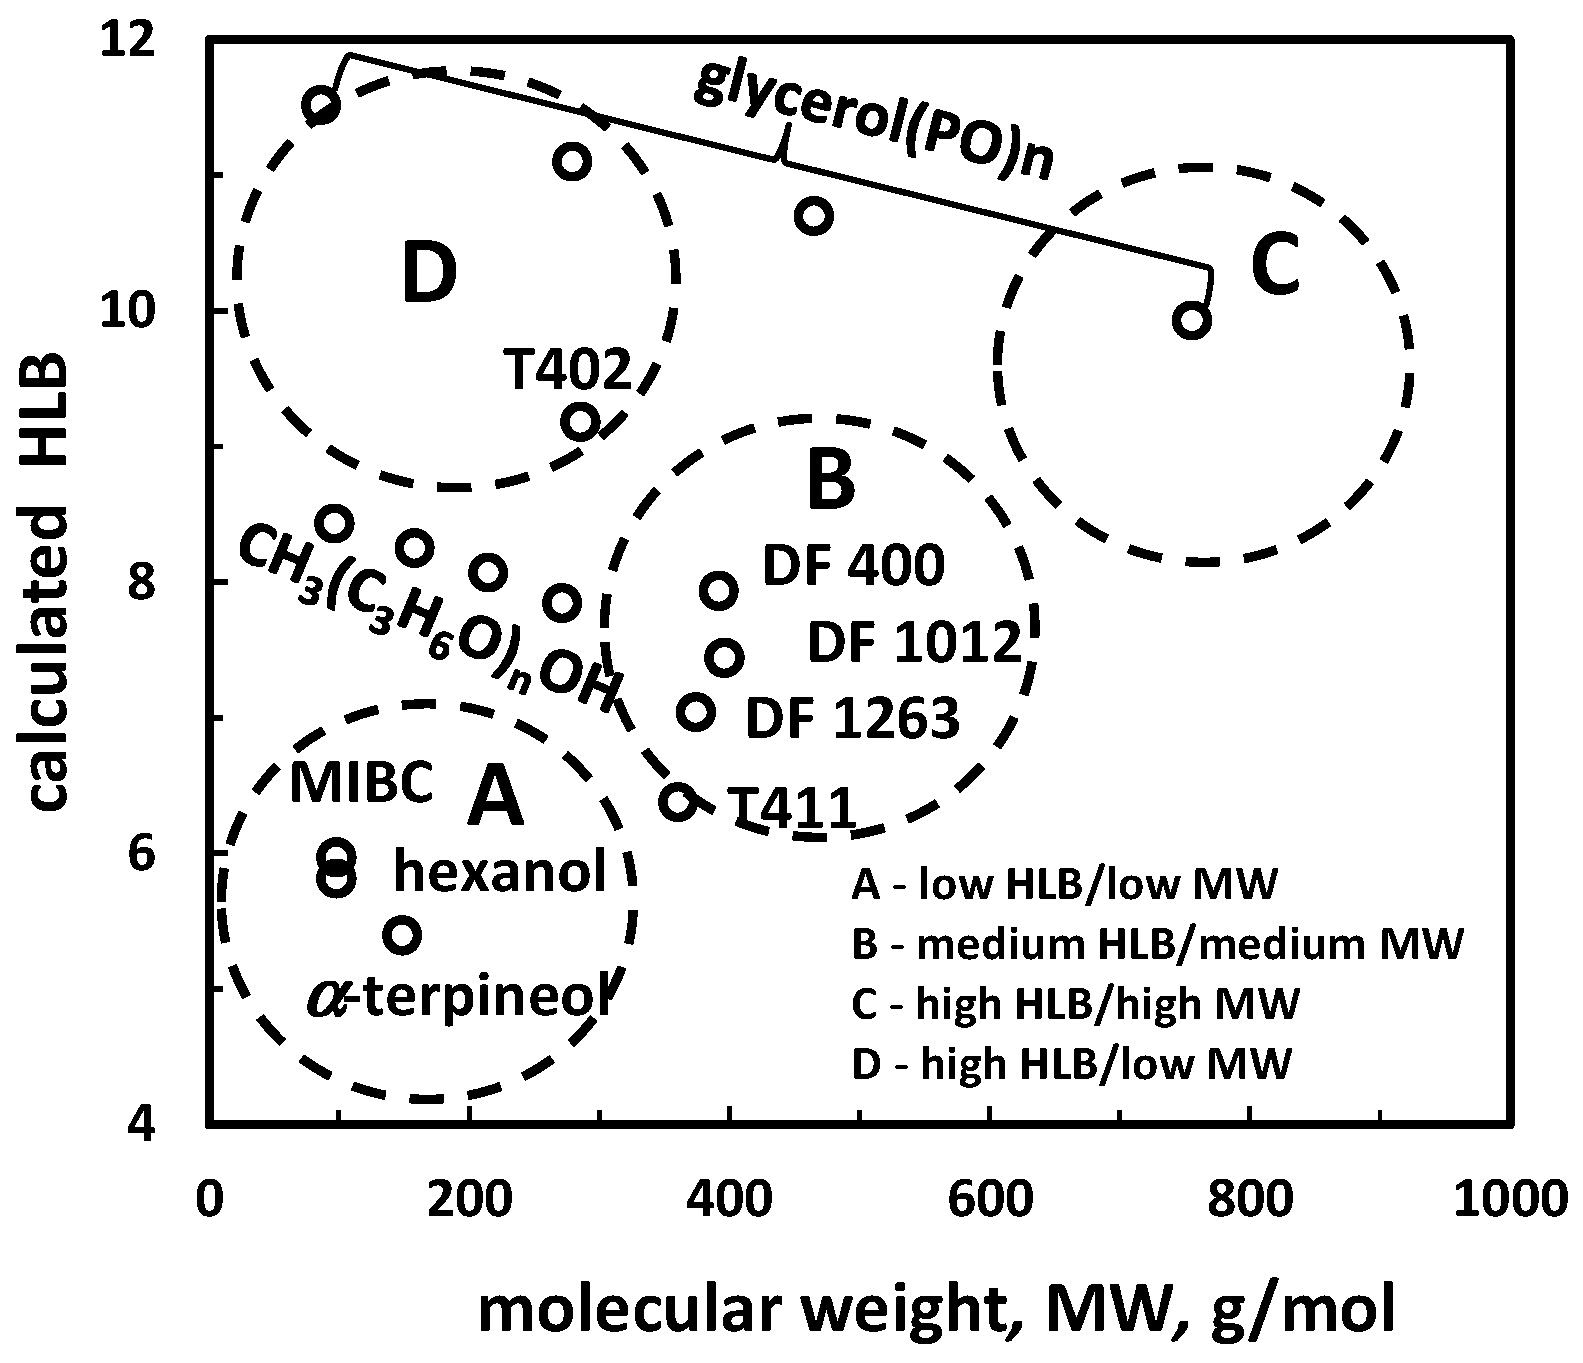
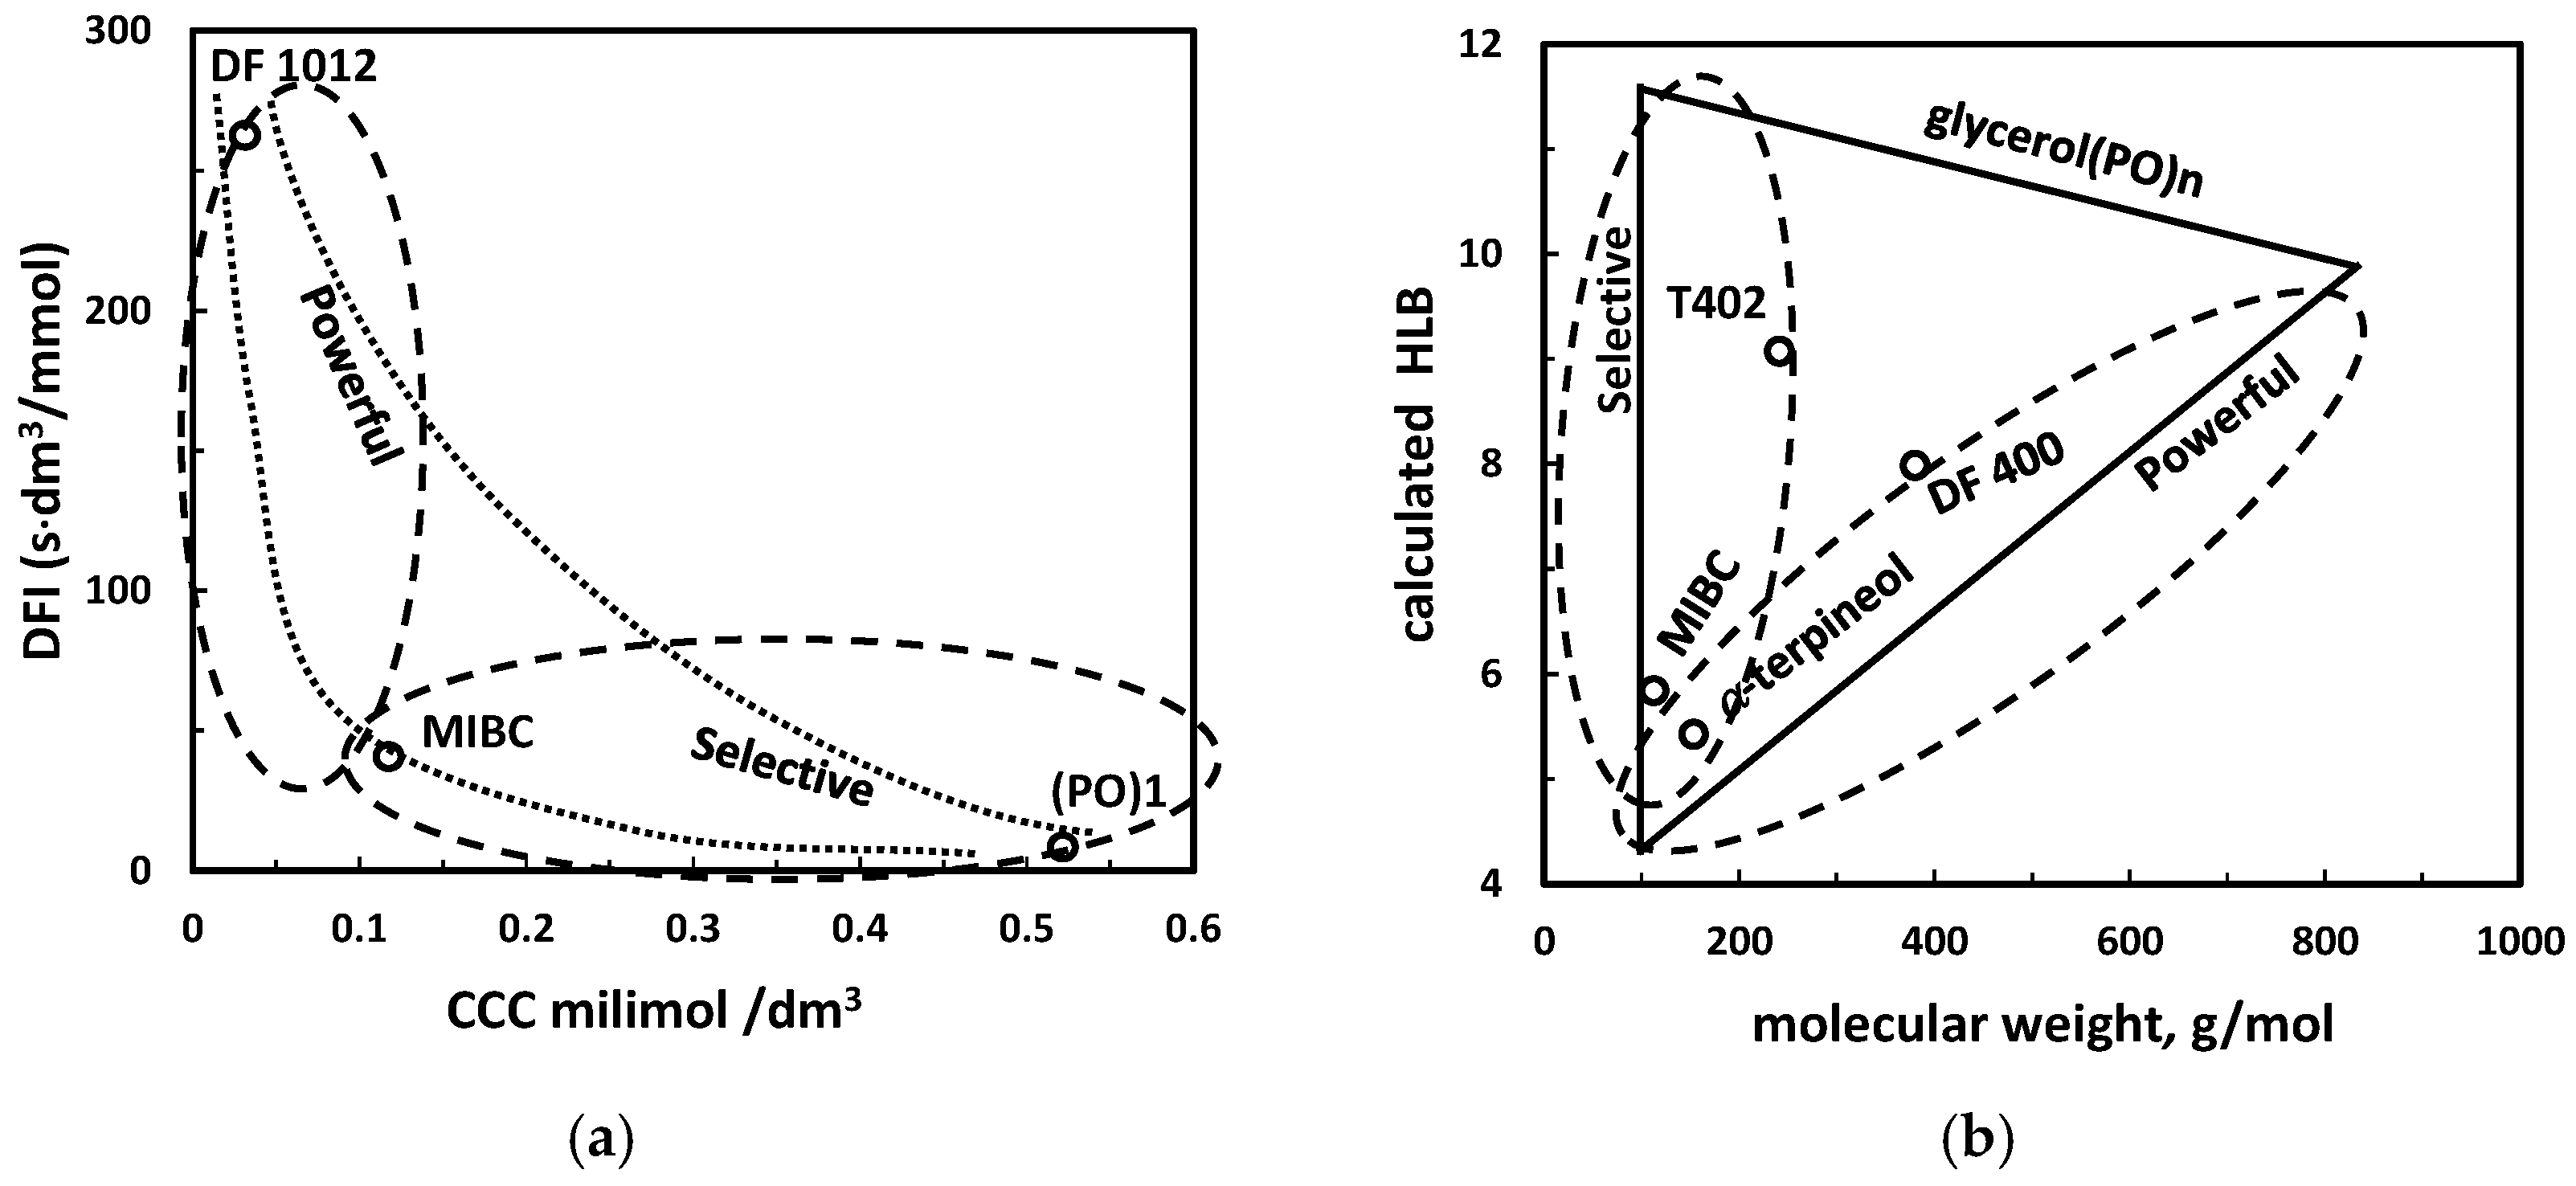
| (e) HLB vs. molecular weight (MW) *2 | Figure 1 | |
| Aqueous solutions | (a) acidic, neutral, alkaline (pH sensitivity) | Table 5 |
| (b) solubility *1 | Table 6 | |
| (c) cloud point *1 | Table 7 | |
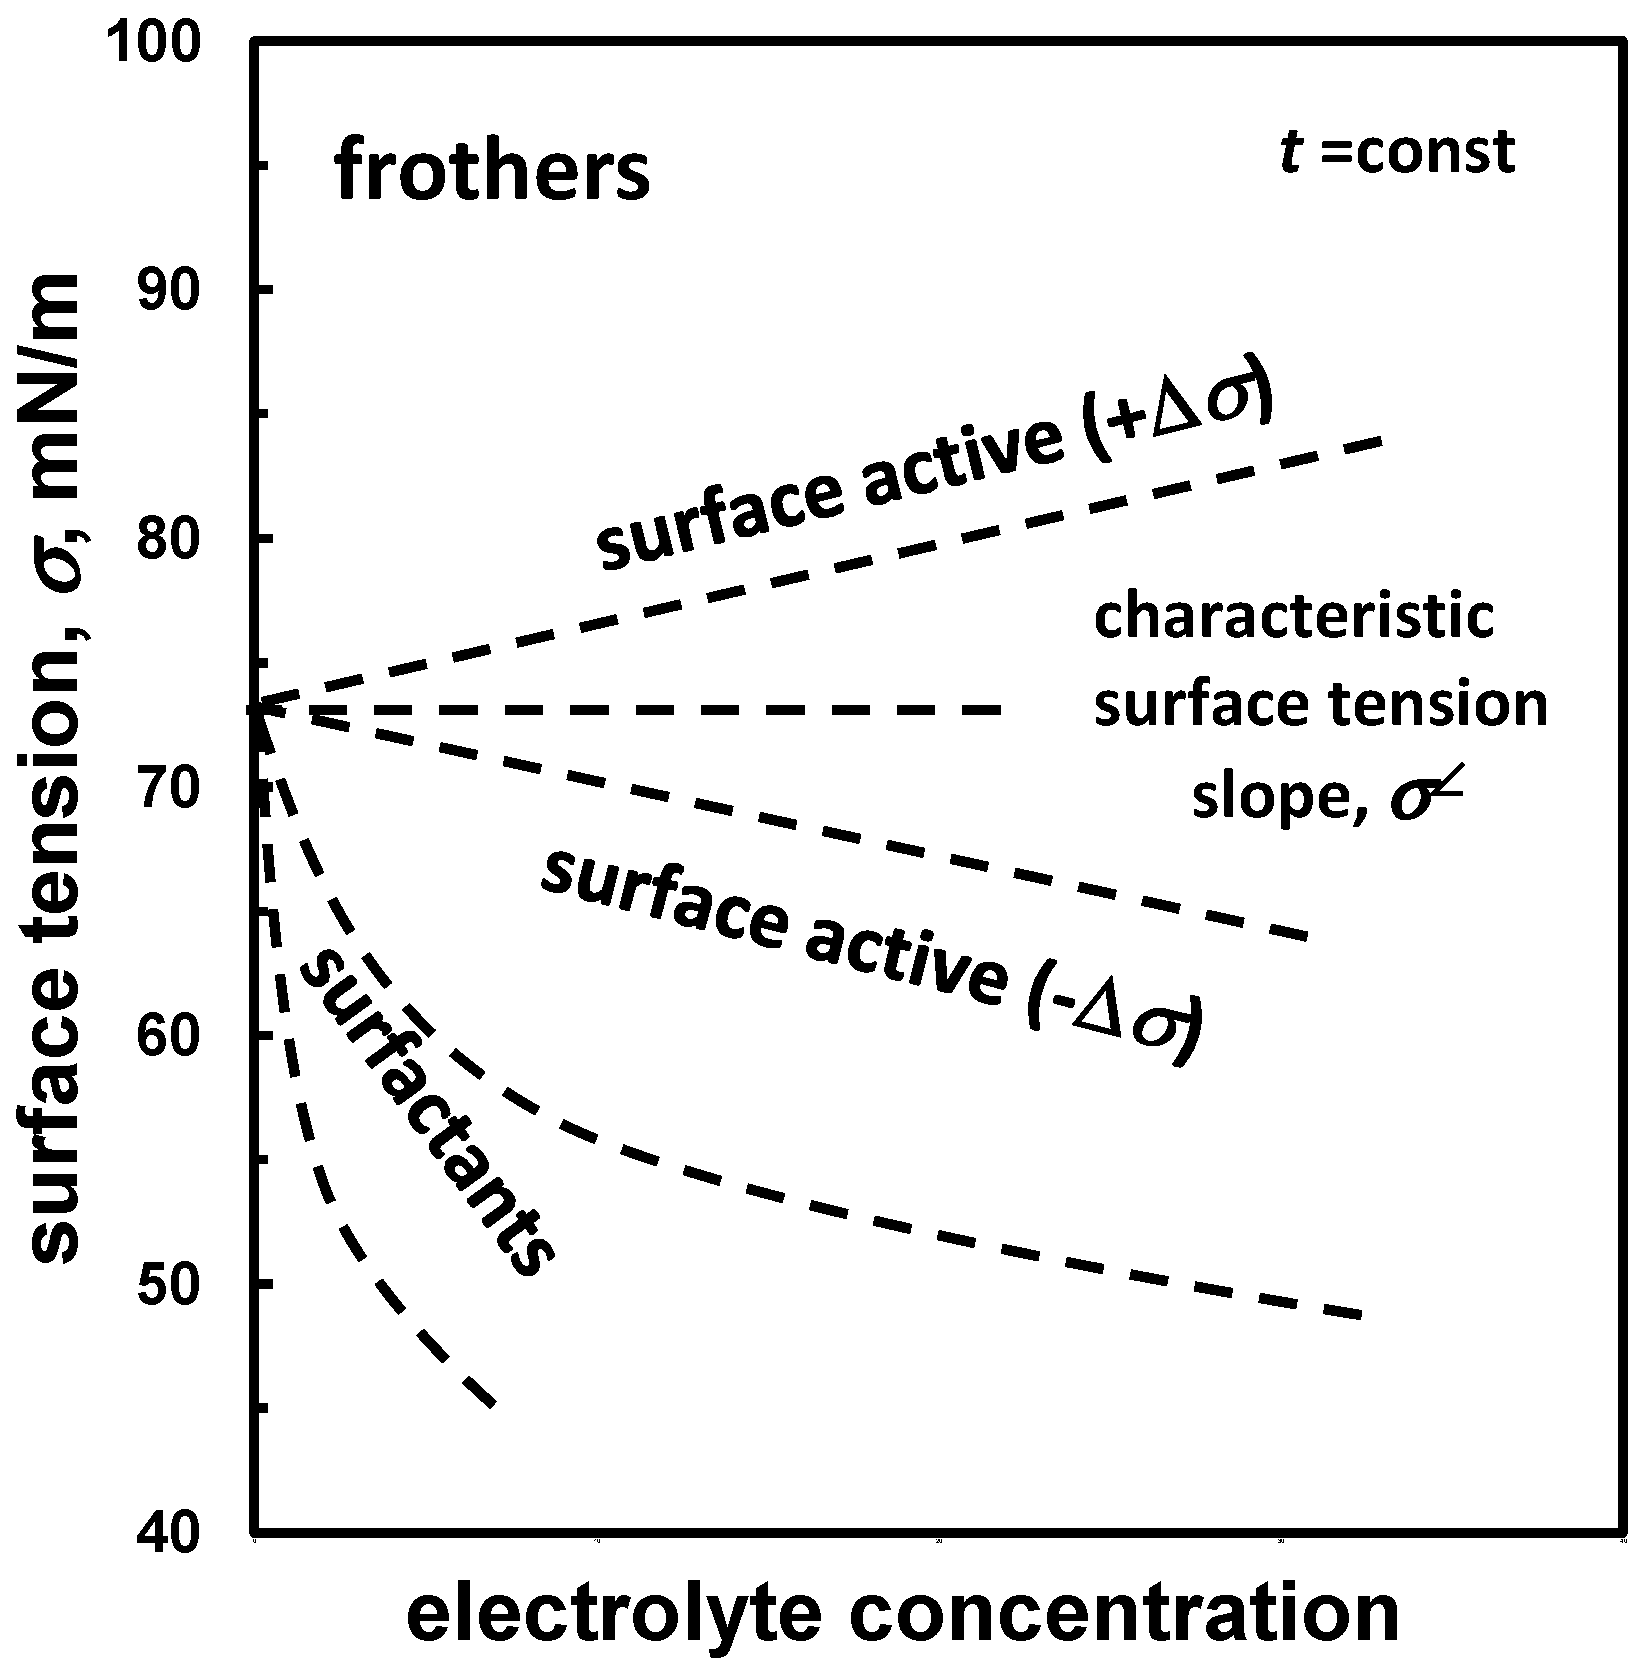
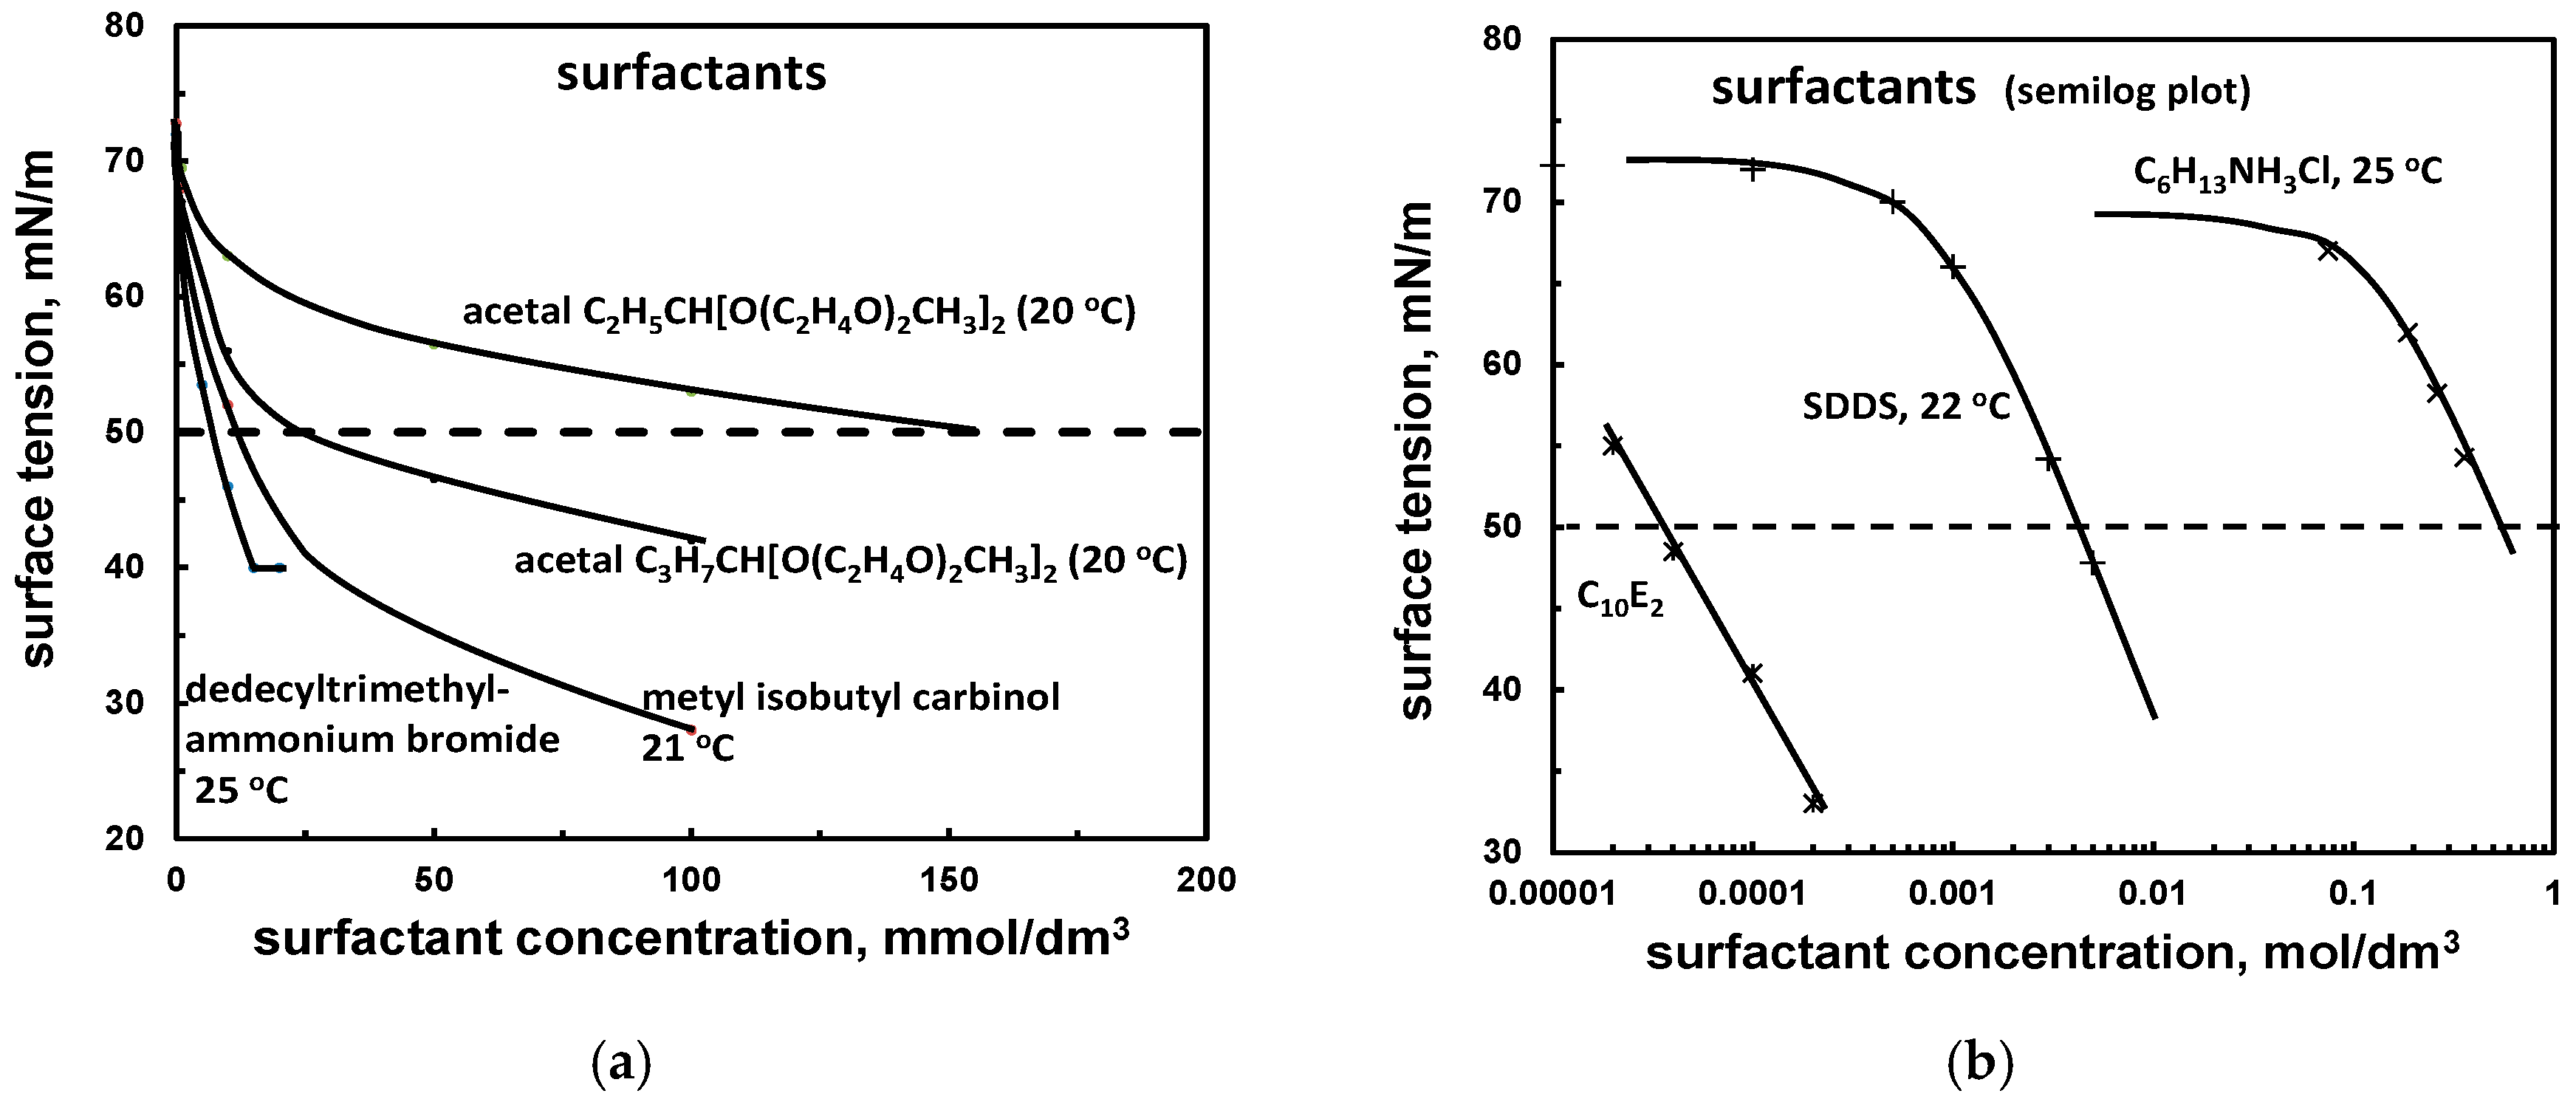
| Aqueous solution/gas system | (a) surface active, surfactant (surface tension vs. concentration) | Table 8, Figure 2 |
| (b) surface tension slope *1 | Tables 9 and 10, Figures 3 and 4 | |
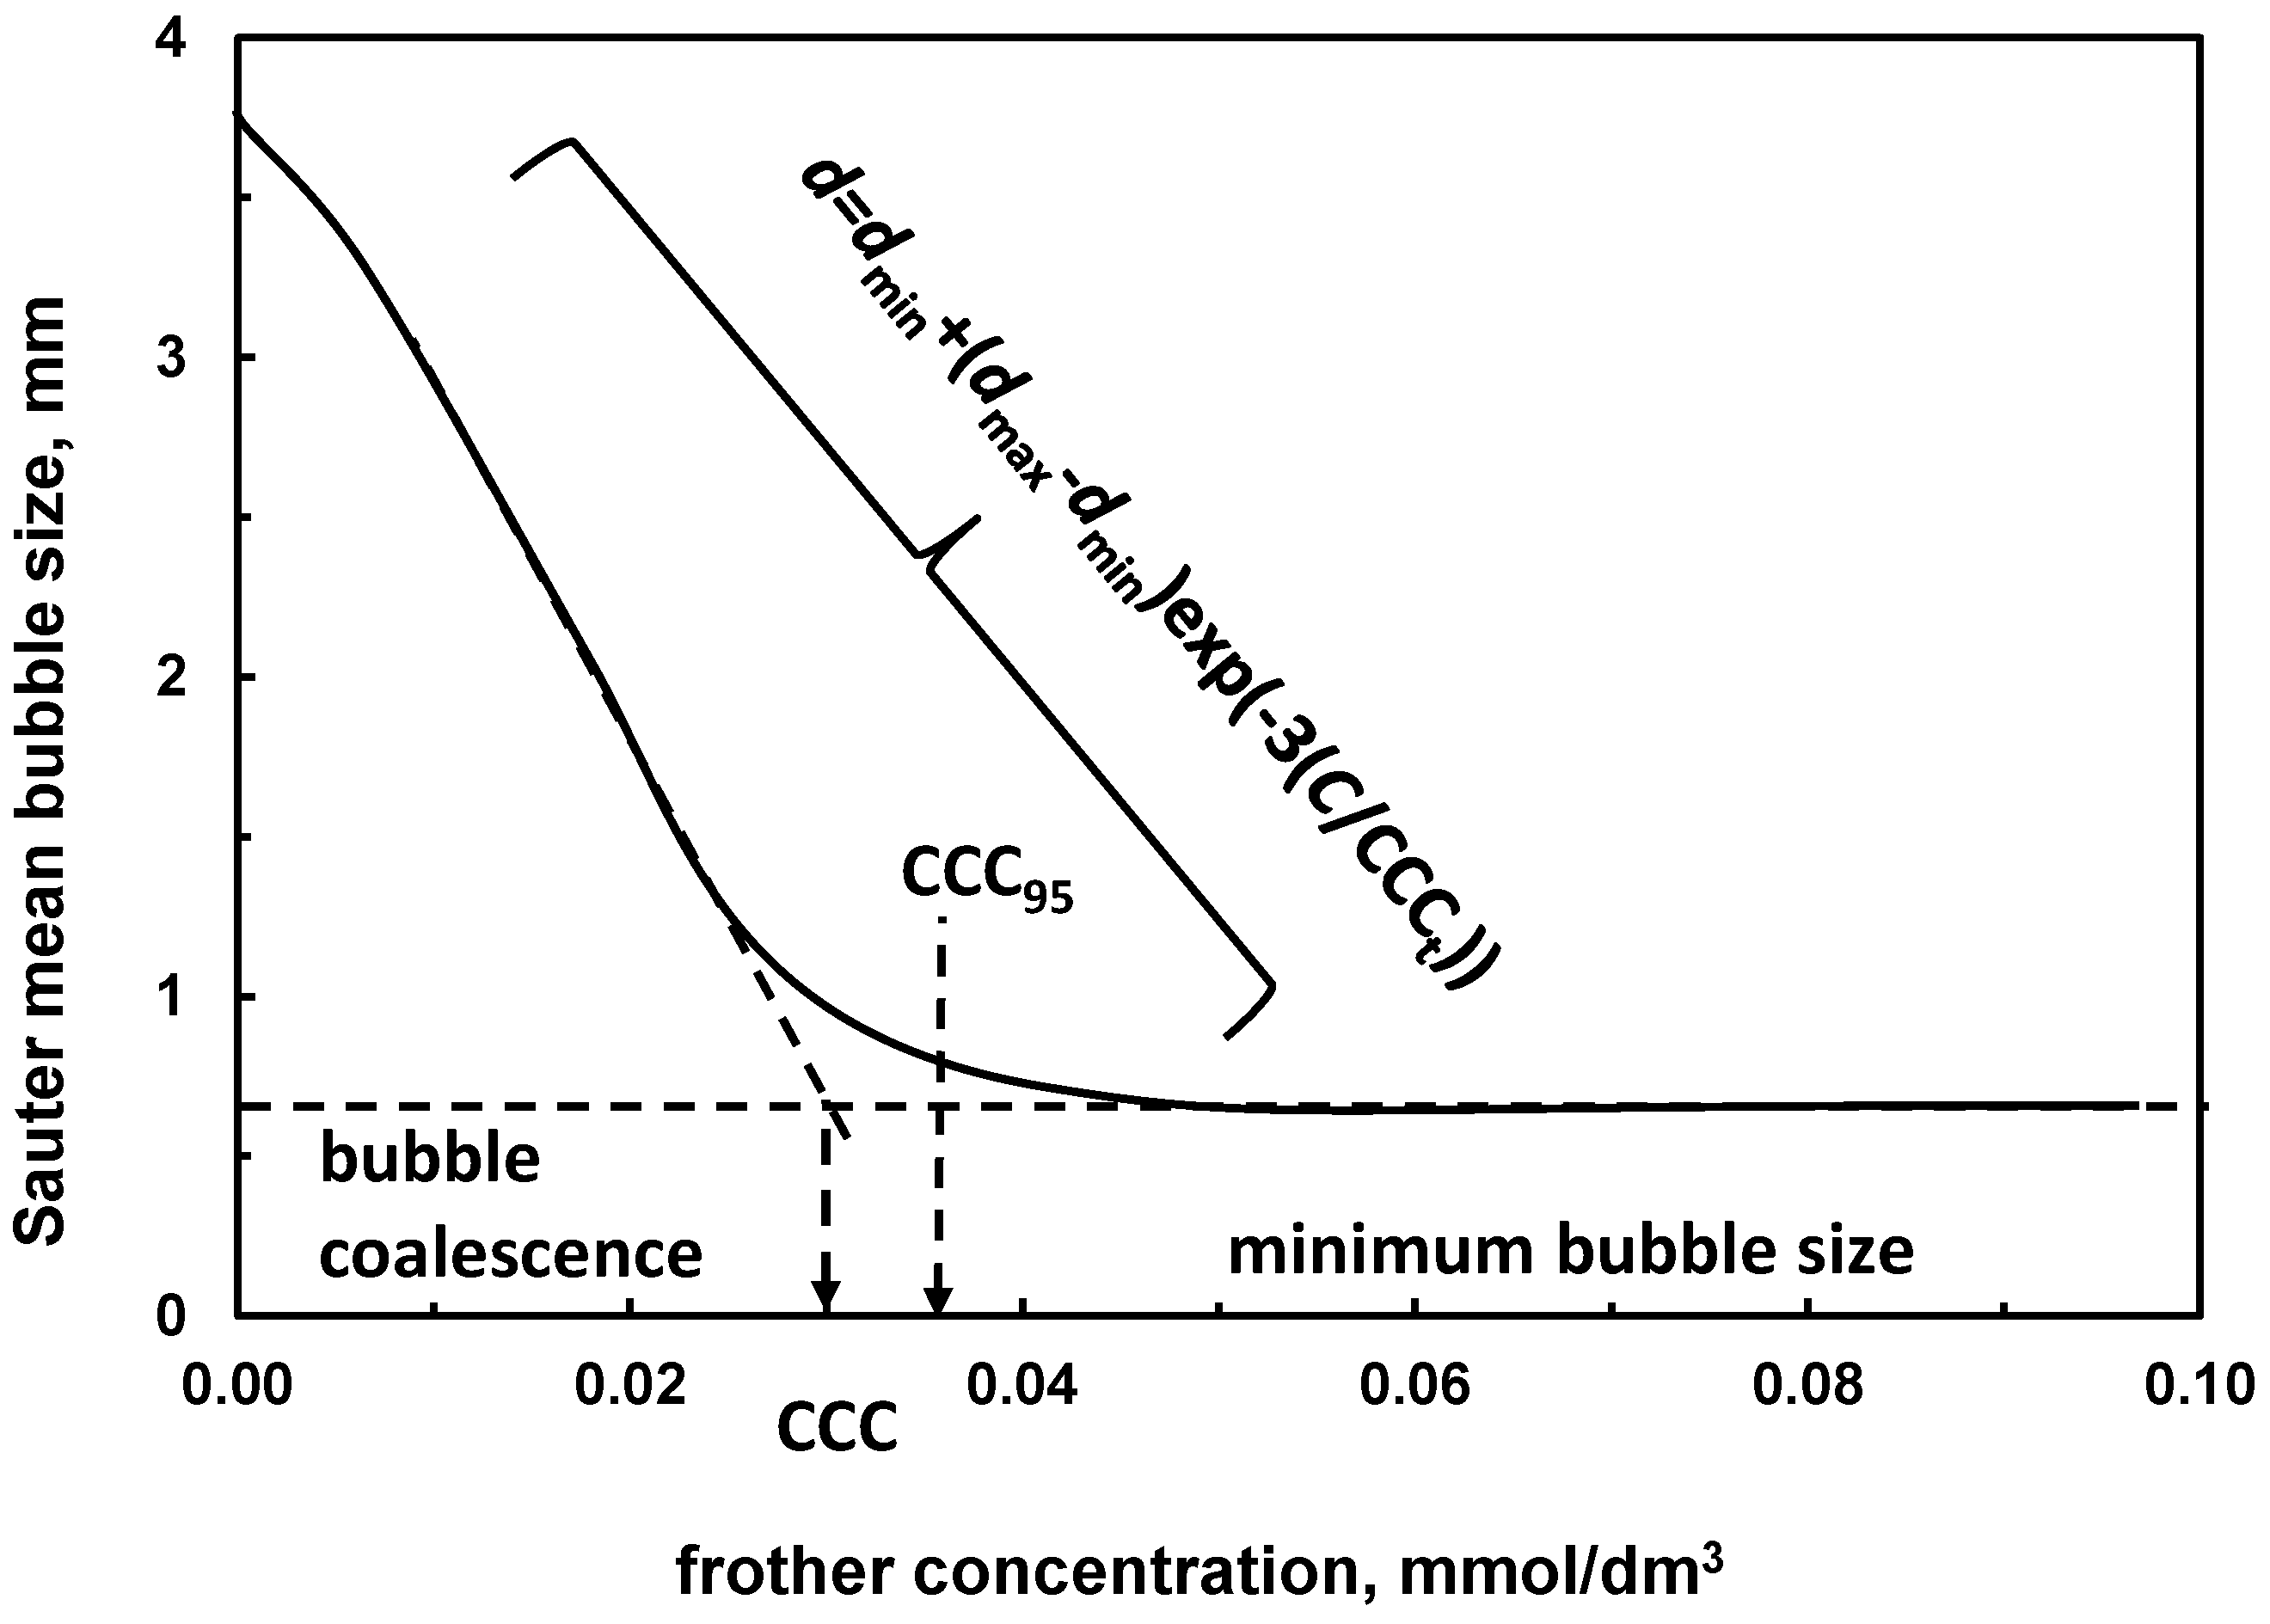
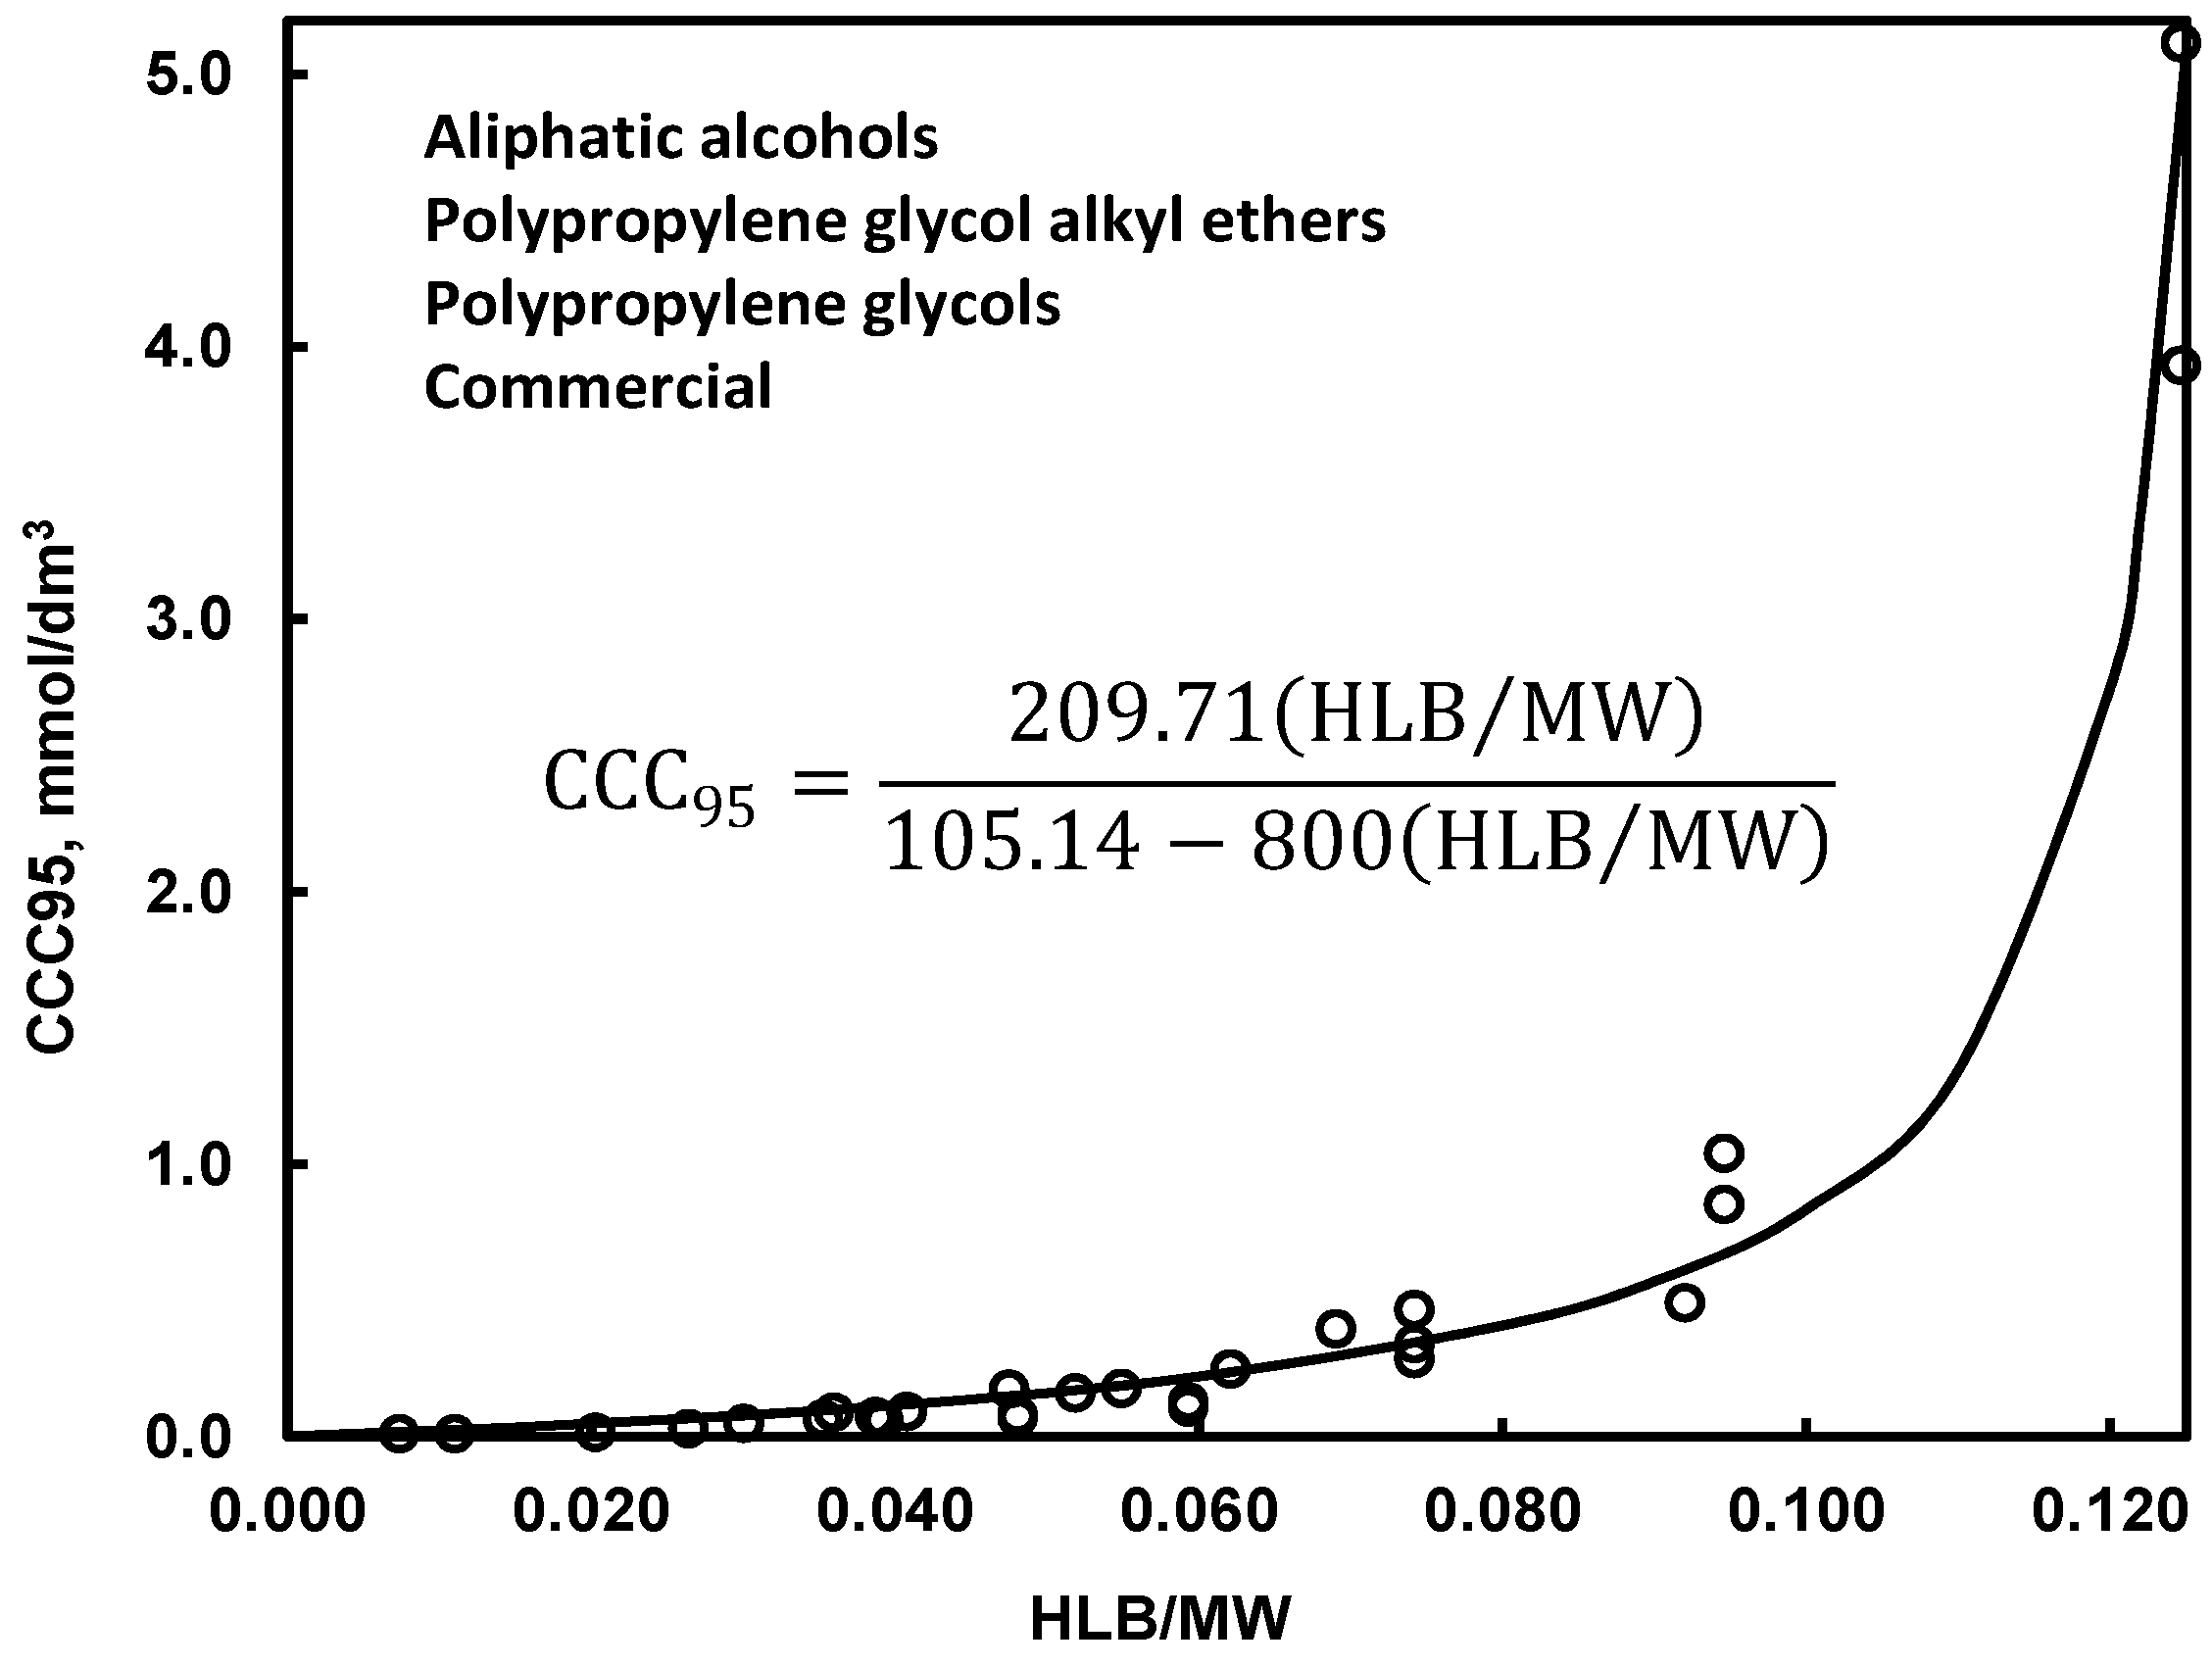
| (c) critical coalescence concentration CCC *1 | Table 11, Figure 5 | |
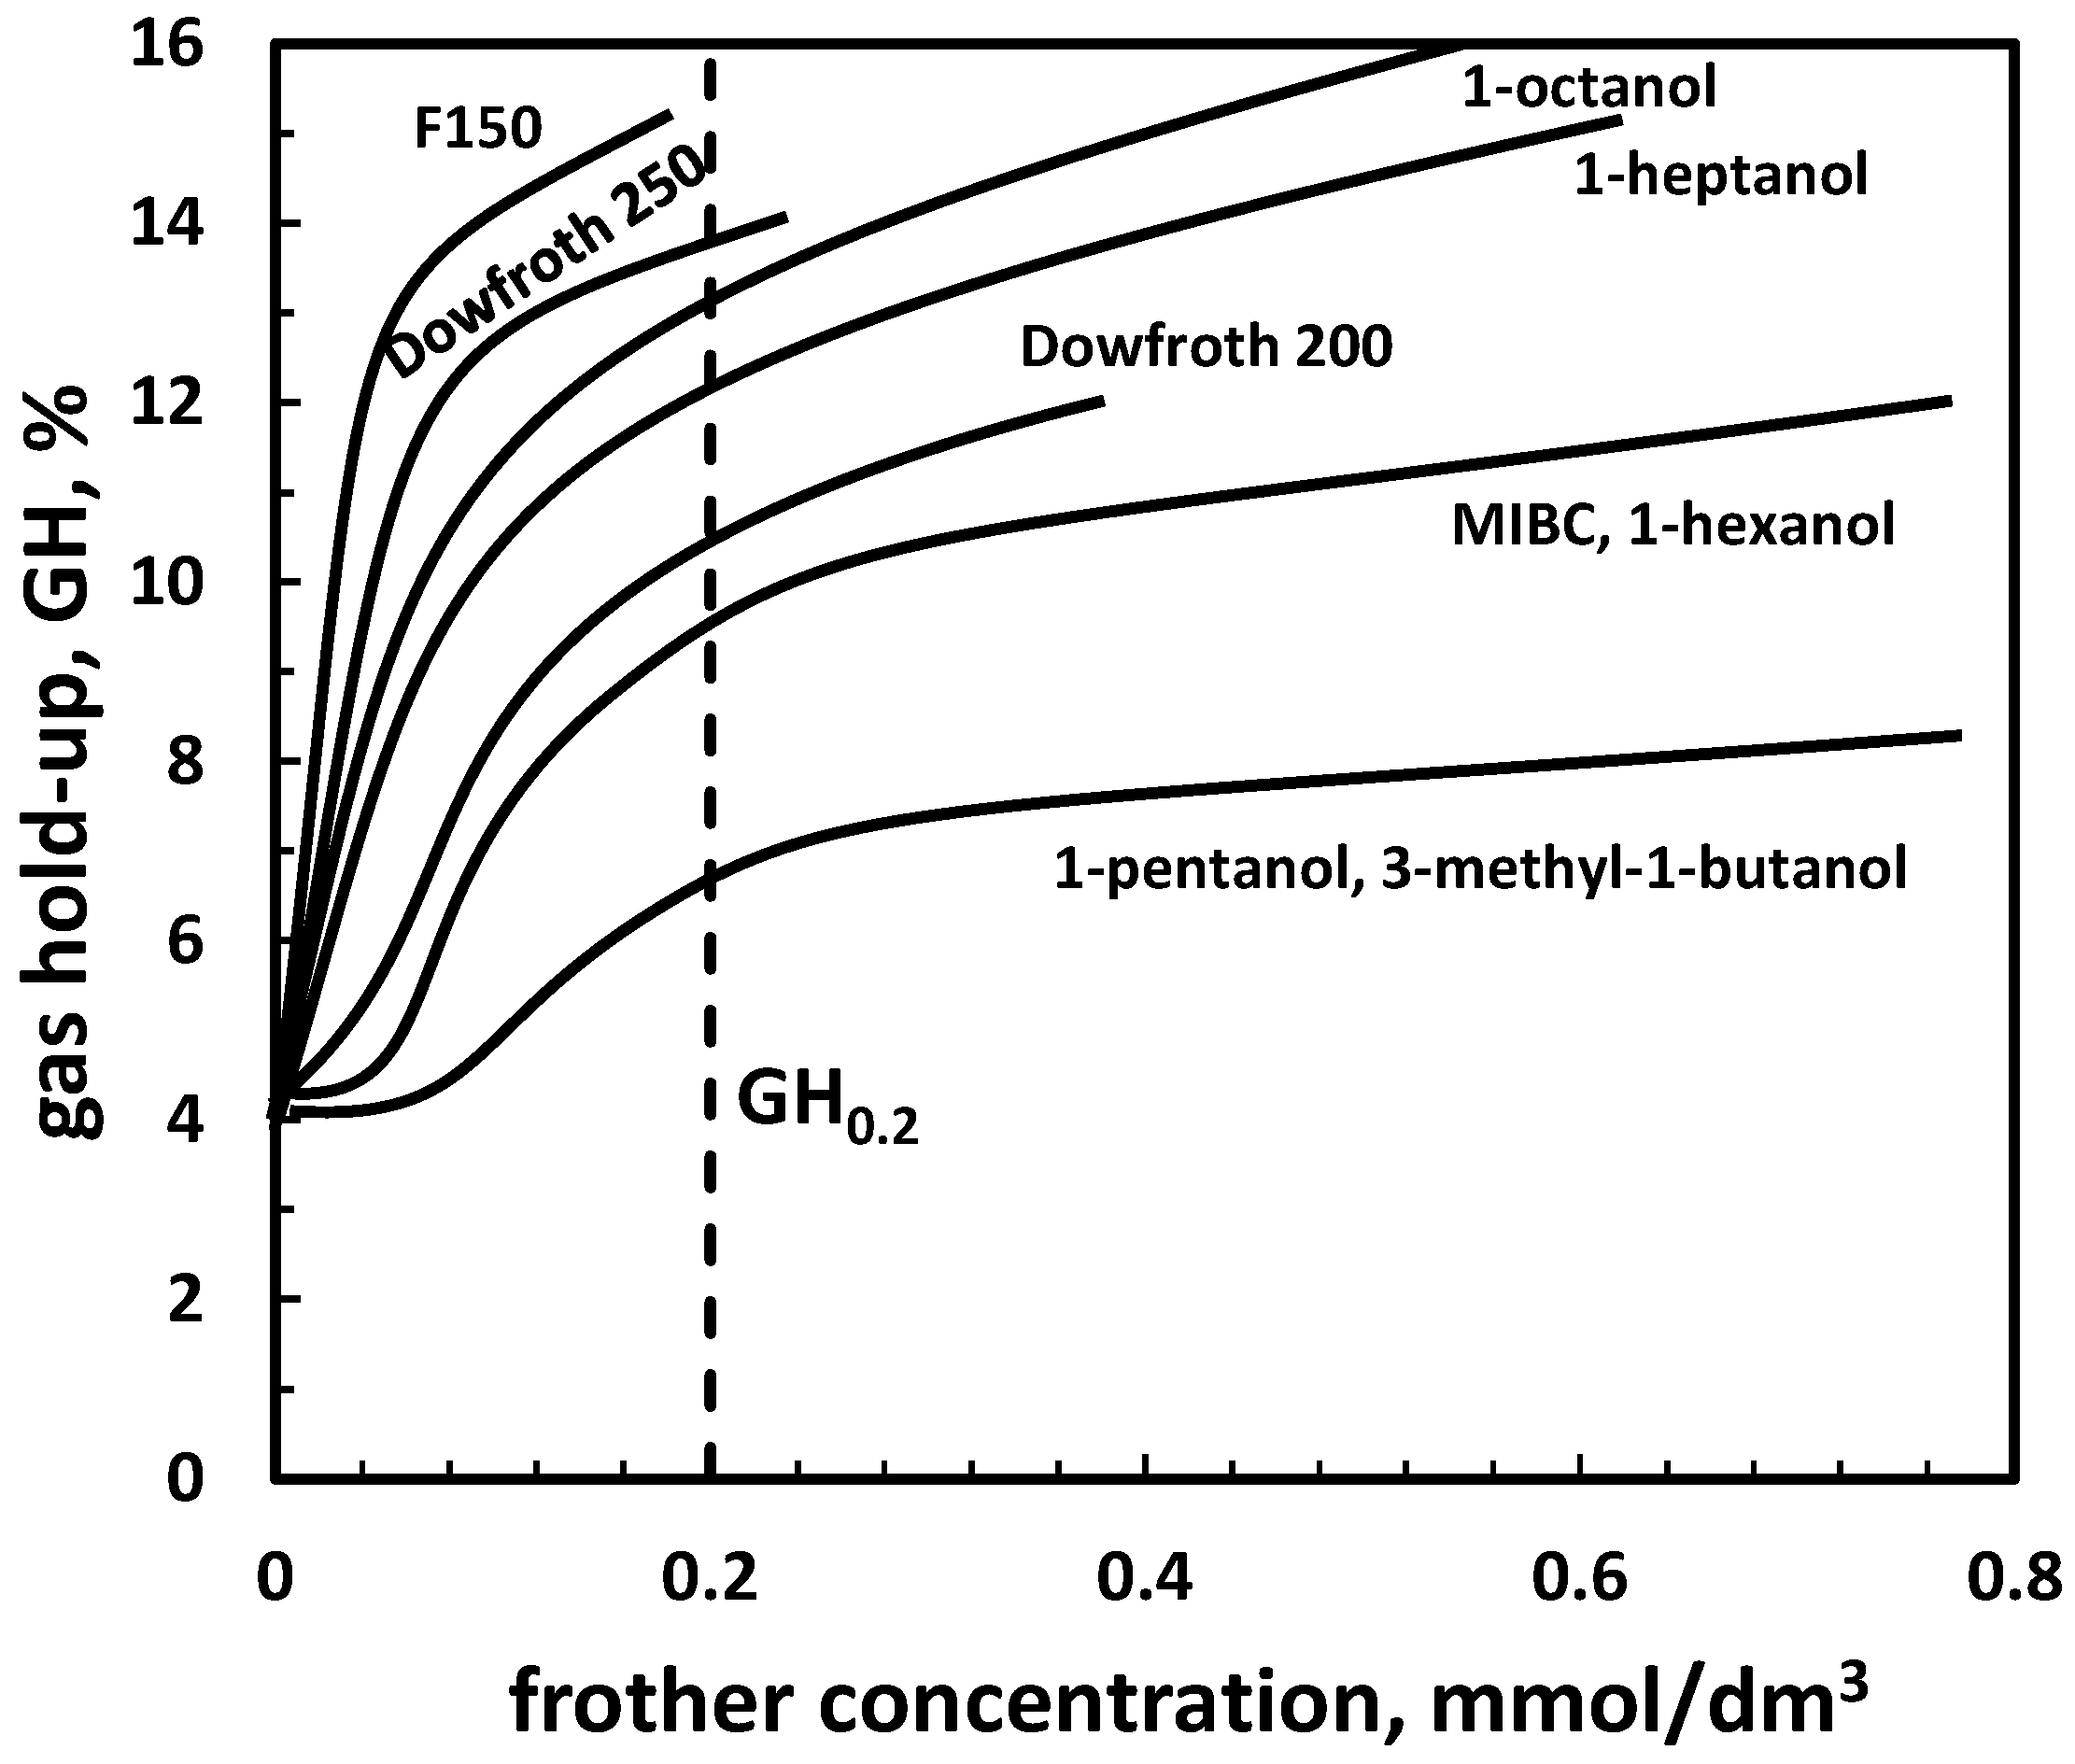
| (d) gas hold-up GH *1 | Table 11, Figure 7 | |
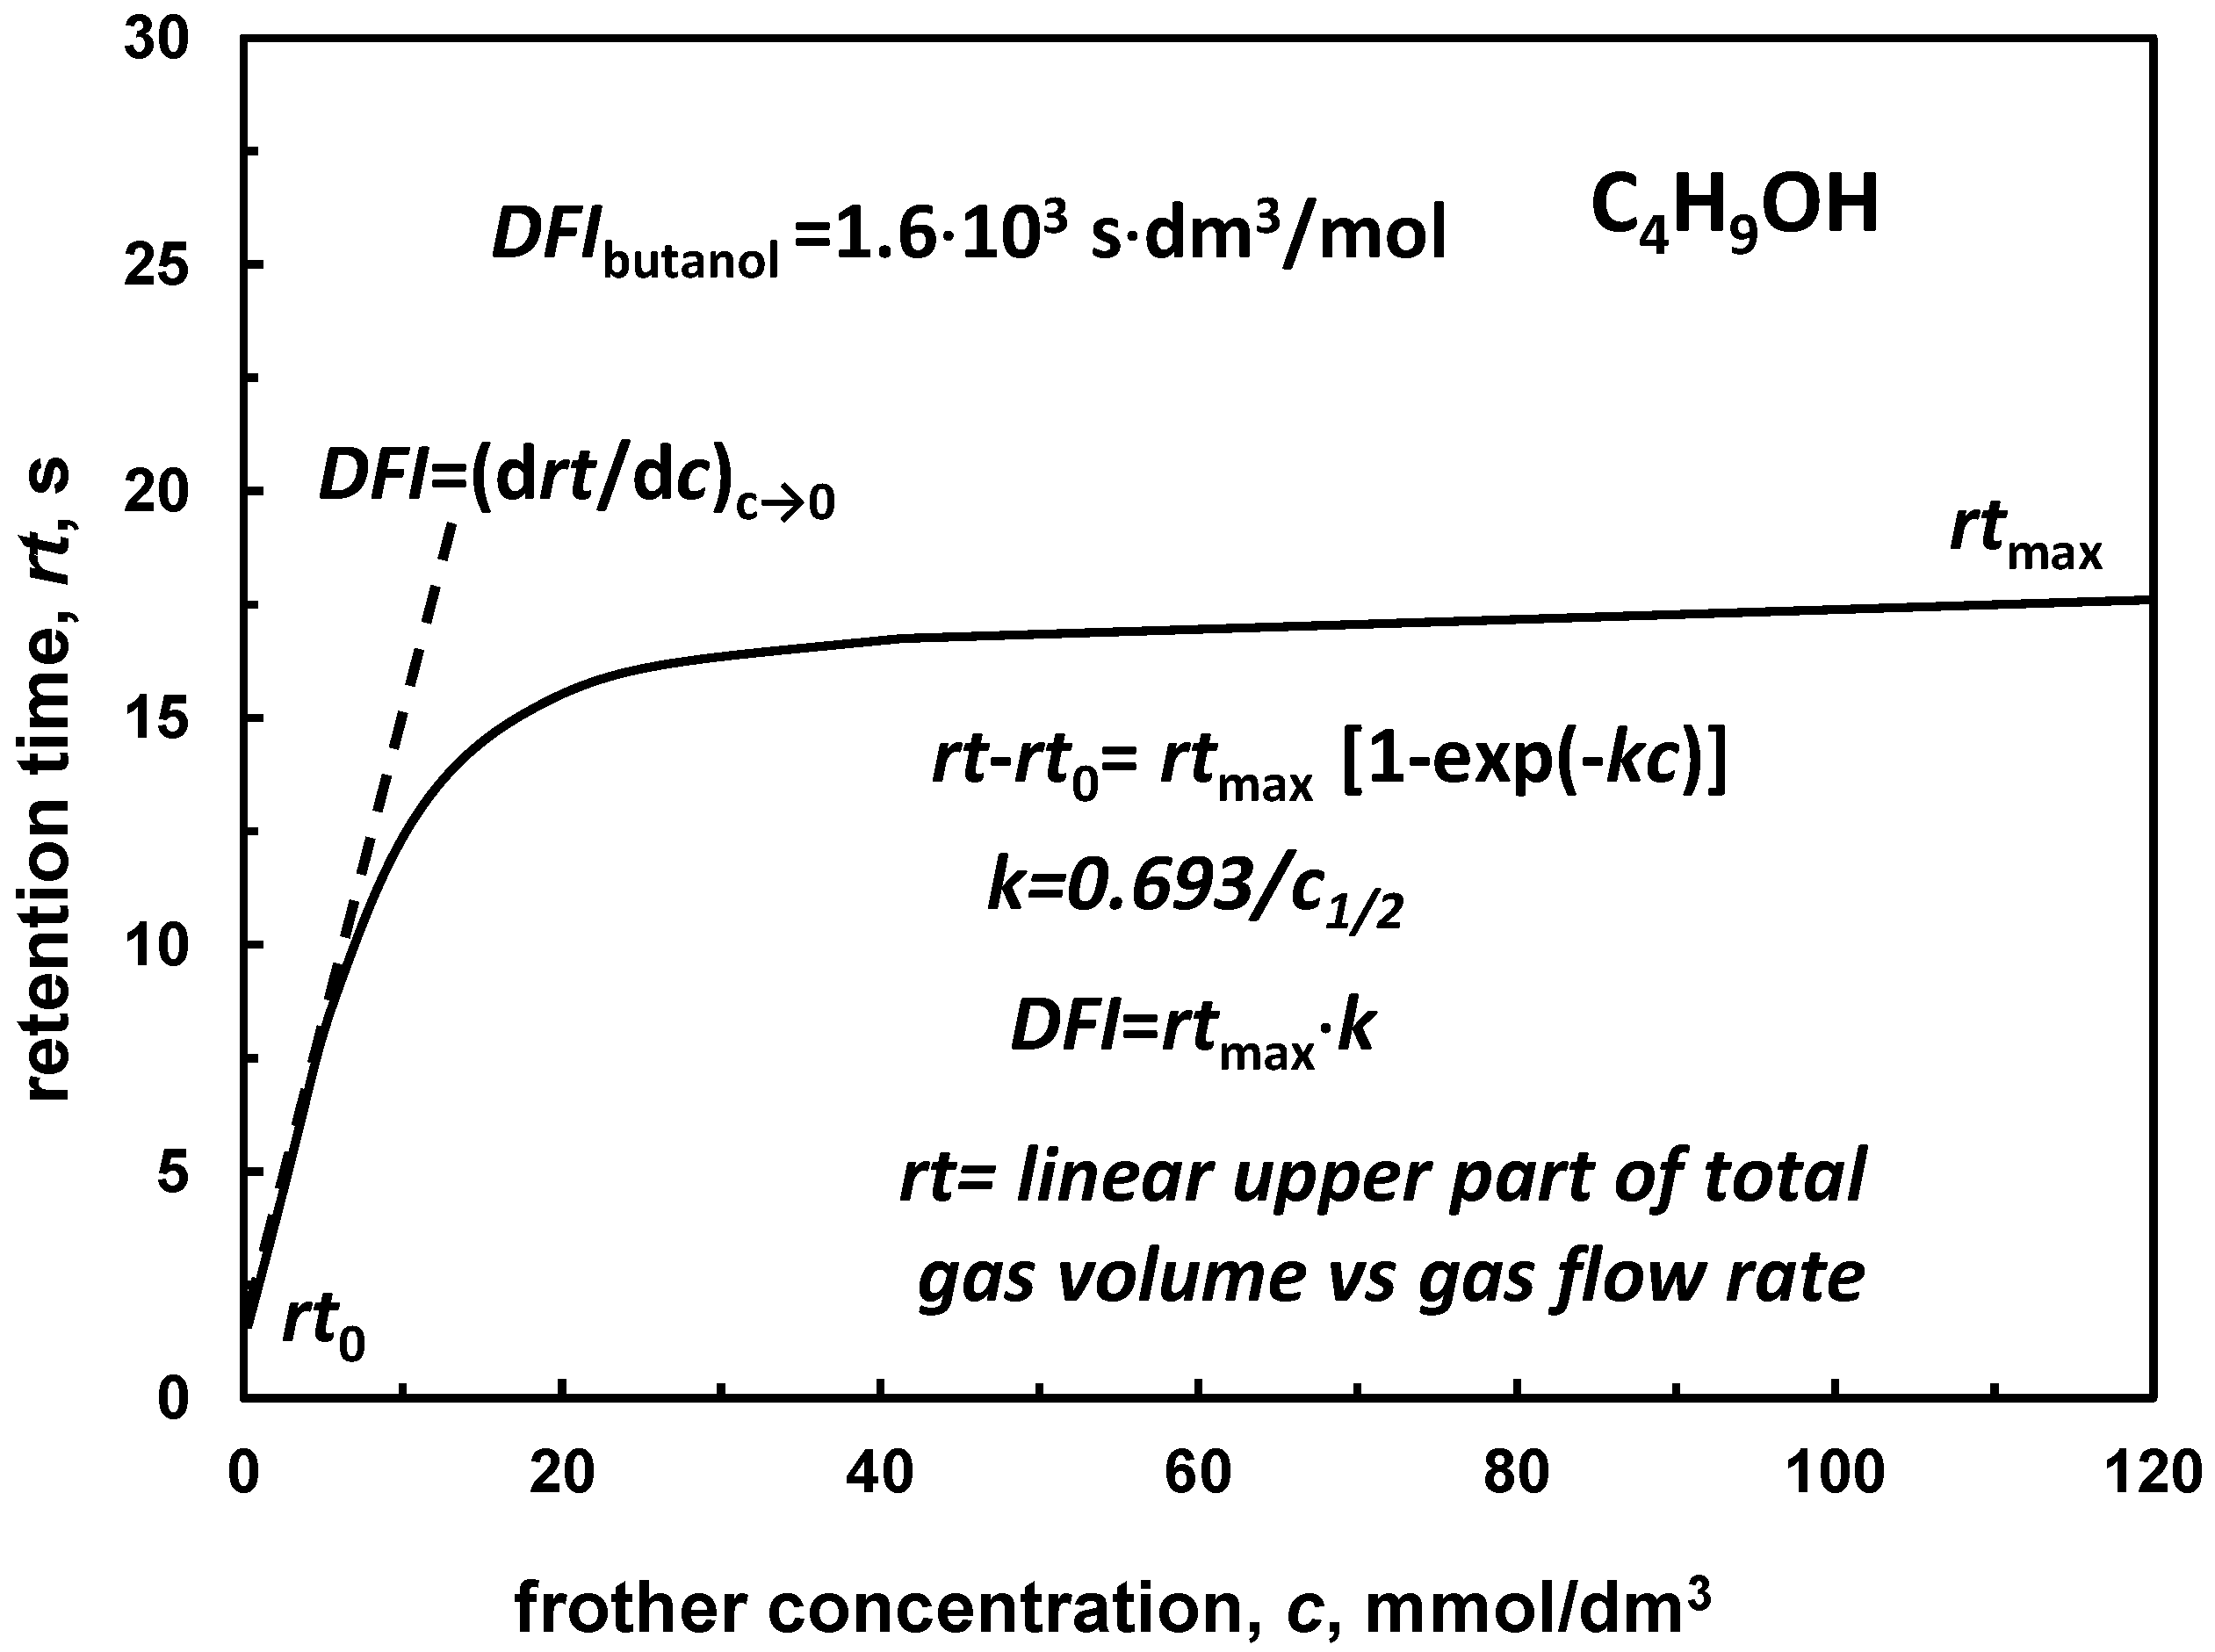
| (e) dynamic frothability index DFI *1 | Table 11, Figure 8 | |
| (f) DFI vs. CCC *2 | Figure 9 | |
| Aqueous solution/gas/solid system | (a) effective, neutral, harmful, overdosed (yield or recovery vs. frother concentration) | Figure 11, Table 12 |
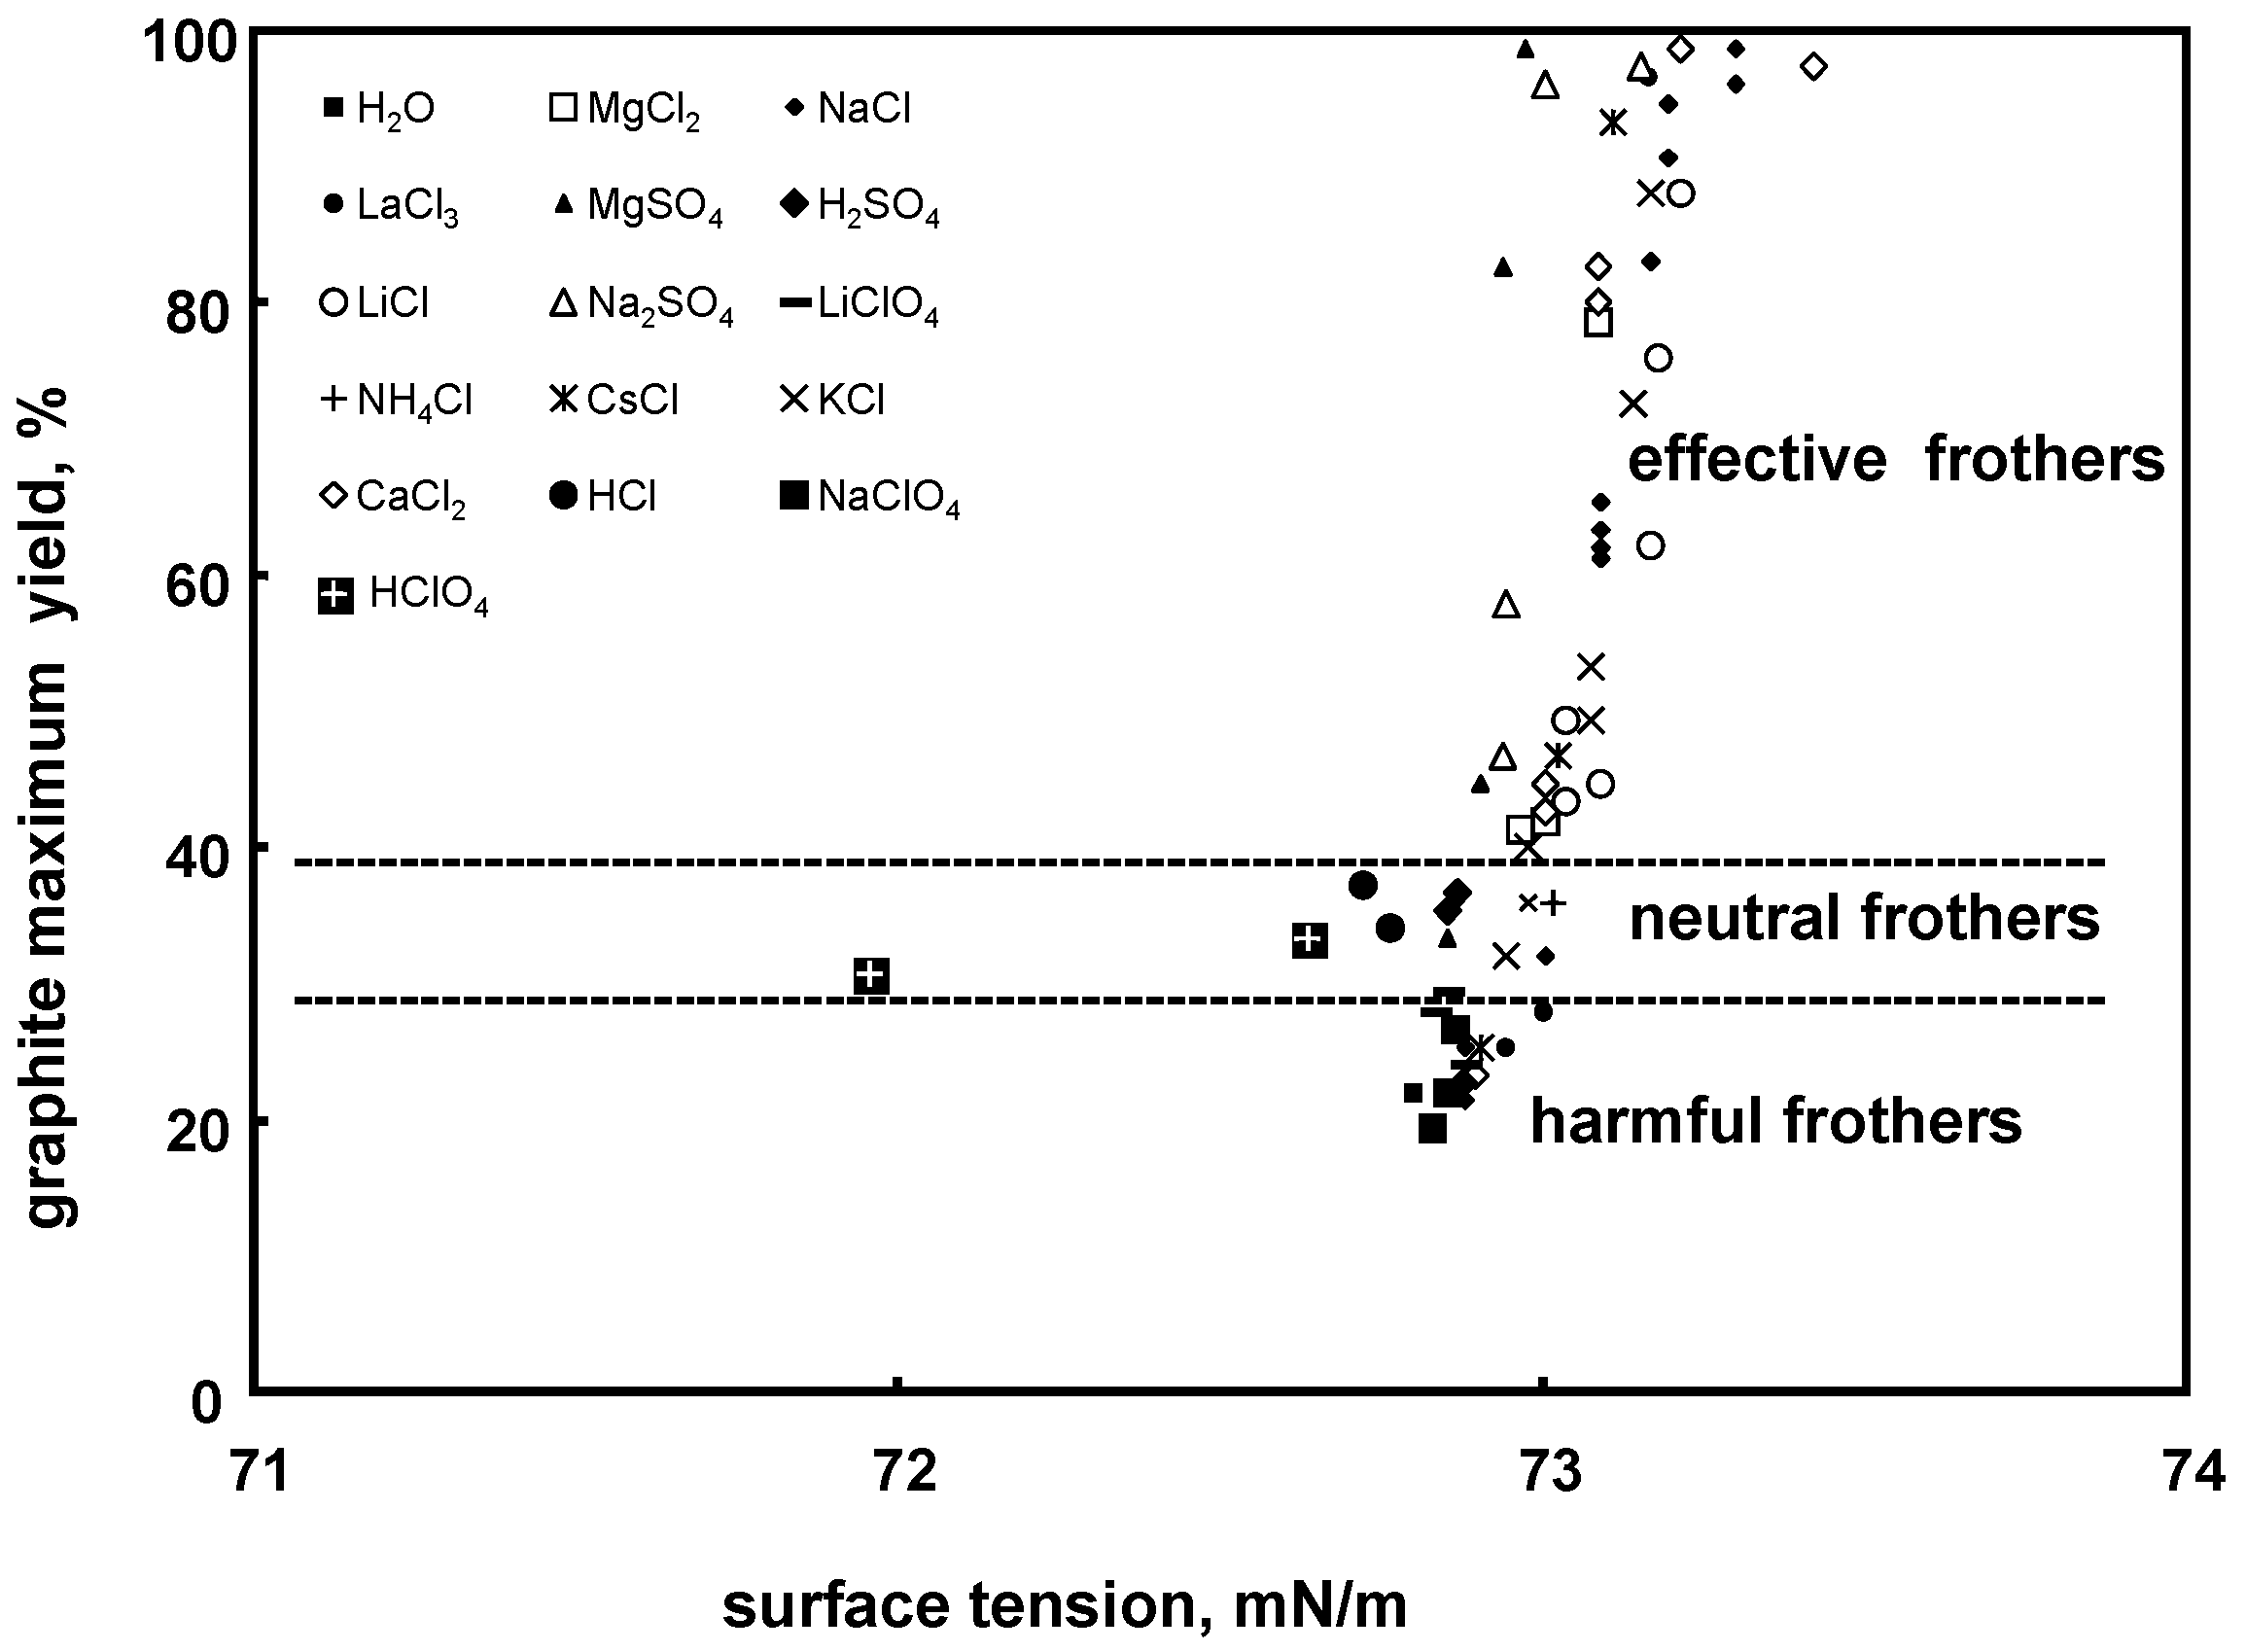
| (b) effective, neutral, harmful, overdosed (recovery or yield vs. surface tension) | Figure 12 (for inorganic electrolytes) | |
| (c) strength or effectiveness (recovery or yield vs. concentration) *1 | Table 13, Figure 13 | |
| (d) k50 (kinesis) *1 | Table 14, Figure 14 | |
| (e) power (based on recovery-recovery plot) *1 | Table 15, Figure 15 | |
| (f) selectivity (based on recovery-recovery plot) *1 | Table 15, Figure 15 | |
| (g) yield or recovery vs. kinetic const. *2 | Figure 16 | |
| (h) powerful and selective (DFI vs. CCC, HLB vs. MW *3) | Figure 17 | |
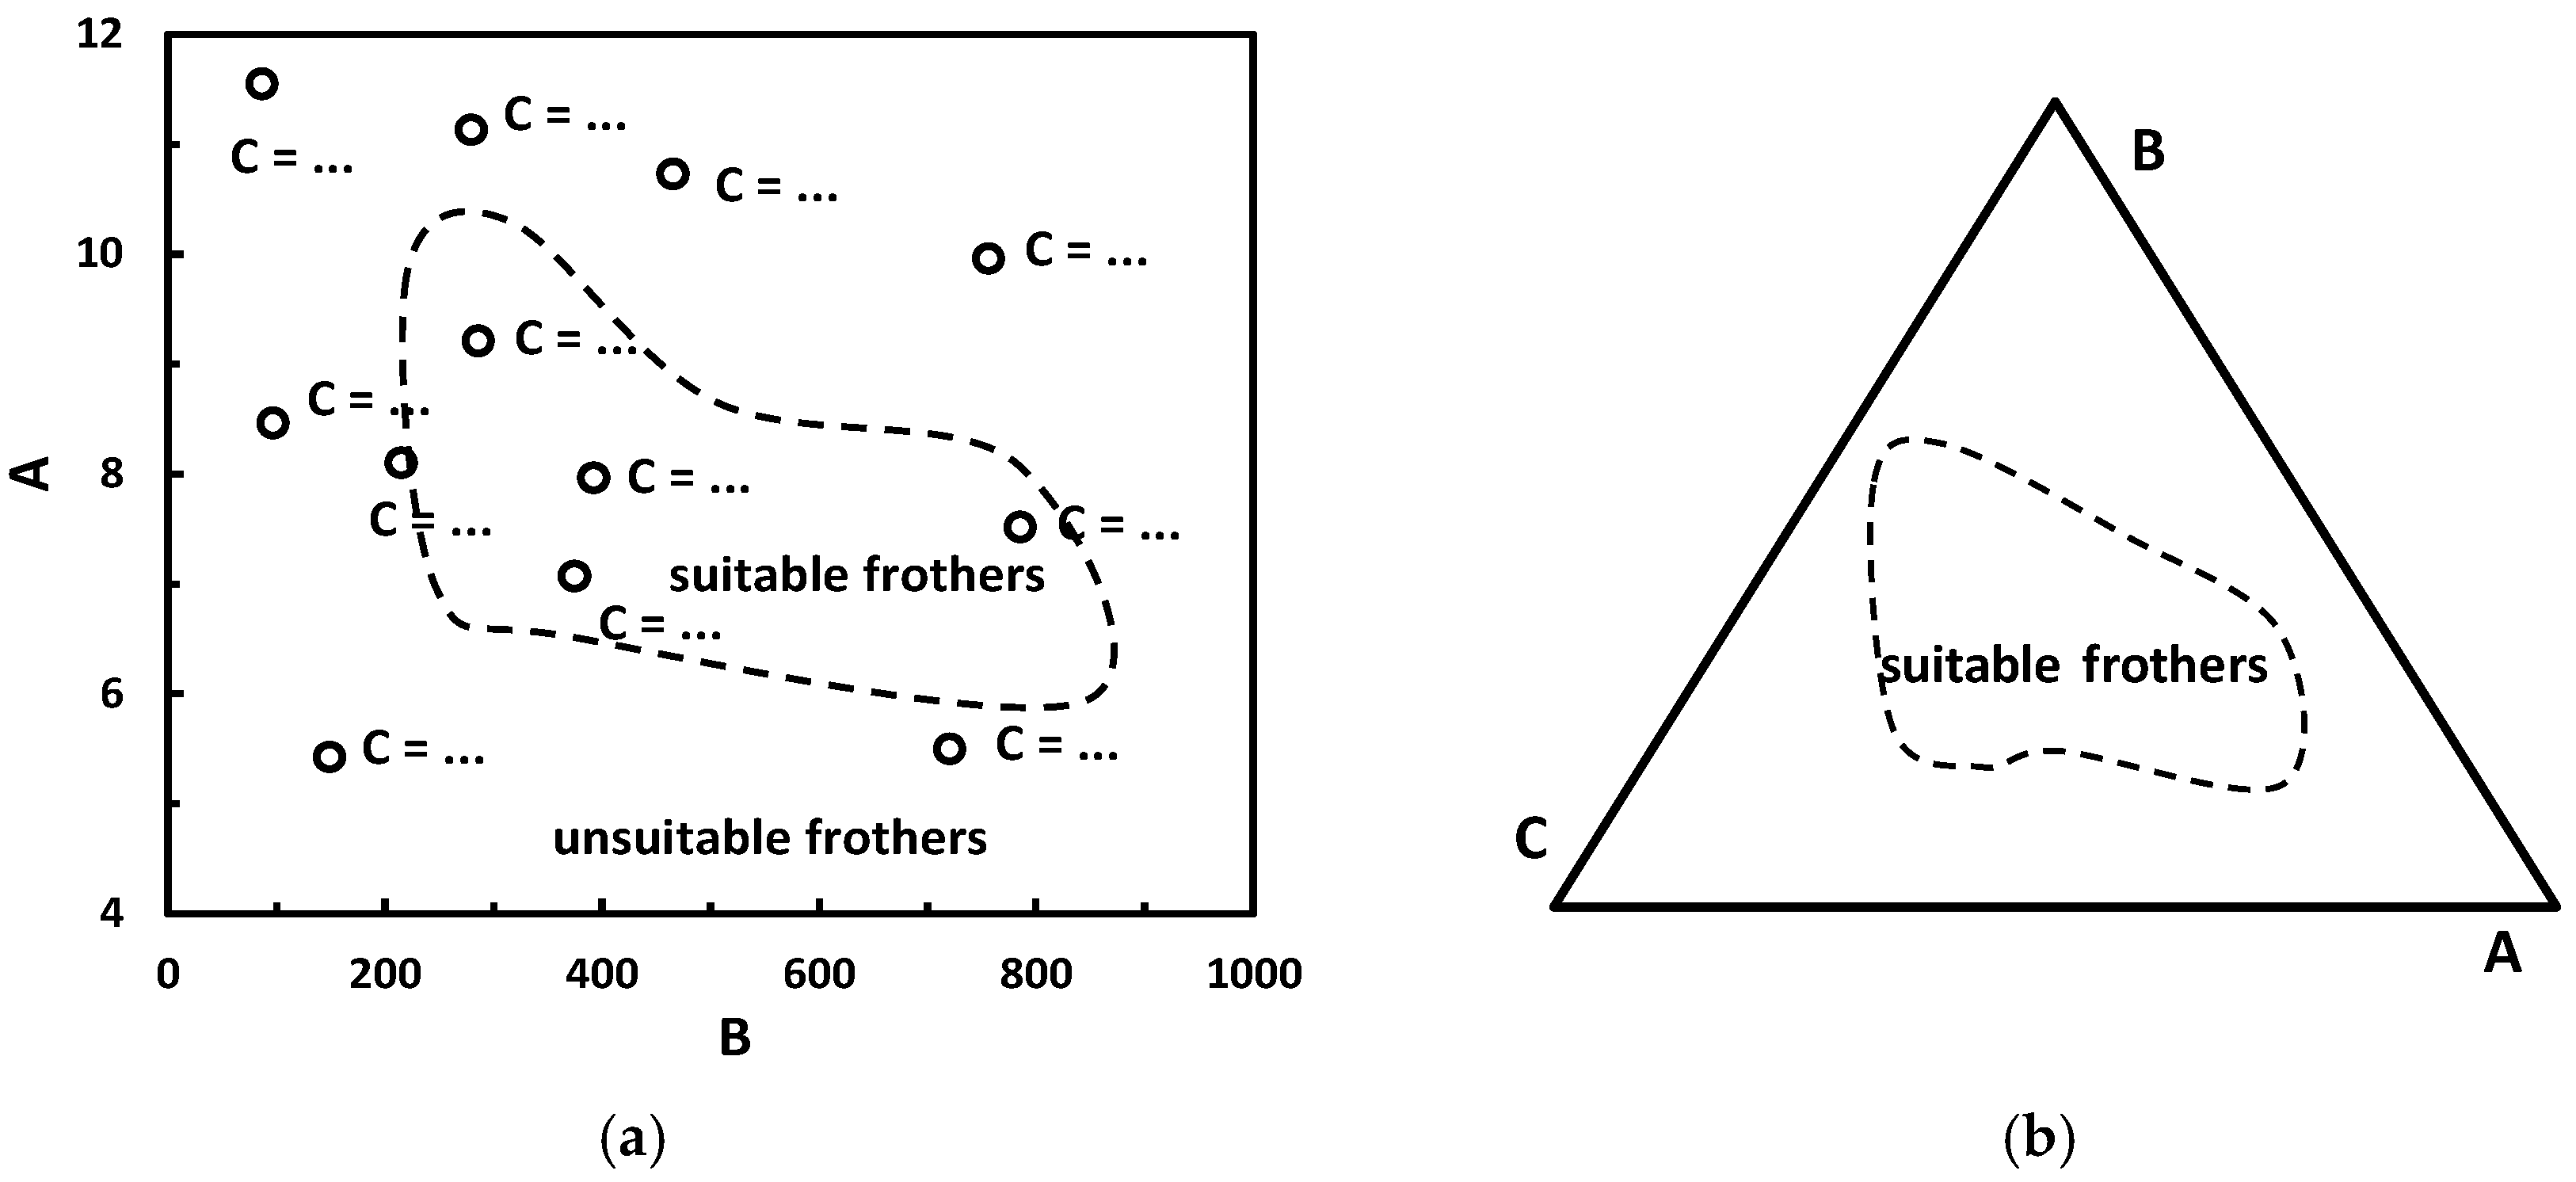
| (i) Cartesian x-y or Gibbs triangle plots *4 | Figure 18 |
| Frother Class | Example | Example |
|---|---|---|
| Organic | organic compounds (alcohols, acetals, acids, bases etc.) | pentanol, oleic acid, amines, polyglycols, polyglycol ethers |
| Inorganic | inorganic compounds (electrolytes: salts, acids and bases) | NaCl, HCl, NaOH |
| Group | Example |
|---|---|
| Alcohol | |
| 1. Aliphatic Alcohols | |
| (a) linear | from amyl to decanol |
| (b) branched | iso-amyl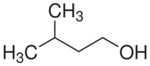 2-ethyl hexanol 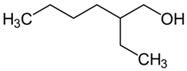 methyl isobutyl carbinol (MIBC) 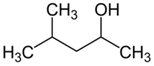 |
| (c) with additional group | diacetone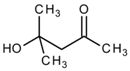 |
| 2. Cyclic Alcohols | |
| (a) linear | Cyclohexanol |
| (b) branched | α-terpineol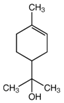 |
| 3. Aromatic | cresols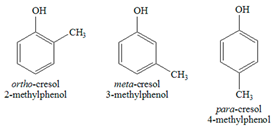 xylenols 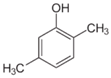 (2,5-xylenol) |
| 4. Polyglycols and hydrocarbon polyglycol ethers | R(X)nOH R = H or CnH2n+1 or any hydrocarbon X = EO (ethylene oxide), PO (propylene oxide), BO (butylene oxide) |
| Organic Non-Alcohols | |
| 1. Alkoxy-hydrocarbons | 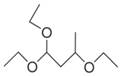 (1,1,3-triethoxybutane) |
| 2. Acetals | 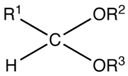 R1 = H, alkyl, aryl R2, R3 = alkyl (usually R2 = R3) |
| 3. Frother/collectors (long chain carboxylic acids, amines, sulfonates, sulphates etc.) | |
| HLB | Properties |
|---|---|
| 1.5–3 | Antifoaming reagents |
| 3.5–6 | Emulsification reagents |
| 3.5–6 | Frothers with emulsification properties |
| 7–10 | Frothers with wetting properties |
| 7–9 | Wetting reagents |
| 8–18 | Emulsification reagents (oil in water) |
| 13–15 | Detergents |
| 15–18 | Solubilisation reagents |
| Frother Type | Example |
|---|---|
| Acidic | Phenols Alkylsulfonates 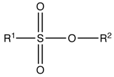 |
| Neutral | Primary and cyclic alcohols R-OH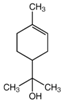 (α-terpineol) Natural oils 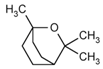 (eucalyptol) Alkoxy paraffins 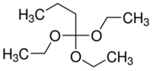 (1,1,3-triethoxybutane) Polyglycol ethers 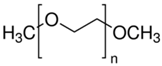 (poly(ethylene glycol) dimethyl ether) |
| Basic | Pyridine base |
| Alkyl Alcohol | Solubility mg/dm3 at 25 °C | Monoterpene Alcohol | Solubility mg/dm3 at 23.5 °C | Carboxylic Acids | Solubility * mg/dm3 |
|---|---|---|---|---|---|
| n-butanol | 7.400 × 10⁴ | α-pinene | 2.45 | C6H5NH2 | 383 |
| n-pentanol | 2.200 × 10⁴ | plinol | 1482 | C4H9COOH | 333 |
| n-hexanol | 5.875 × 10³ | linalool | 853 | C6H5COOH | 24 |
| n-heptanol | 1.740 × 10³ | α-terpineol | 709 | o-CH3C6H5COOH | 9 |
| MIBC | 1.6 × 10⁴ (20 °C) | arbanol | 577 | m-CH3C6H5COOH | 7 |
| Frother | Cloud Point, °C | Frother | Cloud Point, °C | Frother | Cloud Point, °C |
|---|---|---|---|---|---|
| C10E4 | 22 | C12E5 | 36 | C14E5 | 28 |
| C10E5 | 46 | C12E6 | 55 | C14E6 | 49 |
| C10E6 | 63 | C12E7 | 69 | C14E7 | 63 |
| Frother Class | Property of Aqueous Solution | Liquid-Gas Interactions | Froth/Foam |
|---|---|---|---|
| Surface active | Form colloidal solutions (fatty acids, amines, sulfonates, sulphates) | Strongly reduce aqueous solution surface tension | Form two (foam) and three (froth) phase systems |
| Form true solutions (alcohols) | Change aqueous surface tension | ||
| Surface inactive | Organic compounds forming true solutions (ethyl acetal, ethyl diacetone) Inorganic electrolytes | Do not change aqueous surface tension Increase surface tension of water * | Form only three phase systems (froth) Form weak foam and strong froth with hydrophobic particles |
| Example | Surface Tension Slope σ∠ (mN/m)/(mol/dm3) |
|---|---|
| AlCl3 | 6.0 [34] |
| MgCl2 | 4.0 [32] |
| Na2SO4 | 2.9 [32] |
| KCl | 1.8 [32] |
| sucrose | 1.7 [19] |
| NH4Cl | 1.6 [32] |
| H2SO4 | 0.4 [32] |
| methylammonium chloride | 0.4 [35] |
| NaClO4 | 0.2 [32] |
| ethylammonium chloride | −1.3 [35] |
| HClO4 | −2.2 [32] |
| KPF6 | −2.5 [36] |
| propylamonnium chloride | −4.3 [35] |
| Example | cσ50 (mmol/dm3) |
|---|---|
| diethylene oxide n-decyl ether (C10E2) | 0.35 |
| sodium n-dodecyl sulphate (SDDS) | 4.5 |
| dodecyl trimethyl ammonium bromide (DTAB) | 7 |
| methyl isobutyl carbinol (MIBC) | 10 |
| acetal C3H7CH[O(C2H4O)2CH3]2 | 22 |
| acetal C2H5CH[O(C2H4O)2CH3]2 | 155 |
| hexyl ammonium chloride (C6H15NH3Cl) | 500 |
| Example | CCC mmol/dm3 | GH0.2 Gas-Holdup, % at 0.2 mmol/dm3 of Frother | DFI s·dm3/mmol |
|---|---|---|---|
| 2-butanol | 1.041 c,* | - | 1 a |
| 1-pentanol | 0.284 c,* | 6.8 g | 6 a |
| 1-hexanol | 0.108 c,* | 9.5 g | 34 a |
| 1-heptanol | 0.069 c,* | 12.2 g | 41 a |
| 1-octanol | 0.062 c,* | 13.0 g | 79 a |
| MIBC | 0.11 d | 9.5 g | 37 a |
| a-terpineol | 0.054 e | - | 138 a |
| DF250 | 0.038 f | 13.8 g | 208 b |
| DF200 | 0.084 f | 10.4 g | 196 b |
| DF1024 | 0.015 f | - | 267 b |
| Solid Hydrophobicity θ | Surface Tension Change with Concentration | Inorganic (I)/Organic (O) Frother | Frother Type | Sub-System Symbol | Example |
|---|---|---|---|---|---|
| High s(Hθ) | Δσ+ | I | * | s(Hθ, Δσ+,I)/w/g | |
| O | * | s(Hθ, Δσ+,O)/w/g | |||
| Δσ0 | I | * | s(Hθ, Δσ0,I)/w/g | ||
| O | * | s(Hθ, Δσ0,O)/w/g | |||
| Δσ- | I | * | s(Hθ, Δσ-,I)/w/g | ||
| O | * | s(Hθ, Δσ-,O)/w/g | |||
| Δσs | O | overdosed | s(Hθ, Δσs,O)/w/g | Figure 12 | |
| Medium s(Mθ) | Δσ+ | I | effective | s(Mθ, Δσ+,I)/w/g | Figure 12 |
| O | * | s(Mθ, Δσ+,O)/w/g | |||
| Δσ0 | I | neutral | s(Mθ, Δσ0,I)/w/g | Figure 13 | |
| O | * | s(Mθ, Δσ0,O)/w/g | |||
| Δσ- | I | harmful | s(Mθ, Δσ-,I)/w/g | Figure 12 | |
| O | * | s(Mθ, Δσ-,O)/w/g | |||
| Δσs | O | effective | s(Lθ, Δσs,O)/w/g | Figure 12 | |
| Low or hydrophilic s(Lθ) | Δσ+ | I | neutral | s(Lθ, Δσ+,I)/w/g | |
| O | neutral | s(Lθ, Δσ+,O)/w/g | |||
| Δσ0 | I | neutral | s(Lθ, Δσ0,I)/w/g | ||
| O | neutral | s(Lθ, Δσ0,O)/w/g | |||
| Δσ- | I | neutral | s(Lθ, Δσ-,I)/w/g | ||
| O | neutral | s(Lθ, Δσ-,O)/w/g | |||
| Δσs | O | neutral | s(Lθ, Δσs,O)/w/g | Figure 12 |
| Example | Strength cγ75, mmol/dm3 (Coal, Lab. Flotation Machine, [50]) | Example | Molar Effectiveness, γ1M (Carbonaceous Shale, Hallimond Cell, [55]) |
|---|---|---|---|
| n-butanol | 0.2 | KPF6 | 4% |
| n-propanol | 1 | NaCl | 44% |
| n-hexanol | 3 | Na2SO4 | 46% |
| Separation System | k50, min−1 |
|---|---|
| Shale/MIBC (MHT) | 0.045 [69] |
| Shale/Hexylamine (MHT) | 0.046 [69] |
| Shale/Hexylamine (MHT) | 0.050 [70] |
| Shale/MIBC (FC) | 0.064 [56] |
| Shale/C4E3 (FC) | 0.076 [56] |
| Shale/Hexylamine (FC) | 0.076 [56] |
| Coal/NaCl + CH3COONa (MM) | 0.100 [71] |
| PTFE/α-terpineol (DM) | 0.173 [72] |
| Coal/oil + frother (FLM) | 0.278 [73] |
| Quartz/KNO3 + MIBC (MFC) | 0.278 [74] |
| Coal/α-terpineol (DM) | 0.597 [75] |
| Coal/C1P2 (DM) | 0.770 [75] |
| Frother | Formula | Selectivity F, % | Power P, mg/dm3 | Power P, mmol/dm3 |
|---|---|---|---|---|
| C4E1 | C4H9O(C2H4O)1H | 78 ± 1 | 38 | 0.32 |
| C4E3 | C4H9O(C2H4O)3H | 78 ± 1 | 65 | 0.32 |
| C1P3 | C1H3O(C3H6O)3H | 77 ± 1 | 65 | 0.32 |
| C4E2 | C4H9O(C2H4O)2H | 77 ± 2 | 102 | 0.63 |
| C6E2 | C6H13O(C2H4O)2H | 76 ± 2 | 120 | 0.63 |
| C0P3 | (C3H6O)3H | 77 ± 3 | 121 | 0.63 |
| C3P3 | C3H7O(C3H6O)3H | 75 ± 2 | 145 | 0.63 |
| C4P3 | C4H9O(C3H6O)3H | 74 ± 2 | 155 | 0.63 |
© 2018 by the authors. Licensee MDPI, Basel, Switzerland. This article is an open access article distributed under the terms and conditions of the Creative Commons Attribution (CC BY) license (http://creativecommons.org/licenses/by/4.0/).
Share and Cite
Drzymala, J.; Kowalczuk, P.B. Classification of Flotation Frothers. Minerals 2018, 8, 53. https://doi.org/10.3390/min8020053
Drzymala J, Kowalczuk PB. Classification of Flotation Frothers. Minerals. 2018; 8(2):53. https://doi.org/10.3390/min8020053
Chicago/Turabian StyleDrzymala, Jan, and Przemyslaw B. Kowalczuk. 2018. "Classification of Flotation Frothers" Minerals 8, no. 2: 53. https://doi.org/10.3390/min8020053
APA StyleDrzymala, J., & Kowalczuk, P. B. (2018). Classification of Flotation Frothers. Minerals, 8(2), 53. https://doi.org/10.3390/min8020053