Article

Structure Refinement and Thermal Stability Studies of the Uranyl Carbonate Mineral Andersonite, Na2Ca[(UO2)(CO3)3]·(5+x)H2O

by
Vladislav V. Gurzhiy
1,*,
Maria G. Krzhizhanovskaya
1,
Alina R. Izatulina
1,
Ginger E. Sigmon
2,
Sergey V. Krivovichev
1,3 and
Peter C. Burns
2,4
1
Department of Crystallography, Institute of Earth Sciences, St. Petersburg State University, University Emb. 7/9, 199034 St. Petersburg, Russia
2
Department of Civil and Environmental Engineering and Earth Sciences, University of Notre Dame, Notre Dame, IN 46556, USA
3
Kola Science Centre, Russian Academy of Sciences, Fersmana 14, 184209 Apatity, Russia
4
Department of Chemistry and Biochemistry, University of Notre Dame, Notre Dame, IN 46556, USA
*
Author to whom correspondence should be addressed.
Minerals 2018, 8(12), 586; https://doi.org/10.3390/min8120586
Submission received: 21 November 2018 / Revised: 4 December 2018 / Accepted: 10 December 2018 / Published: 11 December 2018
(This article belongs to the Special Issue Actinide Mineralogy and Crystallography)

Abstract

:
A sample of uranyl carbonate mineral andersonite, Na2Ca[(UO2)(CO3)3]·5−6H2O, originating from the Cane Springs Canyon, San Juan Co., UT, USA was studied using single-crystal and powder X-ray diffraction at various temperatures. Andersonite is trigonal, R−3m, a = 17.8448(4), c = 23.6688(6) Å, V = 6527.3(3) Å3, Z = 18, R1 = 0.018. Low-temperature SCXRD determined the positions of H atoms and disordered H2O molecules, arranged within the zeolite-like channels. The results of high-temperature PXRD experiments revealed that the structure of andersonite is stable up to 100 °C; afterwards, it loses crystallinity due to release of H2O molecules. Taking into account the well-defined presence of H2O molecules forming channels’ walls that to the total of five molecules p.f.u., we suggest that the formula of andersonite is Na2Ca[(UO2)(CO3)3]·(5+x)H2O, where x ≤ 1. The thermal behavior of andersonite is essentially anisotropic with the lowest values of the main thermal expansion coefficients in the direction perpendicular to the channels (plane (001)), while the maximal expansion is observed along the c axis—in the direction of channels. The thermal expansion around 80 °C within the (001) plane becomes negative due to the total release of “zeolitic” H2O molecules. The information-based structural complexity parameters of andersonite were calculated after the removal of all the disordered atoms, leaving only the predominantly occupied sites, and show that the crystal structure of the mineral should be described as complex, possessing 4.535 bits/atom and 961.477 bits/cell, which is comparative to the values for another very common natural uranyl carbonate, liebigite.

Graphical Abstract

1. Introduction

Uranyl carbonates are important phases in the geo-ecology of uranium deposits and nuclear facilities, including radioactive waste disposal sites. Uranyl carbonate minerals readily form during alteration of primary uranium minerals (e.g., pitchblende or uraninite) under the influence of water enriched with CO2, which may be derived from the dissolution of carbonate rocks or from the atmosphere [1,2,3,4,5,6]. Uranyl carbonates may play an important role in the transport of uranium in ground waters. Teterin et al. [7] and Burakov et al. [8] described an active uranyl-carbonate mineralization among the secondary formations that formed after the accident at the 4th reactor of the Chernobyl nuclear power plant. Currently, there are almost 40 known uranyl carbonate mineral species. From the perspective of crystallography, this group of compounds is of considerable interest mainly due to the recent discoveries of the structurally highly complex minerals ewingite, Mg8Ca8(UO2)24(CO3)30O4(OH)12·138(H2O) [9] and paddlewheelite, MgCa5Cu2(UO2)4(CO3)12·33(H2O) [10]. However, members of this family are often challenging for research due to low crystallinity; crystal structures of about half of the uranyl carbonate minerals are still undetermined. Among the most common and well-studied uranyl carbonate minerals, such as rutherfordine, (UO2)(CO3) [11], liebigite, Ca2(UO2)(CO3)3·11H2O [12], and andersonite, Na2Ca[(UO2)(CO3)3]·5−6H2O, the latter attracts interest due to its zeolite-like framework structure with channels of ~5 Å in diameter that are occupied by H2O molecules.
Andersonite, Na2Ca(UO2)(CO3)3·6H2O, was first reported by Axelrod et al. [13] from specimens collected at the Hillside Mine, AZ, USA, where it is associated with other uranyl carbonates (schröckingerite, bayleite, and swartzite). Andersonite occurs as clusters of pseudo-cubic (rhombohedral) crystals or spheroidal globules, which exhibit a strong yellowish-green fluorescence. It may also appear coating walls of mines or shafts [14]. The crystal structure of andersonite was first fully determined using its synthetic analog [15] and then refined twice [16,17], including the first attempt made on a natural sample [18]. However, the first less successful attempt to refine the structure of synthetic andersonite, based on poor quality data that resulted in the loss of one of the H2O sites, was made by Coda [19]. In addition to X-ray experiments, papers describe the optical, IR, and Raman spectroscopy characteristics of andersonite [20,21,22,23] together with thermal analyses results and thermodynamic properties [24,25,26,27].
We have studied a sample of natural andersonite using single-crystal X-ray diffraction (XRD) at a low temperature to determine the positions of H atoms and disordered H2O molecules. High-temperature powder XRD was then used to evaluate the stability of the structure and thermal expansion characteristics of the framework.

2. Materials and Methods

2.1. Occurence

The sample of andersonite studied in this work was taken from the collection of radioactive minerals of the Department of Civil and Environmental Engineering and Earth Sciences at the University of Notre Dame, where it is stored under the catalog number 1272. The sample originates from the Cane Springs Canyon, San Juan Co., UT, USA.

2.2. Chemical Composition

A small fragment of an andersonite single crystal (Figure 1c) verified on the diffractometer was crushed, pelletized, and carbon coated. The chemical composition of the sample was determined using a Hitachi S-3400N scanning electron microscope equipped with a AzTec Energy X-Max 20 spectrometer (Oxford Instruments, Abingdon, UK), with an acquisition time of 30 s per point in energy-dispersive mode (acceleration voltage 20 kV, beam current 2 nA). The following analytical standards were used: albite (NaK), wollastonite (CaK), and U3O8 (UK). Analytical calculations for andersonite: Atomic ratio from structural data Na 2.00, Ca 1.00, U 1.00; found by EDX: Na 1.95, Ca 0.97, U 1.08. Traces of Si up to 1 at % were found by EDX and are attributed to the microinclusions of quartz, which were detected during PXRD measurements. The number of H2O molecules per formula unit of Na2Ca[(UO2)(CO3)3·(H2O)5.3 was calculated from the structural data.

2.3. Single-Crystal X-ray Diffraction Study

A single crystal of andersonite was selected under an optical microscope, encased in oil-based cryoprotectant, and mounted on a cryoloop. Diffraction data were collected at 100 K using a Rigaku Oxford Diffraction Xcalibur diffractometer (Oxford, UK) operated with monochromated MoKα radiation (λ[MoKα] = 0.71073 Å) at 50 kV and 40 mA and equipped with an Eos CCD area detector. Data were collected with frame widths of 1.0° in ω and φ, and an exposure of 5 s per each frame. Data were integrated and corrected for background, Lorentz, and polarization effects. An analytical absorption correction using a multifaceted crystal model based on expressions derived by Clark and Reid [28] was applied in the CrysAlisPro program [29]. The unit cell parameters of andersonite, see Table 1, were determined and refined by least-squares techniques on the basis of 11,925 reflections with 2θ in the range from 4.34° to 55.00°. The structure was solved by direct methods and refined to R1 = 0.018 (wR2 = 0.038) for 1697 reflections with I ≥ 2σ(I) using the SHELX programs [30] incorporated in the OLEX2 program package [31]. The final model included coordinates, see Table 2, and anisotropic displacement parameters for all atoms except H. The H atoms of H2O molecules were located in difference Fourier maps and were included in the refinement with Uiso(H) set to 1.5Ueq(O) and O–H blond length restraints (0.9 Å) for the disordered and low-occupancy sites. Supplementary crystallographic data have been deposited in the Inorganic Crystal Structure Database (CSD 1877782) and can be obtained from Fachinformationszentrum Karlsruhe via https://www.ccdc.cam.ac.uk/structures/.

2.4. High-Temperature Powder X-ray Diffraction Study

Crystalline andersonite was ground in an agate mortar for in situ examination using a Rigaku Ultima IV powder X-ray diffractometer (PXRD, CoKα radiation; 40 kV/30 mA; Bragg–Brentano geometry; PSD D-Tex Ultra detector). A Rigaku SHT-1500 chamber was employed for experiments in air in the range from +25 to +800 °C; a Pt strip (20 × 12 × 2 mm3) was used as a heating element and sample holder. The temperature steps varied from 5 to 25 °C depending on the temperature range. The heating rate was 2 °C/min. The collection time at each temperature step was about 30 min. The absence of reversibility of the observed phase transformations was verified by collecting PXRD data on cooling. Phase identification was carried out using the ICDD PDF-2 Database (release 2016). The unit cell parameters were refined by the Pawley method using the TOPAS 4.2 software [35]. The background was modeled using a Chebyshev polynomial of the 12th order. The peak profiles were described using the fundamental parameters approach. The zero-shift parameter was refined at every step, and it was usually increased by 0.01–0.02° 2θ because of the sample holder expansion on heating.
The main coefficients of the thermal-expansion tensor were determined using a second-order approximation of temperature dependencies for the unit cell parameters by means of the TEV program [36]. The same software was also employed to determine the orientation of the principal axes of the thermal expansion tensor and for visualization purposes.

3. Results

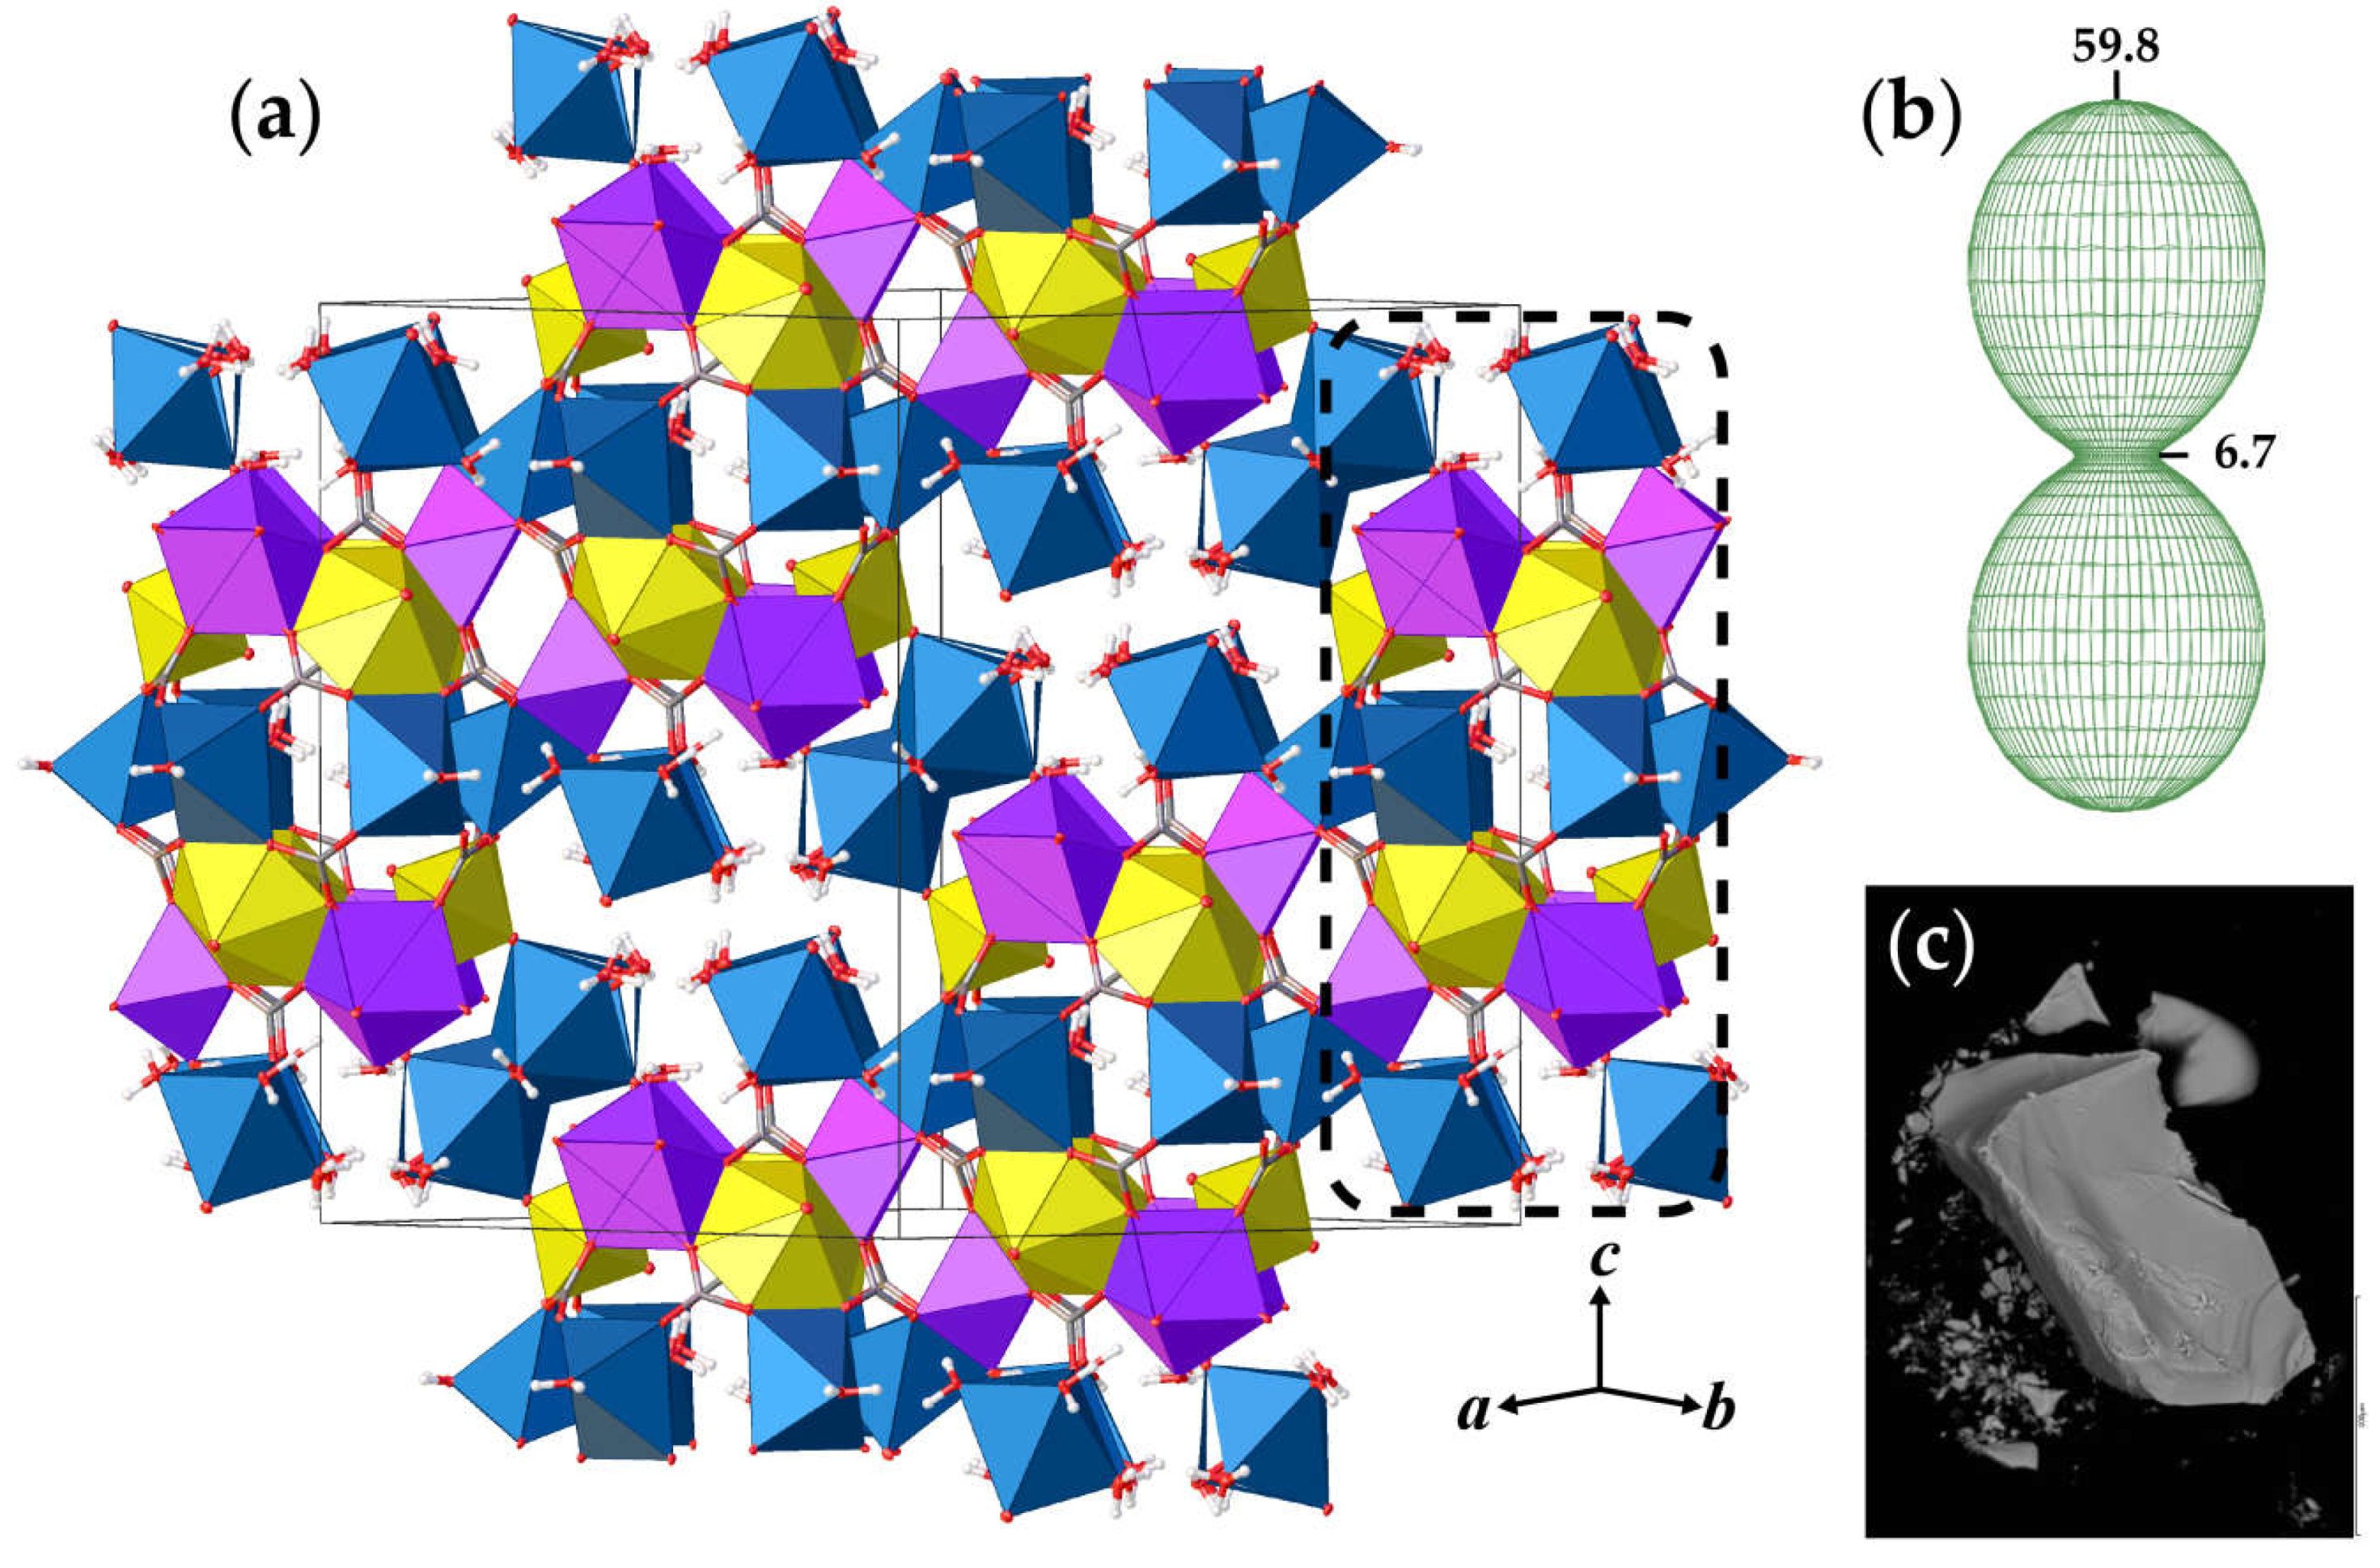
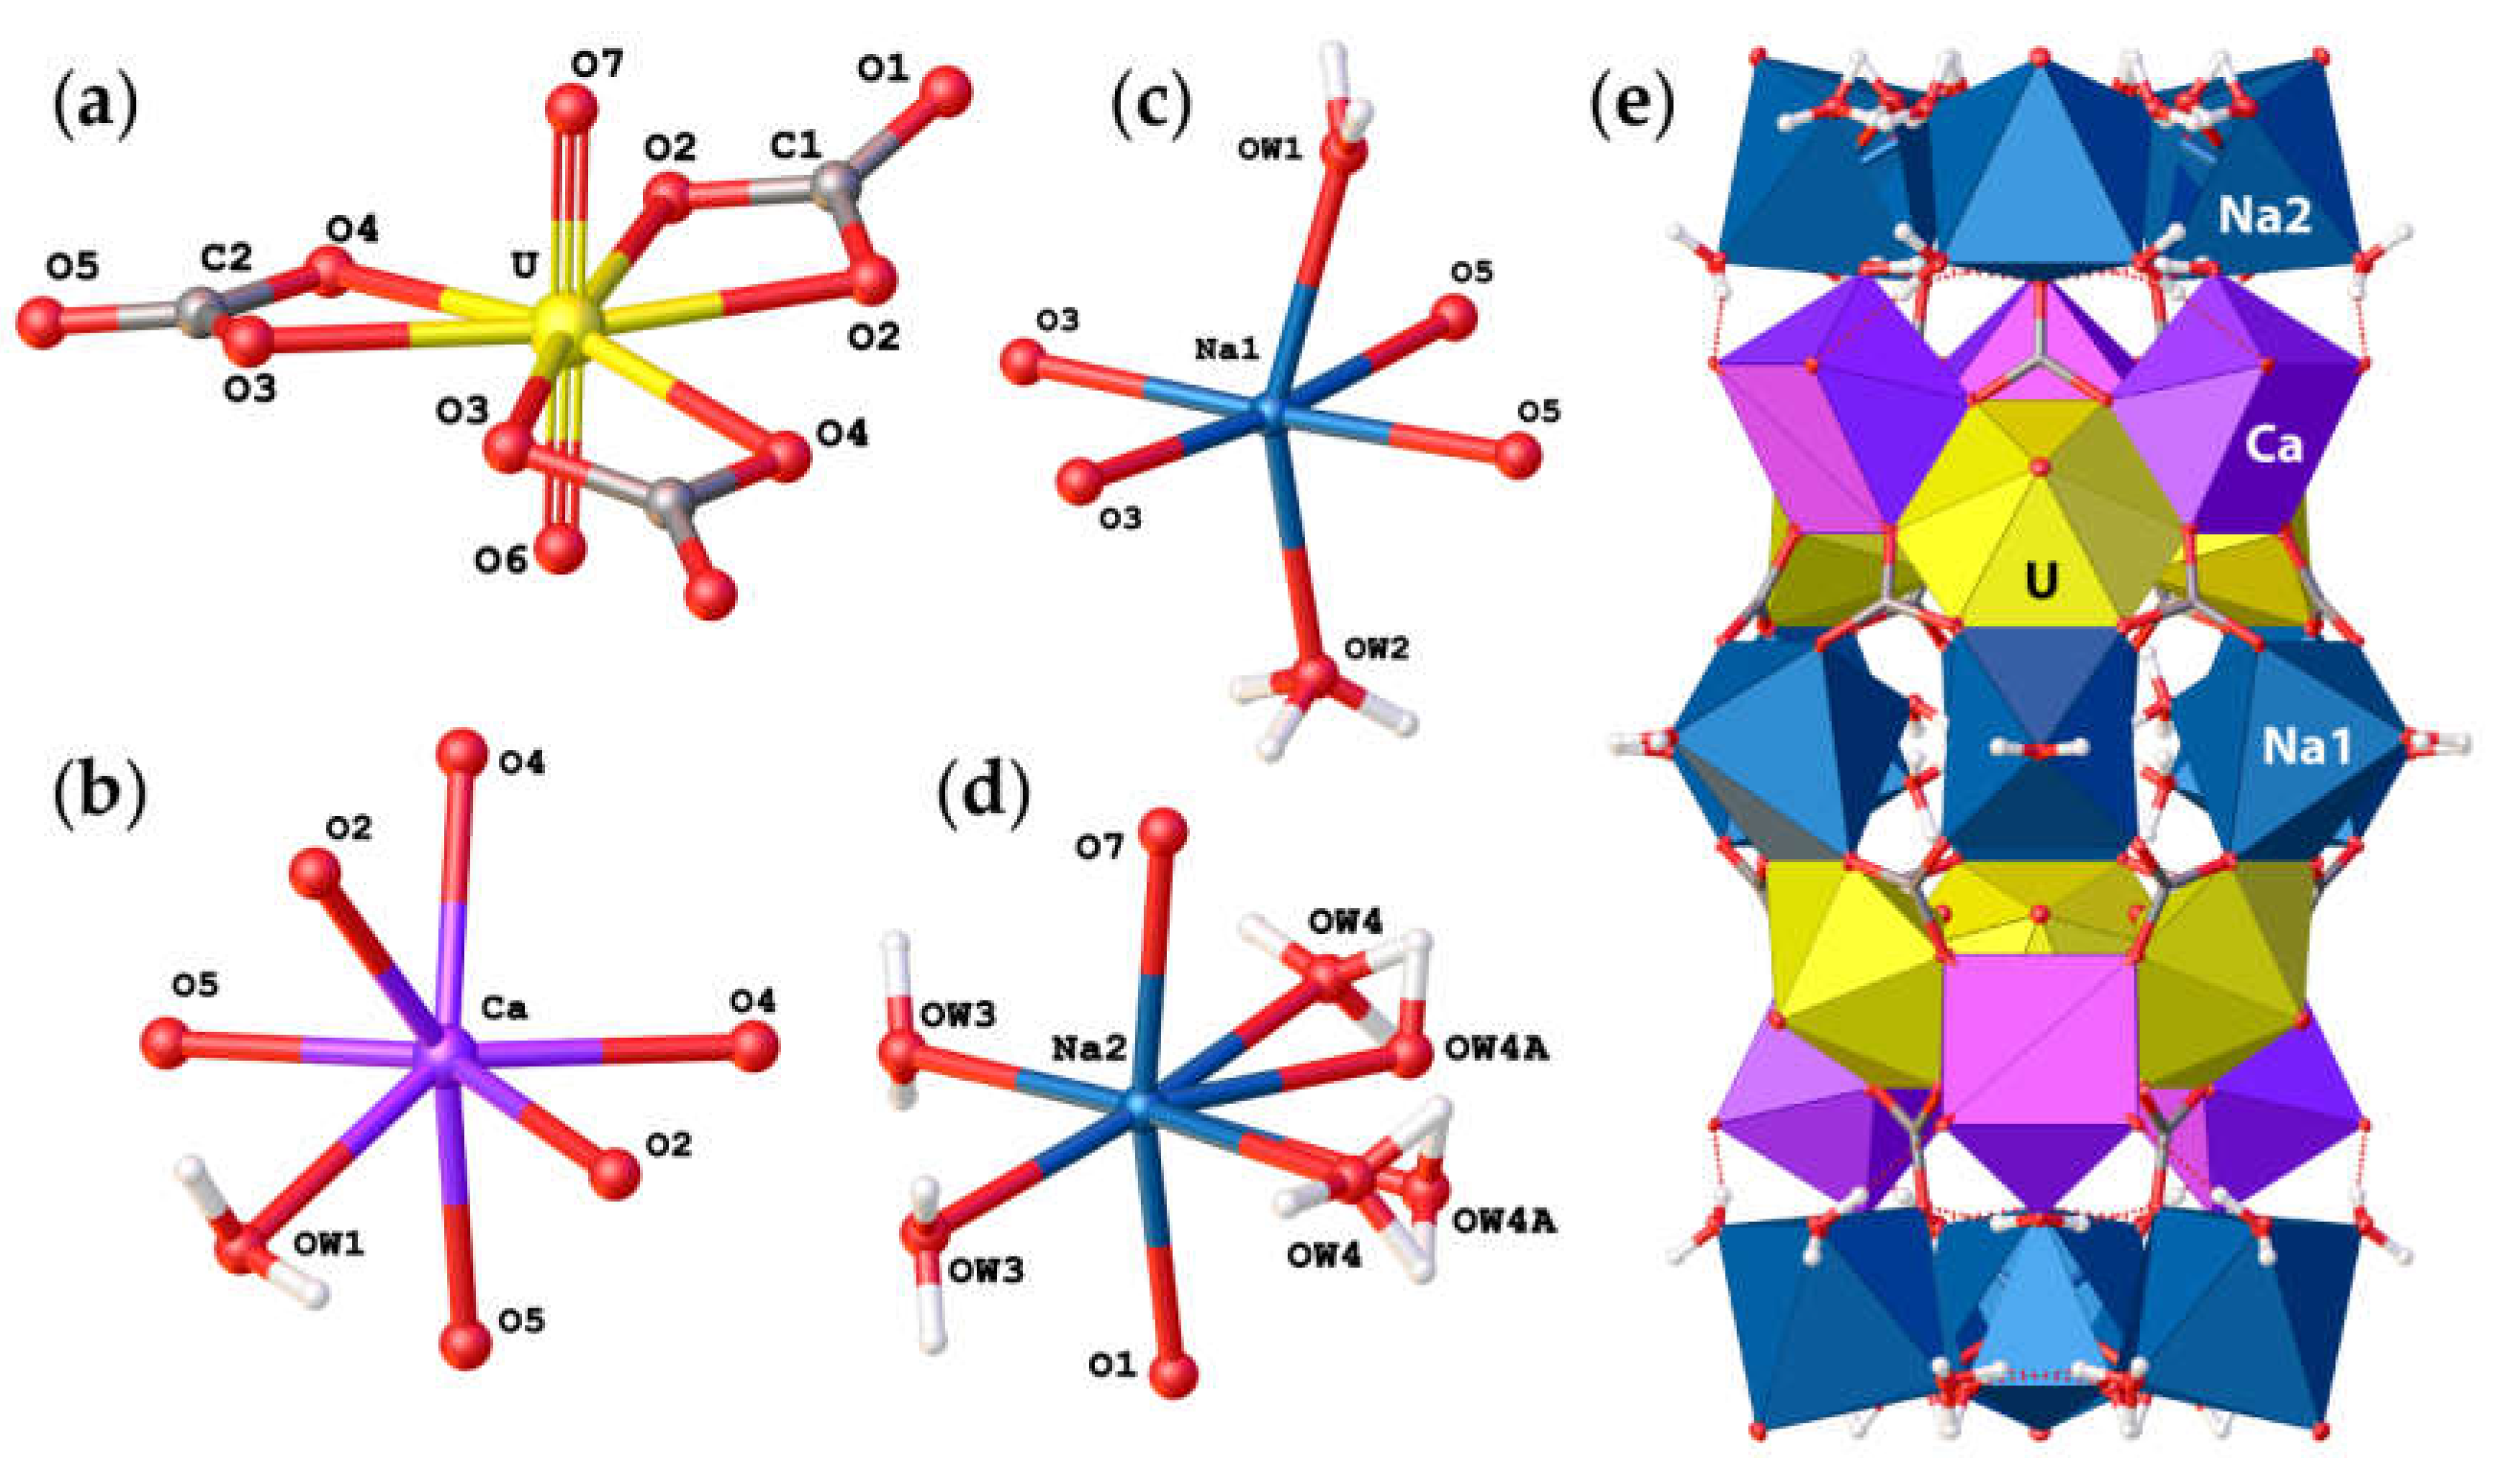
3.1. Structure Description of Andersonite

Andersonite crystallizes in the trigonal R−3m space group and contains one crystallographically nonequivalent U atom with two short U6+≡O2− bonds forming an approximately linear UO22+ uranyl ion (Ur), with <U–OUr> = 1.788 Å. The Ur cation is coordinated by six oxygen atoms <Ur-Oeq> = 2.436 Å that belong to carbonate groups that are arranged in the equatorial plane of the UO8 hexagonal bipyramid, see Figure 2a. The Ca2+ atom is coordinated by seven O atoms, six of which belong to the carbonate groups and one which is the H2O1 molecule, see Figure 2b, with an average distance of 2.38 Å. Na1+ cations possess a slightly distorted octahedral coordination consisting of two H2O molecules at the apical vertices and four O atoms of the carbonate groups within the equatorial plane, as shown in Figure 2c. Na2+ cations have a more distorted coordination geometry due to splitting of the H2OW4 water molecule into two crystallographically nonequivalent OW4 and OW4A sites with total site occupancy factors (s.o.f). equal to 1.0, see Table 3 and Figure 2d. Most likely, the assignment of two individual sites only became possible after cooling down the sample and thus reducing the thermal displacements of the atoms. It should be noted that the bond length parameters for the structure of andersonite described herein are in good agreement with those studied previously [15,16].
The basic structural units in andersonite are the well-known [37,38] uranyl tricarbonate clusters, UTC, see Figure 2a. Coda et al. [15] defined the structure of andersonite as a framework, consisting of oval, buckyball-like cages, which are formed by six UTC, six Na, and six Ca polyhedra. We suggest an alternative structure description. All four types of coordination polyhedra are stacked as rings successively around the threefold axis sharing edges and vertices in the sequence Na2-Ca-UTC-Na1-UTC-Ca-Na2, thus forming “well-like” units, see Figure 2e, with channels 4.95 Å in diameter along the c axis at (⅓, ⅔, z). These cylinders are connected along [001] mostly by a system of H-bonds, and within the (001) plane by face-sharing pairs of Ca-Na1 and Na2-Na2 polyhedra with the neighbor “well”, forming a second type of narrow channel ~2.8 Å in diameter at (⅓, ⅓, z), with walls formed by H2OW3 and H2OW4 molecules. At the center of the large channel, on the threefold axis, there is an additional position of a “zeolitic” H2OW5 molecule that is split into two nonequivalent sites (OW5 and OW5A) separated by ~1.6 Å. In addition to the OW5A site, there is another peak with a positive electron density of 2.5 e3 that is clearly seen on the difference Fourier map, see Figure 3, which was assigned to the OW5B site. The refinement of occupancies of all “zeolitic” H2O molecules indicated that the formula of the studied crystal of natural andersonite is Na2Ca[(UO2)(CO3)3·5.3(H2O).

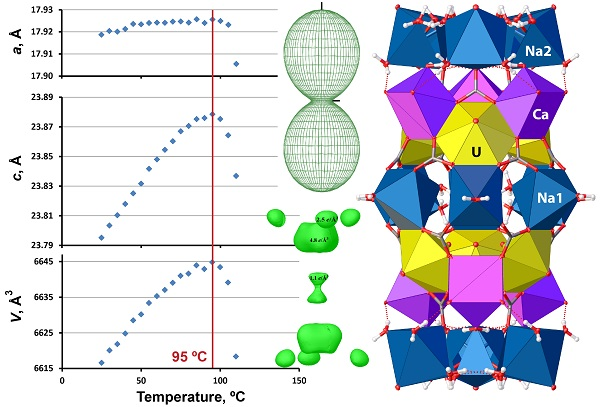
3.2. High-Temperature Behavior of Andersonite

PXRD patterns of andersonite as a function of temperature are shown in Figure 4. The powder pattern of andersonite remains almost unchanged up to 100 °C, where the crystallinity of the U-bearing phase is lost. The only diffraction peaks remaining are attributed to the Pt sample holder and a small amount of quartz contained in the natural sample. Around 340 °C, crystallization of Na4(UO2)(CO3)3 (card no. 01-070-8052 [39]; PDF-2, 2016) begins from the melt, which persists up to 400 °C, after which, the material is amorphous up to almost 550 °C. At 575 °C, diffraction maxima attributed to Ca(UO4) (card no. 01-075-1945 [40]; PDF-2, 2016) are well-defined, and above 600 °C peaks of Na2U2O7 (card no. 01-072-2295 [41]; PDF-2, 2016) appear. Both of the phases exist up to 775 °C, and starting from 700 °C, they transform to sodium uranate (NaUO3, card no. 01-084-1865 [42]; PDF-2, 2016), which is the only distinguishable phase at 800 °C (the low-intensity peak of quartz is overlapped at the highest temperatures). It is worth noting that these results are in agreement with previous thermal analysis studies [20] concerning the stage of andersonite decomposition and with synthetic experiments [40,41,42,43] with regard to the uranate phases’ formation and their subsequent transition.
Plots of the unit-cell parameters of andersonite as a function of temperature, see Figure 4, show a major change in the temperature-dependent character after 95 °C, which corresponds to the beginning of the phase transition process. However, the last diffraction relicts of andersonite are detected to a temperature of 105 °C. Equations describing the temperature dependence of the unit-cell parameters of andersonite within the range of 25–85 °C are: a = 17.912 + 3.29×10⁻⁴ × T − 2.08 × 10⁻⁶ × T2; c = 23.748 + 20.04 × 10⁻⁴ × T − 5.79 × 10⁻⁶ × T2; V = 6598.4 + 0.8 × T − 3.1 × 10⁻³ × T2.

4. Discussion

The low-temperature investigation of the andersonite crystal structure allowed us to characterize the splitting of the OW4 position, which most likely correlates with the distribution and occupancy of the “zeolitic” water molecules (OW5 sites) that are arranged within the large channels of the structure. The quantity of these interchannel molecules may vary, although not significantly considering the 6c multiplicity of the OW5 site. Recently [18], it was suggested that the amount of H2O in the structure of andersonite may vary in the range of 5.3–5.6. Taking into account the well-defined presence of H2OW1–4 molecules within the structure that give the value of five molecules p.f.u., we suggest the formula of andersonite is Na2Ca[(UO2)(CO3)3]·(5+x)H2O, where x ≤ 1.
According to the theory of thermal behavior [44,45,46], the maximal thermal expansion should be along the direction of the weakest bonding. With respect to the framework structure of andersonite, this direction corresponds to the c axis, owing to the H-bonding stacking of the cylindrical “wells”, see Figure 1a, which leaves quite evident gaps in the structural architecture of the mineral. The thermal behavior of andersonite is essentially anisotropic with the lowest values of the main thermal expansion coefficients (TEC), see Table 4, in the direction perpendicular to the channels, whereas maximal expansion is observed in the direction of the channels, see Figure 4. The weak expansion of the structure in the direction perpendicular to the channels is easily explained by the strong bonding of the coordination polyhedra via sharing edges and even faces. Moreover, thermal expansion around 80 °C within the (001) plane becomes negative. The thermal behavior of the structure may be described as follows. Slight variations of the unit cell parameters (especially a) over the low-temperature range may be attributed to the displacement and merging of the OW4 and OW4A sites. Contraction of the structure within the (001) plane above 80 °C most likely relates to the release of “zeolitic” H2OW5(A,B) molecules. Further release of H2OW1–4 molecules results in rapid and irreversible destruction of the framework. Similar behavior has recently been observed for weddellite (CaC2O4·(2+x)H2O) [47], which also has a framework structure with large channels occupied by “zeolitic” H2O molecules.
The information-based complexity parameters [48,49] for andersonite have been calculated using the ToposPro package [50]. It should be taken into account that to process complexity measures all the disordered atoms were removed, leaving only predominantly occupied sites. Complexity calculations show that the crystal structure of andersonite should be described as complex, possessing 4.535 bits/atom and 961.477 bits/cell, which is comparable to the values for another very common natural uranyl carbonate liebigite, Ca2(UO2)(CO3)3·11(H2O) [12] (5.311 bits/atom and 828.523 bits/cell). However, the unit cell volume of andersonite is 1.5 times bigger and the high complexity parameters for liebigite are governed by double the amount of H2O molecules. For comparison, the crystal structures of rutherfordine, (UO2)(CO3) [11], should be considered as very simple (2.236 bits/atom and 15.651 bits/cell), while another uranyl carbonate mineral, ewingite, Mg8Ca8(UO2)24(CO3)30O4(OH)12·138(H2O) [9], is the most complex mineral known (12,684.86 bits/cell without H-atoms correction).

Supplementary Materials

The following are available online at https://www.mdpi.com/2075-163X/8/12/586/s1.

Author Contributions

Conceptualization, V.V.G. and S.V.K.; Methodology, V.V.G., M.G.K. and S.V.K.; Investigation, V.V.G., M.G.K., G.E.S. and A.R.I.; Writing-Original Draft Preparation, V.V.G., S.V.K., P.C.B.; Writing-Review & Editing, V.V.G., S.V.K., G.E.S. and P.C.B.; Visualization, V.V.G. and A.R.I.

Funding

This research was funded by the Russian Science Foundation (grant 18-17-00018 to V.V.G., M.G.K., A.R.I. and S.V.K.).

Acknowledgments

The XRD and EDX measurements have been performed at the X-ray Diffraction Centre and Geomodel Research Centre of the St. Petersburg State University. We are grateful to reviewers for useful comments.

Conflicts of Interest

The authors declare no conflict of interest.

References

  1. Alwan, A.K.; Williams, P.A. The aqueous chemistry of uranium minerals. Part 2. Minerals of the liebigite group. Mineral. Mag. 1980, 43, 665–667. [Google Scholar] [CrossRef]
  2. Clark, D.L.; Hobart, D.E.; Neu, M.P. Actinide Carbonate Complexes and Their Importance in Actinide Environmental Chemistry. Chem. Rev. 1995, 95, 25–48. [Google Scholar] [CrossRef]
  3. Plášil, J. Oxidation–hydration weathering of uraninite: The current state-of-knowledge. J. Geosci. 2014, 59, 99–114. [Google Scholar] [CrossRef]
  4. Baker, R.J. Uranium minerals and their relevance to long term storage of nuclear fuels. Coord. Chem. Rev. 2014, 266–267, 123–136. [Google Scholar] [CrossRef]
  5. Driscoll, R.J.P.; Wolverson, D.; Mitchels, J.M.; Skelton, J.M.; Parker, S.C. A Raman spectroscopic study of uranyl minerals from Cornwall, UK. RSC Adv. 2014, 4, 59137–59149. [Google Scholar] [CrossRef] [Green Version]
  6. Plášil, J.; Čejka, J.; Sejkora, J.; Hloušek, J.; Škoda, R.; Novák, M.; Dušek, M.; Císařová, I.; Němec, I.; Ederová, J. Línekite, K2Ca3[(UO2)(CO3)3]2·8H2O, a new uranyl carbonate mineral from Jachymov, Czech Republic. J. Geosci. 2017, 62, 201–213. [Google Scholar] [CrossRef]
  7. Teterin, Y.A.; Baev, A.S.; Bogatov, S.A. X-ray photoelectron study of samples containing reactor fuel from “lava” and products growing on it which formed at Chernobyl NPP due to the accident. J. Electron. Spectrosc. Relat. Phenom. 1994, 68, 685–694. [Google Scholar] [CrossRef]
  8. Burakov, B.E.; Strykanova, E.E.; Anderson, E. Secondary uranium minerals on the surface of Chernobyl “Lava”. Mat. Res. Soc. Symp. Proc. 1996, 465, 1309–1311. [Google Scholar] [CrossRef]
  9. Olds, T.A.; Plášil, J.; Kampf, A.R.; Simonetti, A.; Sadergaski, L.R.; Chen, Y.-S.; Burns, P.C. Ewingite: Earth’s most complex mineral. Geology 2017, 45, 1007–1010. [Google Scholar] [CrossRef]
  10. Olds, T.A.; Plášil, J.; Kampf, A.R.; Dal Bo, F.; Burns, P.C. Paddlewheelite, a new uranyl carbonate from the Jáchymov district, Bohemia, Czech Republic. Minerals 2018, 8, 511. [Google Scholar] [CrossRef]
  11. Finch, R.J.; Cooper, M.A.; Hawthorne, F.C.; Ewing, R.C. Refinement of the crystal structure of rutherfordine. Can. Mineral. 1999, 37, 929–938. [Google Scholar]
  12. Mereiter, K. The crystal structure of liebigite, Ca2UO2(CO3)3·~11H2O. Tscher. Mineral. Petrog. Mitt. 1982, 30, 277–288. [Google Scholar] [CrossRef]
  13. Axelrod, J.M.; Grimaldi, F.S.; Milton, C.; Murata, K.J. The uranium minerals from the Hillside mine, Yavapai County, Arizona. Am. Mineral. 1951, 36, 1–22. [Google Scholar]
  14. Stefaniak, E.A.; Alsecz, A.; Frost, R.; Mathe, Z.; Sajo, I.E.; Torok, S.; Worobiec, A.; Van Grieken, R. Combined SEM/EDX and micro-Raman spectroscopy analysis of uranium minerals from a former uranium mine. J. Hazard Mater. 2009, 168, 416–423. [Google Scholar] [CrossRef] [PubMed] [Green Version]
  15. Coda, A.; Della Giusta, A.; Tazzoli, V. The structure of synthetic andersonite, Na2Ca[UO2(CO3)3].xH2O (x = 5.6). Acta Cryst. 1981, B37, 1496–1500. [Google Scholar] [CrossRef]
  16. Mereiter, K. Neue kristallographische Daten ueber das Uranmineral Andersonit. Anz. Österr Akad. Wiss. Math.-Naturwiss. K 1986, 123, 39–41. [Google Scholar]
  17. Vochten, R.; van Haverbeke, L.; van Springel, K.; Blaton, N.; Peeters, M. The structure and physicochemical characteristics of a synthetic phase compositionally intermediate between liebigite and andersonite. Can. Mineral. 1994, 32, 553–561. [Google Scholar]
  18. Plášil, J.; Čejka, J. A note on the molecular water content in uranyl carbonate mineral andersonite. J. Geosci. 2015, 60, 181–187. [Google Scholar] [CrossRef]
  19. Coda, A. Ricerche sulla struttura cristallina dell’Andersonite. Atti Accad. Naz. Lincei Rend. Cl. Sci. Fis. Mat. Nat. Ser. 1963, 34, 299–304. [Google Scholar]
  20. Čejka, J.; Urbanec, Z.; Čejka, J., Jr. To the crystal chemistry of andersonite. Neu. Jb. Mineral. Mh. 1987, 11, 488–501. [Google Scholar]
  21. De Neufville, J.P.; Kasdan, A.; Chimenti, R.J.L. Selective detection of uranium by laser-induced fluorescence: A potential remote-sensing technique. 1: Optical characteristics of uranyl geologic targets. Appl. Opt. 1981, 20, 1279–1296. [Google Scholar] [CrossRef] [PubMed]
  22. Amayri, S.; Arnold, T.; Reich, T.; Foerstendorf, H.; Geipel, G.; Bernhard, G.; Massanek, A. Spectroscopic characterization of the uranium carbonate andersonite Na2Ca[UO2(CO3)3]·6H2O. Environ. Sci. Technol. 2004, 38, 6032–6036. [Google Scholar] [CrossRef] [PubMed]
  23. Frost, R.L.; Carmody, O.; Ertickson, K.L.; Weier, M.L.; Čejka, J. Molecular structure of the uranyl mineral andersonite—A Raman spectroscopic study. J. Mol. Struct. 2004, 703, 47–54. [Google Scholar] [CrossRef]
  24. Čejka, J. To the chemistry of andersonite and thermal composition of dioxo-tricarbonatouranates. Coll. Czech. Chem. Commun. 1969, 34, 1635–1656. [Google Scholar] [CrossRef]
  25. Čejka, J.; Urbanec, Z. Thermal and infrared spectrum analyses of natural and synthetic andersonites. J. Therm. Anal. 1988, 33, 389–394. [Google Scholar] [CrossRef]
  26. Vochten, R.; Van Haverbeke, L.; Van Springel, K. Synthesis of liebigite and andersonite, and study of their thermal behavior and luminescence. Can. Mineral. 1993, 31, 167–171. [Google Scholar]
  27. Kubatko, K.-A.; Helean, K.B.; Navrotsky, A.; Burns, P.C. Thermodynamics of uranyl minerals: Enthalpies of formation of rutherfordine, UO2CO3, andersonite, Na2CaUO2(CO3)3(H2O)5, and grimselite, K3NaUO2(CO3)3H2O. Am. Mineral. 2005, 90, 1284–1290. [Google Scholar] [CrossRef]
  28. Clark, R.C.; Reid, J.S. The analytical calculation of absorption in multifaceted crystals. Acta Cryst. 1995, A51, 887–897. [Google Scholar] [CrossRef]
  29. CrysAlisPro Software System, version 1.171.38.46; Rigaku Oxford Diffraction: Oxford, UK, 2015.
  30. Sheldrick, G.M. Crystal structure refinement with SHELXL. Acta Cryst. 2015, C71, 3–8. [Google Scholar]
  31. Dolomanov, O.V.; Bourhis, L.J.; Gildea, R.J.; Howard, J.A.K.; Puschmann, H. OLEX2: A complete structure solution, refinement and analysis program. Appl. Crystallogr. 2009, 42, 339–341. [Google Scholar] [CrossRef]
  32. Burns, P.C.; Ewing, R.C.; Hawthorne, F.C. The crystal chemistry of hexavalent uranium: Polyhedron geometries, bond-valence parameters, and polymerization of polyhedra. Can. Mineral. 1997, 35, 1551–1570. [Google Scholar]
  33. Wood, R.M.; Palenik, G.J. Bond valence sums in coordination chemistry. Sodium−oxygen complexes. Inorg. Chem. 1999, 38, 3926–3930. [Google Scholar] [CrossRef]
  34. Gagné, O.C.; Hawthorne, F.C. Comprehensive derivation of bond-valence parameters for ion pairs involving oxygen. Acta Cryst. 2015, B71, 561–578. [Google Scholar] [CrossRef]
  35. Bruker, A.X.S. Topas V4.2: General Profile and Structure Analysis Software for Powder Diffraction Data; Bruker AXS: Karlsruhe, Germany, 2009. [Google Scholar]
  36. Langreiter, T.; Kahlenberg, V. TEV—A Program for the Determination and Visualization of the Thermal Expansion Tensor from Diffraction Data; Institute of Mineralogy and Petrography, University of Innsbruck: Innsbruck, Austria, 2014. [Google Scholar]
  37. Krivovichev, S.V.; Burns, P.C. Actinide compounds containing hexavalent cations of the VI group elements (S, Se, Mo, Cr, W). In Structural Chemistry of Inorganic Actinide Compounds; Krivovichev, S.V., Burns, P.C., Tananaev, I.G., Eds.; Elsevier: Amsterdam, The Netherlands, 2007; pp. 95–182. [Google Scholar]
  38. Lussier, A.J.; Lopez, R.A.K.; Burns, P.C. A revised and expanded structure hierarchy of natural and synthetic hexavalent uranium compounds. Can. Mineral. 2016, 54, 177–283. [Google Scholar] [CrossRef]
  39. Li, Y.-P.; Krivovichev, S.V.; Burns, P.C. The crystal structure of Na4(UO2)(CO3)3 and its relationship to schroekingerite. Mineral. Mag. 2001, 65, 297–304. [Google Scholar] [CrossRef]
  40. Zachariasen, W.H. Crystal chemical studies of the 5f-series of elements. IV. The crystal structure of CaUO4 and SrUO4. Acta Crystallogr. 1948, 1, 281–285. [Google Scholar] [CrossRef]
  41. Kovba, L.M.; Ippolitova, E.A.; Simanov, Y.P.; Spitsyn, V.I. The X-ray investigation of uranates of alkali elements. Dokl. Akad. Nauk SSSR 1958, 120, 1042–1044. (In Russian) [Google Scholar]
  42. Chippindale, A.M.; Dickens, P.G.; Harrison, W.T.A. A Structural study of the sodium (V) uranate, NaUO3, by time-of-flight powder neutron diffraction. J. Solid State Chem. 1989, 78, 256–261. [Google Scholar] [CrossRef]
  43. Spitsyn, V.I.; Shi-Khua, V.; Kovba, L.M. Investigation of mixed sodium and calcium uranates. Vestn. Moskovskogo Univ. Ser. 2 Khimiya 1962, 5, 60–62. (In Russian) [Google Scholar]
  44. Filatov, S.K. Visokotemperaturnaia Kristallohimia (High-Temperature Crystal Chemistry); Nedra: Leningrad, Russia, 1990. (In Russian) [Google Scholar]
  45. Hazen, R.M.; Downs, R.T. (Eds.) Reviews in Mineralogy and Geochemistry: High-Temperature and High-Pressure Crystal Chemistry; Mineralogical Society of America: Washington, DC, USA, 2001; Volume 41, p. 596. [Google Scholar]
  46. Filatov, S.K. General concept of increasing crystal symmetry with an increase in temperature. Crystallogr. Rep. 2011, 56, 953–961. [Google Scholar] [CrossRef]
  47. Izatulina, A.R.; Gurzhiy, V.V.; Krzhizhanovskaya, M.G.; Kuz’mina, M.A.; Leoni, M.; Frank-Kamenetskays, O.V. Hydrated calcium oxalates: Crystal structures, thermal stability and phase evolution. Cryst. Growth Des. 2018, 18, 5465–5478. [Google Scholar] [CrossRef]
  48. Krivovichev, S.V. Structural complexity of minerals: Information storage and processing in the mineral world. Mineral. Mag. 2013, 77, 275–326. [Google Scholar] [CrossRef]
  49. Krivovichev, S.V. Which inorganic structures are the most complex? Angew. Chem. Int. Ed. 2014, 53, 654–661. [Google Scholar] [CrossRef] [PubMed]
  50. Blatov, V.A.; Shevchenko, A.P.; Proserpio, D.M. Applied topological analysis of crystal structures with the program package ToposPro. Cryst. Growth. Des. 2014, 14, 3576–3586. [Google Scholar] [CrossRef]
Figure 1. The crystal structure of andersonite (a), view approximately along [110], and the arrangement of the figure of thermal expansion coefficients at 50 °C (b) relative to the projection of the structure. SEM image of the andersonite crystal (c). Legend: U, Ca, and Na polyhedra are shown in yellow, lilac, and blue colors, respectively; C, O, and H atoms are shown as grey, red, and white spheres, respectively; the dashed black line designates a building unit (see text for details).
Minerals 08 00586 g001
Figure 2. Coordination of U6+ (a), Ca2+ (b), Na1+ (c), and Na2+ (d) cations in the crystal structure of andersonite, and their arrangement into cylindrical “well-like” units (e). Legend as in Figure 1.
Minerals 08 00586 g002
Figure 3. Arrangement of the positive electron-density peaks (green) within the “zeolite” channel (a), and the geometry details of the residue difference Fourier 3D map (b). The structure of andersonite along the c axis with the maxima of the difference Fourier map shown in green (c), and the final structural model with assigned positions of H2O molecules (d). Legend as in Figure 1.
Minerals 08 00586 g003
Figure 4. Powder X-ray diffraction patterns and the unit cell parameters of andersonite as a function of temperature (25–800 °C) in air (ESDs of the unit cell parameters are within the limits of the symbols).
Minerals 08 00586 g004
Table 1. Crystallographic data and refinement parameters for andersonite, Na2Ca[(UO2)(CO3)3·5.3(H2O).
Crystal SystemTrigonal
Space groupR−3m
a (Å)17.8448(4)
c (Å)23.6688(6)
V3)6527.3(3)
Formula Mass631.25
Size (mm3)0.38 × 0.27 × 0.25
μ (mm–1)11.691
Z18
2θ range, °4.34–55.00
Dcalc (g/cm3)2.891
Total number of reflections11,925
Unique number of reflections1836
Unique I ≥ 2σ(I)1697
Rint0.0342
Rσ0.0218
Final R indexes [I ≥ 2σ(I)]R1 = 0.0182, wR2 = 0.0382
Final R indexes [all data]R1 = 0.0215, wR2 = 0.0390
s1.121
ρmin, ρmin, e/Å3−0.958, 0.945
CSD1877782
Note: R1 = Σ||Fo| − |Fc||/Σ|Fo|; wR2 = {Σ[w(Fo2Fc2)2]/Σ[w(Fo2)2]}1/2; w = 1/[σ2(Fo2) + (aP)2 + bP], where P = (Fo2 + 2Fc2)/3; s = {Σ[w(Fo2Fc2)]/(np)}1/2 where n is the number of reflections and p is the number of refined parameters.
Table 2. Atomic coordinates, isotropic displacement parameters (Å2), site occupancy factors (s.o.f.), and bond-valence sums (BVS, in valence units (v.u.)) for andersonite.
AtomxyzUeqs.o.f.BVS *
U0.55663(2)0.44337(2)0.67846(2)0.00420(7)16.18
Na10.51663(6)0.48337(6)0.82964(7)0.0070(4)11.13
Na20.54058(7)0.45942(7)0.44251(8)0.0131(4)10.93
Ca0.45594(3)0.54406(3)0.94394(4)0.00413(18)12.21
C10.59021(15)0.40979(15)0.56575(19)0.0071(9)13.98
C20.6832(2)0.5986(2)0.73519(13)0.0049(6)13.99
O10.59553(11)0.40447(11)0.51354(13)0.0088(4)11.63
O20.52559(15)0.35307(15)0.59583(9)0.0088(4)12.14
O30.60320(14)0.55322(15)0.75196(9)0.0079(5)11.97
O40.69945(15)0.57427(15)0.68723(9)0.0072(5)12.04
O50.59310(14)0.58736(14)0.90360(9)0.0049(4)11.92
O60.60695(11)0.39305(11)0.71534(13)0.0103(7)11.67
O70.50574(11)0.49426(11)0.64221(14)0.0109(7)11.80
OW10.43997(11)0.56003(11)0.83858(14)0.0049(4)0.928(5)0.40
HW10.459(3)0.6150(13)0.8367(17)0.015(11)0.928(5)-
OW20.58955(11)0.41045(11)0.86128(14)0.0098(7)10.19
HW2A0.598(2)0.402(2)0.8967(12)0.026(18)1-
HW2B0.564(4)0.357(3)0.845(3)0.04(3)0.5-
OW30.5924(2)0.5924(2)0.5000000.0116(7)10.28
HW30.611(3)0.6376(19)0.4778(14)0.017(11)1-
OW40.4728(2)0.3219(2)0.39299(12)0.0166(8)0.881(6)0.16
HW40.4155(14)0.296(4)0.396(3)0.06(2)0.881(6)-
OW4A0.5289(17)0.3323(14)0.3882(9)0.0166(8)0.119(6)0.13
HW4A0.497(3)0.334(7)0.3590(11)0.05(3)0.5605-
HW4B0.488(2)0.2806(12)0.399(2)0.0820.5605-
OW50.6666670.3333330.4217(6)0.089(8)0.76(3)-
HW50.6946(4)0.3054(4)0.434(3)0.1340.507(19)-
OW5A0.6666670.3333330.354(4)0.089(8)0.072(5)-
HW5C0.6380000.3620000.3607010.1340.048(4)-
OW5B0.7265(14)0.2735(14)0.4583(17)0.0049(4)0.072(5)-
HW5A0.7374990.2625000.4905490.0070.072(5)-
HW5B0.6975000.3025000.4651200.0070.072(5)-
* bond valence sums were calculated using the following parameters: U [32], Na [33], Ca [34] and C [34].
Table 3. Selected bond lengths (Å) in the crystal structure of natural andersonite (this work) compared to those in the structures of synthetic analogs [15,16].
Bond This WorkCoda et al. [15]Mereiter [16]
U–O6 1.784(3)1.776(14)1.775(5)
U–O7 1.792(3)1.808(14)1.780(5)
<U–OUr> 1.7881.801.778
U–O2×22.416(2)2.414(14)2.413(3)
U–O3×22.435(2)2.440(17)2.433(4)
U–O4×22.458(2)2.461(18)2.460(4)
<U–Oeq> 2.4362.442.435
Ca–O2×22.304(2)2.311(17)2.324(5)
Ca–O4×22.396(2)2.384(15)2.404(4)
Ca–O5×22.368(2)2.364(16)2.370(4)
Ca–OW1 2.542(3)2.557(18)2.555(6)
<Ca–O> 2.3832.382.393
Na1–O3×22.323(3)2.300(17)2.336(4)
Na1–O5×22.416(3)2.464(16)2.437(4)
Na1–OW1 2.379(4)2.429(13)2.398(5)
Na1–OW2 2.375(4)2.402(13)2.378(5)
<Na1–O> 2.3722.392.387
Na2–O1 2.390(4)2.427(19)2.419(6)
Na2–O7 2.464(4)2.47(2)2.498(6)
Na2–OW3×22.479(3)2.531(16)2.487(5)
Na2–OW4×22.427(3)2.42(3)2.434(7)
Na2–OW4A×22.52(2)
<Na2–O> 2.4632.472.460
C1–O1 1.247(5)1.30(6)1.245(7)
C1–O2×21.301(3)1.27(4)1.289(6)
C2–O3 1.302(4)1.31(3)1.300(6)
C2–O4 1.299(4)1.30(3)1.295(6)
C2–O5 1.255(4)1.26(3)1.243(7)
Table 4. The main coefficients of the thermal expansion αii (i = 1–3) of the structures of andersonite.
Temp., °Cα11α22α33
2512.612.672.1
506.76.759.8
750.90.947.6
95−3.7−3.737.9
α—coefficient of thermal expansion [α11, α22, α33—eigenvalues (main values); ×10–6, °C−1].

