1. Introduction
Dissolution-reprecipitation reactions have been identified to play an important role not only during weathering reactions but also as key mechanism controlling mineral-mineral replacement reactions [
1,
2,
3]. Within the last decade, replacement reactions at ambient and hydrothermal conditions have found increasing attention as examples for this dissolution-reprecipitation mechanism, starting from salt systems for example, KCl-KBr to carbonates [
4,
5], sulphates [
6,
7] to complex silicates [
2,
3].
A special case of such replacement reactions is the uptake of contaminants from aqueous solution during recrystallization and solid solution formation [
6,
8,
9,
10,
11,
12]. Here, the interaction of primary minerals with water and dissolved contaminants leads to a re-equilibration and the formation of a new solid solution. One of the most intensively studied systems is the group of sulphates isomorphic to barite, including the solid solutions between two or three of the end members of the BaSO
4- SrSO
4- RaSO
4- PbSO
4-system in contact with an aqueous solution. In contrast to co-precipitation which is a fast and well-studied process, full re-equilibration of sulphate powders can take from 3 up to several 1000 years [
6,
7,
9,
13,
14].
Among the sulphates, the RaSO
4-BaSO
4-H
2O solid solution-aqueous solution system has received some attention because
226Ra is considered to be relevant not only as important contributor to naturally occurring radioactive materials (NORM) occurring for example, at mining sites [
15,
16] but also as a critical radionuclide with respect to the long-term safety of deep geological nuclear waste disposal. Therefore, the fate of
226Ra in long-term scenarios has found special attention by safety case studies for example, for the high level nuclear waste repositories in Sweden or Switzerland [
17,
18]. In support of these safety case studies, experimental and theoretical studies were performed to fill the knowledge gaps of the thermodynamic data (e.g., [
19,
20,
21]) or to experimentally verify the feasibility of the
226Ra uptake into sulphate solid solutions by recrystallization and replacement reactions, reflecting the situation to be expected in a deep geological nuclear waste repository.
All of the recent recrystallization studies were carried out at close-to-equilibrium conditions. Recent experimental studies at low ionic strength confirmed the uptake of Ra into the binary (Ba,Ra)SO
4 solid solution as well as into the (Sr,Ba,Ra)SO
4 solid solution [
11,
12,
20,
22]. The studies by Klinkenberg et al. (2014) [
10], Weber et al. (2016, 2017) [
11,
12] indicate the structural uptake of Ra into barite via a dissolution re-precipitation mechanism, based on microscopic evidence. A special role was attributed to the internal structure of barite which typically contains fluid inclusions. These fluid inclusions were present in the Sachtleben barite used in the studies by Klinkenberg et al. (2014) [
10] and Weber et al. (2016, 2017) [
11,
12] and provided a pathway for radium to enter the crystal volume of barite. All these experiments started from a solid, which was put into contact with Ra, for example, BaSO
4 or the Sr-rich (Sr,Ba)SO
4 solid solution. The effect of ions in solution was so far only investigated during co-precipitation by Rosenberg et al., 2011 [
13] with respect to ionic strength and regarding Sr in solution by Jucker and Treadwell, 1954 [
23], Ceccarello et al., 2004 [
24] and Ling et al., 2018 [
25]. Background electrolytes can have a significant effect, not only on the solution thermodynamics but also on kinetic barriers for nucleation [
8], barite growth rates [
26,
27,
28,
29] and barite crystal morphology [
30]. In contrast, Sr in solution was observed to specifically interact with barite and Ra, inhibiting the co-precipitation with increasing Sr content in solution [
24]. This indicates a competition of Sr in solution with Ra during the co-precipitation carried out by Ceccarello et al., 2014 [
24]. On the other side, thermodynamic considerations based on atomistic calculations presented in Vinograd et al., 2018b [
21] indicate that the optimum of Ra uptake can be expected in a Ba-rich (Ba,Sr)SO
4 with a ratio of Sr:Ba of about 1:10.
In contrast to previous studies which focused on Sr in the recrystallizing solid or on co-precipitation experiments, we laid the focus on the possible competition of Sr with Ra in solution during the recrystallization of barite. In earlier recrystallization studies by Klinkenberg et al. (2018) [
10] and Vinograd et al. (2018) [
21], SrSO
4 was present in the solid. In the first step of the equilibration process, these lead to the release of equivalent amounts of Sr and sulphate into the aqueous solution. Therefore, a combined effect of additional Sr and sulphate upon the uptake of Ra was studied which in some cases lead to intermediate phases of low solubility and a very dynamic recrystallization process regime. Here, we focus on the ions in solution, especially on Sr
aq and its effect on the structural uptake of Ra into pre-existing BaSO
4. In addition, the effect of ionic strength was monitored which allows for a separation of ionic strength effects from specific effects of additional Sr
aq. We used the same Sachtleben barite to make our results comparable with the earlier studies and assumed that the same dissolution re-precipitation mechanism would lead to a Ra-uptake during recrystallization. In order to test thermodynamic predictions regarding the equilibrium concentrations of Ba, Sr and
226Ra, macroscopic batch experiments were not only performed at ambient temperature but also at elevated temperatures. Furthermore, the solid/liquid ratio was varied to investigate how the relationship between solution, solutes and available surface affects the Ra uptake.
2. Materials and Methods
The general batch experiment setup, including the barite powder and sampling procedure was adapted from earlier recrystallization studies (e.g., [
7,
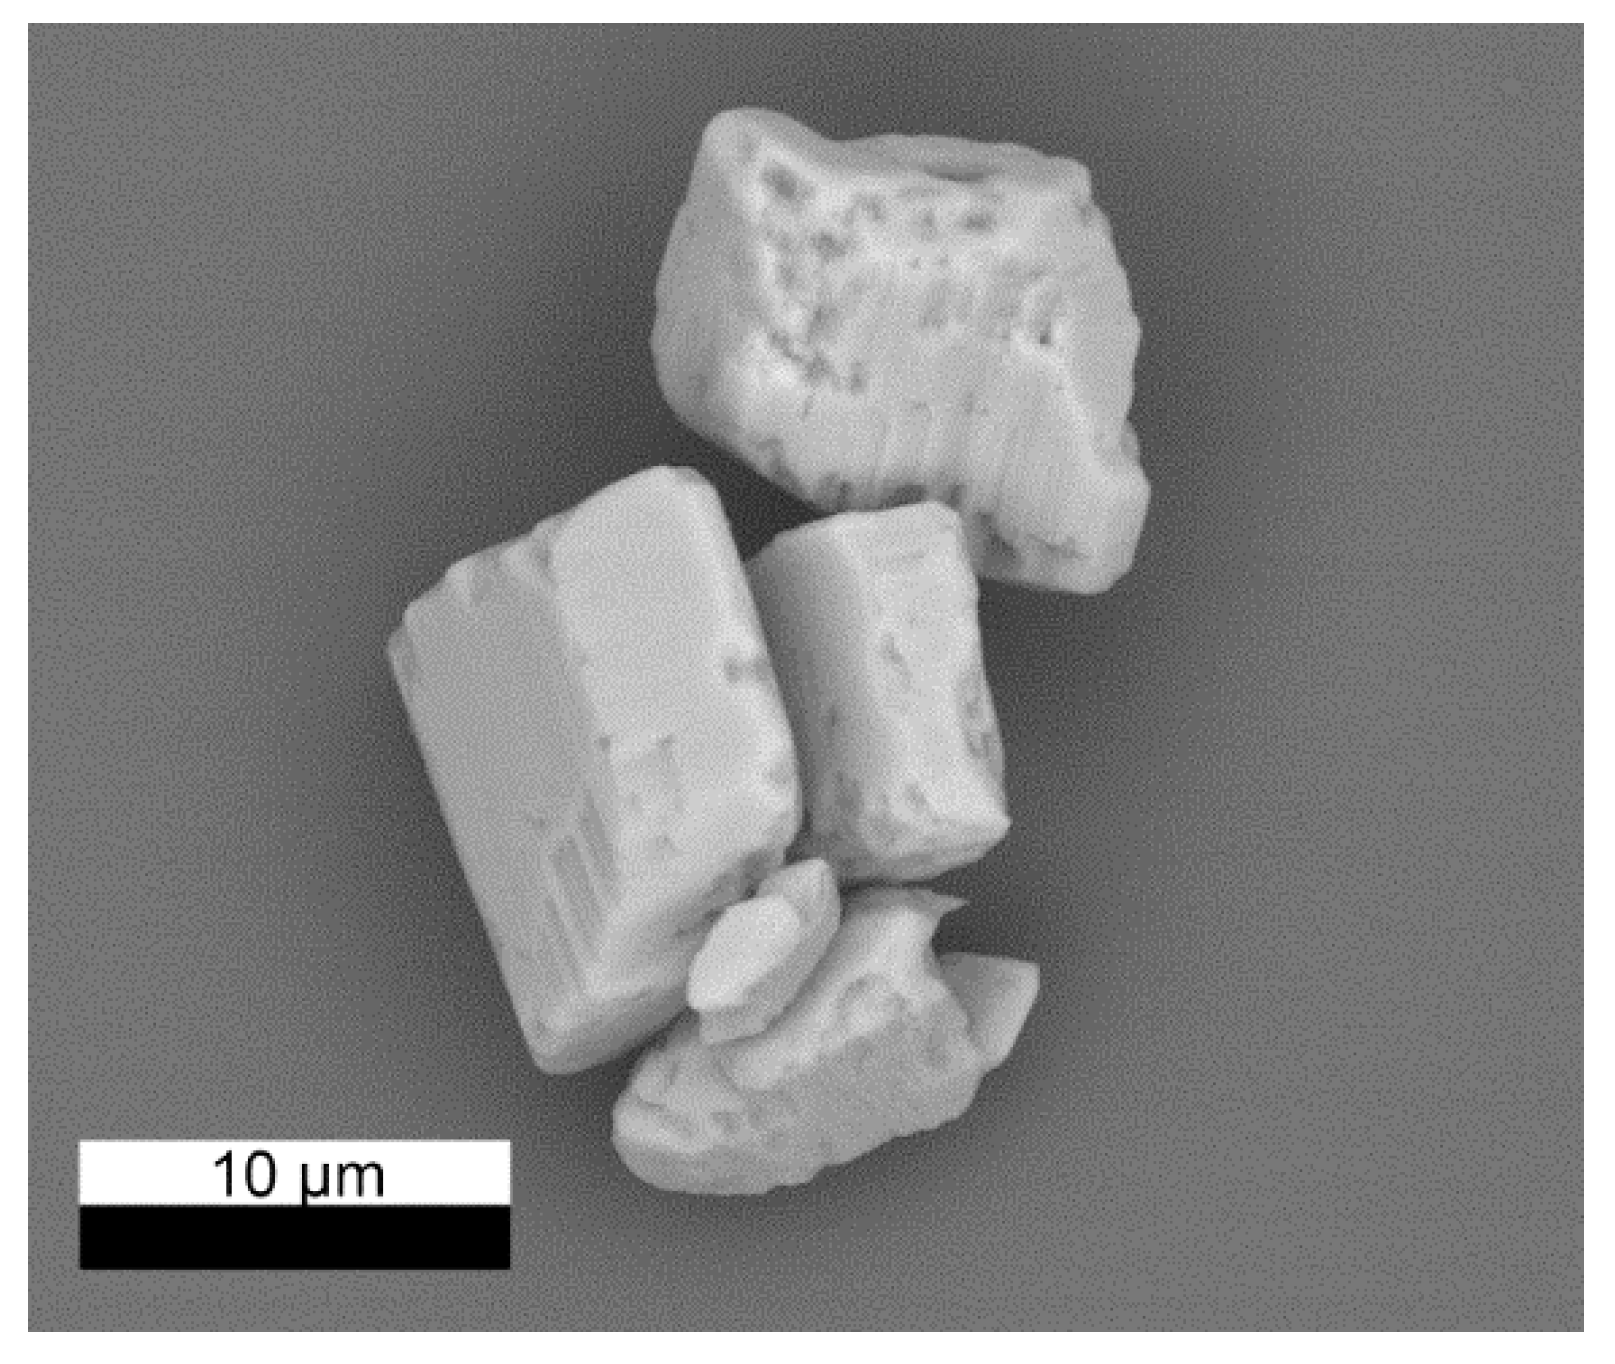
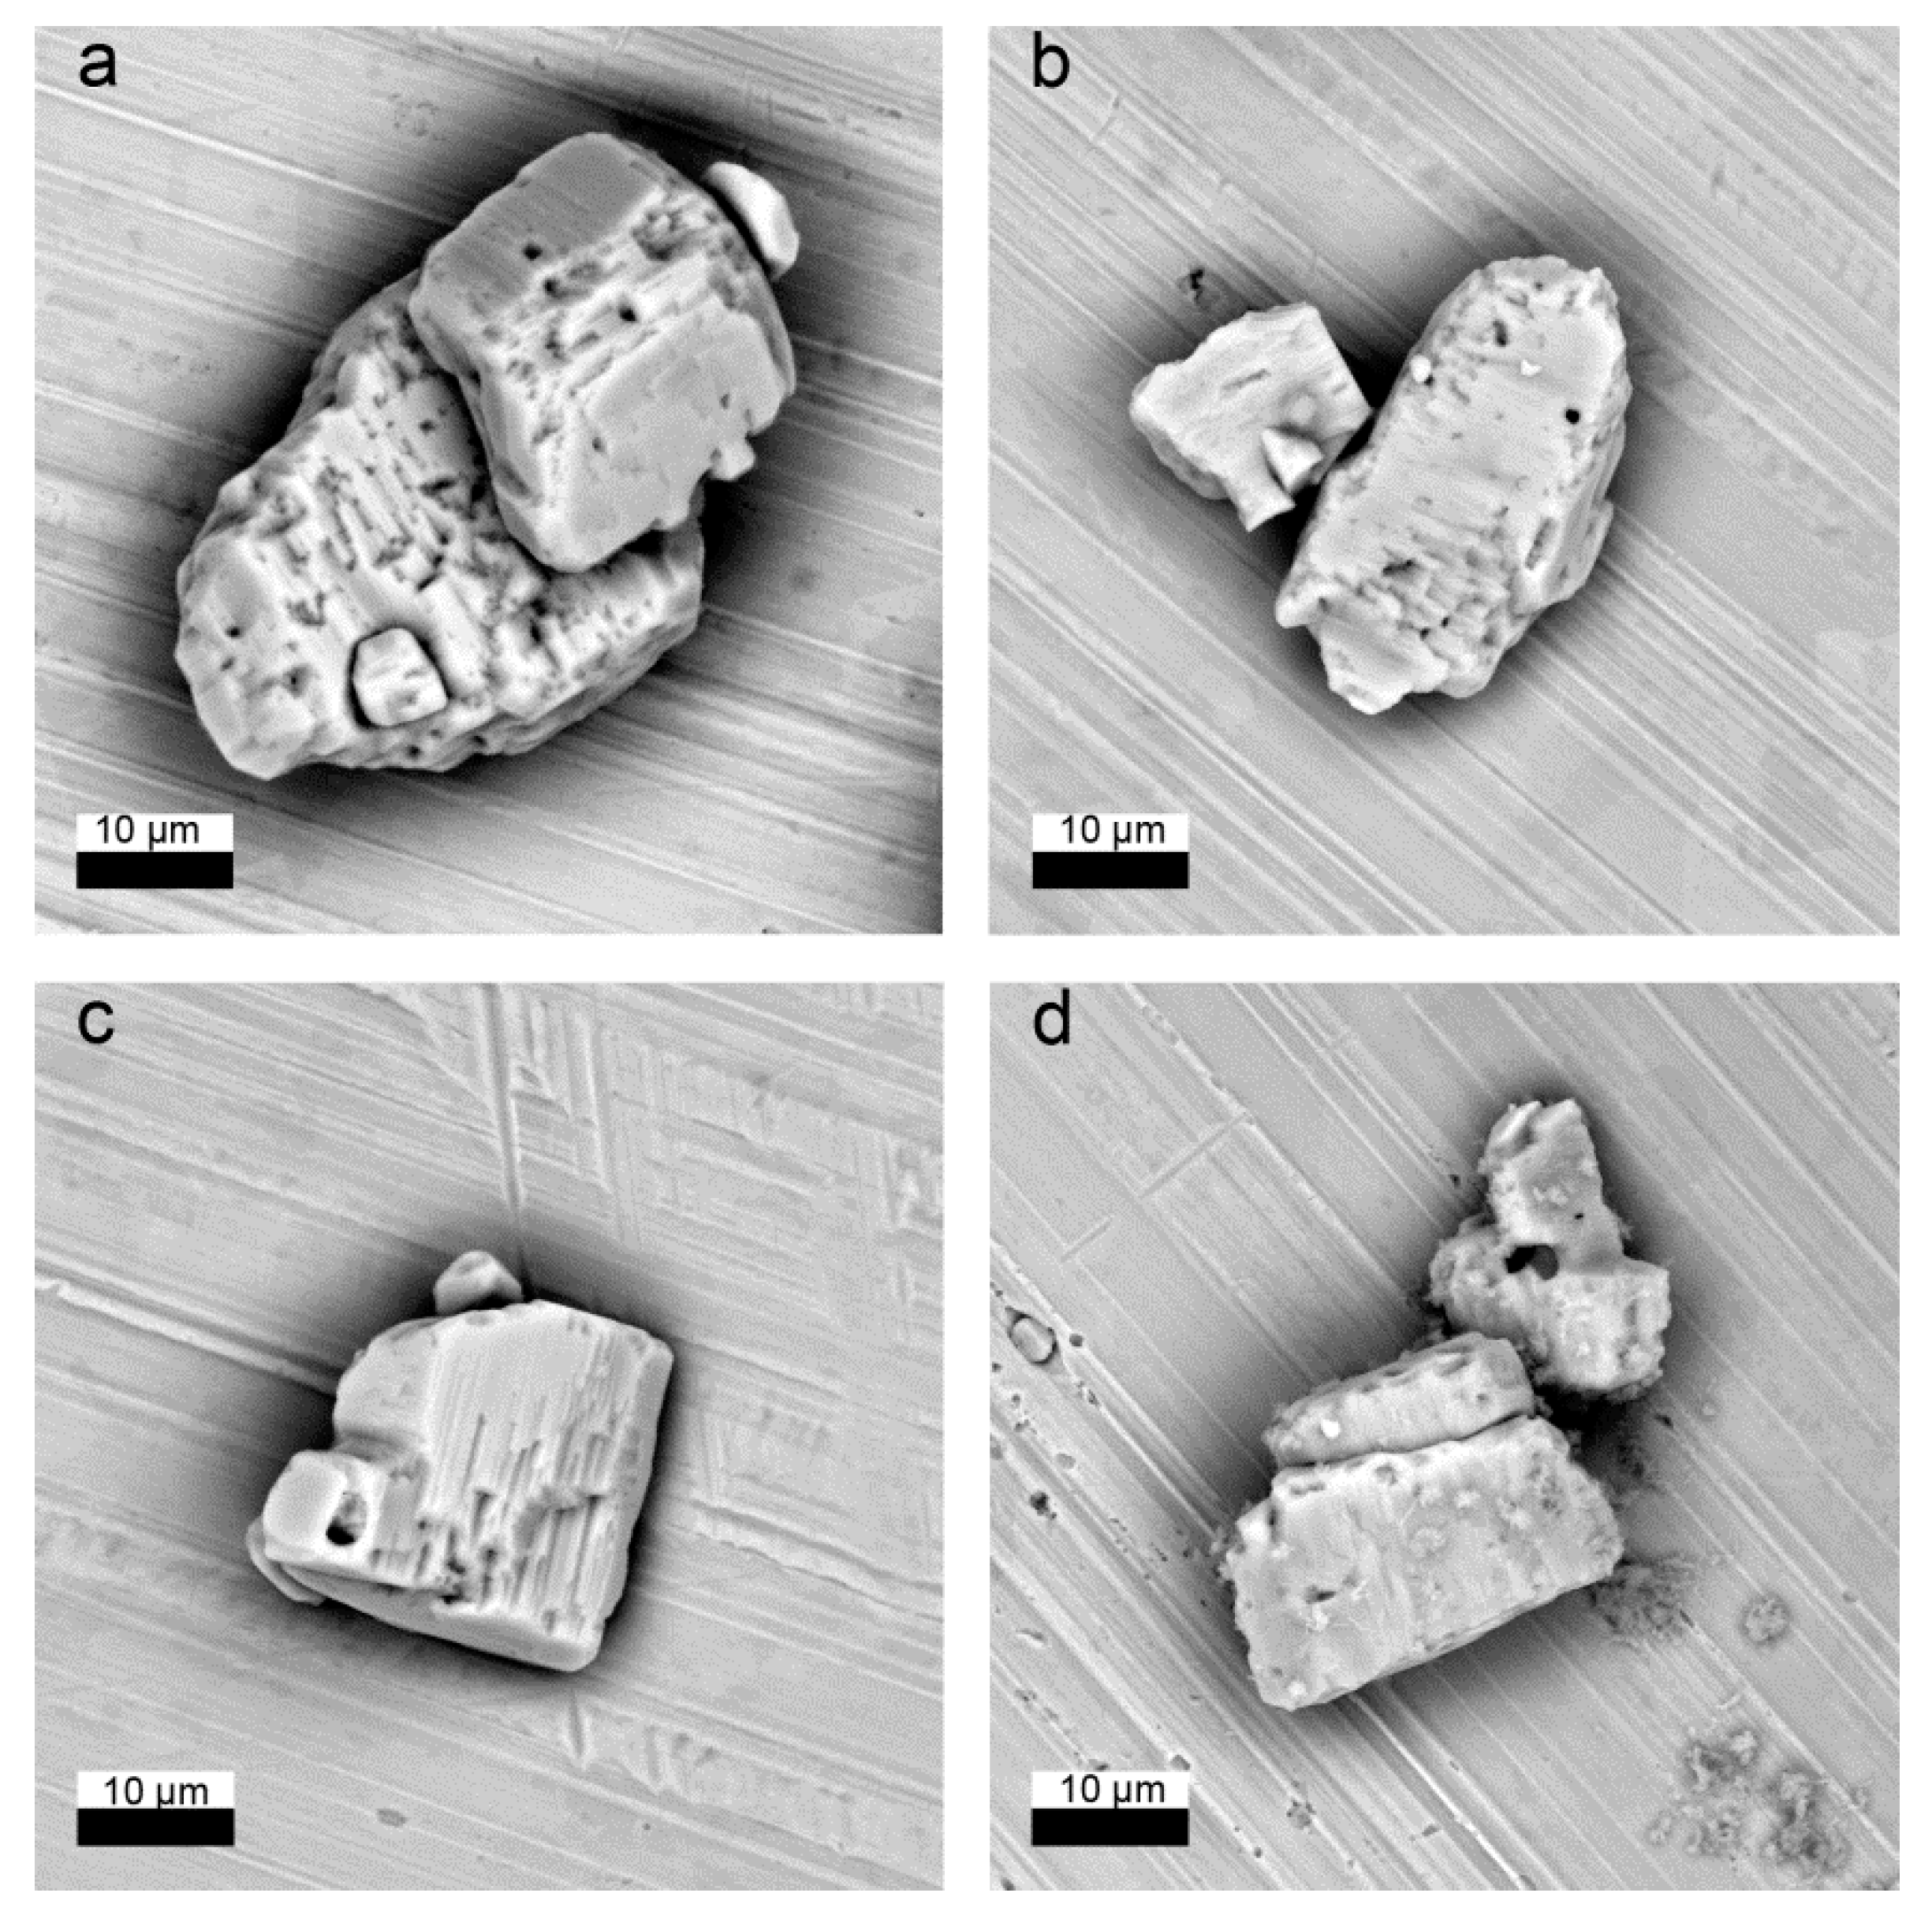
10]) to enable a direct comparison of the new data. Batch recrystallization experiments were performed with barite at 90 °C, 80 °C and ambient conditions (23 ± 2 °C) using 20 mL of solution for each experiment. A commercially available high purity barite (Sachtleben
® XR-HR 10 (Duisburg, Germany),
Figure 1), which has been used as a reference in many earlier studies (e.g., [
6,
22,
31]), was adjusted to grain size dimensions higher than 10 µm (mean grain size: 15 µm) by a sedimentation technique and pre-equilibrated for four weeks at room temperature in 0.2 or 2.0 mol/kg NaCl solution, respectively, before the experiments to avoid high energy surface sites and ultrafine particles which may have an impact on the Ra uptake kinetics. This was the same procedure as in all our earlier studies to allow for comparison of the data. Detailed studies of the same batch of barite as used here showed that there were no other minerals or relevant contamination present. Klinkenberg et al. (2014) [
10] determined a BET-surface area of 0.17 m
2/g for this barite powder. The 25 mL glass vessels used during the experiments were tested for wall adsorption of Ra and no measurable adsorption was detected.
The experiments were carried out with solid/liquid ratios of 5 g/kg and 0.5 g/kg, that is, 0.1 and 0.01 g of barite in 20 g of solution. All recrystallization experiments were started from a concentration of 5.0 × 10⁻⁶ mol/kg RaBr2. High purity NaCl and SrCl2 salts (Merck) were used to adjust the respective concentrations in solution. Samples of the aqueous solution were taken and analysed for 226Ra by γ-spectroscopy and by inductively-coupled plasma mass-spectrometry (ICP-MS) for Sr or Ba, respectively. At regular time intervals 500 µL aliquots of the aqueous solution were taken and directly filtered after a settling time of 1 h through Advantec ultrafilters (MWCO = 10,000 Da). These filters were approved by earlier studies to exclude possible colloids or fine particles due to the close to equilibrium conditions of the experiments. The filters were tested and adsorption of Ra at the given filtered solution amount could also be excluded. The settling time of 1h was required for handling of the hot radioactive solutions (80, 90 °C). According to pre-tests the settling time is much shorter than the time required for barite and 226Ra to re-equilibrate to the lower temperature. A N2 cooled high purity (HP) Ge-detector was used for the quantification of the aqueous 226Ra concentration (Raaq) via γ-spectrometry. The intensity of the Ra peak at 186 keV was determined and converted to a concentration unit (mol/kg). An independent, external standard was used for the calibration of the system. The aqueous Sr and Ba concentrations (Sraq and Baaq) in solution were quantified using the ICP-MS ELAN 6100 DRC (PerkinElmer SCIEX) instrument. The filtered solution was diluted in 0.1 m HNO3 by 1:1000 for Ba and 1:10,000 for Sr-measurements.
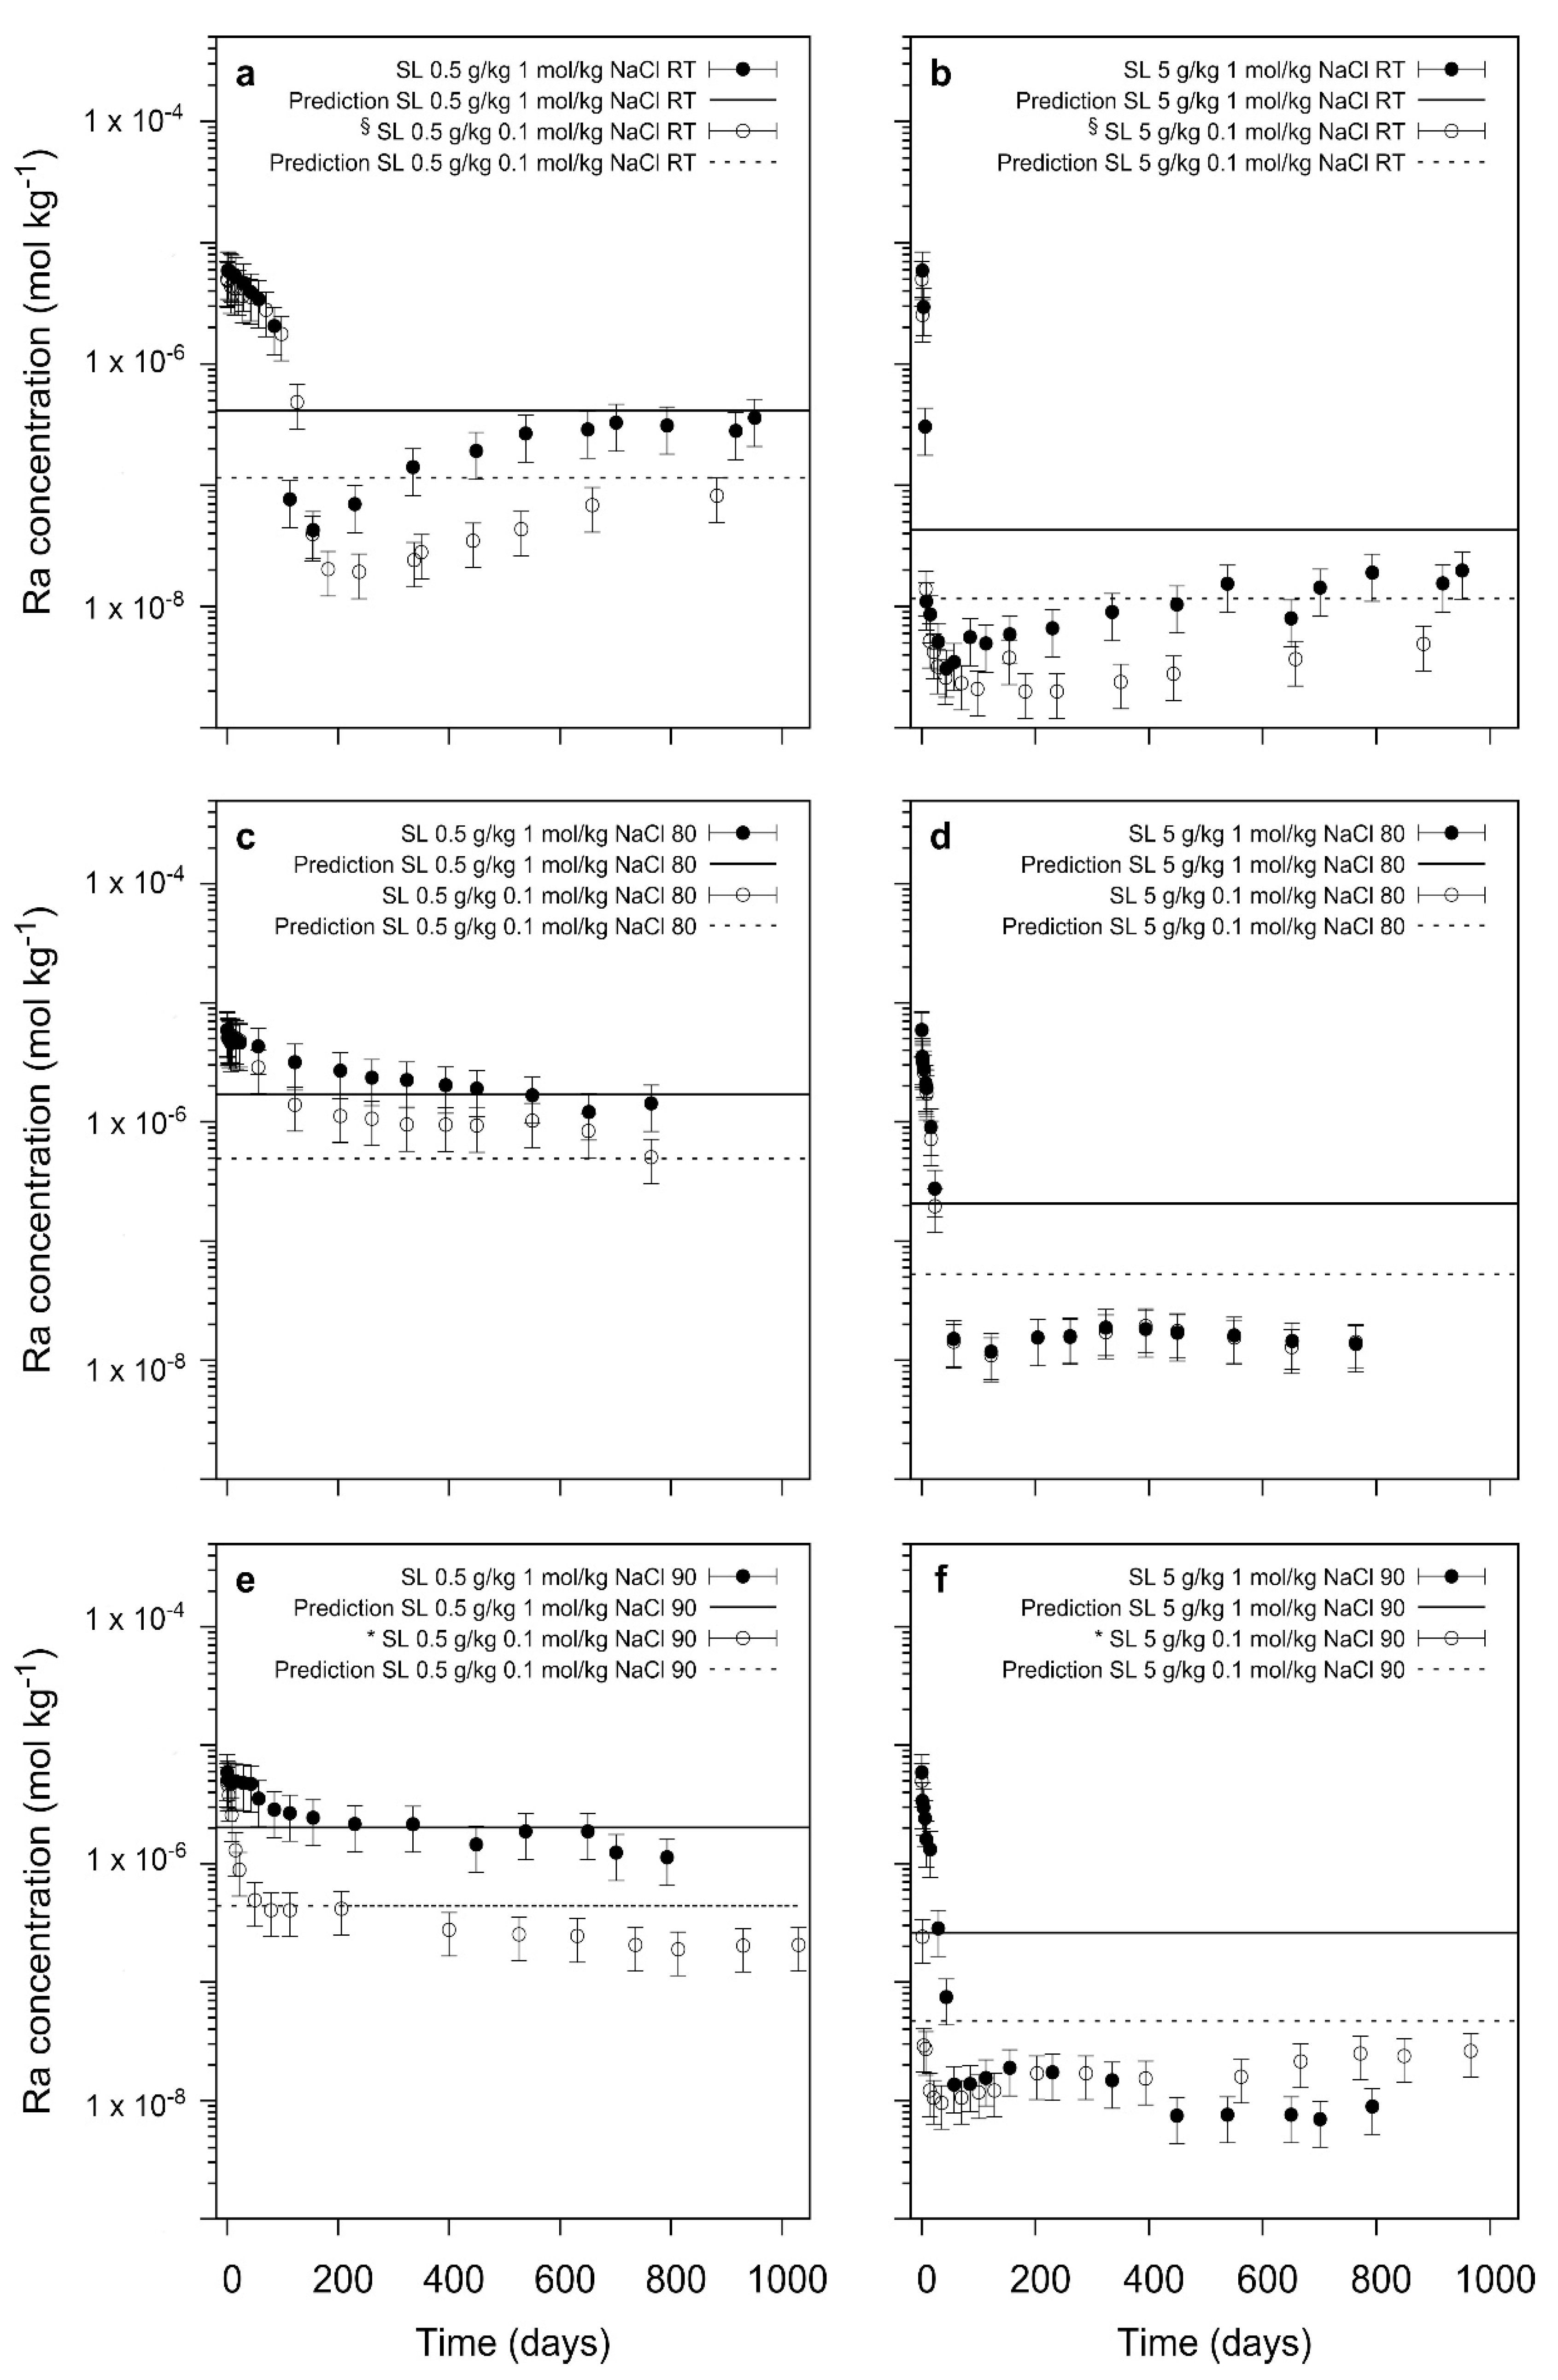
In addition to reference experiments with 0.1 mol/kg of NaCl, two sets of experiments were performed to investigate the influence of (1) elevated ionic strength and (2) Sr in the aqueous solution on the uptake of Ra during the recrystallization of barite:
Experiments with 1.0 mol/kg NaCl at 23 °C, 80 °C and 90 °C, (
Table 1)
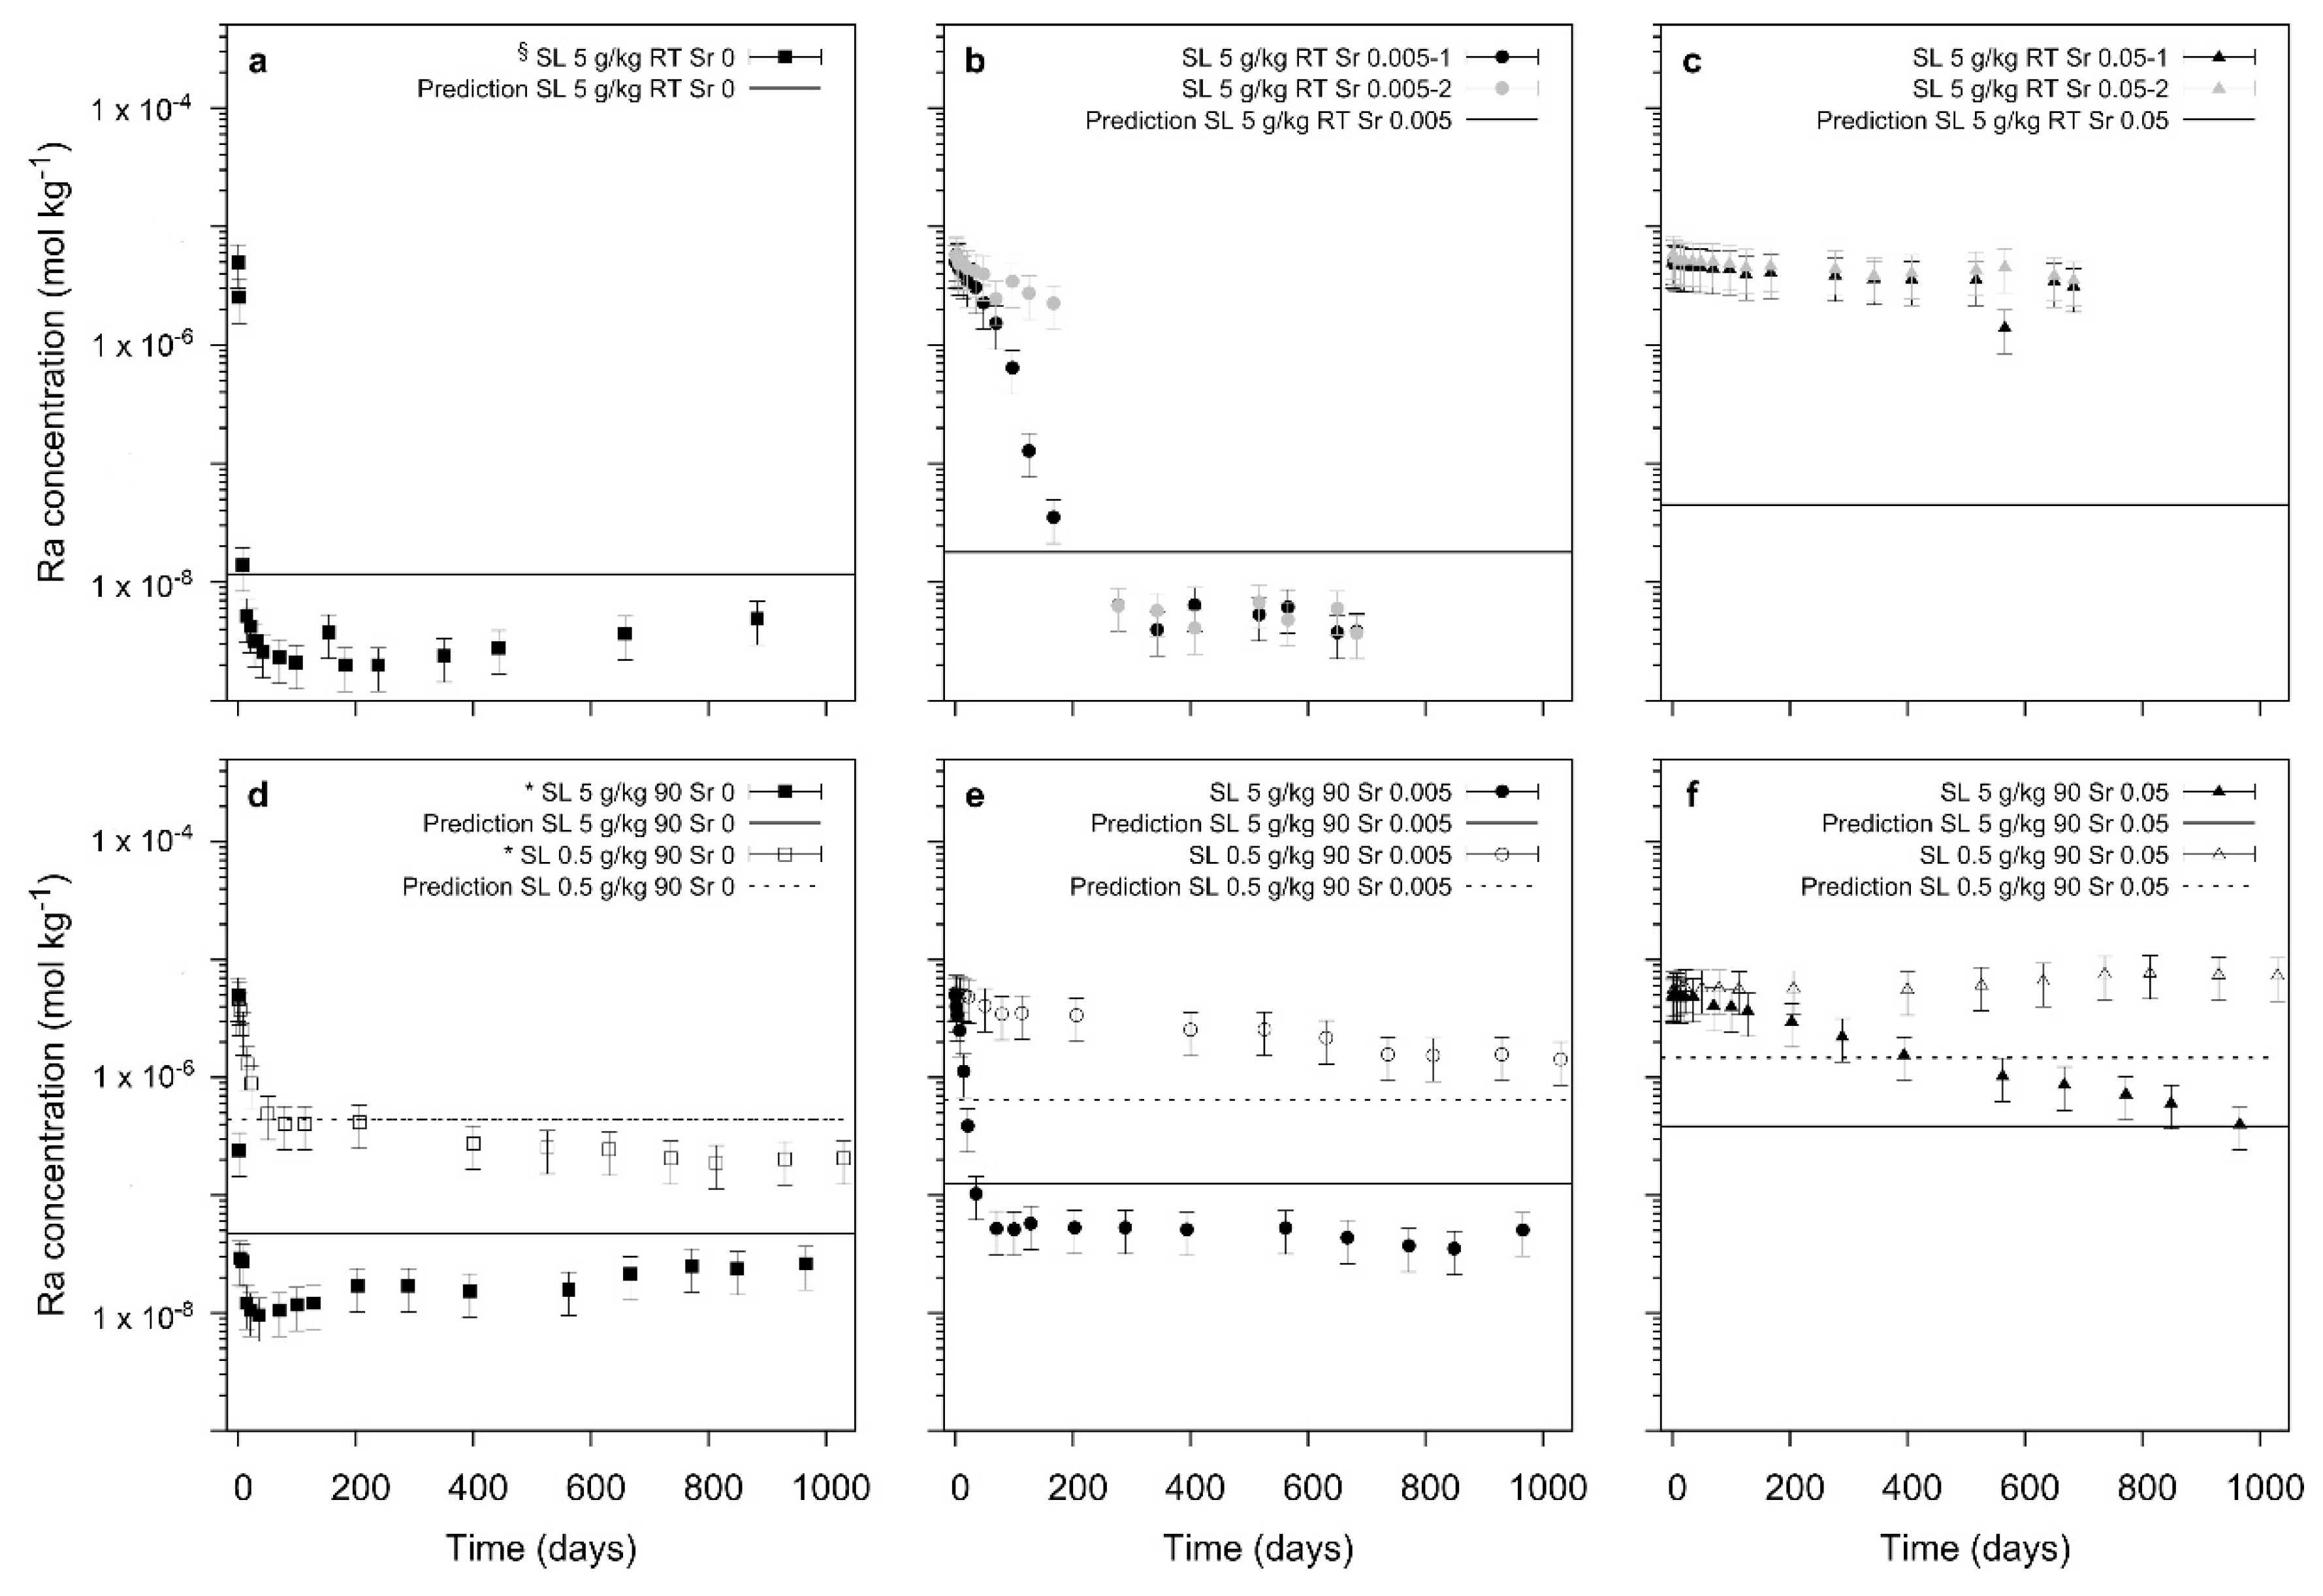
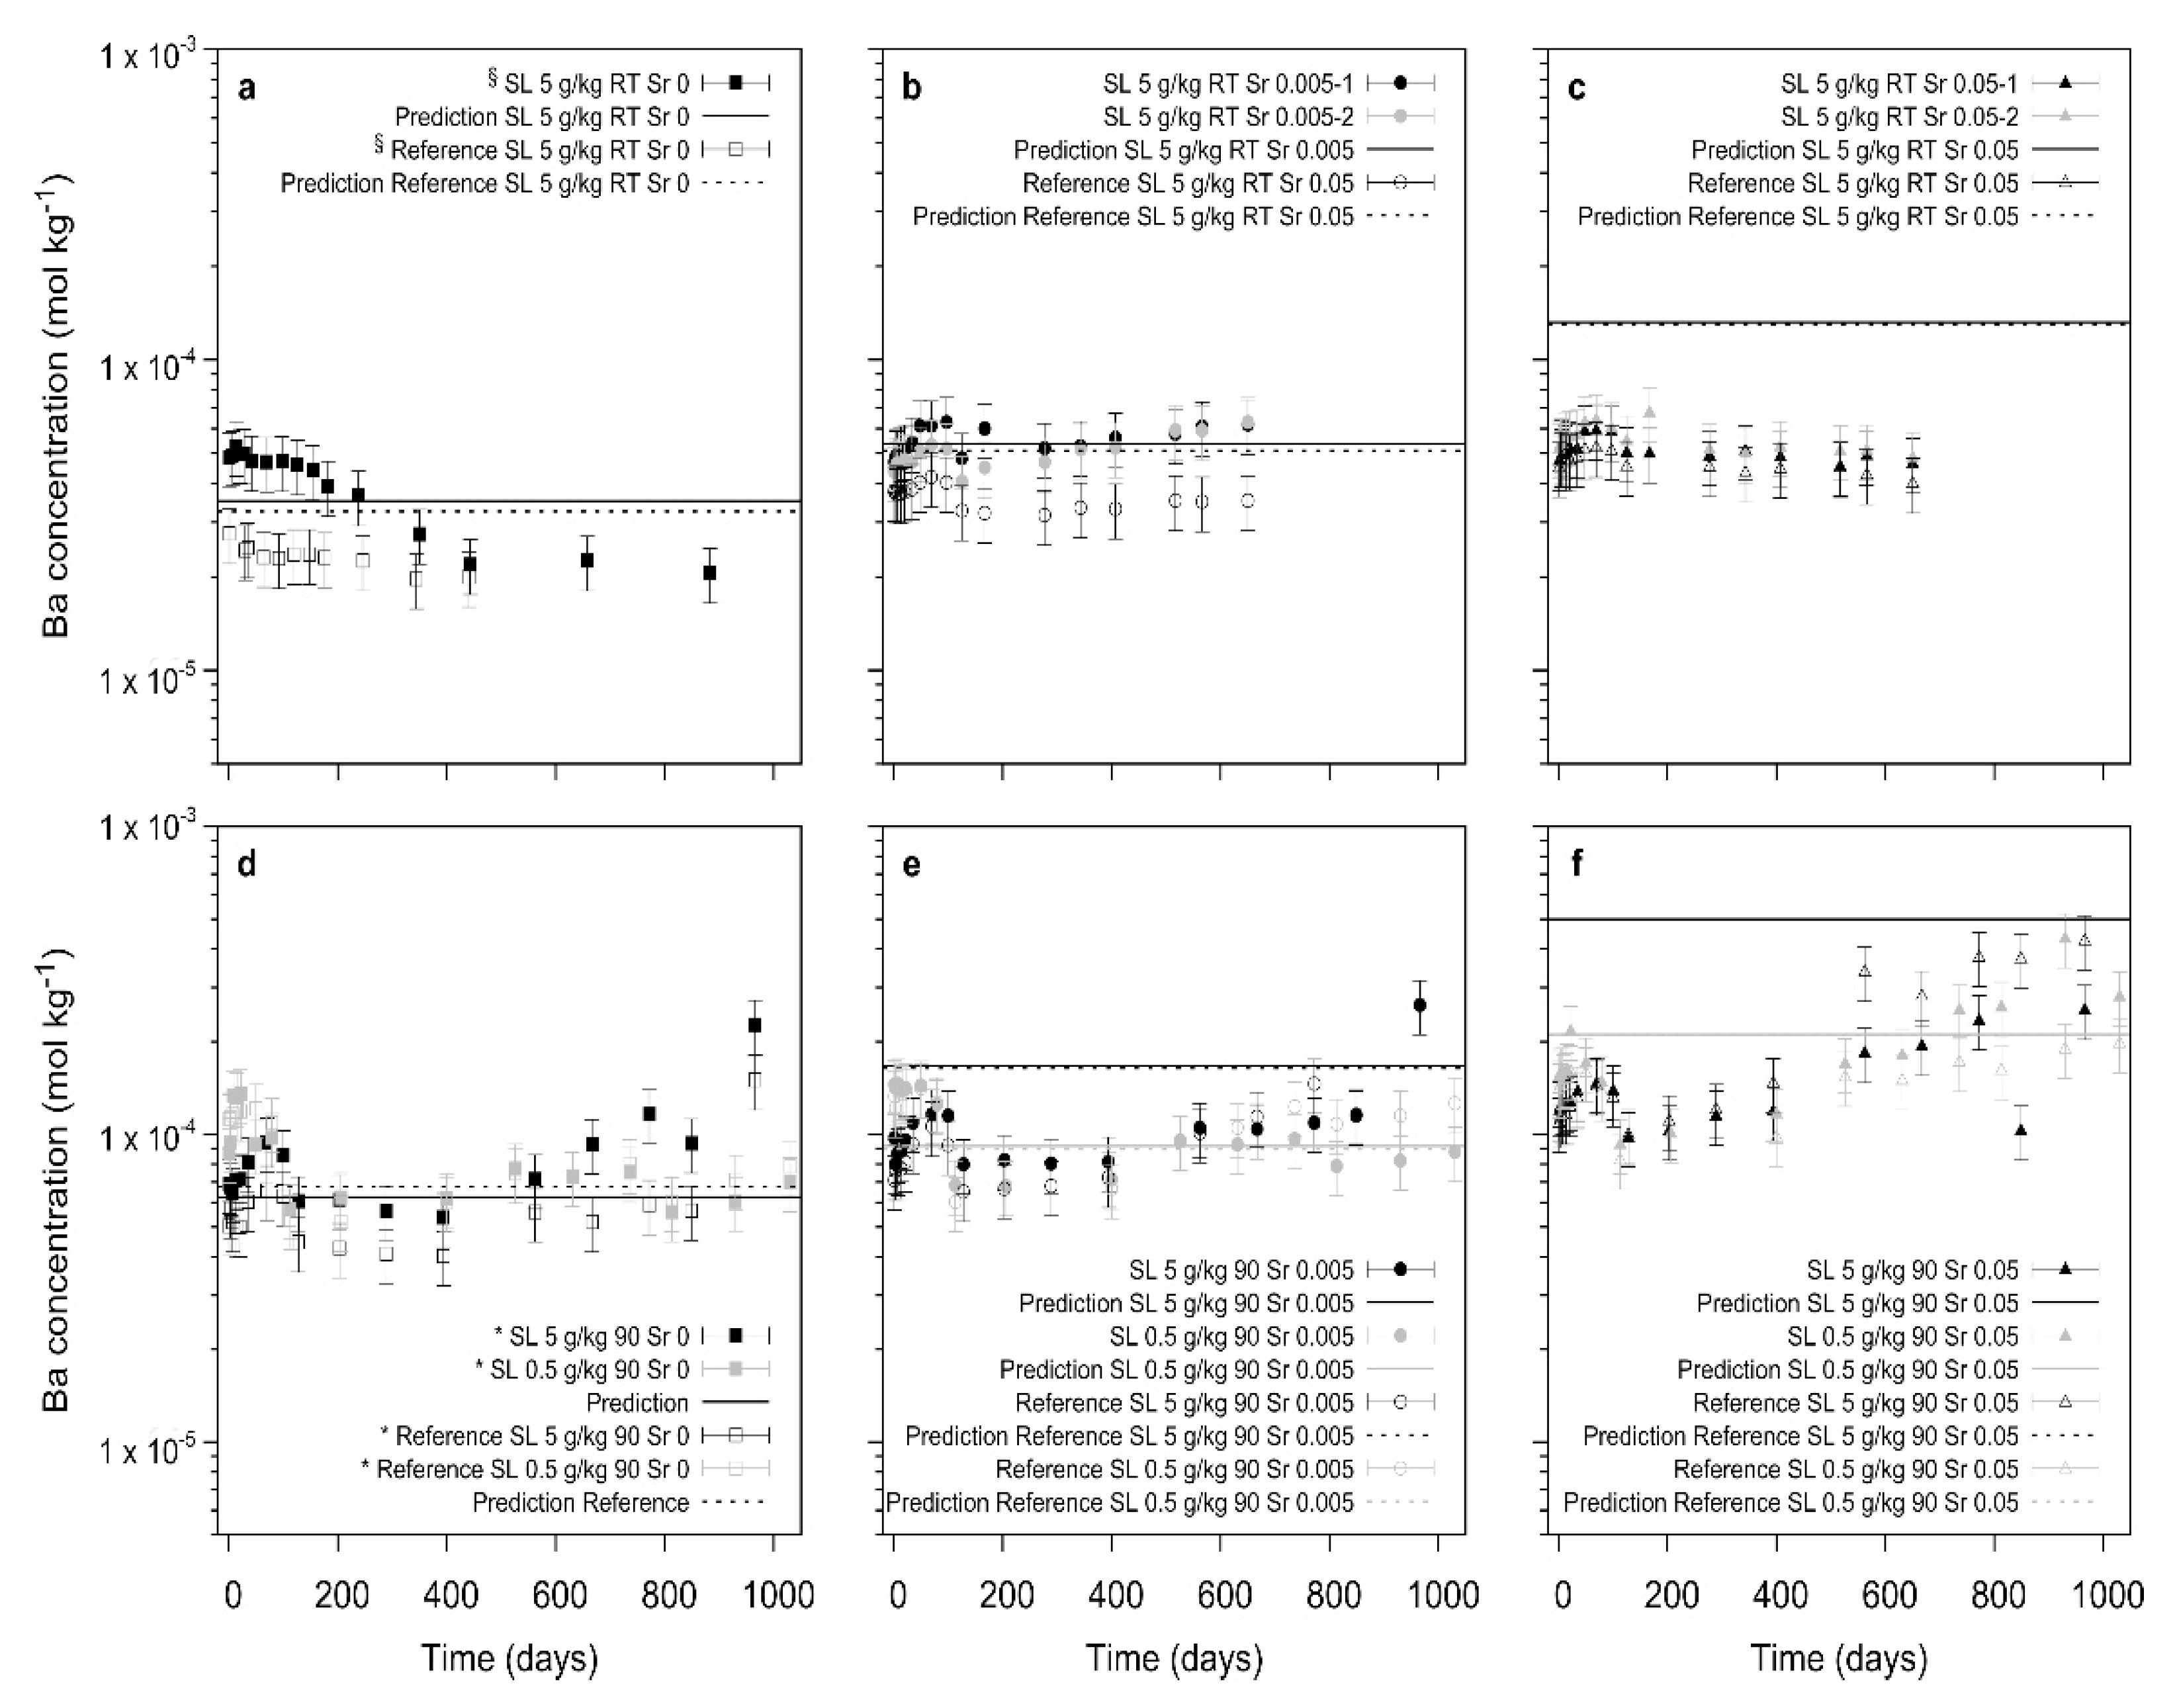
The concentration of Sr
aq was adjusted to either 0.05 mol/kg or 0.005 mol/kg. These concentrations were chosen such that the activity product {Sr
2+}{SO
42−}, as calculated with the GEM-Selector code [
32,
33], was close to or well below the solubility product of pure SrSO
4 (
Table 2).
Small amounts of solid (10 µL of the suspension) were sampled during the recrystallization experiments. The evolution of the crystal morphology and chemical composition were studied using the environmental scanning electron microscope FEI Quanta 200 F (Eindhoven, Netherlands) combined with energy dispersive X-ray spectrometry (EDS, EDAX, Weiterstadt, Germany). In order to avoid artefacts due to precipitation of for example, NaCl, SrSO4 or RaSO4, the samples were separated from their solution by two washing steps in iso-propanol. The samples were then prepared as a suspension on a Cu or Si holder and subsequently dried.
Thermodynamic calculations for solid solution-aqueous solution systems (SS-AS) involve the calculation of the total equilibrium between the solid and the aqueous phase. Different to the case of single-phase equilibria, in which the solution composition is independent of the amount of solid, in the case of SS-AS not only the activities of ions in solution but also of the components of the solid need to be considered. In the case of a pure solid (e.g., barite) in water, the aqueous concentration for example, of Ba2+ for 0.5 or 5 g/kg H2O at thermodynamic equilibrium will be the same. However, this is not the case for a solid solution for example, (Ba,Ra)SO4. For SS-AS equilibria, the solution composition is linked to the composition of the solid. These equilibria were calculated assuming full equilibration of all barite and all cations in solution.
Gibbs energy minimization approaches implemented in the GEMS3K solver (
http://gems.web.psi.ch/GEMS3K) and described in Kulik et al. (2013) [
32] were used to calculate the solid solution composition as well as the aqueous solution equilibria at room temperature, 80 °C and 90 °C. The activity coefficients for all dissolved species (
γj) are calculated according to the extended Debye-Hückel equation [
34]. Equation (1) relates the activity coefficients of an aqueous ion to its charge (
Zj) and ionic strength (
I) [
33]:
where
(in Å) is an average distance of approach of two ions of opposite charges,
bγ is a semi-empirical coefficient, either individual for a given electrolyte or common for all aqueous species. The parameters
and
bγ were set to 3.72 and 0.064, respectively, for all the ionic species [
34].
Aγ and
Bγ are temperature dependent coefficients obtained internally from SUPCRT92 subroutines [
35] incorporated into the GEM3K code. At a temperature of 25 °C and pressure of 1 bar, the value of
Aγ is approximately 0.5114 and
Bγ is approximately 0.3288. Activity coefficients,
γj for neutral species (dissolved gases) and water were set to unity.
Thermodynamic data for aqueous species were taken from the PSI-Nagra database [
36] integrated in GEMS that inherits temperature and pressure dependencies for most aqueous ions and complexes from the HKF EoS [
34] as given in the SUPCRT92 database (
http://gems.web.psi.ch/TDB). Interaction parameters for the ternary (Ba,Sr,Ra)SO
4 solid-solution were taken from Klinkenberg et al. (2018) [
22].
5. Conclusions
In this study, the kinetics and thermodynamic aspects of the presence of ions in solution upon the uptake of 226Ra during the recrystallization of barite was studied with variation of temperature. In contrast to earlier studies which were dominated by nucleation processes and crystal growth at high supersaturation, the 226Ra-uptake during barite recrystallization is a process at close-to-equilibrium conditions. This process is kinetically not very much affected by the increase of ionic strength from 0.1 mol/kg of NaCl to 1.0 mol/kg. The increase of ionic strength from 0.1 to 1.0 mol/kg of NaCl slightly decreases the retention potential of barite, following the trend predicted by thermodynamic model calculations for the experiments at low solid/liquid ratio. At higher S/L, this trend is only observed at ambient temperatures whereas at higher temperatures kinetic effects appear to lead to an additional uptake of Ra—leading to very similar results at both ionic strengths.
The specific interaction of Sraq with the recrystallizing barite and 226Ra leads to a significant decrease in the 226Ra uptake. At low S/L ratio and at ambient conditions, even after 800 to 1000 days the uptake process appears to be inhibited by the presence of Sraq, indicating a poisoning of the barite surfaces by adsorbed Sr. In the cases where barite is able to recrystallize, thermodynamically predicted trends of the final Ra-concentrations are confirmed. In contrast to earlier studies where SrSO4 was present in the solid phase, the addition of Sr in solution leads to a competition of Sr with Ba and Ra during the recrystallization process. At slow recrystallization kinetics due to a low S/L ratio and/or low temperature, a significant effect of Sraq is noted which at the extreme point appears to inhibit the complete barite recrystallization and also the Ra-uptake.
In summary, the unspecific effect of ionic strength has only little consequence upon the Ra-uptake during barite recrystallization whereas Sr in solution appears to stop this process at certain conditions (
Figure 8).


