Article

An Integrated Model for Ilmenite, Al-Spinel, and Corundum Exsolutions in Titanomagnetite from Oxide-Rich Layers of the Lac Doré Complex (Québec, Canada)

1
Sciences de la Terre, Université du Québec à Chicoutimi, Chicoutimi, QC G7H 2B1, Canada
2
IOS Services Géoscientifiques, Chicoutimi, QC G7J 3Y2, Canada
*
Author to whom correspondence should be addressed.
Minerals 2018, 8(11), 476; https://doi.org/10.3390/min8110476
Submission received: 28 September 2018 / Revised: 16 October 2018 / Accepted: 17 October 2018 / Published: 24 October 2018
(This article belongs to the Special Issue Spinel Group Minerals)

Abstract

:
The titanomagnetite of the Lac Doré Complex, an Archean layered intrusion that is located in the Abitibi greenstone belt in Québec (Canada), contains a wide variety of exsolution textures, which are the remnants of a complex cooling history. In the present study, we reconstitute the decomposition stages of the original solid solution in order to explain the formation of ilmenite, Al-spinel (hercynite and gahnite), and corundum exsolutions in magnetite. This was conducted through a detailed mineralogical and textural examination and in situ determination of mineral chemistry. Our investigation reveals two discrete types of ilmenite exsolutions, which are ascribed, respectively, to the oxidation of ulvöspinel at temperatures above and below the magnetite-ulvöspinel solvus. Exsolutions of Al-spinel result from either a decrease in the solubility of the (FeZn)Al2O4 components upon cooling, or local excesses of Al and Zn due to the removal of ulvöspinel during the early oxidation. The origin of corundum is ascribed to the oxidation of pre-existing hercynite exsolutions. The trace element composition of the titanomagnetite indicates stratigraphic reversals in Cr, Mg, Co, Ti, and Si and important changes in redox conditions. We interpret this as a direct consequence of a major event of magma chamber replenishment, which strongly influenced the distribution of exsolutions.

1. Introduction

The Lac Doré Complex (LDC) in Québec, Canada, is a layered intrusion hosting a large deposit of vanadiferous titanomagnetite. Although the LDC has been well-documented since the 1960s from a lithological, structural, and petrogenetic perspective (e.g., [1,2,3,4,5]), no attempt has been made to investigate exsolution features in titanomagnetite and consider which parameters control their variation across the stratigraphy.
Stoichiometric magnetite (Fe3O4) has an inverse spinel structure with a theoretical formula of AB2O4, where the tetrahedral site (A) hosts Fe3+ and the octahedral site (B) hosts Fe2+ and Fe3+ in a 50:50 ratio. It was originally thought that ilmenite (FeTiO3) inclusions in magnetite were formed by exsolution from a solid solution of the two components (e.g., [6,7]); in this paper, the abbreviation “ss” will be used for solid solution (e.g., spinelss). However, in the early 1960s, a number of authors concluded that the solubility of ilmenite in magnetite over a range of temperatures from 600 to 1300 °C is far too low to account for the bulk of magnetite-hosted ilmenite [8,9,10,11,12]. They concluded that most of the Ti is, therefore, more likely to be accommodated by an ulvöspinel (Fe2TiO4) component. The solid solution between magnetite and ulvöspinel, also well-known as titanomagnetite (Fe3−xTixO4), is the result of Fe3+ replacement by Ti4+ (x > 0–1) accompanied by a proportional increase in Fe2+ to maintain charge neutrality [13].
Considering the above-mentioned theory, it became clear that the exsolutions of magnetite-hosted ulvöspinel found in basic intrusions, such as the Skaergaard intrusion in Greenland, the Panzhihua intrusion in China, and the Bushveld Complex in South Africa (e.g., [14,15,16]), result from a miscibility gap along the binary join Fe2O3-Fe2TiO4. Experimental work on the magnetite-ulvöspinel solvus shows that the consolute point lies between ~450 and 600 °C [13,17,18,19]. Thus, ulvöspinel exsolves in response to a decrease in the solubility of its solid solution state at lower temperatures. As firstly pointed out by Vincent and Phillips [14], magnetite-ulvöspinel intergrowths have the appearance of a closely woven piece of cloth. Now well-known as “cloth-textured” intergrowths, these are recognizable by a three-dimensional network of very fine ulvöspinel lamellae parallel to the {100} lattice planes of the magnetite structure (e.g., [15,20,21,22]).
Whereas the origin of the ulvöspinel by exsolution can account for some of the Ti in magnetite, the origin of ilmenite inclusions in magnetite remains controversial because ilmenite cannot be readily accommodated into the magnetite structure. In response to this problem, Buddington and Lindsley [23] proposed that ilmenite exsolutions in magnetite could be ascribed to the oxidation of the ulvöspinel component at temperatures above the magnetite-ulvöspinel solvus, as summarized by the following equilibrium:
6 Fe2TiO4 + O2 = 2 Fe3O4 + 6 FeTiO3
These authors also suggested that increasing degrees of diffusion during this “oxy-exsolution” process result in a systematic progression of ilmenite exsolution textures from: (1) the trellis-type texture of thin ilmenite lamellae in all sets of {111} lattice planes of magnetite; through (2) the sandwich-type texture of thick ilmenite lamellae predominantly in one set of {111} planes; (3) magnetite-hosted granular exsolutions; to (4) external granular exsolutions. Although oxy-exsolution is the most-accepted mechanism for the formation of ilmenite in magnetite (e.g., [15,16,22,24]), recent studies also propose alternative mechanisms, including direct exsolution from cation-deficient titanomagnetitess and inter-oxide re-equilibration between titanomagnetitess and ilmenite-hematitess [25,26].
According to Von Gruenewaldt et al. [15] and Willemse [21], ilmenite inclusions in magnetite could also be ascribed to the sub-solvus oxidation of ulvöspinel. This low-temperature generation of ilmenite, called proto-ilmenite in their respective paper and in a few others (e.g., [22,27,28]), is easily recognizable by patchy optical anisotropy in conformity with {111} directions of magnetite.
In nature, titanomagnetite is generally more complex than a simple two-component solid solution made of magnetite and ulvöspinel. For example, the diadochic substitution of Fe3+ for Al3+, and Fe2+ for Mg2+ and Zn2+, is responsible for the presence of FeAl2O4 (hercynite), MgAl2O4 (spinel), and ZnAl2O4 (gahnite) in solid solution. Pleonaste [(MgxFex)Al2O4; x = 0.5], an intermediate member of the hercynite-spinelss series, is the most common representative of Al-spinel exsolutions in titanomagnetite (e.g., [15,22,27,29,30,31]). As experimentally demonstrated by Turnock and Eugster [32], the solvus of the hercynite-magnetitess lies below ~860 °C, suggesting that pleonaste would exsolve at temperatures far higher than those at which cloth-textured intergrowths of magnetite and ulvöspinel start to form.
One of the major challenges in reconstituting the cooling history of titanomagnetite is to deal with multi-component solid solutions, an evolving composition, and the various exsolution mechanisms that are involved. This study proposes an evolutionary model for spinelss decomposition upon cooling that is exemplified by a ~120-m-long section through the titanomagnetite deposit of the LDC. The model considers and fits perfectly with our interpretations based on geochemical data and microscopic observations. Our investigation on exsolution features via a detailed mineralogical and textural study, in situ chemical analyses by electron microscopy methods and laser ablation inductively coupled plasma mass spectrometry (LA-ICP-MS), and quantitative measurements of titanomagnetite modal composition, reveals evidence for three main mechanisms of exsolution: (1) a solubility decrease in solid solution components upon cooling; (2) supersaturation of solid solution components through rapid compositional changes/diffusion; and (3) exsolution by oxidation (oxy-exsolution). Sub-solidus exsolution transformation involving the formation of corundum and low-temperature ilmenite was also a topic of investigation. Furthermore, this study reports the first occurrence of gahnite as exsolutions in titanomagnetite, as well as empirical solid-solid partition coefficients (D) for trace elements between ilmenite exsolutions and their magnetite host.

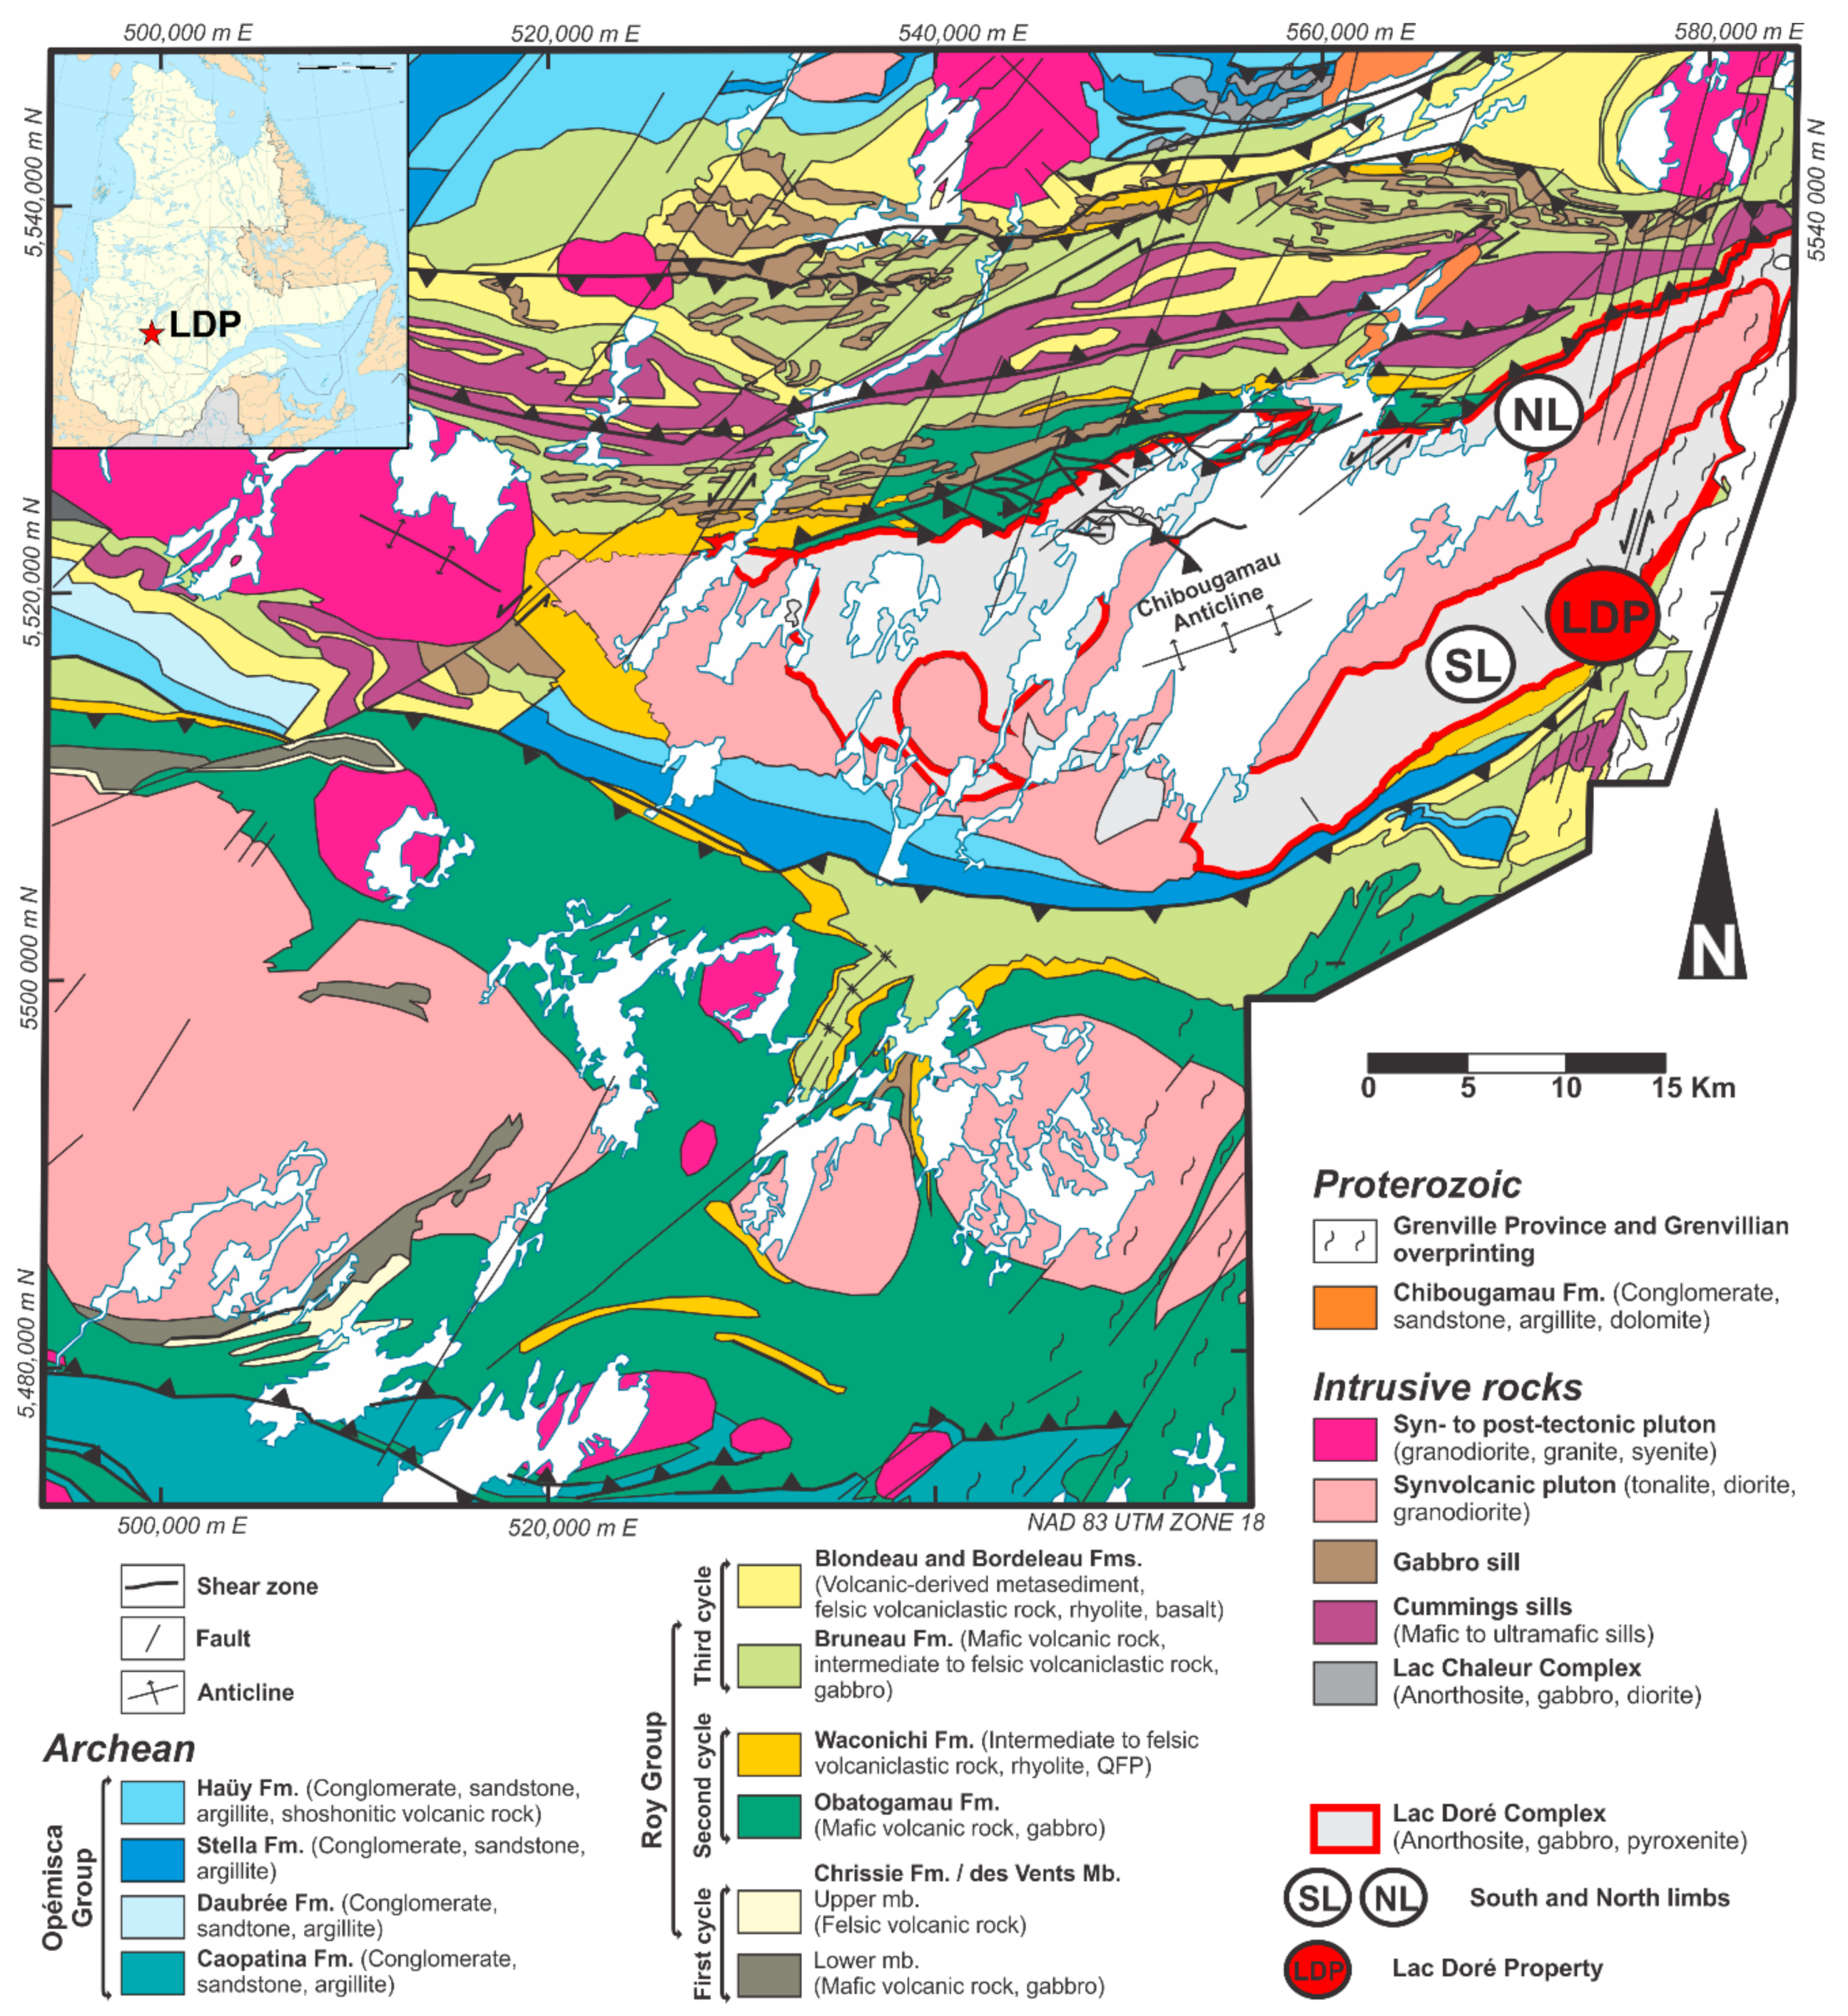
2. Geological Background

The LDC is an Archean layered intrusion (2728.3 +1.2/−1.1 Ma; [33]) that is located in the north-eastern part of the Abitibi greenstone belt in Québec, Canada (Figure 1; (e.g., [4,34]). It extends over 55 km along a NE–SW axis and up to 15 km in the NW–SE direction with a stratigraphic thickness ranging from 5 to 7 km [4]. The Chibougamau anticline, which is oriented approximately ENE–WSW, is responsible for the verticalization of the intrusion and, with subsequent erosion, for two distinct limbs that extend along both flanks of the anticline: the North and the South limbs (Figure 1; [3,4]). The axial zone of the Chibougamau anticline is occupied by the Chibougamau Pluton, of which the dioritic and tonalitic rocks were dated between 2718 ± 2 and 2707 ± 1.4 Ma (U-Pb zircons; [33,35,36,37,38,39]). According to Daigneault and Allard [4], the Chibougamau Pluton was emplaced at the base of the LDC, forming complex intrusive breccias at the interface. In the LDC area, the rocks are overprinted by a regional greenschist facies metamorphism, which is related to the Kenoran event. In the vicinity of the Grenville Front, metamorphism rises to upper amphibolite facies [4,40]. With the exception of local shear zones, the metamorphism is typically an isovolumetric process that preserved the cumulate textures of rocks.
As proposed by Daigneault and Allard [4], the LDC crystallized from silicate liquids of tholeiitic affinity. Consequently, they propose that the complex corresponds to the magma chamber that is related to the volcanic center that would have given rise to their main volcanic hosts, the plagioclase-phyric basalts of the Obatogamau Formation (the basal sequence of the second Roy Group cycle; Figure 1). However, inverse trace element modeling from Bédard et al. [41] suggests that the intrusion rather crystallized from silicate liquids of mainly calc-alkaline affinity. Moreover, these authors claim that the LDC shows geochemical resemblances to the Waconichi Formation tuffs (the felsic cap of the second Roy Group cycle; Figure 1), suggesting that it could represent the Waconichi’s shallow magma chamber. More recently, Polat et al. [5] proposed that the parental magma giving birth to gabbros and mafic dykes in the complex is genetically linked to the Obatogamau tholeiites, whereas the anorthositic rocks would involve a different magma source.
As firstly established by Allard [2,3] and then revised by Daigneault and Allard [4], the LDC can be stratigraphically subdivided into three main series (from base to top): (1) the Lower Series, consisting of a thick sequence of massive coarse-grained anorthositic to gabbroic rocks; (2) the Layered Series, mainly composed of magnetite-bearing anorthosite, gabbro, and pyroxenite beds, interlayered with magnetitites over several tens to more than 100 m from the contact with the Lower Series; and (3) the Upper Series, including the Granophyre Zone and the Upper Border Zone. The Upper Border Zone, which consists of anorthositic, gabbroic, and pyroxenitic rocks, is directly in contact with the overlying volcano-sedimentary host rocks. Allard [3] and Daigneault and Allard [4] claimed that the Layered Series is comparable to the Upper Zone of the Bushveld Complex, particularly because it contains a considerable tonnage of vanadiferous titanomagnetite.
The titanomagnetite deposit of the LDC is hosted by the lowermost part of the Layered Series [3,4,42,43]. Since its discovery in 1954 by Gilles O. Allard, efforts to document the deposit were particularly focused on the south limb due to better exposure and a greater economic interest. As described in Girard and D’Amours [43], the mineralization in this area is represented by an almost continuous titanomagnetite-rich horizon that typically ranges from 60 to 100 m in thickness, increasing to more than 200 m in its most eastern part. According to them, the horizon is steeply dipping to the southeast and extends for 17 km following a NE–SW trend from the Grenville Front toward the southwest. Historically, the south limb deposit was divided into five sub-deposits, including (from southwest to northeast) the Armitage deposit, the southwest deposit, the west deposit, the east deposit, and the northeast deposit [42,43]. Based on field work that was conducted on the east and west deposits, Girard and Allard [42] divided the Layered Series into four units: (1) the P0 unit, dominated by anorthosites with thin scattered magnetitite beds; (2) the P1 unit, which is composed of anorthosite with abundant magnetitite beds that can reach more than 1 m in thickness; (3) the P2 unit (considered to be the main ore body), which is composed of magnetitite and magnetite-bearing anorthosite and gabbro; and (4) the P3 unit, which is mostly composed of magnetite-ilmenite-bearing gabbro and pyroxenite.

3. Materials and Methods

3.1. Sampling and Sample Preparation

Samples were collected from a trench (19 + 50E) that crosscuts the stratigraphy of the main ore body of the Lac Doré mining property (east deposit), which is owned by VanadiumCorp Resources Inc. (South Surrey, BC, Canada) at the time of writing this paper. A total of 78 grab samples of titanomagnetite-bearing rocks and associated host rocks were collected from diamond-saw cut channels along a 122-m-long section that encompasses the P1 and P2 units. A detailed mapping of the section was carried out in the summer of 2016 (Figure 2; [45]). Polished thin sections were made from each sample at the IOS Services Géoscientiques Inc. laboratory (Saguenay, QC, Canada).

3.2. Electron Microscopy and Probe Microanalysis of Oxide Minerals

Samples were examined with an optical microscope in reflected light and oxide minerals were selected for in situ analysis. The major element composition of magnetite and ilmenite was determined by wavelength-dispersive spectroscopy (WDS) on a CAMECA SX100 microprobe (CAMECA, Gennevilliers Cedex, France) at the Université Laval in Québec City. The analytical conditions were 15 kV and 20 nA, with a ~2-µm beam size. In order to avoid an overestimation of V concentrations resulting from the overlaps of the V Kα and Ti Kβ X-rays, V was calibrated on the Kβ emission. The detection limits of the microprobe and the major element compositions of magnetite and ilmenite are provided in Table S1.
Major element analyses on Al-spinels were performed on a Zeiss EVO-MA15 scanning electron microscope (SEM) (ZEISS International, Oberkochen, Germany) with energy dispersive X-ray spectroscopy (EDS) at the IOS Services Géosientifiques Inc. laboratory. The analyses were conducted under analytical conditions of 20 kV, with a ~1-µm3 interaction volume. According to Liao [46], a realistic detection limit of EDS for elements with Z >10 would be 0.1 wt. % in modern SEMs. The compositions of Al-spinels as determined by EDS are given in Table S2.
The modal composition of various oxide mineral assemblages was measured using mosaics of backscattered electron images acquired on the SEM of IOS Services Géoscientifiques Inc. The 78 polished thin sections were scanned with a magnification of either 100 or 125X; however, several high-resolution images (1000X) were also required due to the presence of micrometric-sized exsolutions (Figure 3a). Given that the acquisition time at 1000X was much longer, high-resolution images have been restricted to smaller measurement areas of variable size.
Early stages of mosaic processing were carried out on images converted from RGB to 8-bit format. The ImageJ software version 2.0 (National Institutes of Health, Bethesda, MD, USA; LOCI, University of Wisconsin, Madison, WI, USA) was firstly used to increase tone contrasts between minerals, then to narrow their respective range of grey levels by using plugin filters. High-resolution images have not been processed to preserve the original edge between smaller exsolutions and their magnetite host. The proprietary ARTSection software (IOS Services Géoscientifiques Inc.) was then used to separate the targeted minerals by applying RGB colors to grey level thresholds (Figure 3b). For modal quantification of exsolutions, the false-color images were sampled in order to avoid counting external components as much as possible (i.e., phases unincluded in magnetite). Even with high-resolution images, exsolutions <500 nm in size are not well-detected by the software. False-color images were finally processed with the pixel-counting algorithm of ARTSection to quantify the modal composition of selected oxide assemblages. The complete set of data and details of the calculations are given in Table S5.

3.3. Laser Ablation Inductively Coupled Mass Spectometry of Oxide Minerals

Trace element concentrations in oxide minerals were determined by LA-ICP-MS at the Laboratoire des Matériaux Terrestres (LabMaTer), Université du Québec à Chicoutimi. The equipment used was an Excimer 193 nm RESOlution M-50 laser ablation system that was equipped with a double volume cell S-155 (Australian Scientific Instrument, Fyshwick, Australia) and coupled with an Agilent 7900 mass spectrometer (Agilent Technologies, Santa Clara, CA, USA). The ablated material was carried by a He-Ar gas mixture and analyzed by ICP-MS operating in time-resolved mode using peak jumping. The analyses were conducted using a fluence of 3.5 to 4 J/cm2, a frequency of 20 Hz, and a beam diameter of either 58, 73, or 100 µm depending on the grain size. The gas blank was collected for 30 s followed by at least 30 s of laser ablation. The following isotopes were measured: 25Mg, 27Al, 29Si, 31P, 43Ca, 45Sc, 47Ti, 51V, 52Cr, 55Mn, 59Co, 60Ni, 63Cu, 66Zn, 69Ga, 75As, 89Y, 92Zr, 93Nb, 98Mo, 115In, 118Sn, 121Sb, 177Hf, 181Ta, 184W, and 207Pb. Undesirable inclusions were excluded from the time-resolved signal before calculating the average signal. This was particularly the case for the ablation lines that were performed on ilmenite lamellae, in which Al-spinel inclusions are very common. Ablation profiles having less than 5 s of signal were discarded.
All data provided by the LA-ICP-MS were reduced using the Iolite software version 2.5 (Iolite, Carlton, Australia) by subtracting the gas blank from each of the analyzed isotopes. Iron from the electron microprobe analysis was used as the internal standard for the LA-ICP-MS analyses. Titanomagnetite found in layered intrusions are well-known for their high ilmenite exsolution content (e.g., [24,26,47]). Consequently, the ablation lines that were performed across titanomagnetite allowed us to determine the composition of the mixture mostly consisting of magnetite and ilmenite, which better represents the original spinelss before the exsolution process started. In order to use an adequate value of Fe for calibration, ilmenite was incrementally added until the mass balance was reached using the following equation modified from Dare et al. [47]:
Fefor calibration = (Fein magnetite * wt. % magnetite) + (Fein ilmenite * wt. % ilmenite)
Accordingly, between 10 and 35 wt. % ilmenite was needed to be added to correct the Fe calibration value for the titanomagnetite. The synthetic basalt glass GSE-1G supplied by the United States Geological Survey was used to calibrate all of the measured isotopes. In order to test the accuracy of the calibration, we also analyzed an in-house monitor known as BC-28, which is a natural magnetite from the lowermost titanomagnetite layer of the Bushveld Complex. According to the list of possible isotopic interferences given by Dare et al. [47], 52Cr and 53Cr could cause argide (40Ar) interferences on 92Zr and 93Nb, respectively, whereas 47Ti could cause oxide (16O) interferences on 63Cu. Although Ti is present at the tens of percent level and Cr is present at the hundreds of ppm level in the LDC iron oxides, we did not observe any correlations between Cr and Zr or Nb, nor between Ti and Cu, suggesting that the argide and oxide interferences were negligible. For this study, 346 LA-ICP-MS analyses of titanomagnetite and ilmenite were done. The complete data set, including detection limits and trace element compositions, and values for reference materials are presented in Tables S3 and S4, respectively.

4. Results

4.1. Titanomagnetite Ores and Associated Rocks

As mentioned in the introduction, titanomagnetite is an intermediate between the end-members of the magnetite-ulvöspinelss series. In this paper, as well as in many others (e.g., [15,16,48]), the term “titanomagnetite” is used for magnetite containing titaniferous exsolutions that result from the decomposition of the original solid solution.
Titanomagnetite is one of the most abundant minerals in rocks from the Layered Series, and more specifically from the P1 and P2 units. Figure 2 shows a detailed geological map that encompasses both units from the presumed base of P1 to the top of P2 [45]. This stratigraphic section is mainly characterized by a rhythmical succession of magnetitites and magnetite-bearing anorthositic rocks that form beds ranging from a few cm to more than 1 m in thickness. In general, the beds are steeply dipping (>65°) to the south-southeast and their thicknesses increase northwestward. Given that the amount of Fe-Ti oxides (FTO) is extremely variable in layered rocks, ores have been divided into four classes according to their modal composition: (1) weakly mineralized rocks contain <20 vol. % FTO; (2) disseminated ores contain from 20 to 40 vol. % FTO; (3) semi-massive ores contain from 40 to 65 vol. % FTO; and (4) massive ores contain >65 vol. % FTO.
Iron-titanium oxides in low-grade ores (classes 1 and 2) are present as anhedral grains of titanomagnetite and granular ilmenite forming mm-sized clusters that fill the interstitial spaces between former cumulus silicate phases. According to our quantitative mineralogy measurements (Table S5a), the titanomagnetite to ilmenite proportion in the clusters averages 2.7. Epidote-group minerals and albite derived from the metamorphic replacement of primary plagioclase under greenschist facies conditions are the most common silicates in low-grade ores, followed by ferro-chlorite and ferro-pargasite. Aggregates of ferro-actinolite and minor secondary magnetite, which locally occur in the upper part of the section (<5 vol. % in rocks), are pseudomorphs after cumulus clinopyroxene [4,40].
Titanomagnetite and granular ilmenite in high-grade ores (classes 3 and 4) commonly form densely packed aggregates of intensely fractured anhedral grains that typically range from a few to 10 mm in apparent diameter. The titanomagnetite to ilmenite proportion in these rocks averages 5.8. Although recrystallization textures are not as well-developed as in other layered intrusions (e.g., the Panzhihua intrusion; [16,31]), aggregates from the east deposit of the LDC display some evidence for textural equilibration, such as straight boundaries and interfacial angles of ±120°. The higher proportion of ferro-chlorite and ferro-actinolite relative to epidote and albite in high-grade ores suggests that the fracture networks that developed in FTO promoted the circulation of metamorphic water, resulting in the formation of more hydrated minerals.
Coeval non-stratigraphic units are also present into the cumulate pile. These include anorthosite lenses and amphibolitized gabbroic and pyroxenitic enclaves (Figure 2). Anorthosite lenses are generally unmineralized, whereas the enclaves contain up to 10 vol. % FTO, mostly dominated by ilmenite. Enclaves vary in size from a few tens of cm to ~5 m and display similar textures to those of the layered rocks. The presence of load-cast structures suggests that enclaves are autoliths that fell into the magma following the collapse of the magma chamber’s roof [4,45].

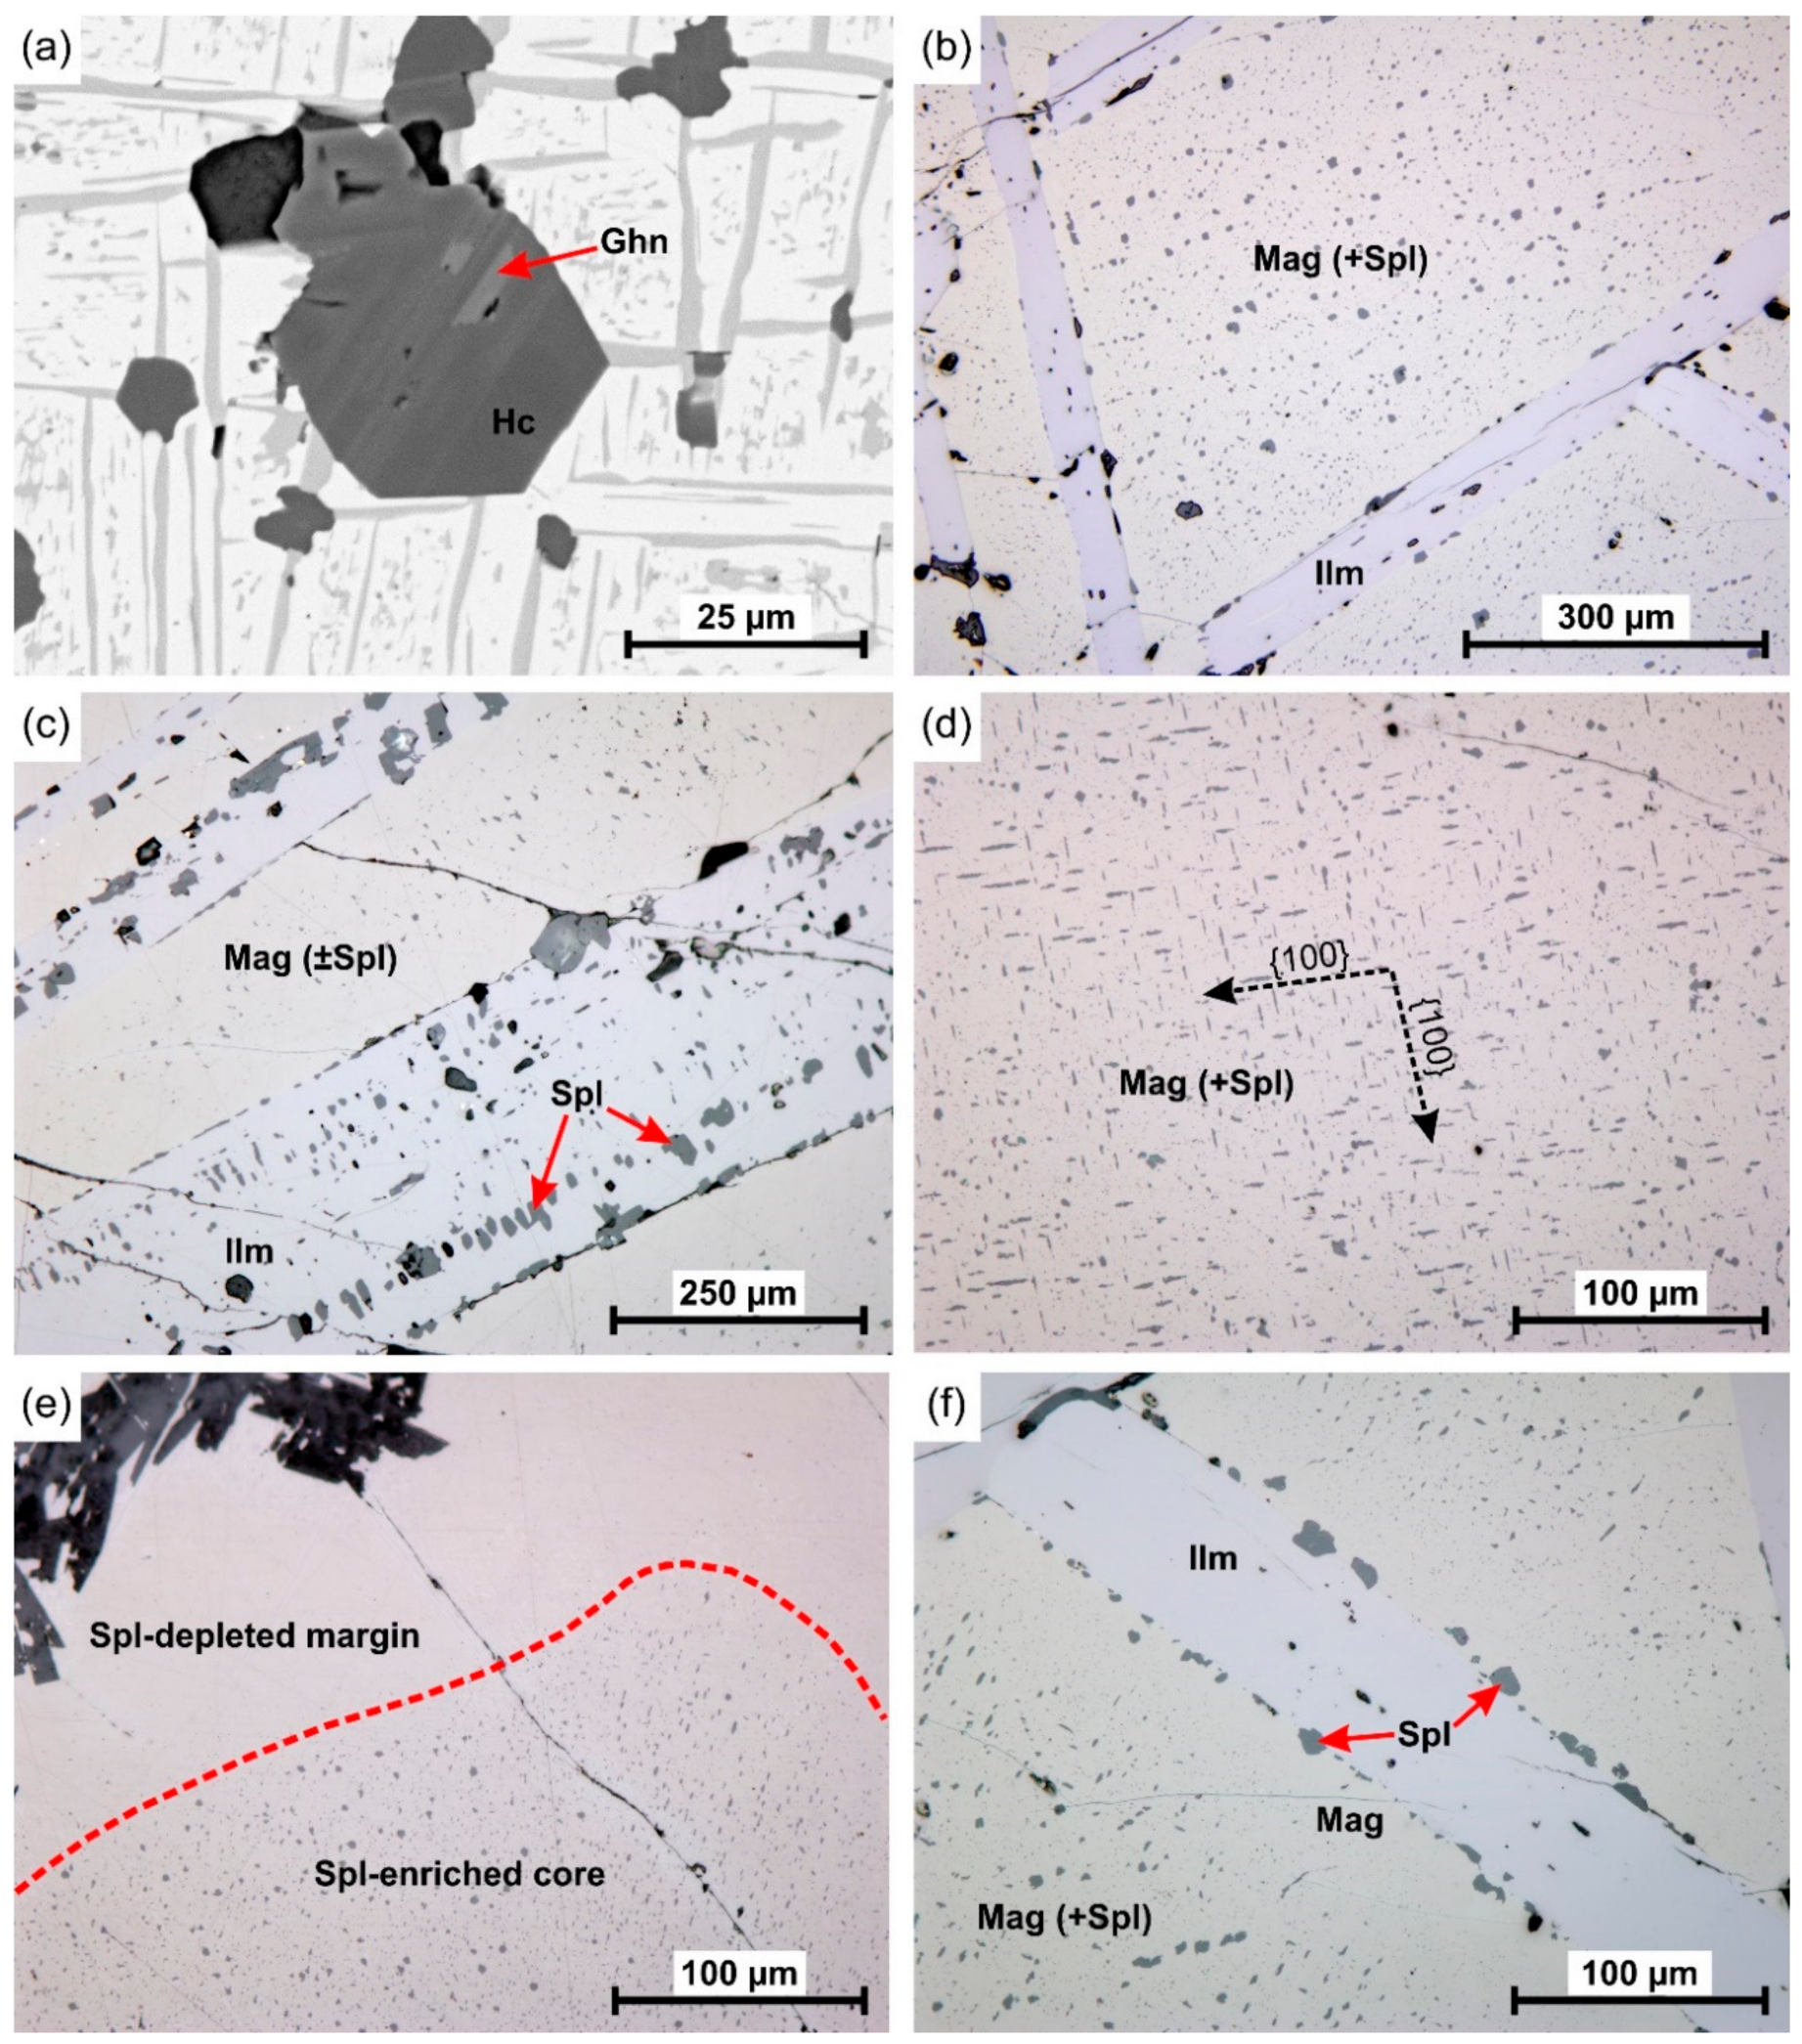
4.2. Features of Exsolution Textures

Titanomagnetite in the Layered Series displays a wide variety of exsolutions that can be grouped into three main types according to their compositional nature and origin: (1) super-solvus exsolutions of ilmenite; (2) sub-solvus exsolutions of ilmenite; and (3) Al-rich exsolutions. These are described in detail in the following sections.

4.2.1. Super-Solvus Exsolutions of Ilmenite

One of the most common types of ilmenite exsolution in the titanomagnetite of the Layered Series is represented by thick lamellae either along all sets of {111} lattice planes of the magnetite structure (trellis-type texture; Figure 4a), or predominantly along one set of {111} planes (sandwich-type texture; Figure 4b). Many researchers, beginning with Buddington and Lindsley [23], interpret these types of lamellar exsolution to have formed at temperatures above the magnetite-ulvöspinel solvus (e.g., [15,24,26]). These will be referred to as Ilmenite-E1 in the text below.
The vast majority of Ilmenite-E1 in the Layered Series is dominated by trellis-type lamellae. These display sharply-defined boundaries with their magnetite host, and are generally spaced tens to hundreds of microns apart. Their thicknesses typically range from 10 to 200 µm, whereas the less common sandwich-type lamellae mostly exceed 100 µm. The trellis- and sandwich-type lamellae found in our samples appear to be unusually thick compared to those reported in titanomagnetite from other layered intrusions (e.g., [15,27,31,49]). On the other hand, they contain numerous inclusions of Al-spinel similarly to other layered intrusions.
Although the vast majority of ilmenite granules in the LDC appear to originate from primary crystallization, there is a little doubt as to whether some of them are formed by exsolution under super-solvus conditions. As detailed in the introduction, Buddington and Lindsley [23] proposed a diffusion–migration process to account for the textural progression from lamellar to granular exsolutions. In our samples, this is highlighted by the fact that ilmenite lamellae are sporadically in spatial and optical continuity with the ilmenite granules that are arranged along the boundaries of the titanomagnetite grains (for similar observations, see Von Gruenewaldt et al. [15]). On the other hand, recrystallization through either post-cumulus compaction or dynamic annealing could also be considered as an alternative cause for external granules, which would form because of the expulsion of ilmenite exsolutions to the triple junctions. Evidence for the expulsion of ilmenite from titanomagnetite in recrystallized rocks is the obvious deficit in the abundance of internal exsolutions (Figure 4c). However, in most cases where evidence of recrystallization is reported, lamellae of Ilmenite-E1 appear to be well-preserved, suggesting that textural equilibration predates the exsolution process. Von Gruenewaldt et al. [15] and Pang et al. [16] found similar conclusions for titanomagnetite layers of the Bushveld Complex and the Panzhihua intrusion.

4.2.2. Sub-Solvus Exsolutions of Ilmenite

Intergrowths of magnetite and ulvöspinel in mafic intrusions are typically represented by a cloth-like texture (e.g., [15,20,21,22]). Although cloth-textured intergrowths were found in titanomagnetite of the LDC, the bulk of the ulvöspinel appears to be completely transformed to ilmenite, as suggested by a group of very minute exsolutions causing patchy optical anisotropy in conformity with the {111} lattice planes of the magnetite structure. This low-temperature ilmenite, i.e., proto-ilmenite in previous studies (e.g., [15,21,22]), would result from the great susceptibility of ulvöspinel to be oxidized. Ilmenite formed through this process will be referred to as Ilmenite-E2 in the text below.
In their excellent paper on exsolution features in titanomagnetite of the Upper Zone of the Bushveld Complex, Von Gruenewaldt et al. [15] propose that migration of Ilmenite-E2 due to progressive diffusion is responsible for a wide variety of interesting textures. Evidence that migration is promoted near grain boundaries and fractures is abundant in the Layered Series of the LDC, and allow us to present a four-stage continuum that summarizes textural changes with increasing diffusion.
Stage 1: Ulvöspinel was oxidized to Ilmenite-E2, which has preserved (or partially preserved) the original cloth-like texture (Figure 5a). This pseudomorphous texture is generally only present in the core of titanomagnetite grains; thus, where diffusion has had the least effect.
Stage 2: Ilmenite-E2 is present as very thin lamellae (from 1 to 5 µm thick) along {111} planes of magnetite, mostly forming a trellis texture (Figure 5b). In cases for which these trellis-type lamellae are less well-developed, ilmenite pseudomorphous after cloth-like texture is preserved in intermediate areas. Three {111}-oriented sets of contiguous irregular areas of thin sandwich-type lamellae are also very common. Although textures related to this second stage of migration appear to be better developed in the core of titanomagnetite, they can also be extended over the entire grain area.
Stage 3: Ilmenite-E2 is present as patchy or vermicular intergrowths that mostly range from a few to several tens of microns in size (Figure 5c,d). At this more advanced stage of migration, ilmenite commonly contains very small (<10 µm) blebs of magnetite (Figure 5c). The term “composite intergrowth” has been used by Von Gruenewaldt et al. [15] to define this exsolution feature in the Upper Zone of the Bushveld Complex. Contiguous irregular areas of vermicular intergrowths showing either preferential orientations or, to a lesser extent, radiating arrangements (referred to as eutectoid-like intergrowths in Reynolds [50]) have been observed in many samples. Ilmenite pseudomorphous after cloth-like texture are sporadically preserved between patchy and vermicular intergrowths; however, in most cases, intensive diffusion had led to the formation of relatively large areas of exsolution-free magnetite (Figure 5c). Intergrowths of Stage 3 are generally better developed near grain boundaries and fractures; however, they also commonly cover the entire grain area. It is possible, however, that this latter observation represents a section cut close to a grain margin.
Stage 4: Ilmenite-E2 is present as small irregularly shaped, equant, or elongated external granules at titanomagnetite boundaries or within fractures (Figure 5d). They vary in size from a few to several tens of microns. Intergrowths related to Stages 2 and 3 that have developed near grain boundaries and fractures are commonly in optical continuity with external granules.
Intergrowths resulting from Stages 2 and 3 of the diffusion–migration process are generally dominant in titanomagnetite. However, all four stages have also been found in the same sample, and even in the same titanomagnetite grain. In this latter case, increasing the degree of diffusion results in a systematic textural continuum from either ilmenite pseudomorphous after cloth-textured intergrowths (Stage 1) or variable patterns of very thin lamellae (Stage 2) in the core of titanomagnetite, through patchy and vermicular intergrowths near grain margins and fractures (Stage 3), to external granules (Stage 4; Figure 5e). In rare samples where Ilmenite-E2 coexists with Ilmenite-E1, lamellae of Ilmenite-E1 are less abundant and generally characterized by a reduced thickness. Moreover, and as also pointed out by Von Gruenewaldt et al. [15], Ilmenite-E2 is systematically absent in the immediate vicinity of thick lamellae (Figure 5f).

4.2.3. Aluminum-Rich Exsolutions

Aluminous spinels of the hercynite-gahnitess series with small amounts of the spinel component are also present as exsolutions in titanomagnetite of the Layered Series. As reported in Table S2, their ZnAl2O4 molar content ranges from 2 to 74%. Most Al-spinel exsolutions consist of a single phase. However, during our SEM investigation, we also found many examples of composite exsolution consisting of two phases, one dominated by the hercynite component and the other by gahnite (Figure 6a). This strongly suggests that individual Al-spinels have exsolved from an original hercynite-gahnitess, which had previously been separated from the titanomagnetitess.
Three main types of Al-spinel exsolution have been observed in our samples (listed in decreasing order of abundance): (1) granular Al-spinel that occurs within the magnetite matrix (Figure 6b); (2) granular Al-spinel that forms rectilinear alignments (Al-spinel strings) within or along lamellae of Ilmenite-E1 (Figure 6c); and (3) thin disc-shaped Al-spinel arranged along the {100} directions of magnetite (Figure 6d). These exsolutions mostly range from 5 to 25 µm in size. They tend to predominantly occupy the core of titanomagnetite (Figure 6e), that indicates that the dissolved quantities of Al, Zn, and, to a lesser extent, Mg, were especially high in the early stage of titanomagnetite crystallization (see also Ramdohr [7]). As will be discussed later, the absence or reduced size of Al-spinels in the immediate vicinity of Ilmenite-E1 lamellae (Figure 6f) suggests that Al and Zn have diffused to form zinciferous hercynite and/or gahnite at the interface between ilmenite and magnetite. Similar features as those mentioned above have been observed and documented for pleonaste exsolutions occurring in titanomagnetite from other mafic intrusive rocks (e.g., [15,22,27,29,30,31]).
Aluminous spinel is also present within complex intergrowths of zinciferous hercynite (6 to 35 mol. % ZnAl2O4), corundum, and magnetite, forming together composite granules that typically range from 100 to 500 µm in size. These hercynite-corundum-magnetite assemblages will be referred to as HCMs in the text below. The hercynite found within the HCMs commonly contains tiny blebs of magnetite and tends to occupy the core of intergrowths (Figure 7a). Alternatively, hercynite could be missing, implying that intergrowths consist entirely of corundum and magnetite. Unlike the three aforementioned types of corundum-free Al-spinel, the HCMs are preferentially located at titanomagnetite boundaries (Figure 7b) or within the margins of granular ilmenite that is adjacent to titanomagnetite (Figure 7c).

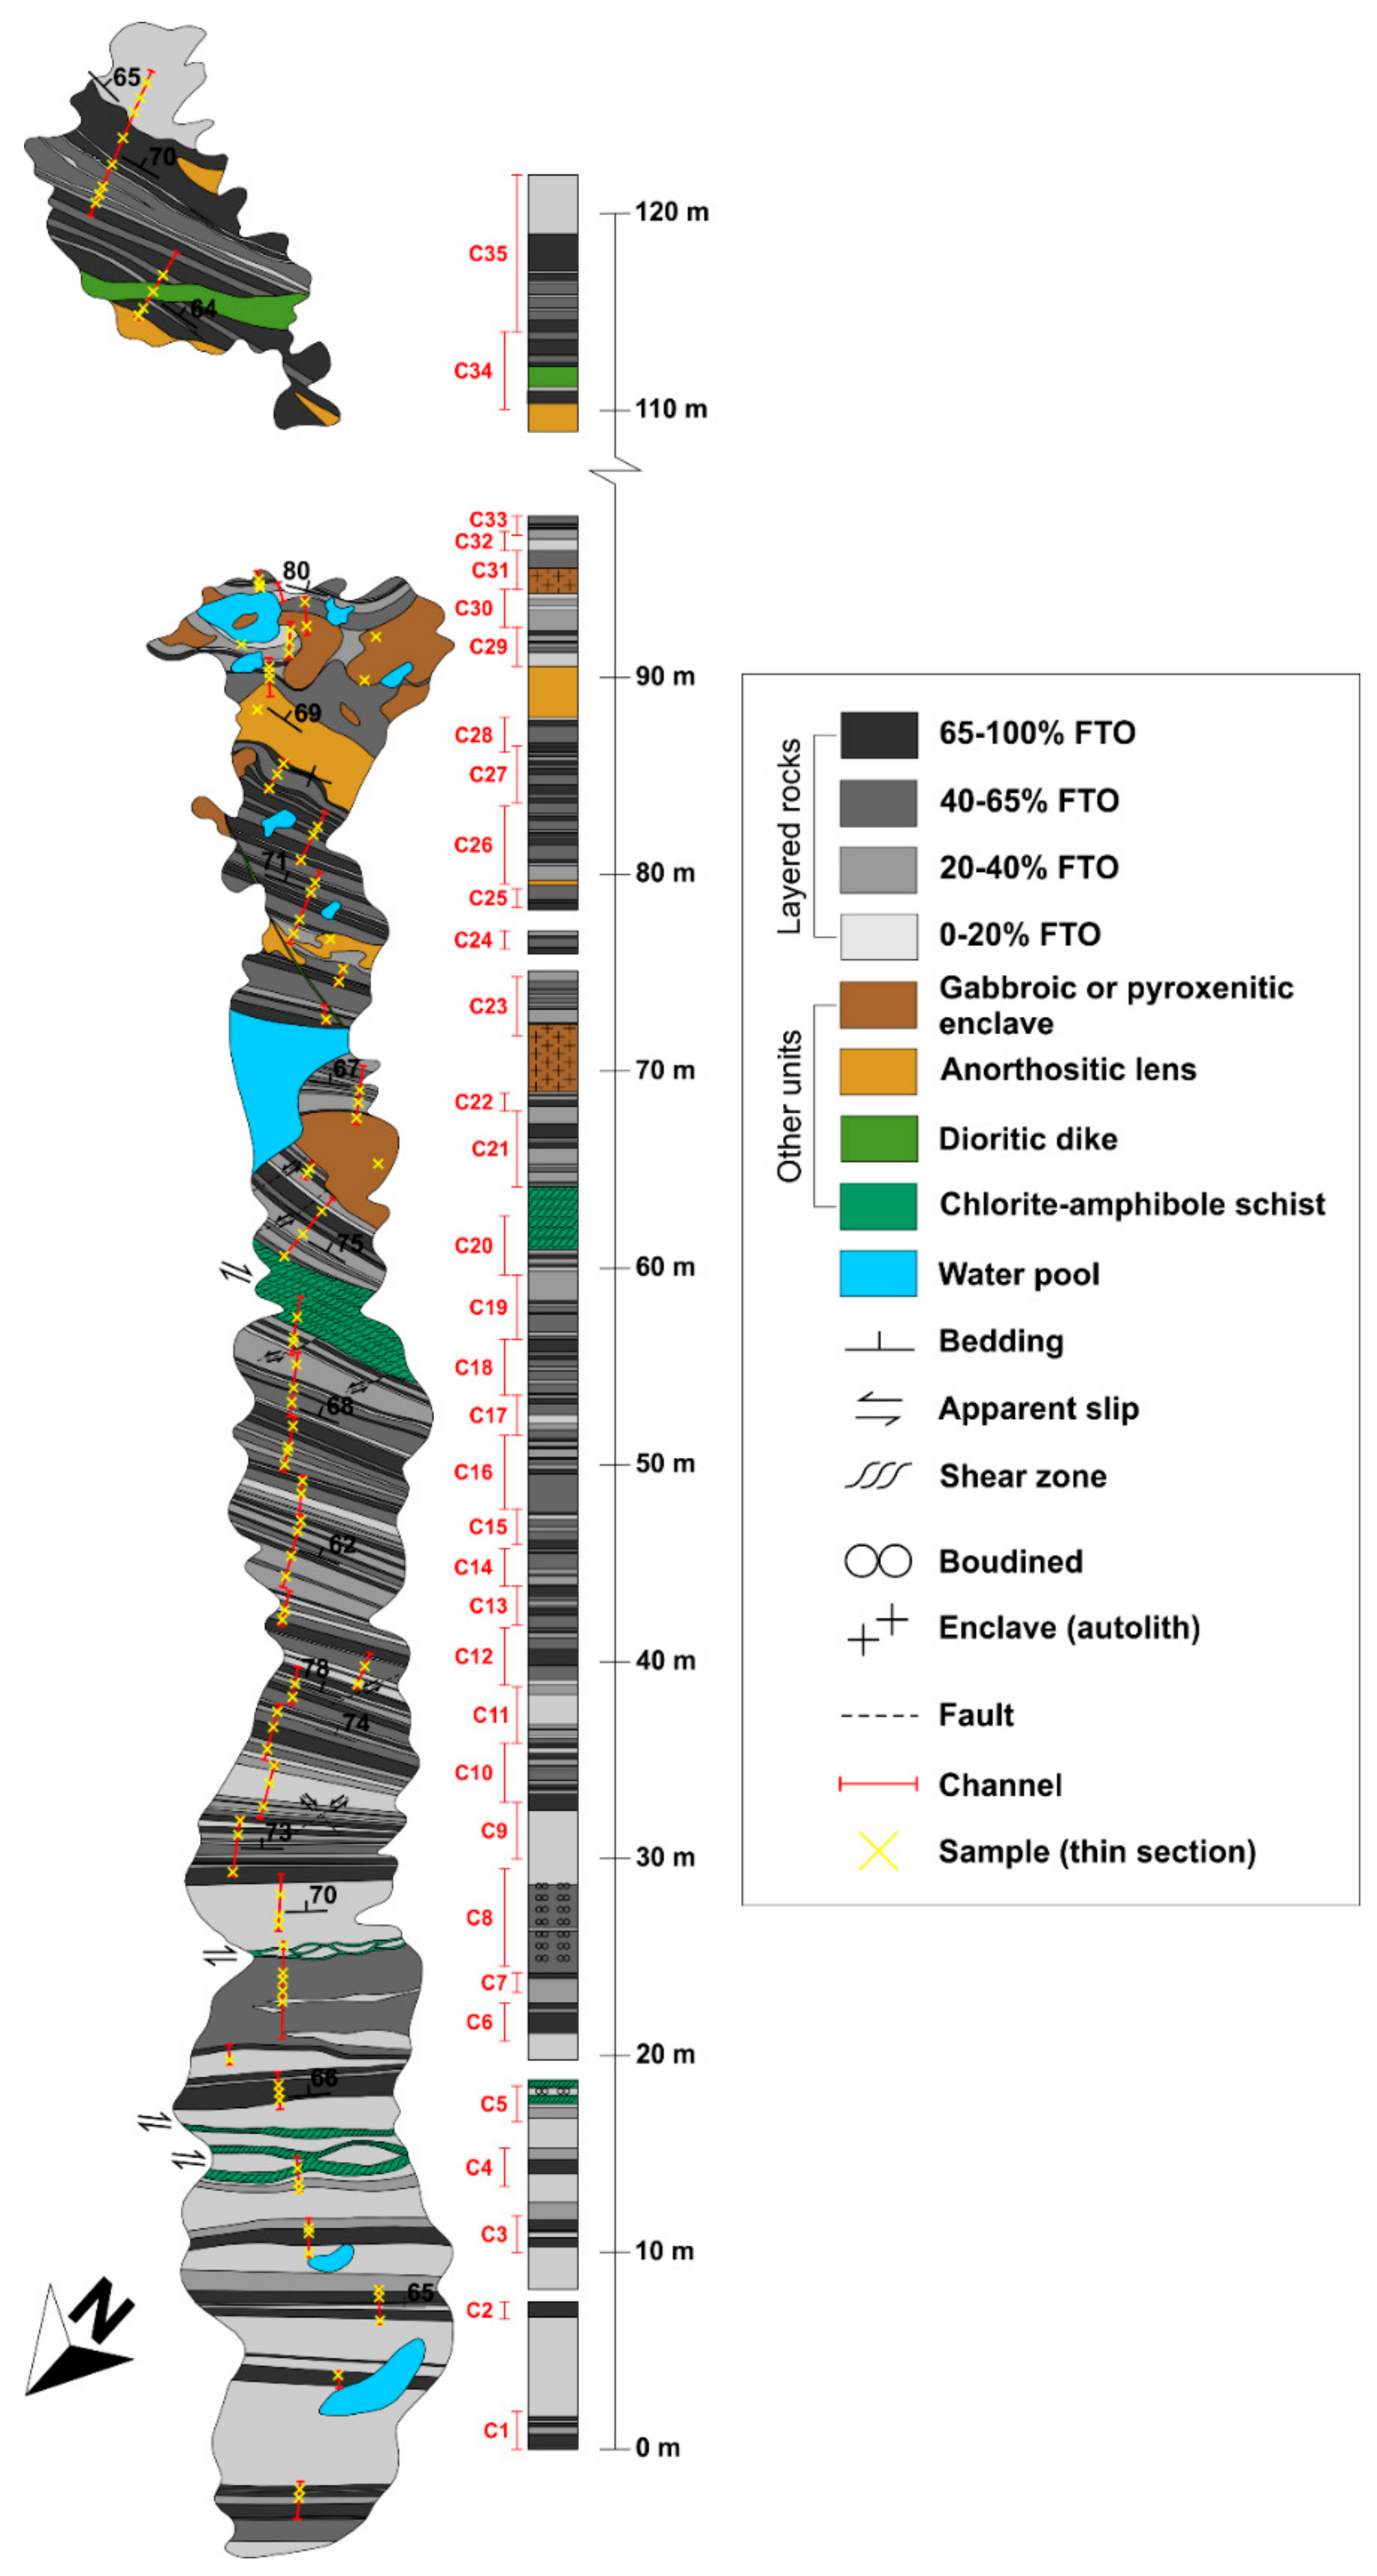
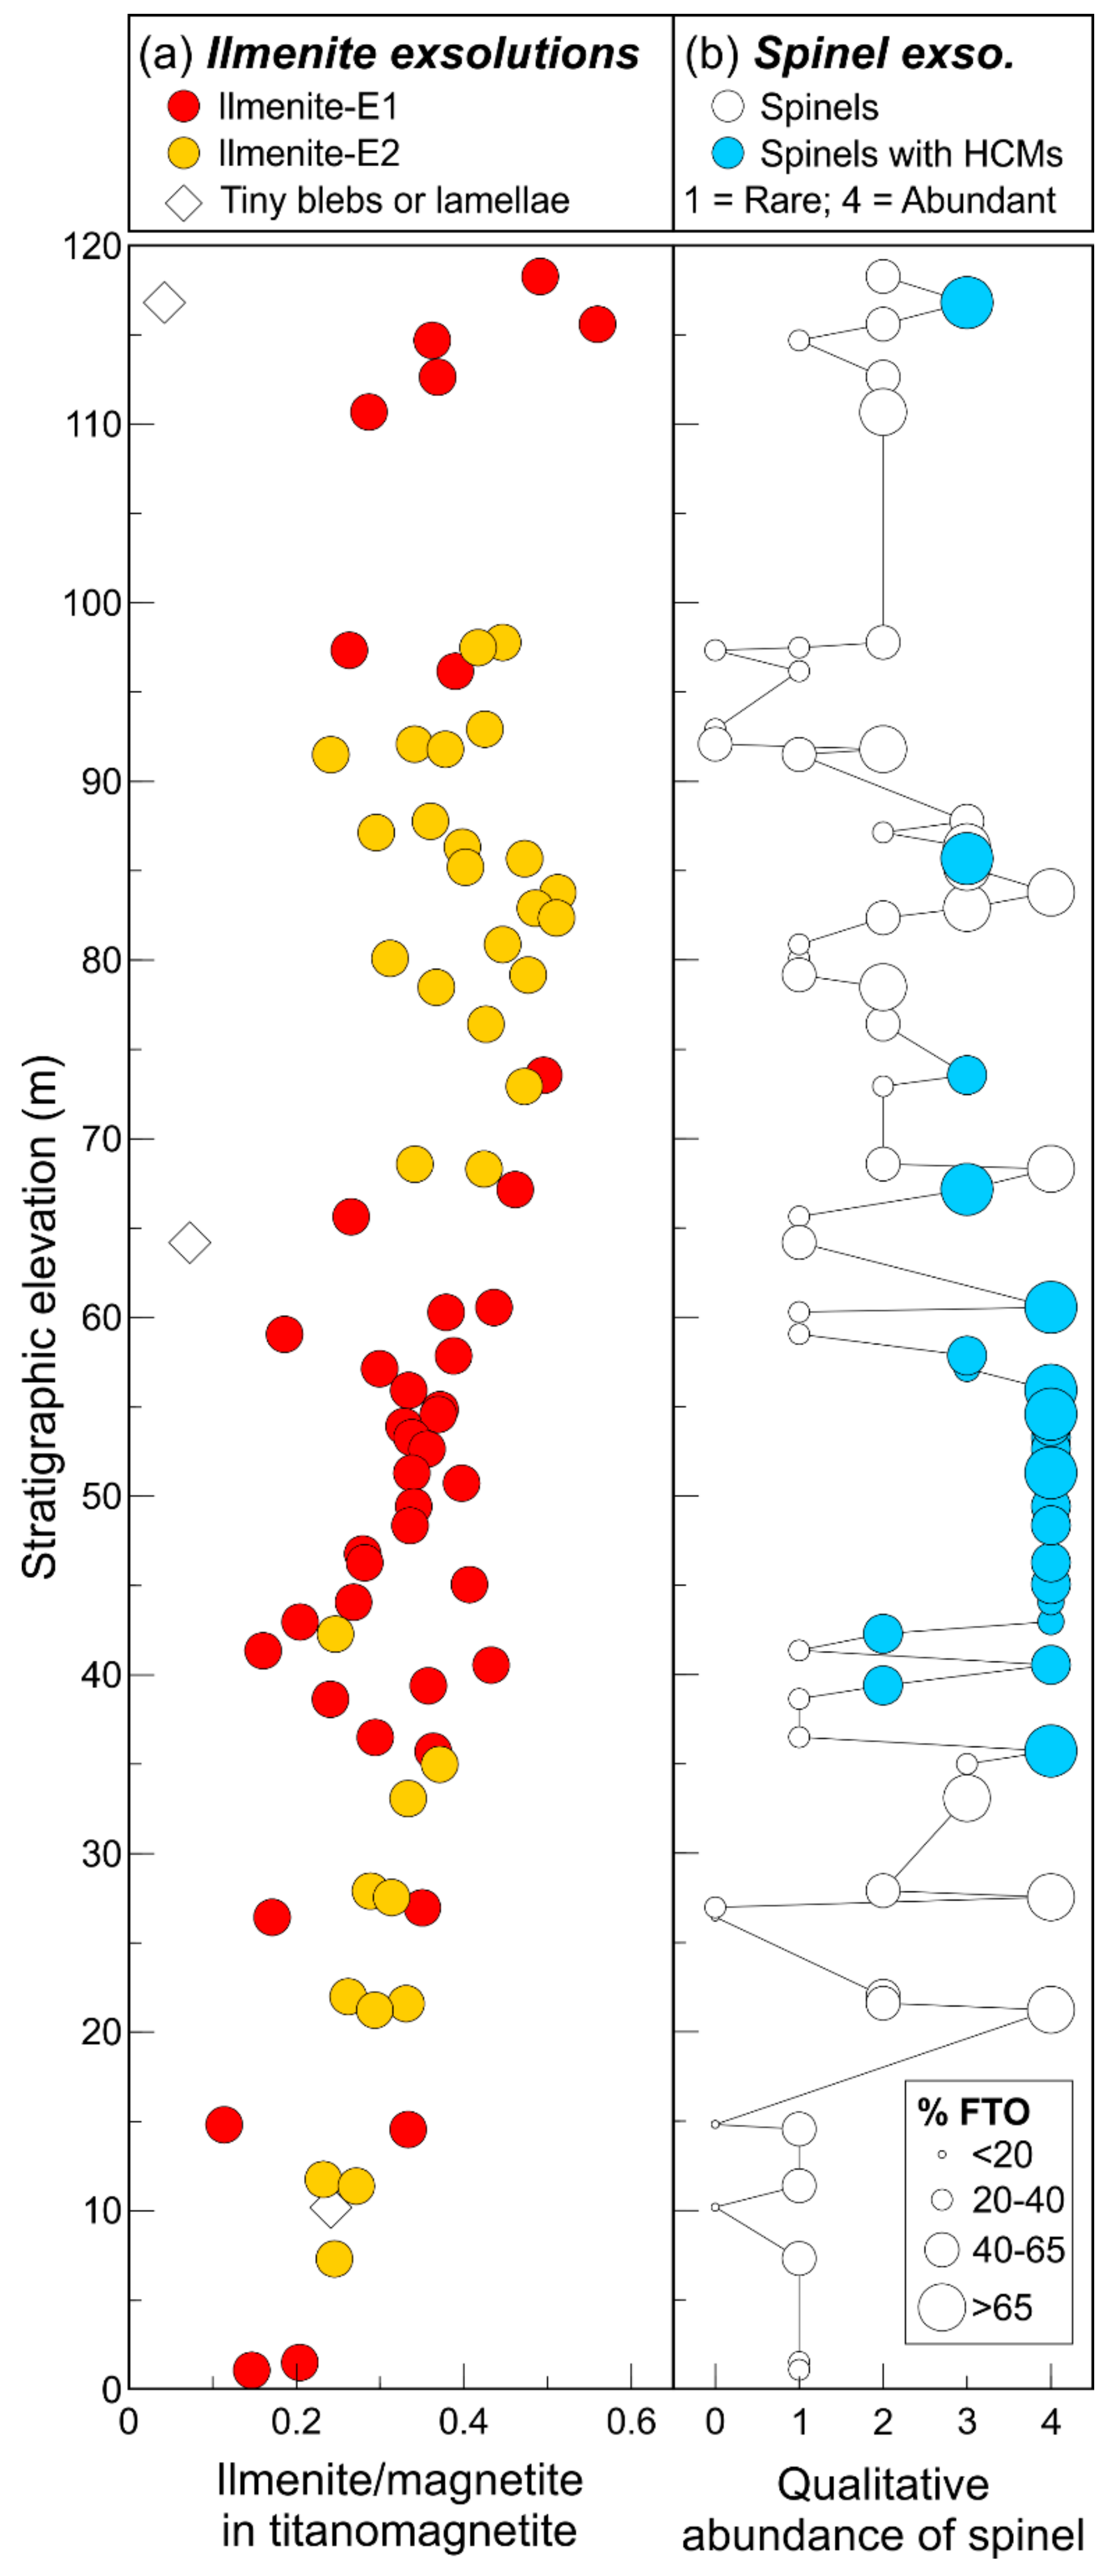
4.3. Textural Variations across the Stratigraphy

Ilmenite exsolutions are abundant in titanomagnetite and occur along the entire studied section. As shown in Figure 8a, the ilmenite to magnetite host proportion tends to increase upward from ~0.2 to 0.5. Assuming an average content of Al-spinel exsolutions of ~2.6 vol. % (see Section 5.5), this means that the ilmenite content in titanomagnetite increases from 16.5 to 32.3 vol. %. The titanomagnetite in samples located at the ~64 and 117 m height levels is particularly depleted in ilmenite exsolutions relative to the overall trend, with ilmenite to magnetite host proportions <0.10 (Figure 8a). We interpret this as a consequence of ilmenite expulsion upon dynamic recrystallization in local shear zones, as highlighted by the polygonal, size-reduced grains (Figure 4c). The process results in the increase of the abundance of granular exsolutions; only very scattered tiny blebs or thin lamellae of ilmenite still remain in the titanomagnetite.
There is a clear spatial control on the ilmenite exsolution textures in the Layered Series. Ilmenite-E1 and -E2 respectively occur at discrete stratigraphic levels and rarely coexist within the same layer. In Figure 8a, Ilmenite-E1 is intermittent with Ilmenite-E2 from the base of the sequence to the ~35 m height level, whereas it mostly dominates levels ranging from ~35 to 65 m and from ~100 m to the top of the sequence. On the other hand, Ilmenite-E2 is dominant between the ~65 and 100 m height levels. As will be detailed later, the stratigraphic distribution of Ilmenite-E1 and -E2 are thought to be the result of fO2 variations.
Although the abundance and development of Al-spinel exsolutions vary considerably from one sample to another, they are almost ubiquitous throughout the cumulate pile. Their heterogenous distribution in titanomagnetite makes them difficult to quantify using the method that is described in Section 3.3. Consequently, four classes of Al-spinel qualitative abundance (from 1 = rare to 4 = abundant) are presented in Figure 8b. Our results suggest that the Al-spinel content in titanomagnetite increases from the base of the sequence to the ~35 m height level, where it begins to be almost continuously high throughout the next 25 m, and then slightly decreases toward the top of the sequence. HCM intergrowths occur mainly between the ~35 and 65 m height levels, where the Al-spinel content is steadily high (Figure 8b).
In Figure 8b, the size of the circles indicates the abundance of FTO in rocks according to the four ore classes that were introduced in Section 4.1. Although this does not seem to be systematic, the Al-spinel content in titanomagnetite tends to decrease with the FTO proportion as suggested by the average values of our qualitative assessment (massive ores = 3.3; semi-massive ores = 2.4; disseminated ores = 1.7; weakly mineralized rocks = 0.3). One possible explanation for this relationship is that titanomagnetite underwent re-equilibration with the surrounding plagioclase before the exsolution process. Alternatively, this could indicate that titanomagnetite respectively predates and postdates the crystallization of plagioclase in high- and low-grade ores.

4.4. Trace Element Composition of Oxide Minerals

The relationships between the stratigraphic height and some of the elements that were determined by LA-ICP-MS in titanomagnetite (Cr, V, Ni, Mg, Co, Ti, Si, and Sb) and ilmenite (V, Al, Nb, and Ta) are shown in Figure 9 and Figure 10, respectively. Aluminum and Zn are not presented in Figure 9, as their concentration strongly correlates with the abundance of Al-spinel exsolutions shown in Figure 8b. The average compositions for the 27 elements that were analyzed are shown in multielement plots in which the values have been normalized to the primitive mantle (Figure 11). As detailed in the following sections, the composition of both titanomagnetite and ilmenite has recorded the behavior of trace elements during fractional crystallization, magma recharge events, and post-cumulus processes of re-equilibration.

4.4.1. Titanomagnetite

According to many authors, the parental liquid from which titanomagnetite crystallizes as a major phase is ferrobasaltic or ferrodioritic in composition (e.g., [16,51,52,53,54]). As shown in Figure 9, the upward decrease in Cr, V, and Ni and the upward increase in Ti are consistent with what is expected from “normal” processes of fractional crystallization involving the crystallization of plagioclase, pyroxene, and FTO from such a liquid. On the other hand, the up-sequence increase in Mg suggests higher plagioclase-to-pyroxene proportions than cotectic proportions (~60:40 by weight; [51,52,55]), as supported by the absence or very low abundance of pyroxene in protoliths from the studied section.
In response to its highly compatible behavior, Cr in titanomagnetite is commonly used to identify events of primitive magma recharge (e.g., [54,56]). The Cr trend that is shown in Figure 9 is defined by several abrupt up-sequence increases, each followed by a rapid decrease. These reversals in Cr likely result from successive episodes of compatible element replenishment, whether via (1) reinjections of fresh, more primitive magma (e.g., [54,55,57]), or (2) convective overturns that have brought less differentiated liquid into the crystallization zone [58,59]. The replenishment event at the ~65 m height level in Figure 9 is not only highlighted by an abrupt reversal in Cr, but also in Mg, Co, Ti, and Si. Above this critical level, the slope changes occurring in the Mg, Co, and Ti diagrams indicate that these elements became suddenly more compatible. The more frequent observation of metamorphic mineral assemblages that are produced via the transformation of clinopyroxene in the upper half of the section suggests that this behavior change results from higher crystallizing proportions of pyroxene than in the underlying sequence. As will be discussed later, both reversals and slope changes that are related to the 65-m-height level (65-MHL) are indicative of a relatively major influx of fresh magma.
Antimony and As in titanomagnetite show unique behavior, as they are the only elements for which the concentrations correlate with the type of ilmenite exsolution, regardless of compositional variations that could be caused by fractional crystallization. The concentrations of Sb are clearly higher in titanomagnetite hosting Ilmenite-E2 than in those hosting Ilmenite-E1, thus resulting in cyclic variations along the whole section (Figure 9). Similarly, the average As concentration (not shown) in titanomagnetite hosting Ilmenite-E2 is 1.9 ppm, whereas the average As concentration in titanomagnetite hosting Ilmenite-E1 is only 0.4 ppm.
The composition of titanomagnetite varies greatly according to the abundance of FTO in rocks, which is denoted by different circle sizes and colors in Figure 9 and Figure 11a, respectively. The elevation profiles indicate that Ni, Mg, and Co tend to be progressively depleted as the abundance of FTO decreases (Figure 9). Furthermore, the mantle-normalized patterns (Figure 11a) suggest that Y, Zr, Hf, Al, Ta, In, and Sn, as well as potentially Ga and W, display the same behavior as Ni, Mg, and Co according to the four ore classes. This similarity is interpreted as the result of post-cumulus re-equilibration with the surrounding silicates. However, given that Ni, Mg, and Co do not partition into plagioclase, and that pyroxene was absent in most protoliths, re-equilibration of these elements must have occurred with metamorphic silicates, such as chlorite.
Unlike the aforementioned elements, the V concentrations tend to be higher in titanomagnetite from low-grade ores (Figure 9 and Figure 11a). As periodic increases in fO2 is one of the hypotheses for the formation of massive magnetite layers (e.g., [15,52,61,62]), Klemm et al. [48] proposed that the partition coefficient of V (DV) between magnetite and silicate liquid is lower at elevated oxidation states, with the result that massive magnetites from the Upper Zone of the Bushveld Complex are depleted in V relative to disseminated magnetites. This point has experimentally been confirmed by Toplis and Corgne [52], who demonstrated that DV between magnetite and silicate liquid decreases with increasing fO2 in response to higher V5+, 4+/V3+ in the magma; V3+ being preferentially incorporated into magnetite. However, experiments that were conducted by these authors also indicated that increasing fO2 results in a decrease of DCo into magnetite. Consequently, because Co concentrations are higher in titanomagnetite from high-grade ores (Figure 9 and Figure 11a), instead of being lower as expected from an increase of fO2 [52], another parameter could be involved in the incorporation of V into magnetite. Another alternative is that titanomagnetite must interact with a maximum volume of silicate magma to be enriched in V. This hypothesis is analogous to the R-factor (the silicate to sulfide liquid ratio), which is used to explain the enrichment in platinum-group elements within base metal sulfides (e.g., [63,64,65]). According to Campbell and Naldrett [63], the following equation can be used to assess the R-factor (R)’s effect on the concentration of a metal in a fractionated phase (CFP):
CFP = CLD(R + 1)/(R + D)
in which CL is the concentration of the metal in the silicate liquid, and D is the partition coefficient between the fractionated phase and the silicate liquid. Based on a DV into magnetite of 22 [52], an initial concentration of V in the silicate liquid of 500 ppm, and the Rayleigh fractionation law, we estimate using Equation (3) that the V concentration in titanomagnetite drastically drops from 9167 to 3667 ppm when the “R-factor” decreases from 99 to 9. Thus, if high-grade ores are derived from high proportions of crystallizing titanomagnetite (up to ~22 wt. % in cotectic proportion; [51]), a lower R-factor could explain lower concentrations of V.

4.4.2. Ilmenite

The composition of ilmenite exsolutions is compared to the composition of ilmenite that derives from primary crystallization in Figure 10 and Figure 11b. Given that Ilmenite-E2 is generally too small to be analyzed by LA-ICP-MS, the composition of exsolutions was only determined from thick lamellae of Ilmenite-E1, while ensuring that Al-spinel exsolutions were avoided during laser ablation. As expressed in Figure 10, lamellar ilmenite is clearly enriched in V and Al, but depleted in Nb and Ta relative to the primary grains. This is not surprising given that V3+ and Al3+ are more compatible with the spinel structure during primary crystallization, whereas high-field-strength elements (HFSEs), such as Nb and Ta, enter more easily into the ilmenite through 4+ cation substitution (e.g., [66]). Furthermore, the normalized average compositions that are given in Figure 11b indicate that Ilmenite-E1 tends to be also enriched in W, Sn, and Ga, but depleted in other HFSEs, such as Zr and Hf, relative to primary ilmenite. The concentrations of HFSEs, as well as those of W, Sc, Mg, Mn, and obviously Ti, are higher in ilmenite compared to titanomagnetite, which concentrates most of the other elements (Figure 11b).

4.5. Major Element Composition of Al-Spinels

Our investigation on Al-spinel exsolutions by EDS revealed two compositional series: low-Ti (<2 wt. % TiO2) and high-Ti (3–7.5 wt. % TiO2; Table S2). The Al-spinels are also distinguished by their combined Zn and Fe contents. Figure 12a shows that low-Ti Al-spinels are richer in ZnO + FeOTotal than high-Ti Al-spinels. Furthermore, the ratios of ZnO to FeO are different, with low-Ti Al-spinels generally being richer in Zn (Figure 12b). In addition to their lower content of Zn and Fe, high-Ti Al-spinels tend to be enriched in Al2O3 and V2O3 relative to low-Ti ones (avg. high-Ti = 59.43 wt. % Al2O3 and 0.47 wt. % V2O3; avg. low-Ti = 56.55 wt. % Al2O3 and 0.29 wt. % V2O3). As was emphasized in the discussion, the occurrence of high- and low-Ti Al-spinels in titanomagnetite is strongly relevant for the reconstitution of the cooling history.

5. Discussion

5.1. Multi-Stage Growth of the Layered Series

Magma chamber replenishment by episodic reinjections of more primitive magma is a commonly used hypothesis to explain reversals in mineral compositional trends that are not consistent with what is expected from a magmatic system undergoing progressive fractional crystallization (e.g., [54,55,57,67,68]). Large-scale cyclic units in layered complexes, such as the Rum intrusion in Scotland, the Muskox intrusion in Canada, and the Stillwater Complex in the United States, have been interpreted to be the result of repeated influxes of new primitive magma into the chamber [69,70,71]. Similarly, many authors agree that the Bushveld Complex was built from successive magma influxes, recognizing injections of three main magma types (known as B1, B2, and B3) of which the composition has been inferred from the occurrence of fine-grained sills of distinct ages at the base of the intrusion [72]. According to Cawthorn [73], thick layered intrusions, such as the Bushveld Complex, result from an early event of high injection frequency that would have led to self-perpetuating inflation of an initial sill-like reservoir. His model involves a first single injection exceeding 100 m in thickness and a time interval between subsequent injections (at least two) of less than 40 years. Consequently, the central section of the body might remain in liquid phase long enough so that all further injections would inflate the magma reservoir, instead of forming discrete sills [73].
In the case of the LDC, Polat et al. [5] recently proposed the presence of two different magma types, one generating gabbros and mafic dykes (genetically linked to the Obatogamau tholeiites), and the other anorthositic rocks. Along the same lines, we propose in the following section that the Layered Series of the LDC was built from successive magma injections with potential evidence of magma chamber inflation.
Titanomagnetite from the LDC has recorded several replenishment events, which are specifically manifested by abrupt reversals in Cr. As indicated earlier, this could be due to either successive magma influxes or episodic convective overturns of the resident magma. Furthermore, major reversals in Mg, Co, Ti, and Si are coincident with the replenishment event that took place at the 65-MHL (Figure 9). Above this critical level, the modal composition of cumulate rocks suggests that the more compatible behavior of Mg, Co, and Ti (relative to the underlying levels) resulted from a decrease in crystallizing plagioclase to pyroxene proportions. Accordingly, it seems that magma chamber replenishment at the 65-MHL was the most important event. Given that silicate liquid in a closed system should become gradually fractionated, it seems that convective overturn alone would not be sufficient to explain this major compositional change. Therefore, the addition of a large volume of fresh magma is proposed as the mechanism accounting for the compositional reversals that have been reported at this critical stratigraphic level.
Numerous autoliths found in layered intrusions have been interpreted as blocks that have collapsed from the roof of the magma chamber that subsequently sank through the magma column and the underlying partly solidified sequence (e.g., [74,75,76,77]). According to the model of Daigneault and Allard [4], the autoliths that were found in the Layered Series would represent blocks from the Upper Border Zone that foundered into the magma following the collapse of the chamber roof. Our mapping work on the lower part of the Layered Series indicates that autoliths, which range from gabbroic to pyroxenitic in composition, are strictly limited to a ~30-m-thick section that is directly located above the 65-MHL (Figure 2). This suggests that crystal mush below this critical level was highly densified and blocks were not able to sink deeper into the magma chamber.
In light of our observations and interpretations, we propose a multi-stage growth model for the Layered Series of the south limb that can be summarized as follows. (1) A first cyclic unit (U1) of titanomagnetite-rich layered rocks crystallized from a batch of evolved basaltic magma (Obatogamau type; Figure 13a). During this stage, the crystallization zone was episodically recharged either by the addition of small volumes of fresh magma or by convective overturns. (2) The fractional crystallization was then temporarily interrupted by a major influx of less differentiated magma that inflated the LDC magma chamber (Figure 13b). The absence of a basal chilled margin suggests that the new magma was not much hotter (nor denser) than the resident magma (ΔT ≤ 100 °C; [73,78]), and therefore that both (i.e., the new and old magmas) were instantly mixed and homogenized. At this stage, a thick layer of crystal-poor hybrid magma is underlain by a highly consolidated crystal mush. (3) The inflation caused earthquakes and instability of the magma chamber’s roof (the Upper Border Zone, which was previously developed by downward crystallization and plagioclase flotation) from where blocks foundered into the underlying magma (Figure 13c). The autoliths have not penetrated the U1, as its top represented the magma chamber’s floor at the time of inflation. Rather, they accumulated near the base of the second cyclic unit, the U2 (Figure 13d). Although there is strong evidence for dynamic processes operating in the LDC magma chamber, we acknowledge that more extensive mapping of the autoliths’ spatial distribution could give rise to divergences of interpretation. However, as the block-rich horizon has also been observed in adjacent trenches, this stratigraphic level likely indicates a major period of chamber roof instability and collapse.
In the evolutionary model of the LDC that was proposed by Daigneault and Allard [4], the assimilation of felsic volcanic rocks of the overlying Waconichi Formation would have promoted the crystallization of titanomagnetite. More recently, Higgins [75] suggested that the crystallization of titanomagnetite in the Sept-Îles Intrusive Suite in Québec (Canada) would have been caused by the addition of water via the solution or the dehydration of autoliths that detached from the Upper Border series. In either case, contamination would have increased fO2, which would in turn make Fe3+ more available for the stability of titanomagnetite. However, we think that the assimilation of igneous rocks, whether they come from the Waconichi Formation or the Upper Border Zone, does not constitute an adequate source of oxygen, unless these have been hydrated during their formation. As a solution to this problem, Higgins [75] claims that the alteration products of the autoliths in the Sept-Iles Intrusive Suite formed at very shallow levels, possibly through a circulation of hydrothermal fluids in the roof of the intrusion during solidification. A similar process could be invoked for the hydration of the Waconichi Formation, as it took place in an intra-oceanic setting [4,5]. Nevertheless, considering our interpretation, which is shown in Figure 13, if a progressive inflation of the magma chamber by successive magma influxes is involved, then it is unlikely that assimilation of the Waconichi Formation, which would have occurred late during the LDC’s growth, was responsible for the formation of titanomagnetite layers. Accordingly, and because the autoliths do not seem to be particularly altered (excluding the greenschist regional metamorphism overprint), we do not discard the possibility that the formation of the titanomagnetite deposit involved other mechanisms, such as the settling and sorting of minerals [79] and magma mixing [80,81].

5.2. Formation of Ilmenite-E1 and -E2

Our mineralogical and textural examination of titanomagnetite has revealed the presence of two main types of ilmenite exsolution in the Layered Series. Ilmenite-E1 mostly consists of thick trellis- and sandwich-type lamellae (Figure 4a), whereas Ilmenite-E2 consists of very minute exsolutions that display a wide variety of textures (Figure 5). Considering first the oxy-exsolution model of Buddington and Lindsley [23] that is summarized in Equation (1), Ilmenite-E1 would result from the oxidation of ulvöspinel at super-solvus temperatures, which is considered by many other researchers to account for the development of the thick lamellae of ilmenite (e.g., [15,16,22,24,26,82]). On the other hand, the formation of Ilmenite-E2 could be ascribed to the oxidation of pre-existing ulvöspinel exsolutions [15,21]. This process of oxidation implies that titanomagnetitess remains at relatively reducing conditions until the temperature drops below the magnetite-ulvöspinel solvus, and that fO2 subsequently increases to reach the equilibrium in Equation (1). In our samples, sub-solvus transformation of ulvöspinel is evidenced by ilmenite pseudomorphous after cloth-textured intergrowths (Stage 1 in Section 4.2.2; Figure 5a). Given that temperature plays an important role in the diffusion–migration process, Von Gruenewaldt et al. [15] proposed that the ulvöspinel content of the original solid solution must be close to that of the upper consolute point of the magnetite-ulvöspinel solvus to promote the migration of proto-ilmenite (Ilmenite-E2), and, therefore, the development of more complex textures (Stages 2, 3, and 4 in Section 4.2.2; Figure 13a,c,d).
As was determined from various experiments, the apex of the magnetite-ulvöspinel solvus should lie between 450 and 600 °C, over a range of composition from Mag45-Usp55 to Mag65-Usp35 [13,17,18,19]. As shown in Figure 14a, the convex shape of the experimental solvus (relative to increasing temperature) suggests two possibilities for the occurrence of super- and sub-solvus exsolutions of ilmenite within a single intrusion. If they both formed at the same temperature, then they formed from titanomagnetite of different compositions: one close to the apex, and the other on either side of the solvus curve (Figure 14b). Alternatively, if the composition of the titanomagnetite is fixed, then they formed at different temperatures (Figure 14c). Because titanomagnetite hosting Ilmenite-E1 is compositionally very close to that in which Ilmenite-E2 predominates (avg. = Mag62-Usp38 and Mag61-Usp39, respectively; Figure 14a), it is more likely that the different types of exsolution formed at different temperatures. Furthermore, the occasional coexistence of both types in the same oxide assemblage indicates that the exsolution process can extend over an interval of temperature from above to below the solvus curve.
The systematic absence of Ilmenite-E2 in the immediate vicinity of Ilmenite-E1 (Figure 5f) is the most convincing physical evidence that Ilmenite-E1 was formed at higher temperatures than the Ilmenite-E2. This indicates either: (1) that Ilmenite-E2 migrated toward Ilmenite-E1 following the oxidation of cloth-textured intergrowths [15,21], or (2) that early formation of Ilmenite-E1 was responsible for a Ti-depleted boundary layer where the exsolution of ulvöspinel was then inhibited. In the attempt to confirm the occurrence of two generations of ilmenite exsolution (i.e., super- and sub-solvus), we calculated the temperature and fO2 conditions of equilibrium between ilmenite and its magnetite host using our microprobe data and geothermobarometers from Spencer and Lindsley [83] and Andersen and Lindsley [84]. The results are given in Table S6. As is shown in Figure 15, the inter-oxide cooling trend is reducing and thus consistent with the path that is followed during the cooling of an oxide assemblage that is dominated by titanomagnetite [85,86]. The calculated temperatures and fO2 respectively range from 339 to 531 °C and from +0.1 to −11.1 (relative to the fayalite-magnetite-quartz (FMQ) buffer), and do not suggest two discrete temperature windows of equilibrium as we would have expected. However, the obtained temperatures are thought to be far lower than those that would be expected from conditions of equilibrium upon cooling. We thus conclude that our results are more likely to represent conditions of metamorphic equilibrium at greenschist facies. This hypothesis is consistent with the depletion of many trace elements (e.g., Ni, Mg, and Co) in disseminated FTO (Figure 13), which we have interpreted as being the result of re-equilibration with the surrounding metamorphic silicates. For comparative purposes, we calculated the temperatures and fO2 using the compositions of magnetite and ilmenite from the low-metamorphosed Sept-Îles Intrusive Suite that were reported by Nabil [87]. As indicated in Figure 15, magnetite–ilmenite couples from the Sept-Îles Intrusive Suite followed a slightly more reduced path over a range of temperatures that is more consistent with conditions of magmatic equilibrium.
In more recent years, alternative processes to oxy-exsolution have been proposed to account for ilmenite exsolutions that have been formed at temperatures above the magnetite-ulvöspinel solvus. Experiments that were conducted under O2-conserving conditions by Lattard [25] demonstrated that ilmenite may directly exsolve from cation-deficient spinelss at high temperatures and low fO2 due to the development of cationic vacancies after the substitution of 2Fe2+ by Ti4+, and to a lesser extent of 3Fe2+ by 2X3+ (X = Fe3+, Al3+, Cr3+, and V3+). However, given that the vacancy concentration is negligible below 900°C [88] and decreases with increasing fO2 [89], Lattard [25] argues that vacancy relaxation is probably not responsible for the majority of ilmenite exsolutions in terrestrial spinels, which are better interpreted to be the result of oxidation. Considering that cationic vacancies do not exceed ~2% in spinelss at 1300°C [11], Tan et al. [26] subsequently estimated that the maximum amount of ilmenite that could be formed by direct exsolution from cation-deficient spinelss is ~15–16 wt. % of the whole titanomagnetite crystal, which is significantly lower than the values that were obtained from our quantitative analysis (avg. = 22.8 wt. %; Table S5a).
Ilmenite that derives from primary crystallization is susceptible to contain hematite lamellae predominantly along one set of its {0001} lattice planes (e.g., [90,91,92]). Hematite lamellae are formed upon cooling through isochemical decomposition of an original ilmenite-hematitess below a consolute point lying at ~675–750 °C [93,94,95]. In the model of Buddington and Lindsley [23], magnetite exsolutions within primary ilmenite are considered to be a sub-solidus reduced product of the hematite component with decreasing fO2, as in the following equilibrium:
6 Fe2O3 (hematite) = 4 Fe3O4 + O2
As pointed out by Tan et al. [26], the reverse host-guest intergrowth is unlikely to be derived from an overall increase of fO2 in cases for which both types of exsolution, i.e., ilmenite (in a magnetite host) and magnetite (in an ilmenite host), simultaneously occur. Consequently, they suggested that ilmenite exsolutions could result from an inter-oxide re-equilibration between spinelss and ilmenite-hematitess that can be expressed by the following exchange operation (see also Frost [86]):
Fe2TiO4 in spinel ss + Fe2O3 in ilmenite-hematite ss = FeTiO3 in magnetite host + Fe3O4 in ilmenite host
As a result of this oxidation-reduction equilibrium, Fe3+/Fe2+ in spinelss would increase as much as Fe3+/Fe2+ decreases in ilmenite-hematitess. Accordingly, Tan et al. [26] proposed that the loss of Fe2+ in spinelss can be estimated by the amount of magnetite exsolution in the adjacent ilmenite. However, the complete absence of exsolution in our primary ilmenite (whether hematite or magnetite) suggests that the Fe2O3 content in the original ilmenite-hematitess was not high enough to achieve the aforementioned equilibrium, and, therefore, that inter-oxide re-equilibration cannot be the dominant mechanism of exsolution in the LDC rocks.
Although we do not discard the possibility that small amounts of magnetite-hosted ilmenite could be ascribed to direct exsolution from cation-deficient spinelss or to inter-oxide re-equilibration [25,26] under local conditions, we are confident that the bulk of ilmenite exsolutions in the LDC rocks were formed via the oxidation of ulvöspinel at temperatures both above and below the magnetite-ulvöspinel solvus. The discrimination of Ilmenite-E1 and -E2 by their Sb and As contents (Figure 9) can be used to investigate the hypothesis of two temperature windows of oxidation. In terrestrial magmas, Sb and As can be present as both 3+ and 5+ cations with higher X5+/X3+ ratios under more oxidizing conditions [96,97]. Given that 3+ cations enter more easily the spinel structures than 5+ cations, Sb and As are, thus, more likely to be incorporated into titanomagnetite at relatively low fO2 (and vice versa). As a result, we propose that titanomagnetite hosting Ilmenite-E1 crystallized at higher fO2 than titanomagnetite hosting Ilmenite-E2, as they respectively contain low and high concentrations of Sb and As, regardless of potential effects of magma differentiation. Although the relationship between Sb and As concentrations and the textural nature of ilmenite exsolutions suggest smaller-scale fluctuations of fO2 near the base of the section, the Sb diagram in Figure 9 suggests a general upward increase of fO2 in the U1 and U2. This is manifested by high Sb concentrations and dominance of Ilmenite-E2 in the lower parts, and low Sb concentrations and dominance of Ilmenite-E1 in the upper parts. Accordingly, we conclude that titanomagnetitess in the upper part of the U1 and U2 was more susceptible to oxidation at higher temperatures (above the magnetite-ulvöspinel solvus) as fO2 was initially higher, producing trellis- or sandwich-type lamellae of Ilmenite-E1. On the other hand, lower fO2 at the base of the cyclic units implies that titanomagnetitess remained at relatively reduced conditions until ulvöspinel exsolved, which was in turn oxidized to form Ilmenite-E2.

5.3. Imposed or Non-Imposed Exsolutions of Hercynite-Gahnite Spinels?

Pleonaste is the most common Al-spinel found as an exsolution in titanomagnetite of mafic intrusive rocks (e.g., [15,22,27,29,30,31]). Although considerable amounts of Zn were detected in pleonaste from the Serrote da Laje mafic–ultramafic sill in Brazil (up to 4.5 wt. % ZnO according to Amcoff and Figueiredo [30]), our investigation by EDS revealed the first finding of gahnitic spinels that were formed from the decomposition of primary titanomagnetitess. The presence of zinciferous herycnite and/or gahnite, instead of pleonaste, results from an “abnormally” higher content of Zn relative to Mg in the original solid solution (avg. = 2914 and 434 ppm, respectively), as compared, for example, with values obtained by Dare et al. [47] from the lowermost titanomagnetite layer of the Bushveld Complex (avg. = 471 and 6569 ppm, respectively).
According to experiments that were conducted by Turnock and Eugster [32], the solvus of the magnetite-hercynitess lies below ~860 °C, making hercynite more likely to predate ulvöspinel in the ternary system Fe3O4-Fe2TiO4-FeAl2O4. To the best of our knowledge, the effect of diadochic substitution of Fe2+ for Zn2+ on the position of the solvus has not yet been investigated. However, textural relationships between ilmenite and Al-spinel exsolutions allowed us to qualitatively constrain the timing of Al-spinel exsolution.
The presence of Al-spinel strings included in, and/or aligned along, lamellae of Ilmenite-E1 (Figure 6c) is a key feature to reconstitute the cooling history of titanomagnetite. Haggerty [98] was the first to propose that the removal of ulvöspinel via the oxy-exsolution process can lead to a surplus in previously insoluble components, implying that the exsolution of Al-spinel is required to lower the Al and Mg in excess. Accordingly, Amcoff and Figueiredo [30] subsequently suggested that the diffusion of ilmenite (i.e., ulvöspinel in solid solution) in magnetite was apparently a very rapid process compared to the diffusion of the Al-spinel components, which simply piled up around growing lamellae. As shown in Figure 16, the LA-ICP-MS time-resolved signal indicates that Cr (one of the slowest-diffusing cations in magnetite [99]) is enriched in the boundary layer between ilmenite lamellae and the magnetite host. A similar process could have happened in the early stages of hercynite-gahnite exsolution from titanomagnetite. This point has previously been made by Mücke [82], who reported enrichments in Al and Zn in the immediate vicinity of ilmenite lamellae in titanomagnetite from the Merensky Reef of the Bushveld Complex. Consequently, we propose that a certain amount of Al-spinel in titanomagnetite from the Layered Series exsolved at the boundary layer between the ilmenite and the magnetite due to an excess of Al and Zn that made the solid solution non-stoichiometric. During further growth of lamellae, Al-spinels would then be incorporated into the ilmenite, and a second Al-spinel string developed at the new magnetite-ilmenite interface. The reiteration of this process eventually resulted in a cyclic series of parallel strings marking now former boundaries. However, this proposed mechanism does not exclude the possibility that small amounts of Al-spinel predated the oxy-exsolution process prior to being incorporated into the subsequent lamellae.
The absence or reduced size of Al-spinels in the immediate vicinity of lamellae of Ilmenite-E1 (Figure 6f) indicates that the imposed formation of Al-spinels has left an Al-Zn-depleted layer where no further Al-spinels could form. Consequently, as also suggested by Von Gruenewaldt et al. [15], most of the Al-spinels in non-depleted areas (i.e., far from the lamellae) postdate the oxy-exsolution process, and, thus, have not been imposed by the removal of ulvöspinel. In contrast, as Ilmenite-E2 is interpreted to have formed at temperatures below the magnetite-ulvöspinel solvus, the formation of associated Al-spinels is thought to predate the oxidation. Indeed, the presence of thin Ilmenite-E2 lamellae that end abruptly at the meeting of euhedral-like Al-spinels is consistent with this assumption (Figure 17a). On the other hand, thin lamellae that penetrate irregularly-shaped grains indicate that some Al-spinels postdate Ilmentite-E2 (Figure 17b). Thus, the exsolution of Al-spinel may be regarded as a continuous process operating from temperatures above the magnetite-ulvöspinel solvus down to temperatures below the solvus. Continuous Al-spinel exsolution was, therefore, controlled by the compositional evolution of the solid solution upon cooling.
Our EDS investigation of Al-spinel exsolutions reveals two compositional series: the high- and low-Ti. As is shown in Figure 12, most of the Al-spinels that were analyzed in titanomagnetite hosting Ilmenite-E2 plot in the high-Ti field (avg. TiO2 = 4.56 wt. %), whereas most of those from titanomagnetite hosting Ilmenite-E1 plot in the low-Ti field (avg. TiO2 = 1.82 wt. %). Given the spatial relationship between both types of ilmenite and the Al-spinels, we suggest that high-Ti Al-spinels formed before the oxidation whereas low-Ti Al-spinels formed after. As the removal of ulvöspinel should have yielded an enrichment of Zn relative to Fe in the remaining solid solution, it is, therefore, consistent that Al-spinels with the higher Zn content were found in titanomagnetite hosting Ilmenite-E1 (Figure 12b).

5.4. Formation of Corundum via the Oxidation of Hercynite

The presence of corundum (Al2O3) as an exsolution product from primary spinelss has rarely been reported in the literature. Butcher and Merkle [29] proposed that corundum in titanomagnetite from the Upper Zone of the Bushveld Complex has exsolved directly from the solid solution at temperatures above 800 °C in response to a surplus of Al at the grain margins. Kulikova and Varlamov [100] came to a similar conclusion for the origin of corundum at the boundaries between ilmenite and its magnetite host in gabbroic rocks from the Malyko-Kharampe Complex (Polar Urals). In the LDC, the vast majority of corundum occurs in HCM intergrowths with magnetite and zinciferous hercynite (Figure 7), as opposed to single exsolutions. The experiments that were conducted by Turnock and Eugster [32] demonstrated that the oxidation of hercynite leads to the formation of corundum together with magnetite. This oxidation reaction can be expressed as follows:
6 FeAl2O4 + O2 = 2 Fe3O4 + 6 Al2O3
In this equation, the amount of corundum (in wt. %) that is formed should be ~1.9 times higher than the amount of magnetite. By using the quantitative method that is described in Section 3.3, we found that the corundum-to-magnetite weight proportion in 12 randomly selected HCMs is consistent with this mass balance (avg. = 1.71; Table S5b), suggesting that corundum results from the oxidation of former hercynite grains. During this process, Zn would concentrate in the remaining hercynite, resulting in a surplus of Fe which in turn led to the formation of tiny blebs of magnetite (Figure 7a). The preferential occurrence of HCMs at titanomagnetite boundaries implies that the hercynite components, of which a majority were concentrated in grain margins, diffused outward (Figure 7b). The alignments of HCMs within the margins of external ilmenite granules (Figure 7c) suggest that the removal of ulvöspinel may also have induced the exsolution of hercynite, as in the case of corundum-free Al-spinels.
Given that HCMs are generally restricted to the upper half of the U1 (Figure 8b), the residual liquid likely became gradually enriched in Al as differentiation progressed in the first stages of the formation of the Layered Series. Following the injection of a significant volume of less-differentiated magma, the Al content of the hybrid magma would not have been high enough to be enriched in the subsequent residual liquid, inhibiting the exsolution of hercynite from grain margins.

5.5. Mass-Balance Calculations and Partition Coefficients between Al-Zn-Rich Magnetitess and Ilmenite Exsolutions

Mass-balance calculations have been used to assess the role of ilmenite exsolutions in controlling trace elements during the oxy-exsolution process. The proportion of the 27 elements accounted for by Ilmenite-E1 ( F I l m x ) have been determined using the following equation:
F I l m x = ( C I l m x F I l m ) / C T m t x
in which C I l m x is the average concentration of an element (x) in the ilmenite exsolutions, F I l m is the weight fraction of the ilmenite exsolutions, and C T m t x is the average concentration of the same element (x) in titanomagnetite. The trace element concentrations are from the LA-ICP-MS data set (Table S3). F I l m has first been determined in vol. % using our results of quantitative analysis (Table S5a) and assuming an average content of Al-spinel exsolution of 2.6 vol. % (see above) and no corundum. The values have then been converted to weight % using the following specific density: magnetite = 5.2 g/cc; ilmenite = 4.8 g/cc; and hercynite-gahnite spinels = 4.1 g/cc. Unfortunately, the mass balance could not be performed on titanomagnetite hosting Ilmenite-E2 since exsolutions were too small to be analyzed by LA-ICP-MS. The numerical results are given in Table S7.
Our mass-balance average and median results indicate that Ilmenite-E1 control more than 50% of the Hf, W, Sc, Ta, Nb, In, Mn, and Ti budget, whereas the other exsolution products, i.e., magnetite plus minor hercynite-gahnite spinels (±corundum), account for the remaining elements, notably with more than 90% of the Si, Al, Mo, Ga, Zn, V, Ni, and Cr budget (Figure 18a). By using the average concentration of Al in magnetite, ilmenite, and Al-spinels, as well as the average ilmenite-to-magnetite proportion in titanomagnetite, we calculated that ~2.1 wt. % (equivalent to 2.6 vol. %) Al-spinel is required for a 100% mass balance. This value represents a maximum average considering that small amounts of corundum could have been ablated. On the basis of this calculation, we estimate that Al-spinels account for ~86% and 76% of the Al and Zn budget, respectively, and, therefore, that both elements are largely removed from the original solid solution during Al-spinel exsolution.
Because ilmenite lamellae were mainly analyzed in areas corresponding to the margins of titanomagnetite grains to avoid interception of Al-spinel inclusions, zonation in trace elements could have led to mass-balance inaccuracy. As shown in Figure 19, the time-resolved signals show that Nb tends to be enriched at grain margins, indicating a potential overestimation of the Ilmenite-E1 mass-balance, which would explain the results that far exceed 100%. Mass-balance inaccuracy could also be due to analytical errors for elements with low concentrations, such as Nb. Tantalum seems to behave the same way as Nb (not shown). Inversely, Al, Mg, and Zn are probably underestimated as they are depleted in titanomagnetite margins. Despite the slight inaccuracy, our mass-balance calculations allow us to present empirical solid–solid partition coefficients for trace elements between Ilmenite-E1 and Al–Zn-rich magnetitess.
As interpreted during this study, Ilmenite-E1 would correspond to the very first exsolution product appearing upon cooling of the former titanomagnetitess. Consequently, by using the average compositions of titanomagnetite and Ilmenite-E1, we can investigate the partitioning behavior of trace elements during the oxy-exsolution process. The estimated partition coefficients are given in Table S8 and shown in Figure 18b. Our average results range between D Ta Ilm / Mag = 8.57 and D Al Ilm / Mag = 0.01 with the elements listed in order of compatibility: Ta, Nb, Ti, Mn, Sc, Hf, W, In, P, Sn, Mg, Zr, Sb, Cu, Co, As, Ca, Pb, Y, Si, Mo, V, Ni, Cr, Zn, Ga, and Al. According to this list, elements from Ta to Sb have a compatible behavior with ilmenite during the oxy-exsolution process ( D x Ilm / Mag >1), whereas the remaining elements have an incompatible behavior and prefer magnetite ( D x Ilm / Mag <1). Although zonation and metamorphic re-equilibration could slightly affect the values of our partition coefficients, our results remain consistent with a previous chemical characterization of the ilmenite-magnetite pair [101].

5.6. Cooling History
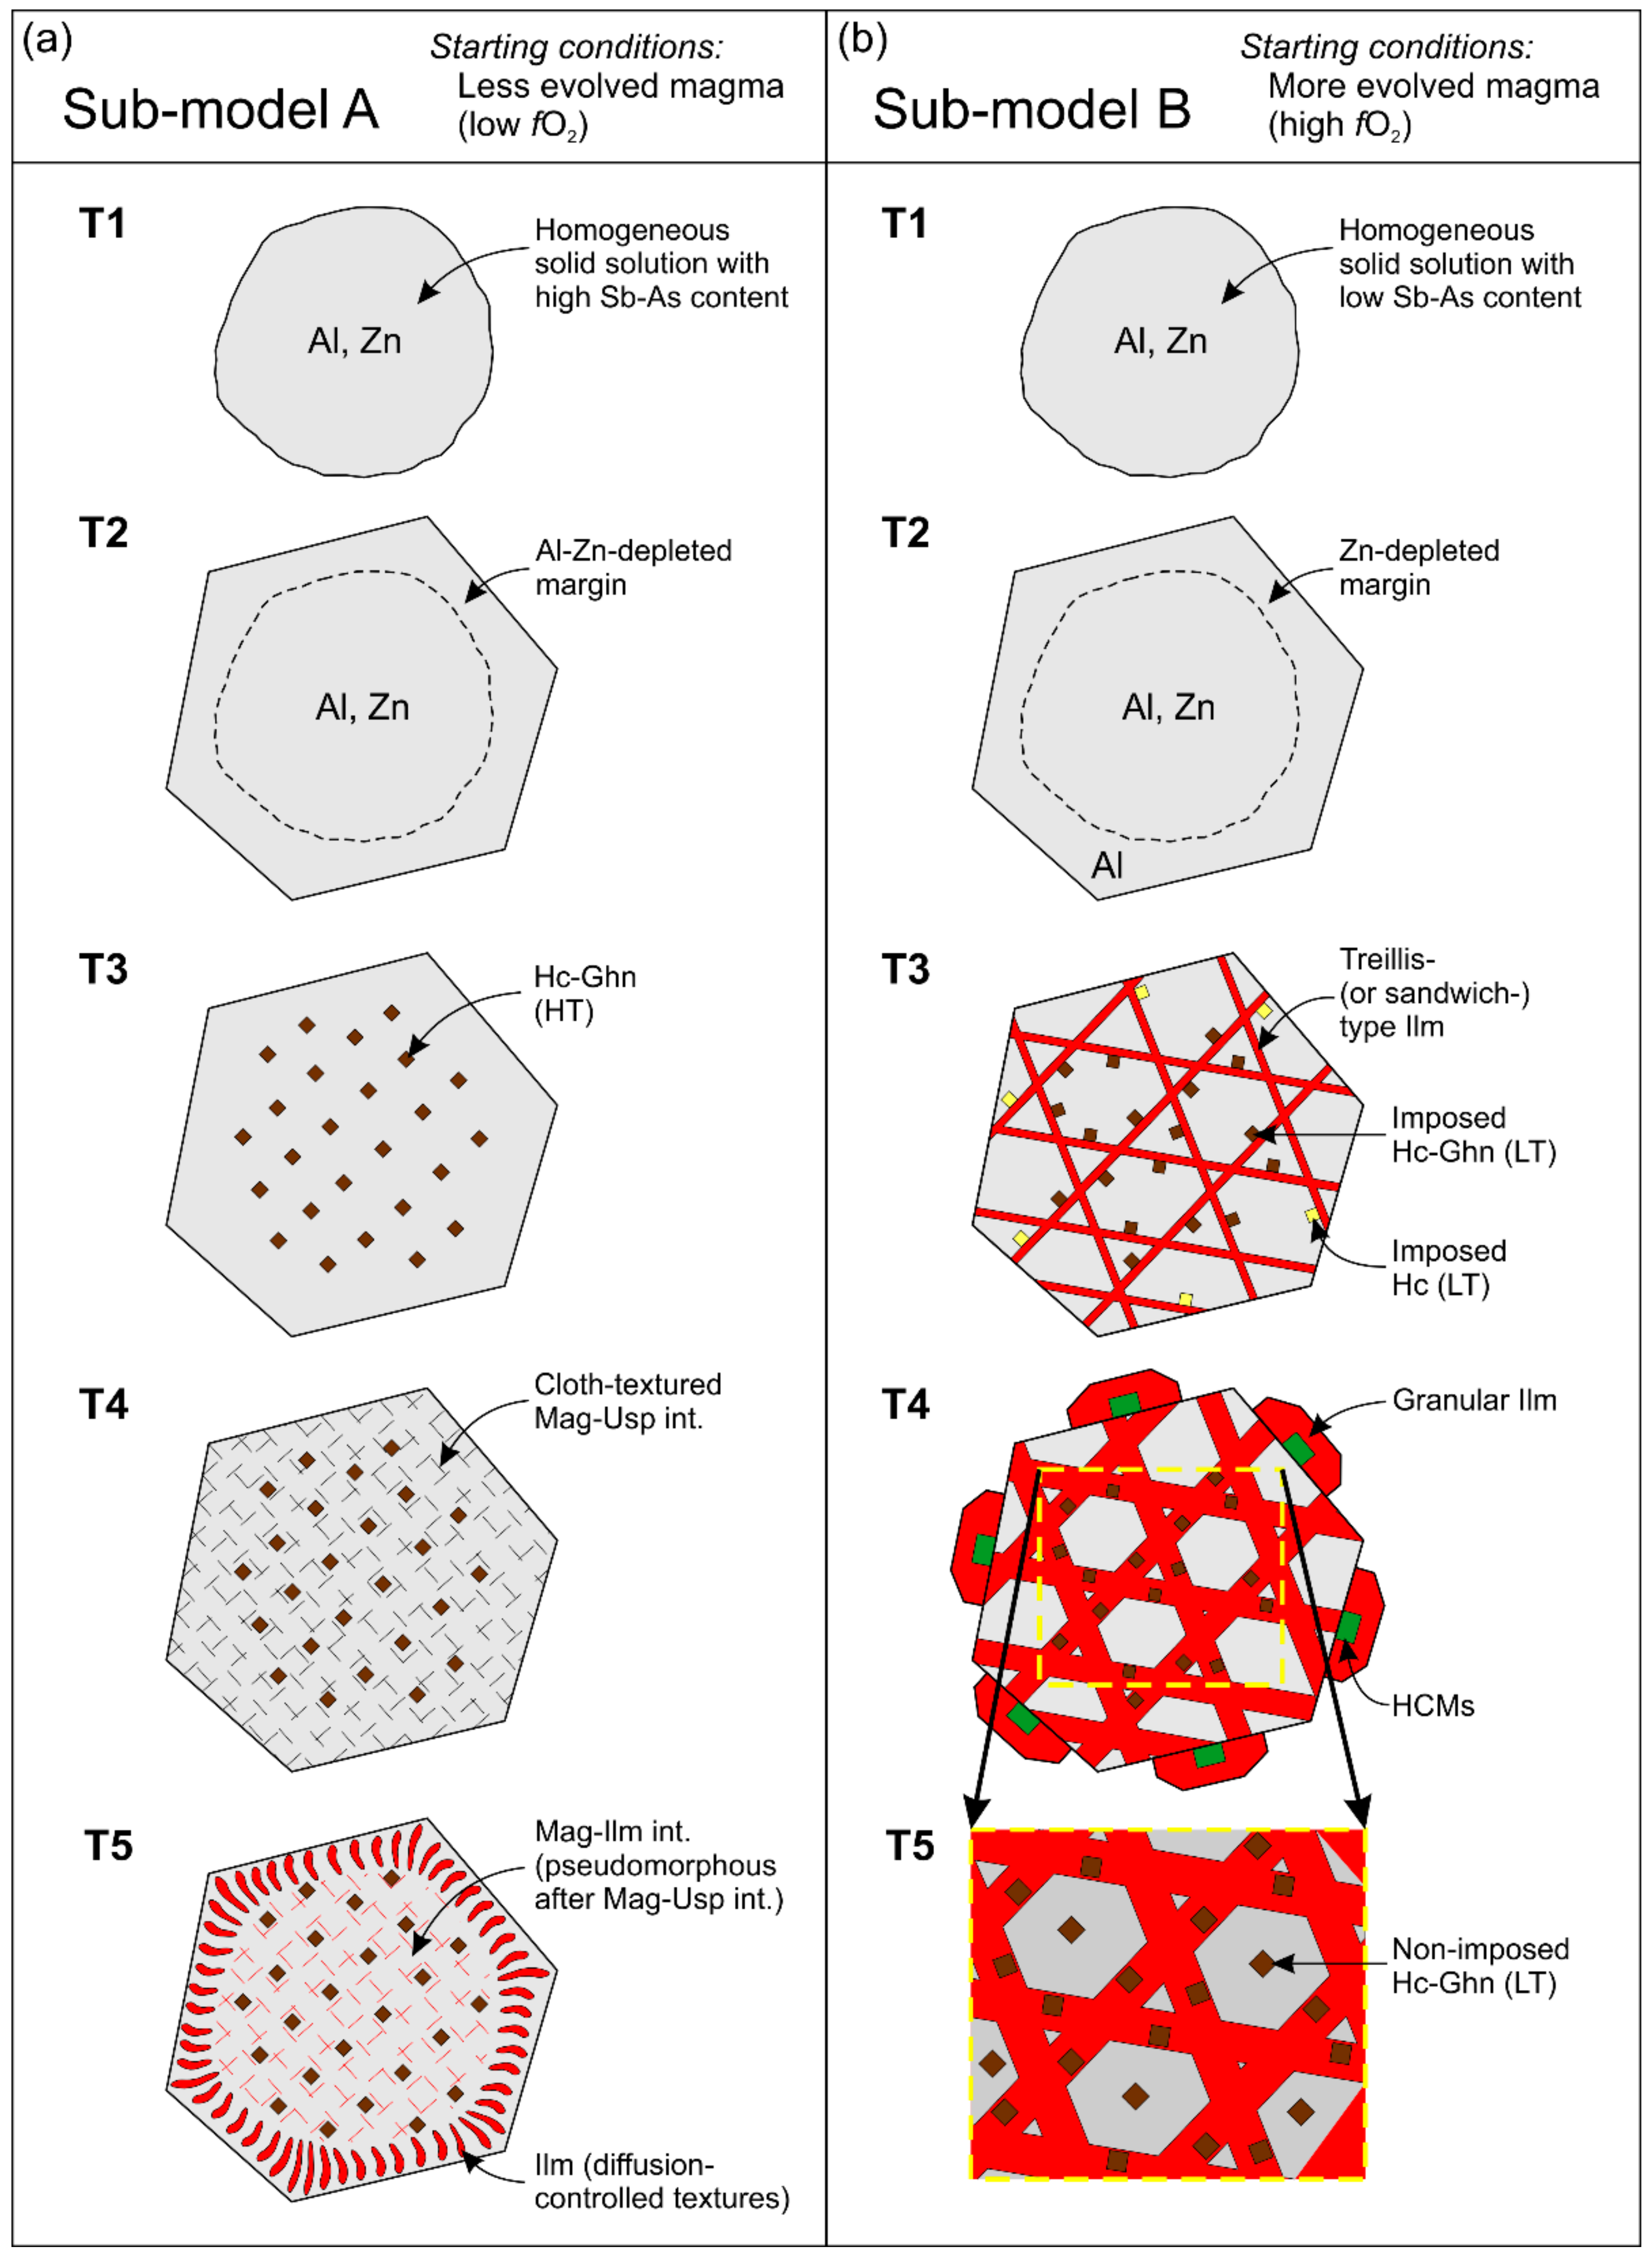
Based on our investigation, we propose a cooling reconstitution model for the massive titanomagnetite layers of the LDC. This general model summarizes the re-equilibration processes that lead to the decomposition of an original solid solution that crystallized under either low- or high-fO2 conditions (sub-models A and B in Figure 20); low- and high-fO2 conditions of crystallization respectively refer to the lower and upper parts of the U1 and U2; the terms “low” and “high” are used here only as a qualitative proxy for fO2 conditions because titanomagnetite necessarily requires oxidizing conditions to crystallize as the major FTO mineral [51]. In addition, our modeling takes into account the following assumptions and features: (1) massive titanomagnetite layers from the U1 have been chosen for the modeling; (2) according to Toplis and Carroll [51], the lowest temperature for magnetite-ulvöspinelss to be the only Fe-oxide phase on the liquidus (i.e., without crystallizing ilmenite-hematitess) lies above 1000 °C in ferrobasaltic systems; and (3) the temperatures of exsolution are only given as qualitative values that refer to the apex of the experimental solvus that was determined for the binary systems Fe3O4-Fe2TiO4 and Fe3O4-FeAl2O4 by Lilova et al. [13] and Turnock and Eugster [32], respectively. With the exception of changes in Al-spinel abundance and distribution due to magma hybridization (see Section 5.4), the following model can also be applied to the U2.

5.6.1. Sub-Model A

Figure 20a shows the cooling sub-model for massive titanomagnetite layers from the lower part of the U1. At T1 (>1000 °C), titanomagnetite starts to crystallize from a relatively reduced, undifferentiated magma. The low-fO2 conditions promote the incorporation of Sb and As into the spinel structure in response to low X5+/X3+ ratios in the magma.
After the accumulation of titanomagnetite by density settling and mechanical sorting (T2), further crystal growth from an Al-Zn-depleted residual liquid leads to the densification of the crystal mush. At that temperature, the liquid-filled porosity was gradually eliminated through a process of pressure-solution compaction inducing the migration of crystal margins and the development of polygonal grains (e.g., [102,103]). The presence of well-annealed grains showing straight boundaries and interfacial angles of ± 120° is consistent with this process of textural maturation.
At T3 (~860 °C), high-Ti Al-spinels from the hercynite-gahnite series started to exsolve from the solid solution as small granules, or, more rarely, as thin discs arranged along the {100} directions of the magnetite structure. Since the dissolved quantities of Al and Zn were especially high during the early stages of titanomagnetite growth, Al-spinels formed predominantly from the core of titanomagnetite, leaving the margins free of exsolutions.
At T4 (~550 °C), the ulvöspinel component started to exsolve from the solid solution, forming a cloth-like texture that is defined by very fine lamellae or prisms arranged along {100} lattice planes of the spinel host. Upon further cooling to temperatures below the magnetite-ulvöspinel solvus (T5), the oxidation of titanomagnetite led to the formation of ilmenite pseudomorphous after ulvöspinel (Ilmenite-E2), causing optical anisotropy in conformity with {111} directions of the spinel host. Increasing degrees of diffusion near the grain boundaries resulted in a zonation of Ilmenite-E2 textures, which is typically recognisable by the development of patchy and vermicular intergrowths. Redistribution (diffusion) of the remaining Al and Zn contents due to the removal of the ulvöspinel component (T4) and the subsequent oxidation–diffusion process (T5) caused the formation of a new generation of Al-spinel exsolutions, which belongs to the low-Ti series.

5.6.2. Sub-Model B

Increasing fO2 and Al content of the magma with progressive differentiation was responsible for changes in exsolutions textures. These are observable in titanomagnetite from the upper part of the U1 (Figure 20b).
At T1 (>1000 °C), titanomagnetite crystallized from a more oxidized magma. The abundance of Sb5+ and As5+ in the magma relative to trivalent species inhibits (or limits) the incorporation of these elements into the spinel structure. The Al enrichment relative to Zn through magma differentiation allows for the maintenance of concentrations in the residual liquid that are sufficient for the formation of Al-undepleted titanomagnetite margins (T2).
Just following the textural maturation of titanomagnetite grains at T2, the high-fO2 conditions of the system allowed for the oxidation of the ulvöspinel component at very high temperatures. This oxy-exsolution process, starting at T3 (>860 °C), is responsible for the development of ilmenite lamellae (Ilmenite-E1) along either all sets of {111} lattice planes of the spinel structure (trellis-type lamellae), or along a single set (sandwich-type lamellae). Aluminum and Zn being among the most incompatible elements with ilmenite during the oxy-exsolution (D <0.1; this study), the ulvöspinel removal in the direct vicinity of Ilmenite-E1 led to the supersaturation of these elements and the exsolution of small granules of low-Ti Al-spinels along the lamellae (imposed Al-spinels). The elemental zonation of the original solid solution results in the preferential development of Zn-depleted Al-spinels (hercynite) at the margins of titanomagnetite.
As ilmenite grows further through diffusion (T4), Al-spinel strings are progressively incorporated into the lamellae. At the same time, the high degree of diffusion near the grain boundaries leads to the formation of external exsolutions of Ilmenite-E1. The migration of ilmenite towards the grain boundaries is suspected to be responsible for the coarsening of adjacent grains of primary ilmenite (i.e., which crystallized from the magma) and the imposition of relatively coarse exsolutions of hercynite, that were subsequently oxidized to form intergrowths of hercynite-magnetite-corundum (HCMs).
At T5 (<860 °C), low-Ti Al-spinels started to exsolve as small granules or thin discs in areas far from the ilmenite lamellae (where the degree of ulvöspinel removal was slower) as the temperature dropped to the magnetite-(hercynite-gahnite) solvus. This generation of non-imposed Al-spinels composes the vast majority of Al-rich exsolutions in titanomagnetite from the upper part of the U1.

6. Conclusions

This study was conducted in order to develop a model for exsolutions in titanomagnetite of the LDC that integrates the concepts of magma replenishment and differentiation. It provides the first evidence and interpretations based on in situ LA-ICP-MS analyses and quantitative measurements of titanomagnetite modal composition. The general conclusions to the study are:
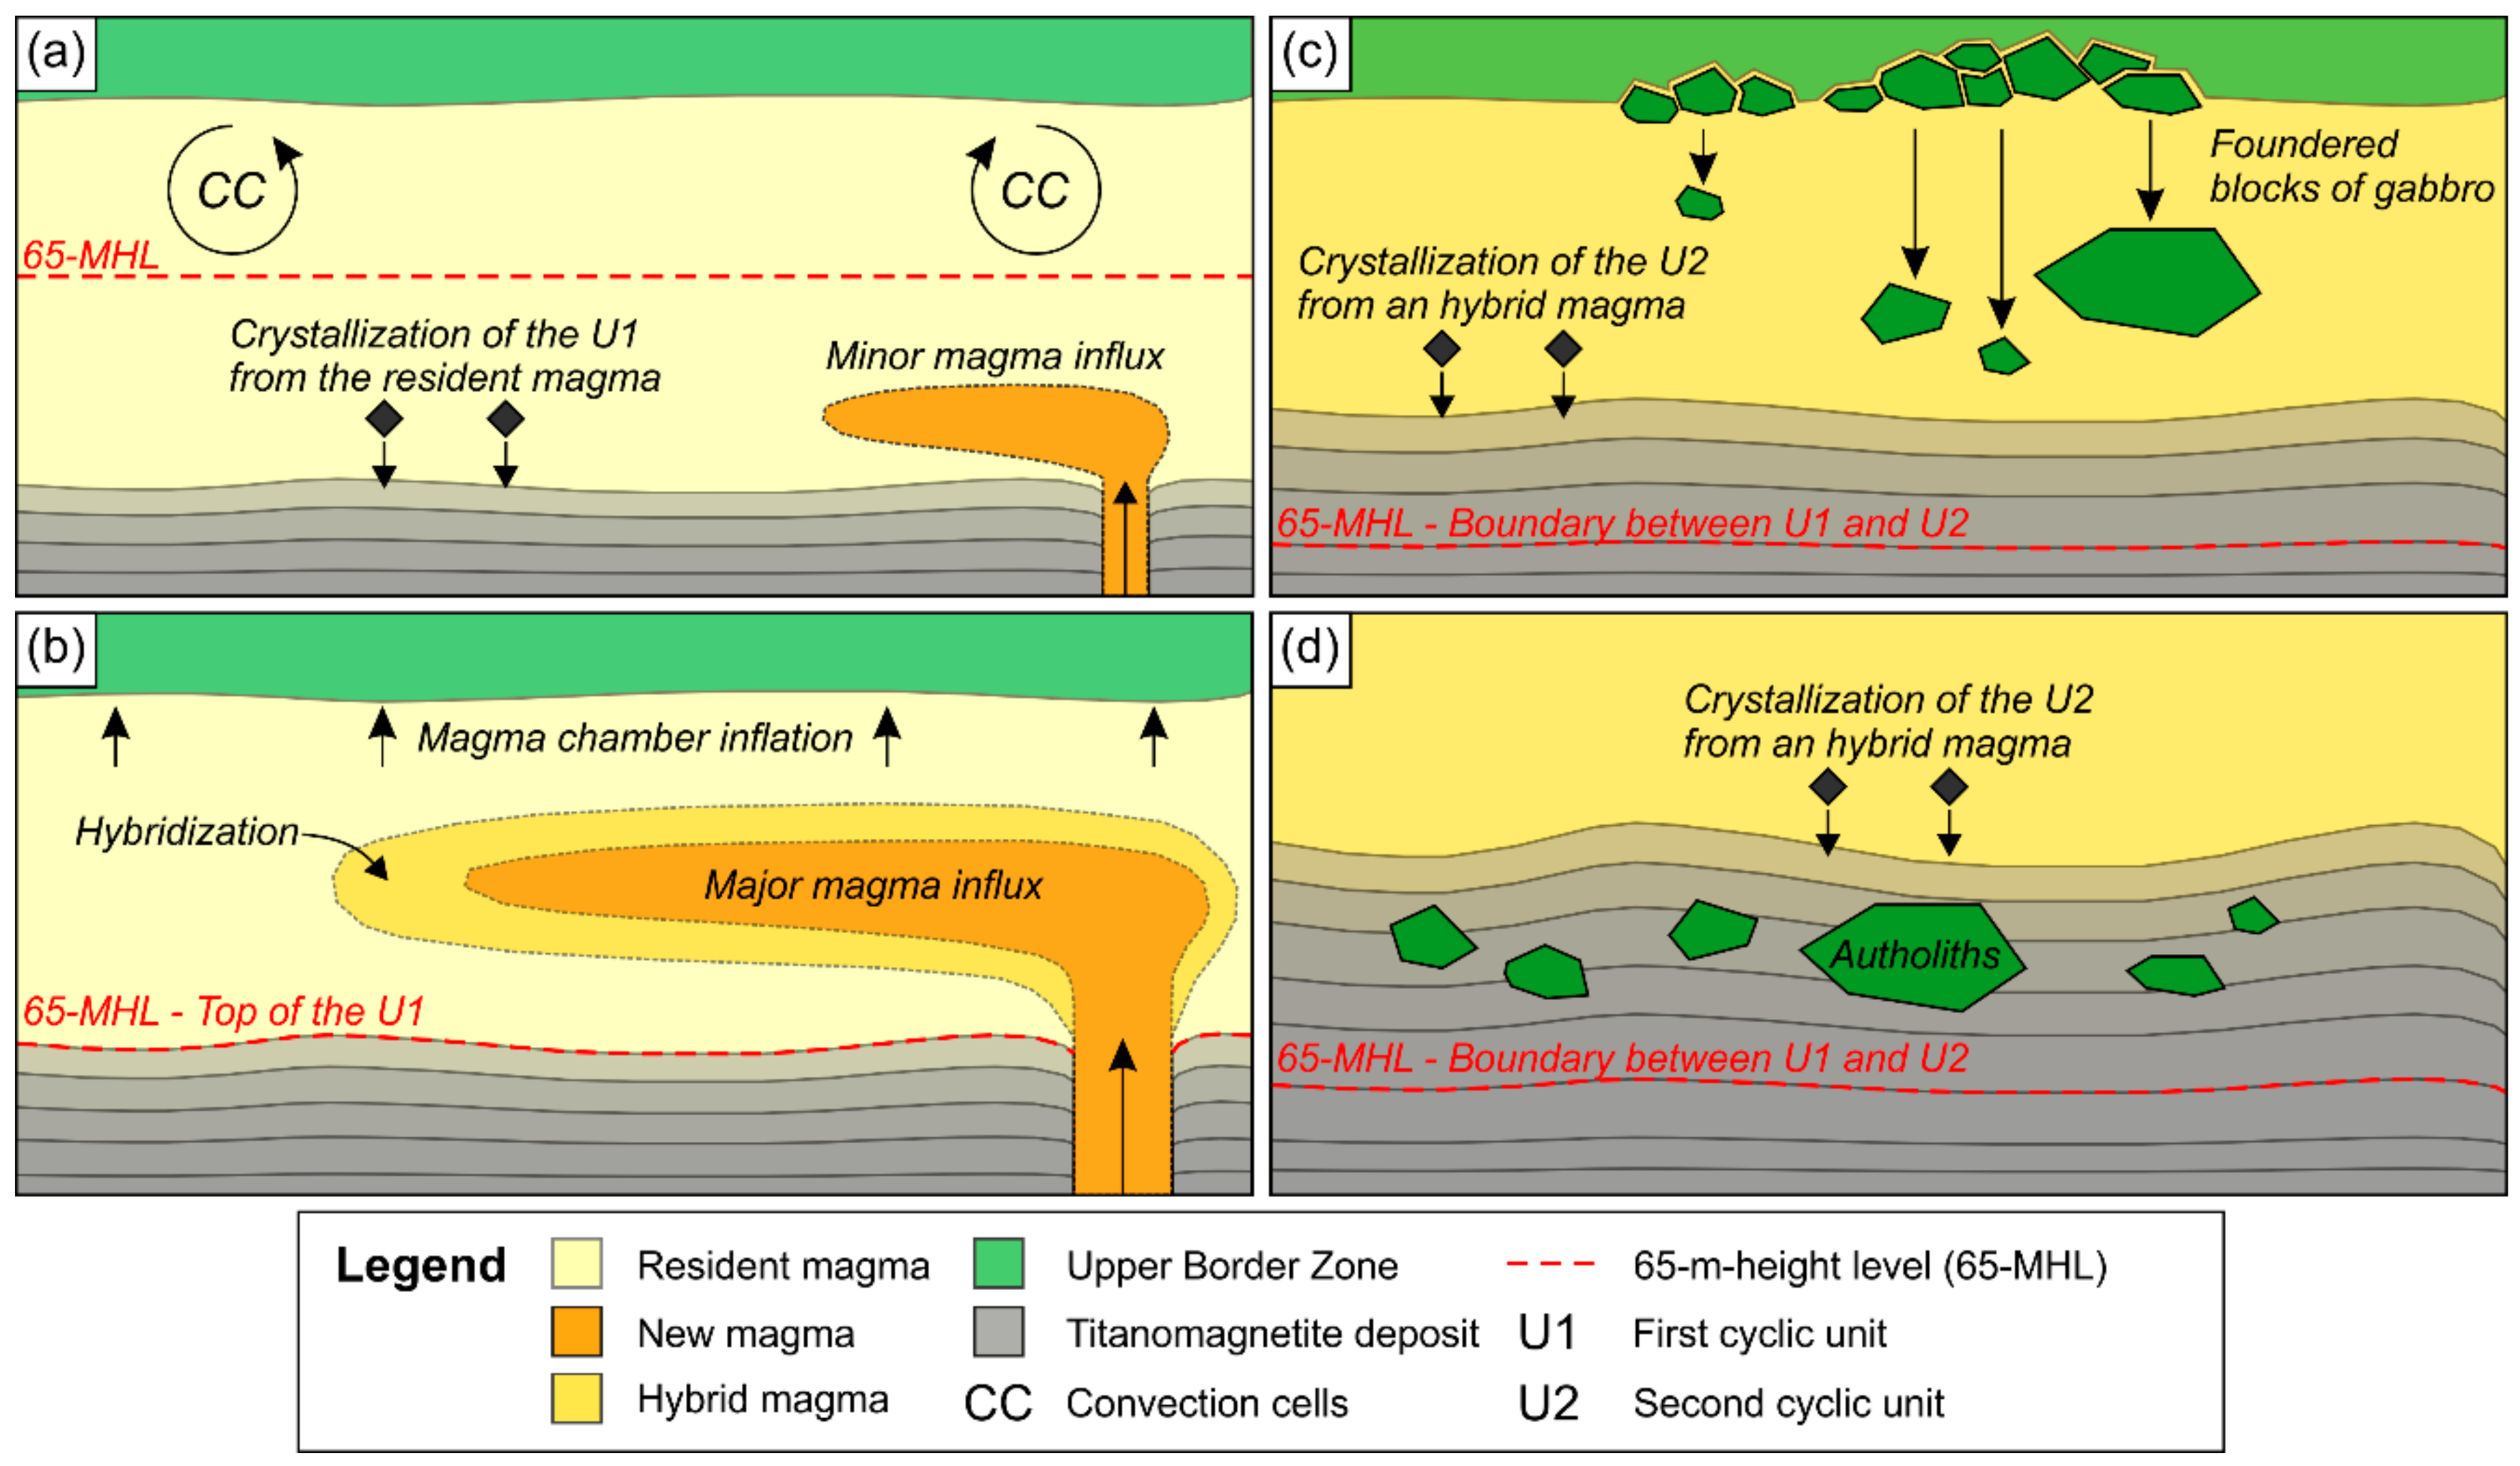
  • Stratigraphic reversals in titanomagnetite compositional trends (Cr, Mg, Co, Ti, and Si) suggest that the Layered Series is formed by successive magma injections, including at least two major events, that allow the studied section to be divided into two cyclic units, the U1 and U2. The presence of an autolith-rich horizon in the lower part of the U2 is indicative of an important collapse event of the magma chamber’s roof. The roof’s instability could have been caused by the inflation of the chamber following the major magma injection that gave rise to the U2.
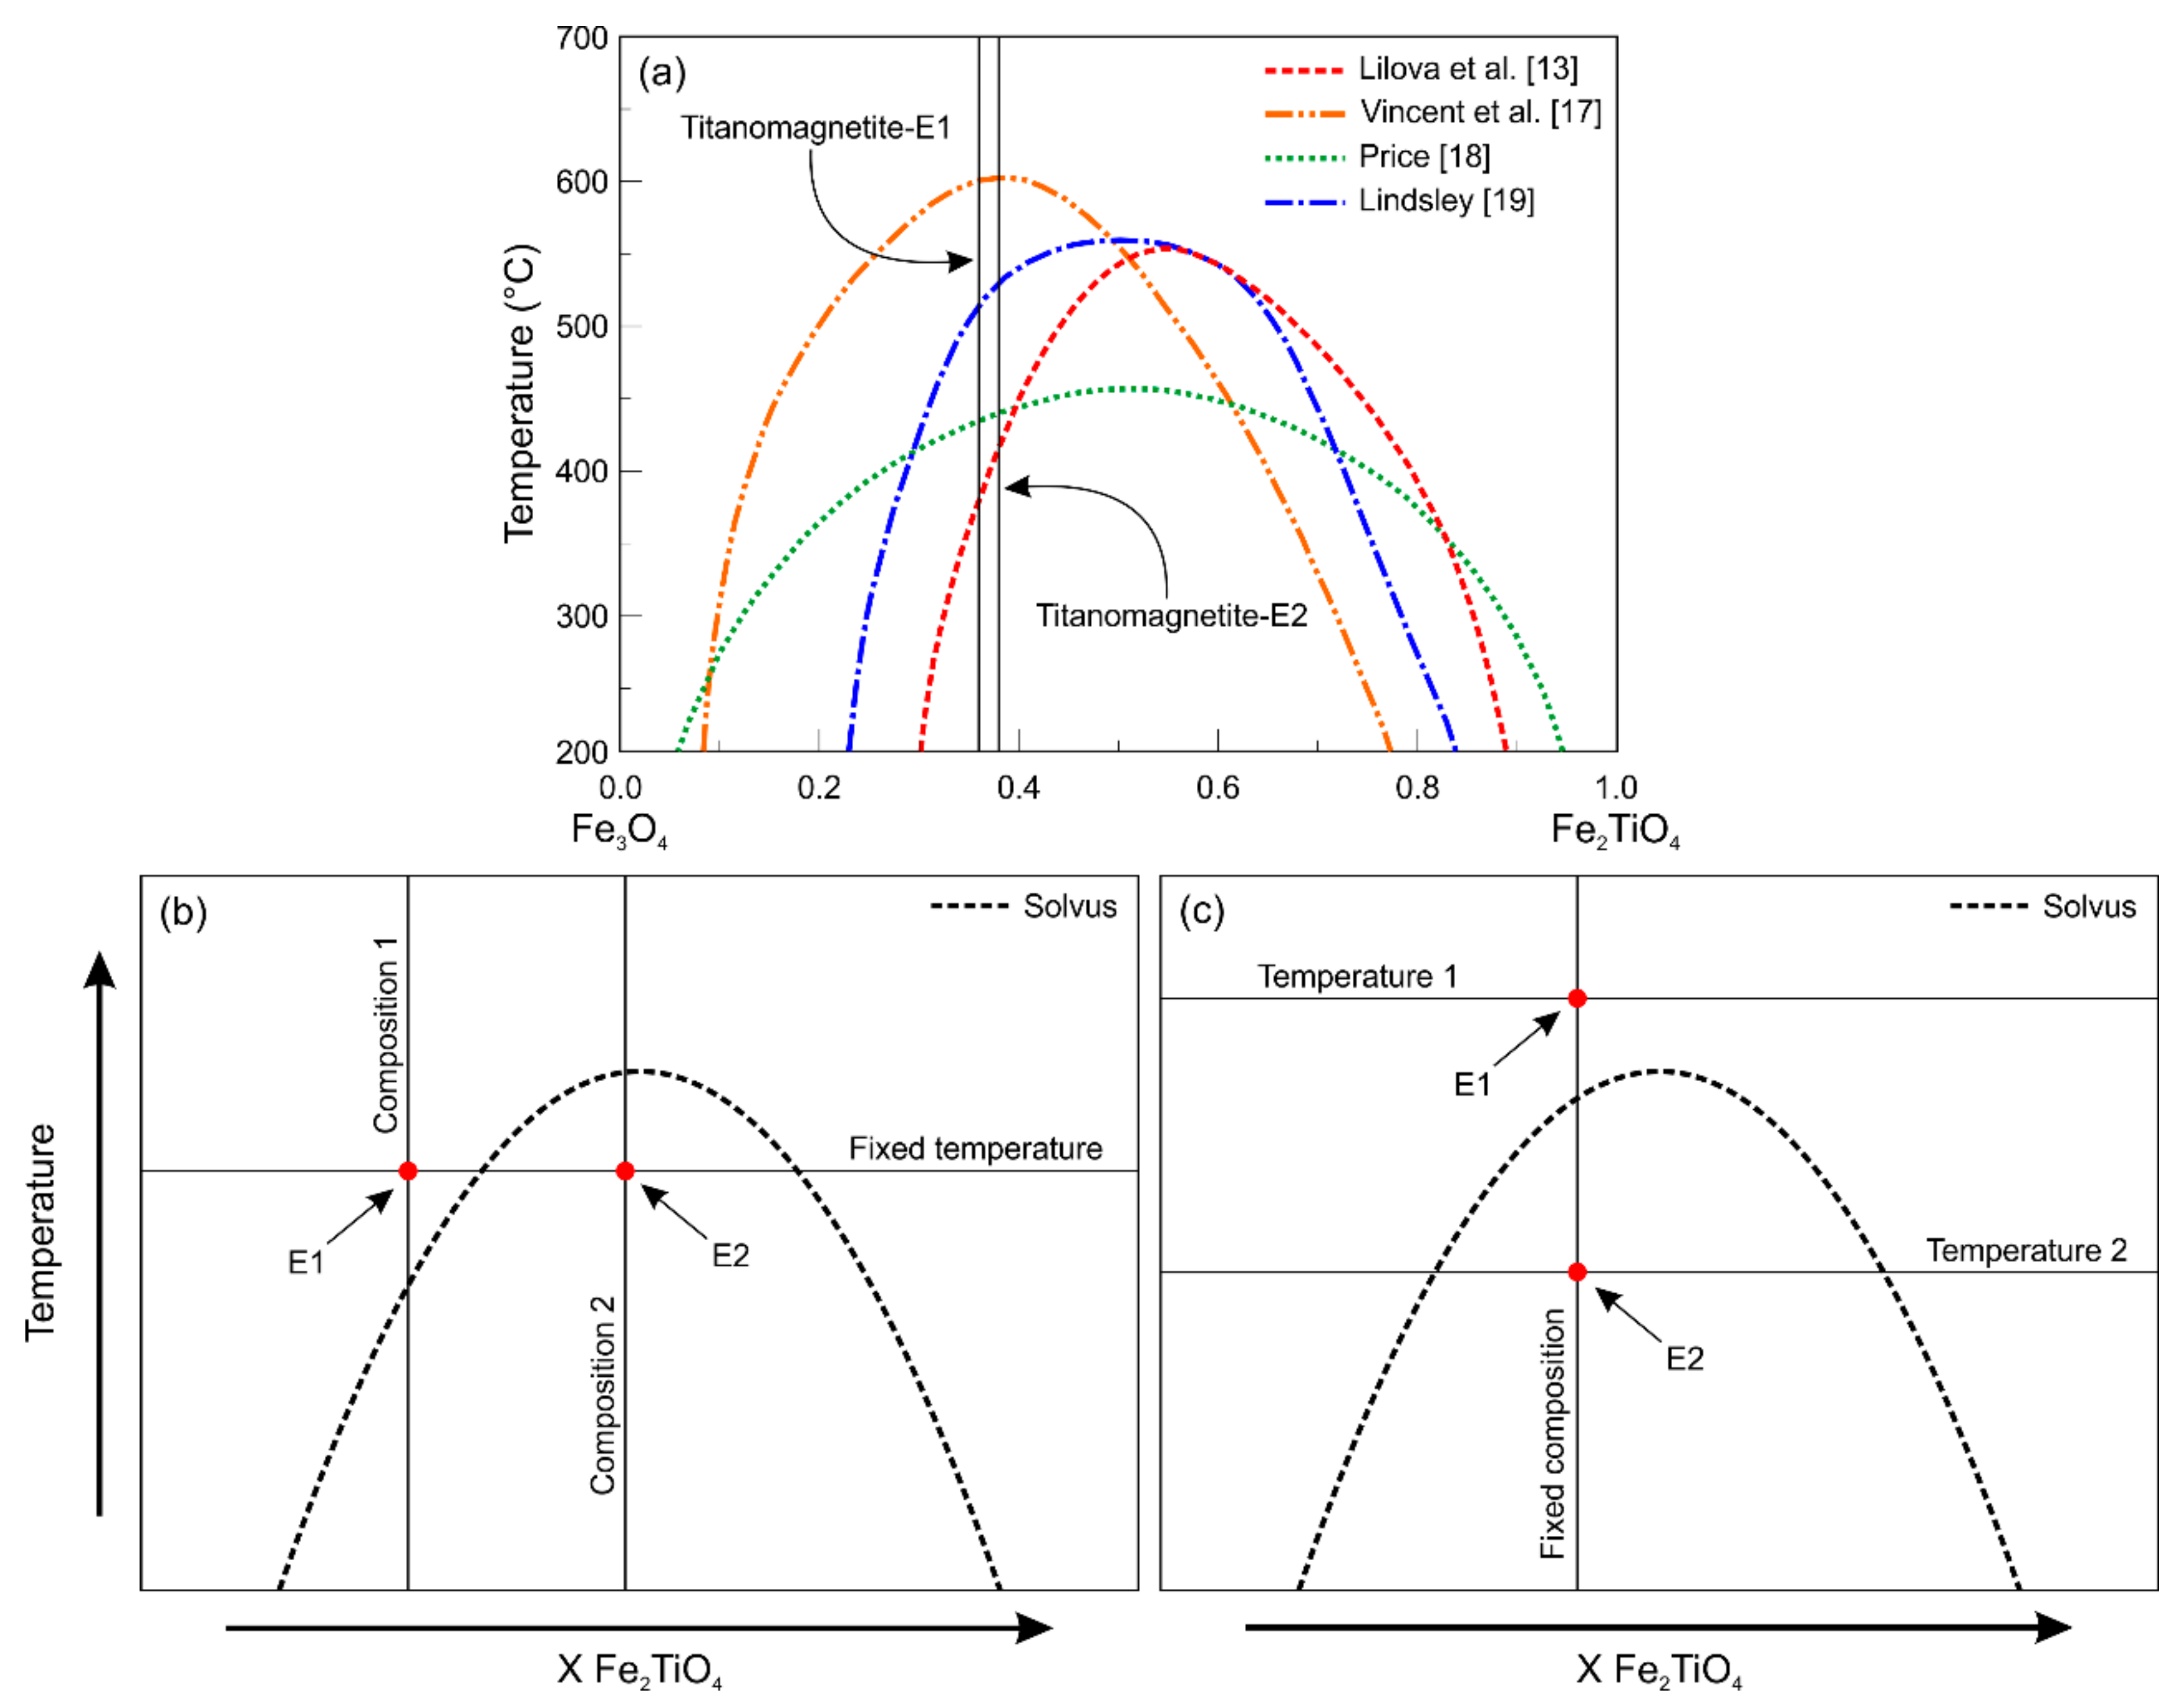
  • Two major types of ilmenite exsolution (E1 and E2) have been found in titanomagnetite from the Layered Series. The bulk of Ilmenite-E1 is thought to have been formed by oxy-exsolution at temperatures above the magnetite-ulvöspinel solvus, whereas Ilmenite-E2 was produced by the sub-solvus oxidation of pre-existing ulvöspinel exsolutions. Increasing diffusion–migration of ilmenite from the boundaries to the core of titanomagnetite resulted in a wide variety of exsolution textures. These textures are much more pronounced for Ilmenite-E2.
  • The independent formation of Ilmenite-E1 and -E2 in titanomagnetite of the LDC involves two discrete temperature windows of oxidation. By using the Sb and As concentrations in titanomagnetite as a proxy for fO2 conditions during the crystallization, we propose that the general upward transition from Ilmenite-E2 to -E1 in both cyclic units is the result of an increase in fO2 with magma differentiation.
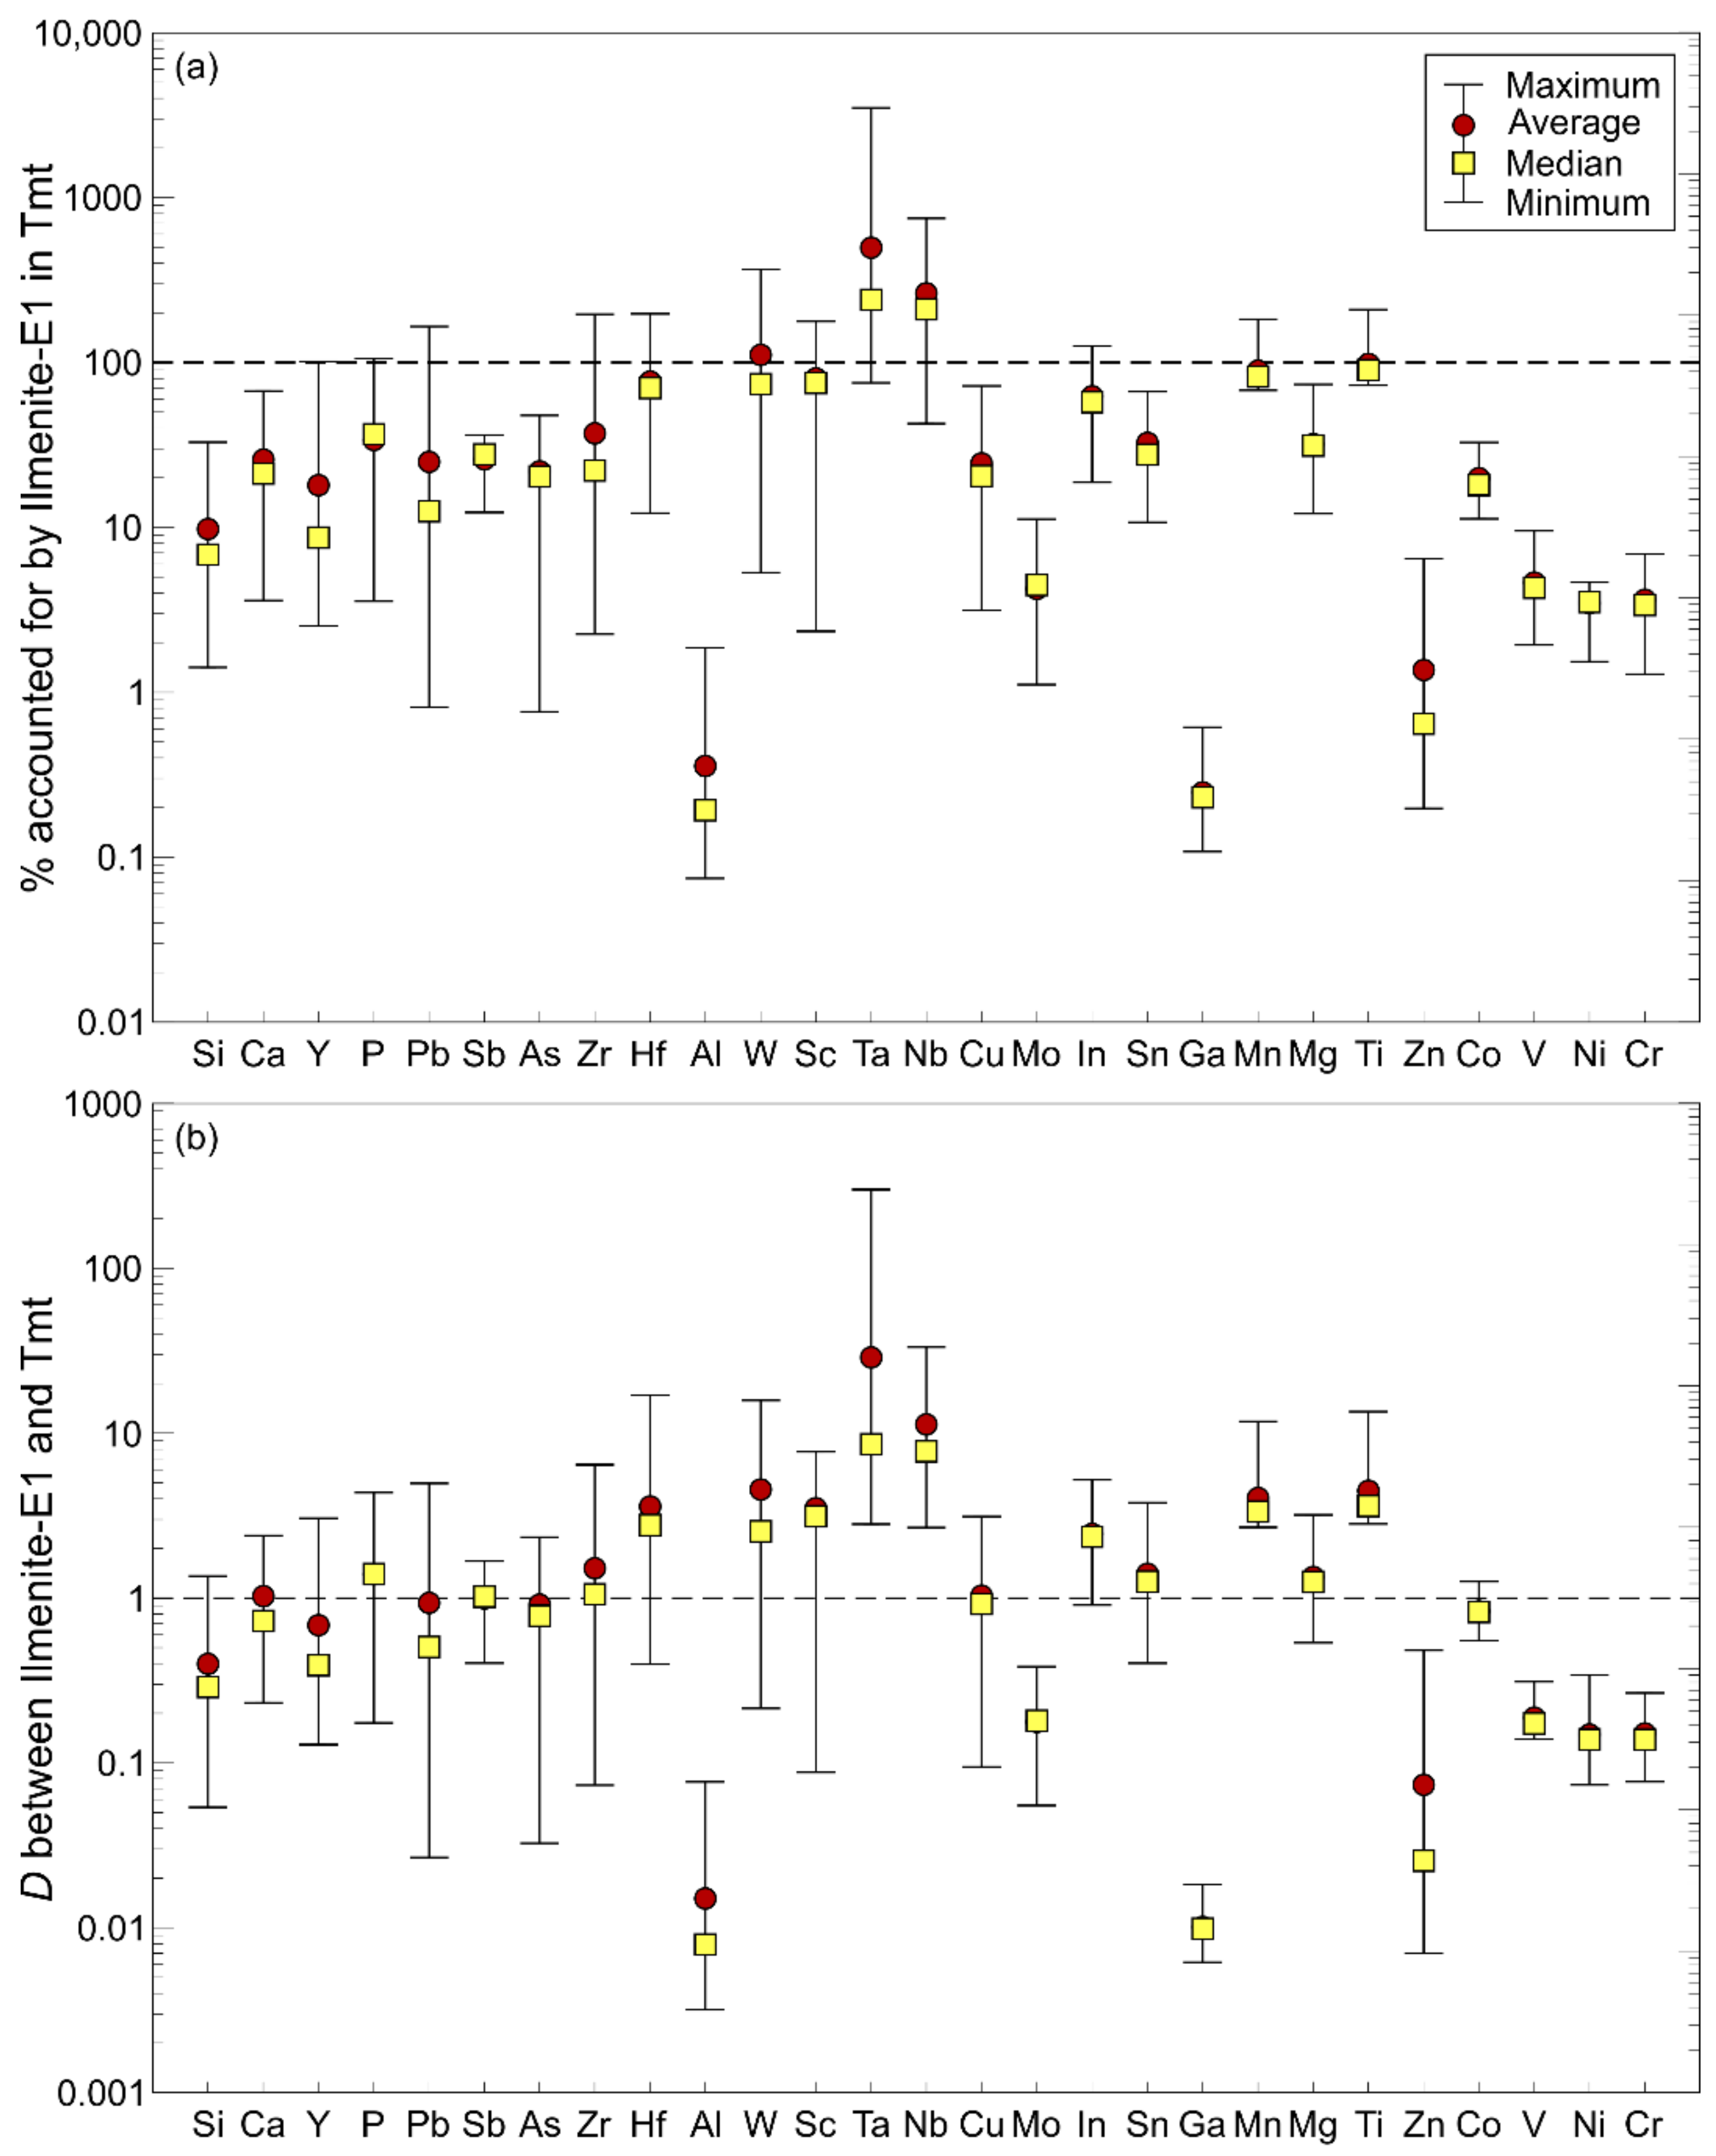
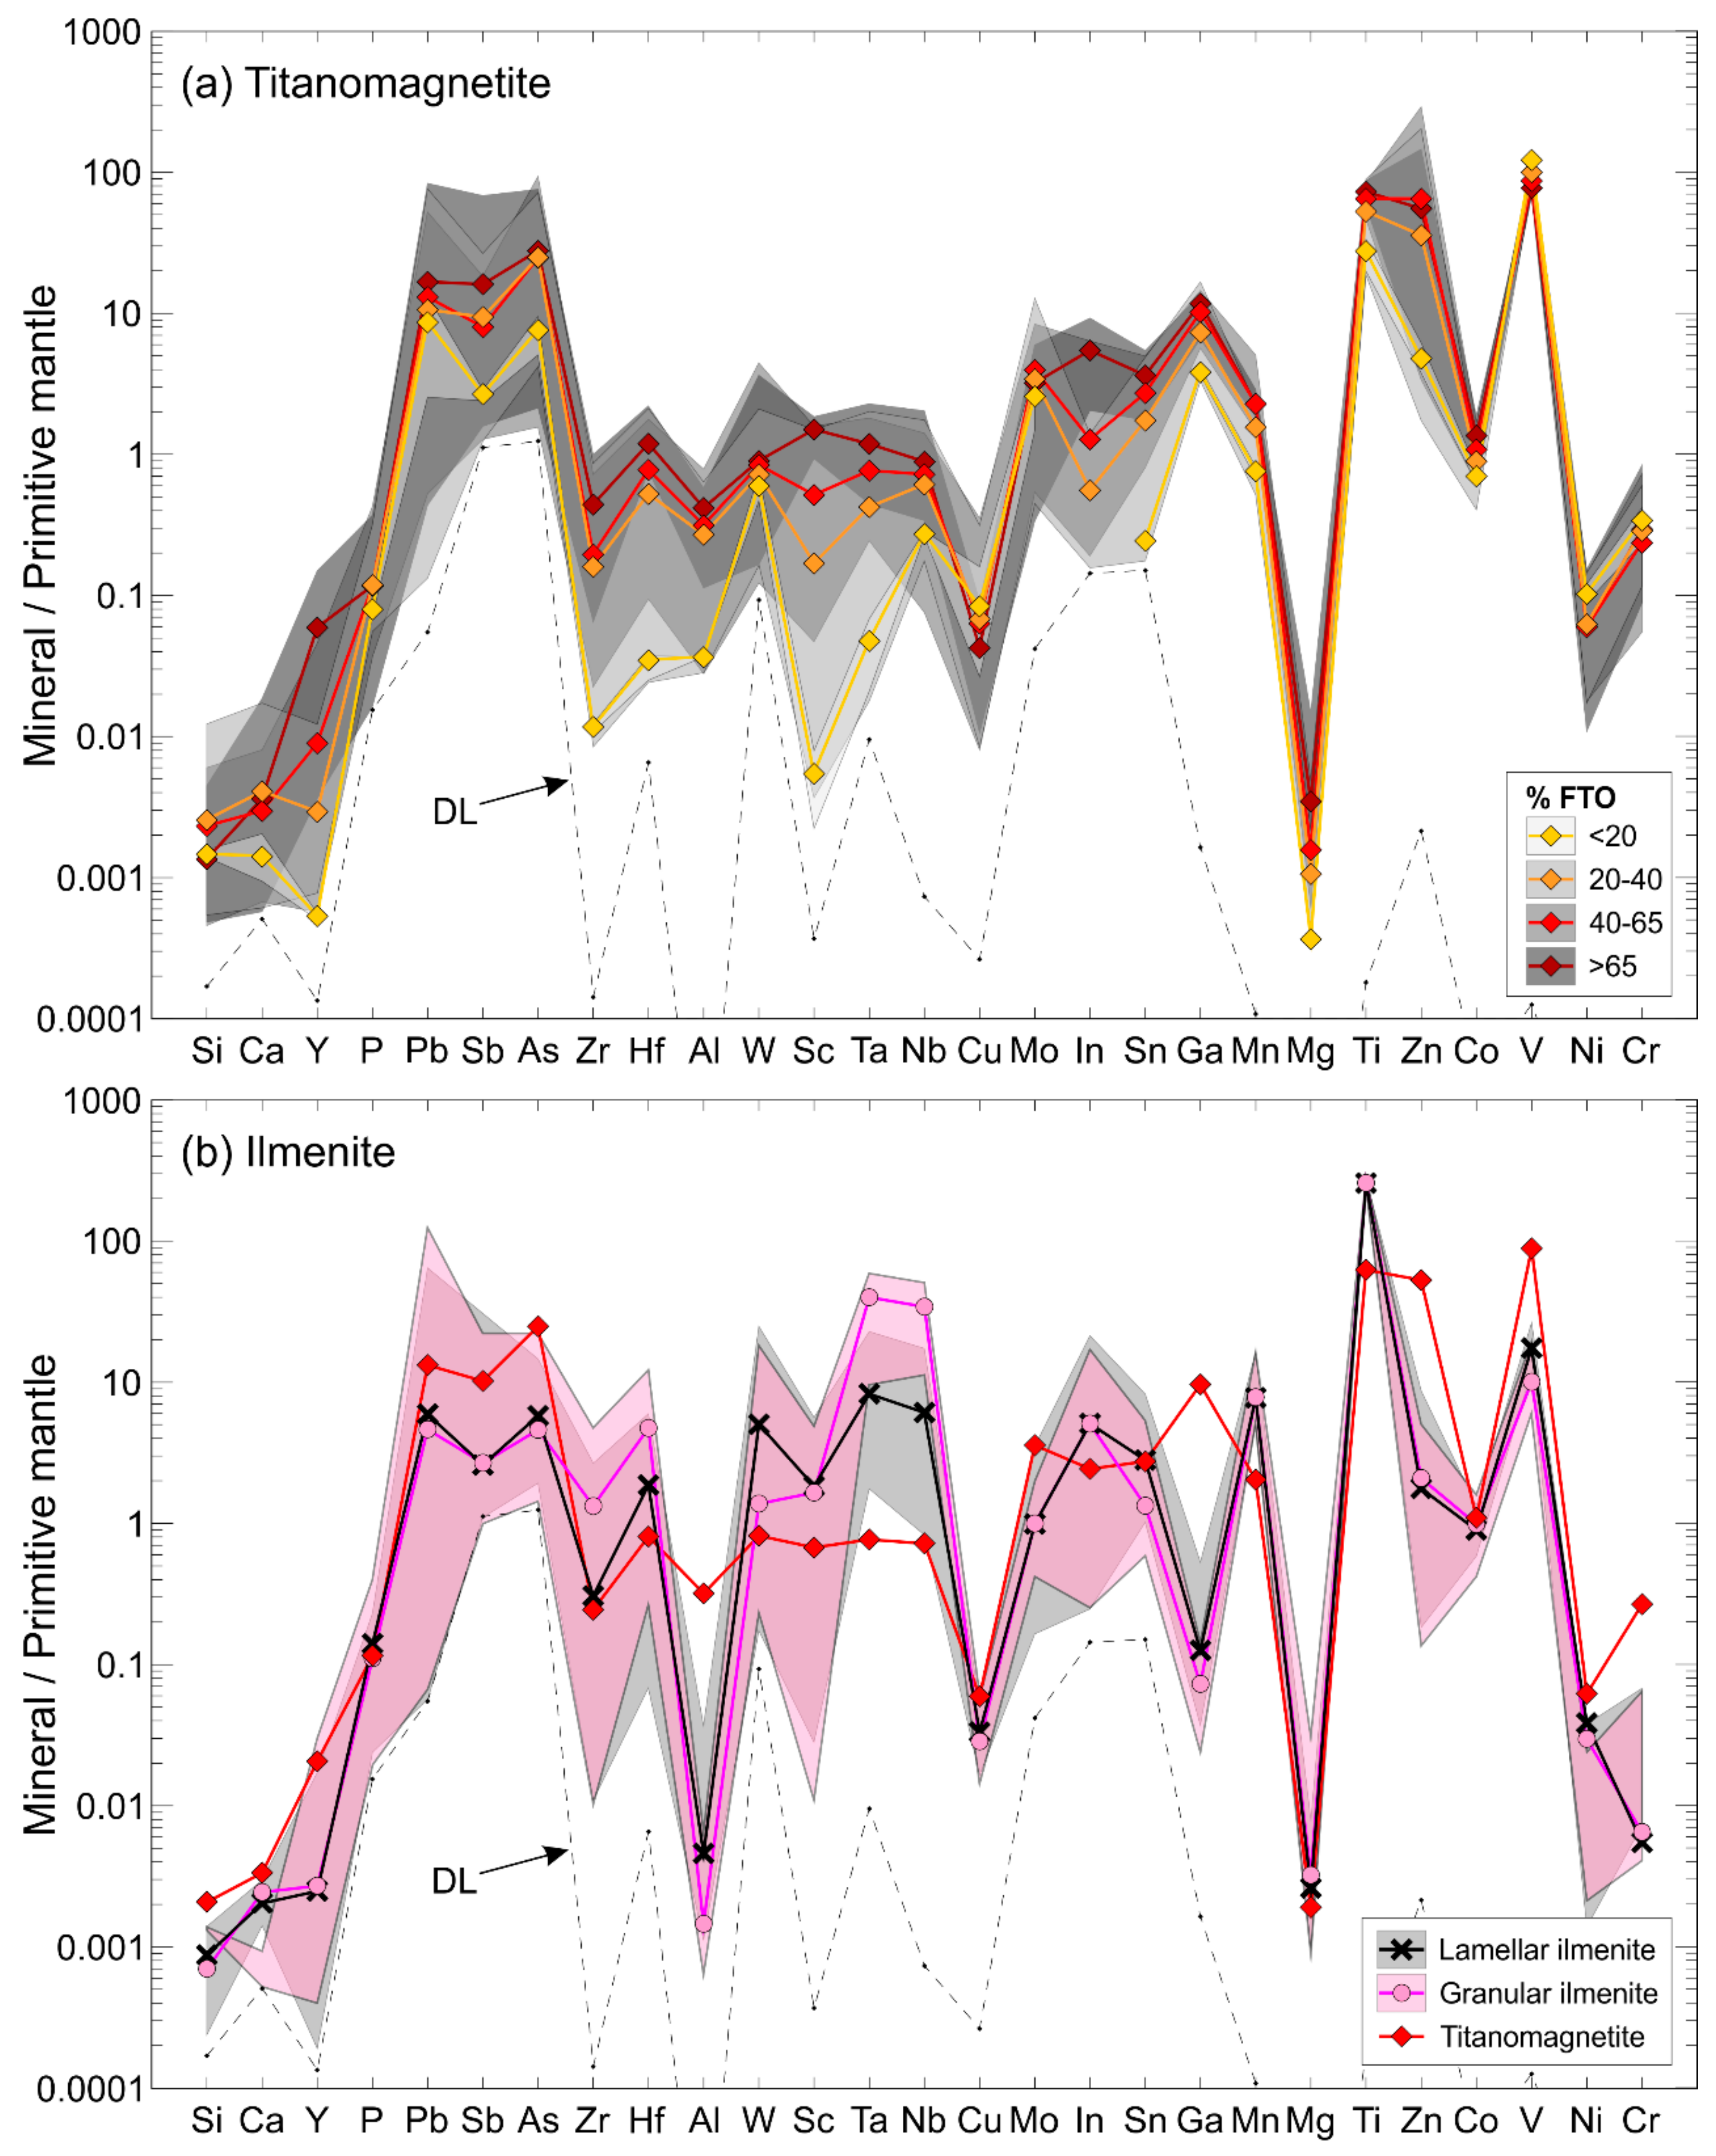
  • Our mass-balance calculations indicate that ilmenite exsolutions account for more than 50% of the Hf, W, Sc, Ta, Nb, In, Mn, and Ti budget of the titanomagnetite, whereas the magnetite matrix (plus small amounts of Al-spinels ± corundum) control the remaining trace elements with more than 90% of the Si, Al, Mo, Ga, Zn, V, Ni, and Cr budget. Further calculations allowed us to estimate that the Al-spinels alone account for ~86% and 76% of the Al and Zn budget, respectively.
  • Our estimation of the solid-solid partition coefficients for trace elements between Ilmenite-E1 and its magnetite host ( D x Ilm / Mag ) suggests the following order of compatibility with the ilmenite structure during the oxy-exsolution process: Ta, Nb, Ti, Mn, Sc, Hf, W, In, P, Sn, Mg, Zr, Sb, Cu, Co, As, Ca, Pb, Y, Si, Mo, V, Ni, Cr, Zn, Ga, and Al. The elements from Ta to Sb in this list are compatible with ilmenite ( D x Ilm / Mag >1), whereas the remaining elements enter more easily into the spinel host’s structure ( D x Ilm / Mag <1).
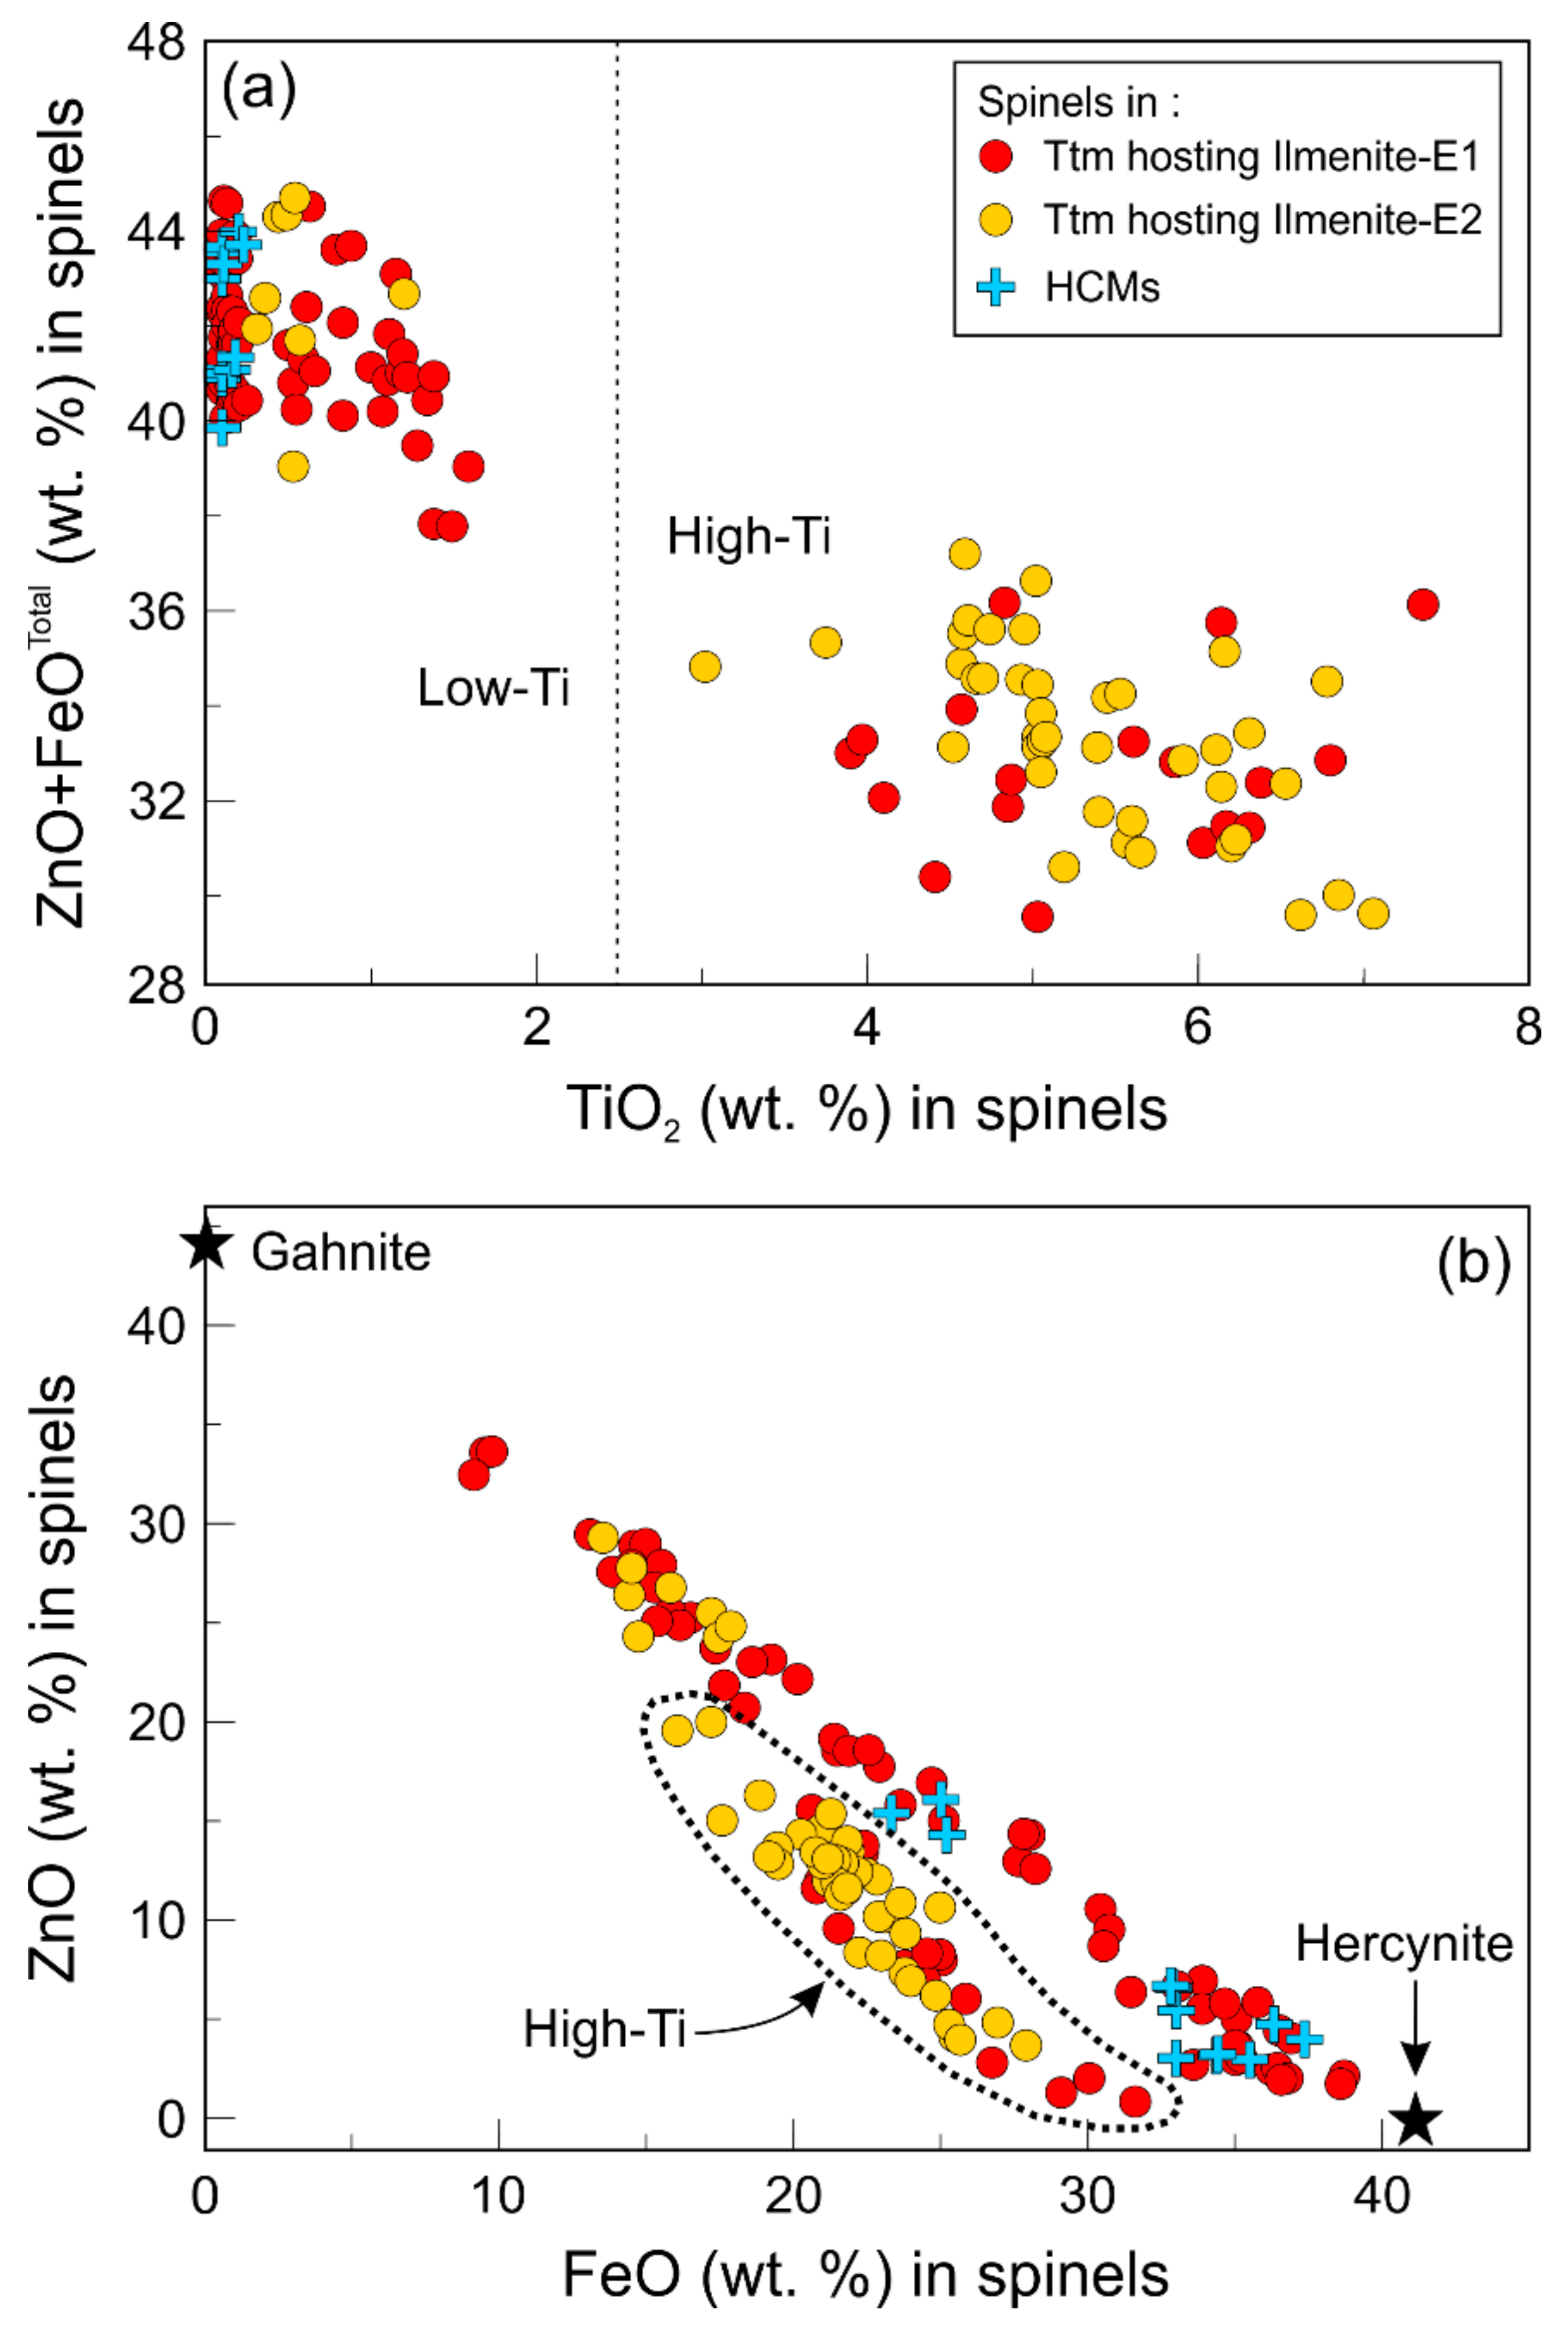
  • Aluminous spinel exsolutions in titanomagnetite of the LDC range from hercynite to gahnite in composition with 2 to 74 mol. % ZnAl2O4 in solid solution. Their formation can be ascribed to the following mechanisms: (a) Al-spinel exsolutions result from a local surplus of Al and Zn due to the rapid degree of ulvöspinel removal during the oxy-exsolution process (imposed Al-spinels); (b) Al-spinels are true exsolutions resulting from a decrease in the solubility of the (FeZn)Al2O4 components with decreasing temperature (non-imposed Al-spinels).
  • Crosscutting relationships between Al-spinel and ilmenite exsolutions suggest that Al-spinels can exsolve at temperature ranges from high above to much below the magnetite-ulvöspinel solvus. The continuous exsolution of Al-spinels results from a combination of a decrease in temperature (normal cooling) and the progressive compositional changes of the solid solution. High- and low-Ti Al-spinels occurring in titanomagnetite of the LDC are interpreted as two distinct chronological populations that respectively occur before and after the removal of ulvöspinel.
  • Corundum in titanomagnetite occurs as complex intergrowths with hercynite and magnetite (HCM intergrowths). Its origin can be ascribed to the oxidation of hercynite as expressed in the equilibrium 6 FeAl2O4 + O2 = 2 Fe3O4 + 6 Al2O3. The preferential exsolution of the former Zn-poor hercynite from the solid solution margins is thought to result from Al enrichment relative to Zn through magma differentiation. In this case, the sudden disappearance of HCMs in the U2 is most likely due to reservoir replenishment with fresh, more primitive magma.
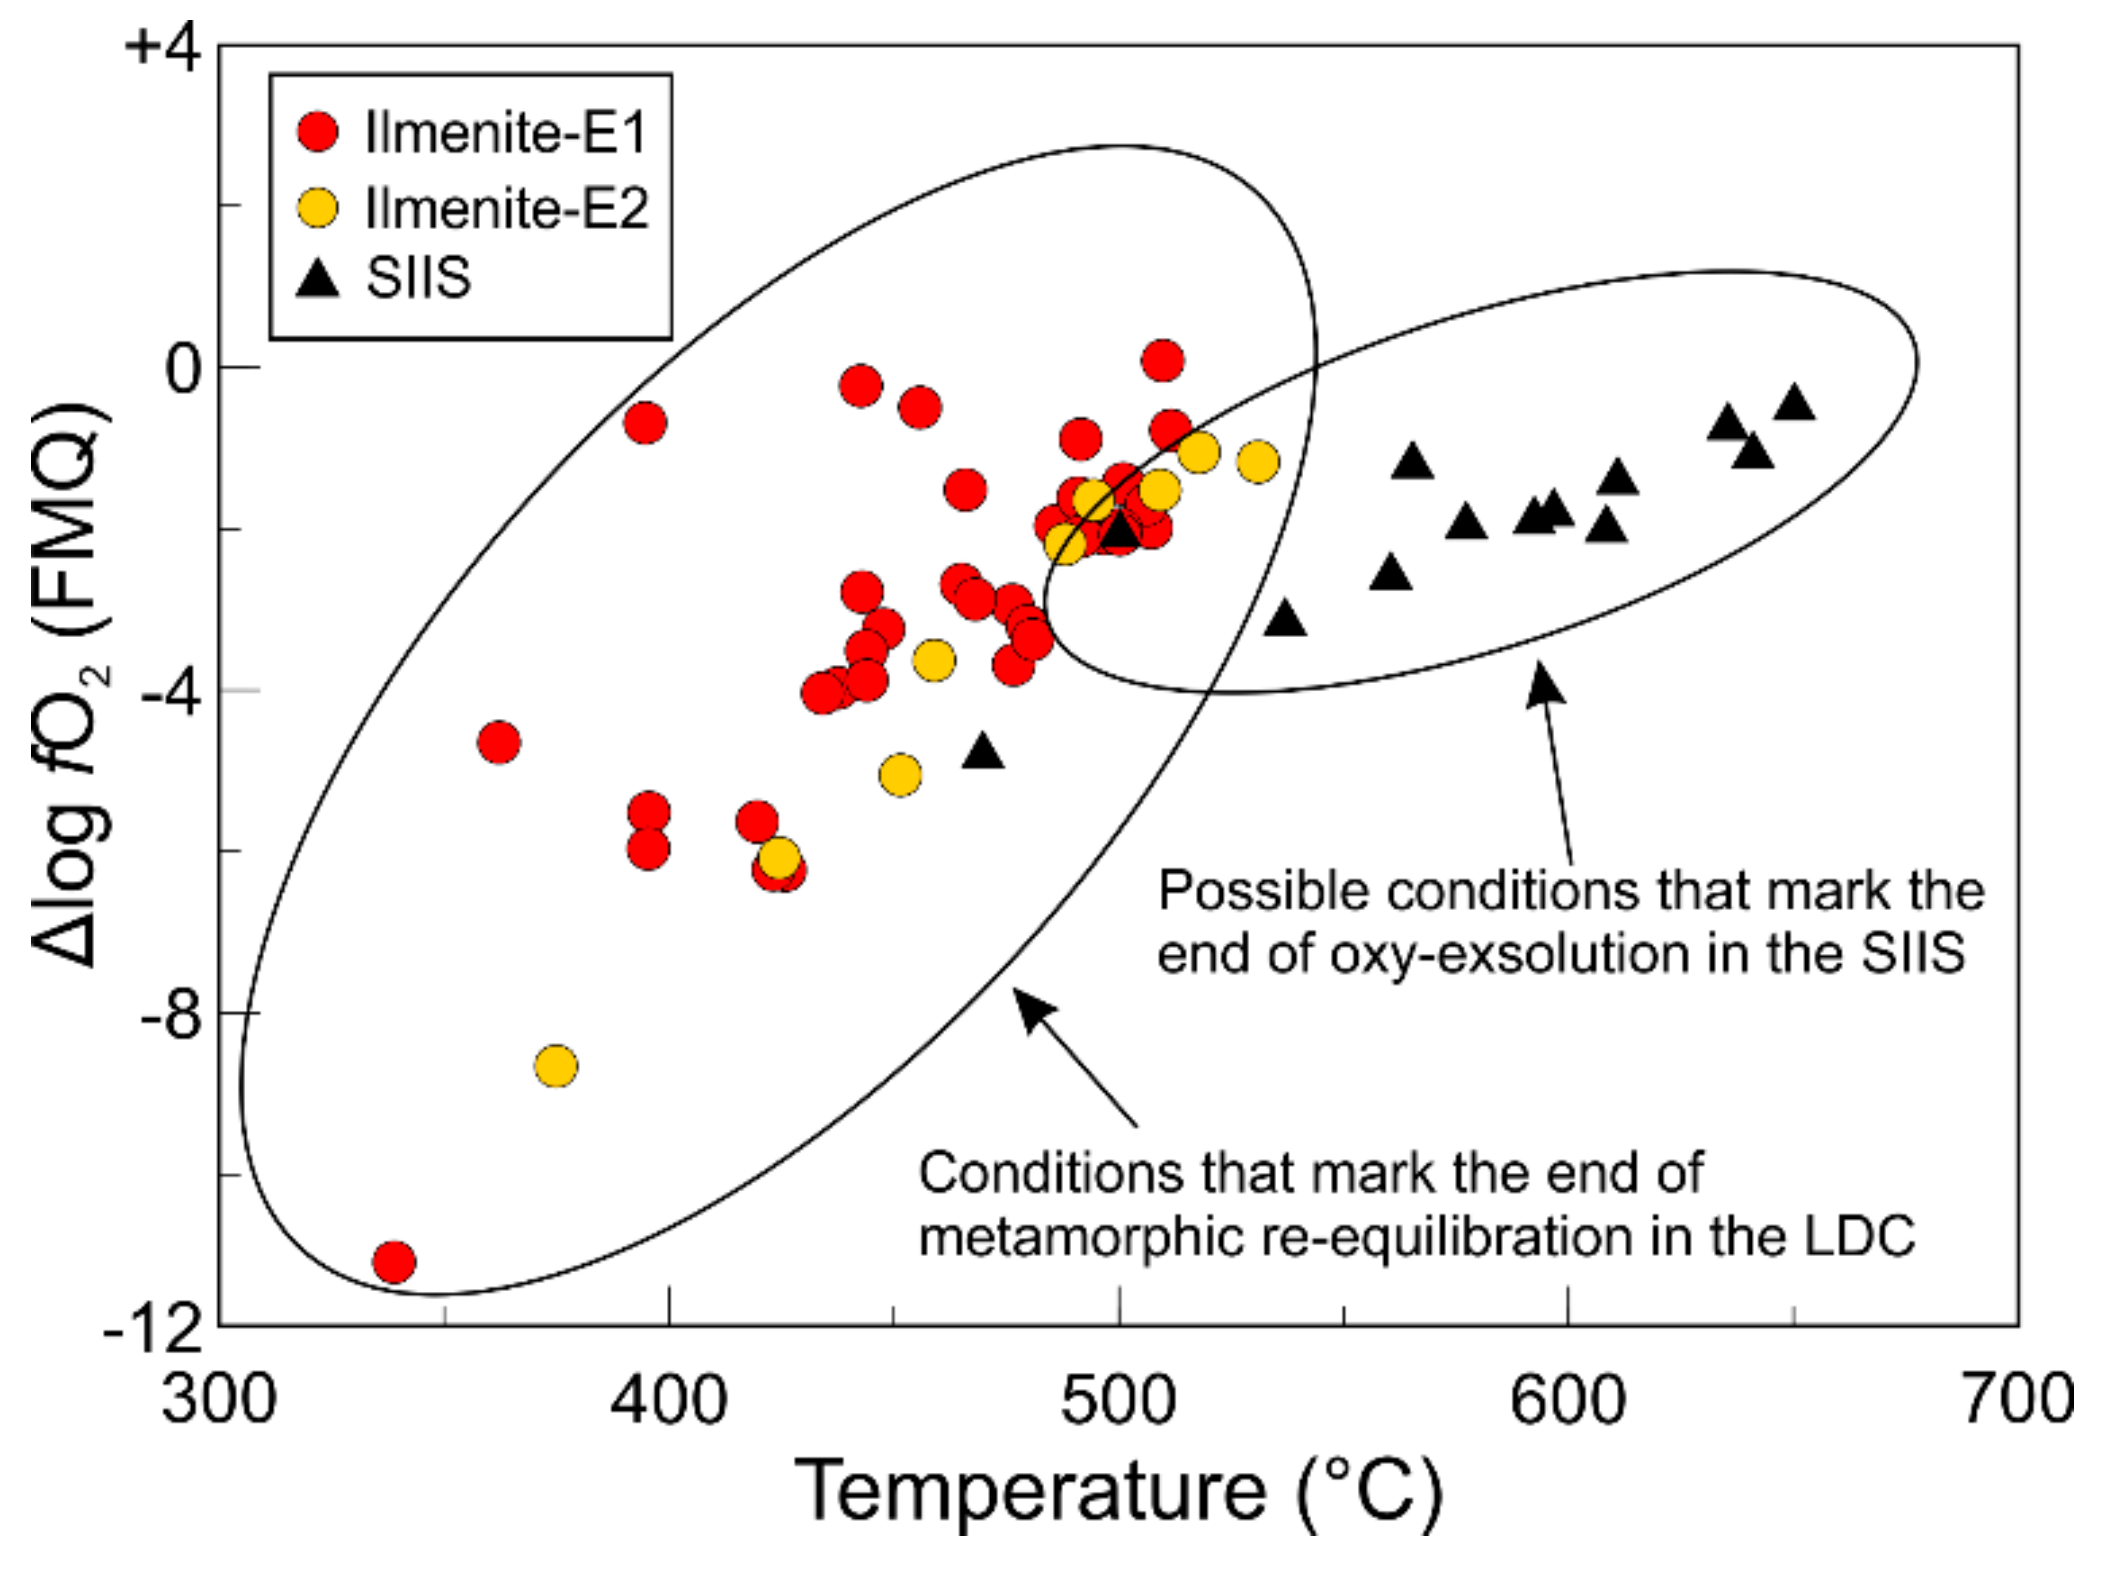
  • The decrease in the concentration of numerous trace elements in titanomagnetite with the increase of FTO proportion in rocks is thought to be the result of post-cumulus re-equilibration with the surrounding silicates. In the absence of pyroxene in most protoliths, variations of Ni, Co, and Mg suggest a re-equilibration of metamorphic origin. Considering that oxy-exsolutions of ilmenite predate the bulk of Al-spinel exsolutions (T~ >800 °C), most of the equilibrium temperatures that were calculated between Ilmenite-E1 and its magnetite host are actually thought to be more representative of metamorphic re-equilibration at greenschist facies.

Supplementary Materials

The following are available online at https://www.mdpi.com/2075-163X/8/11/476/s1. Table S1a: Compositions of magnetite matrices determined by WDS, Table S1b: Compositions of ilmenite determined by WDS, Table S2: Compositions of spinel exsolutions determined by EDS, Table S3a: Trace element compositions of titanomagnetite determined by LA-ICP-MS, Table S3b: Trace element compositions of ilmenite determined by LA-ICP-MS, Table S4: Composition of reference materials used for calibration and monitoring of the LA-ICP-MS data, Table S5a: Modal composition of magnetite-ilmenite assemblages measured from processed backscattered images, Table S5b: Modal proportion of corundum and magnetite in the HCMs measured from processed backscattered images, Table S6: Temperature and oxygen fugacity conditions of equilibrium between magnetite and ilmenite, Table S7: Mass balance calculations: proportion of trace elements accounted for by Ilmenite-E1 in titanomagnetite, Table S8: Empirical solid–solid partition coefficients for trace elements between Ilmenite-E1 and an Al-Zn-rich magnetite solid solution. References [104,105,106,107] are cited in Table S6.

Author Contributions

Conceptualization, J.-P.A., P.P., and R.G.; methodology, J.-P.A., P.P., and R.G.; validation, P.P. and S.-J.B.; formal analysis, J.-P.A.; investigation, J.-P.A.; writing (original draft preparation), J.-P.A.; writing (review and editing), J.-P.A., P.P., S.-J.B., and C.D.; supervision, P.P. and S.-J.B.; project administration, P.P. and S.-J.B.; funding acquisition, J.-P.A.

Funding

This research was funded by a Mitacs Accelerate fellowship awarded to J.-P.A. as part of his PhD, grant #IT07474, and by in-kind contributions from IOS Services Géoscientifiques Inc.

Acknowledgments

Dany Savard and Audrey Lavoie (LabMaTer, Université du Québec à Chicoutimi) are thanked for their outstanding help and assistance on the LA-ICP-MS analyses and data reduction. Jonathan Tremblay and Valérie Lecompte (IOS Services Géoscientifiques Inc.) are gratefully acknowledged for their technical support and advice on the SEM. Alexandre Néron (IOS) is thanked for the ARTSection software’s development and modifications, as well as for his helpful advice on processing the backscattered electron images. The three anonymous reviewers are thanked for their constructive reviews that substantially improved this paper. Anker He and Jingjing Yang are thanked for their careful editorial handling.

Conflicts of Interest

IOS Services Géoscientifiques Inc. (a consulting company) participated in the conceptualization of the PhD project of J.-P.A. However, IOS had no role in the collection, analyses, or interpretation of the data; in the writing of the manuscript, or in the decision to publish the results.

References

  1. Allard, G.O. Géologie du Quart Nord-Ouest du Canton de Rinfret; Report for the Ministère des Richesses naturelles. RP-567; MERN: Québec, QC, Canada, 1967. (In French) [Google Scholar]
  2. Allard, G.O. Some speculations regarding the lower hidden zone of the Doré Lake Complex and its potential mineral resources. Geol. Soc. Am. Bull. 1973, 84, 717–724. [Google Scholar]
  3. Allard, G.O. Doré Lake Complex and Its Importance to Chibougamau Geology and Metallogeny; Report for the Ministère des Richesses Naturelles. DP-368; MERN: Québec, QC, Canada, 1976. (In French) [Google Scholar]
  4. Daigneault, R.; Allard, G.O. Le Complexe du Lac Doré et son Environnement Géologique (Région de Chibougamau-Sous-Province de L’Abitibi); Report for the Ministère de L’Énergie, des Mines et des Ressources; MERN: Québec, QC, Canada, 1990. (In French) [Google Scholar]
  5. Polat, A.; Frei, R.; Longstaffe, F.J.; Woods, R. Petrogenetic and geodynamic origin of the Neoarchean Doré Lake Complex, Abitibi subprovince, Superior Province, Canada. Int. J. Earth Sci. 2017, 107, 811–843. [Google Scholar] [CrossRef]
  6. Edwards, A.B. Textures of the Ore Minerals and Their Significance; Australasian Institute of Mining and Metallurgy: Melbourne, Australia, 1947. [Google Scholar]
  7. Ramdohr, P. The Ore Minerals and Their Intergrowths (International Series of Monographs on Earth Sciences); Pergamon Press: Oxford, UK, 1969. [Google Scholar]
  8. Basta, E.Z. Natural and synthetic titanomagnetites. N. Jahrb. Mineral. Abh. 1960, 94, 1017–1048. [Google Scholar]
  9. Webster, A.H.; Bright, N.F. The system iron-titanium-oxygen at 1200 °C and oxygen partial pressures between 1 Atm. and 2 × 10⁻¹⁴ Atm. J. Am. Ceram. Soc. 1961, 44, 110–116. [Google Scholar] [CrossRef]
  10. Taylor, R.W. An Experimental Study of the System FeO-Fe2O3-TiO2 and Its Bearing on Mineralogical Problems. Ph.D. Thesis, Pennsylvania State University, State College, PA, USA, 1961. [Google Scholar]
  11. Taylor, R.W. Phase equilibria in the system FeO-Fe2O3-TiO2 at 1300 °C. Am. Mineral. 1964, 49, 1016–1030. [Google Scholar]
  12. Lindsley, D.H. Investigations in the system FeO-Fe2O3-TiO2. Carnegie Inst. Wash. Yearb. 1962, 61, 100–106. [Google Scholar]
  13. Lilova, K.I.; Pearce, C.I.; Gorski, C.; Rosso, K.M.; Navrotsky, A. Thermodynamics of the magnetite-ulvöspinel (Fe3O4-Fe2TiO4) solid solution. Am. Mineral. 2012, 97, 1330–1338. [Google Scholar] [CrossRef]
  14. Vincent, E.A.; Phillips, R. Iron titanium minerals in layered gabbros of the Skaergaard intrusion, East Greenland. Geochim. Cosmochim. Acta 1954, 6, 1–26. [Google Scholar] [CrossRef]
  15. Von Gruenewaldt, G.V.; Klemm, D.D.; Henckel, J.; Dehm, R.M. Exsolution features in titanomagnetite from massive magnetite layers and their host rocks of the Upper Zone, Eastern Bushveld Complex. Econ. Geol. 1985, 80, 1049–1061. [Google Scholar] [CrossRef]
  16. Pang, K.-N.; Zhou, M.-F.; Lindsley, D.; Zhao, D.; Malpas, J. Origin of Fe-Ti oxide ores in mafic intrusions: Evidence from the Panzhihua intrusion, SW China. J. Petrol. 2008, 49, 295–313. [Google Scholar] [CrossRef]
  17. Vincent, E.A.; Wright, J.B.; Chavallier, R.; Mathieu, S. Heating experiments on some natural titaniferous magnetites. Mineral. Mag. 1957, 31, 624–655. [Google Scholar] [CrossRef]
  18. Price, G.D. Subsolidus phase relations in the titanomagnetite solid solution series. Am. Mineral. 1981, 66, 751–758. [Google Scholar]
  19. Lindsley, D.H. Some experiments pertaining to the magnetite-ulvöspinel miscibility gap. Am. Mineral. 1981, 66, 759–762. [Google Scholar]
  20. Vincent, E.A. Ulvöspinel in the Skaergaard intrusion, East Greenland. N. Jahrb. Mineral. Abh. 1960, 94, 992–1016. [Google Scholar]
  21. Willemse, J. The vanadiferous magnetic iron ore of the Bushveld Igneous Complex. Econ. Geol. 1969, Monogr. 4, 187–208. [Google Scholar]
  22. Speczik, S.; Wiszniewska, J.; Diedel, R. Minerals, exsolution features and geochemistry of Fe-Ti ores of the Suwalki District (Nort-East Poland). Miner. Depos. 1988, 23, 200–210. [Google Scholar] [CrossRef]
  23. Buddington, A.F.; Lindsley, D.H. Iron-titanium oxide minerals and synthetic equivalents. J. Petrol. 1964, 5, 310–357. [Google Scholar] [CrossRef]
  24. Haggerty, S.E. Oxide textures—A mini-atlas. In Oxide Minerals: Petrologic and Magnetic Significance, Reviews in Mineralogy Volume 25; Lindlsey, D.H., Ed.; Mineralogical Society of America: Chantilly, VA, USA, 1991; pp. 129–219. [Google Scholar]
  25. Lattard, D. Experimental evidence for the exsolution of ilmenite from titaniferous spinel. Am. Mineral. 1995, 80, 968–981. [Google Scholar] [CrossRef]
  26. Tan, W.; Liu, P.; He, H.; Wang, C.Y.; Liang, X. Mineralogy and origin of exsolution in Ti-rich magnetite from different magmatic Fe-Ti oxide-bearing intrusions. Can. Mineral. 2016, 54, 539–553. [Google Scholar] [CrossRef]
  27. Sandecki, J. Mineralogical and genetical aspects of the Smålands Taberg Fe-Ti-V ore, Protogine Zone of southern Sweden. GFF 2000, 122, 351–358. [Google Scholar] [CrossRef]
  28. Arguin, J.-P.; Pagé, P.; Girard, R.; Barnes, S.-J. The spatial variation of mineralogy in the vanadiferous magnetite deposit of the Lac Doré Complex (Chibougamau, Québec) and its implications on the chemical purity of magnetite concentrates. In Proceedings of the 14th SGA Biennial Meeting, Québec city, QC, Canada, 20–23 August 2017; pp. 1491–1494. [Google Scholar]
  29. Butcher, A.R.; Merkle, R.K.W. Postcumulus modification of magnetite grains in the upper zone of the Bushveld Complex, South Africa. Lithos 1987, 20, 247–260. [Google Scholar] [CrossRef]
  30. Amcoff, Ö.; Figueiredo, B.R. Mechanisms of retrograde changes in oxide minerals from the Proterozoic Serrote da Laje deposit, northeastern Brazil. Miner. Depos. 1990, 25, 313–322. [Google Scholar] [CrossRef]
  31. Howarth, G.H.; Prevec, S.A.; Zhou, M.F. Timing of Ti-magnetite crystallisation and silicate disequilibrium in the Panzhihua mafic layered intrusion: Implications for ore-forming processes. Lithos 2013, 170, 73–89. [Google Scholar] [CrossRef]
  32. Turnock, A.C.; Eugster, H.P. Fe-Al oxides; phase relationships below 1000 °C. J. Petrol. 1962, 3, 533–565. [Google Scholar] [CrossRef]
  33. Mortensen, J.K. U-Pb geochronology of the eastern Abitibi subprovince. Part 1: Chibougamau-Matagami-Joutel region. Can. J. Earth Sci. 1993, 30, 11–28. [Google Scholar] [CrossRef]
  34. Leclerc, F.; Bédard, J.H.; Harris, L.B.; McNicoll, V.J.; Goulet, N.; Roy, P.; Houle, P. Tholeiitic to calc-alkaline cyclic volcanism in the Roy Group, Chibougamau area, Abitibi Greenstone Belt-revised stratigraphy and implications for VHMS exploration. Can. J. Earth Sci. 2011, 48, 661–694. [Google Scholar] [CrossRef]
  35. Racicot, D. Géochimie et Métallogénie des Parties Occidentale et Centrale du Pluton de Chibougamau; Report for the Ministère des Ressources naturelles et de la Faune. DPV-834; MERN: Québec, QC, Canada, 1981. (In French) [Google Scholar]
  36. Krogh, T.E. Improved accuracy of U-Pb zircon ages by the creation of more concordant systems using air abrasion technique. Geochim. Cosmochim. Acta 1982, 46, 637–649. [Google Scholar] [CrossRef]
  37. Pilote, P.; Dion, C.; Joanisse, A.; David, J.; Machado, N.; Kirkham, R.V.; Robert, F. Géochronologie des minéralisations d’affiliation magmatique de l’Abitibi, secteurs Chibougamau et de Troilus-Frotet: implications géotectoniques. In Programme et Résumés, Séminaire d’Information sur la Recherche Géologique, Ministère des Ressources naturelles. DV97-03; MERN: Québec, QC, Canada, 1997. (In French) [Google Scholar]
  38. Joanisse, A. Géochronologie des minéralisations filoniennes à Cu-Au retrouvées dans le Complexe du Lac Doré. M.Sc. Thesis, Université du Québec à Montréal, Montréal, QC, Canada, 1998. [Google Scholar]
  39. Côté-Mantha, O. Architecture et Origine du Système de Minéralisation Polymétallique du Secteur du Lac Line, région de Chibougamau. Ph.D. Thesis, Université du Québec à Chicoutimi, Chicoutimi, QC, Canada, 2009. [Google Scholar]
  40. Kline, S.W. Metamorphic mineralogy of the Doré Lake Complex in the vicinity of the Grenville Front. In Chibougamau: Stratigraphy and Mineralization; Guha, J., Chown, E.H., Eds.; Bulletin de l’Institut Canadien des Mines et de la Métallurgie: Montreal, QC, Canada, 1984; Volume 34, pp. 198–211. [Google Scholar]
  41. Bédard, J.H.; Leclerc, F.; Harris, L.B.; Goulet, N. Intra-sill magmatic evolution in the Cummings Complex, Abitibi greenstone belt: Tholeiitic to calc-alkaline magmatism recorded in an Archean subvolcanic conduit system. Lithos 2009, 111, 47–71. [Google Scholar] [CrossRef]
  42. Girard, R.; Allard, G.O. Le gîte de vanadium du Lac Doré, Chibougamau. In Géologie et Métallogénie du District Minier du Chapais-Chibougamau DV98-03; Pilot, P., Ed.; Ministère des Ressources naturelles; MERN: Québec, QC, Canada, 1998; pp. 115–118. (In French) [Google Scholar]
  43. Girard, R.; D’Amours, C. The Lac Doré Vanadium Project: First Resource Estimate (Chibougamau, Québec, Canada); NI 43-101 Technical Report Presented to VanadiumCorp Resource Inc. 2015. Available online: https://www.vanadiumcorp.com/releases/ni-43-101-technical-report-complete/ (accessed on 28 September 2018).
  44. Leclerc, F.; Harris, L.B.; Bédard, J.H.; Van Breemen, O.; Goulet, N. Structural and stratigraphic controls on magmatic, volcanogenic, and shear zone-hosted mineralization in the Chapais-Chibougamau mining camp, Northeastern Abitibi, Canada. Econ. Geol. 2012, 107, 963–989. [Google Scholar] [CrossRef]
  45. Arguin, J.-P.; Girard, R. Detailed stratigraphy across the P1 to P2 magnetite layers (Lac Doré project, NTS 32G16); Technical report presented to VanadiumCorp Resource Inc. 2017; Unpublished work. [Google Scholar]
  46. Liao, Y. Pratical Electron Microscopy and Database—An online book, 2nd ed. Available online: http://www.globalsino.com/EM/ (accessed on 28 September 2018).
  47. Dare, S.A.S.; Barnes, S.-J.; Beaudoin, G.; Méric, J.; Boutroy, E.; Potvin-Doucet, C. Trace elements in magnetite as petrogenetic indicators. Miner. Depos. 2014, 49, 785–796. [Google Scholar] [CrossRef]
  48. Klemm, D.D.; Henckel, J.; Dehm, R.; Von Gruenewaldt, G. The geochemistry of titanomagnetite in magnetite layers and their host rocks of the Eastern Bushveld Complex. Econ. Geol. 1985, 80, 1075–1088. [Google Scholar] [CrossRef]
  49. Habteselassie, M.M.; Mathison, C.I.; Gilkes, R.J. Vanadium in magnetite gabbros and its behaviour during lateritic weathering, Windimurra Complex, Western Autralia. Autral. J. Earth Sci. 1996, 43, 555–566. [Google Scholar] [CrossRef]
  50. Reynolds, I.M. Contrasted mineralogy and textural relationships in the uppermost titaniferous magnetite layers of the Bushveld Complex in the Bierkraal area north of Rustenburg. Econ. Geol. 1985, 80, 1027–1048. [Google Scholar] [CrossRef]
  51. Toplis, M.J.; Carroll, M.R. An experimental study of the influence of oxygen fugacity on Fe-Ti oxide stability, phase relations, and mineral-melt equilibria in ferro-basaltic systems. J. Petrol. 1995, 36, 1137–1170. [Google Scholar] [CrossRef]
  52. Toplis, M.J.; Corgne, A. An experimental study of element partitioning between magnetite, clinopyroxene and iron-bearing silicate liquids with particular emphasis on vanadium. Contr. Mineral. Petrol. 2002, 144, 22–37. [Google Scholar] [CrossRef]
  53. Tegner, C.; Cawthorn, R.G.; Kruger, F.J. Cyclicity in the Main and Upper Zones of the Bushveld Complex, South Africa: Crystallization from a zoned magma sheet. J. Petrol. 2006, 47, 2257–2279. [Google Scholar] [CrossRef]
  54. Namur, O.; Charlier, B.; Toplis, M.J.; Higgins, M.D.; Liégeois, J.-P.; Vander Auwera, J. Crystallization sequence and magma chamber processes in the ferrobasaltic Sept Iles Layered Intrusion, Canada. J. Petrol. 2010, 51, 1203–1236. [Google Scholar] [CrossRef]
  55. Cawthorn, R.G.; Ashwal, L.D. Origin of anorthosite and magnetitite layers in the Bushveld Complex, contrained by major element compositions of plagioclase. J. Petrol. 2009, 50, 1607–1637. [Google Scholar] [CrossRef]
  56. Barnes, S.-J.; Maier, W.D.; Ashwal, L.D. Platinum-group element distribution in the Main Zone and Upper Zone of the Bushveld Complex, South Africa. Chem. Geol. 2004, 208, 293–317. [Google Scholar] [CrossRef]
  57. Maier, W.D.; Barnes, S.-J.; Groves, D.L. The Bushveld Complex, South Africa: Formation of platinum-palladium, chrome- and vanadium-rich layers via hydrodynamic sorting of a mobilized cumulate slurry in a large, relatively slowly cooling, subsiding magma chamber. Miner. Depos. 2013, 48, 1–56. [Google Scholar] [CrossRef]
  58. Cawthorn, R.G.; McCarthy, T.S. Variations in Cr content of magnetite from the Upper Zone of the Bushveld Complex—Evidence for heterogeneity and convection currents in magma chambers. Earth Planet. Sci. Lett. 1980, 46, 335–343. [Google Scholar] [CrossRef]
  59. McCarthy, T.S.; Cawthorn, R.G. The geochemistry of vanadiferous magnetite in the Bushveld Complex: Implications for crystallization mechanisms in layered complexes. Miner. Depos. 1983, 18, 505–518. [Google Scholar] [CrossRef]
  60. McDonough, W.F.; Sun, S.-S. The composition of the Earth. Chem. Geol. 1995, 120, 223–253. [Google Scholar] [CrossRef]
  61. Ulmer, G.G. Experimental investigation of chromite spinels. Eco. Geol. 1967, Monogr. 4, 114–131. [Google Scholar]
  62. Charlier, B.; Namur, O.; Bolle, O.; Latypov, R.; Duchesne, J.C. Fe-Ti-V-P ore deposits associated with Proterozoic massif-type anorthosites and related rocks. Earth-Sci. Rev. 2015, 141, 56–81. [Google Scholar] [CrossRef]
  63. Campbell, I.H.; Naldrett, A.J. The influence of silicate:sulfide ratios on the geochemistry of magmatic sulfides. Econ. Geol. 1979, 74, 1503–1506. [Google Scholar] [CrossRef]
  64. Barnes, S.-J.; Lightfoot, P.C. Formation of magmatic nickel sulfide ore deposits and processes affecting their copper and platinum group element contents. In Economic Geology 100th Anniversary Volume; Hedenquist, J.W., Thompson, J.F.H., Goldfarb, R.J., Richards, J.P., Eds.; Society of Economic Geology: Littleton, CO, USA, 2005; pp. 179–213. [Google Scholar]
  65. Duran, C.J.; Barnes, S.-J.; Corkery, J.T. Geology, petrography, geochemistry, and genesis of sulfide-rich pods in the Lac des Iles palladium deposits, western Ontario, Canada. Miner. Depos. 2016, 51, 509–532. [Google Scholar] [CrossRef]
  66. Waychunas, G.A. Crystal chemistry of oxides and oxyhydroxides. In Oxide Minerals: Petrologic and Magnetic Significance, Reviews in Mineralogy Volume 25; Lindlsey, D.H., Ed.; Mineralogical Society of America: Chantilly, VA, USA, 1991; pp. 11–68. [Google Scholar]
  67. Song, X.Y.; Qi, H.W.; Hu, R.Z.; Chen, L.M.; Yu, S.Y.; Zhang, J.F. Formation of thick stratiform Fe-Ti oxide layers in layered intrusion and frequent replenishment of fractionated mafic magma: Evidence from the Panzhihua intrusion, SW China. Geochem. Geophys. Geosyst. 2013, 14, 712–732. [Google Scholar] [CrossRef]
  68. Wilson, A.H. The earliest stages of emplacement of the Eastern Bushveld Complex: Development of the Lower Zone, Marginal Zone and Basal Ultramafic Sequence. J. Petrol. 2015, 56, 347–388. [Google Scholar] [CrossRef]
  69. Brown, G.M. The layered ultrabasic rocks of Rhum, Inner Hebrides. Philos. Trans. Royal Soc. Lond. B 1956, 240, 1–53. [Google Scholar] [CrossRef]
  70. Irvine, T.N.; Smith, C.H. The ultramafic rocks of the Muskox intrusion, Northwest Territories, Canada. In Ultramafic and Related Rocks; Wyllie, P.J., Ed.; Wiley: New York, NY, USA, 1967; pp. 38–49. [Google Scholar]
  71. Raedeke, L.D.; McCallum, I.S. Investigations in the Stillwater complex: Part II. Petrology and petrogenesis of the ultramafic series. J. Petrol. 1984, 25, 395–420. [Google Scholar] [CrossRef]
  72. Barnes, S.-J.; Maier, W.D.; Curl, E.A. Composition of the marginal rocks and sills of the Rustenburg Layered Suite, Bushveld Complex, South Africa: Implications for the formation of the platinum-group element deposits. Econ. Geol. 2010, 105, 1491–1511. [Google Scholar] [CrossRef]
  73. Cawthorn, R.G. Multiple sills or a layered intrusion? Time to decide. S. Afr. J. Geol. 2012, 115, 283–290. [Google Scholar] [CrossRef]
  74. Irvine, T.N.; Andersen, J.C.O.; Brooks, C.K. Included blocks (and blocks within blocks) in the Skaergaard intrusion: Geologic relations and the origins of rhythmic modally graded layers. Geol. Soc. Am. Bull. 1998, 110, 1398–1447. [Google Scholar]
  75. Higgins, M.D. A new interpretation of the structure of the Sept Iles Intrusive suite, Canada. Lithos 2005, 83, 199–213. [Google Scholar] [CrossRef]
  76. Sonnenthal, E.L.; McBirney, A.R. The Skaergaard Layered Series. Part IV. Reaction–transport simulations of foundered blocks. J. Petrol. 1998, 39, 633–661. [Google Scholar] [CrossRef]
  77. Namur, O.; Charlier, B.; Toplis, M.J.; Higgins, M.D.; Hounsell, V.; Liégeois, J.-P.; Vander Auwera, J. Differentiation of tholeiitic basalt to A-Type granite in Sept Iles Layered Intrusion, Canada. J. Petrol. 2011, 52, 487–539. [Google Scholar] [CrossRef]
  78. Tegner, C.; Wilson, J.R.; Brooks, C.L. Intraplutonic quench zones in the Kap Edvard Holm layered gabbro complex, East Greenland. J. Petrol. 1993, 34, 681–710. [Google Scholar] [CrossRef]
  79. Wager, L.R.; Brown, G.M. Layered Igneous Rocks; Oliver and Boyd: Edinburgh, UK, 1968. [Google Scholar]
  80. Irvine, T.N.; Sharpe, M.R. Magma mixing and the origin of stratiform oxide ore zones in the Bushveld and Stillwater complexes. In Metallogeny of Basic and Ultramafic Rocks; Gallagher, M.J., Ixer, R.A., Neary, C.R., Prichard, H.M., Eds.; Institution of Mining and Metallurgy: London, UK, 1986; pp. 183–198. [Google Scholar]
  81. Harney, D.M.W.; Merkle, R.W.; Von Gruenewaldt, G. Platinum-group element behavior in the lower part of the Upper Zone, Eastern Bushveld Complex–Implications for the formation of the Main Magnetite Layer. Econ. Geol. 1990, 85, 1777–1789. [Google Scholar] [CrossRef]
  82. Mücke, A. Magnetite, ilmenite and ulvite in rocks and ore deposits: Petrography, microprobe analyses and genetic implications. Mineral. Petrol. 2003, 77, 215–234. [Google Scholar] [CrossRef]
  83. Spencer, K.J.; Lindsley, D.H. A solution model for coexisting iron-titanium oxides. Am. Mineral. 1981, 66, 1189–1201. [Google Scholar]
  84. Andersen, D.J.; Lindsley, D.H. New (and final!) models for the Ti-magnetite/ilmenite geothermometer and oxygen barometer. EOS Trans. Am. Geophys. Union 1985, 66, 416. [Google Scholar]
  85. Frost, B.R.; Lindsley, D.H.; Andersen, D.J. Fe-Ti oxide-silicate equilibria: Assemblages with fayalitic olivine. Am. Mineral. 1988, 73, 727–740. [Google Scholar]
  86. Frost, B.R. Magnetic petrology: Factors that control the occurrence of magnetite in crustal rocks. In Oxide Minerals: Petrologic and Magnetic Significance, Reviews in Mineralogy Volume 25; Lindlsey, D.H., Ed.; Mineralogical Society of America: Chantilly, VA, USA, 1991; pp. 489–509. [Google Scholar]
  87. Nabil, H. Genèse des dépôts de Fe-Ti-P associés aux intrusions litées (exemples: l’intrusion mafique de Sept-îles, au Québec; Complexe de Duluth aux États-Unis). Ph.D. Thesis, Université du Québec à Chicoutimi, Chicoutimi, QC, Canada, 2003. [Google Scholar]
  88. Dieckmann, R. Defects and cation diffusion in magnetite (IV): Nonstoichiometry and point defect structure of magnetite (Fe3-δO4). Ber. Bunsenges. Phys. Chem. 1982, 86, 112–118. [Google Scholar] [CrossRef]
  89. Senderov, E.; Dogan, A.U.; Navrotsky, A. Nonstoichiometry of magnetite-ulvöspinel solid solutions quenched from 1300 °C. Am. Mineral. 1993, 78, 565–573. [Google Scholar]
  90. Duchesne, J.C. Microstructures of Fe-Ti oxide minerals in the South Rogaland anorthositic complex (Norway). Ann. Soc. Geol. Belg. 1970, 93, 527–544. [Google Scholar]
  91. Charlier, B.; Sakoma, E.; Sauvé, M.; Stanaway, K.; Vander Auwera, J.; Duchesne, J.-P. The Grader layered intrusion (Havre-Saint-Pierre Anorthosite, Quebec) and genesis of nelsonite and other Fe-Ti-P ores. Lithos 2008, 101, 359–378. [Google Scholar] [CrossRef]
  92. Morisset, C.E.; Scoates, J.S.; Weis, D.; Sauvé, M.; Stanaway, K.J. Rutile-bearing ilmenite deposits associated with the Proterozoic Saint-Urbain and Lac Allard anorthosite massifs, Grenville Province, Quebec. Can. Mineral. 2010, 48, 821–849. [Google Scholar] [CrossRef]
  93. Burton, B.P. Theoretical analysis of chemical and magnetic ordering in the system Fe2O3-FeTiO3. Am. Mineral. 1985, 70, 1027–1035. [Google Scholar]
  94. Burton, B.P. Interplay of chemical and magnetic ordering. In Oxide Minerals: Petrologic and Magnetic Significance, Reviews in Mineralogy Volume 25; Lindlsey, D.H., Ed.; Mineralogical Society of America: Chantilly, VA, USA, 1991; pp. 303–322. [Google Scholar]
  95. Ghiorso, M.S. Thermodynamic properties of hematite-ilmenite-geikielite solid solutions. Contr. Mineral. Petrol. 1990, 104, 645–667. [Google Scholar] [CrossRef]
  96. Onishi, H.; Sandell, E.B. Geochemistry of arsenic. Geochim. Cosmochim. Acta 1955, 7, 1–33. [Google Scholar] [CrossRef]
  97. Esson, J.; Stevens, R.H.; Vincent, E.A. Aspects of geochemistry of arsenic and antimony, exemplified by the Skaergaard intrusion. Mineral. Mag. 1965, 35, 88–107. [Google Scholar] [CrossRef]
  98. Haggerty, S.E. Opaque Mineral Oxides in Terrestrial Igneous Rocks, Reviews in Mineralogy Volume 3; Rumble, D., Ed.; Mineralogical Society of America: Chantilly, VA, USA, 1976; pp. Hg101–Hg300. [Google Scholar]
  99. Van Orman, J.A.; Crispin, K.L. Diffusion in oxides. Rev. Mineral. Geochem. 2010, 72, 757–825. [Google Scholar] [CrossRef]
  100. Kulikova, K.V.; Varlamov, D.A. The first finding of corundum in exsolution structures of oxides in gabbroic rocks from the Polar Urals. Dokl. Earth Sci. 2006, 407, 246–249. [Google Scholar] [CrossRef]
  101. Duran, C.J.; Barnes, S.-J.; Corkery, J.T. Trace element distribution in primary sulfides and Fe-Ti oxides from the sulfide-rich pods of the Lac des Iles Pd deposits, Western Ontario, Canada: Constraints on processes controlling the composition of the ore and the use of pentlandite compositions in exploration. J. Geochem. Explor. 2016, 166, 45–63. [Google Scholar]
  102. Hunter, R.H. Textural development in cumulate rocks. In Layered Intrusions; Cawthorn, R.G., Ed.; Elsevier: Amsterdam, The Netherlands, 1996; pp. 77–101. [Google Scholar]
  103. Higgins, M.D. Quantitative Textural Measurements in Igneous and Metamorphic Petrology; Cambridge University Press: Cambridge, UK, 2006. [Google Scholar]
  104. Carmichael, I.S.E. The iron-titanium oxides of salic volcanic rocks and their associated ferromagnesian silicates. Contr. Mineral. Petrol. 1967, 14, 36–64. [Google Scholar] [CrossRef]
  105. Anderson, A.T. Oxidation of the LaBlache Lake titaniferous magnetite deposit, Quebec. J. Geol. 1968, 76, 528–547. [Google Scholar] [CrossRef]
  106. Lindsley, D.H.; Spencer, K.J. Fe-Ti oxide geothermometry: Reducing analyses of coexisting Ti-magnetite (Mt) and ilmenite (Ilm). EOS Trans. Am. Geophys. Union 1982, 63, 471. [Google Scholar]
  107. Stormer, J.C.J. The effects of recalculation on estimates of temperature and oxygen fugacity from analyses of multicomponent iron-titanium oxides. Am. Mineral. 1983, 68, 586–594. [Google Scholar]
Figure 1. Simplified geological map of the Chapais-Chibougamau area showing the distribution of the Lac Doré Complex (light grey) and the location of the Lac Doré property (LDP). NL, North limb; SL, South limb. Modified after Leclerc et al. [44].
Minerals 08 00476 g001
Figure 2. Detailed geological map of the northern part of the trench 19 + 50E, Lac Doré property. The 122-m-long transect line encompasses the P1 and P2 units of the Layered Series. FTO, Fe-Ti oxides. Modified after Arguin and Girard [45].
Minerals 08 00476 g002
Figure 3. An example of (a) a high-resolution backscattered electron image (1000X) that was acquired on a Zeiss EVO-MA15 SEM, and (b) the corresponding false-color image showing the distribution of ilmenite exsolutions in decomposed titanomagnetitess. See text for details. Ilm, ilmenite; Mag, magnetite; Oth, others.
Minerals 08 00476 g003
Figure 4. Optical microphotographs showing: (a) trellis-type lamellae of Ilmenite-E1 parallel to three sets of {111} lattice planes of the magnetite structure; (b) sandwich-type lamellae of Ilmenite-E1 along one set of {111} planes; (c) a recrystallized assemblage of magnetite and ilmenite that is characterized by size-reduced grains with a polygonal structure and well-developed triple junctions; note the absence of internal exsolutions of ilmenite in the magnetite. The sample shown in the microphotograph (c) has been collected from the immediate vicinity of a shear zone. Ilm, ilmenite; Mag, magnetite; Spl, Al-spinel.
Minerals 08 00476 g004
Figure 5. Backscattered electron images showing exsolutions of Ilmenite-E2 in titanomagnetite: (a) ilmenite pseudomorphous after cloth-like texture of ulvöspinel; (b) trellis-type lamellae of ilmenite with an interstitial, partly preserved, cloth-like texture; (c) composite intergrowths made of patchy exsolutions of ilmenite containing tiny blebs of magnetite (the red frame shows an enlargement of a composite intergrowth); (d) vermicular exsolutions in a titanomagnetite with a fracture filled with ilmenite granules; (e) a textural continuum from ilmenite pseudomorphous after cloth-like texture in the core of titanomagnetite (Stage 1), through vermicular exsolutions in the grain margins (Stage 3), to external granules (Stage 4); (f) thick lamellae of Ilmenite-E1 in cloth-textured titanomagnetite; note the absence of Ilmenite-E2 in the immediate vicinity of the lamellae. Refer to the text for the details on Stages 1, 3, and 4. Ilm, ilmenite; Mag, magnetite.
Minerals 08 00476 g005
Figure 6. Microphotographs showing exsolutions of hercynite-gahnite in titanomagnetite: (a) euhedral granules of hercynite containing lamellae of gahnite; (b) granular Al-spinels that are included in a magnetite matrix; (c) rectilinear alignments of granular Al-spinels (Al-spinel strings) within a thick lamella of Ilmenite-E1; (d) thin Al-spinel discs parallel to the {100} lattice planes of the magnetite structure; (e) zonation of the Al-spinel distribution within a titanomagnetite grain; (f) a thick lamella of Ilmenite-E1 in titanomagnetite containing abundant Al-spinel exsolutions; note the absence of Al-spinel in the immediate vicinity of the lamella. The microphotograph (a) was taken by SEM, whereas all the others were taken by optical microscope. Ghn, gahnite; Hc, hercynite; Ilm, ilmenite; Mag, magnetite; Spl, Al-spinel.
Minerals 08 00476 g006
Figure 7. Backscattered electron images showing HCM (hercynite–corundum–magnetite) intergrowths in titanomagnetite: (a) an irregularly shaped grain of zinciferous hercynite that is surrounded by a mixture of corundum and magnetite; (b) HCMs and granular ilmenite exsolutions (E1 type) that are distributed along the boundaries between titanomagnetite grains; (c) HCMs that are included in the margins of an ilmenite grain at the point of contact with titanomagnetite. Crn, corundum; Hc, hercynite; Ilm, ilmenite; Mag, magnetite.
Minerals 08 00476 g007
Figure 8. The relationships between the stratigraphic elevation, the abundance and the distribution of ilmenite, and Al-spinel exsolutions: (a) the ilmenite/magnetite ratio in titanomagnetite that was measured from backscattered images using the method that is described in Section 3.3; (b) Al-spinel abundance given as a function of four qualitative classes (from 1 = rare to 4 = abundant). The distribution of exsolutions is expressed by different symbol shapes and colours (see the legends). The circle sizes in the diagram (b) represent the abundance of FTO (Fe-Ti oxides) in rocks. HCMs, hercynite–corundum–magnetite intergrowths.
Minerals 08 00476 g008
Figure 9. The relationships between the stratigraphic elevation and eight of the elements that were determined by LA-ICP-MS to be in titanomagnetite (Cr, V, Ni, Mg, Co, Ti, Si, and Sb). The symbol shapes and colours are as in Figure 8a. The circle sizes represent the abundance of FTO (Fe-Ti oxides) in rocks. The dashed line corresponds to the 65-meter-height level (see text for details).
Minerals 08 00476 g009
Figure 10. The relationships between the stratigraphic elevation and four (4) of the elements that were determined by LA-ICP-MS to be in ilmenite (V, Al, Nb, and Ta). The pink filled circles represent the population of ilmenite that was crystallized from the magma, whereas the black crosses represent Ilmenite-E1. The dashed line corresponds to the 65-meter-height level (see text for details).
Minerals 08 00476 g010
Figure 11. The mantle-normalized trace element compositions of (a) titanomagnetite and (b) ilmenite as determined by LA-ICP-MS. The patterns—represented by symbols and thick lines—correspond to the overall-average values, whereas the fields correspond to the distribution of sample-average values. The diamond and line colours in the diagram “a” represent the abundance of FTO (Fe-Ti oxides) in rocks. The average composition of titanomagnetite has been added to the diagram (b) for comparative purposes. The terms “granular” and “lamellar” have respectively been used in the legend of the diagram (b) to designate ilmenite that is derived from primary crystallization and Ilmenite-E1. The elements (excluding As, Sb, and In) are plotted in order of increasing compatibility (from left to right) with magnetite according to Dare et al. [47]. Arsenic, Sb, and In were added to the compatibility order considering, to the best of our knowledge, behavior similarities. The normalizing mantle values are from McDonough and Sun [60]. DL, detection limits.
Minerals 08 00476 g011
Figure 12. Binary diagrams of the composition of Al-spinel exsolutions in titanomagnetite as determined by EDS: (a) TiO2 versus ZnO + FeOTotal; (b) FeO versus ZnO. The dashed line in the diagram (a) corresponds to the limit between the high- and low-Ti series. The composition of the end-members hercynite and gahnite have been added to the diagram (b). HCMs, hercynite-corundum-magnetite intergrowths; Tmt, titanomagnetite.
Minerals 08 00476 g012
Figure 13. A cartoon model of magma chamber inflation and roof destabilization after the injection of a major volume of magma: (a) crystallization of the first cyclic unit (U1) from the resident magma; (b) magma chamber inflation induced by the injection of a large volume of new magma; (c) destabilization of the magma chamber’s roof and foundering of gabbroic blocks of the Upper Border Zone; (d) crystallization of the second cyclic unit (U2) from a hybrid of magma and the trapping of blocks (autoliths). See the text for a complete description of the model.
Minerals 08 00476 g013
Figure 14. Diagrams of X Fe2TiO4 versus temperature (°C) showing (a) experimental and (b,c) schematic solvus of the magnetite-ulvöspinel solid solution. The four experimental solvus in the diagram “a” are from Lilova et al. [13], Vincent et al. [17], Price [18], and Lindsley [19]. See the text for a description of each model that is presented in the diagrams (b,c).
Minerals 08 00476 g014
Figure 15. The diagram of temperature (°C) versus Δlog fO2 (relative to the fayalite–magnetite–quartz (FMQ) buffer) showing the equilibrium conditions between ilmenite (E1 and E2) and its magnetite host calculated using our microprobe data and the geothermobarometers from Spencer and Lindsley [83] and Andersen and Lindsley [84]. The black filled triangles correspond to the equilibrium conditions that were calculated using the compositions that were reported by Nabil [87] from the Sept-Îles Intrusive Suite (SIIS).
Minerals 08 00476 g015
Figure 16. LA-ICP-MS profiles (47Ti, 51V, and 52Cr) in counts per second versus time across a titanomagnetite containing large lamellae of Ilmenite-E1. Note the Cr enrichment at the boundary between ilmenite lamellae and the magnetite host. Ilm, ilmenite lamellae; Mag, magnetite.
Minerals 08 00476 g016
Figure 17. Backscattered electron images showing typical relationships between exsolutions of Al-spinel and Ilmenite-E2 in titanomagnetite: (a) thin lamellae of ilmenite ending abruptly at the edge of the euhedral grain of Al-spinel; (b) thin lamellae of ilmenite penetrating into a subhedral/anhedral grain of Al-spinel. Ilm, ilmenite; Spl, Al-spinel.
Minerals 08 00476 g017
Figure 18. Mass-balance calculations and partition coefficients: (a) the mass-balance calculations showing the proportion (%) of various trace elements that are accounted for by Ilmenite-E1 in titanomagnetite (see Equation (7)); (b) the empirical solid-solid partition coefficients (D) between Ilmenite-E1 and Al-Zn-rich magnetitess. See the text for details regarding our calculations. The order of elements is as in Figure 11. Magss, magnetite solid solution; Tmt, titanomagnetite.
Minerals 08 00476 g018
Figure 19. LA-ICP-MS profiles (25Mg,27Al, 47Ti, 51V, 66Zn, and 93Nb) in counts per second versus time across a titanomagnetite grain containing tiny exsolutions of Ilmenite-E2. The time-resolved signals show that Al and Zn (±Mg) are depleted in the grain margins relative to the core, whereas Nb tend to be slightly enriched.
Minerals 08 00476 g019
Figure 20. A simplified model for exsolution development in titanomagnetite of the LDC: (a) sub-model A involves that titanomagnetite crystallized from a relatively reduced, undifferentiated magma; (b) sub-model B involves that titanomagnetite crystallized from a more oxidized, evolved magma. See the text for model details. Hc, hercynite (light yellow); HCMs, hercynite-corundum-magnetite intergrowths (green); Hc-Ghn, hercynite-gahnite spinels (brown); HT, high-Ti; Ilm, ilmenite (red); int., intergrowth; LT, low-Ti; Mag, spinelss or magnetite matrix (grey); Usp, ulvöspinel (black dashed lines).
Minerals 08 00476 g020

