Abstract
High-resolution laboratory-based thermal infrared spectroscopy is an up-and-coming tool in the field of geological remote sensing. Its spatial resolution allows for detailed analyses at centimeter to sub-millimeter scales. However, this increase in resolution creates challenges with sample characteristics, such as grain size, surface roughness, and porosity, which can influence the spectral signature. This research explores the effect of rock sample surface preparation on the thermal infrared spectral signatures. We applied three surface preparation methods (split, saw, and polish) to determine how the resulting differences in surface roughness affects both the spectral shape as well as the spectral contrast. The selected samples are a pure quartz sandstone, a quartz sandstone containing a small percentage of kaolinite, and an intermediate-grained gabbro. To avoid instrument or measurement type biases we conducted measurements on three TIR instruments, resulting in directional hemispherical reflectance spectra, emissivity spectra and bi-directional reflectance images. Surface imaging and analyses were performed with scanning electron microscopy and profilometer measurements. We demonstrate that surface preparation affects the TIR spectral signatures influencing both the spectral contrast, as well as the spectral shape. The results show that polished surfaces predominantly display a high spectral contrast while the sawed and split surfaces display up to 25% lower reflectance values. Furthermore, the sawed and split surfaces display spectral signature shape differences at specific wavelengths, which we link to mineral transmission features, surface orientation effects, and multiple reflections in fine-grained minerals. Hence, the influence of rock surface preparation should be taken in consideration to avoid an inaccurate geological interpretation.
1. Introduction
Thermal infrared (TIR) spectroscopy of rocks and minerals has been of interest to the geological community ever since it was developed in the middle of the last century [1,2]. Early scientific research showed that primary rock-forming minerals such as silicates and carbonates display their reflectance features in the thermal part of the spectrum (8.0 to 14.0 µm [2,3,4,5,6,7]). From this early work onwards, several hyperspectral airborne and spaceborne TIR sensors have been developed including, among others, HyspIRI and AisaOWL [8]. To validate and calibrate data from these sensors, field and laboratory hyperspectral TIR spectrometers have been built. These field and laboratory sensors are increasingly operated as a main sensor by organizations globally because of their improved usability and spectral resolution [8]. As part of that development, several laboratory-based drill core loggers have been developed for detailed analyses of drill cores at a centimeter to sub-millimeter spatial resolution, giving rise to the new field of proximal sensing. These TIR reflectance imaging spectrometers have a high spatial and spectral resolution (SPECIM’s SisuRock system with the AisaOWL camera, CSIRO’s Hylogger, and a scanner under development from Corescan [9,10,11]), and provide a continuous spectral analysis of the down-hole mineralogical trends without the restrictions of sampling intervals of other techniques. However, multiple research groups identified challenges with sample characteristics, such as grain size, surface roughness, and porosity that can influence the spectral signature.
Early work of Lyon [2,12] showed that spectral contrast of mineral and rock spectra decrease with a decreasing particle size. This work has been confirmed repeatedly by others, e.g., [13,14,15,16,17]. One of the sample characteristics that influence the TIR spectral signature is sample surface roughness [18,19,20]. Kirkland et al. [19] conducted laboratory emissivity measurements on carbonate deposits to show that microscopic surface roughness introduces volume scattering and the cavity effect (partially trapping the signal in surface cavities), both resulting in a reduced spectral contrast. Osterloo et al. [21] conducted laboratory-based emissivity research to study the impact of changing surface roughness on the TIR spectral signature for various rock types. They show that, for all investigated rock types, spectral contrast decreases with increasing roughness as a result of transmittance of light through the medium (also known as volume scattering) resulting in partial loss of energy. They also show that spectral contrast decreases until a certain roughness is achieved after which spectral contrast stays constant or increases again which they attribute to multiple reflections of light within the grains. Hence, their research suggests that increasing roughness does not result in a continued decrease in spectral contrast. More recently, emissivity-based research conducted by Hardgrove et al. [18] on quartz and calcite samples shows that changes in sample surface roughness influence the spectral shape of the spectral signature. They show surfaces that are rough on the wavelength scale cause distinct spectral differences. Furthermore, they suggest a relationship between the crystal size and the surface roughness. Furthermore, several research groups showed that highly porous or vesicular rocks and rock samples with an optically rough surface have low spectral contrast [14,18,19,20,21,22].
The influence of these characteristics have already been identified for the field of geological remote sensing, but have not yet been translated to high-resolution laboratory spectroscopy, where the goal is to quantify changes in mineral composition on a much smaller scale. Furthermore, drill cores often have different surface textures and roughnesses as a result of differences in sample preparation. Some drill cores are split or broken, while others are sawed. Additionally, surface textures can differ as a result of differences in rock composition. This research focuses on the influence of geological sample surface preparation on the TIR spectral signature to determine the effect of various preparation methods and to link the results to previous surface roughness studies. We apply three sample surface preparation methods (split, saw, and polish) to determine how surface roughness affects both the spectral shape as well as the spectral contrast of the TIR spectral signatures. We obtained directional hemispherical reflectance (DHR) measurements, bi-directional reflectance (BDR) images, and emissivity measurements. The selected samples are a pure quartz sandstone, a quartz sandstone containing a small percentage of kaolinite, and an intermediate-grained gabbro. To eliminate the influence of sample heterogeneity, the samples have a limited mineral variation and a homogeneous mineral distribution.
Surface Roughness and Reflectivity of Light
The total ray energy is a product of the reflection, transmission, and absorption at each encountered interface. Whether a light ray is reflected, transmitted or absorbed depends on the angle of incidence and the refractive index of the encountered material as determined by Snell’s Law [17,19,23,24].
Surface reflection can be divided into two endmembers: specular reflection for a smooth, high-opacity surface and diffuse reflection for a rough surface with regular opacity (Figure 1a,b). In case of specular reflection, the surface behaves mirror-like and the angle of incidence equals the angle of reflection resulting in coplanar reflection. With diffuse reflection, the rays reflect in many directions regardless of the angle of the incident radiation. Therefore, the reflected energy is spread over many light rays which can, depending on the measuring method, lower the absolute reflectance of the signal [23]. Most surfaces do not display truly specular nor diffuse reflection, but a mixture of the two endmembers.
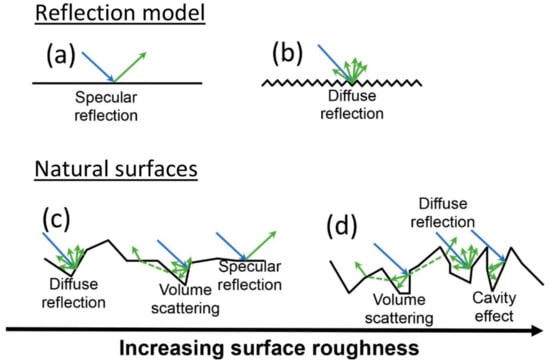
Figure 1.
Schematic diagram of interaction of light with a smooth surface (a) that displays specular reflection and a rough surface (b) that displays diffuse reflection. In natural surfaces, increasing surface roughness decreases specular reflection (c) and promotes diffuse reflection, volume scattering, and the cavity effect (d), which all reduce the spectral contrast.
Volume scattering occurs when surfaces contain significant amounts of hyperfine particles (1–20 µm), also known as clinging fines, which introduce transmission of incident rays through the encountered particles (Figure 1c,d [25,26,27])As a result, energy is lost due to partial absorption of the signal. This influences the spectral signature resulting in reststrahlen band shape changes, shifts of spectral features to longer wavelengths and loss of spectral contrast or even inversion of the spectral signature (Figure 2 [17,19,24,26]).
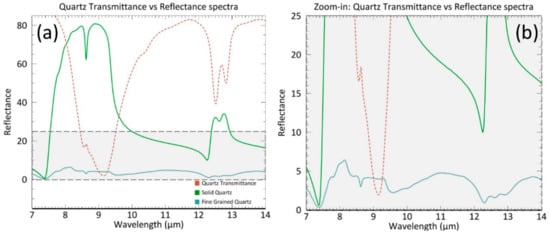
Figure 2.
(a) The effect of transmittance in quartz (red spectrum) on the reflectance spectrum. The green spectrum represents a quartz spectrum that has not been influenced by transmittance. The blue spectrum is a quartz spectrum of a fine-grained, particulate quartz sample (<60 µm) that is significantly affected by transmittance bands [16]. (b), a subset of (a), shows a lowered spectral reflectance in bands that are most influenced by low transmittance. Spectra are from Johns Hopkins University (JHU) and can be found in the ASTER spectral library in ENVI [30,31].
Surface cavities can trap and absorb incident rays reducing reflection and the accompanying spectral contrast, a phenomenon known as the cavity effect (Figure 1d). The relationship between the number of cavities at the surface and the spectral contrast is approximately linear [19,20,21]. Factors influencing the amount of spectral contrast reduction are the cavity shape, cavity area, entrance aperture area, and the diffuse or specular reflectivity of the cavity wall. Generally, the higher the ratio of the cavity depth to entrance width, the more significant the cavity effect [19,21,22]. Research shows for most materials, increase in surface roughness results in an increase of the number of surface cavities [19]. Additionally, Kirchhoff’s law of thermal radiation states: the sum of emissivity ε, transparency γ, and reflectivity ρ equals one (Equation (1)). Therefore, for an opaque object (γ = 0), reflectivity and emissivity display a simple relationship (Equation (2)):
ε + γ + ρ = 1,
ρ = 1 − ε
The result is that cavities have an opposite effect in emissivity measurements. Hence, if the reflected energy decreases, the emitted energy increases [28]. Rayleigh’s roughness criterion can be used to characterize the surface roughness. A surface is optically smooth depending on the height of the surface topography (difference between deepest valley and highest peak) and the wavelength of the light and the incident ray angle [21,29]. A surface is considered optically smooth if:
where H is the height of the surface topography in micrometers, λ the wavelength of the light in micrometers and θinc the zenith angle of the incident ray. For surface roughness to affect the spectral contrast, the surface topography should be larger than the wavelength of the incident light rays. This formula shows for the TIR range (7–16 µm) surfaces are considered optically rough when the topography height is equal to, or larger than, 1 to 20 µm depending on the angle of incidence [21]. Optical smooth surface are dominated by surface reflection, while optical rough surfaces are increasingly influenced by diffuse reflection and volume scattering.
H ≤ λ/(8cosθinc),
2. Materials and Methods
2.1. Sample Description
2.1.1. Sample Selection
The samples of this research represent a range from mono-mineral to more complex mineral composition and have been carefully selected to ensure a homogeneous mineral distribution. The selected samples (Table 1) are a plutonic gabbroic rock known by the trade name of Shanxi gabbro, and two sedimentary sandstones: a pure quartz sandstone with a porosity of 6% (Fontainebleau sandstone [32]) and a sandstone predominantly containing quartz and minor percentages of kaolinite with a porosity of 20% (Gildehaus sandstone [33]). We selected two sandstones and a gabbro to ensure good TIR spectral signatures and variations from simple to more complex mineralogical compositions.

Table 1.
Composition of the samples determined with quantitative XRD.
2.1.2. Sample Preparation
Differences in surface roughness were achieved, by splitting, sawing or polishing three different surfaces of each sample. The samples were sawed to the appropriate size with a Lortone LSS-14P lapidary saw with a 14-inch diamond blade. Sample surfaces were polished with a Knuth Rotor polishing machine that uses silicon carbide grinding papers. Stepwise polishing was done by increasing the grinding paper smoothness from an 80, 220, or 500 grit to a 4000 grit. The samples were split with a chisel, except for the Gabbro which required a brick cutter for splitting. The sample planes have parallel orientation in the original sample block with a maximum spacing of 20 cm, to avoid influences from differences in (mineral) orientation, sample heterogeneity and small lateral changes in sample composition (e.g., veins or inclusions). The samples were washed with tap water and cleaned with compressed air, to remove particles originating from the sample surface preparation. Then, the samples were oven-dried at 50 °C for at least 8 h. We placed the samples in a desiccator during cooling, to prevent air moisture from entering the samples.
2.2. Spectral Measurements and Data Processing
Spectral measurements are conducted on three spectrometers to confirm that our results are occurring across different instruments and both for reflectance and emissivity measurements. Hence, to avoid a bias in the results caused by a specific instrument or measurement type, we conducted measurements using a non-imaging Fourier transform infrared (FTIR) spectrometer with integrating sphere measuring directional-hemispherical reflectance (DHR), a TIR imaging spectrometer measuring double bidirectional reflectance (BDR) images, and a non-imaging emission FTIR spectrometer measuring emissivity. The first two instruments are the primary focus of this research, while the third spectrometer is included to cross-check the results on an emission spectrometer and to link to previous research results. We compare the spectroscopic results to scanning electron microscopy (SEM) images and quantitative micro-topography information from a profilometer.
2.2.1. Directional-Hemispherical Reflectance (DHR) Measurements
We conducted thermal DHR measurements on a Bruker Vertex 70 Fourier transform infrared (FTIR) spectrometer. This is a non-imaging visible near-infrared (VNIR) and TIR spectrometer, customized to allow for directional-hemispherical reflectance measurements. Customization was achieved with a diffuse gold-coated integrating sphere of 150 mm diameter containing a 3 cm diameter sample port [34,35]. An external high-power, water-cooled globar source is attached to the system for optimal energy throughput and signal-to-noise ratio. The Mercury-Cadmium-Tellurium (MCT) detector records the spectra with a spectral range of 1330–625 cm−1 (7.5 to 16 µm) at a resolution of 4 cm−1. A diffuse Labsphere Infragold standard serves as a reference. To check for potential sample heterogeneity, we measured each sample surface on nine randomly selected spots. We did not observe significant variations or outliers in the spectral signature for each surface, hence, we calculated a mean spectra based on the nine measurements. At the end of each measuring series, a dark current measurement is conducted and subtracted from the sample spectra. Previous work [34] shows the Bruker Vertex 70 FTIR spectrometer has excellent repeatability, with a reflectance values standard deviation between 0.1% and 0.6%. For a more detailed description of the measurement setup and processing chain, see [34].
2.2.2. Bidirectional Reflectance (BDR) Images
We recorded the reflectance images with the fully automated hyperspectral imaging workstation SisuROCK developed by SPECIM (www.specim.fi [9]). This workstation covers a large part of the IR spectral range with a VNIR (0.4–1.0 µm), short-wave infrared (SWIR, 0.97–2.5 µm) and a TIR (7.7–12 µm) camera. All cameras are push broom cameras that measure in double BDR mode. The target is moved under the cameras to create a 2D spatial image with full spectral per-pixel information. The focus of this research are the TIR images; hence we do not discuss the specific methodology and results of the VNIR and SWIR cameras.
The AisaOWL TIR camera (SPECIM) is a temperature stabilized imaging spectrometer with a high sensitivity cooled MCT detector. It was operated with a spectral range of 7.7 to 12 µm, 84 bands, 384 spatial pixels, a 1.7 mm pixel size, a spectral resolution of 100 nm and a scan rate of 170 mm/s. Each image recording included the measurement of a diffuse high reflectivity aluminum standard reference plate and a blackbody dark reference at sample temperature.
Samples were mounted on a plate and water leveled by pressing them on laboratory clay with a Leitz Wetzlar manual laboratory press. Then the height of the sample surface was measured, and the sample table of the SisuRock workstation was adjusted accordingly, so the sample surface height was in focus and constant over all measurements.
The reflectance images were processed by applying normalization with a radiometric calibration file and sensor parameters (white and dark references), blinking pixel correction, and spectral and spatial median filtering with software provided by SPECIM. For each sample surface, means, and standard deviations were calculated by averaging all image pixels with ENVI to allow for comparison of the different surfaces.
2.2.3. Emissivity Measurements
Thermal emission measurements were recorded with a MIDAC M4401-F FTIR spectrometer to determine if the observed spectral changes can also be identified in an emissivity based system. The instrument contains a customized down looking fore-optics and measures absolute radiance with a nitrogen cooled MCT detector with a spectral range of 7.5 to 14.5 µm and a resolution of 4 cm−1. The measurements were conducted under laboratory conditions, and the samples were heated in an oven to 50 °C to generate sufficient radiance levels. The measurement procedure includes a measurement of a hot 60 °C blackbody, a cold 20 °C blackbody, a set of three measurements of the sample and a highly diffuse reflecting Infragold® reference plate. The temperature of the reference plate was measured with a handheld infrared thermometer to allow for correction of downwelling radiance [36]. Each sample was measured six times in different spots. The samples were measured in a random order to allow for the detection of possible influences from room temperature differences and were returned to the oven immediately after three measurements. Spectral emissivity was calculated with the equation described by Korb et al. [36].
2.3. Surface Analyses
2.3.1. Scanning Electron Microscopy (SEM)
Scanning electron microscope images were obtained with a Zeiss Merlin HR-SEM to determine how the different sample surface preparation methods influence the mineralogy and texture of the samples. This SEM has a maximum point resolution of 1.2 nm at 30 kV and facilitates several high-resolution detectors. The detectors used to obtain images for this research are the high-efficiency secondary electron detector (HE-SE2), an in-lens detector for detection of higher energy secondary electrons for topographic mapping, and an annular selective backscatter detector (ASB) for compositional and crystal orientation mapping. In addition, energy dispersive X-ray (EDX) was performed to determine the elemental composition of the mineral phases identified in the backscatter images [37].
2.3.2. Profilometer Measurements
Detailed surface roughness analyses were performed with the Bruker Contour GT-I profilometer to quantify the roughness of the sample surfaces. This profilometer measures micro-topography based on the interference of light from the sample surface and light from the internal reference mirror in the objective of the profilometer (Mirau interferometer principle [17]). The Bruker Contour GT-I has a maximum horizontal scan range of 10 mm, a maximum vertical resolution of <0.01 nm and an root mean square repeatability of 0.01 nm.
The surface roughness measurements were conducted in phase shift interferometry mode (PSI) and covered an area of 1.7 × 2.3 mm including 307,200 data points. The roughness parameters are determined for the scanned area in µm or mm scale. Results include a topographic profile. The parameters are:
- The arithmetic average roughness (Ra): the arithmetical mean of the absolute values of the profile deviations from the mean line of the roughness profile;
- The root-mean-square roughness (Rq): the geometric average roughness of the area;
- The maximum peak height (Rp): the highest peak measured from the mean line;
- The maximum valley depth (Rv): the deepest valley measured from the mean line; and
- The maximum height of profile (Rt): the range of the total set of data points.
The difference between Ra and Rq is that Rq is more sensitive to outlying peaks and valleys. Therefore, Rq amplifies occasional high or low values, while Ra merely averages them [38]. To determine if there is a relationship between the spectral values and the surface roughness parameters, we compare the spectral values and band ratios of several distinct spectral features to the surface roughness parameters. Furthermore, we review surface roughness profiles and compare them to the observed spectral trends.
2.4. X-ray Diffraction
To determine the composition of the samples quantitative X-ray diffraction (QXRD) analysis were performed on the Bruker D2 XRD Phaser. Operating in Bragg-Brentano geometry [39], with Cu Kα radiation and a LYNXEYE detector including Bruker’s corundum standard reference material. Scans were conducted with a tube power of 30 kV and 10 mA at 70° 2θ using a 0.006 step size and counting for 1150 s. Two different slits were used: The standard divergence slit (1.0 mm or 0.6°) to control the illuminated area and enhance the resolution of the measurement and a detector slit of 8 mm to limit the irradiated area. Qualitative phase identification was performed with the software DIFFRAC.EVA. Quantitative XRD was determined by applying Rietveldt Refinement with the software GSAS and its graphical interface EXPGUI developed by the Los Alamos National Laboratory [40,41].
3. Results
3.1. Spectral Measurements
The mineral composition determined with the QXRD analyses are confirmed by the spectral signatures of the samples. The Gildehaus and Fontainebleau sandstone display the spectral features of quartz including the prominent reststrahlen doublet consisting of a left lobe (L) at ~8.3 µm and a right lobe (R) at ~9.1 µm (Figure 3a). In between is the characteristic and sharp 8.62 µm trough feature of quartz. The secondary quartz doublet is visible in the 12.3–13 µm region.
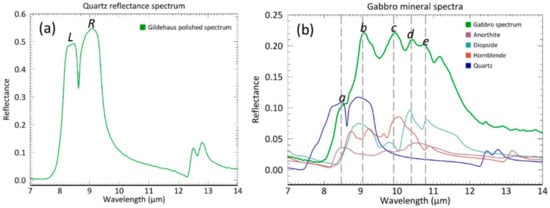
Figure 3.
(a) An example of a quartz reflectance spectrum with the Gildehaus polished spectrum. (b) Gabbro polished reflectance spectra, including the spectra of the minerals that contribute to the shape of the Gabbro spectral signature. Mineral spectra are from Johns Hopkins University (JHU) and can be found in the ASTER spectral library in ENVI [30].
The spectral signatures of the Gabbro (Figure 3b) contains a series of features between 8.5 and 12 µm containing multiple peaks at ~9 µm (b), from diopside, hornblende, and quartz, and ~10 µm (c) from hornblende. Furthermore, between 10 and 11.5 µm (d and e), two or three smaller peaks can be seen from diopside, anorthite and hornblende. A final recognizable spectral feature is located at 8.5 µm (a) from quartz and anorthite that can be best described as a shoulder in the left flank of the broad Gabbro feature. In the following sections we will discuss how the observed spectral shape and contrast is influenced by a changing surface roughness for each spectral method.
3.1.1. Directional-Hemispherical Reflectance (DHR) Spectra
The Gildehaus DHR spectra in Figure 4 show significant differences in spectral contrast for all spectral features. The split surface shows the lowest spectral contrast, followed by sawed and polished surfaces, that have increasingly higher reflectance values (Table 2). When we normalize the spectral contrast to the 0–1 reflectance range, the relative shape differences become more apparent and can be more easily compared (Figure 4b). The shape of the left lobe (L in Figure 3a) of this feature varies: The reflectance maximum within the left lobe occurs at long wavelengths for the polished surface spectrum, but is shifted to the shorter wavelength side for the sawed and split surface spectra.
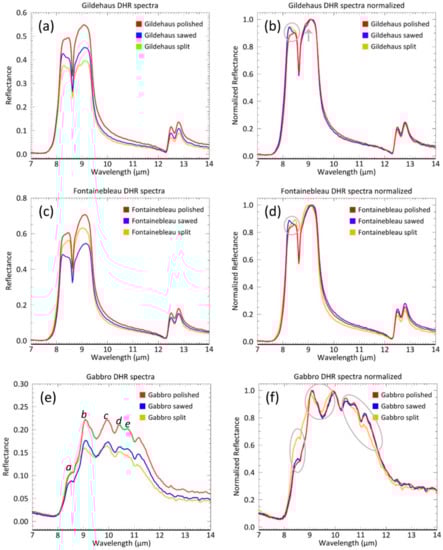
Figure 4.
Mean reflectance spectra and normalized mean reflectance spectra of the Gildehaus (a,b), Fontainebleau (c,d) and Gabbro (e,f) DHR measurements. Circles and arrow indicate spectral shape changes.
Table 2.
Reflectance maxima of DHR spectra.
Additionally, the right lobe (R in Figure 3a) of the split surface displays a kink at about 9 µm, which is not observed in the other DHR spectra.
The Fontainebleau DHR spectra in Figure 4c,d also show clear differences in spectral contrast for all spectral features. However, there are some distinct differences in comparison to the Gildehaus spectral features. First, the order of the three surfaces in their spectral contrast is different: the polished surface has the highest contrast; however, the split surface shows an intermediate spectral contrast in between the polished and the sawed surface (Table 2). Secondly, the left lobe of the reststrahlen quartz feature of the Fontainebleau split spectrum has a different orientation (reflectance maximum at longer wavelength) compared to the Gildehaus sandstone (reflectance maximum at shorter wavelengths).
The Gabbro DHR spectra shown in Figure 4e and f demonstrate a clear spectral contrast between the polished surface that has the highest reflectance and the sawed and split surfaces, which have a lower, but comparable, reflectance (Table 2). Hence, the overall order is the same as in the Gildehaus sandstone. Furthermore, the shape of the spectral features of the polished and the sawed surface correspond well, but the shape of the spectral features of the split surface is different from the other two surfaces. For the split surface, the peaks b (9 µm) and c (9.8 µm) shift to lower wavelengths by ~0.2 µm. Other observed changes are a lower reflectance for the right side of the reflectance feature (e and d, 11.2 µm) and the bulge of the broad spectral feature at a (8.5 µm), which increases in reflectance compared to both other surfaces.
3.1.2. Bidirectional Reflectance (BDR) Images
We calculated mean spectra for all image pixels of each sample surface to allow for comparison of the BDR image spectra to the DHR spectra. The spectral contrast trends identified in the DHR measurements are not reflected in the spectra of the BDR spectra. The following contrast trends could be identified for the BDR spectra (Table 3):
Table 3.
Reflectance maxima of BDR spectra.
- For the Gildehaus sandstone: Highest spectral contrast for the sawed surface, followed by the split and the polished surface.
- For the Fontainebleau sandstone: An equal spectral contrast for the sawed and the split surface followed by the polished surface.
- For the Gabbro: The highest spectral contrast for the split surface, followed by the sawed and the polished surface.
Figure 5 shows that the general shape of the surface mean spectra corresponds with the spectral signatures seen in the DHR measurements. However, both minor shape differences recognized in the DHR spectral signatures have now been lost and the BDR spectra are significantly smoother than the DHR spectra. Therefore, the change in orientation of the left lobe of the quartz feature in the sandstone spectra can no longer be distinguished. The Fontainebleau split spectrum displays a ~0.2 µm shift of both lobes to the center of the reststrahlen feature, which is not observed for the DHR spectrum. For the Gabbro sample, the differences in spectral shape identified between the split surface and the sawed and polished surfaces in DHR spectra are also visible in the BDR spectra, although less pronounced.
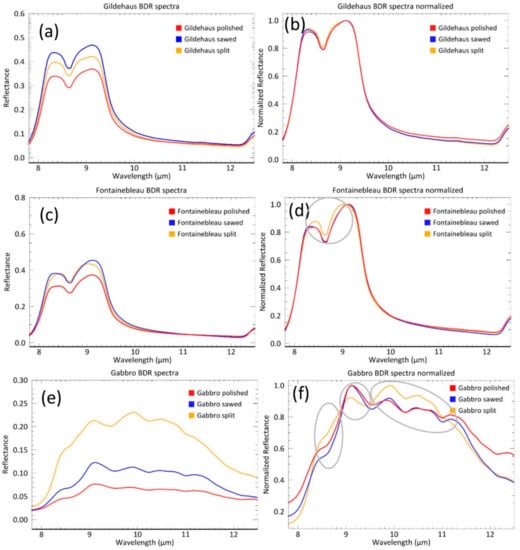
Figure 5.
Mean reflectance spectra and normalized mean reflectance spectra of the Gildehaus (a,b), Fontainebleau (c,d), and Gabbro (e,f) BDR measurements. Circles indicate spectral shape changes.
3.1.3. Emissivity Spectra
The Gildehaus, Fontainebleau, and Gabbro emissivity spectra (Figure 6) show the same patterns as observed and described for the DHR spectra. The trends in spectral contrast are also the same, although in some cases less pronounced (Table 4). This is seen with the Gildehaus split and sawed surface, and the Fontainebleau sawed and polished surface which both display an almost equal spectral contrast. The Fontainebleau split surface is, again, behaving differently than the expected trend. Its emissivity contrast is higher than both the Fontainebleau sawed and polished surface. Furthermore, it is higher than expected from the DHR spectra (where the Fontainebleau split was higher than the sawed surface, but lower than the polished surface).
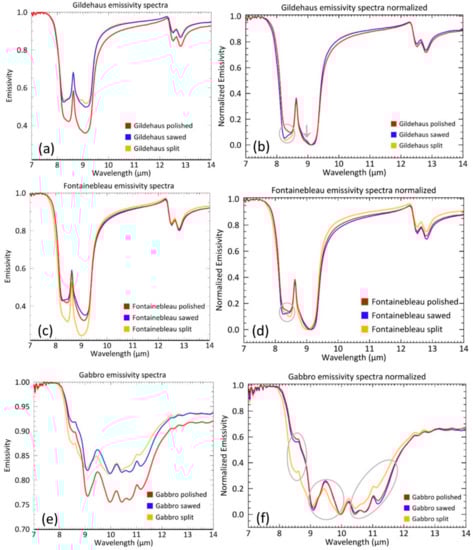
Figure 6.
Mean emissivity spectra and normalized mean emissivity spectra of the Gildehaus (a,b), Fontainebleau (c,d), and Gabbro (e,f) emissivity measurements. Circles and arrow indicate spectral shape changes.
Table 4.
Reflectance maxima of emissivity spectra.
3.2. Surface Analyses
3.2.1. Scanning Electron Microscopy
The scanning electron microscopy images show that the Gildehaus sandstone consists of ~99% subhedral quartz with a grain size of ~250 µm, ~1% of fine-grained (10 µm) intergranular kaolinite, and ~10% intergranular cavities (Figure 7a). Locally, the kaolinite can be seen in larger patches, up to 300 µm in diameter, filling up cavities in between the quartz grains (Figure 7b). The Fontainebleau sandstone is a pure quartz sandstone containing subhedral quartz mineral with a grain size of ~250 µm and ~20% intergranular cavities (Figure 7c). Zoom-ins show fine-grained (10 µm) quartz accumulates acting as a consolidator between the larger grains at their contact points (Figure 7d). The Gabbro has a grain size of 100 µm–1 mm that varies significantly, depending on the mineral type and the mineral orientation. Furthermore, no cavities can be observed. When comparing the various surfaces of the Gabbro, the split surface of the Gabbro has more fragmented and “flaky” grains as a result of splitting (Figure 7e). From the SEM images, no distinct differences in mineral abundance for the various surfaces could be identified.
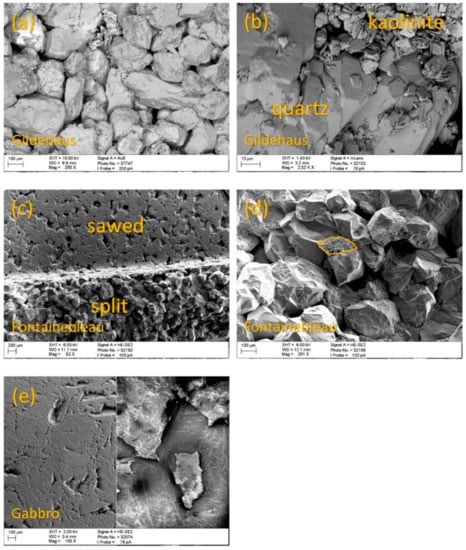
Figure 7.
SEM images of the Gildehaus, Fontainebleau, and Gabbro samples. (a) and (b) show the split surface of the Gildehaus sandstone at two different magnifications. (a) shows subhedrally shaped quartz grains and a significant number of cavities. At higher magnification (b) a fine-grained kaolinite fraction is visible in between the quartz grains. The kaolinite fraction was also identified in the images of the polished and sawed surface of the Gildehaus sandstone. (c) shows that the Fontainebleau sandstone contains subhedral to euhedral quartz grains. At higher magnification (d) fine-grained quartz accumulates (highlighted in yellow) become visible in between the larger quartz grains. The images show a significant number of cavities present at the surface. (e) shows the polished surface of the Gabbro imaged with the HE-SE2 (left) and the AsB (right). The image shows the surfaces of the Gabbro sample have no significant porosity.
3.2.2. Profilometer Analyses
The profilometer analyses provide surface roughness quantification with microscale digital elevation models including a topographic profile (Figure 8, Figure 9 and Figure 10) through the measured area and surface roughness parameters representing the total measured surface (Table 5).
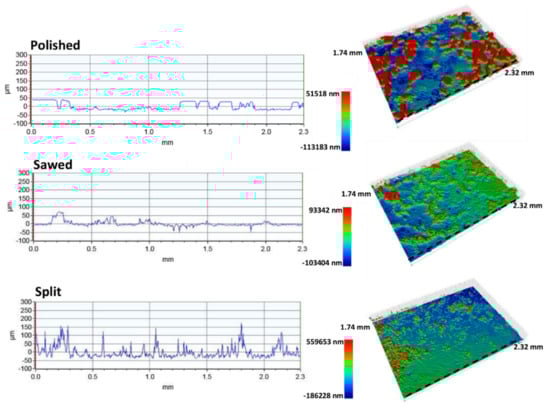
Figure 8.
Surface roughness profiles and corresponding 3D models of the polished, sawed, and split surfaces of the Gildehaus sandstone. Note that the 3D models have different topographic scales. Dashed line indicates location of the topographic profiles.
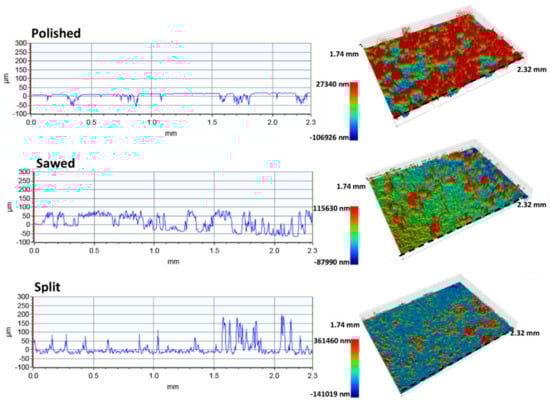
Figure 9.
Surface roughness profiles and corresponding 3D models of the polished, sawed, and split surfaces of the Fontainebleau sandstone. Note that the 3D models have different topographic scales. Dashed line indicates location of the topographic profiles.
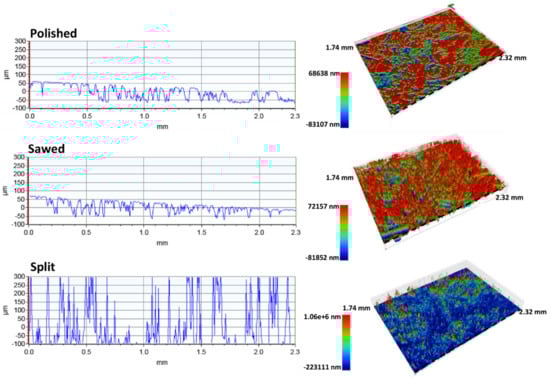
Figure 10.
Surface roughness profiles and corresponding 3D models of the polished, sawed, and split surfaces of the Gabbro. Note that the 3D models have different topographic scales. Dashed line indicates location of the topographic profiles.
Table 5.
Surface roughness parameter values in µm.
The surface roughness analyses of the Gildehaus polished surface shows some parts of the surface are completely smooth at microscale. However, cavities and deeper lying surfaces have not been smoothed out by the polishing process. The polished surface of the Gildehaus sandstone has an arithmetic average roughness (Ra) of 20.5 and a root-mean-square roughness (Rq) of 22.9 (Table 5). The Gildehaus sawed profile significant peaks are absent, and the sawed surface is flat, but not completely smooth, on the microscale. The sawed surface of the Gildehaus sandstone has a slightly less pronounced topography than the polished surface, with a Ra of 11.2 and a Rq of 17.1 (Table 5). The roughness parameters have been influenced by cavities and deeper lying areas that have not been in direct contact with the saw. The split surface has a significant topography compared to the other two surfaces with a Ra of 32.4 and a Rq of 50.1 (Table 5). This is confirmed by the surface profiles, which shows narrow peaks and valleys (Figure 8).
The surface roughness analyses of the Fontainebleau polished surfaces show this surface has a Ra of 17.3 and a Rq of 21.1 (Table 5) and is smooth except for some small cavities and deeper lying areas that are unaffected by the polishing. Significant peaks are absent. The sawed surface has the highest roughness values with a Ra of 33.1 and a Rq of 39.5 (Table 5). The peaks are higher, and there are many more cavities and valleys compared to the polished surface. This shows polishing of the surface has successfully eliminated peaks and significantly decreased the depth of cavities and valleys. Based on the Ra of 18.3, the split surface of the Fontainebleau sandstone has a less significant topography than the sawed surface. However, the Rq of 35.1 for the split surface is comparable to the Rq of the sawed surface (Table 5). The split surface consists of numerous narrow peaks, just as observed for the split surface of the Gildehaus sandstone (Figure 9).
The surface roughness analyses of the Gabbro polished and sawed surface show that they have an almost identical surface topography (Figure 10); the only difference is that the flat tops have been smoothed slightly as a result of polishing. Their roughness parameters are comparable, with an identical Ra of 28.9 and a Rq of 35.1 and 34.3 for the sawed and the polished surfaces, respectively (Table 5). The surface roughness profiles and 3D models confirm this. The split surface displays a significant surface topography with a Ra of 144.1 and a Rq of 200.7 and a distinct profile with peaks partially extending outside of the measuring range set for the surfaces.
4. Discussion
In this research we explored the effect of geological sample surface preparation on the TIR spectral signatures by applying three sample surface preparation methods on three sets of samples. We show that the resulting differences in surface roughness influence both the contrast and shape of the spectral signatures. As outlined in the introduction the surface roughness can be characterized with Rayleigh’s roughness criterion. The topographic profiles and roughness parameters we measured determine that all of our sample surfaces characterize as optically rough: the maximum height difference of the profiles exceeds 20 µm, indicating diffuse reflection is dominant in the studied range of the TIR. However, the topographic profiles also show that several surfaces display multiple scales of roughness: smooth “flat tops” with maximum topography differences of ~1–2 µm and rough areas in between the flat tops with topography differences of 10 to 150 µm. Hence, most surfaces will display both specular as well as diffuse reflection depending on the roughness of specific surface areas. We could not directly link any of the surface roughness parameters to the observed spectral contrast trends. This shows, that the applied sample preparation techniques do not always change the roughness parameters the expected way and that surface roughness alone is not an adequate measure for predicting spectral behavior.
4.1. Influence of Sample Preparation Method on Spectral Contrast
Based on the literature, we expect a trend from high spectral contrast for the polished surface, followed by the sawed surface to a low spectral contrast for the split surface. Most of our results confirm this trend. The DHR and emissivity spectra follow this trend with up to 25% lower reflectance values for a split surface. Note, however, that the Gabbro split spectral contrast is almost equal to the spectral contrast of Gabbro sawed, and the emissivity spectra display a less pronounced trend than the DHR spectra. An exception is the Fontainebleau split surface, which will be discussed in more detail later in this section.
We attribute the spectral contrast trends observed in the DHR and emissivity trends to an increasing cavity effect. Based on Kirchhoff’s law, as stated in the introduction, reflectance decreases as a result of an increasing cavity effect, but emissivity increases. This means that the DHR Gildehaus split and Fontainebleau sawed and split surfaces have been significantly influenced by the cavity effect resulting in a decreased spectral contrast [38]. This also explains why Gabbro split spectral contrast is almost equal to the spectral contrast of the Gabbro sawed. In the split topographic profile, narrow valleys are absent, indicating they are poor light traps due to their cavity entrance/depth ratios. Hence, a significant cavity effect is lacking and the relative spectral contrast of this surface is higher than expected. Furthermore, this also shows that the topographic roughness is not the only factor in determining whether a rough surface will display decreased spectral contrast.
The spectral contrast of the BDR measurements behaves differently from the DHR (and emissivity) trend and the BDR spectra are significantly smoother than the DHR spectra. We attribute the difference in observed spectral trend between the DHR and BDR spectra to the difference in measuring techniques. The DHR measurements are conducted with directional-hemispherical reflectance, using an integrating sphere ensuring that all reflection directions are captured and integrated, while the BDR images are measured bidirectional reflectance mode. Therefore, a significant portion of the signal can be lost, depending on the angle of incidence, the orientation of the sample surface and the direction of reflection. We link the difference in spectral smoothness to spectral oversampling in our BDR spectra, resulting in correlation of spectra from adjacent spectral bands [42]. This means small spectral changes, for example as a result of volume scattering, are not identified in the spectra recorded by our BDR imaging spectrometer setup. Furthermore, the significant averaging that is applied to obtain a single spectrum for each surface will have resulted in some smoothing as well.
The rough Fontainebleau split surface does not follow the trends observed for the other samples. It shows no signs of transmittance and has a significantly higher reflectance than the sawed surface, even though it displays a pronounced topography (Figure 9). The SEM image (Figure 7d) of the Fontainebleau split surface provides an explanation. It shows patches of small-grained quartz particles (~10 µm) in between the large quartz minerals. These fine-grained quartz particles are small enough to promote volume scattering, however, no signs of transmission are visible in the spectrum. We hypothesize that the splitting of the sample mainly exposed the large quartz grains, while the fine-grained quartz particles are found in the sample pores, invisible from the spectrometers. The result is a spectrum that represents the smooth surface of the subhedral to euhedral shape quartz grains that is comparable to the shape of the polished surface.
4.2. Influence of Sample Preparation Method on Spectral Shape
The results of our research also show that different sample preparation methods influence the spectral signature resulting in spectral shape changes. These changes can be observed across measuring techniques. For example, we can recognize the Gabbro split surface in the DHR, BDR, and emissivity spectra because of its distinct spectral features at identical wavelengths. In the discussion of the spectral contrast trends we saw that the DHR spectra provide the most consistent trends, therefore, we select the DHR spectra for a detailed discussion of the spectral shape changes.
If we translate what is known in literature about reflection behavior and volume scattering to our results we can explain the spectral changes observed in the DHR spectra. Several studies show that TIR spectral shape changes at specific wavelengths as a result of an increasing surface roughness can be linked to volume scattering and transmittance in specific minerals. [11,18,21,24]. Multiple groups confirm that increasing surface roughness causes transmittance in quartz which results in spectral shape changes at 8.5 µm [11,16,18]. Salisbury et al. [27] show that transmittance in quartz and kaolinite can result in spectral shape changes at 8.5 µm and 9 µm, respectively, which they attribute to fine particles (<5 µm). Furthermore, Salisbury et al. [26] show that with the spectral features of a fine-grained powdered quartz similar shape changes occur, although more pronounced. Osterloo et al. [21] show that increasing the surface roughness of a Gabbro will result in a decreased spectral contrast and spectral shape changes at 8.5 and 11.5 µm.
Hence, based on previous research, we attribute the DHR spectral shape changes to transmittance features at considerably weaker transmittance bands in the spectra (Figure 4) [16]. The Gildehaus polished spectrum (Figure 4b) does not show signs of transmittance. The Gildehaus sawed spectrum is affected by transmittance in quartz at 8.5 µm and the Gildehaus split spectrum is affected by transmittance in both quartz and kaolinite at 8.5 and 9 µm, respectively (Figure 4a,b). These transmittance features are likely the result of volume scattering caused by the presence of hyperfine particles or “clinging fines” (1–20 µm [16]). Both the Fontainebleau polished and split spectrum do not show signs of transmittance (Figure 4d), confirming the explanation provided for the high spectral contrast of the Fontainebleau split spectrum: the spectrum represents the smooth natural surfaces of the large quartz grains, while the fine-grained quartz accumulates are not detected. This prevents volume scattering and eliminates the accompanying loss of energy. The Fontainebleau sawed spectrum indicates transmittance resulting from volume scattering in fine-grained quartz particles (Figure 4d), that potentially originate from sawing the sample and have not been removed with the cleaning process.
The Gabbro polished and sawed spectra have a similar spectral shape (Figure 4f), which can be attributed to their almost identical topographic profiles. For the Gabbro split spectra we observed several spectral shape changes, which are more complex than observed for the sandstones. We observe spectral shape changes at 8.5, 9.6 and between 11 and 12 µm. The following discussion merely proposes mechanisms and processes to explain the observed shape changes of the Gabbro. However, with the dataset presented here we cannot conclusively link any of these processes to the observed changes. We link the increase in reflectance of the Gabbro split surface at 8.5 µm to an increased angle of the surface with respect to the nadir, which results in a decreased emissivity and an accompanying increased reflectance (based on Kirchhoff’s law) [16]. Maturilli et al. [43] show that increasing the viewing angle for a basalt slab results in a decreased emissivity at 8.5 µm. Since the Gabbro split has a much more pronounced topography than the other surfaces this seems to be a valid explanation of the observed spectral reflectance increase at 8.5 µm. The other observed shape changes could be explained by transmittance in fine particles as observed for the sandstones (Figure 4b,d). However, the Gabbro is a multi-mineral sample and different minerals interact differently with light depending on their wavelength-dependent refractive index n and extinction coefficient k [18]. Hence, for spectral region with a large k, the ratio of k to n will be large, therefore, a significant amount of energy will be reflected, and strong surface reflectance occurs. However, for rough or finely particulate surfaces, multiple surface reflections occur in multiple directions. Hence, even though k is large, a small fraction of energy is transmitted into the grain with each energy interaction. The result is a decrease in the measured reflection, even within the spectral region where the k/n is largest for that mineral [18,44]. Hence, the decrease in reflectance at 11 to 12 µm can be caused by fine-grained particles that result in multiple reflections and a decrease of the reflected energy, although we cannot link it to a specific mineral.
Another mechanism that could explain the observed spectral shape changes is that we are not only looking at differences in shape but also at differences in mineral abundance at the sample surface. This would mean that splitting the Gabbro sample exposes different minerals than sawing or polishing; assuming that splitting will occur through the minerals with the least resistance. The result is an overrepresentation of the weaker minerals at the split surface. To determine which minerals are weakest, we review the mineral hardness in Mohs’ Scale. Diopside and hornblende have a lower hardness than anorthite and quartz, hence if splitting influences mineral abundance as a result of hardness, diopside and hornblende will be overrepresented. If this mechanism is responsible for the Gabbro split spectral shape, extensive ultrasonic cleaning will not change the shape of the spectral signature. Furthermore, to prove the overrepresentation of weaker minerals at the surface this will need to be confirmed with spectral unmixing of the Gabbro spectra.
4.3. Practical Implications
Our results show that sample surface preparation as well as the applied spectroscopy method influence the shape and contrast of the TIR spectrum. The DHR and emissivity spectra suggest that increasing surface roughness promotes both volume scattering and the cavity effect. Furthermore, the BDR spectra show that the applied spectroscopy method can have a significant influence on the spectral contrast trend and the spectral smoothing of the spectra, which can eliminate the majority of the spectral shape changes identified in spectra from other methods. Hence, spectral trends can conflict for different spectrometers and care must be taken when comparing spectra of various spectrometers. Additionally, the results presented here are from homogeneous samples with a simple modal mineralogy and a uniform mineral distribution. More complex samples that display for example mineral trends, preferred mineral orientations or a diverse range of grain sizes will complicate the identification of the surface roughness effect. Hence, with TIR drill core logging instrumentation, the influences from differences in sample preparation and spectroscopy method need to be eliminated by selecting suitable methods based on the sample complexity, the number of samples, and the targeted spectral and spatial resolution. This means that for samples with a simple mineralogy that are not analyzed in great detail, splitting or sawing the sample is sufficient and spectra of different spectrometers can be compared, while samples with a complex mineral trend demand to be subjected to identical sample preparation methods and measured with the same spectroscopy method. To eliminate the effect the absolute reflectance trends we suggest normalizing the spectra. To identify and correct the transmittance features that we suggest the development of models that include both reflectance and transmittance endmembers. However, the effect of surface roughness also creates opportunities. For example, the spectral shape and contrast trends can be used to determine the relative surface roughness of samples. Furthermore, a specific sample preparation method could be selected to improve identification of (ultra)fine fractions in the spectral signature, such as kaolinite in the Gildehaus sandstone.
Furthermore, if we translate our results to extraterrestrial exploration and planetary surfaces we can state that secondary sample features are an important factor in the use and interpretation of extraterrestrial spectral data. This means that for areas were little is known about the surface and atmospheric conditions (e.g., dust), these seemingly minor sample characteristics can have a great influence and be an obstacle for the spectral interpretation. On the other hand, they can also be applied as a tool to obtain more information about the planetary surfaces we investigate, such as dust cover, grain size or surface (micro)topography.
5. Conclusions
This research explores the effect of geological sample surface preparation on the TIR spectral signatures. The results show that different sample surface preparation methods result in differences in surface roughness that are significant enough to affect the spectral signature. The influence of the surface roughness is two-fold, one effect is a changing spectral shape, and the other is a varying spectral contrast. The first effect is consistent for each applied spectrometry method (DHR, BDR and emissivity), while the second effect is more variable depending on the measuring technique.
Our results show that optically smooth polished surfaces display the highest reflectance, while optically rough sawed and split surfaces display reflectance values that are up to 25% lower. Furthermore, the sawed and split surfaces display shape changes of the spectral signature at specific wavelength bands, which we link to transmittance bands of the minerals present in the sample, surface orientation effects and multiple reflections in fine-grained minerals. The trends in spectral contrast that we measured suggest that surface roughness promotes the cavity effect which reduces reflectance and increases emissivity. However, surfaces with a pronounced topography do not always display a significant cavity effect, as shown by the Gabbro split sample, which we attribute to a small cavity depth/width ratio preventing sufficient trapping of light.
Hence, even though the effect appears small, the influence of sample surface preparation should not be underestimated, and a suitable sample preparation needs to be selected to ensure that the geological interpretation is not influenced, especially when working with laboratory-based TIR spectroscopy. This means that for samples with a homogeneous mineral distribution and grain size that are analyzed at a resolution of five centimeters or more, splitting or sawing the sample is sufficient and spectra of different spectrometers can be compared. While samples that contain a complex mineral trend, that display for example a preferred mineral orientations or a diverse range of grain sizes, demand to be subjected to identical sample preparation and measured with the same spectroscopy method, to avoid spectral changes.
Author Contributions
All authors (E.R., C.H., M.C.S. and F.D.v.d.M.) discussed the obtained results and revised and edited the manuscript. Conceptualization: E.R., C.H., M.C.S., and F.D.v.d.M.; methodology: E.R., C.H., M.C.S., and F.M.; software: E.R. and C.H.; validation: E.R., C.H., M.C.S., and F.D.v.d.M.; formal analysis: E.R.; investigation: E.R.; resources: E.R., C.H., M.C.S., and F.D.v.d.M.; writing—original draft preparation: E.R.; writing—review and editing: E.R., C.H., M.C.S., and F.D.v.d.M.; visualization: E.R.; supervision: C.H., M.C.S., and F.D.v.d.M.
Funding
This research received no external funding
Acknowledgments
The authors would like to thank the anonymous reviewers, whose comments and suggestions helped to greatly improve this document. The authors would like to thank Andrew Green from CSIRO for his constructive and useful feedback on the first draft of this paper, which we greatly appreciated. We thank Caroline Lievens for her support and academic advice during our work in the geoscience laboratory of the University of Twente and Harald van der Werff for performing quantification of our XRD results with the assistance from Fiorenza Deon from the Delft University of Technology. The authors would like to thank Mark Smithers (SEM) and Huib van Vossen (profilometer) from the MESA+ Institute for Nanotechnology, University of Twente for their support.
Conflicts of Interest
The authors declare no conflict of interest
References
- Lyon, R.J.P.; Tuddenham, W.M.; Thompson, C.S. Quantitative mineralogy in 30 minutes. Econ. Geol. 1959, 54, 1047–1055. [Google Scholar] [CrossRef]
- Lyon, R.J.P.; Burns, E.A. Analysis of rocks and minerals by reflected infrared radiation. Econ. Geol. 1963, 58, 274–284. [Google Scholar] [CrossRef]
- Hunt, G.R. Visible and near-infrared spectra of minerals and rocks: I silicate minerals. Mod. Geol. 1970, 1, 283–300. [Google Scholar]
- Hunt, G.R.; Salisbury, J.W.; Lenhoff, C.J. Visible and near infrared spectra of minerals and rocks: IX. Basic and ultrabasic igneous rocks. Mod. Geol. 1974, 5, 15–22. [Google Scholar]
- Hunt, G.R.; Salisbury, J.W. Mid-Infrared Spectral Behavior of Metamorphic Rocks; Air Force Cambrigde Research Labs Hanscom AFB: Bedford MA, USA, 1976. [Google Scholar]
- Lyon, R.J.P. Analysis of rocks by spectral infrared emission (8 to 25 microns). Econ. Geol. 1965, 60, 715–736. [Google Scholar] [CrossRef]
- Vincent, R.K.; Hunt, G.R. Infrared reflectance from mat surfaces. Appl. Opt. 1968, 7, 53–59. [Google Scholar] [CrossRef] [PubMed]
- Riley, D.N.; Hecker, C.A. Mineral mapping with airborne hyperspectral thermal infrared remote sensing at Cuprite, Nevada, USA. In Thermal Infrared Remote Sensing; Springer: Dordrecht, The Netherlands, 2013; pp. 495–514. [Google Scholar]
- Kuosmanen, V.; Arkimaa, H.; Tiainen, M.; Bärs, R. Hyperspectral close-range LWIR imaging spectrometry–3 case studies. In Geophysical Signatures of Mineral Deposit Types in Finland; Airo, M.-L., Ed.; Geological Survey of Finland: Espoo, Finland, 2015; Volume 58, pp. 117–144. [Google Scholar]
- Martini, B.A. Personal communication 2017. Corescan Pty Ltd.: Denver, CO, USA.
- Salisbury, J.W.; Walter, L.S. Thermal infrared (2.5–13.5 µm) spectroscopic remote sensing of igneous rock types on particulate planetary surfaces. J. Geophys. Res. Solid Earth 1989, 94, 9192–9202. [Google Scholar] [CrossRef]
- Lyon, R.J.P. Evaluation of infrared Spectrophotometry for Composition Analysis Lunar and Planetary Soils: Rough and Powdered Surfaces; Stanford Research Institute: Menlo Park, CA, USA, 1964; Part I1, Contract NASR 49. [Google Scholar]
- Hunt, G.R.; Logan, L.M. Variation of single particle mid-infrared emission spectrum with particle size. Appl. Opt. 1972, 11, 142–147. [Google Scholar] [CrossRef] [PubMed]
- Salisbury, J.W.; Eastes, J.W. The effect of particle size and porosity on spectral contrast in the mid-infrared. Icarus 1985, 64, 586–588. [Google Scholar] [CrossRef]
- Salisbury, J.W.; Walter, L.S.; Vergo, N. Mid-Infrared (2.1–25 um) Spectra of Minerals; US Geological Survey: Reston, VA, USA, 1987; pp. 87–263. [Google Scholar]
- Salisbury, J.W.; D’Aria, D.M. Emissivity of terrestrial materials in the 3–5 μm atmospheric window. Remote Sens. Environ. 1994, 47, 345–361. [Google Scholar] [CrossRef]
- Schodlok, M.C.; Whitbourn, L.; Huntington, J.; Mason, P.; Green, A.; Berman, M.; Coward, D.; Conner, P.; Wright, W.; Jolivet, M.; et al. HyLogger-3, A visible to shortwave and thermal infrared reflectance spectrometer system for drill core logging: Functional description. Aust. J. Earth Sci. 2016, 63, 929–940. [Google Scholar]
- Hardgrove, C.J.; Rogers, A.D.; Glotch, T.D.; Arnold, J.A. Thermal emission spectroscopy of microcrystalline sedimentary phases: Effects of natural surface roughness on spectral feature shape. J. Geophys. Res. Planets 2016, 121, 542–555. [Google Scholar] [CrossRef]
- Kirkland, L.; Herr, K.; Keim, E.; Adams, P.; Salisbury, J.; Hackwell, J.; Treiman, A. First use of an airborne thermal infrared hyperspectral scanner for compositional mapping. Remote Sens. Environ. 2002, 80, 447–459. [Google Scholar] [CrossRef]
- Ramsey, M.S.; Fink, J.H. Estimating silicic lava vesicularity with thermal remote sensing: A new technique for volcanic mapping and monitoring. Bull. Volcanol. 1999, 61, 32–39. [Google Scholar] [CrossRef]
- Osterloo, M.M.; Hamilton, V.E.; Anderson, F.S. A laboratory study of the effects of roughness on the thermal infrared spectra of rock surfaces. Icarus 2012, 220, 404–426. [Google Scholar] [CrossRef]
- Bedford, R.E.; Ma, C.K.; Chu, Z.; Sun, Y.; Chen, S. Emissivities of diffuse cavities. 4: Isothermal and nonisothermal cylindro-inner-cones. Appl. Opt. 1985, 24, 2971–2980. [Google Scholar] [CrossRef] [PubMed]
- Giancoli, D.C. Physics: Principles with Applications; Pearson: Nerw York, NY, USA, 2005. [Google Scholar]
- Kirkland, L.E.; Herr, K.C.; Adams, P.M. Infrared stealthy surfaces: Why TES and THEMIS may miss some substantial mineral deposits on Mars and implications for remote sensing of planetary surfaces. J. Geophys. Res. Planets 2003, 108. [Google Scholar] [CrossRef]
- Aronson, J.R.; Emslie, A.G. Spectral reflectance and emittance of particulate materials. 2: Application and results. Appl. Opt. 1973, 12, 2573–2584. [Google Scholar] [CrossRef] [PubMed]
- Salisbury, J.W.; Wald, A. The role of volume scattering in reducing spectral contrast of reststrahlen bands in spectra of powdered minerals. Icarus 1992, 96, 121–128. [Google Scholar] [CrossRef]
- Salisbury, J.W.; Wald, A.; D’Aria, D.M. Thermal-infrared remote sensing and Kirchhoff’s law: 1. Laboratory measurements. J. Geophys. Res. Solid Earth 1994, 99, 11897–11911. [Google Scholar] [CrossRef]
- Fraden, J. AlP Handbook of Modern Sensors; American Institute of Physics, Springer: New York, NY, USA, 1993. [Google Scholar]
- Hapke, B. Theory of Reflectance and Emittance Spectroscopy; Cambridge University Press: Cambrige, UK, 1993. [Google Scholar]
- Baldridge, A.M.; Hook, S.J.; Grove, C.I.; Rivera, G. The ASTER Spectral Library Version 2.0. Remote Sens. Environ. 2009, 113, 711–715. [Google Scholar] [CrossRef]
- Salisbury, J.W.; D’Aria, D.M. Emissivity of terrestrial materials in the 8–14 μm atmospheric window. Remote Sens. Environ. 1992, 42, 83–106. [Google Scholar] [CrossRef]
- Bourbie, T.; Zinszner, B. Hydraulic and acoustic properties as a function of porosity in Fontainebleau sandstone. J. Geophys. Res. Solid Earth 1985, 90, 11524–11532. [Google Scholar] [CrossRef]
- Reyer, D.; Philipp, S.L. Empirical relations of rock properties of outcrop and core samples from the Northwest German Basin for geothermal drilling. Geotherm. Energy Sci. 2014, 2, 21–37. [Google Scholar] [CrossRef]
- Hecker, C.; Hook, S.; Meijde, M.V.D.; Bakker, W.; Werff, H.V.D.; Wilbrink, H.; van Ruitenbeek, F.; de Smeth, B.; van der Meer, F. Thermal infrared spectrometer for earth science remote sensing applications—Instrument modifications and measurement procedures. Sensors 2011, 11, 10981–10999. [Google Scholar] [CrossRef] [PubMed]
- Hecker, C.; Dilles, J.H.; Meijde, M.; Meer, F.D. Thermal infrared spectroscopy and partial least squares regression to determine mineral modes of granitoid rocks. Geochem. Geophys. Geosyst. 2012, 13. [Google Scholar] [CrossRef]
- Korb, A.R.; Dybwad, P.; Wadsworth, W.; Salisbury, J.W. Portable Fourier transform infrared spectroradiometer for field measurements of radiance and emissivity. Appl. Opt. 1996, 35, 1679–1692. [Google Scholar] [CrossRef] [PubMed]
- Reichelt, R. Scanning electron microscopy. In Science of Microscopy; Springer: New York, NY, USA, 2007; pp. 133–272. [Google Scholar]
- Dong, W.P.; Sullivan, P.J.; Stout, K.J. Comprehensive study of parameters for characterizing three-dimensional surface topography: IV: Parameters for characterizing spatial and hybrid properties. Wear 1994, 178, 45–60. [Google Scholar] [CrossRef]
- Dinnebier, R.E.; Billinge, S.J.L. (Eds.) Powder Diffraction: Theory and Practice; Royal Society of Chemistry: London, UK, 2008. [Google Scholar]
- Larson, A.C.; Von Dreele, R.B. Gsas. General Structure Analysis System; LANSCE: Los Alamos, NM, USA, 1994. [Google Scholar]
- Toby, B.H. EXPGUI, a graphical user interface for GSAS. J. Appl. Crystallogr. 2001, 34, 210–213. [Google Scholar] [CrossRef]
- Hunt, S.D.; Sierra, H. Spectral oversampling in hyperspectral imagery. In Algorithms and Technologies for Multispectral, Hyperspectral, and Ultraspectral Imagery IX. Int. Soc. Opt. Photonics 2003, 5093, 643–651. [Google Scholar]
- Maturilli, A.; Helbert, J.; Ferrari, S.; D’Amore, M. On the effect of emergence angle on emissivity spectra: Application to small bodies. Earth Planets Space 2016, 68, 84. [Google Scholar] [CrossRef]
- Mustard, J.F.; Hays, J.E. Effects of hyperfine particles on reflectance spectra from 0.3 to 25 μm. Icarus 1997, 125, 145–163. [Google Scholar] [CrossRef]
© 2018 by the authors. Licensee MDPI, Basel, Switzerland. This article is an open access article distributed under the terms and conditions of the Creative Commons Attribution (CC BY) license (http://creativecommons.org/licenses/by/4.0/).