Article

Na-Montmorillonite Edge Structure and Surface Complexes: An Atomistic Perspective

1
Department of Geology, Kangwon National University, Chuncheon 24341, Korea
2
Critical Zone Frontier Research Laboratory (CFRL), Kangwon National University, Chuncheon 24341, Korea
*
Author to whom correspondence should be addressed.
Minerals 2017, 7(5), 78; https://doi.org/10.3390/min7050078
Submission received: 3 April 2017 / Revised: 6 May 2017 / Accepted: 8 May 2017 / Published: 12 May 2017
(This article belongs to the Special Issue Computational Geochemistry)

Abstract

:
The edges of montmorillonite (MMT) react strongly with metals and organic matter, but the atomic structure of the edge and its surface complexes are not unambiguous since the experimental isolation of the edge is challenging. In this study, we introduce an atomistic model of a Na MMT edge that is suitable for classical molecular dynamics (MD) simulations, in particular for the B edge, a representative edge surface of 2:1 phyllosilicates. Our model possesses the surface groups identified through density functional theory (DFT) geometry optimizations performed with variation in the structural charge deficit and Mg substitution sites. The edge structure of the classical MD simulations agreed well with previous DFT-based MD simulation results. Our MD simulations revealed an extensive H-bond network stabilizing the Na-MMT edge surface, which required an extensive simulation trajectory. Some Na counter ions formed inner-sphere complexes at two edge sites. The stronger edge site coincided with the exposed vacancy in the dioctahedral sheet; a weaker site was associated with the cleaved hexagonal cavity of the tetrahedral sheet. The six-coordinate Na complexes were not directly associated with the Mg edge site. Our simulations have demonstrated the heterogeneous surface structures, the distribution of edge surface groups, and the reactivity of the MMT edge.

Graphical Abstract

1. Introduction

Smectite minerals, common products of the weathering and low-temperature hydrothermal alteration of primary minerals, are omnipresent in the environment with an outsized role in the fate and transport of soil solution solutes. This significant role is due to the highly specific surface area that is a consequence of the nanometer thickness (~1.0 nm) of these layered 2:1 phyllosilicate minerals. Montmorillonite (MMT), a subgroup of smectite minerals, is comprised of an Al sheet between two Si sheets arranged into tetrahedral-octahedral-tetrahedral (TOT) layers. In MMT, more than 50% of the permanent negative charge (0.2–0.6 per formula unit) originates from substitutions of divalent cations (e.g., Mg2+ or Fe2+) for Al3+ in the octahedral sheet [1]. Counter ions balance this permanent charge in the interlayer nanopores. The hydration of these interlayer cations and osmotic pressure results in the swelling of the smectite layers. The permanent negative charge imparts significant cation exchange capacity to the MMT layers. These physicochemical properties of the MMT interlayer have been used to great advantage in engineered barriers [2,3,4], nanocomposite materials [5,6,7], and pharmaceutical and biomedical applications [8].
The edges of 2:1 phyllosilicate minerals are no less important to their reactivity, despite being a much smaller fraction of the total surface area. The edges of these clay nanosheets are a source of variable charge in soils and an important sorption site for cations, anions, and any sorbates too large to cross the boundary from the neighboring mesopore into the interlayer nanopore, such as soil organic matter [1,9]. A comprehensive understanding of the clay edge is challenging as this small fraction of the total surface area is difficult to isolate experimentally and the edge face is highly disordered. The choice of a non- or low-swelling clay mineral combined with the careful manipulation of the experimental pH and ionic strength has been used in sorption studies to discriminate between clay edge and interlayer sorption [10,11,12,13]. A surface complexation model of sorption that treated both the permanent structural and variable charge has proved successful in modeling sorption to MMT by employing a general description of the edge sorption sites [14]. This 2 Site Protolysis Non Electrostatic Surface Complexation and Cation Exchange (2 SPNESC/CE) model discriminates between strong and weak energy sites at the MMT edges. Extended X-ray absorption fine structure (EXAFS) spectroscopy has been used to isolate a strong edge sorption site in the plane of the octahedral sheet at low-loadings but was unable to resolve the weak reactive edge sites at higher sorbate loadings [15]. These experimental protocols and surface complex models can provide a spatially-averaged perspective of edge surface sorption based on the reporting unit queried experimentally. However, these experimental methods cannot provide sufficient resolution for a true atomic-scale description of individual features of the edge surface. Increasingly, atomistic simulations are employed to address this limitation of experimental methods as they afford a detailed atomistic description of the clay edge.
An accurate atomic structure of the 2:1 edge face was first proposed by White and Zelazny [16], who used crystal growth theory [17] to identify three periodic bond chains (PBCs) that are parallel to the edges of 2:1 dioctahedral phyllosilicates. Two of these PBCs are symmetrically equivalent, and one is unique. These PBCs are composed of linked tetrahedron-octahedron-tetrahedron (TOT) units. White and Zelazny [16] chose to refer to the PBCs according to the center of symmetry across which the tetrahedra are attached to the octahedron. We preserve this nomenclature and refer to the symmetrically equivalent PBCs as the AC edge and the unique PBC as the B edge. These edge structures have been the initial configuration for atomistic simulations of the 2:1 clay edge at both the quantum mechanical (QM) and molecular mechanical (MM) levels of theory. Many QM simulations have been used for a detailed characterization of the 2:1 edge structures, surface energies, acid-base reactivity, and cationic surface complexes [18,19,20,21,22,23,24,25,26,27]. These simulations are the most theoretically rigorous available, but the theoretical rigor comes with high computational costs that limit the model size and the duration of any QM-based molecular dynamics (MD) simulations. Constraints on model size often result in structures that do not sufficiently isolate the surface groups or clay edges from one another. By trading some theoretical rigor for computational efficiency, MM simulations can employ larger models of the clay edge that isolate the edges and explore extended time-scales. The increased computational efficiency is achieved through the simplification of interatomic interactions to a set of pair-wise potentials, referred to as a force field, that are parameterized by using experimental or QM results. With a thoughtful simulation design, the advantages of individual QM and MM simulations can be leveraged for a comprehensive understanding of the 2:1 clay edges.
MM simulations of clay mineral edges, however, have been hampered by the lack of validated force fields for the mineral edges. While the development of reliable force fields for clay mineral edges is an ongoing research topic in the computational chemistry community, a recent classical molecular dynamics (MD) simulation study [28] demonstrated that the edge structures can be described within a reasonable accuracy by using the Clayff force field [29], a force field widely used in the research of interlayer or basal surfaces of clay minerals. The classical MD simulations not only reproduced the main edge structrual features obtained by QM-based MD simulations but also offered evidence for defect structures at the pyrophyllite AC edge, denoted as Edelman Favejee (EF) [30] defects by the authors who first proposed a similar structure for 2:1 smectites. Defects may play an important role in surface reactivity, but defects at the clay mineral edges have not been discussed yet. Our atomistic thermodynamics study based on density functional theory (DFT) [31] tested the thermodynamics stability of the EF defects and showed that the defects on the pyrophyllite AC edge are feasible at water chemical potentials and temperatures at which the pyrophyllite B edge would exist. Recently, our classical MD simulations [32] using Clayff explored the effects of layer charge arising from isomorphic substitutions in the octahedral layer on the AC edge of MMT by employing DFT models with different layer charges. The simulations demonstrated the correlation between local charge deficits in the octahedral layer and coordination of Al and Mg at the AC edge. The presence of local charge deficits increased the disorder of the edge Al polyhedra relative to the unsubstituted MMT AC edges, including five- and four-fold coordination with O and EF defects at the edge.
In the present study, we extend our previous simulations to the B edge of Na-MMT. We develop a model of the edge informed by the energetics, edge surface groups, and partial charges from DFT geometry-optimized MMT edge structures suitable for classical MD simulations. Based on this model, our classical MD simulations provide a detailed characterization of the edge structure, the interfacial hydrogen bond network, and edge sorption sites as influenced by isomorphic substitutions in the octahedral sheet.

2. Materials and Methods

2.1. Molecular Dynamics Simulations

The atomistic model of the Na-montmorillonite (Na-MMT) edge was derived from a previous model of the pyrophyllite edge, with the details of that model described elsewhere [28]. The B edge surface model was created from a 4 × 4 × 2 (a × b × c) expansion of the atomic coordinates of the pyrophyllite-1M unit cell [33]. The octahedral sheet of this 2:1 phyllosilicate unit cell is trans-vacant (i.e., the two cis-sites, where the anionic positions are shared along an octahedral edge, are occupied; Figure 1). The B edge structure is created by cleavage of the monoclinic cell along the (010) plane. A hydrated 60 Å pore was created perpendicular to the B edge faces; the opposing edge interfaces are separated across the bulk by approximately 30 Å. The simulation cell c dimension was expanded to 30.6 Å, and the two MMT layers were distributed equally in the c direction to accommodate a hydrated bi-layer in the two interlayer spaces. The initial monoclinic simulation cell geometry was a = 20.84, b = 94.29 Å, c = 30.64 Å, α = 90.00°, β = 100.46°, and γ = 90.00°.
The unsaturated bonds of the edge surface are healed through the chemi- and physi-sorption of an integer number of water molecules to maintain the surface at the point of zero net proton charge (p.z.n.p.c.). The two unsaturated surface Si per TOT unit were healed with one chemisorbed water molecule (i.e., ≡SiO–H + ≡Si–OH). The unsaturated octahedron of each TOT unit is healed with one physisorbed water molecule. Unlike the DFT-based molecular dynamics (DFT-MD), wherein energetically unfavorable initial distributions of physi- and chemi-sorbed water molecules may result in a re-distribution of protons amongst the surface oxygen [20,24,34], classical mechanical simulations must proceed from surface structures chosen a priori; the initial surface configuration was created based on our DFT geometry optimization results. The force fields used in classical mechanical simulation assign an atom type to each atom in the molecular structure based on the chemical element of the atom and its coordination environment. We have chosen atom type assignments for the B edge surface groups such that no new atom types or revisions of partial charges reported for bulk clay minerals [29] are necesssary. Surface coordinated –OH groups are assigned parameters consistent with the partial charges, short-range potentials, and harmonic bonds of the hydroxyl oxygen and hydrogen atom types; the atoms of surface coordinated water molecules are identical to the bulk water molecules.
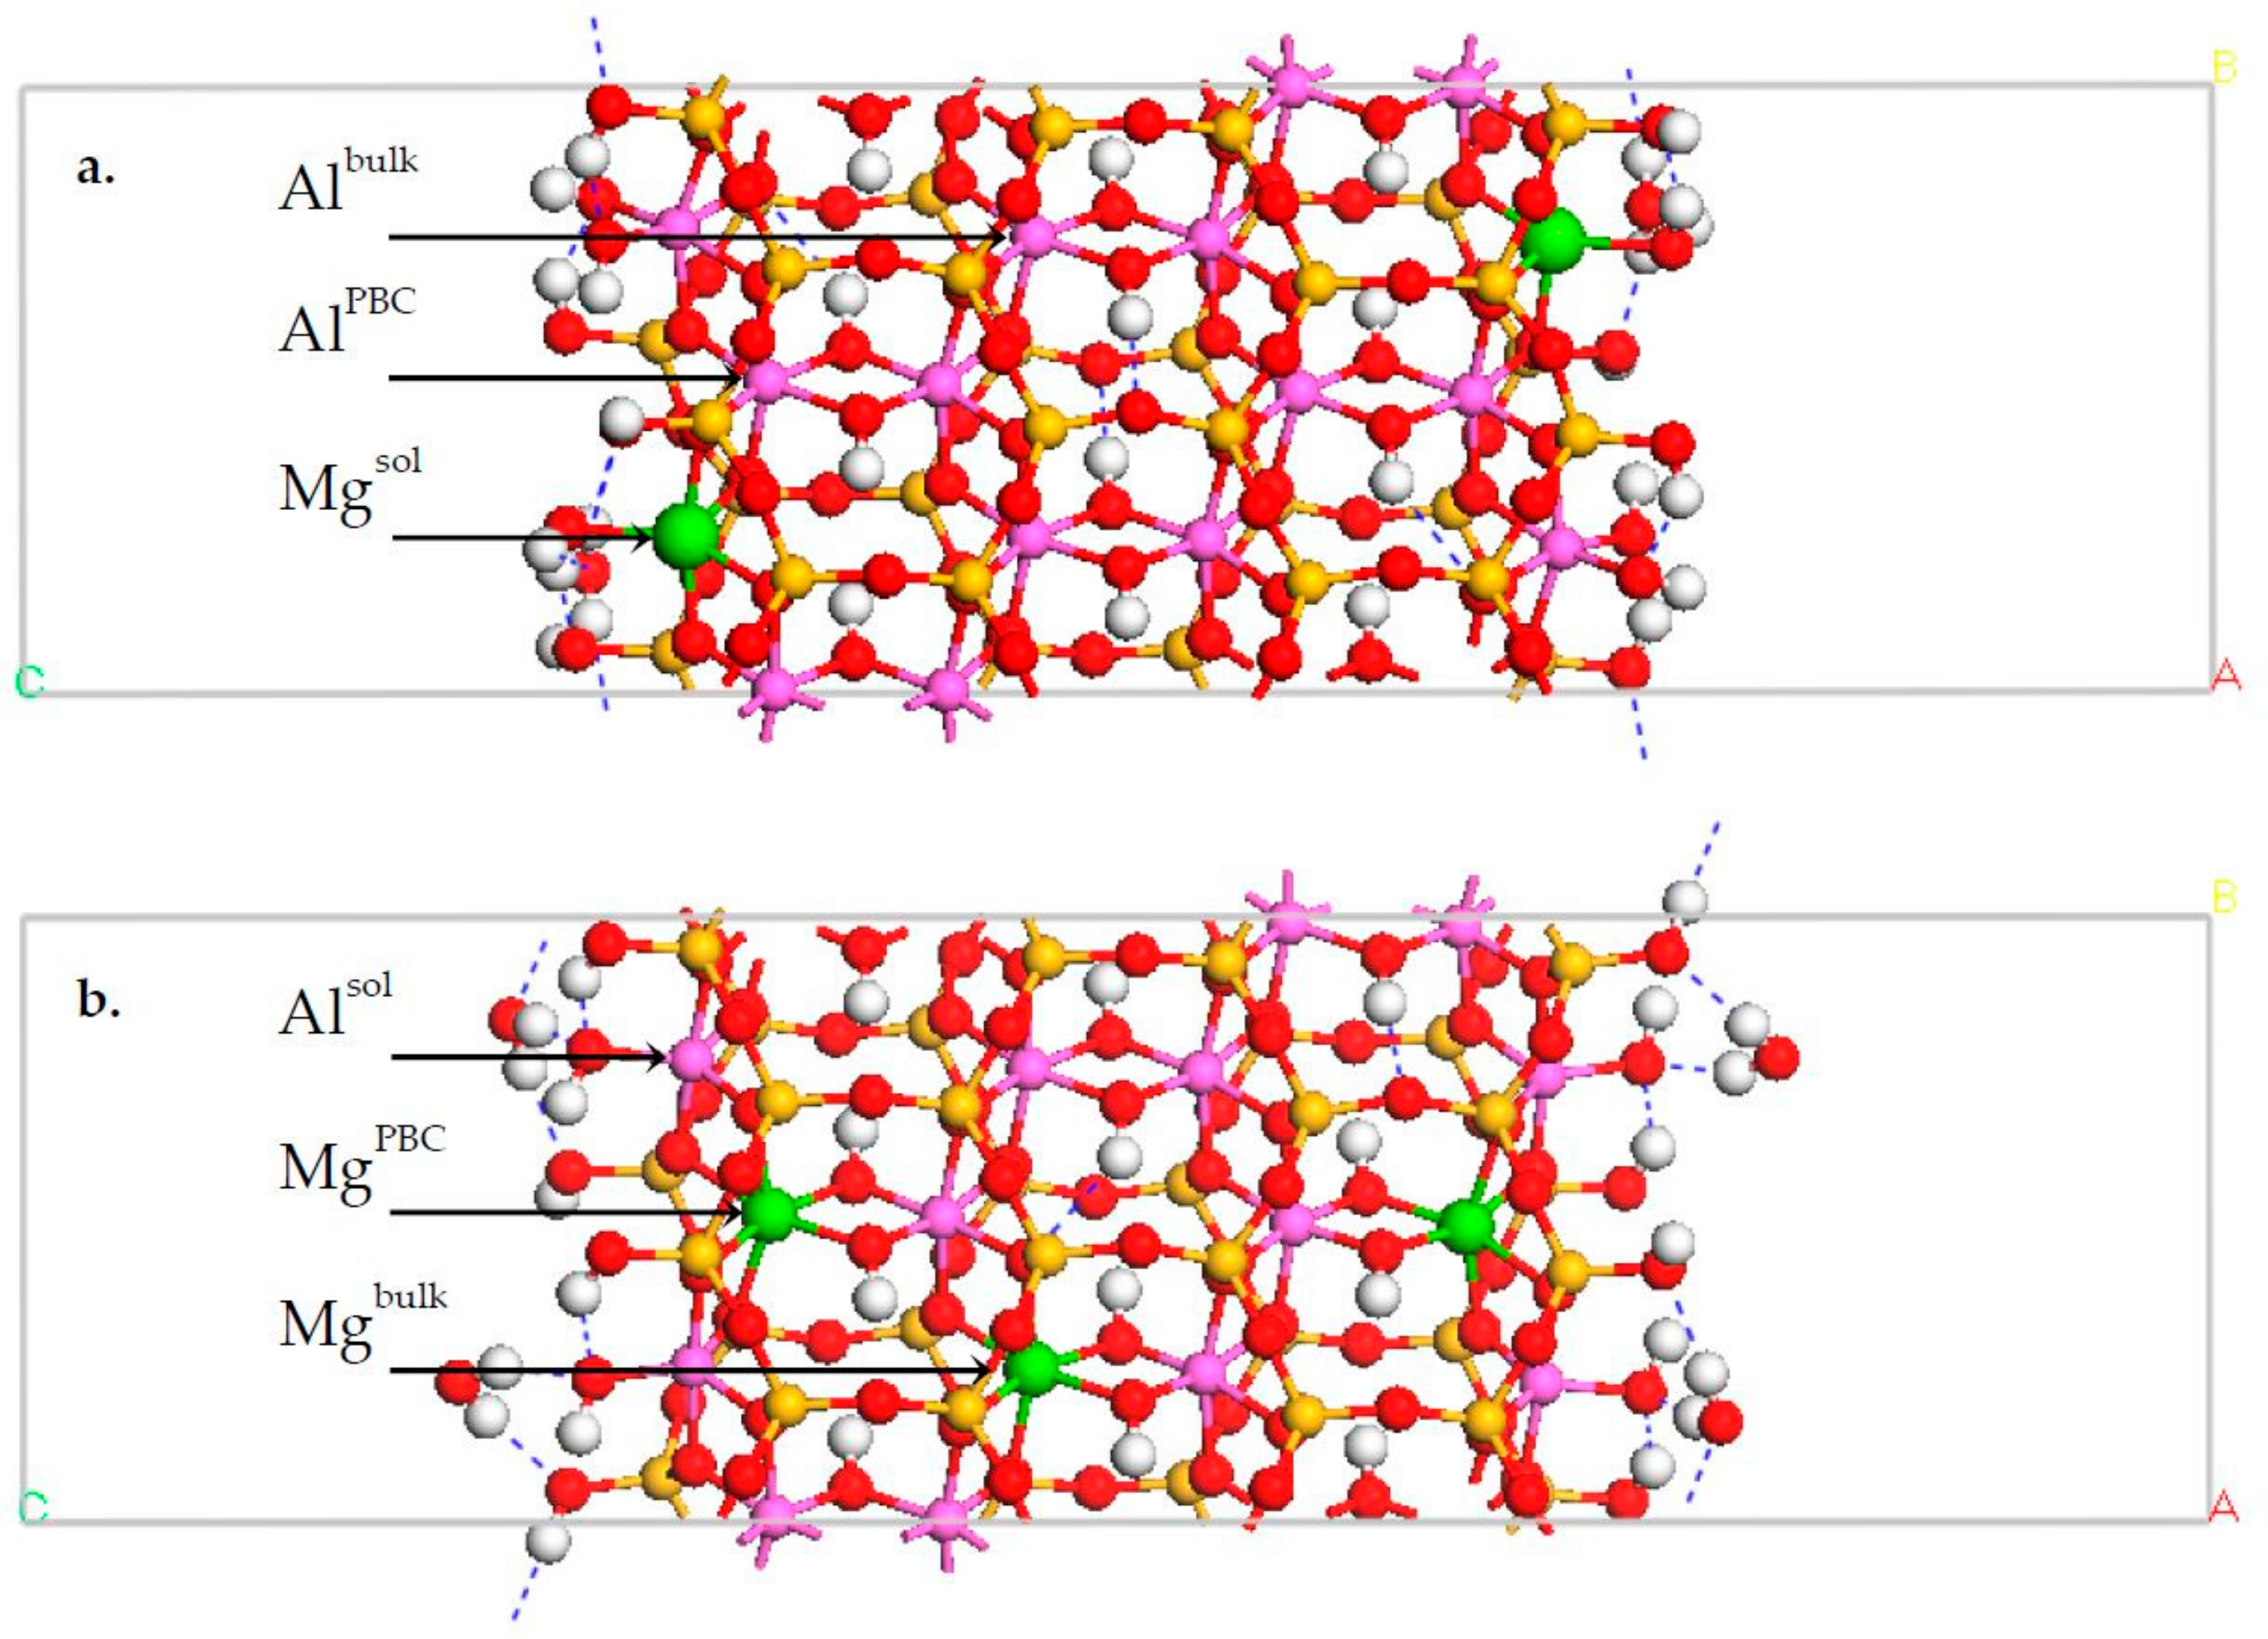
Isomorphic substitutions of Al3+ by Mg2+ in the octahedral layer were assigned at random and were subject to the two constraints described previously [32]. The random assignment of substitutions and the first constraint that prohibits the presence of Mg–(OH)2–Mg pairs in the octahedral sheet are based on 1H magic angle spinning nuclear magnetic resonance (MAS NMR) and FT-IR spectra from MMTs that show no contributions from Mg–(OH)2–Mg moieties and QM simulations that demonstrated that Mg2+ substitutions are randomly distributed within the octahedral layer [35,36,37]. The second constraint, informed by the properties of synthetic MMTs [38,39,40,41], limits the substitution ratio of the edge PBC (i.e., Mg edge substitutions: total number of octahedral edge sites in the PBC) to less than 0.20, which is the maximum substitution ratio for a synthetic MMT with only octahedral substitutions. The structural characterization of synthetic MMTs with divalent cation substitution ratios greater than 0.20 revealed octahedral sheet occupancies greater than 2.00, which is indicative of an MMT structure with some trioctahedral character, and isomorphic substitutions in the tetrahedral sheet. The octahedral substitution ratio (i.e., the number of substitutions per total octahedral sites) is one half the layer charge, x, in number of moles of excess electron charge per the M-MMT chemical formula: Mx[Al(2−x)Mgx]Si4O10(OH)2, where M is the interlayer counter ion and the term in brackets represents the octahedral sheet cations. Any assignments that violated either of the two constraints were ignored, and a new random assignment was made. The two edge interfaces created are comprised of the edge PBCs of two MMT layers. Each interface possesses an edge PBC with a solvent accessible substitution (MgSol) and a second edge PBC with a solvent inaccessible Mg (MgPBC) substitution. The remaining Mg substitutions were distributed in the MMT bulk (Mgbulk). An equal number of random substitutions were assigned to each layer [N(sub/layer) = 13], and an equal number of Na ions were assigned to each interlayer space to balance this permanent structural charge. This atomistic model of Na-MMT had a layer charge of 0.40, which is consistent with the low- to medium-charged MMT [42] (cation exchange capacity (CEC) ~110 cmolc·kg−1). The chemical formula for the MMT without sorbed water molecules was (Mg26Al102)Si256O640(OH)128. The interlayer and 60 Å macropore were hydrated with a total of 1320 water molecules (Figure 1).
The interatomic potentials of the Clayff force field [29] were used for the Coulomb and short-range interactions as well as the harmonic bonds of the hydroxyl groups in the atomistic model of Na–MMT. Adjustments were made to the partial Coulombic charges of the octahedral Mg atoms (qmgo = 1.3598 e) and the bridging O atoms with double substitution (qobss = −1.3116 e) to maintain the charge neutrality of the atomistic model. Other than these two minor adjustments, all assigned atom types in the MMT structure are those species available in the Clayff force field. The aqueous phase was described by the extended simple point charge (SPC/E) water model with harmonic bond stretching and angle bending terms [43,44]. Long-range electrostatic interactions and the attractive contribution to the van der Waals interaction were evaluated using the Ewald summation [45], with the repulsive contribution of the van der Waals interaction truncated at a distance of 10.0 Å. All Ewald summations were determined to an accuracy of 0.0001 kcal/mol.
All MD simulations were performed with the LAMMPS software package [46], installed on the supercomputers at the National Energy Research Scientific Computing Center (NERSC; Berkeley, CA, USA). The simulation algorithm has been described in detail elsewhere [32]. In brief, the solution phase was initiated with a series of short MD simulations in the microcanonical (NVE, T = 298.15 K) ensemble, where the number of atoms (N), simulation cell volume (V), and energy (E) were held constant, with the temperature (T) controlled with a direct temperature-rescaling thermostat and the SHAKE algorithm [47] for water molecule bonds and angles. The timestep increased in a progression of Δt = [0.001, 0.01, 0.2, 0.3, 0.4, 0.5 fs] for 40,000 steps each before the solution phase linear velocity was zeroed, the atoms of the MMT phase were released from their rigid positions, and the thermodynamic ensemble was changed to isobaric-isothermal [NPT; (P = 1.0 atm, T = 298.15 K)], wherein pressure (P) and temperature were held constant with a chain of three Nose-Hoover thermostats. The entire system was then equilibrated for an additional 200,000 steps with Δt = 0.25 and 0.5 fs. The approximately 200 ps of equilibration were followed by a 5.0 ns production run in the NPT ensemble. The internal routines of the LAMMPS code were used to calculate the metal-oxygen radial distribution functions (RDFs) and coordination numbers (CNs). The charactersitic properties of the RDFs (i.e., metal-oxygen distances, rMeO; the first-shell minimum of the RDF, ρ; and the coordination numbers, CNs) were calculated from 10 time-averaged blocks of 100 ps duration. The hydrogen bonds (H-bonds) at the NaMMT edge-water interface were defined by the donor-acceptor separation distance and the donor-hydrogen⋯acceptor angle criteria developed by Kumar, et al. [48] for the SPC/E water model (dH-bond ≤ 3.2 Å; ∠H–D ⋯ A ≤ 40°) and rendered and quantified with the open-source program, Visual Molecular Dynamics (VMD) [49]. The volumetric density maps were calculated for a 0.05 Å grid resolution and a uniform atom weight of 1.0 using the VMD VolMap plugin.

2.2. Density Functional Theory (DFT) Geometry Optimizations

All DFT computations were performed with CASTEP, a planewave DFT code [50], using ultrasoft pseudopotentials [51] under the generalized gradient approximations [52]. The planewave basis set was expanded to include kinetic energy of up to 600 eV. A 6 × 4 × 4 grid was used for the k-point sampling using a Monkhorst-Pack grid [53] for the pyrophyllite unit cell, and one k-point was used for supercells, which represent surface models. With the chosen kinetic-energy cutoff and k-point grid, the atomic forces converged to <<0.01 eV/Å. The geometry optimization permitted the coordinates of all ions to relax. Geometry optimizations were performed until the residual atomic force was ≤0.03 eV/Å and the root-mean-square stress of the bulk structure was ≤0.02 GPa.
A periodic slab model of the B edge surface for DFT calculations (Figure 2) was created based on a 2 × 2 × 1 supercell of a geometry optimized pyrophyllite-1M unit cell from Bleam, et al. [33]. This slab model has two symmetric edge surfaces at the left and right of Figure 2. The B edge structure was cleaved from the supercell in the same manner as the molecular mechanics simulations. The generic chemical formula for the surface slab models without sorbed water molecules was [Al(16−n)Mgn]Si32O80(OH)16, where n = 2 or 3 in our DFT simulations, corresponding to a layer charge of 0.25 or 0.375. The slab model was comprised of four PBCs (~18 Å thickness). The vacuum space perpendicular to the edge surface slab model was ~20 Å. The supercell dimensions for the DFT edge surface model were 10.45 × 37.53 × 10.12 Å (a × b × c) with each edge surface ~1.0 nm2. A distance greater than 17.5 Å separated the periodic images of the surface models.
Isomorphic substitutions of Mg for Al were introduced into the PBC of each edge surface and, in some models, the bulk of the octahedral sheet. The effect of the substitution location in the edge PBC was investigated by considering two different models. In the first model, the isomorphic substitution occupied a solvent accessible octahedron in the edge PBC (Figure 2a, MgSol); the isomorphic substitution of the second model occupied a linking octahedral position in the PBC (Figure 2b, MgPBC). A single isomorphic substitution in each edge PBC results in a MMT with a layer charge, x1 = 0.25. The layer charge of the models was increased to x2 = 0.375 through the introduction of an additional isomorphic substitution into the bulk of the octahedral sheet (Figure 2b, MgBulk). The inclusion of the MgBulk atom did not change the substitution ratio of the edge PBCs; the ratio remained 0.25. Although in excess of our defined constraint, this edge substitution ratio is the lowest possible for the current DFT model. The small size of these atomistic models imposes limits on the substitution ratios and layer charges that can be considered. Thus, we have chosen models that most closely agree with those of the classical mechanical simulations described above and are within the range of the octahedral substitution ratios of synthetic MMT. The isomorphic substitution of Mg for Al results in a net negative charge in the supercell representing the surface. In this study, the charge deficit was compensated by application of a uniform positive background [54].
Unsaturated bonds at the B edge were healed via the dissociative chemisorption and physisorption reactions with water molecules to create an edge surface at the p.z.n.p.c. The Si edge tetrahedra each possess one silanol (≡SiOH) group. Upon cleavage of the B edge surface, each solvent accessible octahedron is in five-fold coordination with oxygen and possesses one solvent accessible, singly coordinated hydroxyl group. Saturation of these surface octahedra requires the physisorption of a water molecule (or other neutral species) to maintain conditions at the p.z.n.p.c. A total of four H2O molecules per edge surface were used to saturate the solvent-accessible TOT units.
When all edge surface octahedra are equivalent, the assignment of one water molecule and one hydroxyl group to each edge octahedron is a reasonable initial structure [i.e., ≡Al(OH)(OH2)]. When the surface octahedra include isomorphic substitutions, however, this homogeneous assignment is perhaps insufficient. The observed spontaneous transfer of protons on the pyrophyllite B edge surface during DFT-MD simulations [20,24,34]; the effects of isomorphic substitution on the pKa of edge surfaces groups [25]; and the considerable difference between the first hydrolysis constants of Mg and Al in solution (pKa1 = 11.4 v. 5.0, respectively [55]) all suggest that the investigation of alternative initial surface proton distributions is prudent. Liu, et al. [24] used constrained DFT-MD to calculate the free-energy profile for H2O dissociation from the phyllosilicate edges and identified variations in the surface functional groups when Mg is substituted for solvent accessible Al sites. Our simulations are designed to examine explicitly the effects of local charge deficits and the location of isomorphic substitutions on the edge structure. For the most thorough investigation of these effects, we also considered an alternate initial proton distribution at the p.z.n.p.c., where the surface octahedron is coordinated to two hydroxyls or two water molecules [i.e., ≡Al(OH)2 + ≡Mg(OH2)2 and ≡Mg(OH)2 + ≡Al(OH2)2].

3. Results

3.1. DFT Calculation Results

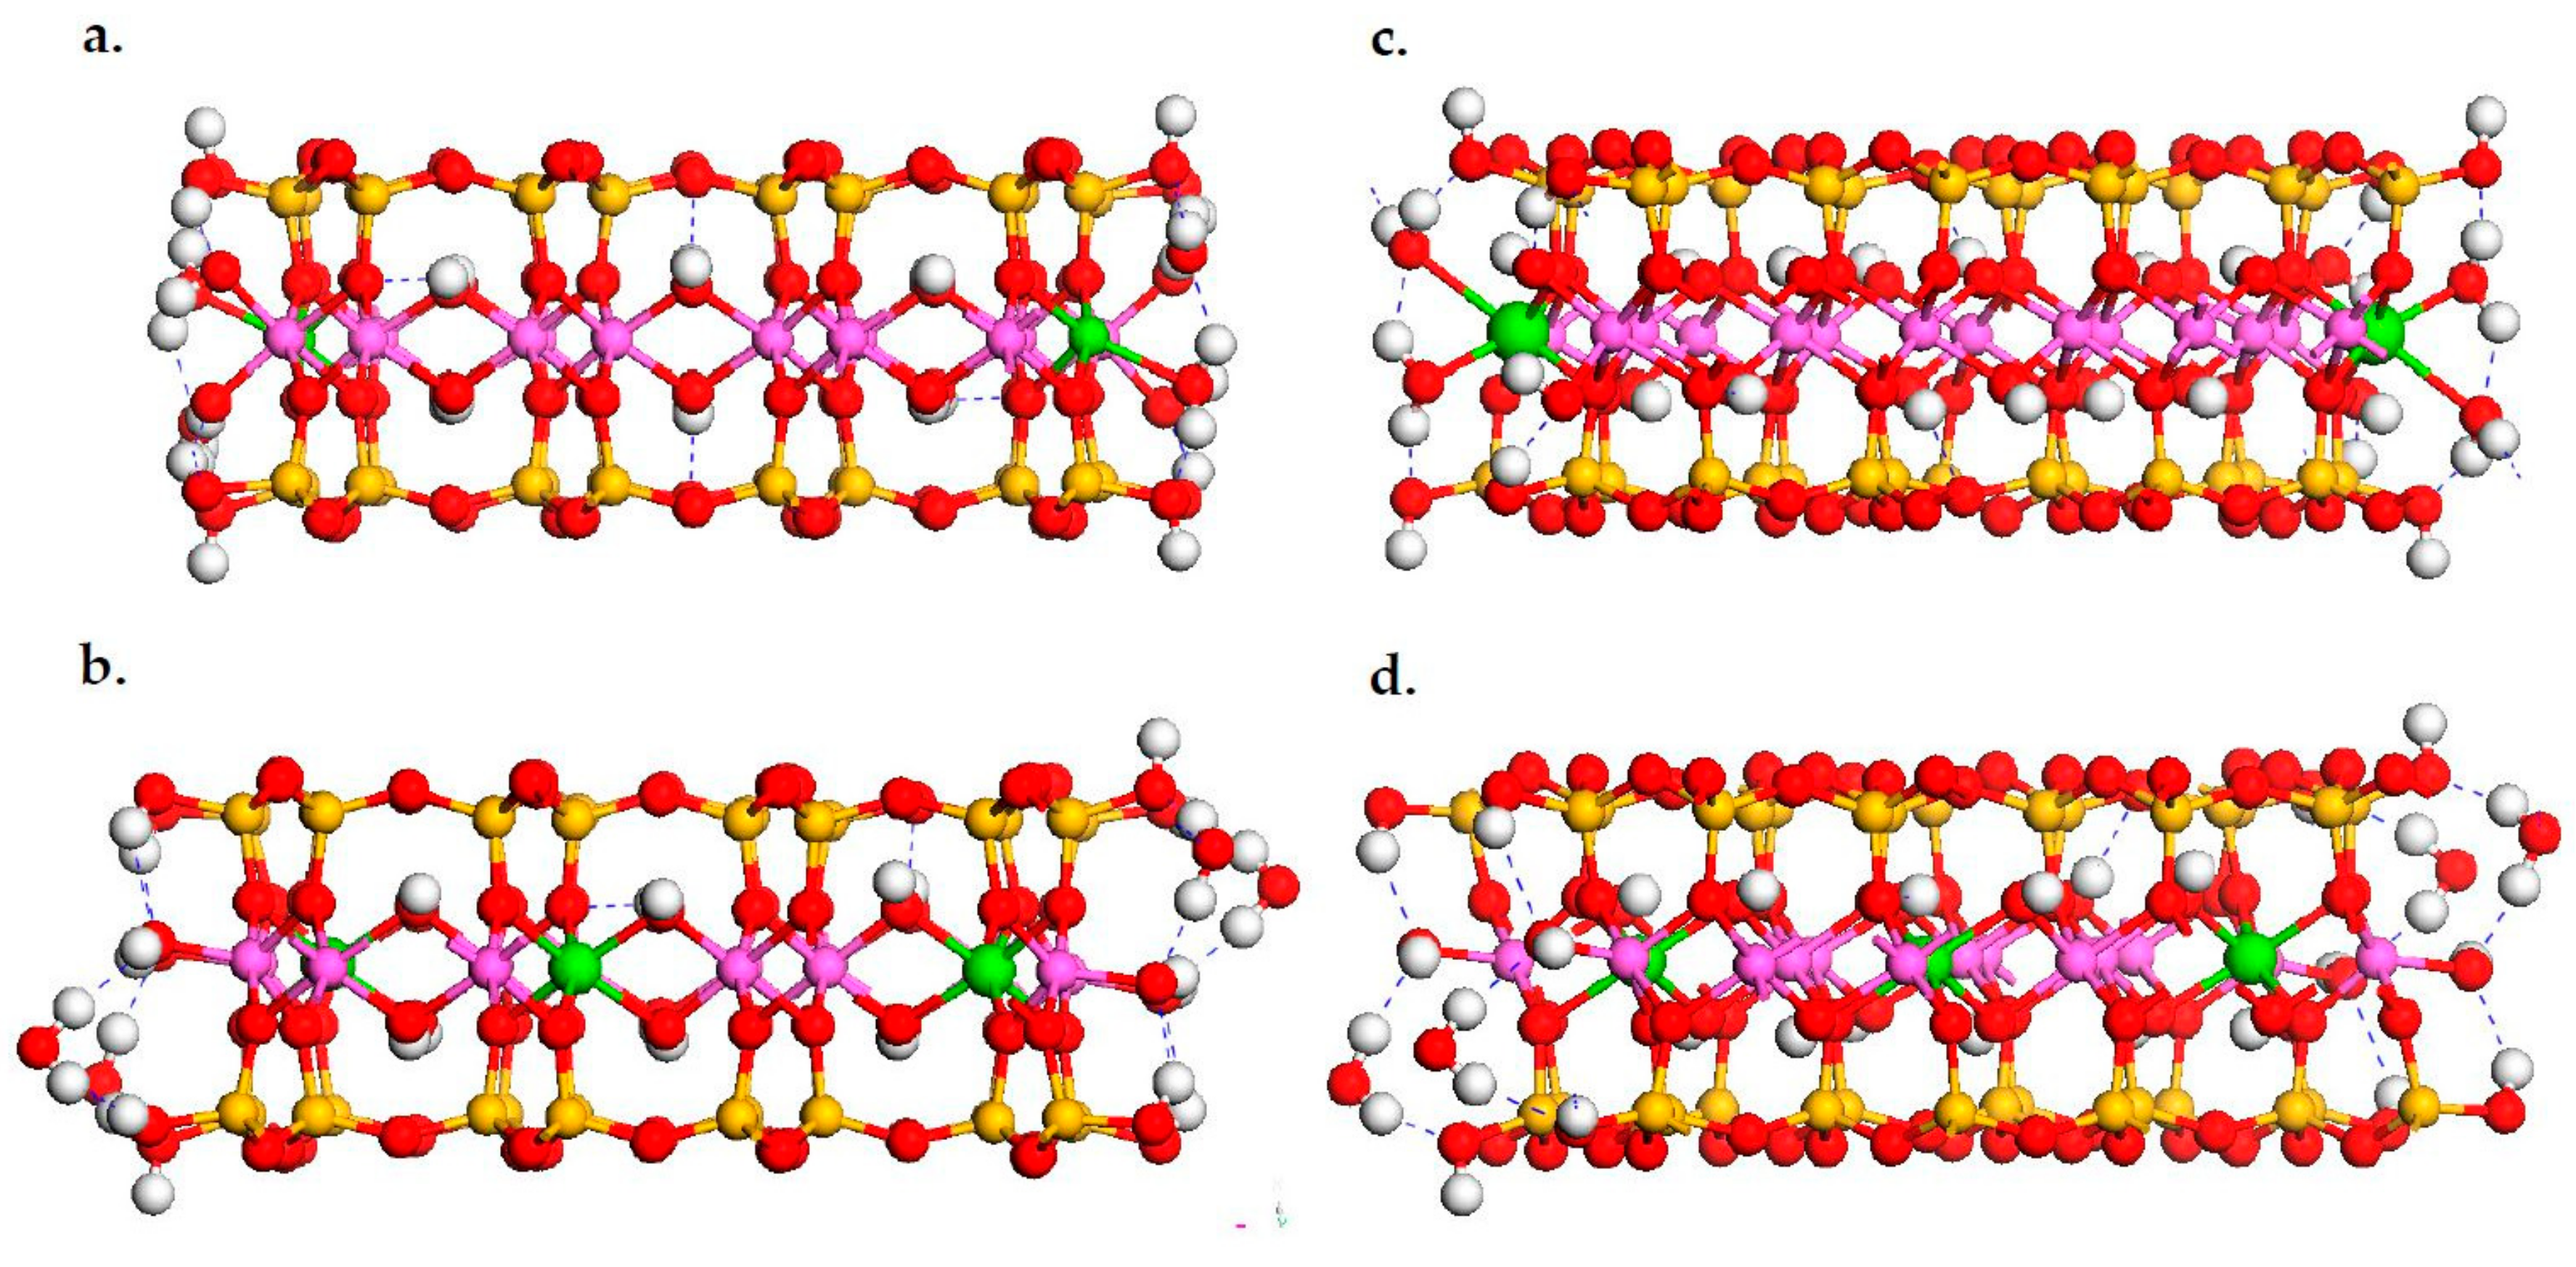
The geometry optimized structures and relative energies demonstrate a correlation between the distribution of the active surface groups, as identified by Liu, et al. [24], and the magnitude of the local charge deficit (Table 1). At lower substitution densities (Figure 3a,c), the edge cations of the octahedral sheet are more likely to be in octahedral coordination with a hydrolyzed Alsol [≡Al(OH)2] adjacent to a Mgsol coordinated to two water molecules [≡Mg(OH2)2]. This arrangement of surface groups at a low layer charge can be rationalized by the large difference in the first hydrolysis constant (pKa) of aqueous Al3+ and Mg2+. At high local charge densities, the isomorphic substitutions are less likely to be solvent accessible, and the edge Al favor trigonal bipyramidal coordination (Figure 3b,d). These findings are important for the atom type assignments in the classical mechanical model of the Na–MMT B edge.
At a higher layer charge (x2 = 0.375), the most favorable location for the Mg substitution was the solvent inaccessible position of the edge PBC (Table 1, MgPBC). The Alsol of this structure was in five-fold coordination with oxygen. This coordination is evident upon visual inspection of Figure 3b and from the large Alsol-water oxygen (Alsol–Ow) distance that places the water oxygen outside of the first Al–O shell (Table 2). The contraction of the average Alsol–O distance relative to the Albulk–O distance also confirms the reduced number of oxygens coordinated to the Alsol atoms. The exposed surface hydroxyl coordinated to Alsol is stabilized via an intrasurface H-bond with the nearest silanol group and the H-bonds of a water molecule that forms a bridge to the second silanol group of the surface TOT structure.
At a lower layer charge, however, the Mgsol substitution is preferable (Table 1: x1 = 0.25); the ≡Mg–(OH2)2 and ≡(Al–OH)2 edge structures are the most energetically favorable. In this lowest energy structure, the Mgsol is in six-fold coordination with oxygen, including two water molecules (Figure 3a). The Mg-water oxygen [Mg–Ow] distances were longer than the average Mgsol–O distance (Table 2). The adjacent Alsol is also in octahedral coordination with oxygen, including two surface hydroxyl groups. The Al-hydroxyl oxygen [Alsol–Oh] distances at the surface are contracted relative to the Al–Oh distances in the bulk structure [1.85 v. 1.90 Å, respectively]. The Mulliken charges [56] of these two surface hydroxyl groups in single coordination with the Alsol and adjacent to the MgSol substitution were approximately equal (−0.64 e) and slightly greater than both the charges of the hydroxyl of the edge silanol groups and the bulk structure (−0.60 e).
The initial proton distribution, wherein the Mgsol was hydrolyzed [≡Mg–(OH)2] and the Alsol was coordinated to two water molecules [≡Al–(OH2)2], was unstable at the low layer charge. A spontaneous proton transfer from the edge Al to the edge Mg octahedra occurred during the geometry optimization. The Mgsol octahedra were coordinated to one hydroxyl and a water molecule, and the Alsol was in five-fold coordination with a hydroxyl group in the final structure. At the higher layer charge, a spontaneous proton transfer occurred. However, the geometry optimization of this initial proton distribution did not result in a structure that satisfied the convergence criteria.
The minimum energy edge structures predicted by our DFT optimization concur with those edge structures obtained via DFT-based molecular dynamics simulations of the B edge with an octahedral substitution [24]. These previous simulations employed a model that possessed a layer charge of 0.25, was half the size of our model, and considered only a Mgsol substitution. The active surface groups in this model were an octahedral Mg [≡Mg–(OH2)2], two different octahedral Al [≡Al–(OH)(OH2); ≡Al–(OH)2], and a trigonal bipyramidal Al [≡AlV–OH].

3.2. Classical MD Simultion Results

All of the relevant surface groups identified via the DFT geometry optimization and DFT-MD simulations of the Na–MMT B edge are recreated in our classical mechanical model. The surface groups associated with both low- and high-local charge deficits could be accommodated in the classical mechanical model due to the greater length-scale of the model. The greater areal extent of the edge surface in the classical model created a more heterogeneous distribution of isomorphic substitutions and permitted the creation of a model with the representative surface groups. The atom type assignment for edges where the Mg substitution is solvent inaccessible is straightforward as the edge surface groups are all coordinated to solvent accessible Al atoms. The initial assignment of surface groups for the Alsol is one singly coordinated hydroxyl and one water molecule (i.e., ≡Al–(OH)(OH2)). When the Mg substitution is in the solvent accessible position, our atom type assignment is informed by the DFT results. In bulk, the Clayff hydroxyl oxygen atoms associated with isomorphic substitutions have a different partial charge than unsubstituted hydroxyl oxygens (q(ohs) = −1.0808 e versus q(oh) = −0.95 e, respectively). Cleavage of the bulk mineral phase can expose these substituted hydroxyl groups (ohs) at the edge (i.e., ≡Mg–(OH)2). The DFT geometry optimizations demonstrated that this arrangement of surface hydroxyls was unstable, and protons were spontaneously transferred to lower the relative energy of the structure (Table 1). As the Mulliken charge of the hydroxyl groups coordinated to the hydrolyzed Alsol was greater than the other surface and bulk hydroxyls, we have assigned the two substituted hydroxyl groups to the hydrolyzed Alsol of the classical mechanical model and saturated the Mgsol with two water molecules (i.e., ≡Al–(OH)2 and ≡Mg–(OH2)2). This choice of atom type assignments maintains the edge surface at the p.z.n.p.c. and the partial charge neutrality of the classical mechanical model.
The Alsol–O distance calculated by our classical mechanics MD simulation (Table 3: 1.87 Å) is intermediate between the distances for the low- and high-layer charge DFT models. This result is expected given that the larger classical MD model possesses Alsol groups that are in six- and five-fold coordination with O (Table 3: CN(Alsol–O) = 5.72; Figure 4). The mix of octahedral and trigonal bipyramidal coordination results from the free exchange of the coordinated water molecule with the bulk, which is thermodynamically favorable [24]. On average, slightly more than half of the ≡Al–(OH)(OH2) surface groups are in octahedral coordination at any time throughout the MD simulation. The Alsol–O distances of the DFT models that bracket the MD model distances reflect Alsol that are in either octahedral or trigonal bipyramidal coordination. The Alsol–O distance is contracted relative to the bulk Al–O distance (Albulk–O). This contraction is attributed to the presence of trigonal bipyramidal Al at the edge. The Alsol–Oh distance on the Na–MMT B edge agrees well with the corresponding distance in the DFT model at low layer charge (x1 = 0.25) and previously reported B edge Al–OH distance of pyrophyllite [28]. The Alsol–Ow distance of the classical mechanical model of the Na–MMT edge cannot be compared with the DFT models as the Alsol is hydrolyzed at a low layer charge (i.e., ≡Al–(OH)2) or in five-fold coordination at a higher layer charge in the smaller DFT models. Comparison of the Alsol–Ow distance of the Na–MMT B edge with the corresponding distance on the pyrophyllite B edge reveals that it is contracted somewhat (rpeak(Al–Ow) = 2.06 and 2.25 Å, respectively). The Al in the linking position in the edge PBC (Alpbc) has a first oxygen shell that is indistinguishable from the Albulk.
The classical MD model reproduced the solvent accessible Mg-oxygen distance (Table 3: rpeak(Mgsol–O) = 2.12 Å) of the DFT model at the low layer charge. The MD simulations underestimated the Mgsol–Ow distance when compared to the DFT results (rpeak(Mgsol–Ow) = 2.20 versus 2.32 Å, respectively). A closer examination of Mgsol–Ow distances from the DFT geometry-optimization reveals two distinct clusters of distances at 2.17 and 2.53 Å. With this additional perspective, the first peak of the Mgsol–Ow RDF reproduces the first cluster distance, and the first minimum of the RDF encompasses the distance of the second cluster [Table 3: rpeak(Mgsol–O) = 2.52 Å]. The water ligands associated with Mgsol were not exchanged with the bulk phase during the timescale of our classical MD trajectory, a result consistent with the slow exchange of first shell water molecules from hydrated Mg ions (average residence time: 1–2 μs [57,58]). The Mgpbc–O pair distribution is indistinguishable from the Mg–O pairs in bulk.

3.3. H-Bond Network at the Na-Montmorillonite B Edge

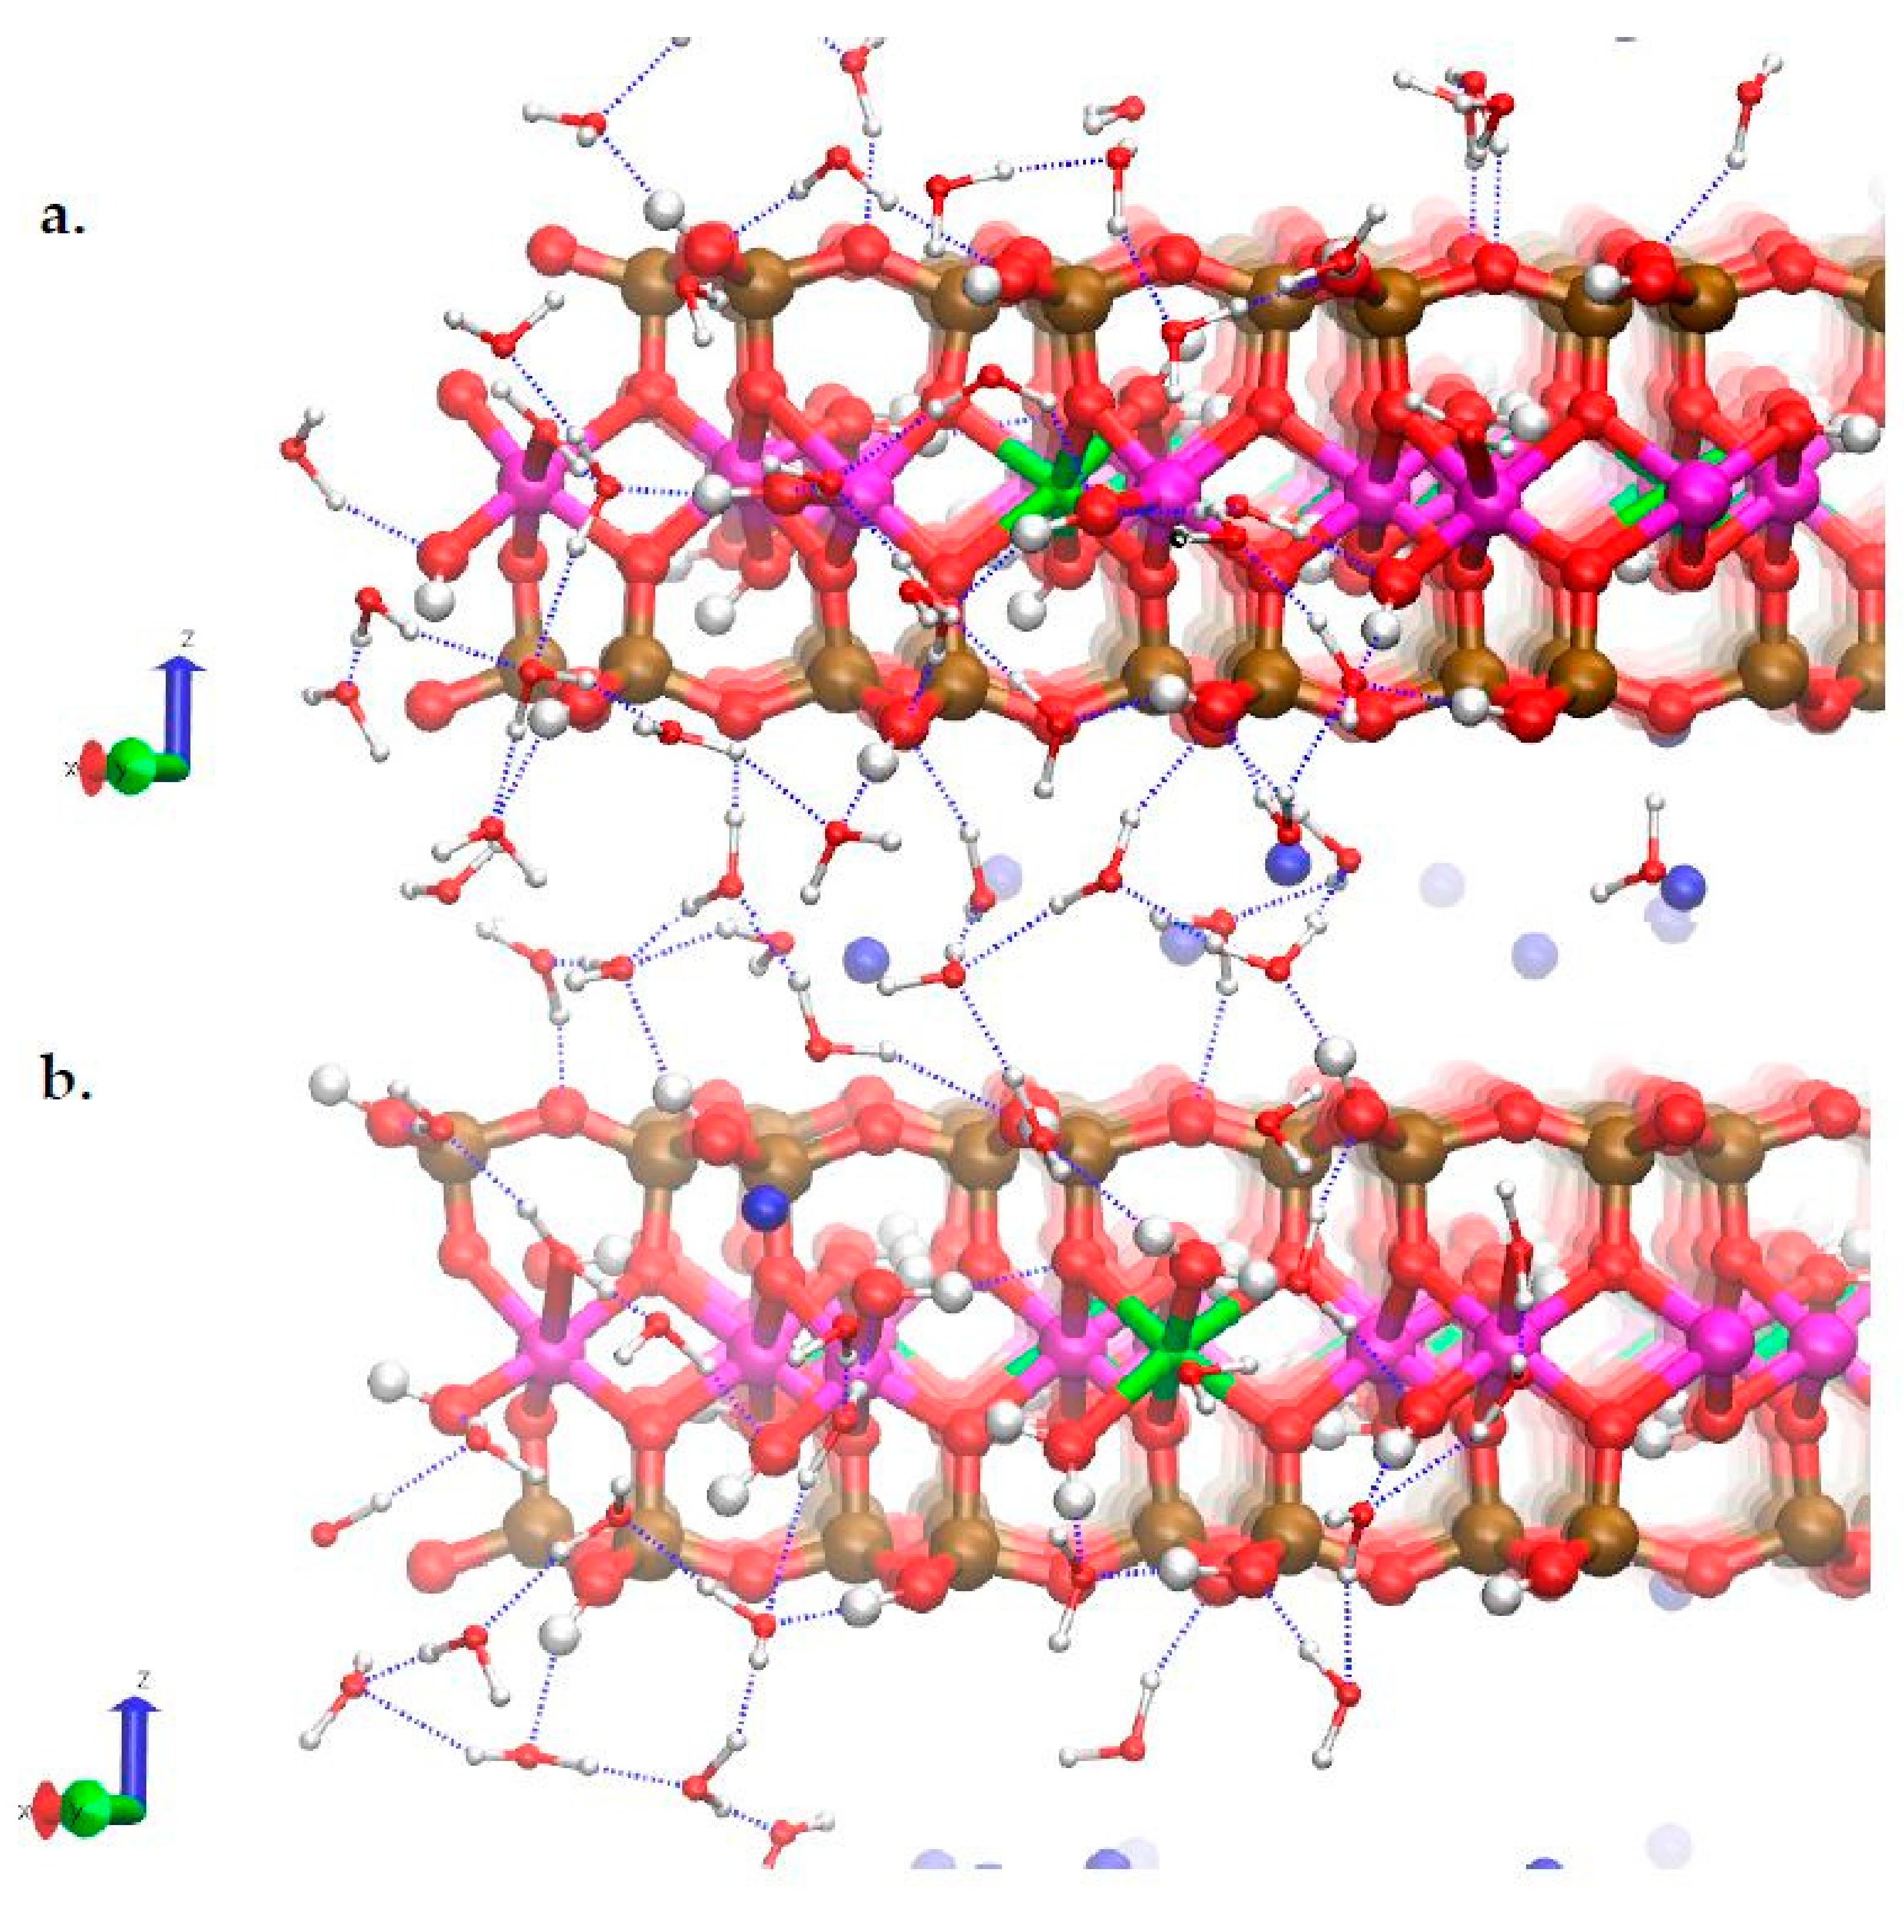
Our MD simulations showed that an extensive H-bond network exists at the edge-water interface and likely contributes to the stability of the disordered surface structures. The hydroxyl groups of the trigonal-bipyramidal Al that share an edge with the solvent-inaccessible Mg substitution (Mgpbc) are H-bonded to water molecules that bridge the surface and form H-bonds with the adjacent octahedral Al (Figure 4a). Similarly, water bridges stabilize the two water molecules coordinated with the solvent accessible Mg. These water bridges accept H-bonds from the Mg coordinated water molecules and accept or donate H-bonds to the neighboring aluminol or silanol groups (Figure 4b). The hydroxyl groups of the surface Al accept and donate H-bonds to water bridges to the adjacent surface groups (i.e., ≡Al–(OH2) and ≡Mg(OH2)2) as well as to the silanol groups. The surface hydroxyl groups occasionally form intrasurface H-bonds directly by donating a H-bond to neighboring silanol or the O that bridges the tetrahedral and octahedral sheets (i.e., ≡ (Al or Mg)–O–Si≡). These surface H-bonds described by the classical mechanics model are qualitatively similar to those observed in the DFT geometry-optimized structure (Figure 3).
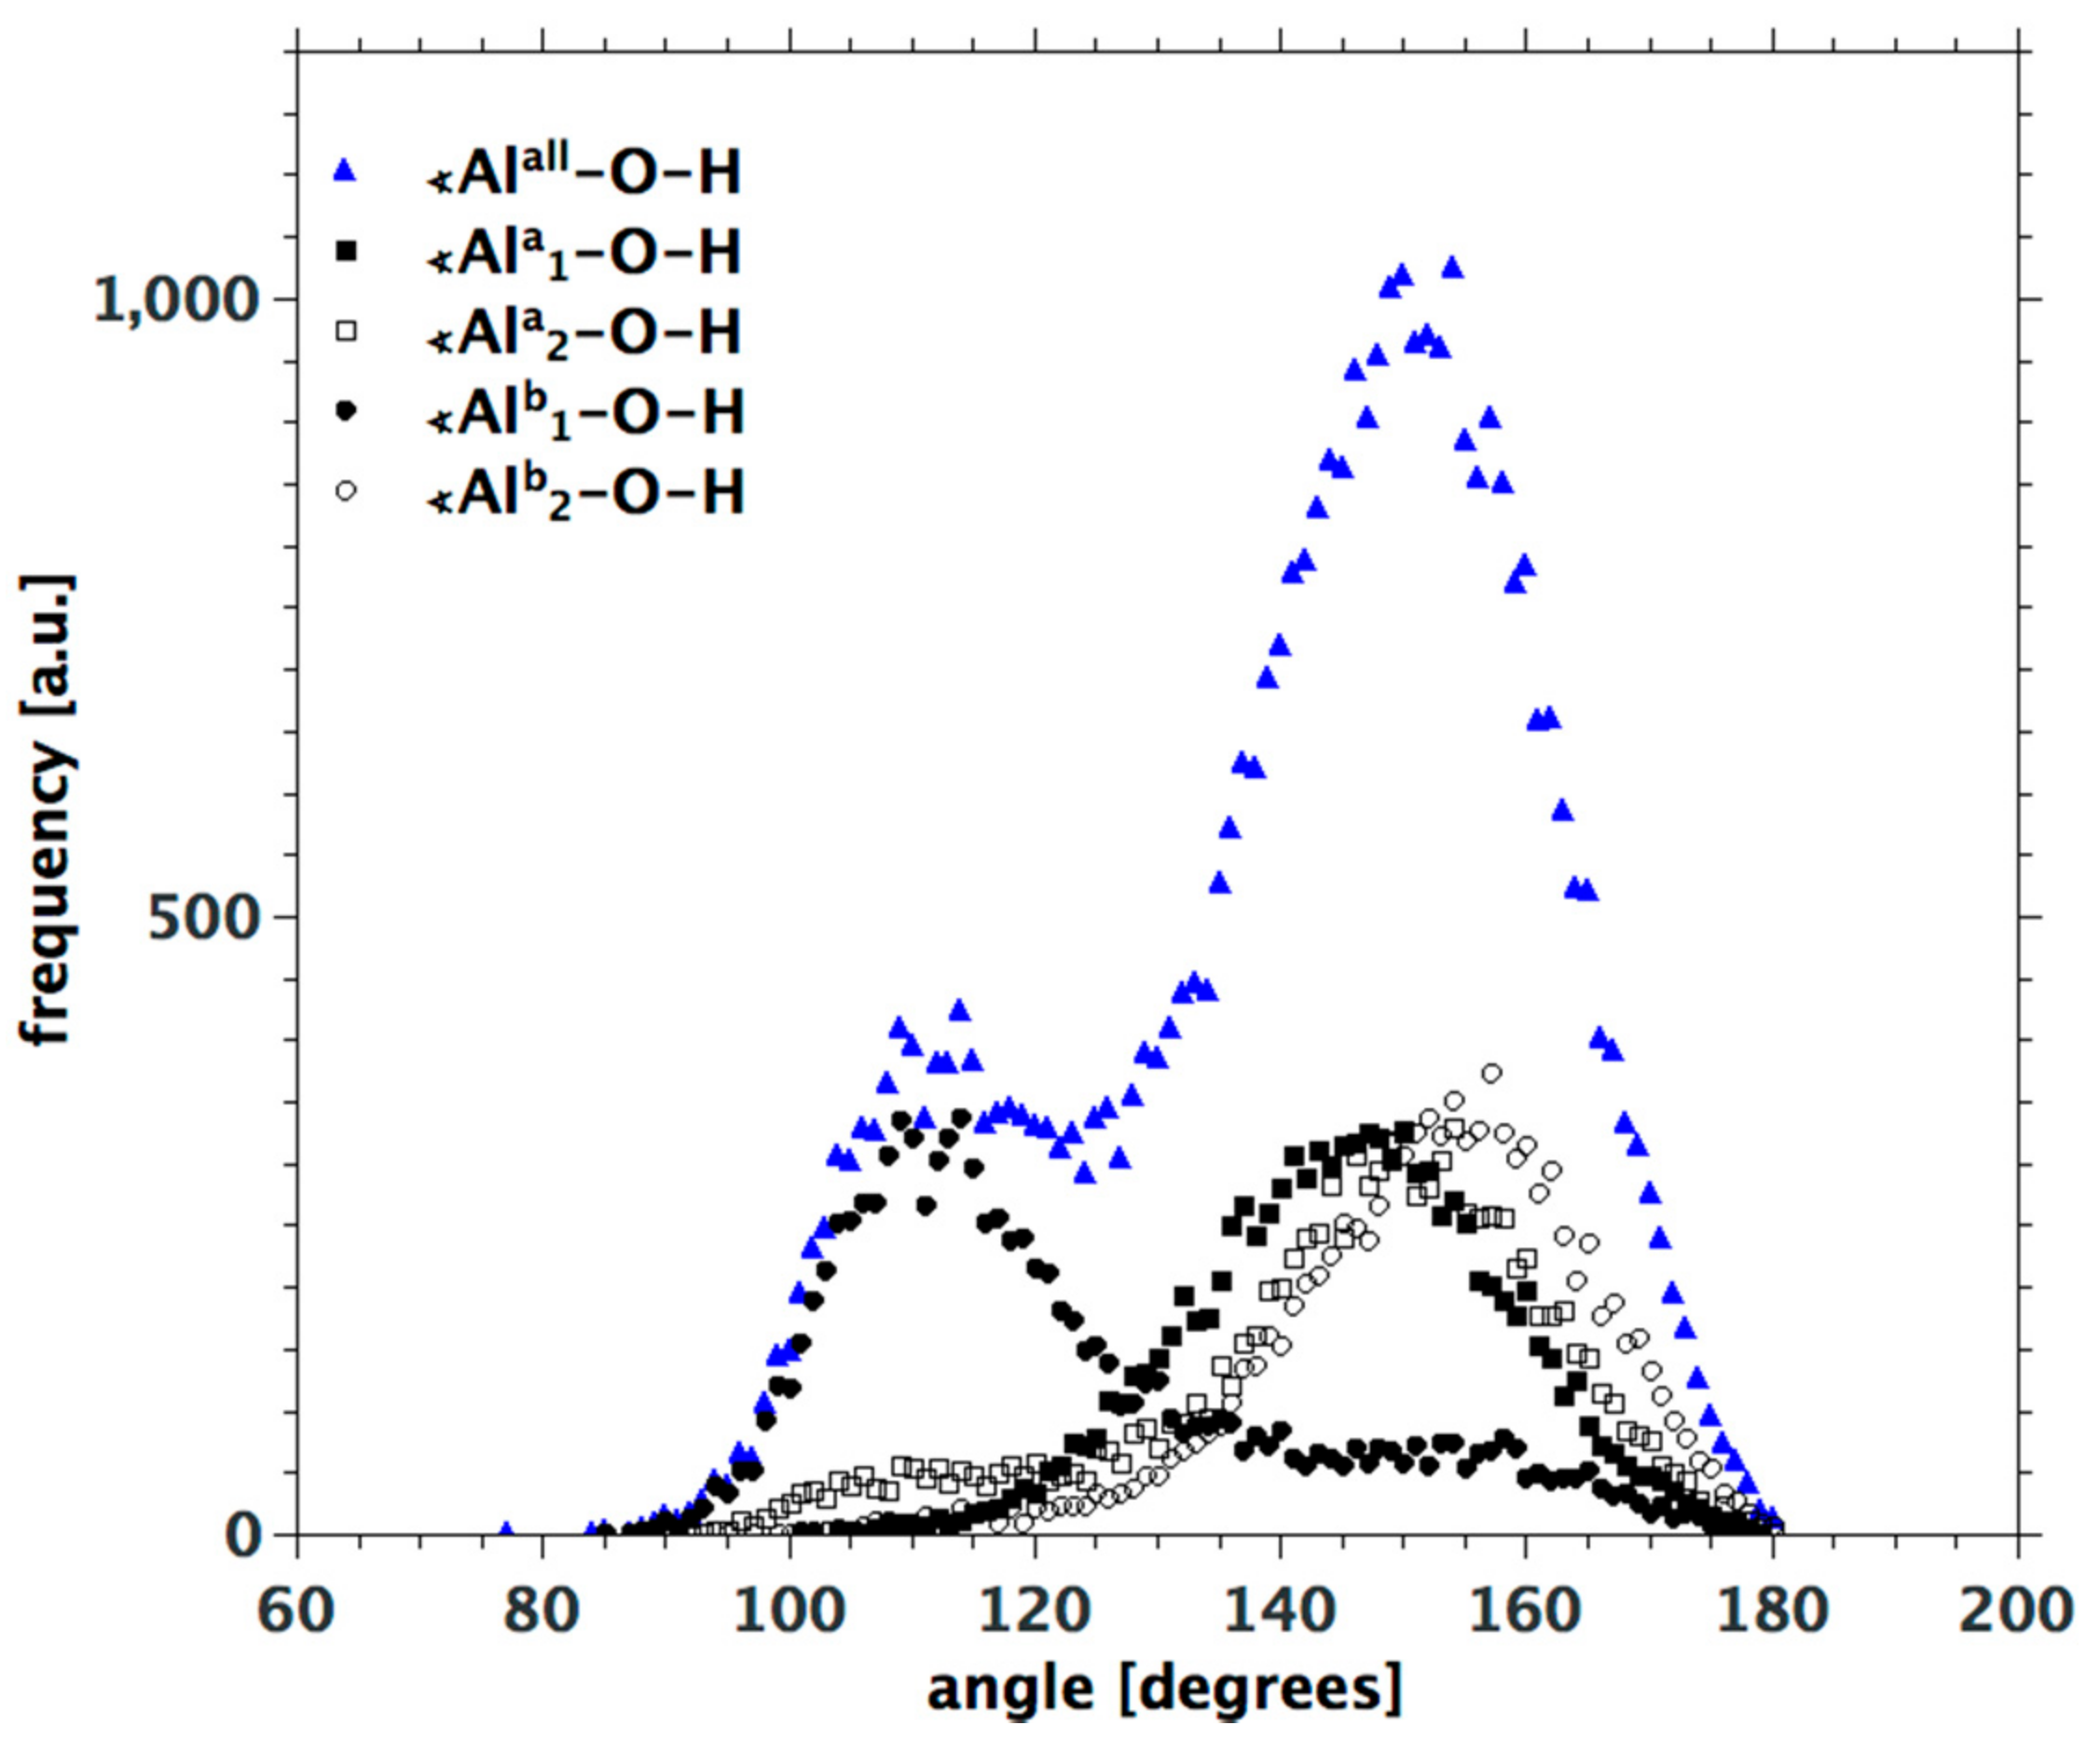
The observed surface H-bond network described above was quantified for the final 1.0 ns of the MD trajectory (Table 4). The ≡Mg–(OH2)2 groups almost exclusively behaved as H-bond donors in our model. The ≡Al–(OH)2 surface groups accepted twice as many H-bond as were donated. Our findings are a marked departure with previous results from a DFT-based MD study by Liu, et al. [24] that reported that the water ligands of ≡Mg–(OH2)2 behave as very weak H-bond donors and that ≡Al–(OH)2 accepts one H-bond from solvating waters but typically does not donate H-bonds to water due to the orientation of the hydroxyl groups. The Al–O–H angle frequency distribution from our MD simulations possesses a dominant peak at 150° with a lesser peak near 110° (Figure 5). The lesser peak is due to one of the four Al–O–H angles in the model that is a H-bond donor in an intrasurface H-bond (Figure 6b: upper Al–O–H group). This one hydroxyl group does not donate H-bonds to the water and its orientation is consistent with that reported in the DFT–MD simulations. The majority of these hydroxyls, however, are more likely oriented toward the solvent phase. In the DFT-MD simulations, the reported absence of H-bond donors from these ≡Al–(OH)2 surface groups may be attributed to limitations in the physical model size and the duration of the simulation trajectory (45 ps).
The H-bonds of the ≡Al–(OH2)(OH) surface group are reported separately for the OH and OH2 moieties (Table 4). The hydroxyl group functions as both a H-bond donor and acceptor in approximately the same proportion as the surface Al coordinated to two hydroxyl groups (i.e., ≡Al–(OH)2). The coordinated water molecule behaves almost exclusively as a H-bond donor similar to the water molecules coordinated to the surface Mg. The interfacial H-bonding of the ≡Al–(OH)(OH2) on the B edge agrees quantitatively with the sum of H-bond donors and acceptors for this group reported in the previous DFT-based MD of the pyrophyllite B edge [20], which is equivalent to the pyrophyllite (010) edge in a monoclinic unit cell. We also examined the possible influence of an octahedral Mg substitution on the H-bonds of the silanol surface groups (Table 4). The hydrolyzed surface Al and the surface Mg coordinated to two water molecules did not affect the silanol H-bond pattern when compared to the silanol groups that were un-influenced by the isomorphic substitution [compare N(H-bond) for ≡SiAl–OH and ≡SiMg–OH versus ≡Si–OH).

3.4. Na-Montmorillonite B Edge Adsorption Sites

During the course of the 5.0 ns MD trajectory, ~10% of the Na counter ions in the interlayer crossed the edge plane and migrated to the bulk mesopore. The volumetric density maps for these Na ions for the interval 4.0 < t < 5.0 ns revealed the formation of inner-sphere Na complexes at two distinct sites: Na was associated with a site in the plane of the octahedral sheet (Figure 6a) and the cleaved hexagonal cavity of the tetrahedral sheets (Figure 6b). The Na RDFs further showed that these Na edge complexes formed near the substituted Mg site but are not directly associated with the Mgsol site (Table 5). The rpeak(Na–Mg) distance was greater than 6 Å (6.5 and 7.9 Å). Sodium formed surface complexes with Al octahedra or Si tetrahedra but not with Mg octahedra.
One can infer from the volumetric density and RDF analysis that the octahedral sheet sites would be the stronger of the two types of sorptive sites identified in our simulations. While all edge Na complexes were in octahedral coordination, the first shell of the complex associated with the hexagonal cavity (tetrahedral sheet) was somewhat more relaxed than the complexes associated with octahedral sheets as evidenced by the greater extent of the first shell (i.e., ρ = 3.3 v. 2.6 Å). The Na surface complex at the hexagonal cavity had four water oxygens, as compared to two in the first shell of the complexes in the plane of the octahedral sheet. The Na complexes in the plane of the octahedral sheet each had two bridging oxygen atoms in their first O shell (i.e., CN(Na–Ob) ≈ 2.0); the bridging oxygen atoms were absent from the first O shell of the Na complex at the hexagonal vacancy as the average Na–Ob distance was much greater than the average Na–O distance.
The Na edge complexes in the plane of the octahedral sheet have three octahedral nearest-neighbors as well as the two Si tetrahedra of the shared bridging O atoms. These Na ions clearly occupy the dioctahedral vacancy of the B edge and form; what can more generally be described as multinuclear, tetradentate, inner-sphere complexes. The Na edge complex associated with the tetrahedral sheet was coordinated with the hydrolyzed Al and the hydroxyl of the Si at the corner of the cleaved hexagonal cavity. This Na edge surface complex can be described as a binuclear, bidentate, inner-sphere complex. It is worth noting that, due to the interconversion of the edge Al between five- and six-fold O coordination, the arrangement of hydroxyl groups at the edge is not static. The tangible result of this is that the nearest dioctahedral vacancy may not always possess the necessary coaxial arrangement of hydroxyl groups to form an inner-sphere complex. This necessary surface hydroxyl configuration was absent in the instance where we observed a binuclear, bidentate complex; a water molecule occupies the coaxial position of the Al across the dioctahedral vacancy.
The crystallographic description of the first site at the dioctahedral vacancy on the B edge (Figure 6a) is consistent with previous DFT simulations of the B edge complexes for Cd2+ [59] and UO22+ [22] and the interpretation of spectra from polarized X-ray adsorption fine structure spectroscopy (P-EXAFS) from Ni and Zn sorption on MMT [60,61]. This site is attributed to the strong site in the 2SPNE SC/CE model of surface complexation on 2:1 phyllosilicates [14]. The second sorption site associated with the cleaved hexagonal cavity (Figure 6b) is consistent with the second of two most probable sites identified for UO22+ sorption but differed from the Cd2+ surface complexes. The surface charge condition was not equivalent in any of the simulations; the simulations of Cd2+ complexes had no structural charge and one deprotonated hydroxyl group per sorbate, while the UO22+ simulations had structural charge balanced with a counter ion and two deprotonated hydroxyl groups per sorbate, and our simulations possessed only structural charge at the edge. The Cd2+ DFT-MD simulations sampled two low-energy sites of assumed configurations; a mononuclear, bidentate site associated with the edge Al (i.e., ≡Al–(OH)2–Cd2+) and a mononuclear, monodentate silanol site (i.e., ≡Si–OH–Cd2+). In fact, our MD trajectory showed that at early times the Na ion was in a mononuclear, bidentate octahedral complex with the ≡Al–(OH)2 surface groups (i.e., ≡Al–(OH)2–Na+) but later occupied the dioctahedral vacancy. This well illustrates the advantage of classical MD simulations in obtaining sufficient structural data, which could be critical in the interpretation of metal surface speciation.

4. Discussion

The results of our present atomistic simulations provide new insights when compared to previous simulations of the Na–MMT AC edge [32]. The DFT geometry optimizations of the AC and B edges both demonstrated a relationship between the local charge deficits and structural disorder of the Na–MMT edge. The relative stability of octahedral substitutions in the edge PBC, however, was different for the two stoichiometrically-equivalent edge structures. The AC edge favored substitutions in the solvent-inaccessible positions (Mgpbc) at both low and high layer-charges [32]. In contrast, on the B edge, the favorable site changed from Mgsol at low a layer-charge to Mgpbc at a high layer-charge. An increase in layer charge reversed the location of the lowest relative energy substitution in the B edge chain and altered the coordination of edge Al of the octahedral sheets. Trigonal bipyramidal Al structures were predicted at both the AC and B edges of Na–MMT, but an Edelman-Favejee [30] defect co-occurs in the tetrahedral sheet with five-fold Al structures on the AC edge [32]. The Alsol and Mgsol of the AC edge were stable as octahedral and square-pyramidal structures due to the free exchange of the coordinated water molecule with the bulk. In contrast, no stable square-pyramidal Al structures were observed on the B edge, being the edge Al transition between octahedral and trigonal-bipyramidal polyhedra. In addition, the water molecules coordinated with Mgsol on the B edge were not freely exchanged with the bulk on the timescale of our MD simulations, a result consistent with previous constrained DFT-based MD that predicted that this exchange was thermodynamically unfavorable [24]. The present simulations, when considered with previous simulations of the Na–MMT AC edge, demonstrate that a relationship between disorder at the 2:1 phyllosilicate edges and excess local charge exists but also identify aspects of the disordered structures that are unique to the B edge.
Our exploration of the B edge sorption sites under the influence of octahedral substitutions was conducted in the absence of variable charge (i.e., pH = p.z.n.p.c.). This pH condition imposes some limitations on our findings; however, the results should be considered in light of the calculated pKas of the B edge surface groups. The calculated pKas for the B edge are ~7 for silanol groups and ~8 for aluminol but are subject to relatively large uncertainties that result in the overlap of the two values [25,26,27]. On the AC edge, the pKa for the amphoteric Al site (i.e., ≡Al–OH2) is 5.5 [26]. The AC edge also possesses a lower surface energy than the B edge and would be a greater fraction of the total edge surface area [19,28,31]. This difference in surface acidities and fraction of total surface area indicate that the reactive site density of the AC edge will be greater than that of the B edge. Thus, our findings with regard to the B edge surface complexes are applicable under even mildly acidic conditions.
Our current classical MD simulations and DFT geometry optimizations provide a unique perspective on the structure of the montmorillonite edge. We have used DFT geometry optimizations to affirm the identity of the relevant surface groups in the octahedral sheet and the relationship of these groups to the local charge deficit. These relevant surface groups can be successfully reproduced in classical MD simulations using the Clayff force field without modification. When combined with previous simulation of the AC edge [32], the Clayff force field can be used for future simulations to explore the properties of the dominant crystallographic edges, nanoparticles, and transport across the macro- to nano-pore boundary. A limited number of Na counter ions freely crossed this boundary during the course of our simulations and proved useful as probes in identifying two distinct edge sites associated with isomorphic substitutions at the edge. The identification of two sorptive sites at the edge surface and the influence of octahedral substitutions on the sorbed complexes should be useful in constraining the number and type of sites in surface complexation models of MMT. These results will also guide the interpretation of experimental spectra and any future atomistic simulations to determine the free energies for sorption at the B edge. The present simulations have focused on the role of permanent structural charge originating from the octahedral sheet of 2:1 aluminosilicates with atomistic models whose layer charges were constrained by synthetic MMTs. The layer charge of 2:1 phyllosilicates can be considerably greater if the isomorphic substitutions originate from or occur in combination with the tetrahedral sheets [62]. Previous DFT simulations of the 2:1 phyllosilicate edge have considered the effects of isolated isomorphic substitutions in the tetrahedral sheets on properties of the edge [24,34]. The effects of tetrahedral substitutions on the edge structure of high-layer charge minerals (e.g., vermiculite, illite, mica, etc.) and unconstrained classical MD simulations of these 2:1 edges are deserving topics of future classical mechanical simulations.

Acknowledgments

This research was supported by the Basic Science Research Program through the National Research Foundation of Korea (NRF), funded by the Ministry of Science, ICT, and Future Planning (NRF-2015R1A4A1041105). Kideok D. Kwon was supported by the NRF Ministry of Education (2016R1D1A1B03931919). A portion of the computations were performed using resources of the National Energy Research Scientific Computing Center, which is supported by the Office of Science of the U.S. Department of Energy under Contract No. DE-AC02-05CH11231.

Author Contributions

Aric G. Newton performed the molecular dynamics (MD) simulations; Kideok D. Kwon performed the density functional theory (DFT) geometry optimizations; and Aric G. Newton, Jin-Yong Lee, and Kideok D. Kwon wrote the manuscript.

Conflicts of Interest

The authors declare no conflict of interest. The funding sponsors had no role in the design of the study; in the collection, analyses, or interpretation of data; in the writing of the manuscript; or in the decision to publish the results.

References

  1. Sposito, G. The Chemistry of Soils, 2nd ed.; Oxford University Press: Oxford, UK; New York, NY, USA, 2008. [Google Scholar]
  2. Miller, A.W.; Wang, Y. Radionuclide interaction with clays in dilute and heavily compacted systems: A critical review. Environ. Sci. Technol. 2012, 46, 1981–1994. [Google Scholar] [CrossRef] [PubMed]
  3. Pusch, R.; Karnland, O. Physico chemical stability of smectite clays. Eng. Geol. 1996, 41, 73–85. [Google Scholar] [CrossRef]
  4. Tournassat, C.; Bourg, I.C.; Steefel, C.I.; Bergaya, F. Natural and engineered clay barriers. In Developments in Clay Science 6; Elsevier: Amsterdam, The Netherlands, 2015; Volume 6, pp. 5–432. [Google Scholar]
  5. Boulet, P.; Coveney, P.V.; Stackhouse, S. Simulation of hydrated Li+-, Na+- and K+-montmorillonite/polymer nanocomposites using large-scale molecular dynamics. Chem. Phys. Lett. 2004, 389, 261–267. [Google Scholar] [CrossRef]
  6. Liu, X.D.; Lu, X.C.; Wang, R.C.; Zhou, H.Q.; Xu, S.J. Interlayer structure and dynamics of alkylammonium-intercalated smectites with and without water: A molecular dynamics study. Clays Clay Miner. 2007, 55, 554–564. [Google Scholar] [CrossRef]
  7. Yu, Y.R.; Yang, X.N. Molecular simulation of swelling and interlayer structure for organoclay in supercritical CO2. Phys. Chem. Chem. Phys. 2011, 13, 282–290. [Google Scholar] [CrossRef] [PubMed]
  8. Kim, M.H.; Choi, G.; Elzatahry, A.; Vinu, A.; Choy, Y.B.; Choy, J.H. Review of clay-drug hybrid materials for biomedical applications: Administration routes. Clays Clay Miner. 2016, 64, 115–130. [Google Scholar] [CrossRef]
  9. Lal, R. Soil carbon sequestration impacts on global climate change and food security. Science 2004, 304, 1623–1627. [Google Scholar] [CrossRef] [PubMed]
  10. Brouwer, E.; Baeyens, B.; Maes, A.; Cremers, A. Cesium and rubidium ion equilibria in illite clay. J. Phys. Chem. 1983, 87, 1213–1219. [Google Scholar] [CrossRef]
  11. Elzinga, E.J.; Sparks, D.L. Nickel sorption mechanisms in a pyrophyllite-montmorillonite mixture. J. Colloid Interface Sci. 1999, 213, 506–512. [Google Scholar] [CrossRef] [PubMed]
  12. Morton, J.D.; Semrau, J.D.; Hayes, K.F. An X-ray absorption spectroscopy study of the structure and reversibility of copper adsorbed to montmorillonite clay. Geochim. Cosmochim. Acta 2001, 65, 2709–2722. [Google Scholar] [CrossRef]
  13. Zachara, J.M.; Smith, S.C.; Liu, C.X.; McKinley, J.P.; Serne, R.J.; Gassman, P.L. Sorption of Cs+ to micaceous subsurface sediments from the hanford site, USA. Geochim. Cosmochim. Acta 2002, 66, 193–211. [Google Scholar] [CrossRef]
  14. Bradbury, M.H.; Baeyens, B. A mechanistic description of Ni and Zn sorption on Na-montmorillonite 2. Modelling. J. Contam. Hydrol. 1997, 27, 223–248. [Google Scholar] [CrossRef]
  15. Dähn, R.; Baeyens, B.; Bradbury, M.H. Investigation of the different binding edge sites for Zn on montmorillonite using P-EXAFS—The strong/weak site concept in the 2SPNE SC/CE sorption model. Geochim. Cosmochim. Acta 2011, 75, 5154–5168. [Google Scholar] [CrossRef]
  16. White, G.N.; Zelazny, L.W. Analysis and implications of the edge structure of dioctahedral phyllosilicates. Clays Clay Miner. 1988, 36, 141–146. [Google Scholar] [CrossRef]
  17. Hartman, P. Crystal Growth: An Introduction; North-Holland Publishing Co./American Elsevier: Amsterdam, The Netherlands; New York, NY, USA, 1973. [Google Scholar]
  18. Bickmore, B.R.; Rosso, K.M.; Nagy, K.L.; Cygan, R.T.; Tadanier, C.J. Ab initio determination of edge surface structures for dioctahedral 2:1 phyllosilicates: Implications for acid-base reactivity. Clays Clay Miner. 2003, 51, 359–371. [Google Scholar] [CrossRef]
  19. Churakov, S.V. Ab initio study of sorption on pyrophyllite: Structure and acidity of the edge sites. J. Phys. Chem. B 2006, 110, 4135–4146. [Google Scholar] [CrossRef] [PubMed]
  20. Churakov, S.V. Structure and dynamics of the water films confined between edges of pyrophyllite: A first principle study. Geochim. Cosmochim. Acta 2007, 71, 1130–1144. [Google Scholar] [CrossRef]
  21. Kremleva, A.; Kruger, S. Comparative computational study of Np(V) and U(VI) adsorption on (110) edge surfaces of montmorillonite. Clays Clay Miner. 2016, 64, 438–451. [Google Scholar] [CrossRef]
  22. Kremleva, A.; Kruger, S.; Rosch, N. Uranyl adsorption at solvated edge surfaces of 2:1 smectites. A density functional study. Phys. Chem. Chem. Phys. 2015, 17, 13757–13768. [Google Scholar] [CrossRef] [PubMed]
  23. Kremleva, A.; Krüger, S.; Rösch, N. Toward a reliable energetics of adsorption at solvated mineral surfaces: A computational study of uranyl(VI) on 2:1 clay minerals. J. Phys. Chem. C 2016, 120, 324–335. [Google Scholar] [CrossRef]
  24. Liu, X.; Lu, X.; Meijer, E.J.; Wang, R.; Zhou, H. Atomic-scale structures of interfaces between phyllosilicate edges and water. Geochim. Cosmochim. Acta 2012, 81, 56–68. [Google Scholar] [CrossRef]
  25. Liu, X.; Lu, X.; Sprik, M.; Cheng, J.; Meijer, E.J.; Wang, R. Acidity of edge surface sites of montmorillonite and kaolinite. Geochim. Cosmochim. Acta 2013, 117, 180–190. [Google Scholar] [CrossRef]
  26. Liu, X.D.; Cheng, J.; Sprik, M.; Lu, X.C.; Wang, R.C. Surface acidity of 2:1-type dioctahedral clay minerals from first principles molecular dynamics simulations. Geochim. Cosmochim. Acta 2014, 140, 410–417. [Google Scholar] [CrossRef]
  27. Tazi, S.; Rotenberg, B.; Salanne, M.; Sprik, M.; Sulpizi, M. Absolute acidity of clay edge sites from ab-initio simulations. Geochim. Cosmochim. Acta 2012, 94, 1–11. [Google Scholar] [CrossRef]
  28. Newton, A.G.; Sposito, G. Molecular dynamics simulations of pyrophyllite edge surfaces: Structure, surface energies, and solvent accessibility. Clays Clay Miner. 2015, 63, 277–289. [Google Scholar] [CrossRef]
  29. Cygan, R.T.; Liang, J.J.; Kalinichev, A.G. Molecular models of hydroxide, oxyhydroxide, and clay phases and the development of a general force field. J. Phys. Chem. B 2004, 108, 1255–1266. [Google Scholar] [CrossRef]
  30. Edelman, C.H.; Favejee, J.C.L. On the crystal structure of montmorillonite and halloysite. Z. Kristallogr. 1940, 102, 417–431. [Google Scholar] [CrossRef]
  31. Kwon, K.D.; Newton, A.G. Structure and stability of pyrophyllite edge surfaces: Effect of temperature and water chemical potential. Geochim. Cosmochim. Acta 2016, 190, 100–114. [Google Scholar] [CrossRef]
  32. Newton, A.; Kwon, K.; Cheong, D.-K. Edge structure of montmorillonite from atomistic simulations. Minerals 2016, 6, 25. [Google Scholar] [CrossRef]
  33. Bleam, W.F.; Welhouse, G.J.; Janowiak, M.A. The surface coulomb energy and proton coulomb potentials of pyrophyllite (010), (110), (100), and (130) edges. Clays Clay Miner. 1993, 41, 305–316. [Google Scholar] [CrossRef]
  34. Suter, J.L.; Kabalan, L.; Khader, M.; Coveney, P.V. Ab initio molecular dynamics study of the interlayer and micropore structure of aqueous montmorillonite clays. Geochim. Cosmochim. Acta 2015, 169, 17–29. [Google Scholar] [CrossRef]
  35. Cadars, S.; Guegan, R.; Garaga, M.N.; Bourrat, X.; Le Forestier, L.; Fayon, F.; Huynh, T.V.; Allier, T.; Nour, Z.; Massiot, D. New insights into the molecular structures, compositions, and cation distributions in synthetic and natural montmorillonite clays. Chem. Mater. 2012, 24, 4376–4389. [Google Scholar] [CrossRef]
  36. Sainz-Diaz, C.I.; Timon, V.; Botella, V.; Artacho, E.; Hernandez-Laguna, A. Quantum mechanical calculations of dioctahedral 2:1 phyllosilicates: Effect of octahedral cation distributions in pyrophyllite, illite, and smectite. Am. Mineral. 2002, 87, 958–965. [Google Scholar] [CrossRef]
  37. Sainz-Díaz, C.I.; Cuadros, J.; Hernández-Laguna, A. Analysis of cation distribution in the octahedral sheet of dioctahedral 2:1 phyllosilicates by using inverse monte carlo methods. Phys. Chem. Miner. 2001, 28, 445–454. [Google Scholar]
  38. Lantenois, S.; Champallier, R.; Bény, J.M.; Muller, F. Hydrothermal synthesis and characterization of dioctahedral smectites: A montmorillonites series. Appl. Clay Sci. 2008, 38, 165–178. [Google Scholar] [CrossRef]
  39. Reinholdt, M.; Brendlé, J.; Tuilier, M.-H.; Kaliaguine, S.; Ambroise, E. Hydrothermal synthesis and characterization of Ni-Al montmorillonite-like phyllosilicates. Nanomaterials 2013, 3, 48–69. [Google Scholar] [CrossRef] [PubMed]
  40. Reinholdt, M.; Miehe-Brendle, J.; Delmotte, L.; Le Dred, R.; Tuilier, M.H. Synthesis and characterization of montmorillonite-type phyllosilicates in a fluoride medium. Clay Min. 2005, 40, 177–190. [Google Scholar] [CrossRef]
  41. Reinholdt, M.; Miehe-Brendle, J.; Delmotte, L.; Tuilier, M.H.; le Dred, R.; Cortes, R.; Flank, A.M. Fluorine route synthesis of montmorillonites containing Mg or Zn and characterization by XRD, thermal analysis, MAS-NMR, and EXAFS spectroscopy. Eur. J. Inorg. Chem. 2001, 2831–2841. [Google Scholar] [CrossRef]
  42. Emmerich, K.; Wolters, F.; Kahr, G.; Lagaly, G. Clay profiling: The classification of montmorillonites. Clays Clay Miner. 2009, 57, 104–114. [Google Scholar] [CrossRef]
  43. Berendsen, H.J.C.; Grigera, J.R.; Straatsma, T.P. The missing term in effective pair potentials. J. Phys. Chem. 1987, 91, 6269–6271. [Google Scholar] [CrossRef]
  44. Lopez-Lemus, J.; Chapela, G.A.; Alejandre, J. Effect of flexibility on surface tension and coexisting densities of water. J. Chem. Phys. 2008, 128, 174703. [Google Scholar] [CrossRef] [PubMed]
  45. Karasawa, N.; Goddard, W.A. Acceleration of convergence for lattice sums. J. Phys. Chem. 1989, 93, 7320–7327. [Google Scholar] [CrossRef]
  46. Plimpton, S.J. Fast parallel algorithms for short-range molecular dynamics. J. Comput. Phys. 1995, 117, 1–19. [Google Scholar] [CrossRef]
  47. Ryckaert, J.-P.; Ciccotti, G.; Berendsen, H.J. Numerical integration of the cartesian equations of motion of a system with constraints: Molecular dynamics of n-alkanes. J. Comput. Phys. 1977, 23, 327–341. [Google Scholar] [CrossRef]
  48. Kumar, R.; Schmidt, J.R.; Skinner, J.L. Hydrogen bonding definitions and dynamics in liquid water. J. Chem. Phys. 2007, 126, 204107. [Google Scholar] [CrossRef] [PubMed]
  49. Humphrey, W.; Dalke, A.; Schulten, K. VMD: Visual molecular dynamics. J. Mol. Graph. 1996, 14, 33–38. [Google Scholar] [CrossRef]
  50. Clark, S.J.; Segall, M.D.; Pickard, C.J.; Hasnip, P.J.; Probert, M.J.; Refson, K.; Payne, M.C. First principles methods using CASTEP. Z. Kristallogr. 2005, 220, 567–570. [Google Scholar] [CrossRef]
  51. Vanderbilt, D. Soft self-consistent pseudopotentials in a generalized eigenvalue formalism. Phys. Rev. B Condens. Matter Mater. Phys. 1990, 41, 7892–7895. [Google Scholar] [CrossRef]
  52. Perdew, J.P.; Burke, K.; Ernzerhof, M. Generalized gradient approximation made simple. Phys. Rev. Lett. 1996, 77, 3865–3868. [Google Scholar] [CrossRef] [PubMed]
  53. Monkhorst, H.J.; Pack, J.D. Special points for brillouin-zone integrations. Phys. Rev. B 1976, 13, 5188–5192. [Google Scholar] [CrossRef]
  54. Leslie, M.; Gillan, M.J. The energy and elastic dipole tensor of defects in ionic-crystals calculated by the supercell method. J. Phys. C Solid State Phys. 1985, 18, 973–982. [Google Scholar] [CrossRef]
  55. Stumm, W.; Morgan, J.J. Aquatic Chemistry: Chemical Equilibria and Rates in Natural Waters, 3rd ed.; Wiley: New York, NY, USA, 1996. [Google Scholar]
  56. Mulliken, R.S.; Roothaan, C.C.J. Electronic population analysis on LCAO–MO molecular wave functions. I. J. Chem. Phys. 1955, 23, 1833–1840. [Google Scholar] [CrossRef]
  57. Bleuzen, A.; Pittet, P.A.; Helm, L.; Merbach, A.E. Water exchange on magnesium(II) in aqueous solution: A variable temperature and pressure 17O NMR study. Magn. Reson. Chem. 1997, 35, 765–773. [Google Scholar] [CrossRef]
  58. Neely, J.; Connick, R. Rate of water exchange from hydrated magnesium ion. J. Am. Chem. Soc. 1970, 92, 3476–3478. [Google Scholar] [CrossRef]
  59. Zhang, C.; Liu, X.; Lu, X.; Meijer, E.J.; Wang, K.; He, M.; Wang, R. Cadmium(II) complexes adsorbed on clay edge surfaces: Insight from first principles molecular dynamics simulation. Clays Clay Miner. 2016, 64, 337–347. [Google Scholar] [CrossRef]
  60. Churakov, S.V.; Dähn, R. Zinc adsorption on clays inferred from atomistic simulations and EXAFS spectroscopy. Environ. Sci. Technol. 2012, 46, 5713–5719. [Google Scholar] [CrossRef] [PubMed]
  61. Dähn, R.; Scheidegger, A.M.; Manceau, A.; Schlegel, M.L.; Baeyens, B.; Bradbury, M.H.; Chateigner, D. Structural evidence for the sorption of Ni(II) atoms on the edges of montmorillonite clay minerals: A polarized X-ray absorption fine structure study. Geochim. Cosmochim. Acta 2003, 67, 1–15. [Google Scholar] [CrossRef]
  62. Bailey, S.W. Structures of layer silicates. In Crystal Structures of Clay Minerals and Their X-ray Indentification; Brindley, G.W., Brown, G., Eds.; Mineralogical Society: London, UK, 1980; Volume 5, pp. 1–124. [Google Scholar]
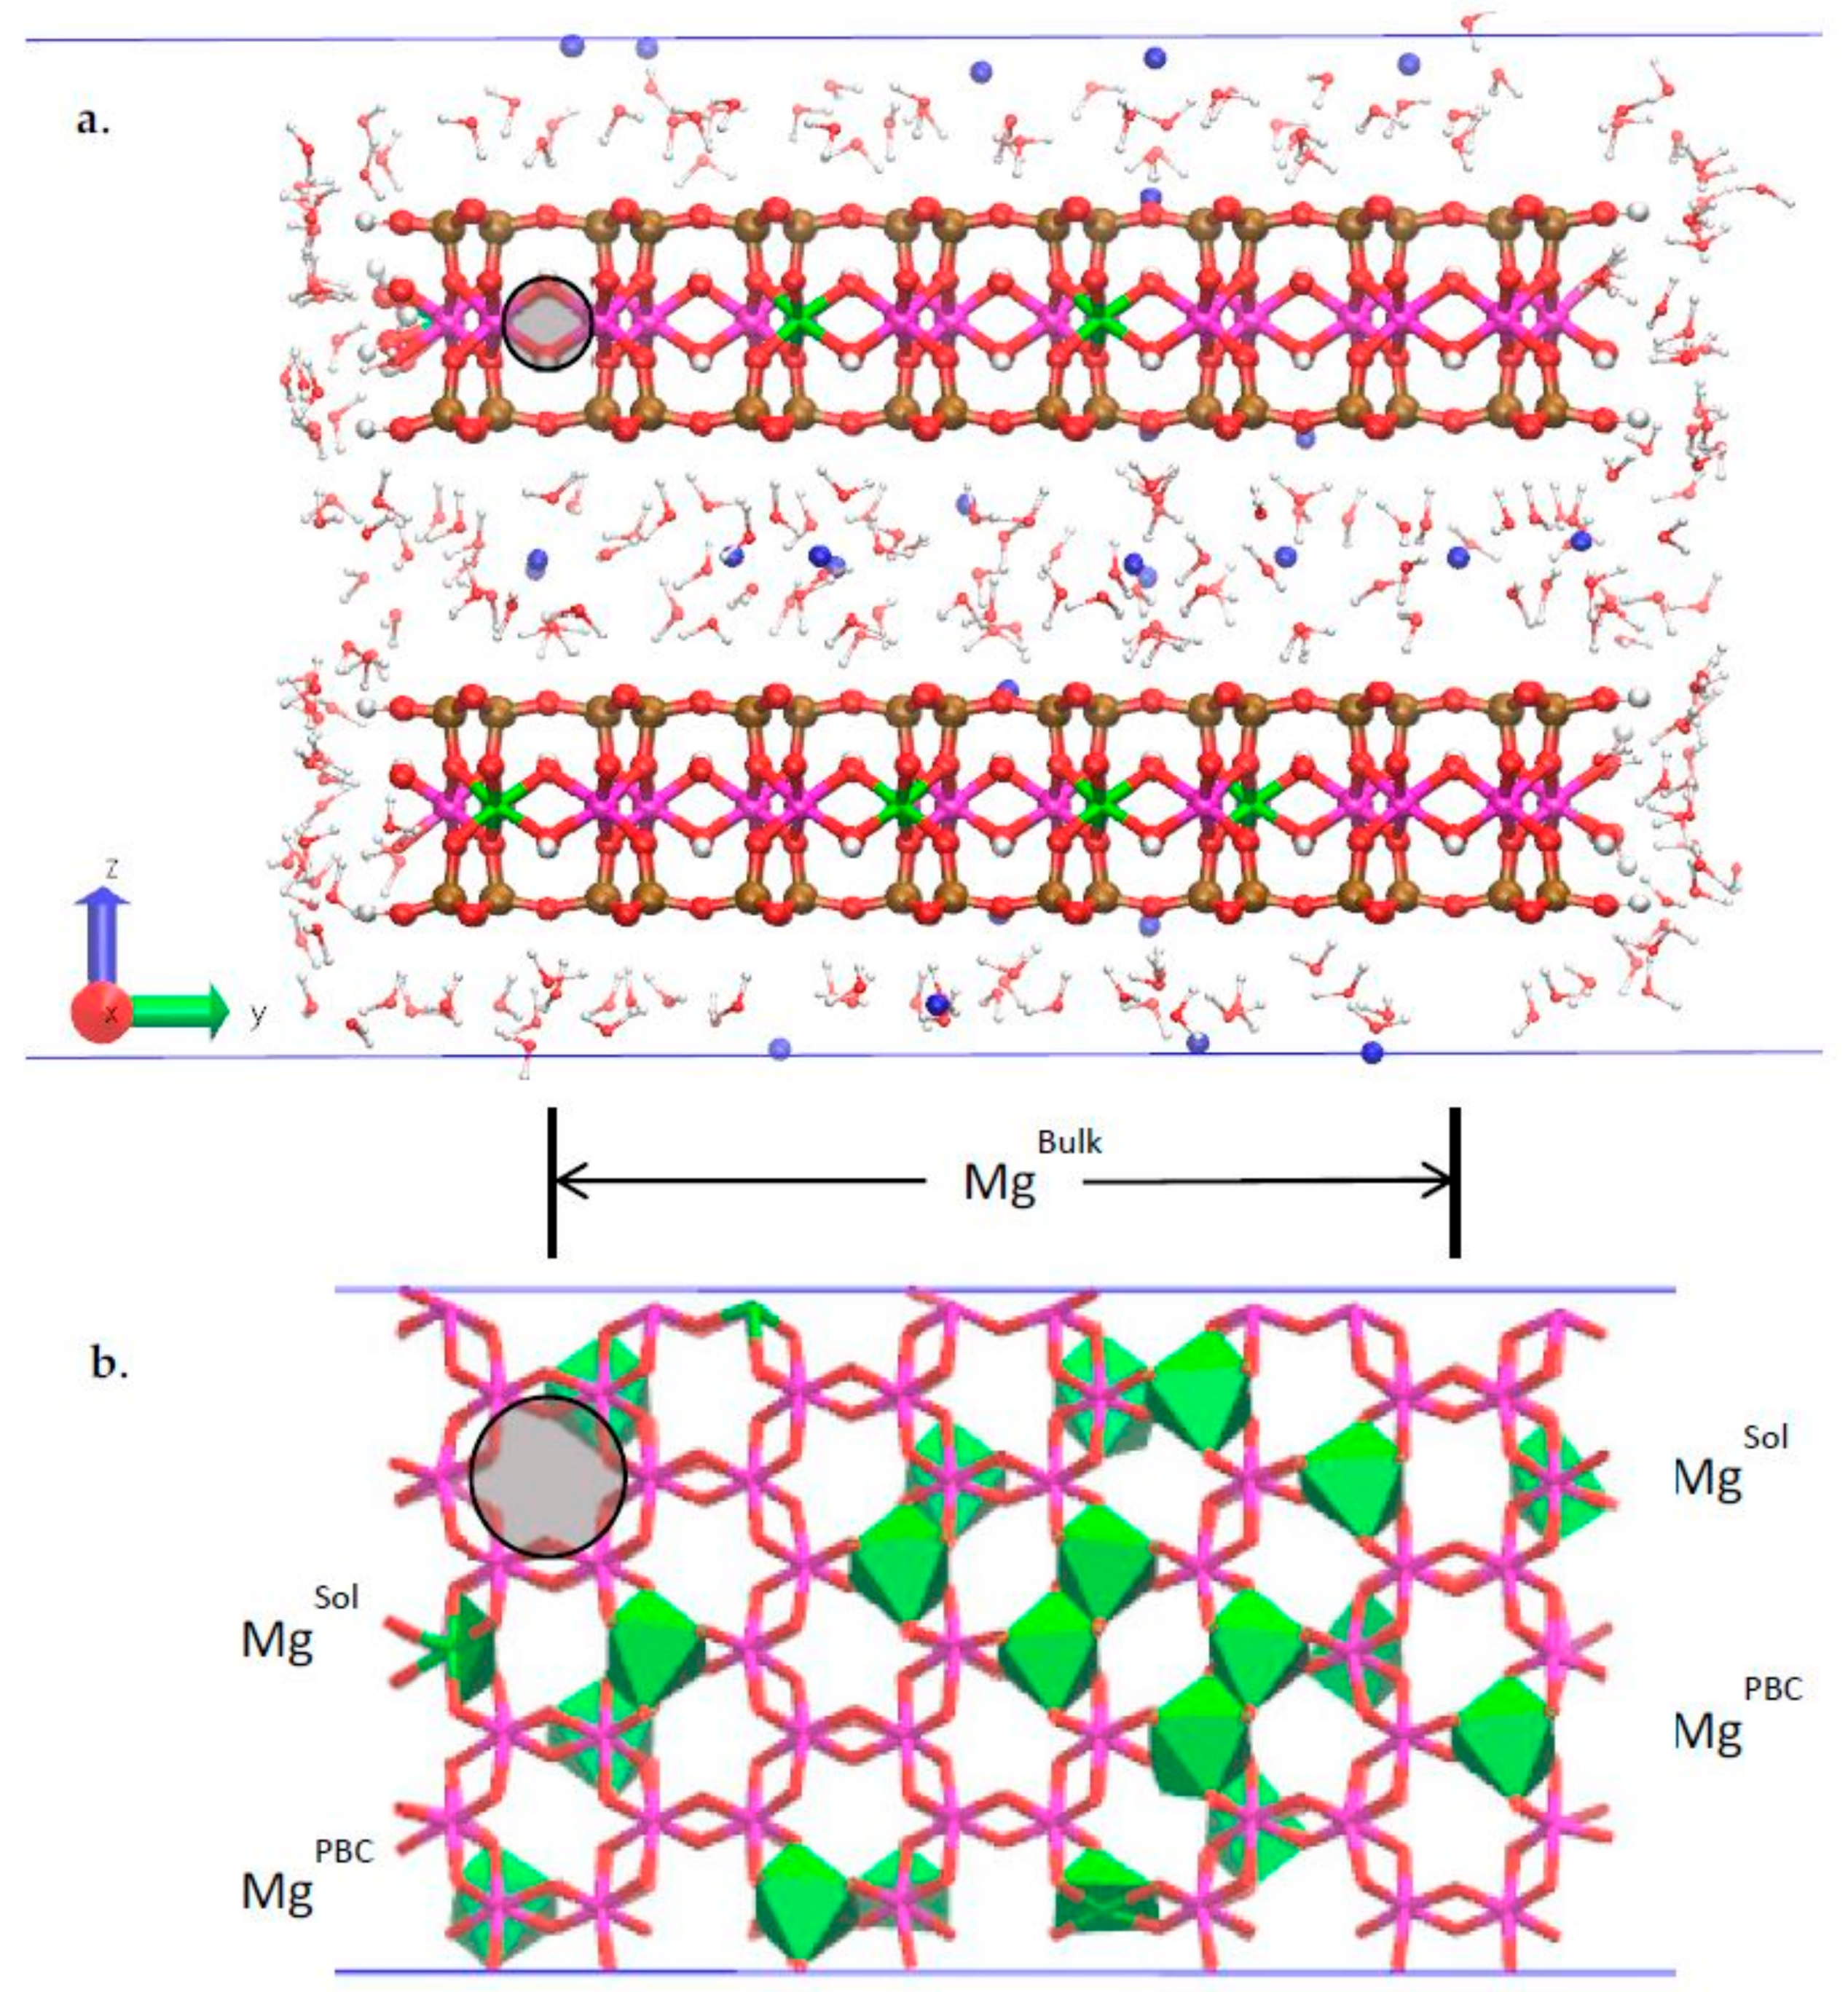
Figure 1. (a) Profile of Na-montmorillonite (Na–MMT) model after the equilibration of the aqueous phase and just prior to the release of the montmorillonite (MMT) atoms from their initial positions. Al = magenta; Mg = green; Si = ochre; O = red; H = white; Na = blue; (b) Plan view of the octahedral sheets from the Na–MMT structure showing the locations of the random Mg substitutions (green polyhedra). The Mg substitutions in the lower sheet can be distinguished from those in the upper sheet by the stick representations of the octahedral Al–O bonds imposed above the green polyhedra. MgSol = solvent accessible Mg; MgPBC = solvent inaccessible Mg substitutions in the linking PBC positions; MgBulk = Mg substitutions in the bulk of the MMT octahedral sheets. Trans-vacant octahedral sites noted with black shaded circles.
Minerals 07 00078 g001
Figure 2. Density functional theory (DFT) geometry-optimized Na–MMT B edge structure at (a) a low layer charge (x1 = 0.25) and (b) a higher layer charge (x2 = 0.375). The bulk, linking periodic bond chain (PBC), and solvent accessible atom positions in the octahedral sheet are defined. The atom legend is as in Figure 1. The hydrogen bonds are shown as dashed blue lines.
Minerals 07 00078 g002
Figure 3. Na–MMT models geometry-optimized by DFT with layer charges (a) x1 = 0.25 and (b) x2 = 0.375; oblique views are provided for the layer charges (c) x1 = 0.25 and (d) x2 = 0.375. Both the Mgsol and Alsol of the low layer charge model are in six-fold coordination. The Alsol of the high layer charge model are in trigonal bipyramidal coordination with the surface hydroxyl stabilized through the H-bonds of water bridges. The asymmetric Mg–OH2 bonds and H-bond patterns are evident in the oblique views of the interfaces. The atom legend is the same as in Figure 1; hydrogen bonds are shown as dashed blue lines.
Minerals 07 00078 g003
Figure 4. Na–MMT edge structures taken from the MD simulation trajectory at t = 5.0 ns with substitution in the (a) Mgpbc and (b) Mgsol positions. Both of the Alsol that share an edge with the Mgpbc are in trigonal bipyramidal coordination with oxygen. The Mgsol and adjacent Alsol are both in octahedral coordination with oxygen. The atom legend is the same as in Figure 1; Hydrogen bonds are shown as dashed blue lines.
Minerals 07 00078 g004
Figure 5. Frequency distribution for the ≡Al–O–H angles of the hydrolyzed Al adjacent to the Mgsol sites during the final 1.0 ns of the 5.0 ns MD trajectory. The individual and cumulative frequency distributions are provided for each of the four relevant ≡Al–O–H angles. The Al superscripts correspond to the edge complexes in Figure 6; the subscript corresponds to the upper (1) or lower (2) hydroxyl coordinated to the edge Al.
Minerals 07 00078 g005
Figure 6. Na surface complexes (blue sphere) on the MMT B edge surface that are associated with (a) the octahedral sheet and (b) the tetrahedral sheet. The atom legend is the same as in Figure 4, with the additions of Al as octahedra; the first shell oxygen atoms being shown as orange; and the first shell Al, Mg, and Si as enlarged spheres. The half-maximum isosurface from the Na ion volumetric density maps are shown as transparent, blue, ovoid surfaces.
Minerals 07 00078 g006
Table 1. Relative total energies (Erel) for the low- and high-layer charge (x1 and x2) Na–MMT B edges with different proton distributions on the surface octahedra at the p.z.n.p.c.
Octahedral Surface GroupsErel (kJ/mol)
x1 = 0.25x2 = 0.375
≡Al–(OH)(OH2) + ≡Al–(OH)(OH2) *00
≡Mg–(OH)(OH2) + ≡Al–(OH)(OH2)−56.9158.1
≡Mg–(OH2)2 + ≡Al–(OH)2−98.485.8
≡Mg–(OH)2 + ≡Al–(OH2)279.1 n/r
* model with solvent-inaccessible Mg (MgPBC), whose total energy is the reference for the relative energy calculation; Initial octahedral surface groups are not stable. A spontaneous proton transfer occurred during geometry optimization. n/r: not reported.
Table 2. Interatomic distances for the lowest-energy DFT models of MMT B edges with layer charges of x1 = 0.25 or x2 = 0.375. The bulk octahedral cation-oxygen distances (Albulk– or Mgbulk–O) are included for comparison. The water and hydroxyl O atoms are denoted as Ow and Oh, respectively.
α-β PairInteratomic Distance (Å)
x1 = 0.25x2 = 0.375
Alsol–O1.941.85
Alsol–Ow-3.74
Alsol–Oh1.851.80
Alpbc–O1.921.91
Mgsol–O2.12-
Mgsol–Ow2.32-
Mgpbc–O-2.07
Albulk–O1.931.92
Mgbulk–O-2.07
Table 3. Cation-oxygen (α-β) pair distribution functions of the octahedral sheet of the Na–MMT model from classical molecular dynamics (MD) simulations. The pair distribution functions are summarized by the distance to the first peak (rpeak), coordination number (CN), the first minimum (ρ) of the cation–O pair distribution for the solvent accessible (sol), and the solvent-inaccessible (pbc) positions of the edge PBC and bulk positions in the octahedral sheet. The standard deviation for each property (+/−) is provided. Ow and Oh represent the O of water and hydroxyl, respectively.
α-β Pairrpeak (Å)+/−CN+/−ρ (Å)+/−
Alsol–O1.870.0115.720.0372.810.067
Alsol–Ow2.060.0220.570.0382.740.101
Alsol–Oh1.850.0081.140.0002.110.022
Alpbc–O1.950.0106.000.0012.670.036
Mgsol–O2.120.0175.990.0052.520.030
Mgsol–Ow2.200.0191.990.0042.520.028
Mgpbc–O2.110.0126.000.0032.440.027
Albulk–O1.930.0106.000.0002.710.028
Mgbulk–O2.110.0056.000.0002.460.025
Table 4. Hydrogen bonding to the edge surface groups. The average number of total H-bonds, N(H-bonds), is provided as well as the average number of H-bonds donated (D) and accepted (A) by the surface group. The H-bonds to the silanol surface groups are summarized for silanol groups in TOT units with ≡Al–(OH)(OH2) (i.e., ≡Si–OH), in TOT units with ≡Al–(OH)2 (i.e., ≡SiAl–OH), and in TOT units with ≡Mg–(OH2)2 (i.e., ≡SiMg–OH). The average number of H-bonds and standard deviation (+/−) was calculated from the final 1.0 ns of the 5.0 ns trajectory.
Surface GroupH-BondN(H-Bonds)+/−
≡Mg–(OH2)2Total1.540.287
-D1.530.281
-A0.010.050
≡Al–(OH)2Total1.460.329
-D0.470.244
-A0.990.186
≡Al(OH2)–(OH)Total1.750.198
-D0.650.132
-A1.100.140
≡Al(OH)–(OH2)Total1.240.233
-D1.240.231
-A0.010.043
≡Si–OHTotal1.310.132
-D0.780.081
-A0.530.106
≡SiAl–OHTotal1.180.308
-D0.790.200
-A0.390.230
≡SiMg–OHTotal1.500.375
-D0.860.173
-A0.640.297
Table 5. Pair distribution functions for the Na edge complexes in Figure 6a,b. The total Na–O RDF is further factored into the constituent O atom types: Ow, water oxygen; Oh, hydroxyl oxygen; and Ob, bridging oxygen. The a/b values for distances and CNs in the table correspond to the complexes in Figure 6a,b, respectively.
α-β Pairrpeak, ÅCNρ, Å
a/ba/ba/b
Na–O2.34/2.366.17/5.893.02/3.01
Na–Ow2.37/2.371.98/3.992.83/3.12
Na–Oh2.28/2.322.01/2.272.62/3.26
Na–Ob2.49/5.261.97/14.373.18/6.23
Na–Al3.27/3.532.99/1.013.91/3.99
Na–Mg7.94/6.540.99/1.008.34/7.20
Na–Si3.46/3.471.96/1.124.10/3.97