3.3.1. Spatial Relation Retrieval and Verification
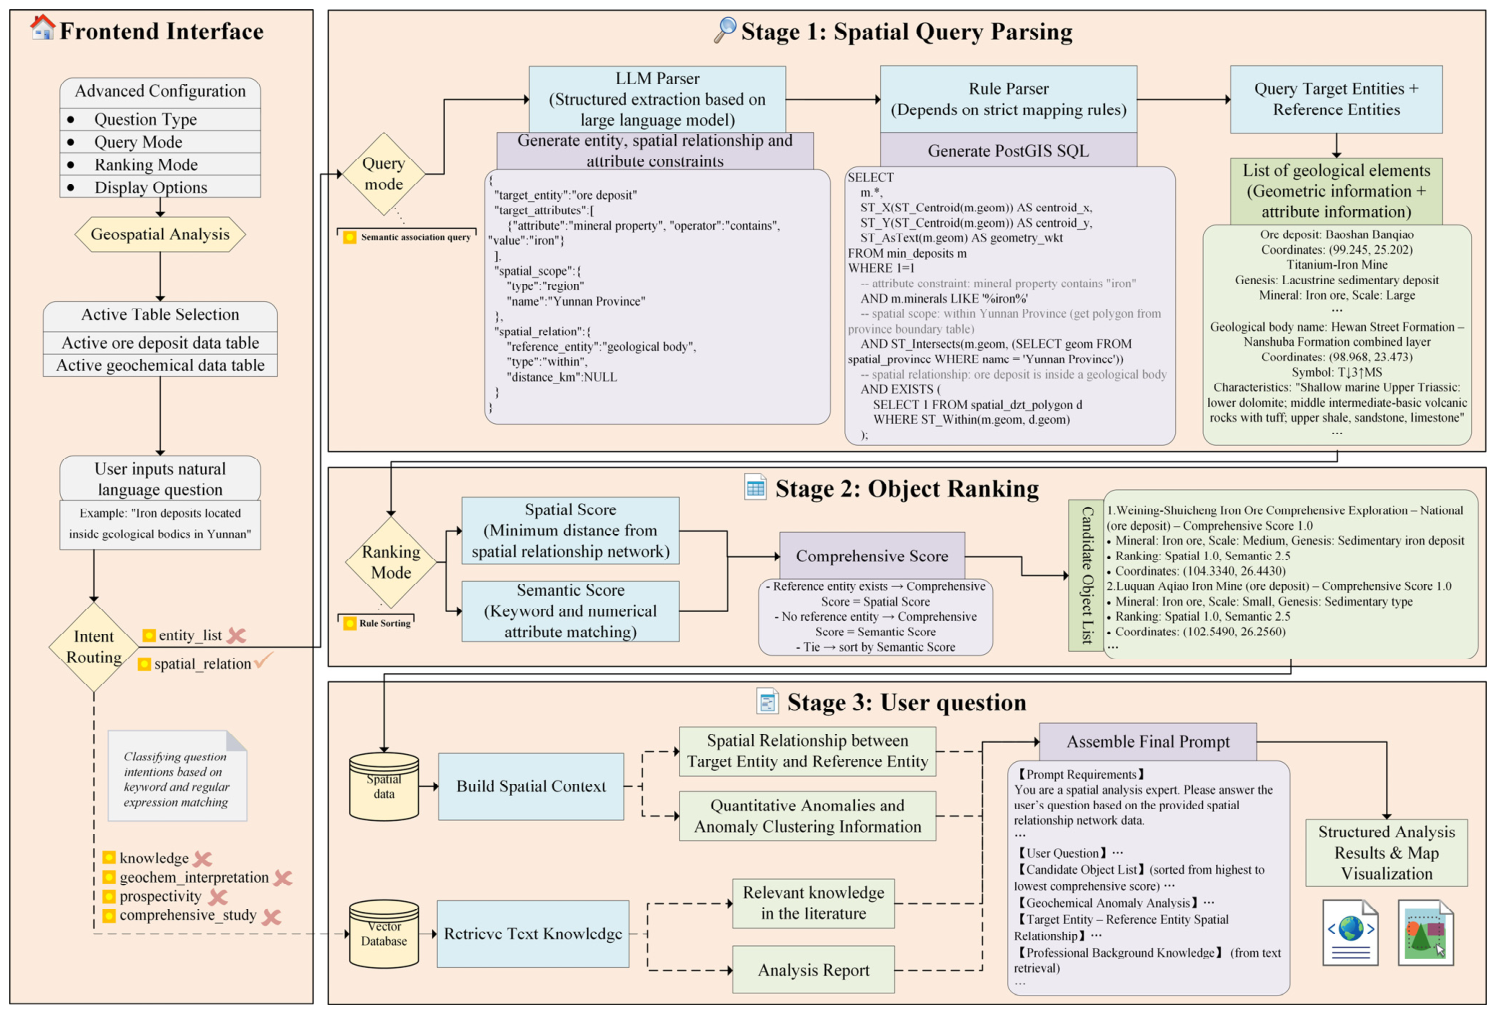
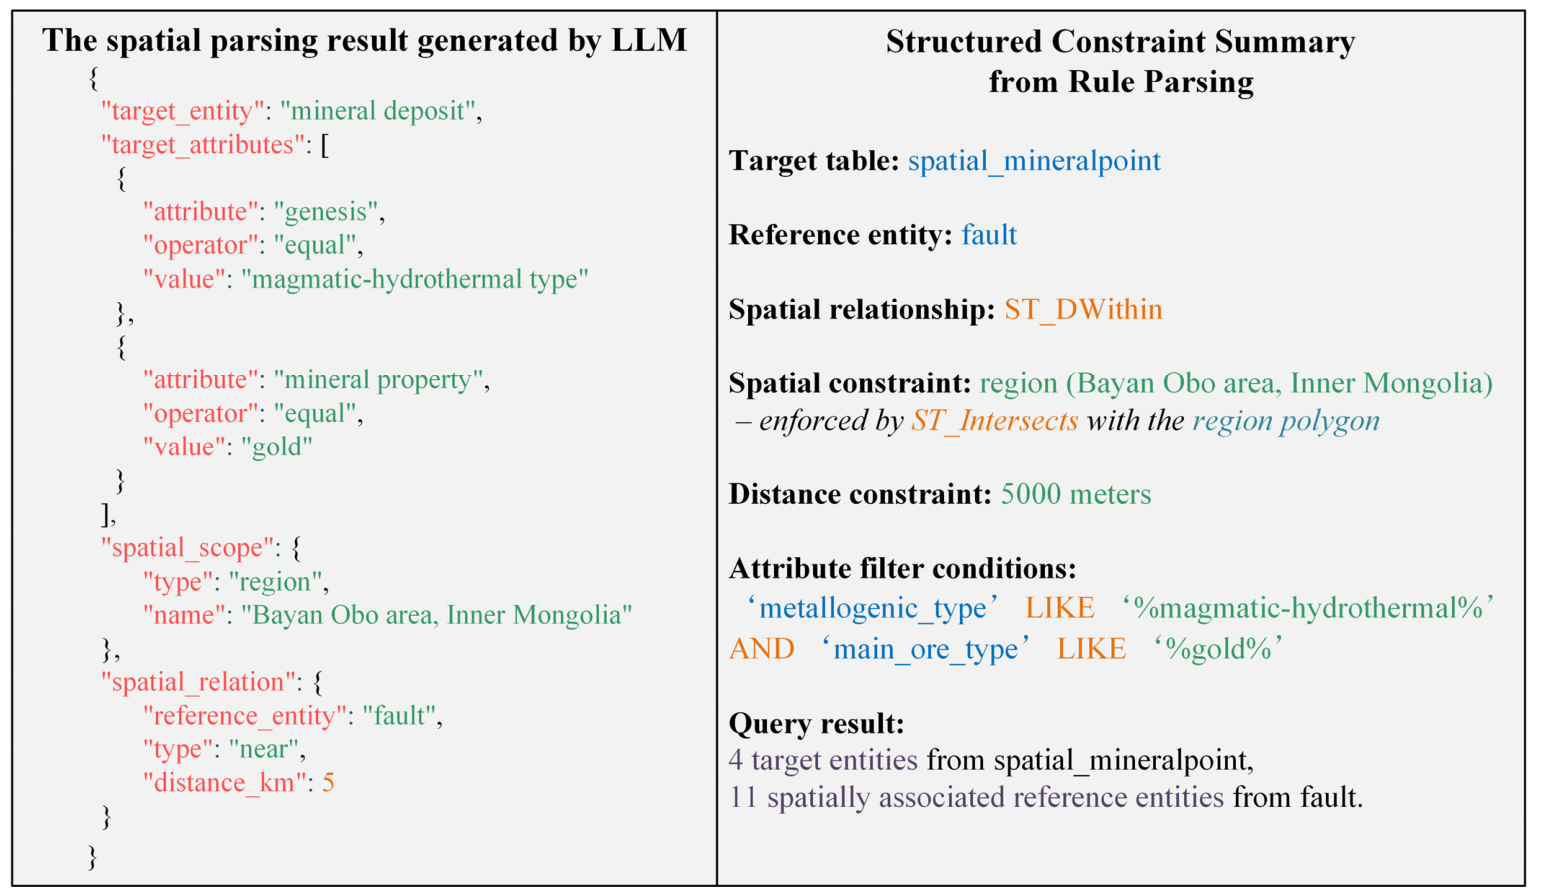
The following query was posed: “What magmatic-hydrothermal type gold deposits are located within 5 km of faults in the Bayan Obo area, Inner Mongolia?” The system first identifies it as a spatial relation query through the intent classifier and invokes the semantic parsing module to extract from the natural language the target entity type “ore occurrence”, attribute constraints “magmatic-hydrothermal type” and “gold”, spatial extent “Bayan Obo area, Inner Mongolia”, and spatial relation “within 5 km of faults”, as shown in
Figure 4. Subsequently, the rule parser dynamically generates a parameterized PostGIS SQL statement. It implements attribute constraints using LIKE fuzzy matching (metallogenic type containing “magmatic-hydrothermal type”, main mineral containing “gold”), restricts the query to the polygon boundary of the “Bayan Obo area, Inner Mongolia” using ST_Intersects, and filters ore occurrences within 5 km of faults using ST_DWithin combined with geographic coordinate system distance calculation (geometry::geography), while simultaneously obtaining the geometry information of reference faults to construct the spatial proximity verification module.
After the first-stage spatial query parsing, the system accurately obtains four ore occurrences and eleven faults that satisfy the attribute and spatial constraints, along with the corresponding list of geological semantic elements. Subsequently, the second-stage rule-based ranking module performs comprehensive scoring and ranking of the candidate ore occurrences, primarily based on spatial distance. The final candidate order is consistent with the order of ore occurrences in
Table 7 (arranged in ascending order of distance to fault). The spatial proximity verification module calculates the precise distance from each ore occurrence to the nearest fault. It not only retains the nearest reference entity but also lists other reference entities within the radius, ensuring that important structural information is not lost (see
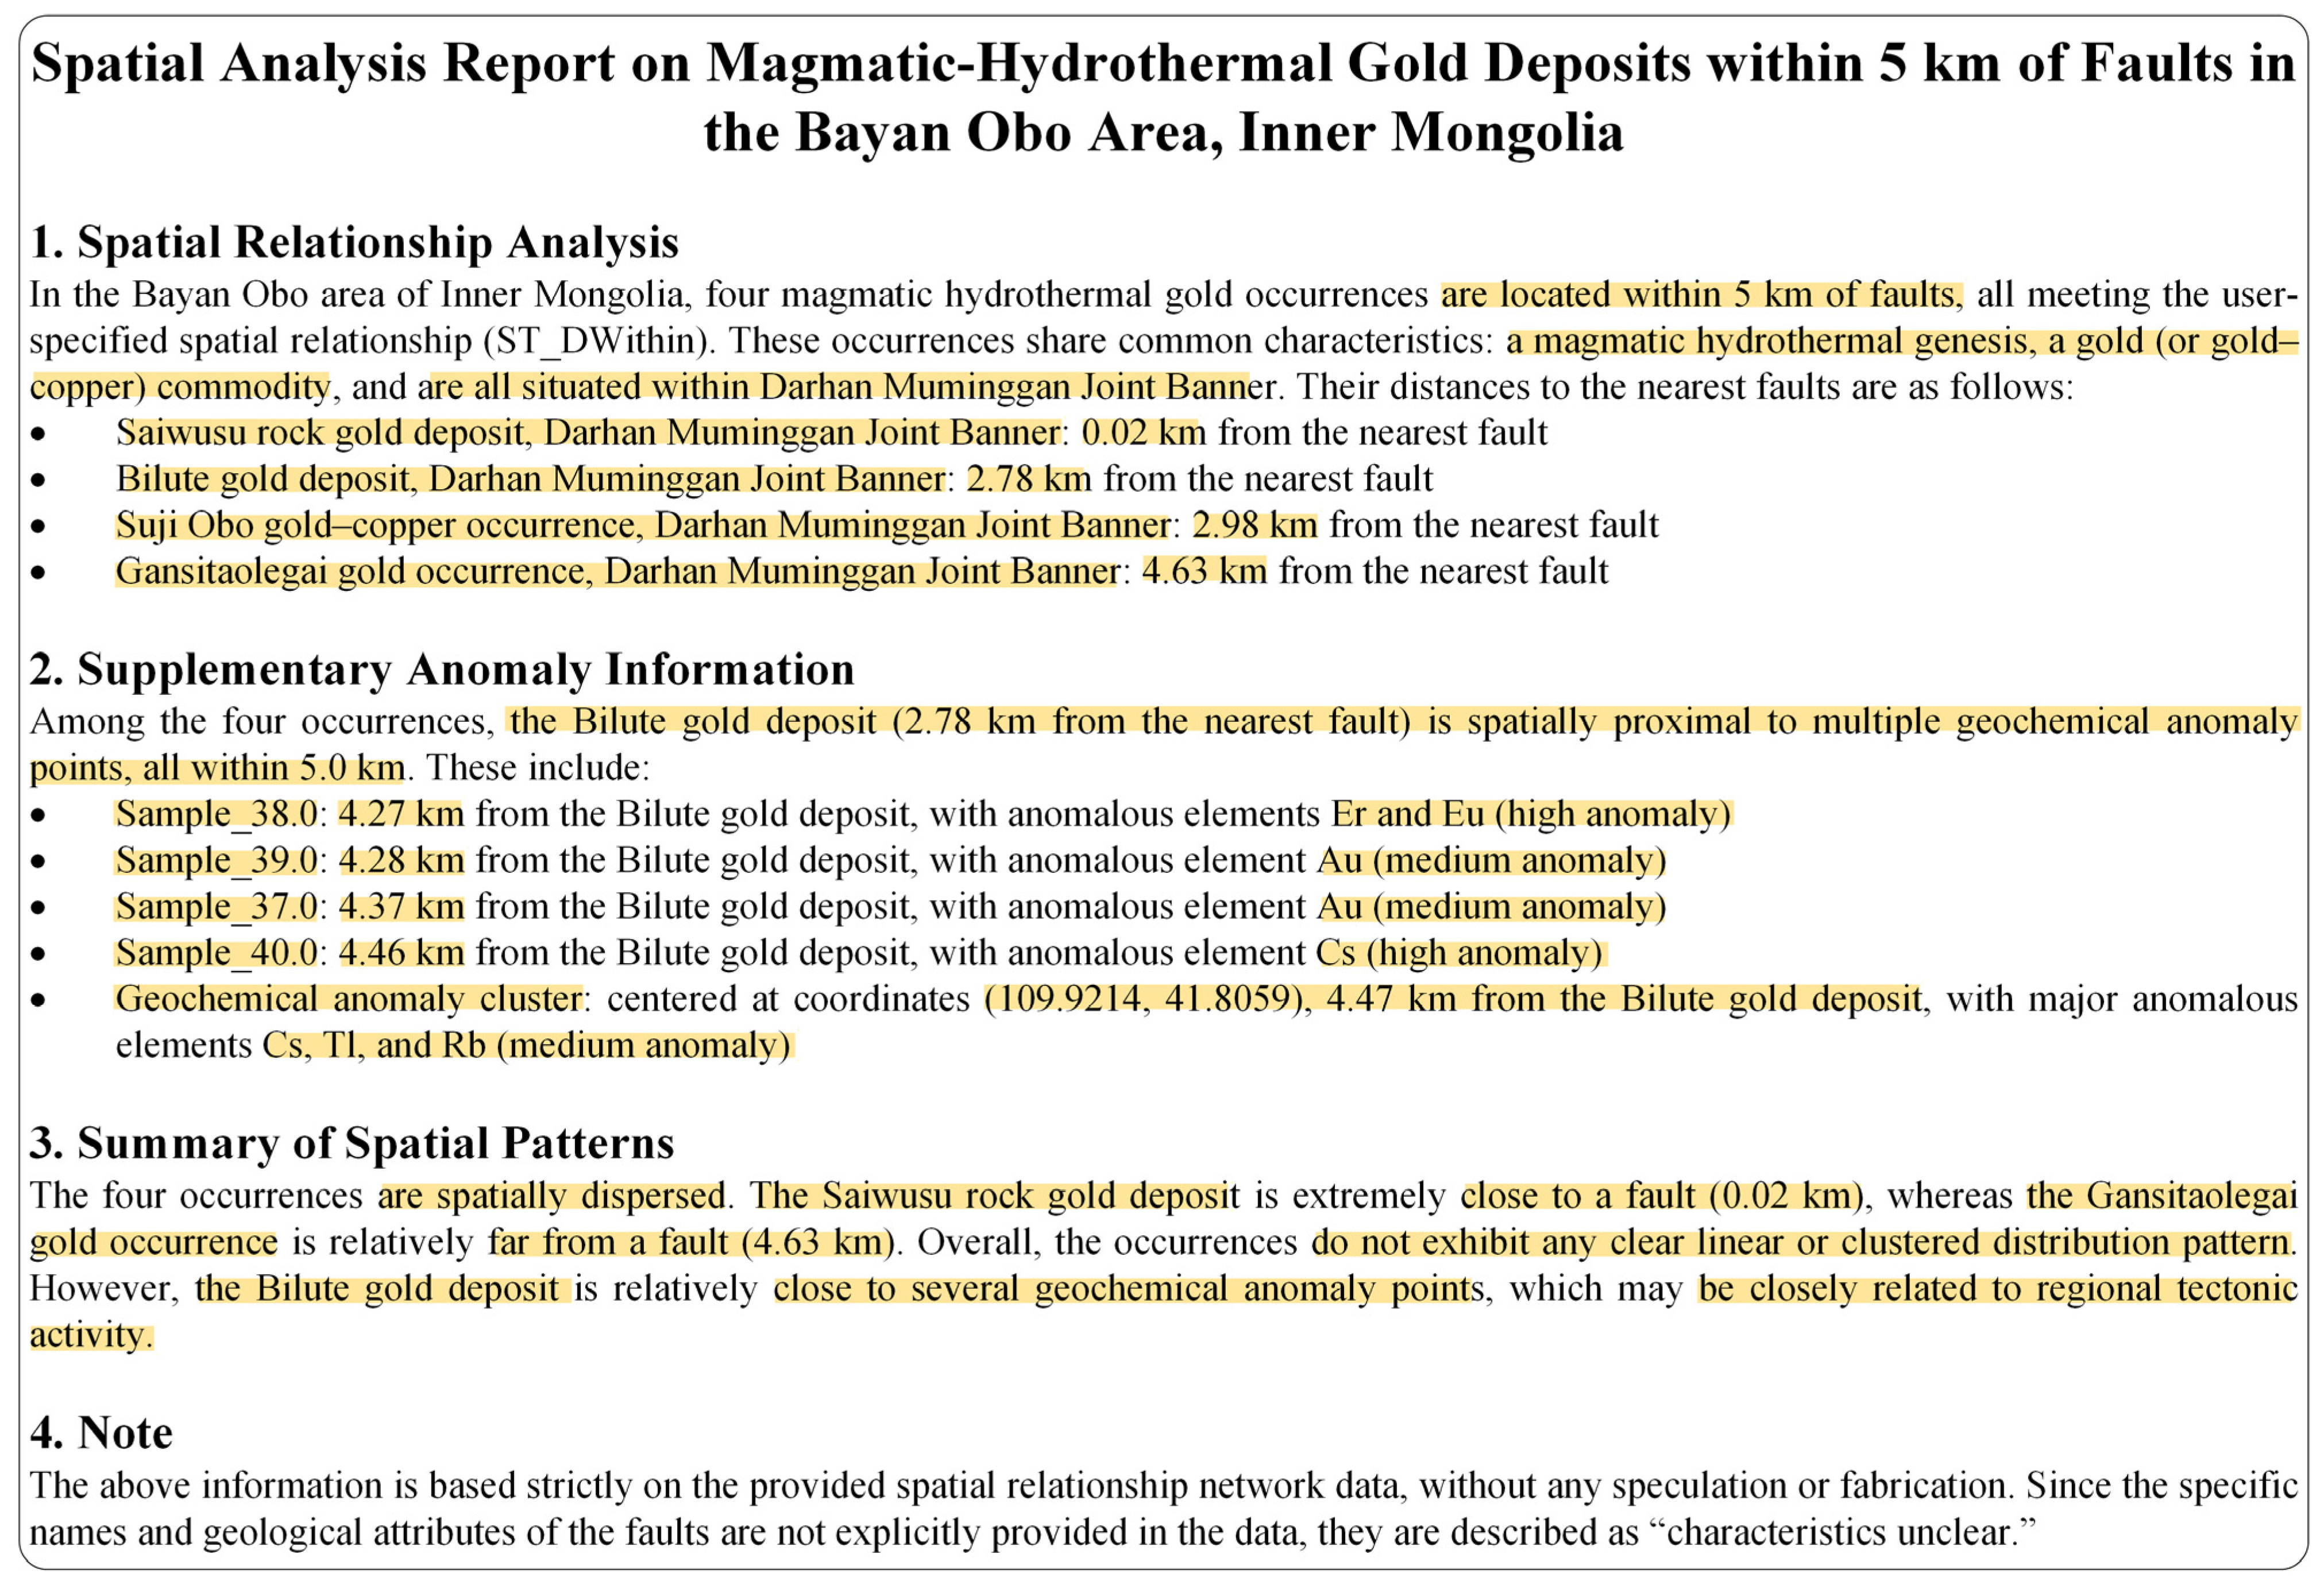
Table 7). The results show that the Saiwusu rock gold deposit is closest to a fault (0.02 km), followed by the Bilute gold deposit (2.78 km), the Sujiao’ao gold-copper prospect (2.98 km), and the Gansi Taolegai gold prospect (4.63 km), all satisfying the constraint. Although the nearest reference entity for all deposits is displayed as “unknown characteristics” due to incomplete attribute information, the spatial proximity module retains faults with detailed attributes among other reference entities within the radius. For example, the reference entities within the radius of the Saiwusu rock gold deposit include the northern margin fault belt of the North China Craton, described as “trending east-west, dipping north in the western segment and steep in the eastern segment, a boundary between the platform and the geosyncline, significantly controlling the tectonic evolution on both sides, extending eastward into Hebei and Liaoning”, at a precise distance of 2.84 km.
The system can adaptively decide whether to introduce geochemical anomaly information based on spatial proximity and element association, with the introduced information enriching the answer without interfering with core judgments. In this study, a data-driven quantile threshold method is adopted: the 95th percentile of each element’s concentration in the study area is used as the high-anomaly threshold, and the 75th percentile as the medium-anomaly threshold, to identify geochemical anomaly points at different anomaly levels. The main elements of anomaly clusters are derived based on the frequency of samples exceeding the high threshold within each cluster. Taking the Bilute gold deposit as an example, 12 high-intensity geochemical anomaly points are identified within a 4.3–5.0 km radius around it, with anomaly elements mainly including Au, Ag, Ce, Eu, Cs, etc. Among them, sample_38.0 is 4.27 km from the deposit, showing high anomalies of Er and Eu; sample_39.0 is 4.28 km away, showing a medium anomaly of Au. This anomaly information is spatially associated with the ore-forming fluid characteristics of magmatic-hydrothermal gold mineralization.
Based on the above data, the system generates an analysis report focusing on spatial distance judgment and incorporating anomaly background (see
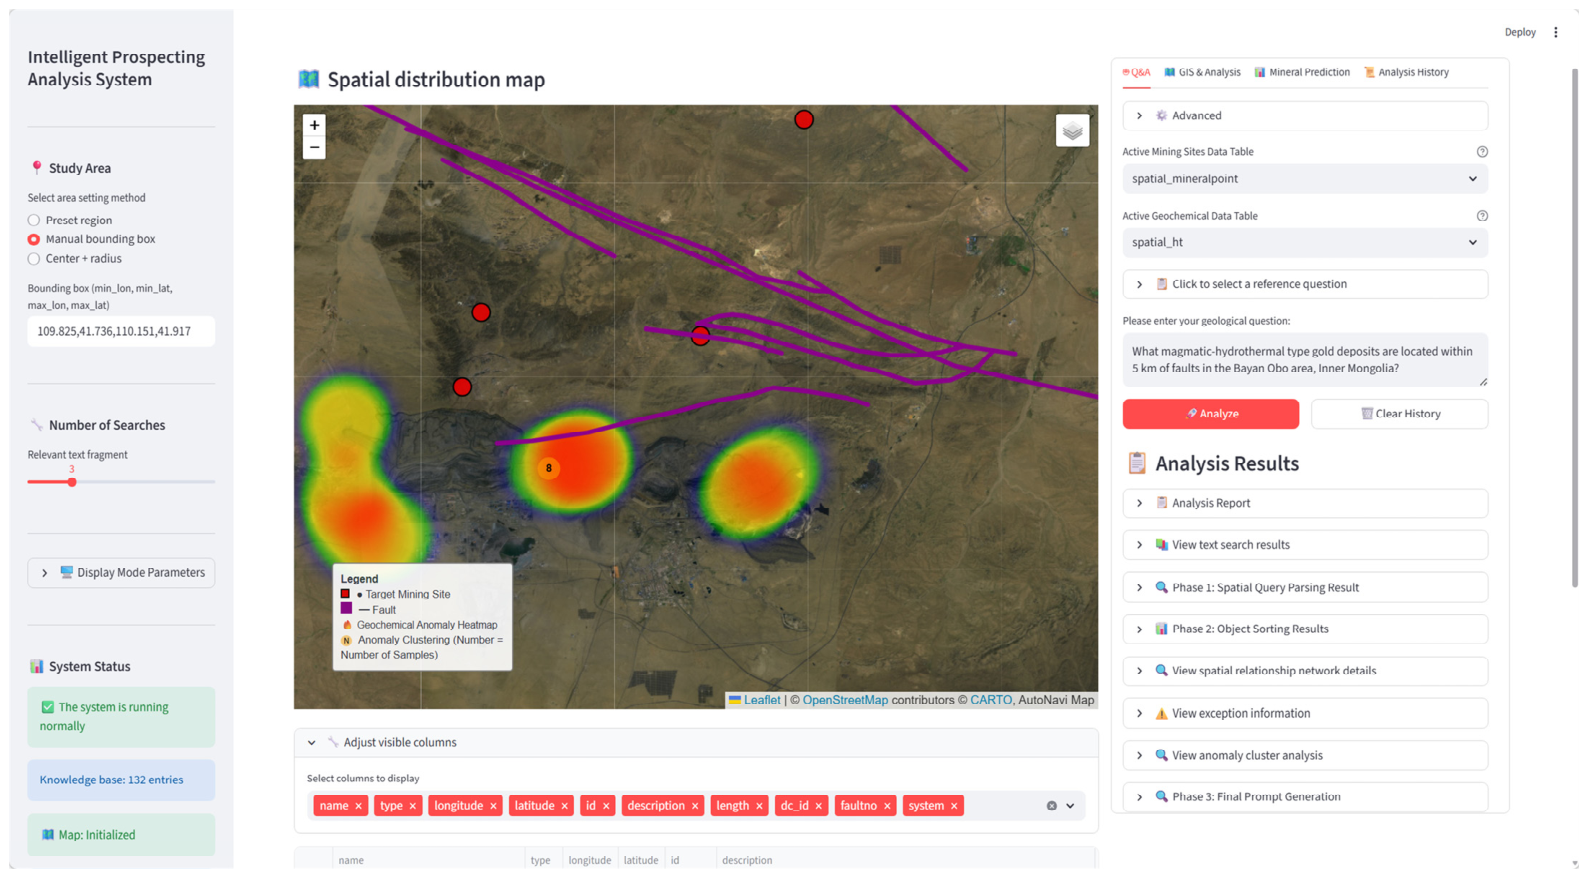
Figure 5). The report explicitly lists the precise distances from each deposit to the fault and the satisfaction of constraints, and supplements geochemical anomaly information around the Bilute gold deposit as auxiliary evidence. In the interactive map visualization (see
Figure 6), the system represents faults with purple lines, marks target deposits with red dots, and automatically overlays a geochemical anomaly heatmap and anomaly cluster digital markers (orange dots and numbers) within the deposit proximity threshold (5 km).
3.3.2. Comprehensive Interpretation and Metallogenic Prediction
A composite query was posed: “What is the geological significance of the REE-Fe-Nb composite anomalies in the Bayan Obo area, Inner Mongolia? What is the prospecting potential of this area?” The system first invokes the results of the element association analysis module. This analysis is based on 16,370 stream sediment samples in the study area, selecting 15 elements closely related to rare earth-niobium mineralization (La, Ce, Pr, Nd, Sm, Eu, Gd, Tb, Ho, Er, Tm, Lu, Nb, F, Zr). After log1p transformation and Z-score standardization, PCA, K-Means clustering, and R-type hierarchical clustering were performed.
PCA tests show Kaiser–Meyer–Olkin (KMO) is 0.824, Bartlett’s sphericity test
p < 0.05, indicating that the data are suitable for dimensionality reduction (see
Table 8). The first six principal components cumulatively explain 98.28% of the variance. PC1 (70.05%) reflects regional background geological characteristics, with strong correlations among rare earth elements (REEs) being the main reason for the high concentration of variance [
35,
36]; PC2 (14.20%) shows positive loadings of Lu, Tm, Ho, Er and negative loadings of La, Eu, Ce, indicating light-heavy rare earth fractionation [
35,
37], and this principal component has the highest number of anomalous samples (451), suggesting the need for investigation in conjunction with fault zones and hydrothermal activity centers; PC3 (5.09%) is characterized by a high loading of Zr (0.872) and a key negative loading of F (−0.380), reflecting the geochemical separation of Zr and the volatile element F during the early magmatic-hydrothermal stage, indicating the control of multi-stage magmatic-hydrothermal activity on element fractionation [
38]; PC4 (4.12%) has positive loadings of F (0.715), Eu (0.368), Zr (0.366), corresponding to fluoritization and REE-Zr co-enrichment, which may be direct evidence of fluorine-rich hydrothermal overprinting and reflects the strong modification of the H8 unit by Paleozoic fluids [
36,
38]; PC5 (2.82%) has positive loadings of Eu (0.535), Tb (0.411) and negative loadings of Nd (−0.328), F (−0.517), reflecting late Eu anomaly and F depletion, representing the rare earth fractionation stage at the end of hydrothermal evolution [
36,
38]; PC6 (2.00%) has a loading of Nb as high as 0.910, with extremely low loadings for other elements, likely reflecting an independent Nb enrichment event caused by late hydrothermal activity superimposed on rare earth mineralization [
36,
38].
K-Means clustering (K = 3) yields a silhouette coefficient of 0.394 [
39], indicating some overlap between clusters and moderately weak clustering characteristics (see
Table 9). The samples are divided into three classes, among which Class 3 (399 samples) has significantly higher dimensionless center values (after log1p transformation) for La, Ce, F, Zr, Nb than the first two classes (La = 5.83, Ce = 6.13, F = 7.84, Zr = 5.26, Nb = 4.71), representing a high-background mineralization group.
R-type hierarchical clustering divides the 15 elements into two groups. Group 1 consists of Ho-Er-Tm-Lu, a heavy rare earth combination, possibly indicating late hydrothermal activity; Group 2 consists of La-Ce-Pr-Nd-Sm-Eu-Gd-Tb-Nb-F-Zr, where the close combination of light rare earths, niobium, and fluorine is consistent with the element paragenesis of carbonatite-type rare earth-iron-niobium deposits [
35,
36,
38]. The inclusion of zircon may reflect the contribution of granites or clastic rocks to stream sediments; the Bayan Obo area contains Paleozoic granites and Proterozoic clastic rocks rich in zircon, whereas carbonatites themselves are typically depleted in zircon, so the two are not contradictory [
35,
36,
37,
38].
Interface screenshots of the element association analysis (PCA, K-Means clustering, and hierarchical clustering) are shown in
Figures S1–S3. The analysis reports from the element association analysis are automatically saved to the ChromaDB vector knowledge base for later retrieval during question answering.
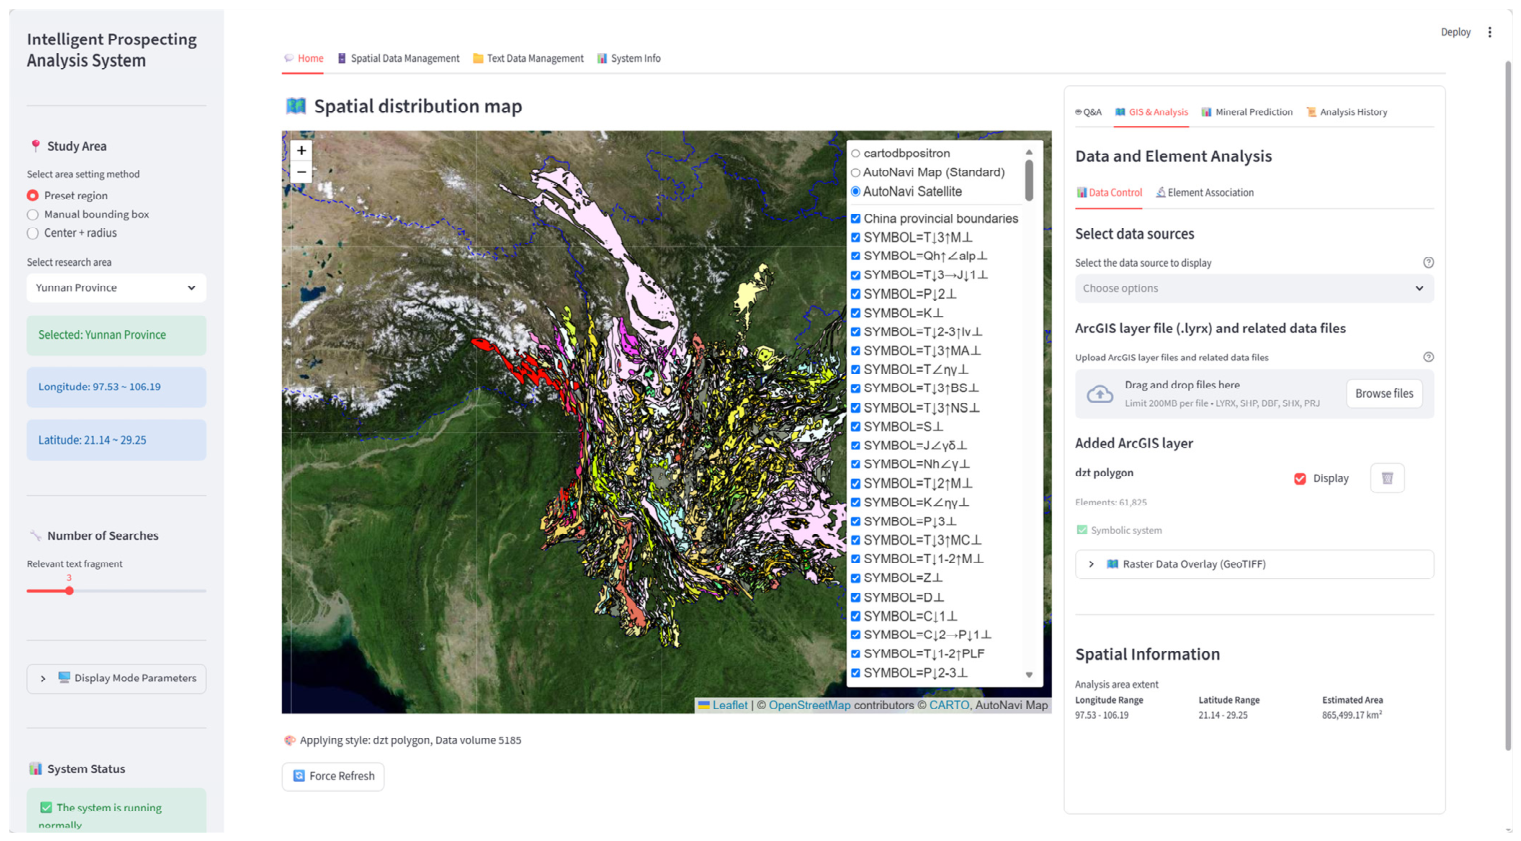
In the metallogenic prediction interface, the model training used a grid size of 200 m, an ore occurrence buffer radius of 1000 m, the number of trees set to 50, and features including distance to faults, the 15 elements mentioned above, and geological body type. To overcome extreme positive-negative sample imbalance (only 313 positive samples) and spatial autocorrelation, undersampling was used for balancing (313 positive and 313 negative), and 5-fold spatial cross-validation was performed to evaluate generalization ability (see the right-side operation panel in
Figure 7). The results show that the model achieves AUCs (Area Under the Curve values) of 0.727, 0.671, 0.999, and 0.864 on the first four folds, with the fifth fold yielding no computable AUC because its spatial test block contained zero positive samples (known mineral occurrences). This is an inherent consequence of the strict spatial block isolation (block size 0.05 degrees, approximately 5 km) applied to highly imbalanced prospecting data, where positive samples are sparsely distributed and may be absent from an individual test block. The mean AUC is 0.815 (standard deviation 0.127, computed over the four folds with valid AUC) and the mean accuracy is 0.915 (standard deviation 0.048, over all five folds), indicating moderately strong but variable discriminative ability in unknown spatial regions.
To investigate whether the near-perfect AUC of 0.999 on the third fold indicates feature leakage, a block-size sensitivity analysis was conducted by varying the spatial block size from 0.02 degrees to 0.10 degrees (approximately 2–11 km) with 10 repeated spatial cross-validation runs per block size (
Table 10). Note that the sensitivity analysis uses 10 repeated runs with downsampling balance, so the 0.05 degrees row in
Table 10 (mean AUC 0.771) differs from the single-run result (mean AUC 0.815) reported above. High-AUC folds (>0.99) occur across block sizes from 0.02 to 0.07 degrees (6.0%–16.0% of folds) and are strongly associated with very few positive test samples (mean 6.5 positives in high-AUC folds versus 91.2 in normal folds; see Data Availability Statement). Their frequency peaks at 0.05 degrees (16.0%) and declines toward both smaller (0.02 degrees: 6.0%) and larger (0.10 degrees: 0.0%) blocks—a non-monotonic pattern that is inconsistent with feature leakage, since smaller blocks with higher spatial autocorrelation would produce more, not fewer, high-AUC folds if leakage were present. Instead, the peak reflects the interaction between block count and positive-sample distribution: the intermediate 0.05-degree partitioning (32 blocks, ~6 test blocks per fold) occasionally yields test sets with as few as 3–7 positive samples, destabilizing AUC; smaller block sizes (e.g., 0.02 degrees, 180 blocks, ~36 test blocks per fold) provide more positives per test set and stabilize the metric, while larger blocks (e.g., 0.10 degrees, 10 blocks) either produce zero-positive folds or distribute positives too evenly for instability. At the largest block size (0.10 degrees), high-AUC folds disappear entirely, but two of five folds contain zero positive samples, rendering AUC computation impossible. These findings suggest that the near-perfect AUC values are likely a statistical artifact of extreme class imbalance under strict spatial block isolation rather than definitive evidence of feature leakage.
The feature importance ranking (see
Table 11) shows that distance to faults (19.87%) and geological body type (17.02%) are the most important ore-controlling factors, with faults dominating fluid migration and geological bodies controlling element enrichment [
32,
33,
34,
35,
36,
37,
38]. Additionally, elements such as F (8.32%), Tm (6.82%), and Ho (6.75%) also contribute significantly. F promotes rare earth enrichment through three aspects: fluid complexation, mineral precipitation, and magmatic differentiation [
36,
37,
38]; Tm and Ho, as less abundant heavy REEs, can theoretically participate in the formation of light rare earth minerals (e.g., monazite, bastnäsite) through lattice substitution and can serve as tracers of the degree of magmatic differentiation and evolution, indirectly reflecting the characteristics of the metallogenic environment [
35,
36,
38].
Based on the predicted probabilities, the study area is divided into three potential levels by quantiles: high-potential areas are the top 1% of grids (probability ≥ 0.9344), totaling 184 target areas, with typical coordinates such as (109.9613, 41.8063), (109.9685, 41.8027), etc.; medium-potential areas are the top 1%–10% of grids (0.4619 ≤ probability < 0.9344); and low-potential areas have probability < 0.4619. The probability map’s high-value centers align with known ore occurrences, while high-potential areas concentrate at fault intersections and specific geological bodies.
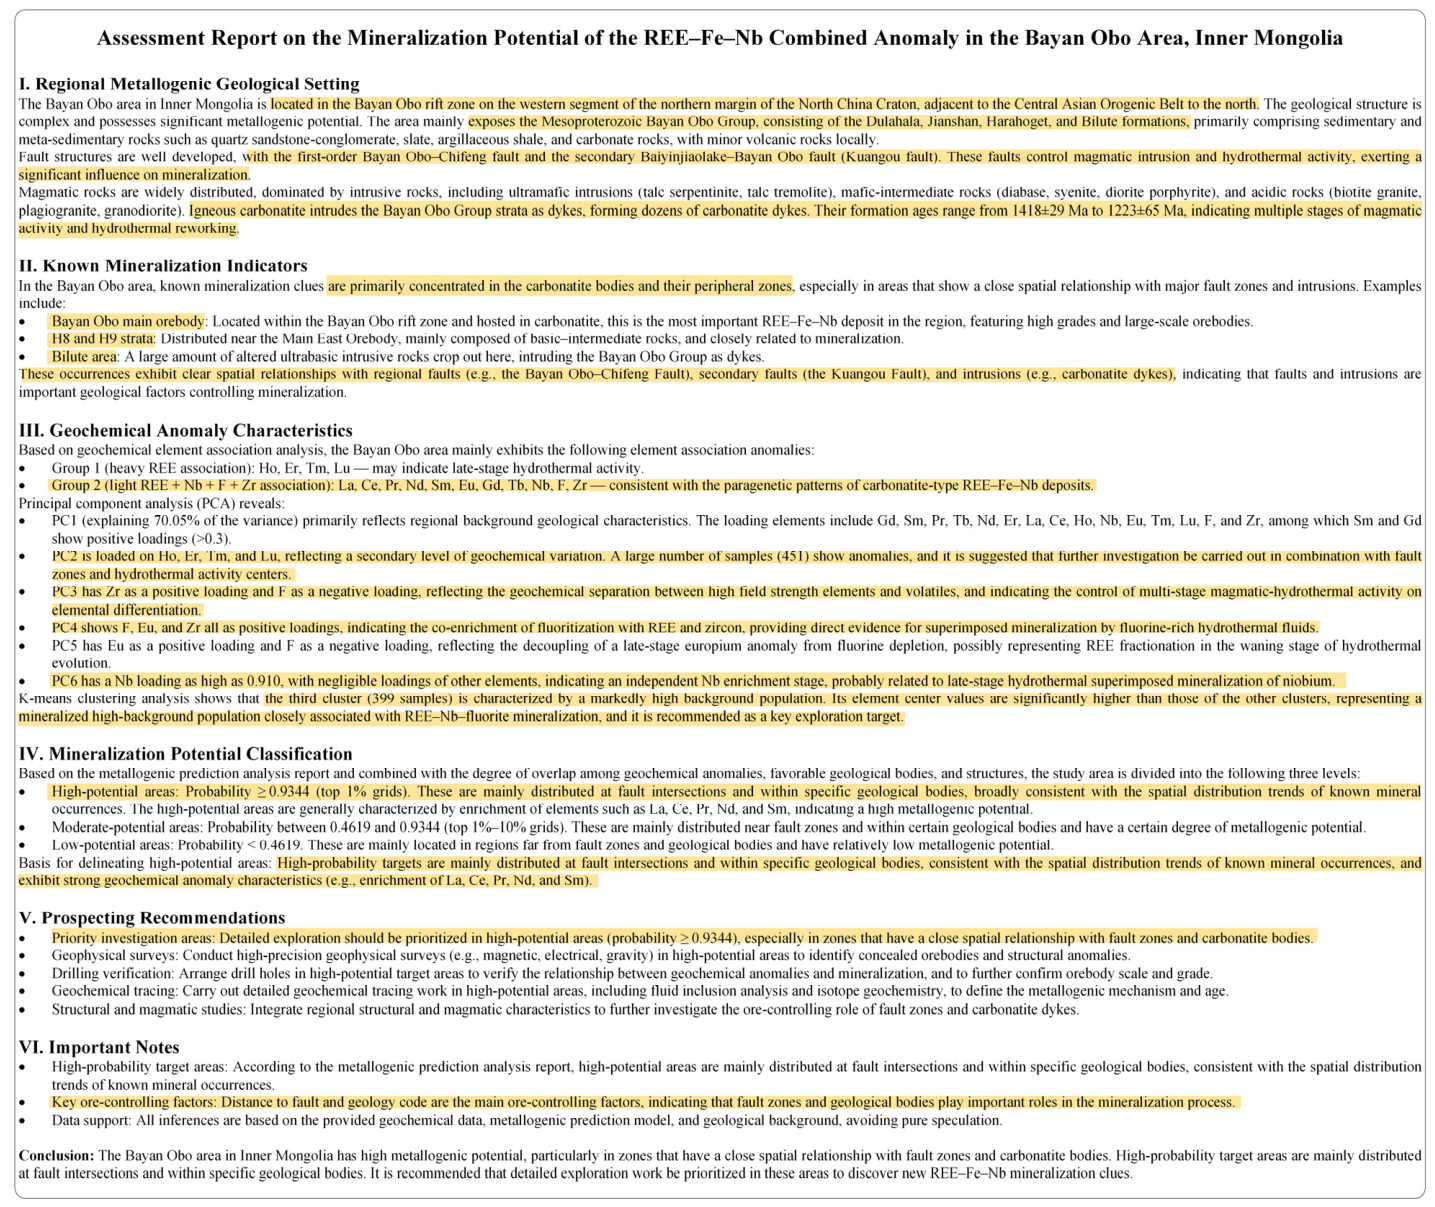
In the Q&A interface, the above analysis results are integrated with literature on the genesis of the Bayan Obo deposit (igneous carbonatite magmatism and subsequent hydrothermal alteration) from the knowledge base [
40] to generate a comprehensive report (see
Figure 8). The map also automatically displays the previously generated metallogenic prediction probability map, onto which users can overlay ore occurrences, faults, and geological bodies for analysis (
Figure S4 in Supplementary_Figures.docx,
Supplementary Materials).
The report not only provides quantitative target area coordinates but also offers interpretable evidence from three dimensions: structure, geochemistry, and metallogenic model, achieving a progressive analysis that proceeds from data-driven insights, through background knowledge enhancement, to comprehensive decision-making. The report first outlines the regional metallogenic geological background, stating that the regional metallogenic setting is the rift belt on the northern margin of the North China Craton, with the Mesoproterozoic Bayan Obo Group controlled by multi-stage faulting and igneous carbonatite intrusion. Regarding geochemical anomalies, four core principal components jointly constitute the multi-dimensional metallogenic indicators of the REE-Fe-Nb composite anomalies: PC2 (strong light-heavy rare earth fractionation) reflects the rare earth fractionation during magmatic-hydrothermal evolution; PC3 (geochemical separation of zircon and fluorine) indicates the control of fluorine-rich fluid evolution on element differentiation; PC4 (fluoritization and REE-Zr co-enrichment) and PC6 (independent niobium enrichment) correspond to fluorine-rich hydrothermal overprinting and a late niobium mineralization event, respectively. Meanwhile, the Class 3 high-background group samples show good spatial coupling with known ore bodies. In the metallogenic potential zoning, the high-potential areas (probability ≥ 0.9344) exhibit significant enrichment of La, Ce, Pr, Nd, Sm, etc. (enrichment factors 1.47–3.21). The report recommends prioritizing comprehensive geological, geochemical, and high-precision geophysical surveys in high-potential target areas, and implementing drilling verification near fault zones and around known ore occurrences.




 ,
,