Article

Intent-Driven Hybrid Semantic–Spatial Retrieval–Augmented Generation for Intelligent Prospecting with GIS Visualization

1
Center for Earth Environment & Earth Resources, Sun Yat-sen University, Zhuhai 510275, China
2
School of Earth Sciences and Engineering, Sun Yat-sen University, Zhuhai 519000, China
3
Guangdong Provincial Key Laboratory of Geological Processes and Mineral Resource Exploration, Zhuhai 519085, China
4
Joint Research Institute for Deep-Time Digital Earth and Intelligent Prediction, Sun Yat-sen University, Shenzhen 510000, China
*
Authors to whom correspondence should be addressed.
Minerals 2026, 16(8), 802; https://doi.org/10.3390/min16080802
Submission received: 5 June 2026 / Revised: 29 July 2026 / Accepted: 31 July 2026 / Published: 2 August 2026
(This article belongs to the Topic Big Data and AI for Geoscience)

Abstract

To address the difficulty of synergizing multi-source spatial data with geological text and the limited spatial reasoning of large language models (LLMs), this paper proposes an intention-driven hybrid semantic–spatial retrieval–augmented generation (RAG) method and a corresponding GIS visualization system. The method uses intent routing to direct queries to spatial parsing or text retrieval, extracts target entities, attribute constraints, and spatial relations from natural language via an LLM, and dynamically generates parameterized PostGIS (PostgreSQL Spatial Extension) queries through a rule-based parser, achieving deep coupling of semantic understanding and spatial computation. A spatial proximity verification module computes the minimum distances between target and reference entities, producing a verifiable target-reference list that provides precise spatial support for answers. The system implements a multi-source dynamic data management mechanism supporting unified heterogeneous data import, ArcGIS layer style parsing, adaptive point visualization, and user-defined mappings from data tables to geological entity types. It further integrates prospectivity prediction, geochemical association analysis, and intelligent QA into an end-to-end interactive GIS environment. Experimental results show that semantic filtering raises Precision@5 (Precision at rank 5) from 0.171 to 0.829, rule-based ranking improves NDCG@5 (Normalized Discounted Cumulative Gain at rank 5) by about 16%, and the spatial proximity verification module increases the spatial citation rate (distance coverage ratio) from 24.2% to 47.8% when computed over the 17 spatial-relation queries for which distance citations are applicable. Adding textual knowledge further boosts answer relevance to 0.863 while maintaining a comparable spatial citation rate (47.2% vs. 47.8%). To mitigate potential self-preference bias in the LLM-as-Judge setup, an independent evaluation using DeepSeek-V4-Flash was conducted, yielding high inter-evaluator agreement (Pearson r = 0.951 for faithfulness, 0.988 for relevance). These results suggest the method’s potential for query understanding, ranking optimization, and spatial interpretability, while also highlighting the need for larger-scale benchmarks and blinded expert evaluation.

1. Introduction

Mineral resource exploration is a complex task highly dependent on the comprehensive analysis of multi-source heterogeneous data. In traditional operational modes, geologists need to simultaneously refer to ore occurrence distribution maps, fault structure maps, geological body boundaries, geochemical anomaly maps, and numerous geological survey reports, relying on experience to identify favorable metallogenic areas [1,2,3,4]. However, these data exist on different platforms as independent files in heterogeneous formats with distinct semantic standards, leading to a long-standing separation between spatial location information and textual description information. The collaborative use of multi-source knowledge remains a technical bottleneck that has not been effectively overcome [3,5]. With the rise of LLMs and RAG [6], using natural language to directly interact with spatial databases, automatically integrate textual knowledge, and generate interpretable analysis reports is becoming a new paradigm for intelligent geological exploration [5].
Although traditional GIS possesses powerful spatial analysis and visualization capabilities, it cannot understand the spatial intent implicit in unstructured natural language, requiring users to manually set parameters and combine layers to obtain the desired information, resulting in a high operational barrier. In recent years, review studies in the field of geographic question answering (GeoQA) have systematically analyzed the challenges in this direction, including the lack of appropriate spatial representations (e.g., simplifying polygons to points causing calculation errors), context-dependent selection of spatial operators, the ambiguity and variability of spatial language, and uncertainty in geographic information [7]. Although geological question-answering systems based on LLMs and RAG have initially demonstrated text comprehension abilities, their core limitation lies in the lack of genuine understanding of spatial relations [8,9,10]; systematic evaluations have confirmed that even advanced LLMs struggle with spatial reasoning tasks [11]. Moreover, the geological domain involves the real-time integration of multi-source heterogeneous spatial data (ore occurrences, faults, geochemical sampling points, etc.) and complex spatial computations, further exacerbating the difficulty.
Existing studies have attempted to incorporate spatial information into RAG frameworks, covering areas such as general travel recommendation, traffic map cartography, and geospatial modeling [12,13,14]. However, the transferability of these general frameworks to the geological domain is limited. In geological question answering, works such as GeoGPT, GraphRAG, and LightRAG [15,16,17] have preliminarily achieved geological knowledge graph construction and text retrieval. Nevertheless, the spatial reasoning abilities of these methods are mostly built upon predefined ontological relations or offline-constructed graph structures, lacking real-time spatial computation and semantic joint filtering capabilities for multi-source spatial data. Currently, there is no intelligent prospecting question answering system that can simultaneously perform natural language spatial semantic understanding, collaborative retrieval of multi-source spatial and textual data, and output interpretable spatial reasoning details [18,19].
To address the aforementioned issues and shortcomings, this study organically integrates an LLM, a PostGIS spatial database [20,21], a ChromaDB vector knowledge base, and a GIS visualization engine into an intelligent mineral prospecting GIS visualization and analysis system. The system supports unified storage and dynamic mapping of multi-source heterogeneous spatial data, an intent-driven hybrid retrieval pipeline, automatic conversion from natural language to PostGIS spatial queries, candidate ranking by spatial distance and semantic matching, and context-enhanced generation that fuses a spatial proximity verification module, geological background knowledge, and analysis reports. Using the Bayan Obo metallogenic belt in Inner Mongolia as the main study area, systematic experiments on multi-source geological datasets validate the method’s effectiveness in retrieval precision, ranking quality, and interpretability. Section 2 describes the study area, system architecture, core business pipelines, and main methods; Section 3 reports experimental results; Section 4 presents the discussion; and Section 5 concludes the paper.

2. Materials and Methods

2.1. Study Area and Data

This study takes the Bayan Obo REE-Fe-Nb metallogenic belt in Inner Mongolia as the primary case study area, supplemented by geological data from Yunnan and Sichuan for retrieval evaluation across diverse geological settings. The Bayan Obo region was selected for its world-class rare earth deposits, rich multi-source geological data, and representative metallogenic complexity, making it an ideal testbed for demonstrating the system’s spatial retrieval and analysis capabilities. All spatial data use the WGS84 geographic coordinate system to ensure uniformity in spatial analysis. Table 1 summarizes the data types, storage locations, and purpose descriptions. Ore occurrence data include vector point files with attribute fields such as deposit name, mineral type, scale, and genesis; fault data are line features with information including fault number, activity status, and tectonic system; geological body data record stratigraphic units, lithological symbols, and thickness as polygons; geochemical data contain element concentration information from stream sediments and rock samples, covering major components (e.g., SiO2, MgO, CaO) in weight percent and trace elements (e.g., Au, Ag, Cu, Pb, Zn) in ppm or ppb. Different data sources have different table structures and attribute naming conventions. Additionally, the system loads auxiliary layers such as provincial boundaries and geological boundaries, collectively forming a multi-table, multi-source, heterogeneous spatial database. Geological literature, reports, and other textual knowledge are stored in the ChromaDB vector database for semantic retrieval.

2.2. System Architecture

2.2.1. Overall System Architecture

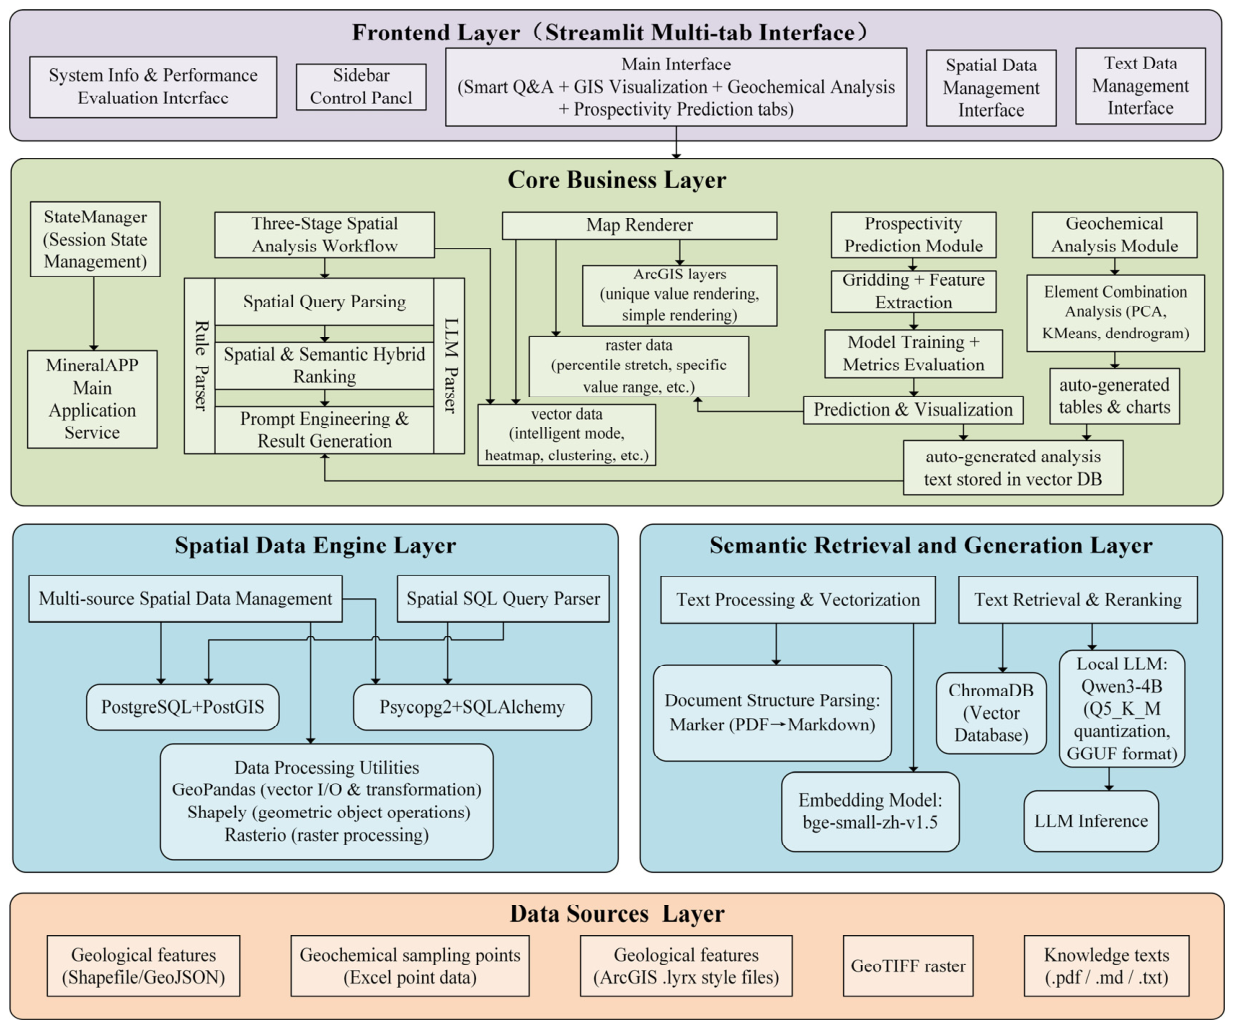
The overall system architecture is shown in Figure 1. The system adopts a layered architecture design, which consists, from bottom to top, of the data source layer, spatial data engine layer, semantic retrieval and generation layer, core business layer, and front-end presentation layer.
The data source layer integrates multi-source heterogeneous geological data, including vector data in the PostGIS spatial database (such as mineral occurrences, faults, geological bodies, geochemical data, geological boundaries, and provincial boundaries), as well as rasterized mineral prospectivity prediction results and soil data. The system also supports dynamic import of external files (Shapefile, GeoJSON, Excel, GeoTIFF, and ArcGIS Pro (v3.0.1) .lyrx style files) and textual knowledge for semantic retrieval (PDF, Markdown, TXT). For diverse spatial data, the system employs configurable table-entity type mapping (user_table_types.json) and attribute column name mapping (user_column_mapping.json) mechanisms to dynamically bind semantic attributes from different data sources to database fields, thereby adapting to new table structures without code modifications. To support efficient access, this layer maintains spatial indexes and automatic geometry column discovery, providing efficient spatial query interfaces to upper layers. Example schema-mapping files are provided as Supplementary Materials (see Data Availability Statement).
The spatial data engine layer is in charge of managing spatial data from several sources, interpreting spatial queries, and performing spatial geometric operations. It combines SQLAlchemy and Psycopg2 to provide standard access to the PostgreSQL/PostGIS spatial database, as well as interfaces for spatial data storage, indexing, and querying. The built-in spatial SQL (Structured Query Language) query parser converts natural language constraints into parameterized PostGIS queries. This layer also includes GeoPandas for vector data reading, writing, and coordinate system transformation; Rasterio for raster data processing (e.g., quantile stretching and specific value range display); and Shapely for spatial relationship calculations of geometric objects. Together, these functions provide efficient and reliable spatial data services for upper-layer business logic.
The semantic retrieval and generation layer comprises a text retrieval module powered by the ChromaDB vector database and a local embedding model (bge-small-zh-v1.5) [22], as well as a locally deployed Qwen3-4B LLM (Q5_K_M quantization, GGUF format) [23] that achieves efficient GPU inference through the llama-cpp-python package (v0.3.22) (with CUDA support ≥12.4). Geological documents undergo Markdown cleaning, main text extraction, and intelligent chunking before being stored in the vector database, providing domain background knowledge for upper-layer question answering through semantic similarity retrieval. The LLM inference service provides a unified interface for semantic parsing, object ranking, and final answer generation.
Built upon this layered architecture, when the system executes spatial queries, what is retrieved are no longer raw spatial data but deeply processed “geological semantic elements” and “quantitative anomaly information” that can be directly used for genesis analysis. Text retrieval provides background knowledge such as regional metallogenic regularities and deposit models.
The core business layer implements an intelligent pipeline under the MineralApp main application service and the StateManager session manager. A three-stage spatial analysis workflow comprises: spatial query parsing (aided by the LLM and rule-based SQL generation), spatial-semantic hybrid ranking (spatial score based on minimum distance; semantic score based on keyword and numerical attribute matching), and context-enhanced generation (driven by prompt engineering). Meanwhile, the geochemical analysis module automatically performs Principal component analysis (PCA), K-Means clustering, and hierarchical clustering, generating corresponding tables and charts. The mineral prospectivity mapping module handles gridding, feature extraction, random forest [24] training and caching, supports class balancing via SMOTE (Synthetic Minority Over-sampling Technique) [25] oversampling or undersampling [26], and evaluates model generalization through spatial cross-validation [27], ultimately producing a mineral prospectivity probability map. The map renderer supports visualization of vector data using strategies such as smart mode, heatmaps, and clustering, and can display raster data with quantile stretching and specific value ranges. It also processes unique-value rendering and simple rendering for ArcGIS layers, and overlays anomaly heatmaps and cluster markers from analysis results onto the map, providing full layer control functionality.
The front-end presentation layer uses Streamlit [28] to build a multi-tab interactive interface containing four main tabs: Home, Spatial Data Management, Text Data Management, and System Information. The Home tab focuses on intelligent Q&A and GIS visualization, integrating a left-side map with a right-side Q&A and analysis panel, and supports map-linked display of spatial-semantic retrieval results and browsable visualization of analysis reports. The Data Management interfaces provide access points for file upload, database table management, attribute mapping configuration, and knowledge base maintenance. The System Information tab displays system component status, cache statistics, and performance metrics. Layers exchange data through well-defined interfaces, and the architecture design fully embodies modularity, extensibility, and dynamic data-driven characteristics.

2.2.2. Core Business Pipeline

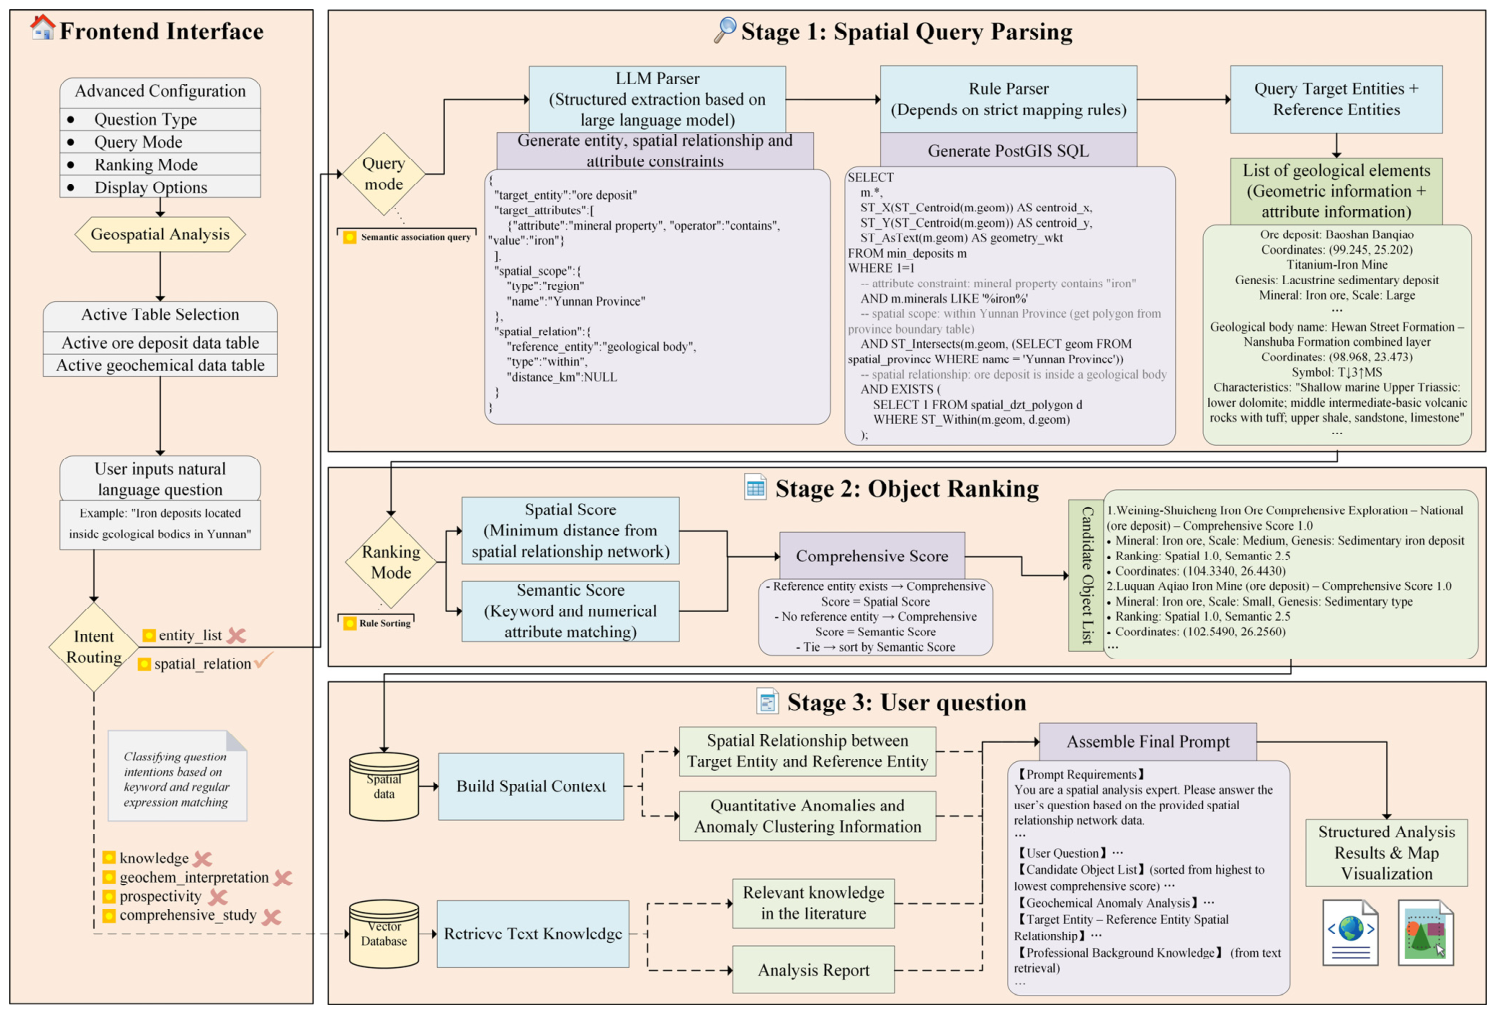
The system follows a workflow design of “intent routing—spatial semantic parsing—ranking—context-enhanced generation”, as illustrated in Figure 2. The workflow uses the spatial relation analysis question “iron deposits within geological bodies in Yunnan Province” as an example.
After the user inputs a natural language question through the frontend interface, the system first classifies the question’s intent using a lightweight intent classifier based on keywords and regular expressions, categorizing it into simple knowledge question answering, entity list query, spatial relation analysis, geochemical anomaly interpretation, and metallogenic prediction. The specific routing rules are as follows: if the question contains words such as “what is”, “definition”, “explain”, it is classified as simple knowledge question answering, and the system directly retrieves from the text knowledge base without activating spatial data queries; if the question contains spatial relation words such as “near”, “within...km”, “inside”, “intersects”, or explicitly mentions a region name and entity type, the spatial query pipeline is triggered; for questions containing words like “anomaly”, “element association”, “PCA”, “clustering”, the system automatically loads pre-stored element association analysis reports and incorporates them into the context; when words such as “potential”, “target area”, “prospect” appear, the metallogenic prediction module is activated, embedding existing metallogenic probability maps and feature importance analysis results into the answer. Based on the classification result, the question is directed to different processing branches. The pure-text branch invokes the ChromaDB vector database to retrieve relevant geological knowledge fragments; the spatial query branch proceeds to the three-stage workflow of query, ranking, and generation.
In the spatial query pipeline, the system obtains a structured JSON through the LLM parser and feeds it into the rule parser, which generates parameterized PostGIS SQL statements, dynamically loads the corresponding spatial tables, and after execution obtains a list of target entities and a list of reference entities. Subsequently, the rule-based ranker scores and ranks the candidate entities by combining spatial distance and semantic matching. The final context-enhanced generation module integrates the ranked entity list, the spatial proximity verification module between target and reference entities, geochemical anomaly information, and text knowledge fragments into a prompt, driving the LLM to generate an analysis report rich in verifiable spatial details. Among these, the spatial proximity verification module uses the precise geometric information of reference entities to calculate the minimum distances between target and reference entities, providing accurate spatial scores for ranking and verifiable distance data for subsequent answers. The text knowledge fragments, stored in the ChromaDB vector database, are text fragments converted from geological literature, element association analysis reports, and metallogenic prediction analysis reports. The system performs semantic retrieval via an embedding model, providing domain background knowledge for prompt construction in the third stage. The map visualization module overlays analysis result layers such as ore occurrences, faults, geological bodies, and geochemical heatmaps.

2.3. Spatial Semantic Parsing and SQL Generation

The spatial semantic parsing module is responsible for converting natural language queries into structured spatial constraints. The system provides a carefully designed prompt to the LLM, requiring it to output a strict JSON object containing the target entity type, target attribute constraints (attribute name, operator, value), spatial extent object (region polygon or bounding box), and spatial relation object (reference entity, topological relation type, distance threshold). The model extracts only information explicitly mentioned in the question, avoiding fabricating attributes or relations. To handle the diversity of attribute names, the system uses a configurable column mapping table to convert semantic attribute names (e.g., “MgO content”) into actual database column names (e.g., “mgo_(wt%)”) and automatically handles unit conversions. For spatial topological relations such as “inside”, “intersects”, the prompt provides explicit examples, supplemented by keyword completion rules to ensure the accuracy of the spatial relations output by the LLM. The complete prompt templates for all pipeline stages are provided as Supplementary Materials (see Data Availability Statement).
Subsequently, a rule parser dynamically converts the parsed JSON into parameterized PostGIS SQL statements. It selects the corresponding data table based on the mapping of the target entity type, automatically obtains the geometry column name of that table, generates WHERE conditions (supporting LIKE fuzzy matching and comparison operators) based on attribute constraints, and inserts spatial functions such as ST_Intersects, ST_DWithin, and ST_Within to implement region filtering and proximity calculations. The SQL statements use parameterized queries to effectively prevent injection risks and append a LIMIT clause to control the number of returned records. This design allows the same parsing framework to adapt to ore occurrence and geochemical data tables from different regions, fully reflecting the system’s multi-source data adaptability.

2.4. Spatial Proximity Verification Module

The spatial proximity verification module integrates three distinct elements: (1) standard spatial operations supplied by PostGIS, specifically the ST_Distance function, for computing geometric distances between entities; (2) evidence-assembly logic that converts these distances into reciprocal proximity scores and produces an ordered target–reference list; and (3) the methodological contribution of injecting this structured spatial evidence into the LLM prompt to produce verifiable distance citations in generated answers. The module does not employ a graph structure, learned model, or message-passing mechanism; its novelty lies in the structured integration of spatial evidence into the RAG pipeline rather than in the underlying spatial computation itself. The spatial proximity verification module is a key component for achieving interpretable spatial reasoning in the system. Its core function is to construct quantifiable spatial proximity measures for each target entity after obtaining the complete geometric information of reference entities in the semantic parsing stage. For the target entity set T = { t 1 , t 2 , . . . , t i } and reference entity set R = { r 1 , r 2 , . . . , r m } returned by query Q, the module defines an ordered mapping function Φ ( T , R ) that calculates the spatial distance from each target entity t i to all reference entities r j and generates a target-reference relation list sorted by ascending distance. For any target entity t i , the distance to its nearest reference entity is defined as follows:
d m i n ( t i ) = min r j R d ( t i , r j )
The distance function uses PostGIS’s ST_Distance geospatial operator to calculate the geodesic distance between two points based on the WGS84 ellipsoid, in kilometers. This distance is further converted into a spatial proximity score in the second-stage rule-based ranking, using a reciprocal function to achieve smooth mapping, so that target entities closer to reference entities receive higher spatial scores and thus occupy higher positions in the candidate list:
S s p a t i a l ( t i ) = 1 1 + d m i n ( t i )  
The module retains complete information for the nearest reference entity for each target entity, including the reference entity name, type, and distance value accurate to meters (or kilometers to two decimal places), and can also attach the distribution of other reference entities within a specified radius. In the third-stage context construction, these relation data are injected into the prompt template in a structured summary form, explicitly listing the distance of each target entity to its nearest reference entity in natural language, e.g., “Main ore is 0.47 km from fault F1, East ore is 0.89 km from fault F2”. This mechanism enables the LLM to cite verifiable and precise spatial data when generating answers, transforming the user’s vague spatial expressions into geological analysis statements supported by specific numerical values. For queries that do not involve spatial relations or for which no reference entities are retrieved, the module output is empty, without affecting the normal operation of other system modules.

2.5. Object Ranking

For the candidate entity list returned by a spatial query, the system adopts a rule-based ranking strategy, combining spatial distance and semantic matching with weighted scores. The spatial score S s p a t i a l ( t i ) is provided by the spatial proximity verification module (see Section 2.4). For numerical attribute constraints (e.g., “MgO content greater than 50%”), the system performs continuous scoring via a sigmoid function:
S n u m ( x ) = 1 1 + e k ( x x 0 )
where x is the attribute value of the candidate entity, x 0 is the user-specified threshold, and k is a parameter that adjusts the steepness of the curve (typically set to 1). When x > x 0 , the score approaches 1; otherwise, it approaches 0.
Text attribute matching uses keyword overlap and direct attribute field comparison to obtain a text matching score S t e x t . After weighting, a unified semantic score is obtained:
S s e m a n t i c = w n u m S n u m + w t e x t S t e x t
The final comprehensive score is obtained by fusing the spatial score and the semantic score. When reference entities exist, S t o t a l = w s p a t i a l S s p a t i a l + w s e m a n t i c S s e m a n t i c (typically w s p a t i a l = 0.6 , w s e m a n t i c = 0.4 , to emphasize the dominance of spatial proximity); when no reference entities exist, S t o t a l = S s e m a n t i c .
The ranked candidate object list, along with detailed information such as spatial distances and element concentrations, is passed to the prompt construction of the third stage.

2.6. GIS Visualization

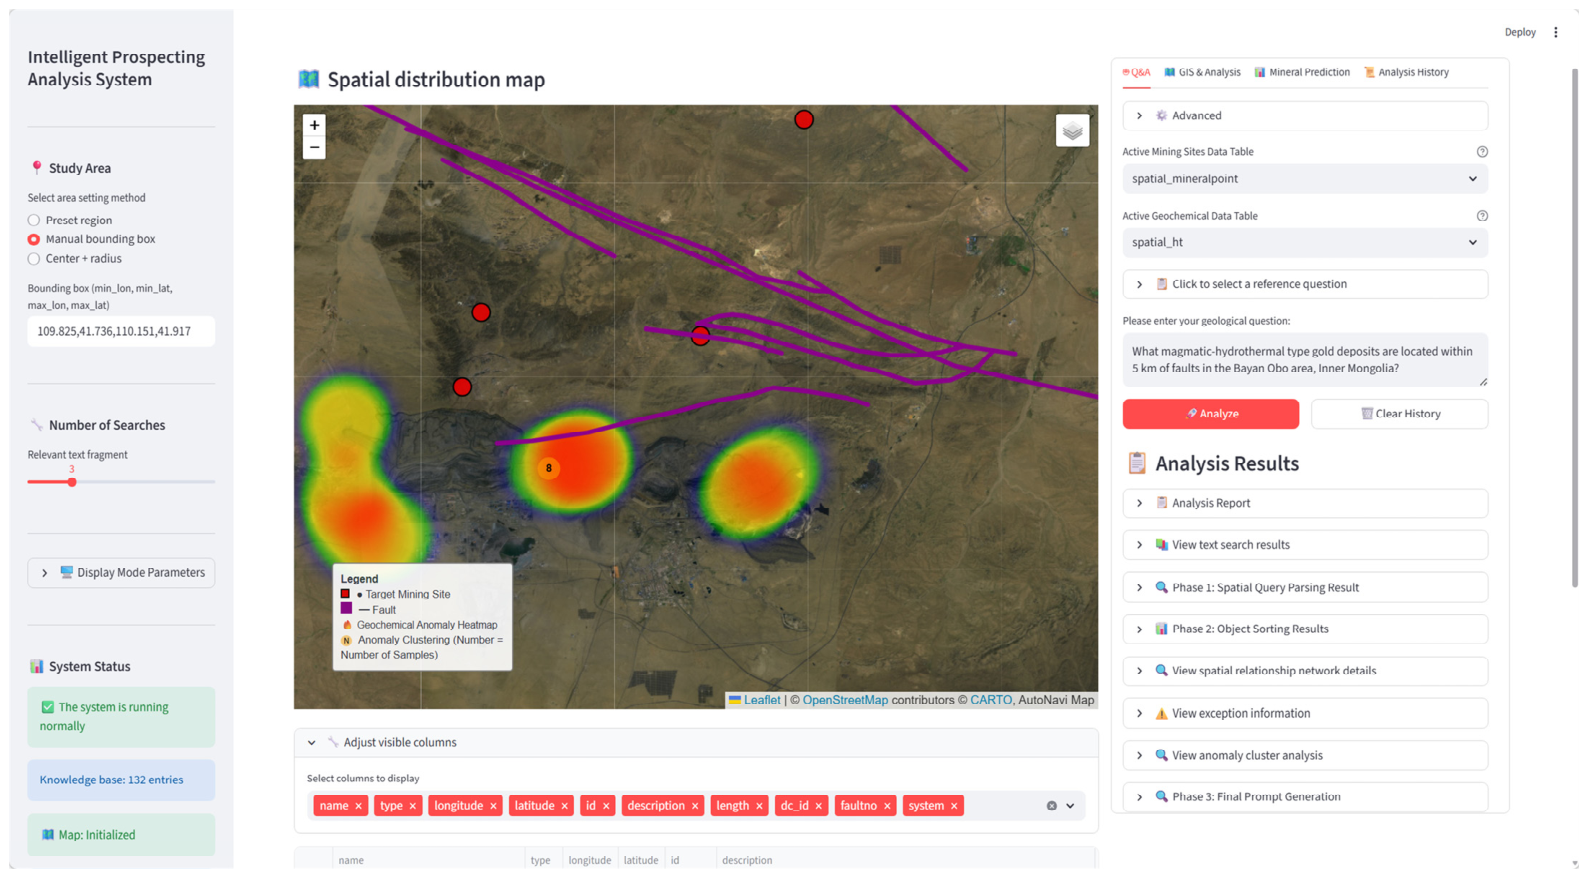
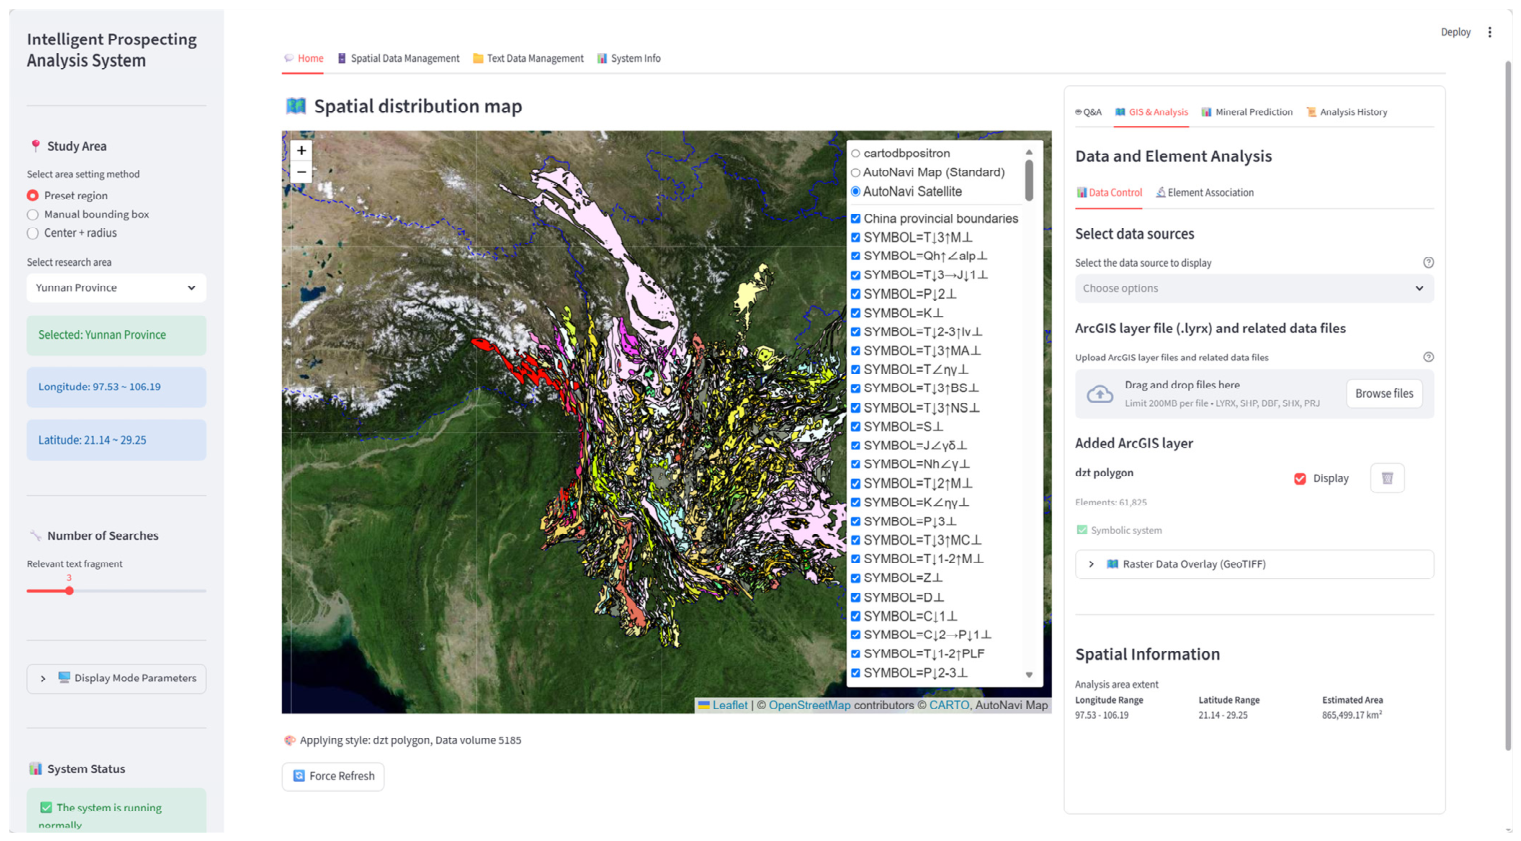
The frontend of the system integrates an interactive WebGIS module based on Folium, allowing multi-source spatial data layers to be overlaid on a Leaflet base map [29]. In the concrete implementation, the system dynamically loads vector features (points, lines, polygons) according to the study area extent selected by the user in the sidebar. For point data, three visualization strategies are designed: intelligent mode (all points are displayed when the data volume is below a threshold; otherwise, equally spaced sampling is applied), heatmap (based on kernel density estimation), and cluster display (adjacent points are aggregated via MarkerCluster). In addition to manually triggered visualization operations by the user, the intelligent question answering and metallogenic analysis workflows also include automatic data visualization mechanisms. After a spatial query or element analysis is completed, the analysis results (including target entities, reference entities, anomaly heatmaps, and anomaly cluster areas) are highlighted and overlaid on the map, with dynamically generated HTML legends distinguishing different feature types. The metallogenic prediction module trains on ore occurrences, faults, geological bodies, and geochemical elements using the random forest algorithm, generates a metallogenic probability raster map (GeoTIFF format) for the study area, and after resampling and color mapping, overlays it as an ImageOverlay. Figure 3 shows the overall system layout and an example of symbolizing geological bodies in Yunnan Province using an ArcGIS Pro (v3.0.1) .lyrx style file.

2.7. Context-Enhanced Generation and Knowledge Fusion

In the third stage, the system fuses the structured data generated in the previous stages with external knowledge to construct a unified prompt template, driving the large language model to produce the final analysis report. The fused data include: the ranked list of target entities (with attributes and spatial coordinates), the precise distances from target to reference entities, and the list of reference entities within the radius provided by the spatial proximity verification module; geochemical anomaly points and anomaly cluster information identified based on quantile thresholds; and geological literature knowledge fragments retrieved from the ChromaDB vector knowledge base. All data are cleaned before being injected into the prompt, retaining only the plain text blocks directly relevant to the question, in order to maximize the model’s context window.
Based on the question type identified by the intent classifier, the system dynamically selects a corresponding answer instruction template. For entity list queries, the template requires the model to list the name, type, and location coordinates of each entity, and to automatically extract key attributes corresponding to the entity type. For spatial relation queries, the template requires the model to first summarize the number of target objects satisfying the constraints and their common characteristics, then adopt different description styles depending on the type of spatial relation (proximity, inside, or intersect): for proximity relations, the distance is stated in the form “X.XX km from the nearest reference entity”; for inside or intersect relations, described as “located inside the geological body” or “intersects the fault”. Additionally, the template allows the model to supplement geochemical anomaly information when anomaly points are spatially close to target objects (below a preset threshold), and requires summarizing the spatial distribution pattern. For metallogenic prediction or geochemical anomaly interpretation questions, the template guides the model to write a professional evaluation report, requiring the citation of quantitative results from existing analysis reports (e.g., principal component loadings, cluster center values, random forest feature importance, metallogenic probability quantile thresholds, etc.), and to elaborate from five dimensions: geological background, mineralization clues, geochemical characteristics, potential zoning, and prospecting recommendations.
Through this dynamic instruction template and multi-source data fusion mechanism, the answers generated by the system not only remain faithful to the retrieved spatial data but also incorporate domain background knowledge, balancing spatial precision with geological professionalism, thereby providing users with verifiable and interpretable prospecting analysis results.

3. Results

3.1. Experimental Design and Evaluation Metrics

To objectively evaluate system performance, this study generated a test set containing 35 geological spatial queries using an automatic script build_test_set.py. Each query consists of a natural language question, a corresponding spatial bounding box, and a list of ground-truth answer entities (relevant_ids) extracted from the database via independently written precise SQL. For queries requiring ranking by spatial distance or element concentration, the test set further provides an ideal ranking list (gold_ranking) and corresponding distance or concentration values (gold_distances/gold_values) to enable fine-grained evaluation of ranking quality. The test set comprises 13 queries targeting the Bayan Obo region (Inner Mongolia), 17 queries targeting Yunnan, and 5 queries targeting Sichuan, spanning two intent categories: 17 spatial-relation queries involving proximity to faults or geological boundaries (14 of which include gold_distances for distance-based ranking), and 18 entity-list queries including 7 geochemical threshold queries with value-based ranking (gold_values). It should be noted that because the ground-truth entities are obtained via independently written SQL over the same database queried by the system, the retrieval metrics inherently share a common data and logic foundation with the system pipeline. For the deterministic structured spatial queries that constitute this benchmark, however, the correct answer set is objectively and unambiguously defined by the explicit spatial and attribute conditions specified in each query—e.g., “within 2 km of faults” or “Au > 0.18 ppm”—leaving no room for subjective relevance interpretation. In this setting, a correctly authored SQL query necessarily returns the complete set of entities satisfying the stated conditions, and no independent relevance standard exists apart from the query conditions themselves. The system itself never accesses the ground-truth SQL; rather, it processes each natural language question through the full pipeline (intent classification, semantic parsing, SQL generation, spatial computation), and the evaluation measures whether this end-to-end pipeline produces the same correct result as a human expert would obtain by writing SQL directly. The shared database and SQL paradigm therefore do not invalidate the evaluation: they reflect the inherent nature of deterministic structured queries, where the query conditions themselves are the only possible relevance standard. The test set, generation script, prompt templates, evaluation metrics, and experiment runner are publicly available as Supplementary Materials (see Data Availability Statement).
For retrieval and ranking, this paper uses Precision@5, Recall@5, and Mean Reciprocal Rank (MRR) to measure retrieval hit ability, and introduces NDCG@5 [30] to evaluate the agreement between the ranking results and the ideal order. For queries containing distance or concentration data, NDCG uses continuous relevance scores to reflect the relevance gradient among different entities. For generation quality, this paper adopts an LLM-as-Judge architecture [31], where the same LLM, based on the complete generation prompt (including candidate object list, spatial proximity module summary, textual knowledge, etc.), scores the answer’s faithfulness and relevance on a 0–10 scale, ultimately normalized to the 0–1 interval. It should be noted that using the same model as both generator and judge may introduce self-preference bias, and the automatic judge can occasionally reward non-answers or generic background statements. Additionally, the spatial citation rate is computed only over queries whose intent involves proximity constraints (spatial-relation queries), as entity-list queries do not require distance citations. To objectively measure interpretability, this metric automatically detects whether specific distance descriptions are included in the answer to count the frequency of spatial detail citation.
To validate the contribution of each module, seven configurations were set up in the experiment, as shown in Table 2. The text-only baseline relies only on the knowledge base text without accessing spatial data, serving as a weak baseline. The Vanilla LLM-to-SQL baseline bypasses all pipeline components, letting the LLM directly generate PostGIS SQL from natural language, serving as an end-to-end comparison to quantify the contribution of the proposed pipeline. The w/o Semantic Filtering method retrieves entities only by spatial bounding box without imposing any attribute constraints, highlighting the value of semantic filtering. The w/o Ranking method retains the spatial proximity module but skips the ranking step, ablating the ranking module. The w/o Spatial Module method queries only target entities without constructing the target-reference proximity relation, verifying the role of the spatial proximity module. The Full Model is the final proposed model, including semantic association retrieval, rule-based ranking, and an automatically constructed spatial proximity module. The Full Model + Text augments the Full Model with textual knowledge, evaluating the gain from multi-source knowledge fusion.
To quantify the reliability of the semantic parsing and intent-routing components, we analyzed the intermediate structured outputs generated by the Full Model across all 35 test queries. The intent classifier, which uses keyword-based rules to distinguish spatial-relation queries from entity-list queries, achieved perfect accuracy (35/35). Within the spatial-relation category, the parser correctly identified all distance-proximity queries (14/14, characterized by explicit distance thresholds such as “within 5 km”) and all topology-containment queries (3/3, characterized by qualitative predicates such as “located within” without numeric distance constraints). All required fields—target entity type, spatial relation predicate, and reference entity—were successfully extracted in 100% of queries. These results indicate that the rule-based parser and keyword-based intent classifier are highly reliable on the evaluated query set, though performance may vary with more linguistically diverse inputs.

3.2. Retrieval and Generation Performance Evaluation

To comprehensively evaluate the system’s performance in retrieval hit, ranking quality, and answer credibility, we used the unified experimental configuration (Table 2) and report the retrieval metrics (Precision@5, Recall@5, MRR, NDCG@5) and generation quality metrics (Faithfulness, Relevance, spatial citation rate) for each method based on the test set. Generation quality was independently assessed by both the original evaluator (Qwen3-4B, denoted Q-Faith/Q-Relev) and an external evaluator (DeepSeek-V4-Flash, denoted DS-Faith/DS-Relev) using identical scoring criteria and factual evidence to mitigate self-preference bias. The results are summarized in Table 3.
The text-only baseline yields zero for all retrieval metrics, and the w/o Semantic Filtering method also has much lower retrieval metrics (Precision@5 = 0.171, NDCG@5 = 0.198) than the other methods. The Vanilla LLM-to-SQL baseline, which bypasses intent routing, semantic parsing, and the spatial proximity module by letting the LLM directly generate PostGIS SQL from natural language, achieves near-zero retrieval accuracy (P@5 = 0.023, NDCG@5 = 0.030). Of the 35 SQL queries generated by this baseline, 30 (85.7%) either failed to execute due to syntax or cardinality errors (e.g., subqueries returning multiple rows) or returned no results. Although its faithfulness score (0.854) is comparable to the Full Model, this is an artifact of the system returning “no results found” for most queries—a technically faithful but uninformative response. The substantially lower relevance (0.734 vs. 0.857) and spatial citation rate (0.059 vs. 0.478) confirm that without the proposed pipeline components, end-to-end LLM-to-SQL translation cannot reliably construct valid spatial queries for geological applications. This result demonstrates that the intent classification (100% accuracy), rule-based semantic parsing, and spatial proximity module are essential for bridging the gap between natural language and spatial database queries.
All metrics of the w/o Spatial Module method are lower than or equal to those of the Full Model, directly confirming that the spatial proximity module improves retrieval quality both in the screening stage and in ranking optimization. Specifically, because the w/o Spatial Module method disables reference entity queries, the system returns only target entities without spatial proximity constraints, resulting in retrieval hit rates (Precision, Recall) that are lower than those of the Full Model, although MRR remains saturated at 1.000 for both configurations because MRR only considers the rank of the first relevant result, and most spatial-relation queries have multiple relevant entities. The NDCG@5 of the w/o Spatial Module method (0.871) is notably lower than that of the Full Model (0.977), indicating that the spatial proximity module is not only the source of distance information for ranking but also fundamentally determines whether the candidate entity set contains objects that satisfy the user’s spatial relation requirements. In contrast, the w/o Ranking method retains reference entity queries and only skips the ranking step, so its retrieval hit rates are the same as the Full Model, but its ranking quality (NDCG) declines significantly.
The w/o Ranking method maintains exactly the same retrieval hit rates (Precision, Recall, MRR) as the Full Model, but the Full Model increases NDCG@5 from 0.845 to 0.977 through rule-based ranking, indicating that rule-based ranking significantly optimizes the ordering of candidate entities, bringing entities that are closer or have better-matching concentrations to the front. The spatial citation rate remains comparable (0.499 vs. 0.478), consistent with the expectation that ranking reorders entities without altering the underlying distance information. Moreover, ranking also affects the quality of generated answers: Qwen-evaluated faithfulness increases from 0.797 to 0.837, and relevance from 0.820 to 0.857, suggesting that rule-based ranking, by providing a more reasonable candidate order, helps the model generate more accurate and relevant answers.
The Full Model + Text, under the same retrieval performance, increases Qwen-evaluated faithfulness and relevance to 0.840 and 0.863, respectively, reflecting that multi-source knowledge fusion broadens the coverage of answers and enhances their comprehensiveness. The spatial citation rate remains nearly identical (0.472 vs. 0.478), indicating that textual knowledge does not interfere with the model’s ability to cite spatial distance evidence. Furthermore, the independent DeepSeek evaluator also assigns slightly higher scores to Full Model + Text (DS-Faith = 0.877, DS-Relev = 0.871) compared to the Full Model (DS-Faith = 0.871, DS-Relev = 0.869), consistent with the Qwen evaluator in identifying that multi-source knowledge fusion enhances answer comprehensiveness. Both evaluators assign the highest scores to Full Model + Text.
To further assess the system’s cross-region transferability and per-intent performance, we report the Full Model results disaggregated by region (Table 4) and by intent type (Table 5). Entity-list queries do not involve proximity constraints and therefore contribute zero to the spatial citation rate; Table 5 disaggregates the citation rate by intent type, showing 0.478 for spatial-relation queries versus 0.000 for entity-list queries.
As shown in Table 4, the Full Model achieves consistent retrieval performance across all three regions (Precision@5 = 0.800–0.880, NDCG@5 = 0.955–1.000), confirming that the system does not overfit to a single region’s data structure. The spatial citation rate (computed over the 17 spatial-relation queries per region as the denominator) is highest in Yunnan (0.542) and lowest in Bayan Obo (0.286), reflecting region-specific variation in the LLM’s tendency to cite verifiable distance evidence.
Table 5 reveals three important findings. First, disaggregating the spatial_relation category shows that distance-proximity queries (14 queries, P@5 = 0.914, citation rate = 0.527) substantially outperform topology-containment queries (3 queries, P@5 = 0.800, citation rate = 0.250) in both retrieval precision and spatial citation rate. The lower citation rate for topology-containment queries reflects their reliance on qualitative spatial predicates (e.g., “located within”) rather than numeric distance values that can be verified against prompt evidence. Second, the spatial citation rate is 0.478 for spatial-relation queries and 0.000 for entity-list queries, confirming that the overall citation rate reported in Table 3 is an artifact of mixing the two intent types. Third, disaggregating the entity_list category exposes a precision dilution effect: the geochemical threshold sub-group (7 queries, P@5 = 0.971) achieves markedly higher precision than the attribute-filter sub-group (11 queries, P@5 = 0.636), and when both sub-groups are combined into the aggregated entity_list category, the mean P@5 drops to 0.767. This dilution is driven by five attribute-filter queries with P@5 as low as 0.2–0.4, where multi-constraint parsing causes the LLM-based semantic parser to misattribute a constraint. These sub-category breakdowns highlight the need for per-intent reporting in future benchmarks.
To validate the reliability of the LLM-as-judge evaluation and mitigate potential self-preference bias, an independent evaluation was conducted using DeepSeek-V4-Flash as an external judge on all 245 responses (7 configurations × 35 queries). The independent evaluator applied the same scoring criteria and received the same core factual evidence (extracted from phase3 prompts) as the original evaluator (Qwen3-4B). As shown in Table 6, the two evaluators show strong overall agreement, with Pearson correlation coefficients of 0.951 for faithfulness and 0.988 for relevance, and Spearman ρ of 0.905 and 0.994, respectively (all p < 0.001). Per-experiment analysis reveals consistently high agreement across all configurations, with faithfulness ρ ranging from 0.742 (Full Model + Text) to 0.998 (Text-only), and relevance ρ ranging from 0.973 (Full Model) to 1.000 (Vanilla LLM-to-SQL), all significant at p < 0.001. The slightly lower faithfulness agreement for the Full Model (ρ = 0.815) and Full Model + Text (ρ = 0.742) configurations likely reflects the greater complexity and nuance of spatially grounded responses, where evaluators may differ on fine-grained factual details while still agreeing on overall ranking. Both evaluators consistently assign higher scores to the Full Model and Full Model + Text configurations, confirming that the proposed pipeline components substantially improve generation quality.

3.3. Case Study

The Bayan Obo REE-Fe-Nb metallogenic belt, located on the northern margin of the North China Craton, is characterized by well-developed fault structures, intense magmatic activity, and diverse, high-intensity geochemical anomalies [32,33,34]. It is an ideal area for testing spatial-semantic joint retrieval and anomaly interpretation capabilities. This section uses two independent cases to verify the core capabilities of the system: (1) Spatial relation retrieval and verification: using a query for magmatic-hydrothermal gold deposits to test the system’s ability to parse composite constraints combining attributes and spatial proximity; (2) Comprehensive interpretation and metallogenic prediction: using REE-Fe-Nb composite anomalies to test the system’s ability to integrate multivariate statistical analysis, machine learning prediction, and textual knowledge for comprehensive interpretation. Together, these two cases demonstrate the system’s applicability to different types of geological problems.

3.3.1. Spatial Relation Retrieval and Verification

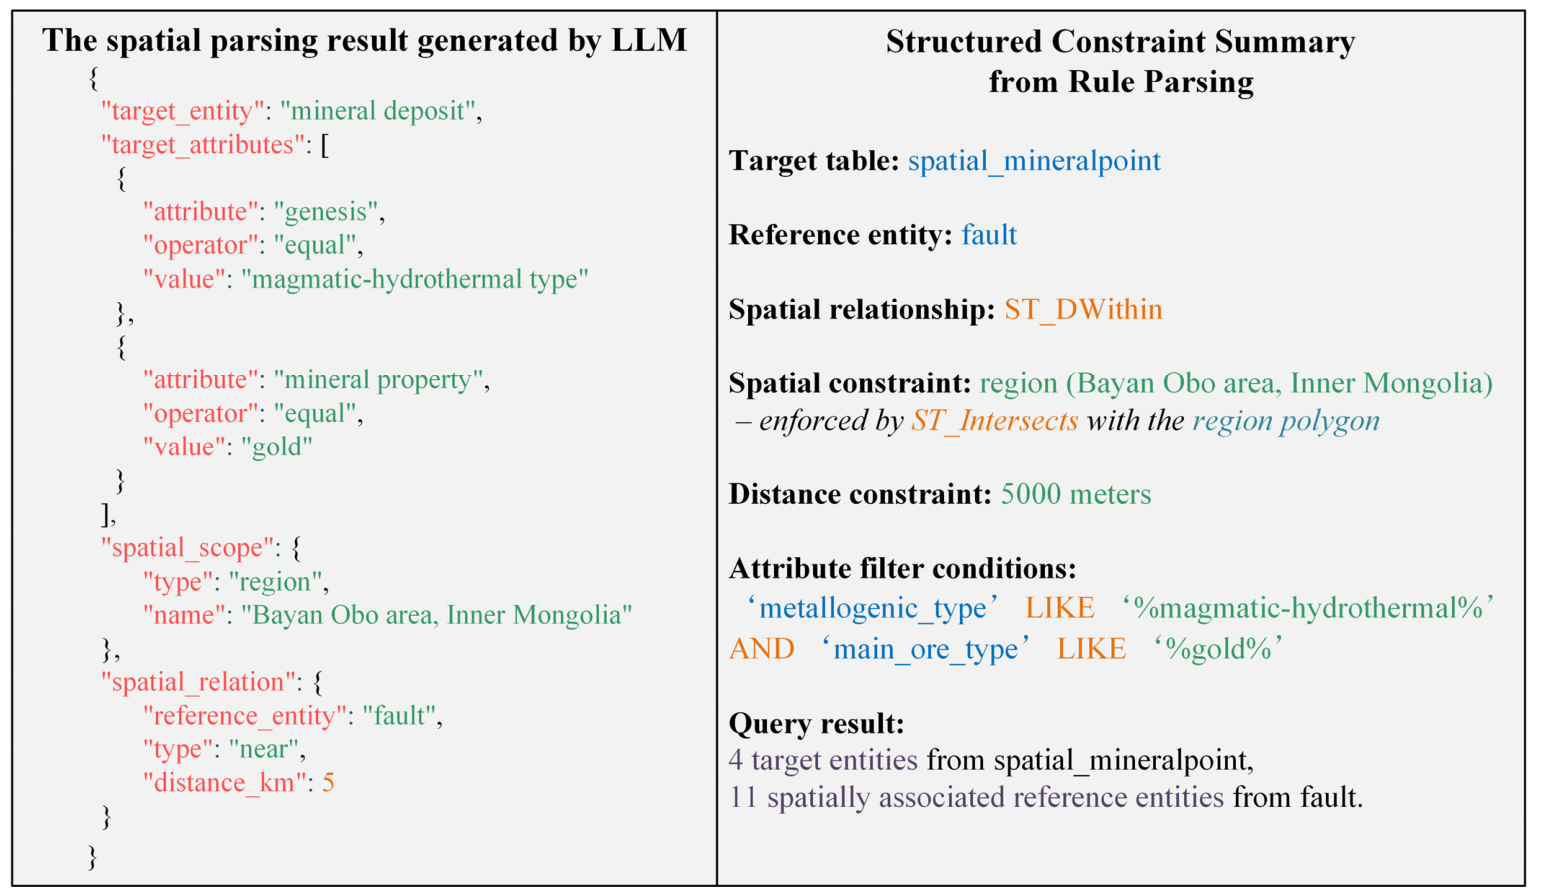
The following query was posed: “What magmatic-hydrothermal type gold deposits are located within 5 km of faults in the Bayan Obo area, Inner Mongolia?” The system first identifies it as a spatial relation query through the intent classifier and invokes the semantic parsing module to extract from the natural language the target entity type “ore occurrence”, attribute constraints “magmatic-hydrothermal type” and “gold”, spatial extent “Bayan Obo area, Inner Mongolia”, and spatial relation “within 5 km of faults”, as shown in Figure 4. Subsequently, the rule parser dynamically generates a parameterized PostGIS SQL statement. It implements attribute constraints using LIKE fuzzy matching (metallogenic type containing “magmatic-hydrothermal type”, main mineral containing “gold”), restricts the query to the polygon boundary of the “Bayan Obo area, Inner Mongolia” using ST_Intersects, and filters ore occurrences within 5 km of faults using ST_DWithin combined with geographic coordinate system distance calculation (geometry::geography), while simultaneously obtaining the geometry information of reference faults to construct the spatial proximity verification module.
After the first-stage spatial query parsing, the system accurately obtains four ore occurrences and eleven faults that satisfy the attribute and spatial constraints, along with the corresponding list of geological semantic elements. Subsequently, the second-stage rule-based ranking module performs comprehensive scoring and ranking of the candidate ore occurrences, primarily based on spatial distance. The final candidate order is consistent with the order of ore occurrences in Table 7 (arranged in ascending order of distance to fault). The spatial proximity verification module calculates the precise distance from each ore occurrence to the nearest fault. It not only retains the nearest reference entity but also lists other reference entities within the radius, ensuring that important structural information is not lost (see Table 7). The results show that the Saiwusu rock gold deposit is closest to a fault (0.02 km), followed by the Bilute gold deposit (2.78 km), the Sujiao’ao gold-copper prospect (2.98 km), and the Gansi Taolegai gold prospect (4.63 km), all satisfying the constraint. Although the nearest reference entity for all deposits is displayed as “unknown characteristics” due to incomplete attribute information, the spatial proximity module retains faults with detailed attributes among other reference entities within the radius. For example, the reference entities within the radius of the Saiwusu rock gold deposit include the northern margin fault belt of the North China Craton, described as “trending east-west, dipping north in the western segment and steep in the eastern segment, a boundary between the platform and the geosyncline, significantly controlling the tectonic evolution on both sides, extending eastward into Hebei and Liaoning”, at a precise distance of 2.84 km.
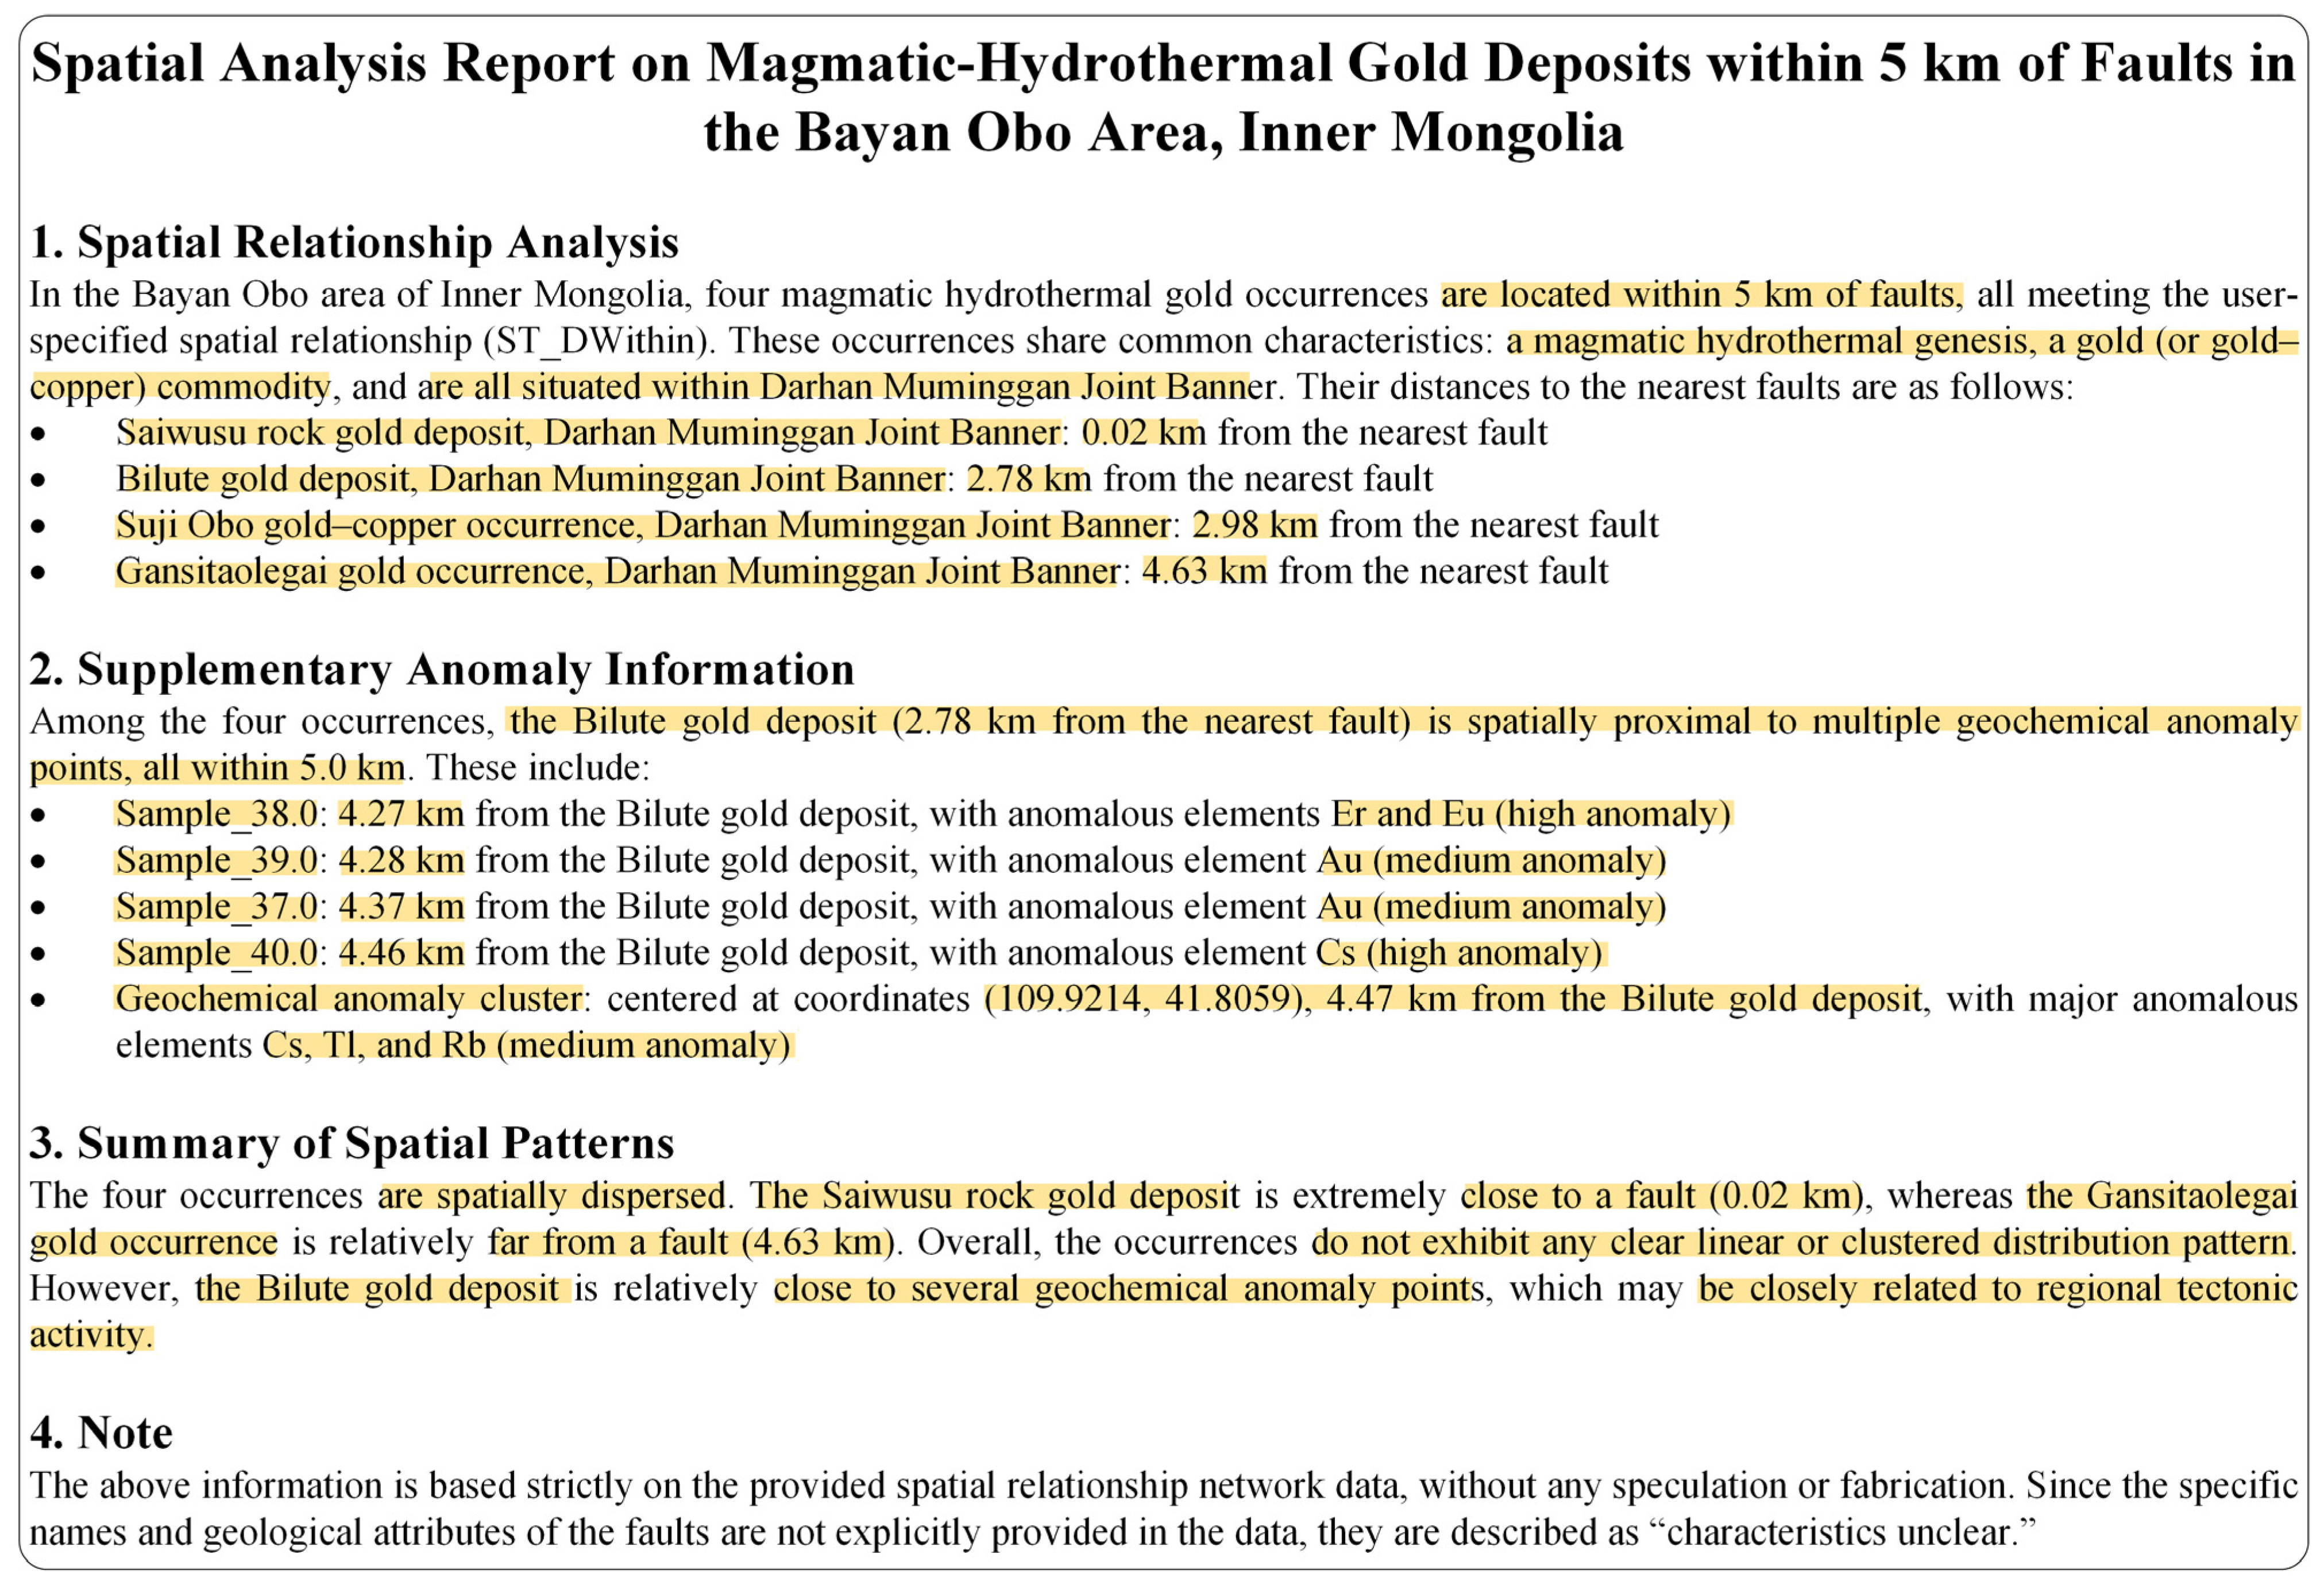
The system can adaptively decide whether to introduce geochemical anomaly information based on spatial proximity and element association, with the introduced information enriching the answer without interfering with core judgments. In this study, a data-driven quantile threshold method is adopted: the 95th percentile of each element’s concentration in the study area is used as the high-anomaly threshold, and the 75th percentile as the medium-anomaly threshold, to identify geochemical anomaly points at different anomaly levels. The main elements of anomaly clusters are derived based on the frequency of samples exceeding the high threshold within each cluster. Taking the Bilute gold deposit as an example, 12 high-intensity geochemical anomaly points are identified within a 4.3–5.0 km radius around it, with anomaly elements mainly including Au, Ag, Ce, Eu, Cs, etc. Among them, sample_38.0 is 4.27 km from the deposit, showing high anomalies of Er and Eu; sample_39.0 is 4.28 km away, showing a medium anomaly of Au. This anomaly information is spatially associated with the ore-forming fluid characteristics of magmatic-hydrothermal gold mineralization.
Based on the above data, the system generates an analysis report focusing on spatial distance judgment and incorporating anomaly background (see Figure 5). The report explicitly lists the precise distances from each deposit to the fault and the satisfaction of constraints, and supplements geochemical anomaly information around the Bilute gold deposit as auxiliary evidence. In the interactive map visualization (see Figure 6), the system represents faults with purple lines, marks target deposits with red dots, and automatically overlays a geochemical anomaly heatmap and anomaly cluster digital markers (orange dots and numbers) within the deposit proximity threshold (5 km).

3.3.2. Comprehensive Interpretation and Metallogenic Prediction

A composite query was posed: “What is the geological significance of the REE-Fe-Nb composite anomalies in the Bayan Obo area, Inner Mongolia? What is the prospecting potential of this area?” The system first invokes the results of the element association analysis module. This analysis is based on 16,370 stream sediment samples in the study area, selecting 15 elements closely related to rare earth-niobium mineralization (La, Ce, Pr, Nd, Sm, Eu, Gd, Tb, Ho, Er, Tm, Lu, Nb, F, Zr). After log1p transformation and Z-score standardization, PCA, K-Means clustering, and R-type hierarchical clustering were performed.
PCA tests show Kaiser–Meyer–Olkin (KMO) is 0.824, Bartlett’s sphericity test p < 0.05, indicating that the data are suitable for dimensionality reduction (see Table 8). The first six principal components cumulatively explain 98.28% of the variance. PC1 (70.05%) reflects regional background geological characteristics, with strong correlations among rare earth elements (REEs) being the main reason for the high concentration of variance [35,36]; PC2 (14.20%) shows positive loadings of Lu, Tm, Ho, Er and negative loadings of La, Eu, Ce, indicating light-heavy rare earth fractionation [35,37], and this principal component has the highest number of anomalous samples (451), suggesting the need for investigation in conjunction with fault zones and hydrothermal activity centers; PC3 (5.09%) is characterized by a high loading of Zr (0.872) and a key negative loading of F (−0.380), reflecting the geochemical separation of Zr and the volatile element F during the early magmatic-hydrothermal stage, indicating the control of multi-stage magmatic-hydrothermal activity on element fractionation [38]; PC4 (4.12%) has positive loadings of F (0.715), Eu (0.368), Zr (0.366), corresponding to fluoritization and REE-Zr co-enrichment, which may be direct evidence of fluorine-rich hydrothermal overprinting and reflects the strong modification of the H8 unit by Paleozoic fluids [36,38]; PC5 (2.82%) has positive loadings of Eu (0.535), Tb (0.411) and negative loadings of Nd (−0.328), F (−0.517), reflecting late Eu anomaly and F depletion, representing the rare earth fractionation stage at the end of hydrothermal evolution [36,38]; PC6 (2.00%) has a loading of Nb as high as 0.910, with extremely low loadings for other elements, likely reflecting an independent Nb enrichment event caused by late hydrothermal activity superimposed on rare earth mineralization [36,38].
K-Means clustering (K = 3) yields a silhouette coefficient of 0.394 [39], indicating some overlap between clusters and moderately weak clustering characteristics (see Table 9). The samples are divided into three classes, among which Class 3 (399 samples) has significantly higher dimensionless center values (after log1p transformation) for La, Ce, F, Zr, Nb than the first two classes (La = 5.83, Ce = 6.13, F = 7.84, Zr = 5.26, Nb = 4.71), representing a high-background mineralization group.
R-type hierarchical clustering divides the 15 elements into two groups. Group 1 consists of Ho-Er-Tm-Lu, a heavy rare earth combination, possibly indicating late hydrothermal activity; Group 2 consists of La-Ce-Pr-Nd-Sm-Eu-Gd-Tb-Nb-F-Zr, where the close combination of light rare earths, niobium, and fluorine is consistent with the element paragenesis of carbonatite-type rare earth-iron-niobium deposits [35,36,38]. The inclusion of zircon may reflect the contribution of granites or clastic rocks to stream sediments; the Bayan Obo area contains Paleozoic granites and Proterozoic clastic rocks rich in zircon, whereas carbonatites themselves are typically depleted in zircon, so the two are not contradictory [35,36,37,38].
Interface screenshots of the element association analysis (PCA, K-Means clustering, and hierarchical clustering) are shown in Figures S1–S3. The analysis reports from the element association analysis are automatically saved to the ChromaDB vector knowledge base for later retrieval during question answering.
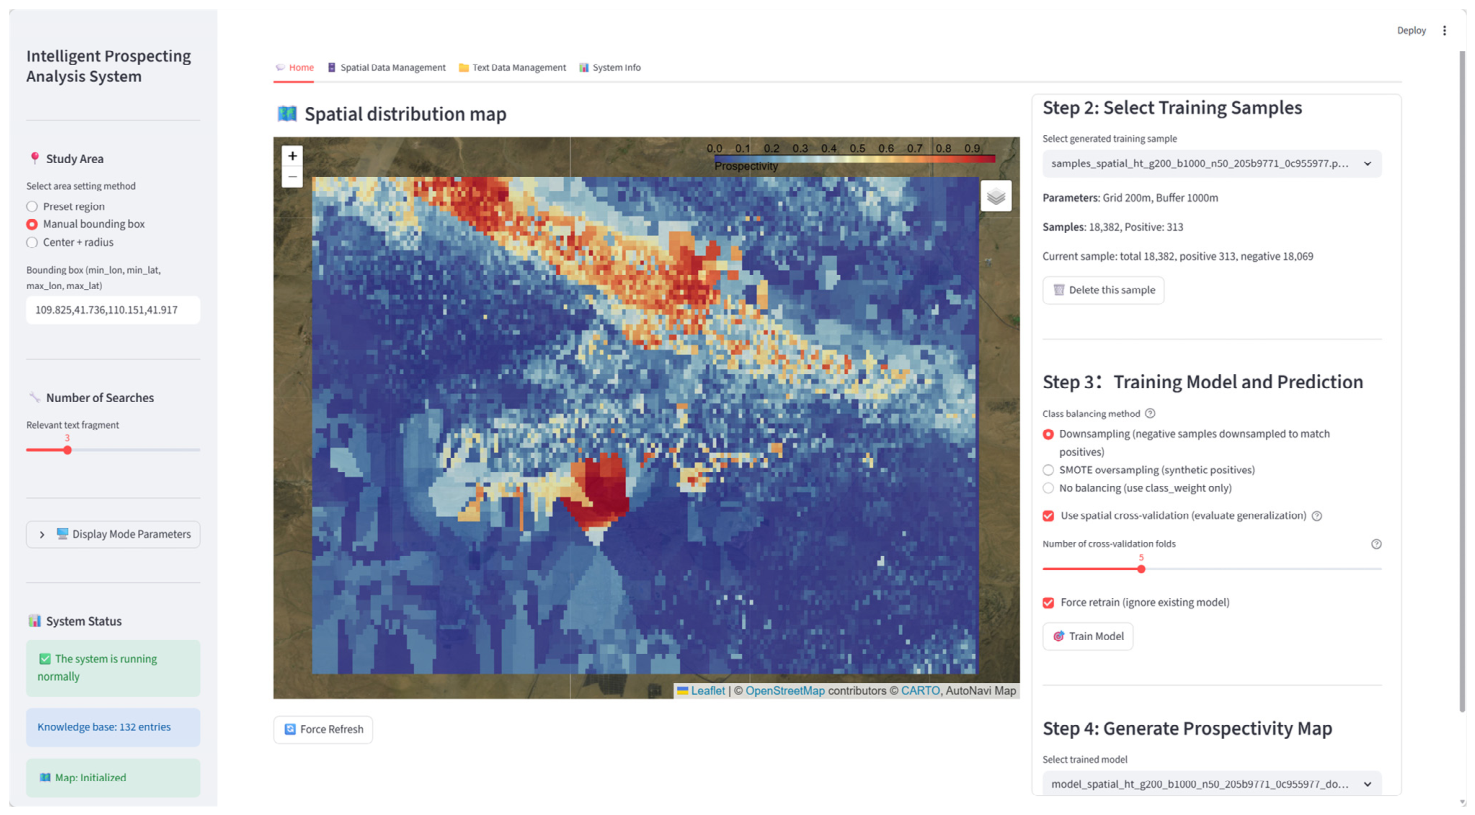
In the metallogenic prediction interface, the model training used a grid size of 200 m, an ore occurrence buffer radius of 1000 m, the number of trees set to 50, and features including distance to faults, the 15 elements mentioned above, and geological body type. To overcome extreme positive-negative sample imbalance (only 313 positive samples) and spatial autocorrelation, undersampling was used for balancing (313 positive and 313 negative), and 5-fold spatial cross-validation was performed to evaluate generalization ability (see the right-side operation panel in Figure 7). The results show that the model achieves AUCs (Area Under the Curve values) of 0.727, 0.671, 0.999, and 0.864 on the first four folds, with the fifth fold yielding no computable AUC because its spatial test block contained zero positive samples (known mineral occurrences). This is an inherent consequence of the strict spatial block isolation (block size 0.05 degrees, approximately 5 km) applied to highly imbalanced prospecting data, where positive samples are sparsely distributed and may be absent from an individual test block. The mean AUC is 0.815 (standard deviation 0.127, computed over the four folds with valid AUC) and the mean accuracy is 0.915 (standard deviation 0.048, over all five folds), indicating moderately strong but variable discriminative ability in unknown spatial regions.
To investigate whether the near-perfect AUC of 0.999 on the third fold indicates feature leakage, a block-size sensitivity analysis was conducted by varying the spatial block size from 0.02 degrees to 0.10 degrees (approximately 2–11 km) with 10 repeated spatial cross-validation runs per block size (Table 10). Note that the sensitivity analysis uses 10 repeated runs with downsampling balance, so the 0.05 degrees row in Table 10 (mean AUC 0.771) differs from the single-run result (mean AUC 0.815) reported above. High-AUC folds (>0.99) occur across block sizes from 0.02 to 0.07 degrees (6.0%–16.0% of folds) and are strongly associated with very few positive test samples (mean 6.5 positives in high-AUC folds versus 91.2 in normal folds; see Data Availability Statement). Their frequency peaks at 0.05 degrees (16.0%) and declines toward both smaller (0.02 degrees: 6.0%) and larger (0.10 degrees: 0.0%) blocks—a non-monotonic pattern that is inconsistent with feature leakage, since smaller blocks with higher spatial autocorrelation would produce more, not fewer, high-AUC folds if leakage were present. Instead, the peak reflects the interaction between block count and positive-sample distribution: the intermediate 0.05-degree partitioning (32 blocks, ~6 test blocks per fold) occasionally yields test sets with as few as 3–7 positive samples, destabilizing AUC; smaller block sizes (e.g., 0.02 degrees, 180 blocks, ~36 test blocks per fold) provide more positives per test set and stabilize the metric, while larger blocks (e.g., 0.10 degrees, 10 blocks) either produce zero-positive folds or distribute positives too evenly for instability. At the largest block size (0.10 degrees), high-AUC folds disappear entirely, but two of five folds contain zero positive samples, rendering AUC computation impossible. These findings suggest that the near-perfect AUC values are likely a statistical artifact of extreme class imbalance under strict spatial block isolation rather than definitive evidence of feature leakage.
The feature importance ranking (see Table 11) shows that distance to faults (19.87%) and geological body type (17.02%) are the most important ore-controlling factors, with faults dominating fluid migration and geological bodies controlling element enrichment [32,33,34,35,36,37,38]. Additionally, elements such as F (8.32%), Tm (6.82%), and Ho (6.75%) also contribute significantly. F promotes rare earth enrichment through three aspects: fluid complexation, mineral precipitation, and magmatic differentiation [36,37,38]; Tm and Ho, as less abundant heavy REEs, can theoretically participate in the formation of light rare earth minerals (e.g., monazite, bastnäsite) through lattice substitution and can serve as tracers of the degree of magmatic differentiation and evolution, indirectly reflecting the characteristics of the metallogenic environment [35,36,38].
Based on the predicted probabilities, the study area is divided into three potential levels by quantiles: high-potential areas are the top 1% of grids (probability ≥ 0.9344), totaling 184 target areas, with typical coordinates such as (109.9613, 41.8063), (109.9685, 41.8027), etc.; medium-potential areas are the top 1%–10% of grids (0.4619 ≤ probability < 0.9344); and low-potential areas have probability < 0.4619. The probability map’s high-value centers align with known ore occurrences, while high-potential areas concentrate at fault intersections and specific geological bodies.
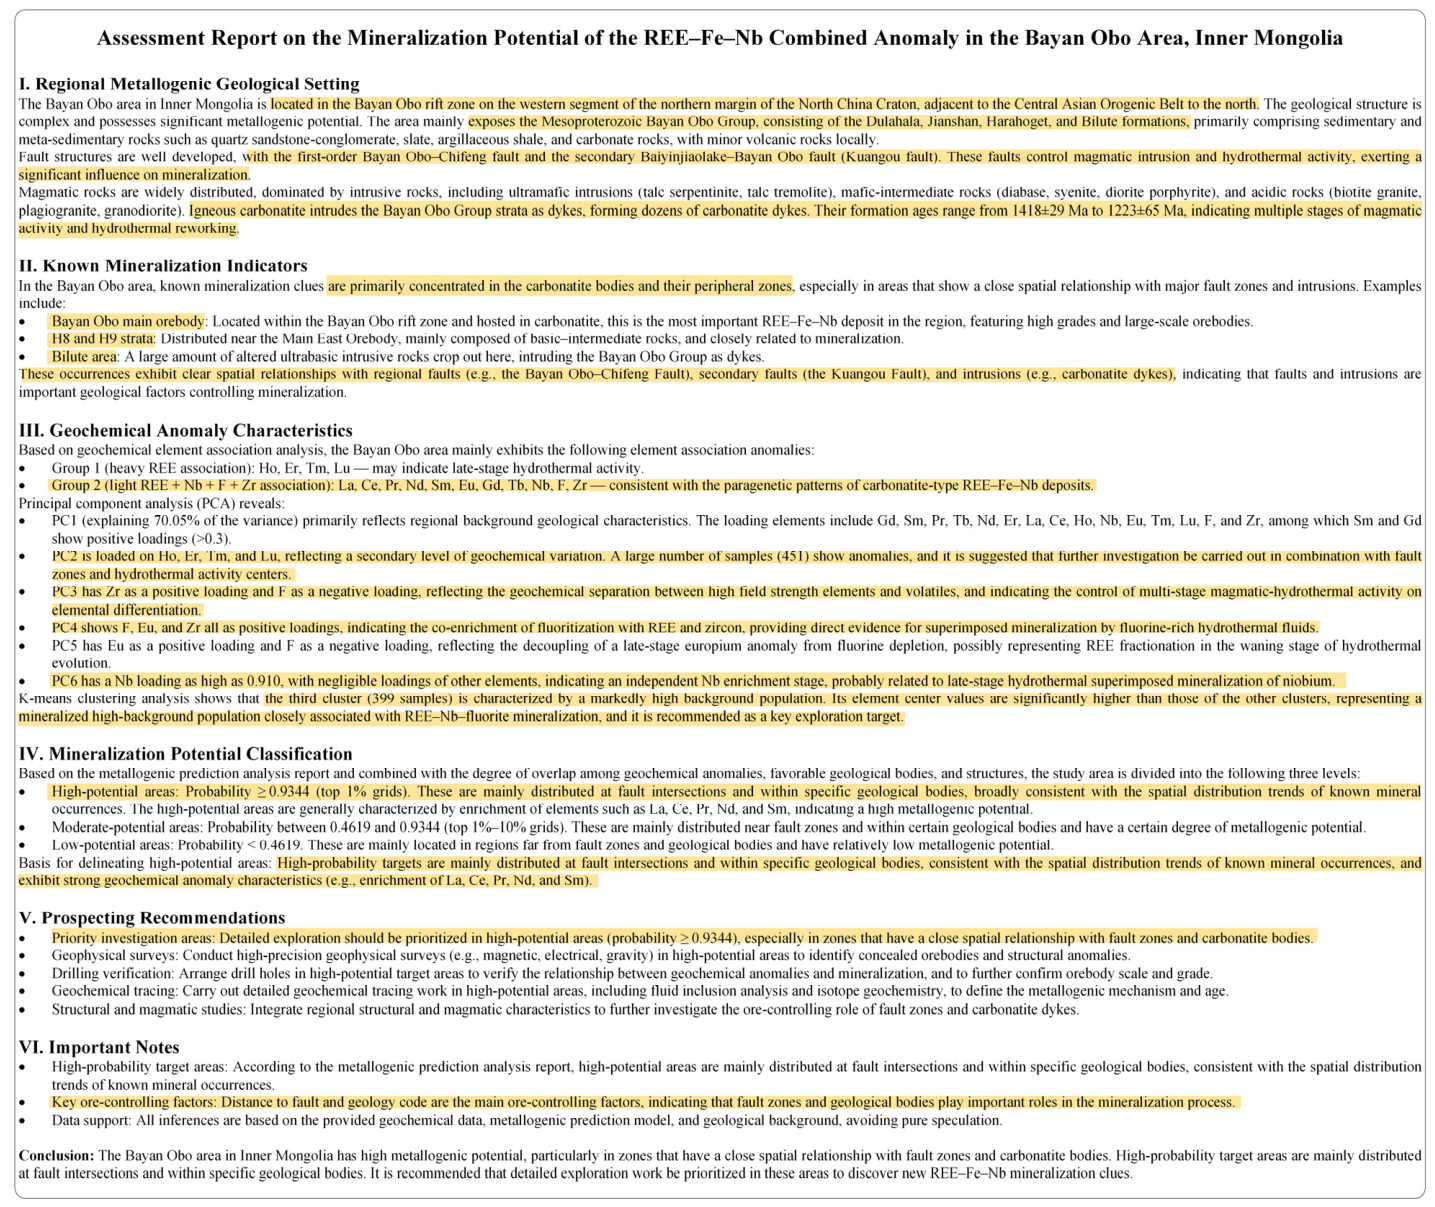
In the Q&A interface, the above analysis results are integrated with literature on the genesis of the Bayan Obo deposit (igneous carbonatite magmatism and subsequent hydrothermal alteration) from the knowledge base [40] to generate a comprehensive report (see Figure 8). The map also automatically displays the previously generated metallogenic prediction probability map, onto which users can overlay ore occurrences, faults, and geological bodies for analysis (Figure S4 in Supplementary_Figures.docx, Supplementary Materials).
The report not only provides quantitative target area coordinates but also offers interpretable evidence from three dimensions: structure, geochemistry, and metallogenic model, achieving a progressive analysis that proceeds from data-driven insights, through background knowledge enhancement, to comprehensive decision-making. The report first outlines the regional metallogenic geological background, stating that the regional metallogenic setting is the rift belt on the northern margin of the North China Craton, with the Mesoproterozoic Bayan Obo Group controlled by multi-stage faulting and igneous carbonatite intrusion. Regarding geochemical anomalies, four core principal components jointly constitute the multi-dimensional metallogenic indicators of the REE-Fe-Nb composite anomalies: PC2 (strong light-heavy rare earth fractionation) reflects the rare earth fractionation during magmatic-hydrothermal evolution; PC3 (geochemical separation of zircon and fluorine) indicates the control of fluorine-rich fluid evolution on element differentiation; PC4 (fluoritization and REE-Zr co-enrichment) and PC6 (independent niobium enrichment) correspond to fluorine-rich hydrothermal overprinting and a late niobium mineralization event, respectively. Meanwhile, the Class 3 high-background group samples show good spatial coupling with known ore bodies. In the metallogenic potential zoning, the high-potential areas (probability ≥ 0.9344) exhibit significant enrichment of La, Ce, Pr, Nd, Sm, etc. (enrichment factors 1.47–3.21). The report recommends prioritizing comprehensive geological, geochemical, and high-precision geophysical surveys in high-potential target areas, and implementing drilling verification near fault zones and around known ore occurrences.


4. Discussion

This study verifies the feasibility of coupling LLM with a spatial database for geological prospecting question answering. The intent-driven routing mechanism ensures that queries are directed to the correct processing pipeline. Semantic parsing is the core driver of the system; its absence leads to a substantial drop in retrieval accuracy. The value of rule-based ranking lies in its ability to optimize candidate entity ranking quality, approaching the theoretical optimal NDCG value without relying on additional LLM inference resources. The spatial proximity module adds an interpretability dimension to the generation stage, transforming answers from mere entity lists into citable and verifiable spatial facts, which is a key feature distinguishing this system from traditional RAG. The spatial citation rate, as a novel hard metric, compensates for the insensitivity of automatic evaluation to interpretability.
Compared with existing work, this study exhibits different emphases in multiple dimensions. In the general domain, the Spatial-RAG framework proposed by Yu et al. [12] integrates a structured spatial database with an LLM using a hybrid retrieval engine of sparse spatial filtering and dense semantic matching for travel route recommendation and map question answering. However, its spatial filtering relies on predefined geometry types and POI semantic categories, making it difficult to adapt to the diverse entity types and semantically heterogeneous spatial data in geological prospecting. In the cartography domain, Wang et al. [13] combined a knowledge graph with an LLM for traffic map cartography, achieving cartographic rule reasoning and interactive modification, demonstrating the effectiveness of an external knowledge base in enhancing LLM spatial tasks. Nevertheless, their method heavily depends on the stable symbol system and predefined rule graph of traffic maps and cannot be transferred to scenarios with variable entity types (e.g., deposit genesis, fault ages) in the geological domain. In the geographic information domain, Liang et al. [14] proposed GeoGraphRAG, which realizes automated geospatial modeling script generation by constructing an external graph knowledge base, demonstrating high efficiency and interpretability. However, its ability to perform immediate queries on newly collected geochemical sampling points and ore occurrence data is limited, and it cannot handle dynamically changing reference entities in exploratory queries.
Existing work in the geological domain mostly adopts knowledge graph paths with predefined ontologies. Li et al. [15] built an intelligent question answering system for the Jiaodong gold deposit based on GraphRAG, achieving natural language question answering and knowledge tracing by constructing an ontological knowledge system covering concepts such as metallogenic type, ore-controlling structure, and mineral assemblage. Zhou et al. [16] integrated GeoGPT’s domain knowledge extraction capability with LightRAG’s efficient retrieval mechanism to achieve low-cost, high-precision geological knowledge graph construction and a high-performance question answering system, providing a scalable solution for intelligent analysis of geological texts. Huang et al. [17] presented the GeoGPT-RAG technical report, demonstrating a standardized process for RAG applications in geoscience question answering by constructing a large-scale geoscience knowledge base and fine-tuning embedding and reranking models. These works excel in text-based question answering and knowledge tracing, but their spatial capability is confined to predefined relation paths and largely relies on offline modeling. In contrast, the system presented in this paper maintains immediate responsiveness to newly ingested data through dynamic data schema adaptation and real-time spatial query generation.
Current geological question-answering RAG systems primarily use textual sources, such as academic literature or technical reports [11,17,41,42]. Recent work has shown that while refined Chain-of-Thought prompting can enhance LLM performance on certain spatial reasoning tasks, it does not eliminate fundamental errors in multi-step spatial inference [11]. This further motivates our use of an external spatial computation engine (PostGIS) and a verifiable distance module, rather than relying solely on the LLM’s internal reasoning. Our system’s context-enhanced generation module incorporates geological literature fragments from the ChromaDB vector database, as well as geochemical anomaly distributions, random forest metallogenic probability predictions, and element association analysis results. This allows answers to include precise spatial distances, anomaly statistics, and literature references. The technology transforms GIS from a static basemap to a real-time tool for querying spatial data and creating maps. Additionally, in contrast to the objectives put forth in recent forward-looking discussions on RAG for geoscience [19], such as multi-modal earth data retrieval, physically constrained reasoning, and scientific-grade result generation, this paper makes an initial investigation of the “reasoning and verification” link within the Geo-RAG framework, offering a useful basis for the later introduction of more stringent physical constraints and numerical model validation mechanisms.
This study also has several limitations. Under the geochemical anomaly interpretation intent, the current system has not yet achieved automatic linkage from analysis results to map layers. For example, when a user queries for geochemical anomaly interpretation and metallogenic prediction, although the system provides a detailed statistical report and geological interpretation, it does not automatically highlight, on the map, information such as high-scoring points of PC1 or high-background sample groups from K-Means clustering. This limitation mainly stems from the incomplete performance optimization of real-time data sharing among multiple modules. In the future, cluster labels and principal component scores can be bound to spatial coordinates, and one-click visualization of anomalous sample distributions can be realized through Folium dynamic layers, providing more intuitive guidance for target area delineation. The robustness of LLM semantic parsing is also a prominent challenge. Although the parsing failure rate has been significantly reduced through carefully designed prompts, multiple post-processing cleaning functions, and keyword-based auto-completion rules, the model may still generate incorrect attribute mappings or omit spatial relations when faced with ambiguous semantic expressions or rare geological terminology combinations. In addition, system performance heavily depends on the quality of input data. The ground-truth SQL on which the test set construction relies requires careful manual writing; any omissions or semantic biases in the ground truth directly affect the objectivity of evaluation metrics. Inconsistent units in geochemical data, scale differences between major and trace elements, and inconsistent primary keys among different data tables all increase the adaptation cost of the system to varying degrees. The limitations of the LLM-as-Judge automatic evaluation method were also exposed in the experiment, indicating that current evaluation models are insufficient at identifying factual errors and hollow answers, thus necessitating the combination of hard metrics such as the spatial citation rate.

5. Conclusions

This study organically integrates the natural language understanding capability of an LLM with the precise computational capability of a PostGIS spatial database. Ablation experiments on 35 queries spanning three geological regions (Bayan Obo, Yunnan, and Sichuan) and two query intent categories demonstrate that semantic filtering improves retrieval precision, rule-based ranking enhances candidate ordering, and the spatial proximity verification module increases the frequency of verifiable distance citations in generated answers. Within the spatial-relation queries, the citation rate further reveals that distance-proximity queries achieve a higher rate (0.527) than topology-containment queries (0.250), reflecting the fact that the latter rely on qualitative spatial descriptions rather than numeric values verifiable against prompt evidence. Two case studies in the Bayan Obo REE-Fe-Nb metallogenic belt, selected for its representative geological significance and rich multi-source data, further illustrate the system’s ability to integrate spatial retrieval, geochemical analysis, and knowledge fusion. The decoupled modular design supports transfer to other geological regions and provides an evolutionary path for subsequently introducing more advanced functions such as a more powerful LLM agent framework, multi-modal geological data understanding, and spatiotemporal sequence analysis.
The evaluation framework presented in this study has several methodological constraints. The benchmark comprises 35 queries spanning all intent types that the prototype system currently supports—spatial-relation queries (17, including 14 distance-proximity and 3 topology-containment subtypes) and entity-list queries (18, subdivided into 7 geochemical threshold and 11 attribute-filter queries)—with ground truth derived from independently authored SQL against the same database the system queries. Furthermore, while these queries were designed to reflect real geological exploration scenarios, they were authored by the system developers rather than domain experts; incorporating queries manually designed by geologists with field experience in the study areas would provide a more rigorous assessment of practical utility and linguistic coverage. While this design verifies SQL execution equivalence, the saturation of MRR at 1.000 across multiple configurations reflects the deterministic nature of the ground-truth definition: for structured queries with multiple relevant entities, MRR—which only considers the rank of the first relevant result—reaches its maximum value whenever the system correctly retrieves any relevant entity, regardless of ordering. Precision@5 and Recall@5, which vary substantially across configurations (e.g., Full Model P@5 = 0.829 vs. Vanilla LLM-to-SQL P@5 = 0.023), remain the discriminating retrieval metrics. Scaling the benchmark with additional queries of the same type is unlikely to substantially alter these conclusions, as the underlying SQL patterns and data structures remain constant; meaningful expansion of the test set would become necessary when the system’s functionality is extended to support fuzzy retrieval queries requiring multi-module orchestration and intelligent reasoning—for example, a query such as “potential mineral occurrences near a specific fault” would require combining spatial proximity retrieval with prospectivity modeling results, and the answer is not deterministic but depends on model predictions and geological reasoning. For such queries, SQL-based ground-truth extraction is no longer applicable, and independent human relevance annotation would become essential. A further concern is that the same Qwen3-4B model functions as both answer generator and automatic judge, potentially introducing self-preference bias into the faithfulness and relevance scores. To address this concern, an independent evaluation was conducted using DeepSeek-V4-Flash as an external judge on all 245 responses, yielding high inter-evaluator agreement (Pearson r = 0.951 for faithfulness, 0.988 for relevance; both p < 0.001). Nevertheless, blinded expert evaluation remains necessary to further validate the automatic scoring.
Future work should focus on: (1) enhancing system intelligence through agentic workflows (e.g., multi-step reasoning chains that automatically combine element association analysis, prospectivity modeling, and spatial querying), as well as introducing multi-modal LLMs for joint analysis of images and text and extending support for spatiotemporal sequence data; further, broadening the evaluation benchmark beyond the current query types, as discussed above; (2) conducting blinded human evaluation by multiple geological experts, incorporating expert-designed real-world queries into the benchmark, and introducing independent relevance annotation for fuzzy retrieval queries once the system is extended to support such scenarios where SQL-based ground truth is no longer applicable; (3) developing citation correctness and completeness metrics—beyond the current coverage-only spatial citation rate—to provide a more precise assessment of interpretability across diverse question types.

Supplementary Materials

The following supporting information can be downloaded at: https://www.mdpi.com/article/10.3390/min16080802/s1, All Supplementary Materials are provided as a single archive (Supplementary_Materials.zip) containing both supplementary figures (Supplementary_Figures.docx: Figure S1: PCA analysis interface for geochemical element association; Figure S2: K-Means clustering analysis interface; Figure S3: Hierarchical clustering (dendrogram) analysis interface; Figure S4: QA-driven interface showing the prospectivity map with overlaid ore occurrences, faults, and geological bodies. Screenshot of the Q&A interface, displaying the metallogenic prediction probability map. Users can interactively overlay ore occurrences, faults, and geological bodies for spatial analysis) and the following code/data files: (1) the evaluation benchmark (test_queries.json) containing 35 test queries with each query provided in both Chinese (the original query language processed by the system) and an English translation; (2) the test set generation script (build_test_set.py), whose embedded SQL queries serve as reference SQL templates for ground-truth extraction; (3) the evaluation metrics implementation (simple_metrics.py) including the Faithfulness, Relevance, and spatial citation rate scoring rubrics; (4) the experiment runner template (run_experiments_template.py) showing seven experiment configurations (five ablation configurations and two baselines); (5) all LLM prompt templates (prompt_templates.py) used in the semantic parsing, candidate ranking, and answer generation stages, provided in Chinese with English descriptions; (6) an example configuration file (config_example.py) with database, model, and system parameters; (7) example schema-mapping files (user_table_types_example.json and user_column_mapping_example.json) that illustrate how the system maps natural language terms to database tables and columns, normally configured through the system’s web interface; and (8) the per-fold sensitivity analysis data (sensitivity_fold_details.csv) containing the individual cross-validation fold AUC, accuracy, and positive/negative sample counts for each block size and repeat. The full system source code is proprietary and is not shared.

Author Contributions

Y.Z. (Yuqing Zhang): Conceptualization, methodology, software, validation, formal analysis, investigation, data curation, writing—original draft preparation, writing—review and editing, visualization. Y.Z. (Yongzhang Zhou): Conceptualization, Writing—review and editing, project administration, funding acquisition. L.N.: Conceptualization, methodology, data curation, investigation. X.Y.: Data curation, investigation. B.Z.: Data curation, investigation. All authors have read and agreed to the published version of the manuscript.

Funding

This research was funded by the National Key Research and Development Program of China (2022YFF0801201); National Natural Science Foundation of China (U1911202); Inner Mongolia Autonomous Region “Open Bidding for Selecting the Best Candidates” Project (2025KJTW0020).

Data Availability Statement

The lithological basemap used in Figure 3 was derived from a publicly available dataset at https://gitcode.com/open-source-toolkit/53e1c (accessed on 13 November 2025). The underlying geological and mineral occurrence data that support the findings of this study are not publicly available due to confidentiality agreements and ongoing research projects.

Conflicts of Interest

The authors declare no conflicts of interest.

Abbreviations

The following abbreviations are used in this manuscript:
LLMLarge Language Model
RAGRetrieval-Augmented Generation
GeoQAGeographic Question Answering
PostGISPostgreSQL Spatial Extension
SQLStructured Query Language
PCAPrincipal Component Analysis
SMOTESynthetic Minority Over-sampling Technique
AUCArea Under the Curve
NDCGNormalized Discounted Cumulative Gain
MRRMean Reciprocal Rank
KMOKaiser–Meyer–Olkin
REERare Earth Element

References

  1. Zhou, Y.; Zhang, L.; Zhang, A.; Wang, J. Big Data Mining and Machine Learning in Earth Sciences; Sun Yat-Sen University Press: Guangzhou, China, 2018; pp. 1–269. [Google Scholar]
  2. Zuo, R. Geodata Science-Based Mineral Prospectivity Mapping: A Review. Nat. Resour. Res. 2020, 29, 3415–3424. [Google Scholar] [CrossRef] [Scilit]
  3. Cheng, Q.M. A new paradigm for mineral resource prediction based on human intelligence-artificial intelligence integration. Earth Sci. Front. 2025, 32, 1–19. [Google Scholar] [CrossRef] [Scilit]
  4. Yuan, M.; Li, Q.; Zhang, B.; Pan, J.; Gao, L.; Jing, L.; Lu, L. A systematic review of deep learning methods for mineral exploration using multisource geoscience data (2018–2025). Int. J. Appl. Earth Obs. 2026, 149, 105254. [Google Scholar] [CrossRef] [Scilit]
  5. Zhou, Y.; Yang, H.; Ji, X. Big Data and AI in Geoscience: From Data to Discovery—A Thematic Overview. Minerals 2026, 16, 229. [Google Scholar] [CrossRef] [Scilit]
  6. Lewis, P.; Perez, E.; Piktus, A.; Petroni, F.; Karpukhin, V.; Goyal, N.; Küttler, H.; Lewis, M.; Yih, W.; Rocktäschel, T. Retrieval-augmented generation for knowledge-intensive nlp tasks. Adv. Neural Inf. Process. Syst. 2020, 33, 9459–9474. [Google Scholar]
  7. Mai, G.; Janowicz, K.; Zhu, R.; Cai, L.; Lao, N. Geographic question answering: Challenges, uniqueness, classification, and future directions. Agil. GIsci. Ser. 2021, 2, 8. [Google Scholar] [CrossRef] [Scilit]
  8. Mai, G.; Huang, W.; Sun, J.; Song, S.; Mishra, D.; Liu, N.; Gao, S.; Liu, T.; Cong, G.; Hu, Y. On the opportunities and challenges of foundation models for geoai (vision paper). Acm Trans. Spat. Algor 2024, 10, 1–46. [Google Scholar] [CrossRef] [Scilit]
  9. Zhang, H.; Li, C.; Wu, W.; Mao, S.; Vulić, I.; Zhang, Z.; Wang, L.; Tan, T.; Wei, F. A call for new recipes to enhance spatial reasoning in mllms. arXiv 2025, arXiv:2504.15037. [Google Scholar]
  10. Dorobantu, G.I.; Badea, A.C. Geospatial reasoning and awareness in large language models: A systematic review. Artif. Intell. Rev. 2026, 59, 111. [Google Scholar] [CrossRef] [Scilit]
  11. Li, F.; Hogg, D.C.; Cohn, A.G. Advancing spatial reasoning in large language models: An in-depth evaluation and enhancement using the stepgame benchmark. Proc. AAAI Conf. Artif. Intell. 2024, 2024, 18500–18507. [Google Scholar] [CrossRef] [Scilit]
  12. Yu, D.; Bao, R.; Ning, R.; Peng, J.; Mai, G.; Zhao, L. Spatial-rag: Spatial retrieval augmented generation for real-world geospatial reasoning questions. arXiv 2025, arXiv:2502.18470. [Google Scholar]
  13. Wang, M.; Li, B.; Wang, Z.; Liu, S.; Liao, C.; Cai, Z. An Intelligent Map Cartography Framework Integrating Knowledge Graph and Large Language Model. Geomat. Inf. Sci. Wuhan Univ. 2026, 51, 840–851. [Google Scholar] [CrossRef]
  14. Liang, J.; Hou, S.; Jiao, H.; Qing, Y.; Zhao, A.; Shen, Z.; Xiang, L.; Wu, H. GeoGraphRAG: A graph-based retrieval-augmented generation approach for empowering large language models in automated geospatial modeling. Int. J. Appl. Earth Obs. 2025, 142, 104712. [Google Scholar] [CrossRef] [Scilit]
  15. Li, B.W.; Wang, Y.Z.; Ding, Z.J.; Wang, B.; Wen, S.B.; Dong, Y.H.; Ji, Z. Intelligent search technology for Jiaodong gold deposits based on large models and GraphRAG. Earth Sci. Front. 2025, 32, 155–164. [Google Scholar]
  16. Zhou, B.; Li, K. Fusing Geoscience Large Language Models and Lightweight RAG for Enhanced Geological Question Answering. Geosciences 2025, 15, 382. [Google Scholar] [CrossRef] [Scilit]
  17. Huang, F.; Wu, F.; Zhang, Z.; Wang, Q.; Zhang, L.; Boquet, G.M.; Chen, H. GeoGPT-RAG Technical Report. arXiv 2025, arXiv:2509.09686. [Google Scholar]
  18. Xie, S.; Hsu, S.; Zhang, Q.; Gao, Y.; Shahabi, C.; Sabek, I. Evaluating Intrinsic Geospatial Topological Reasoning in LLMs. In Proceedings of the 1st ACM SIGSPATIAL International Workshop on Generative and Agentic AI for Multi-Modality Space-Time Intelligence, Minneapolis, MN, USA, 3–6 November 2025; pp. 43–48. [Google Scholar]
  19. Yu, R.; Luo, S.; Ghosh, R.; Li, L.; Xie, Y.; Jia, X. Rag for geoscience: What we expect, gaps and opportunities. arXiv 2025, arXiv:2508.11246. [Google Scholar]
  20. PostGIS: Spatial and Geographic Objects for PostgreSQL. Available online: https://postgis.net/ (accessed on 13 November 2025).
  21. Obe, R.; Hsu, L. PostGIS in Action; Simon and Schuster: New York, NY, USA, 2021. [Google Scholar]
  22. Xiao, S.; Liu, Z.; Zhang, P.; Muennighoff, N.; Lian, D.; Nie, J. C-pack: Packed resources for general Chinese embeddings. In Proceedings of the 47th International ACM SIGIR Conference on Research and Development in Information Retrieval, Washington, DC, USA, 14–18 July 2024; pp. 641–649. [Google Scholar]
  23. Yang, A.; Li, A.; Yang, B.; Zhang, B.; Hui, B.; Zheng, B.; Yu, B.; Gao, C.; Huang, C.; Lv, C. Qwen3 technical report. arXiv 2025, arXiv:2505.09388. [Google Scholar]
  24. Breiman, L. Random forests. Mach. Learn 2001, 45, 5–32. [Google Scholar] [CrossRef] [Scilit]
  25. Chawla, N.V.; Bowyer, K.W.; Hall, L.O.; Kegelmeyer, W.P. SMOTE: Synthetic minority over-sampling technique. J. Artif. Intell. Res. 2002, 16, 321–357. [Google Scholar] [CrossRef] [Scilit]
  26. Liu, A.Y. The Effect of Oversampling and Undersampling on Classifying Imbalanced Text Datasets. Doctoral Dissertation, The University of Texas at Austin, Austin, TX, USA, 2004. [Google Scholar]
  27. Brenning, A. Spatial cross-validation and bootstrap for the assessment of prediction rules in remote sensing: The R package sperrorest. In 2012 IEEE International Geoscience and Remote Sensing Symposium; IEEE: New York, NY, USA, 2012; pp. 5372–5375. [Google Scholar]
  28. Streamlit: The Fastest Way to Build and Share Data Apps; Snowflake Inc.: San Francisco, CA, USA, 2025.
  29. Marie, P. Creating Interactive Maps with Folium and Python. In Modern Web Cartography: Open Source Map Solutions with OpenStreetMap, Overpass, Nominatim, Leaflet and Folium; Springer: Berlin/Heidelberg, Germany, 2026; pp. 171–233. [Google Scholar]
  30. Järvelin, K.; Kekäläinen, J. Cumulated gain-based evaluation of IR techniques. ACM Trans. Inf. Syst. (TOIS) 2002, 20, 422–446. [Google Scholar] [CrossRef] [Scilit]
  31. Zheng, L.; Chiang, W.; Sheng, Y.; Zhuang, S.; Wu, Z.; Zhuang, Y.; Lin, Z.; Li, Z.; Li, D.; Xing, E. Judging llm-as-a-judge with mt-bench and chatbot arena. Adv. Neural Inf. Process. Syst. 2023, 36, 46595–46623. [Google Scholar] [CrossRef] [Scilit]
  32. Zhao, G.; Cawood, P.A.; Wilde, S.A.; Sun, M.; Lu, L. Metamorphism of basement rocks in the Central Zone of the North China Craton: Implications for Paleoproterozoic tectonic evolution. Precambrian Res. 2000, 103, 55–88. [Google Scholar] [CrossRef] [Scilit]
  33. Zhai, M.; Santosh, M. The early Precambrian odyssey of the North China Craton: A synoptic overview. Gondwana Res. 2011, 20, 6–25. [Google Scholar] [CrossRef] [Scilit]
  34. Zhao, G.; Zhai, M. Lithotectonic elements of Precambrian basement in the North China Craton: Review and tectonic implications. Gondwana Res. 2013, 23, 1207–1240. [Google Scholar] [CrossRef] [Scilit]
  35. Yang, K.; Fan, H.; Santosh, M.; Hu, F.; Wang, K. Mesoproterozoic carbonatitic magmatism in the Bayan Obo deposit, Inner Mongolia, North China: Constraints for the mechanism of super accumulation of rare earth elements. Ore Geol. Rev. 2011, 40, 122–131. [Google Scholar] [CrossRef] [Scilit]
  36. Fan, H.; Yang, K.; Hu, F.; Liu, S.; Wang, K. The giant Bayan Obo REE-Nb-Fe deposit, China: Controversy and ore genesis. Geosci. Front 2016, 7, 335–344. [Google Scholar] [CrossRef] [Scilit]
  37. Fan, H.; Hu, F.; Yang, K.; Pirajno, F.; Liu, X.; Wang, K. Integrated U–Pb and Sm–Nd geochronology for a REE-rich carbonatite dyke at the giant Bayan Obo REE deposit, Northern China. Ore Geol. Rev. 2014, 63, 510–519. [Google Scholar] [CrossRef] [Scilit]
  38. Smith, M.P.; Campbell, L.S.; Kynicky, J. A review of the genesis of the world class Bayan Obo Fe–REE–Nb deposits, Inner Mongolia, China: Multistage processes and outstanding questions. Ore Geol. Rev. 2015, 64, 459–476. [Google Scholar] [CrossRef] [Scilit]
  39. Rousseeuw, P.J. Silhouettes: A graphical aid to the interpretation and validation of cluster analysis. J. Comput Appl. Math. 1987, 20, 53–65. [Google Scholar] [CrossRef] [Scilit]
  40. Zhao, C.; Tang, Q.; Li, Z.; Liu, S.; Zhang, Y.; Qin, T.; Jin, H.; Chen, B. The mineralization mechanism of niobium enrichment in the Bayan Obo Nb-REE-Fe deposit. Acta Petrol. Sin. 2026, 42, 1467–1480. [Google Scholar]
  41. Ma, J.; Zhou, Y.; Su, L.; Yang, H.; He, L. A domain-specific language model for engineering-scale geological reasoning and mineral exploration in the Qin-Hang belt. Eng. Appl. Artif. Intel. 2026, 167, 113651. [Google Scholar] [CrossRef] [Scilit]
  42. Wu, S.; Xiong, Y.; Cui, Y.; Wu, H.; Chen, C.; Yuan, Y.; Huang, L.; Liu, X.; Kuo, T.; Guan, N. Retrieval-augmented generation for natural language processing: A survey. arXiv 2024, arXiv:2407.13193. [Google Scholar]
Figure 1. Layered architecture of the system.
Minerals 16 00802 g001
Figure 2. Schematic diagram of the core business pipeline.
Minerals 16 00802 g002
Figure 3. System interface and visualization case. The geological basemap is visualized using an ArcGIS Pro (v3.0.1) .lyrx style file converted from a public 1:2,500,000 lithological dataset (see Data Availability Statement for source).
Minerals 16 00802 g003
Figure 4. JSON structured constraints obtained from LLM parsing and rule parsing.
Minerals 16 00802 g004
Figure 5. Analysis report for the spatial relation query.
Minerals 16 00802 g005
Figure 6. Map-linked display of spatial query results in the Q&A interface.
Minerals 16 00802 g006
Figure 7. Metallogenic prediction analysis interface and visualization results.
Minerals 16 00802 g007
Figure 8. Comprehensive report on the geological significance and metallogenic potential of REE-Fe-Nb composite anomalies in the Bayan Obo area, Inner Mongolia.
Minerals 16 00802 g008
Table 1. Data types, storage locations, and purpose descriptions.
Data CategorySpecific TypeStorage LocationPurpose Description
Core Basic DataGeological maps (vector data: strata, intrusions, faults, folds, known mineral occurrences, etc.)spatial databaseProvide regional geological background and spatial distribution of prospecting indicators; support spatial queries such as “within” and “intersects”.
Regional geochemical sampling point data (including coordinates and element concentrations) spatial databaseDelineate element anomaly areas.
Knowledge Support DataGeological literature and reports (text data)vector databaseRetrieve theoretical knowledge (e.g., regional metallogenic regularity, deposit models) via semantic similarity search.
Table 2. Experimental configuration description.
MethodSpatial Query ModeRanking StrategySpatial Proximity ModuleText KnowledgeDescription
Text-onlyNo spatial dataNo rankingNoYesWeak baseline, relies only on knowledge base text
Vanilla LLM-to-SQLLLM generates SQLNo rankingNoNoEnd-to-end baseline: LLM directly generates PostGIS SQL without intent routing or semantic parsing
w/o Semantic FilteringStatic spatial extent retrievalRule-basedNoNoRetrieves entities solely by bounding box, no semantic constraints
w/o Spatial ModuleSemantic exact retrievalRule-basedNoNoQueries only target entities, no reference entities or spatial module
w/o RankingSemantic association retrievalNo rankingYesNoAblation of Phase 2 ranking module
Full ModelSemantic association retrievalRule-basedYesNoFinal proposed model, includes reference entity query and spatial module
Full Model + TextSemantic association retrievalRule-basedYesYesFull model augmented with text knowledge
Table 3. Performance evaluation results.
MethodPrecision@5Recall@5MRRNDCGQ-FaithDS-FaithQ-RelevDS-RelevCit. Rate
Text-only0.0000.0000.0000.0000.7340.7570.4800.5400.176
Vanilla LLM-to-SQL0.0230.0380.0470.0300.8540.8570.7340.7430.059
w/o Semantic Filtering0.1710.1370.3400.1980.7310.7540.6600.6860.282
w/o Spatial Module0.8230.7251.0000.8710.7310.7710.7260.7540.242
w/o Ranking0.8290.7281.0000.8450.7970.8430.8200.8370.499
Full Model0.8290.7281.0000.9770.8370.8710.8570.8690.478
Full Model + Text0.8290.7281.0000.9770.8400.8770.8630.8710.472
Q-Faith/Q-Relev: scores from the original evaluator (Qwen3-4B); DS-Faith/DS-Relev: scores from the independent evaluator (DeepSeek-V4-Flash); Cit. Rate: spatial citation rate. Bold values indicate the best performance for each metric.
Table 4. Per-region performance of the Full Model.
Region#QP@595% CIMRRNDCG@595% CIFaith.95% CIRelev.95% CICit. Rate95% CI
Bayan Obo130.846[0.72, 0.98]1.0000.955[0.90, 1.00]0.877[0.83, 0.93]0.869[0.76, 0.97]0.286[0.21, 0.36]
Yunnan170.800[0.66, 0.94]1.0001.000[1.00, 1.00]0.835[0.79, 0.88]0.871[0.81, 0.94]0.542[0.35, 0.74]
Sichuan50.880[0.67, 1.00]1.0000.959[0.89, 1.00]0.760[0.72, 0.80]0.780[0.68, 0.88]0.529[0.21, 0.84]
Overall350.829[0.74, 0.92]1.0000.977[0.95, 1.00]0.837[0.81, 0.87]0.857[0.80, 0.91]0.478[0.34, 0.62]
The spatial citation rate is computed only over spatial-relation queries; entity-list queries do not involve proximity constraints. #Q: number of queries.
Table 5. Per-intent performance of the Full Model.
Intent#QP@595% CIMRRNDCG@595% CIFaith.95% CIRelev.95% CICit. Rate95% CI
spatial_relation170.894[0.81, 0.98]1.0000.988[0.96, 1.00]0.782[0.75, 0.82]0.788[0.73, 0.85]0.478[0.34, 0.62]
 - distance-proximity140.914[0.84, 0.99]1.0001.000[1.00, 1.00]0.807[0.78, 0.83]0.821[0.76, 0.88]0.527[0.37, 0.68]
 - topology-containment30.800[0.48, 1.00]1.0000.931[0.82, 1.00]0.667[0.61, 0.72]0.633[0.49, 0.77]0.250[0.02, 0.48]
entity_list180.767[0.62, 0.91]1.0000.968[0.92, 1.00]0.894[0.86, 0.93]0.922[0.85, 1.00]0.000[0.00, 0.00]
 - attribute-filter110.636[0.44, 0.84]1.0001.000[1.00, 1.00]0.882[0.84, 0.92]0.946[0.92, 0.97]0.000[0.00, 0.00]
 - geochemical threshold70.971[0.92, 1.00]1.0000.916[0.82, 1.00]0.914[0.84, 0.99]0.886[0.71, 1.00]0.000[0.00, 0.00]
The spatial_relation category is disaggregated into distance-proximity and topology-containment subtypes; the entity_list category is further disaggregated into attribute-filter queries and geochemical threshold queries. #Q: number of queries.
Table 6. Inter-evaluator agreement statistics between Qwen3-4B and DeepSeek-V4-Flash across 245 responses (7 configurations × 35 queries).
ConfigurationnFaith rFaith ρFaith pRel rRel ρRel p
Text-only350.9600.998<0.0010.9740.975<0.001
Vanilla LLM-to-SQL350.9820.965<0.0010.9941.000<0.001
w/o Semantic Filtering350.9660.956<0.0010.9830.993<0.001
w/o Spatial Module350.9820.959<0.0010.9930.995<0.001
w/o Ranking350.9660.961<0.0010.9840.996<0.001
Full Model350.8360.815<0.0010.9850.973<0.001
Full Model + Text350.7770.742<0.0010.9820.995<0.001
Overall2450.9510.905<0.0010.9880.994<0.001
r: Pearson correlation coefficient; ρ: Spearman rank correlation coefficient; p: two-tailed significance level.
Table 7. Results of the spatial proximity verification module (arranged in ascending order of distance to fault) and anomaly information.
Target Entity (Deposit Name) *CoordinatesAttributeDist. to Nearest Fault (km)No. of Faults (≤5 km)Named Faults in RadiusNearby High-Intensity Anomalies
Saiwusu Rock Gold Deposit109.9903,
41.8506
Au; Medium; Magmatic-hydrothermal0.028Northern margin fault belt of North China Craton (2.84 km)None
Bilute Gold Deposit109.8822,
41.8336
Au(Ag); Medium; Magmatic-hydrothermal2.781NoneAu, Ag, Ce, Eu anomalies (4.27–4.97 km)
Sujiao‘ao Gold-Copper Prospect110.0375,
41.9239
Au-Cu; Occurrence; Magmatic-hydrothermal2.981NoneNone
Gansi Taolegai Gold Prospect109.8908,
41.8586
Au; Occurrence; Magmatic-hydrothermal4.632NoneNone
* “Darhan Muminggan United Banner” is omitted for brevity.
Table 8. PCA loadings and variance explained (PC1–PC6).
−−PC1PC2PC3PC4PC5PC6
La0.270−0.293−0.080−0.186−0.135−0.069
Ce0.268−0.2560.035−0.295−0.1810.029
Pr0.284−0.233−0.093−0.171−0.095−0.079
Nd0.282−0.1840.013−0.191−0.328−0.054
Sm0.302−0.076−0.052−0.0340.006−0.099
Eu0.235−0.273−0.1210.3680.535−0.158
Gd0.303−0.019−0.071−0.0860.016−0.132
Tb0.2830.101−0.1500.0520.411−0.231
Ho0.2630.3450.023−0.0240.137−0.094
Er0.2710.3160.035−0.0160.081−0.055
Tm0.2300.4430.108−0.090−0.0260.056
Lu0.2210.4480.135−0.095−0.1560.115
Nb0.255−0.1390.0520.0550.2280.910
F0.2060.072−0.3800.715−0.5170.059
Zr0.158−0.1720.8720.366−0.082−0.142
Variance Explained Rate (%)70.0514.205.094.122.822.00
Cumulative Explained Rate (%)70.0584.2589.3493.4696.2898.28
Loadings with absolute value > 0.3 are shown in bold.
Table 9. K-Means cluster centers.
ElementClass 1 (n = 9184)Class 2 (n = 6787)Class 3 (n = 399)
La3.672.855.83
Ce4.383.576.13
Pr2.301.544.28
Nd3.512.644.72
Sm1.941.213.44
Eu0.800.492.32
Gd1.831.113.33
Tb0.600.271.57
Ho0.650.301.01
Er1.310.691.90
Tm0.360.150.40
Lu0.360.160.34
Nb2.661.834.71
F6.485.507.84
Zr5.074.515.26
The original data were log1p-transformed and Z-score standardized before clustering; the values in the table are the transformed center values.
Table 10. Sensitivity analysis of spatial cross-validation AUC to block size.
Block Size (°)~Size (km)# BlocksMean AUC ± StdMin AUCMax AUCHigh-AUC Folds
0.022.221800.9310 ± 0.01730.89220.95963/50 (6.0%)
0.033.33840.9121 ± 0.02240.87400.94046/50 (12.0%)
0.055.55320.7708 ± 0.05170.69320.83058/50 (16.0%)
0.077.77180.8748 ± 0.03330.81790.91536/50 (12.0%)
0.1011.10100.6566 ± 0.00000.65660.65660/50 (0.0%)
High-AUC folds: number of individual CV folds with AUC > 0.99, out of 10 × 5 = 50 total folds per block size. Min AUC and Max AUC: the minimum and maximum of the 10 repeat-level mean AUC values (each being the average AUC across the 5 folds within one repeated run). # Blocks: number of spatial blocks.
Table 11. Random forest feature importance ranking (top 15).
FeatureImportance
distance_to_fault0.198729
geology_code0.170153
F0.083225
Tm0.06819
Ho0.067589
Ce0.061182
Nb0.045149
La0.042899
Er0.041944
Zr0.036899
Nd0.03652
Lu0.036328
Tb0.027353
Pr0.026861
Gd0.026836
geology_code is a categorical code for geological body type.
Disclaimer/Publisher’s Note: The statements, opinions and data contained in all publications are solely those of the individual author(s) and contributor(s) and not of MDPI and/or the editor(s). MDPI and/or the editor(s) disclaim responsibility for any injury to people or property resulting from any ideas, methods, instructions or products referred to in the content.