Article

Pyrite Genesis and Its Implications for Uranium Mineralization at the Yahewan Deposit, Southern Ordos Basin, China

1
National Key Laboratory of Uranium Resources Exploration-Mining and Nuclear Remote Sensing, Beijing 100029, China
2
Beijing Research Institute of Uranium Geology, Beijing 100029, China
*
Author to whom correspondence should be addressed.
Minerals 2026, 16(8), 785; https://doi.org/10.3390/min16080785
Submission received: 25 June 2026 / Revised: 23 July 2026 / Accepted: 23 July 2026 / Published: 27 July 2026
(This article belongs to the Special Issue Genesis of Uranium Deposit: Geology, Geochemistry, and Geochronology)

Abstract

The origin and metallogenic role of pyrite in sandstone-hosted uranium deposits remain difficult to constrain because pyrite may record both early diagenetic reduction and later ore-fluid overprinting. Here, pyrite and associated uranium minerals from mineralized and barren sandstones of the Middle Jurassic Zhiluo Formation in the Yahewan uranium deposit, southern Ordos Basin, were investigated using petrography, SEM-BSE imaging, EPMA, LA-ICP-MS trace-element analysis, and in situ sulfur isotope analysis. Pyrite occurs mainly as framboidal, colloidal, pore-filling, fracture-filling, and massive aggregates and is commonly associated with organic matter and coffinite or coffinite-like U-silicate minerals. Most pyrite domains show low Co/Ni ratios, suggesting a predominantly authigenic to sedimentary–diagenetic origin. High U, Mo, V, W, Se and As occur mainly in pyrite-rich microdomains, but high-U analyses are interpreted cautiously because some signals may include contributions from adjacent coffinite or coffinite-like U-silicate phases, fracture-hosted uranium minerals, or mixed ablation. Together, the petrographic, trace-element and sulfur isotope data support a two-stage model in which early organic matter and authigenic/biogenic pyrite created local reducing microenvironments that were later overprinted by U-bearing basinal fluids.

1. Introduction

Pyrite is a ubiquitous metallic sulfide mineral within the Earth’s crust. It frequently serves as a critical carrier for various ore-forming elements, such as uranium and gold, and is paragenetically associated with diverse rock types and mineral deposits [1,2,3]. Within sandstone-hosted uranium deposits, pyrite typically functions as a reducing agent or an indicator mineral for the redox conditions during the uranium mineralization process [4]. Its formation often spans the entire duration of the uranium mineralizing stages. Consequently, the geochemical composition of pyrite records vital information regarding the evolution of uranium-bearing fluids, serving as a reliable indicator for characterizing the properties of ore-forming solutions, the physicochemical environment, and the mechanisms of uranium mineralization [4,5,6]. In this context, resolving whether pyrite is of early diagenetic origin or was modified by syn-ore fluid overprinting is fundamental to understanding the development of reducing microenvironments and the mechanisms of uranium precipitation.
The Ordos Basin, the second-largest sedimentary basin in China, hosts abundant energy resources, including coal, oil, natural gas, and uranium [7,8]. The Yahewan uranium deposit is a recently confirmed medium-sized deposit located in the southern basin. Previous studies on the Yahewan deposit have addressed sand-body alteration, sedimentary characteristics, and their relationship with uranium mineralization. It is generally recognized that mineralization is primarily controlled by the lithofacies heterogeneity of the main braided channel sandstone bodies. The ore bodies typically occur in tabular or stratiform shapes at the contact zone between gray and green sandstones. The sedimentary materials are likely derived from the Qinling Orogenic Belt along the southern margin of the basin [9].
Previous work in the Yahewan area has documented sand-body architecture, alteration zoning and the spatial association among uranium mineralization, organic matter and pyrite. However, the timing and genetic role of pyrite remain unclear. In particular, it is uncertain whether pyrite mainly represents an early diagenetic reductant, a product of later ore-fluid influx, or a composite record of both processes. It is also unclear whether U and redox-sensitive elements in pyrite are lattice-bound, inclusion-related, or fracture-controlled, and how the large sulfur isotope variability reflects sulfur sources and pore-water evolution. Here, we combine petrographic observations, SEM-BSE imaging, EPMA, LA-ICP-MS trace-element analysis and in situ sulfur isotope measurements of pyrite from mineralized and barren Zhiluo Formation sandstones. The aim is to constrain pyrite genesis and evaluate how pyrite-organic matter assemblages contributed to uranium precipitation in the Yahewan deposit.

2. Geological Setting

2.1. Regional Geological Framework

The Ordos Basin is situated in the southwestern part of the North China Craton (Figure 1), covering an expansive area of approximately 370,000 km2. The basin is exceptionally rich in energy resources and serves as a vital national production hub for natural gas, coal-bed methane, coal, and petroleum [10,11,12]. The basin also hosts numerous sandstone-hosted uranium deposits and has emerged as one of China’s most important uranium-producing regions [10,13,14,15,16,17,18]. The Yahewan uranium deposit is located in the western part of the Weibei Uplift in the southern Ordos Basin. Structurally, it occupies the transition zone between the Weibei Uplift and the Bin-Xun Sag, bordered by the Qinling Orogenic Belt to the south and the Yishan Slope to the north (Figure 1) [19,20]. The regional structure is characterized by a gentle monocline dipping toward the north, with relatively simple structural features and low stratigraphic dip angles. The primary structural framework is dominated by NE-trending and nearly E-W-trending faults [18]. Since the Late Cretaceous, tectonic uplift has exerted significant control over paleogeomorphology and groundwater circulation, thereby providing a favorable structural framework for the formation of sandstone-hosted uranium mineralization. At the basin scale, recent studies have further emphasized that large-scale sandstone-hosted uranium mineralization in northern China is jointly controlled by neotectonic activity, stratigraphic architecture, basin evolution, and fluid migration pathways [21,22]. These regional controls provide an important framework for understanding the localization of uranium mineralization in the southern Ordos Basin and help place the Yahewan deposit within the broader metallogenic system of the northern Chinese Meso-Cenozoic basins.

2.2. Geology of the Yahewan Uranium Deposit

The stratigraphic succession exposed in the Yahewan uranium deposit comprises, in ascending order, the Middle Jurassic Yan’an Formation (J2y) characterized by gray coal-bearing sandstones; the Middle Jurassic Zhiluo Formation (J2z) composed of variegated sandstones (with the basal light grayish-white and grayish-green pebbly coarse sandstones serving as the primary ore-hosting sand bodies); and the Lower Cretaceous Yijun Formation (K1y) featuring purplish-red conglomerates, followed by the Luohe Formation (K1l) comprising brownish-yellow coarse sandstones.
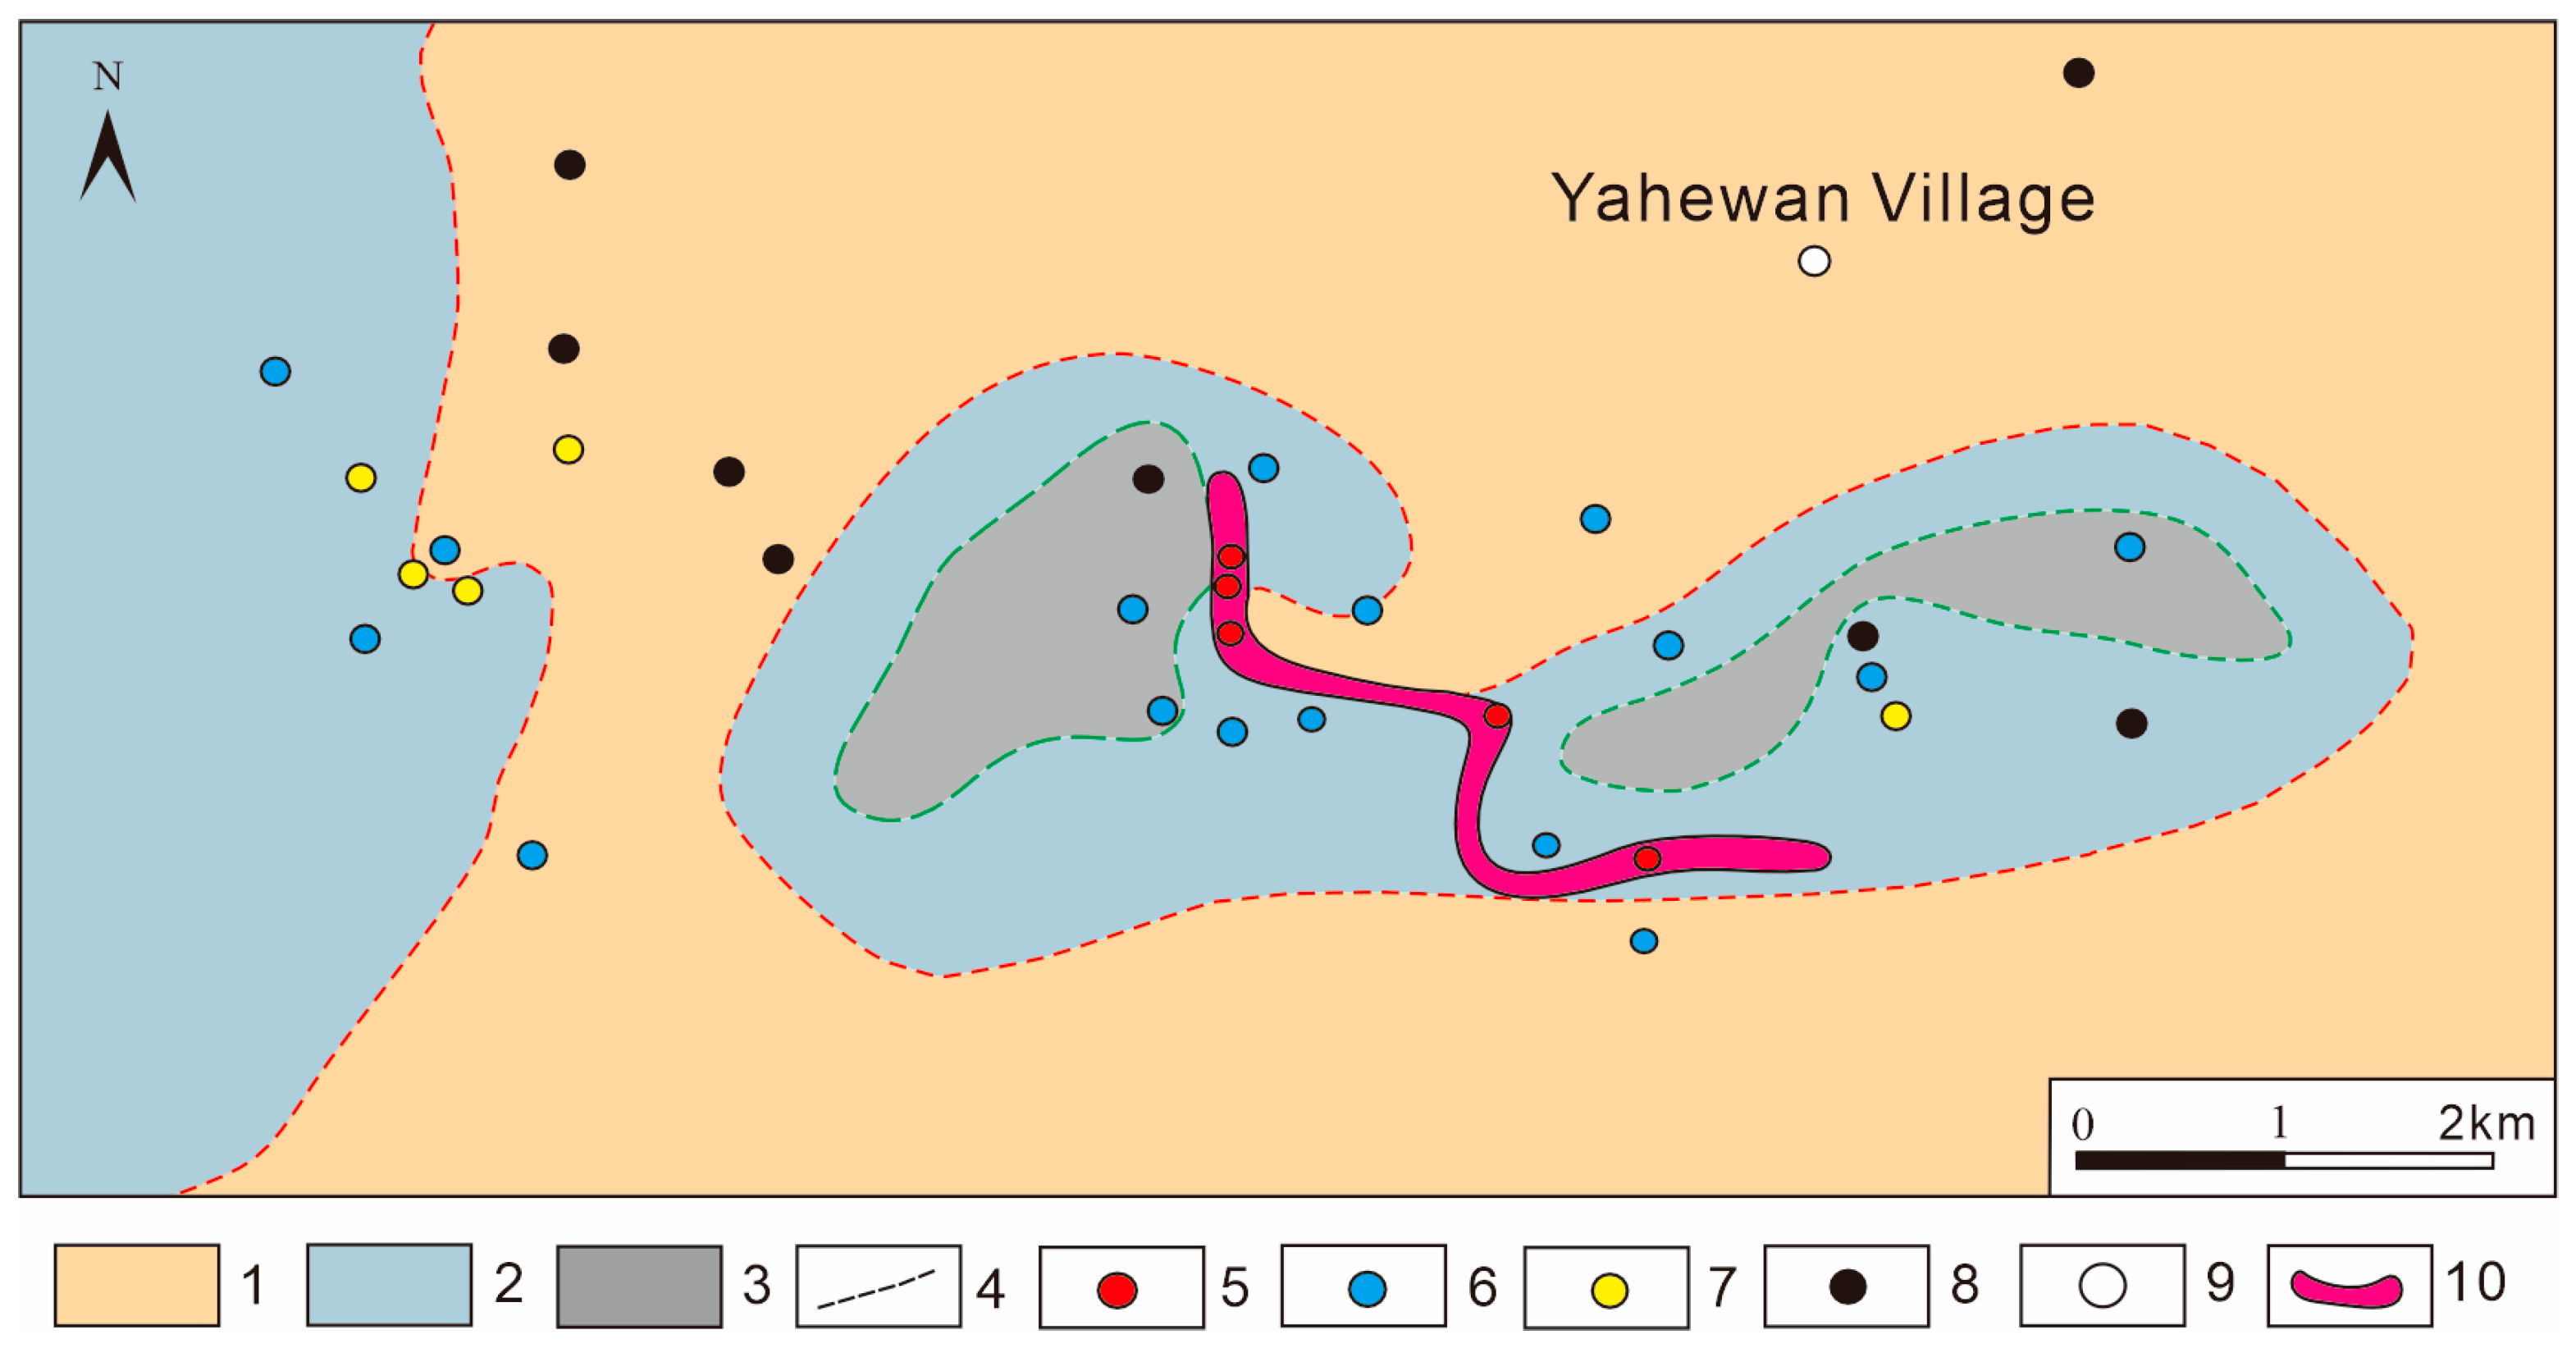
Uranium mineralization in the study area is predominantly hosted within the braided river channel sandstone bodies of the lower member of the Zhiluo Formation. These sandstone bodies exhibit significant thickness and high permeability. In cross-section, the ore bodies typically occur as stratiform or lenticular layers and are mainly localized along the oxidation–reduction transition zone. In the plan view, they display a sinuous morphology (Figure 2). The primary uranium mineral in the ore is coffinite, which mostly occurs as fine-grained disseminations. These minerals exhibit an intimate spatial and genetic association with reducing agents, particularly pyrite and organic matter.

3. Samples and Analytical Methods

3.1. Sample Collection and Preparation

A total of five representative, unweathered sandstone samples were selected from three drill cores in the Yahewan uranium deposit for petrographic and in situ geochemical analyses. These samples were collected from the lower member of the Middle Jurassic Zhiluo Formation (J2z1) and include four mineralized sandstone samples from ore intervals, namely 0-9-2, 0-9-3, 86-4-6, and 106-1-5, and one barren sandstone sample, 86-4-7. The sampling depths range from 318.0 m to 681.0 m. All samples are light grayish-white pebbly coarse sandstones, representing the main ore-hosting lithology in the study area. Detailed sample information, including drill-hole number, sampling depth, lithology, mineralization type, redox/color facies, uranium grade or radioactivity, pyrite morphology, and the number of EPMA, LA-ICP-MS, and sulfur isotope analytical spots, is provided in Table S1.
After initial processing, the samples were prepared into standard polished thin sections for microscopic and microbeam analyses. Petrographic observations were first conducted using transmitted- and reflected-light microscopy to identify detrital components, cement types, organic matter, pyrite textures, and mineral paragenetic relationships. SEM-BSE imaging was then used to further characterize the occurrence of pyrite, coffinite or coffinite-like U-silicate minerals, micro-fractures, and possible mineral inclusions. Based on these observations, representative pyrite domains were selected and marked for in situ micro-geochemical analyses, including Electron Probe Microanalysis (EPMA), LA-ICP-MS trace-element analysis, and in situ sulfur isotope measurement.

3.2. Analytical Methods

Petrographic observations, morphological characterization, and compositional analyses were performed at the Analytical Testing Center of the Beijing Research Institute of Uranium Geology (BRIUG). Basic petrographic identification was conducted using a Leica polarizing microscope (Leica Microsystems GmbH, Wetzlar, Germany) under both transmitted and reflected light. Micro-morphological observations and energy-dispersive spectroscopy (EDS) analyses were carried out using an FEI Nova Nano SEM 450 (FEI Company, Hillsboro, OR, USA) and a Zeiss Sigma 300 thermal field emission scanning electron microscope (SEM) (Carl Zeiss Microscopy GmbH, Jena, Germany). In situ quantitative analyses of major elements in uranium minerals were performed using a JEOL JXA-8100 electron probe microanalyzer (EPMA) (JEOL Ltd., Tokyo, Japan) equipped with an EDS system. The EPMA analyses were conducted at an accelerating voltage of 20 kV, a beam current of 10 nA, a take-off angle of 40° and a beam diameter of 2 μm. Albite was used as the standard for Si, Na, and Al; K-feldspar for K; Ca-bearing rhodonite for Ca; rhodonite for Mn; rutile for Ti; hematite for Fe; pyroxene for Mg; and metallic uranium for U. Before microbeam analysis, polished thin sections were examined by transmitted- and reflected-light microscopy and SEM-BSE imaging to identify uranium minerals, pyrite textures, micro-fractures, and possible mineral inclusions.
In situ trace element and sulfur isotope analyses of pyrite were conducted at Kehui Testing (Tianjin) Technology Co., Ltd. (Tianjin, China). Trace element analyses were performed using an Analytik Jena PQMS ICP-MS (Analytik Jena GmbH, Jena, Germany) coupled with an ASI RESOlution 193 nm excimer laser ablation system (Australian Scientific Instruments Pty Ltd., Canberra, Australia). The analyses were carried out in single-spot ablation mode, with a spot diameter of 38 μm, a repetition rate of 5 Hz, and a laser fluence of approximately 5 J/cm2, using high-purity He as the carrier gas. Before analysis, the instrument was tuned to optimal performance using the NIST SRM 610 glass reference material. Each single-spot analysis lasted 85 s, including 20 s of background acquisition, 45 s of continuous sample ablation, and 20 s of washout [23]. During the analytical sequence, external reference materials, including NIST SRM 610, NIST SRM 612, BHVO-2G, BCR-2G, BIR-1G, and the sulfide reference material MASS-1, were inserted after approximately every ten unknown analyses for quantitative calibration and quality control. Offline data reduction, including background subtraction, instrumental drift correction, and concentration calculation, was performed using ICPMSDataCal 10.8. Reference values for the glass standards followed Pearce et al. [23], and the ICPMSDataCal-based data-reduction procedure followed Liu et al. [24], without applying an internal standard. During data reduction, time-resolved signals were checked to minimize the influence of obvious inclusions, mineral intergrowths, or mixed-ablation effects.
In situ sulfur isotope analyses were conducted using a Thermo Scientific Neoma Multi-Collector Inductively Coupled Plasma Mass Spectrometer (MC-ICP-MS; Thermo Fisher Scientific, Bremen, Germany) coupled with a RESOlution SE 193 nm solid-state laser (Applied Spectra Inc., West Sacramento, CA, USA). Single-point ablation was performed on the pyrite grains previously identified under the optical microscope, utilizing a spot diameter of 20–30 μm, a laser fluence of 3 J/cm2, and a repetition rate of 6 Hz. The ablated aerosol was transported to the MC-ICP-MS using high-purity He as the carrier gas. The 32S and 34S signals were simultaneously detected in static mode using Faraday cups, with a single-point integration time of 0.131 s. Instrumental mass bias was corrected using a standard–sample–standard bracketing method with sulfide reference materials. The sulfur isotope compositions are reported as δ34SV-CDT values in per mille.

4. Results

4.1. Pyrite Petrography and Mineral Associations

Pyrite in the Yahewan uranium deposit predominantly occurs in medium- to coarse-grained feldspathic quartz sandstones of the Zhiluo Formation. These sandstones are well consolidated and commonly exhibit calcareous cementation. The core samples display low textural maturity, characterized by poor sorting and rounding of detrital grains, together with a mixed grain-size distribution. Compositionally, quartz and feldspar account for approximately 60% of the total detrital components, followed by igneous and metamorphic lithic fragments at approximately 30%, with minor sedimentary lithic fragments and mica flakes.
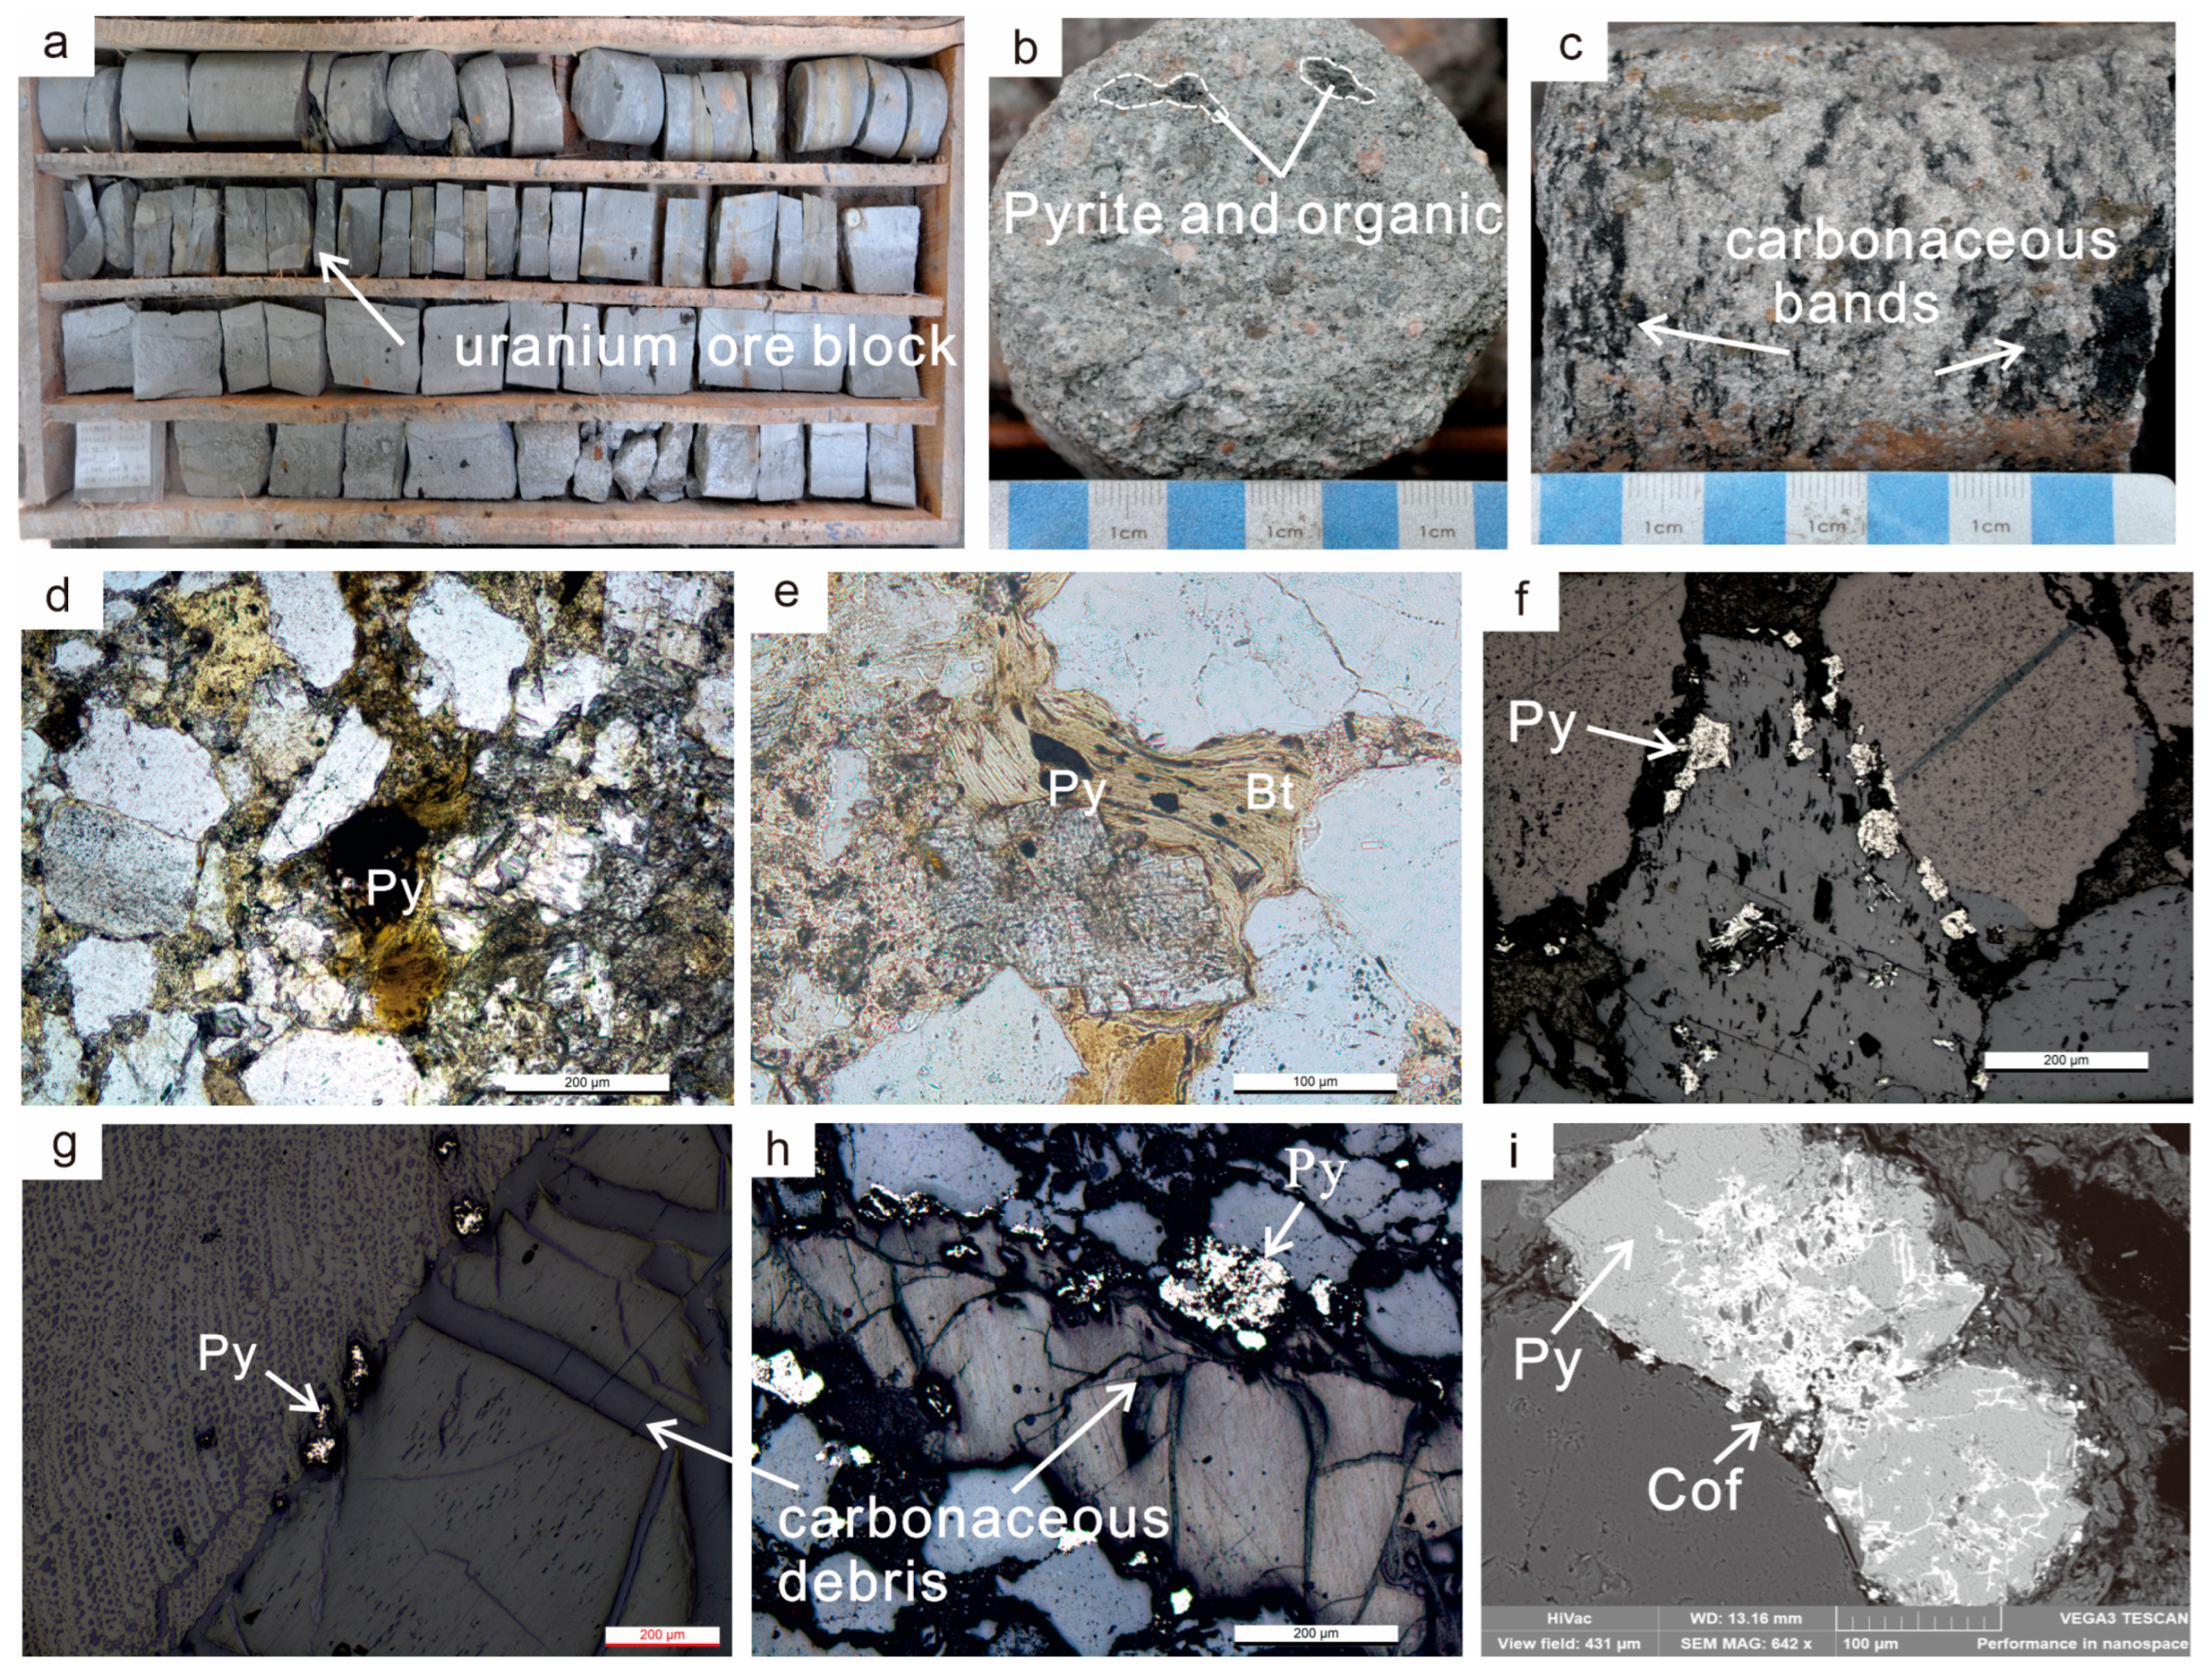
The uranium-bearing sandstones are mainly grayish-white, pebbly, medium- to coarse-grained sandstones (Figure 3a). Macroscopically, abundant pyrite (Figure 3b) and organic matter, such as carbonaceous debris (Figure 3c), are visible within the ore specimens. Microscopic observations show that pyrite commonly fills intergranular pores between detrital grains, such as quartz (Figure 3d,f), and also occurs along the cleavage planes of biotite (Figure 3e). Spatially, pyrite is closely associated with organic matter (Figure 3g,h) and locally shows a close paragenetic relationship with uranium minerals, mainly coffinite or coffinite-like U-silicate phases (Figure 3i).
Based on micro-petrographic observations and spatial distribution patterns, pyrite in the studied Zhiluo Formation sandstones can be grouped into three main types.
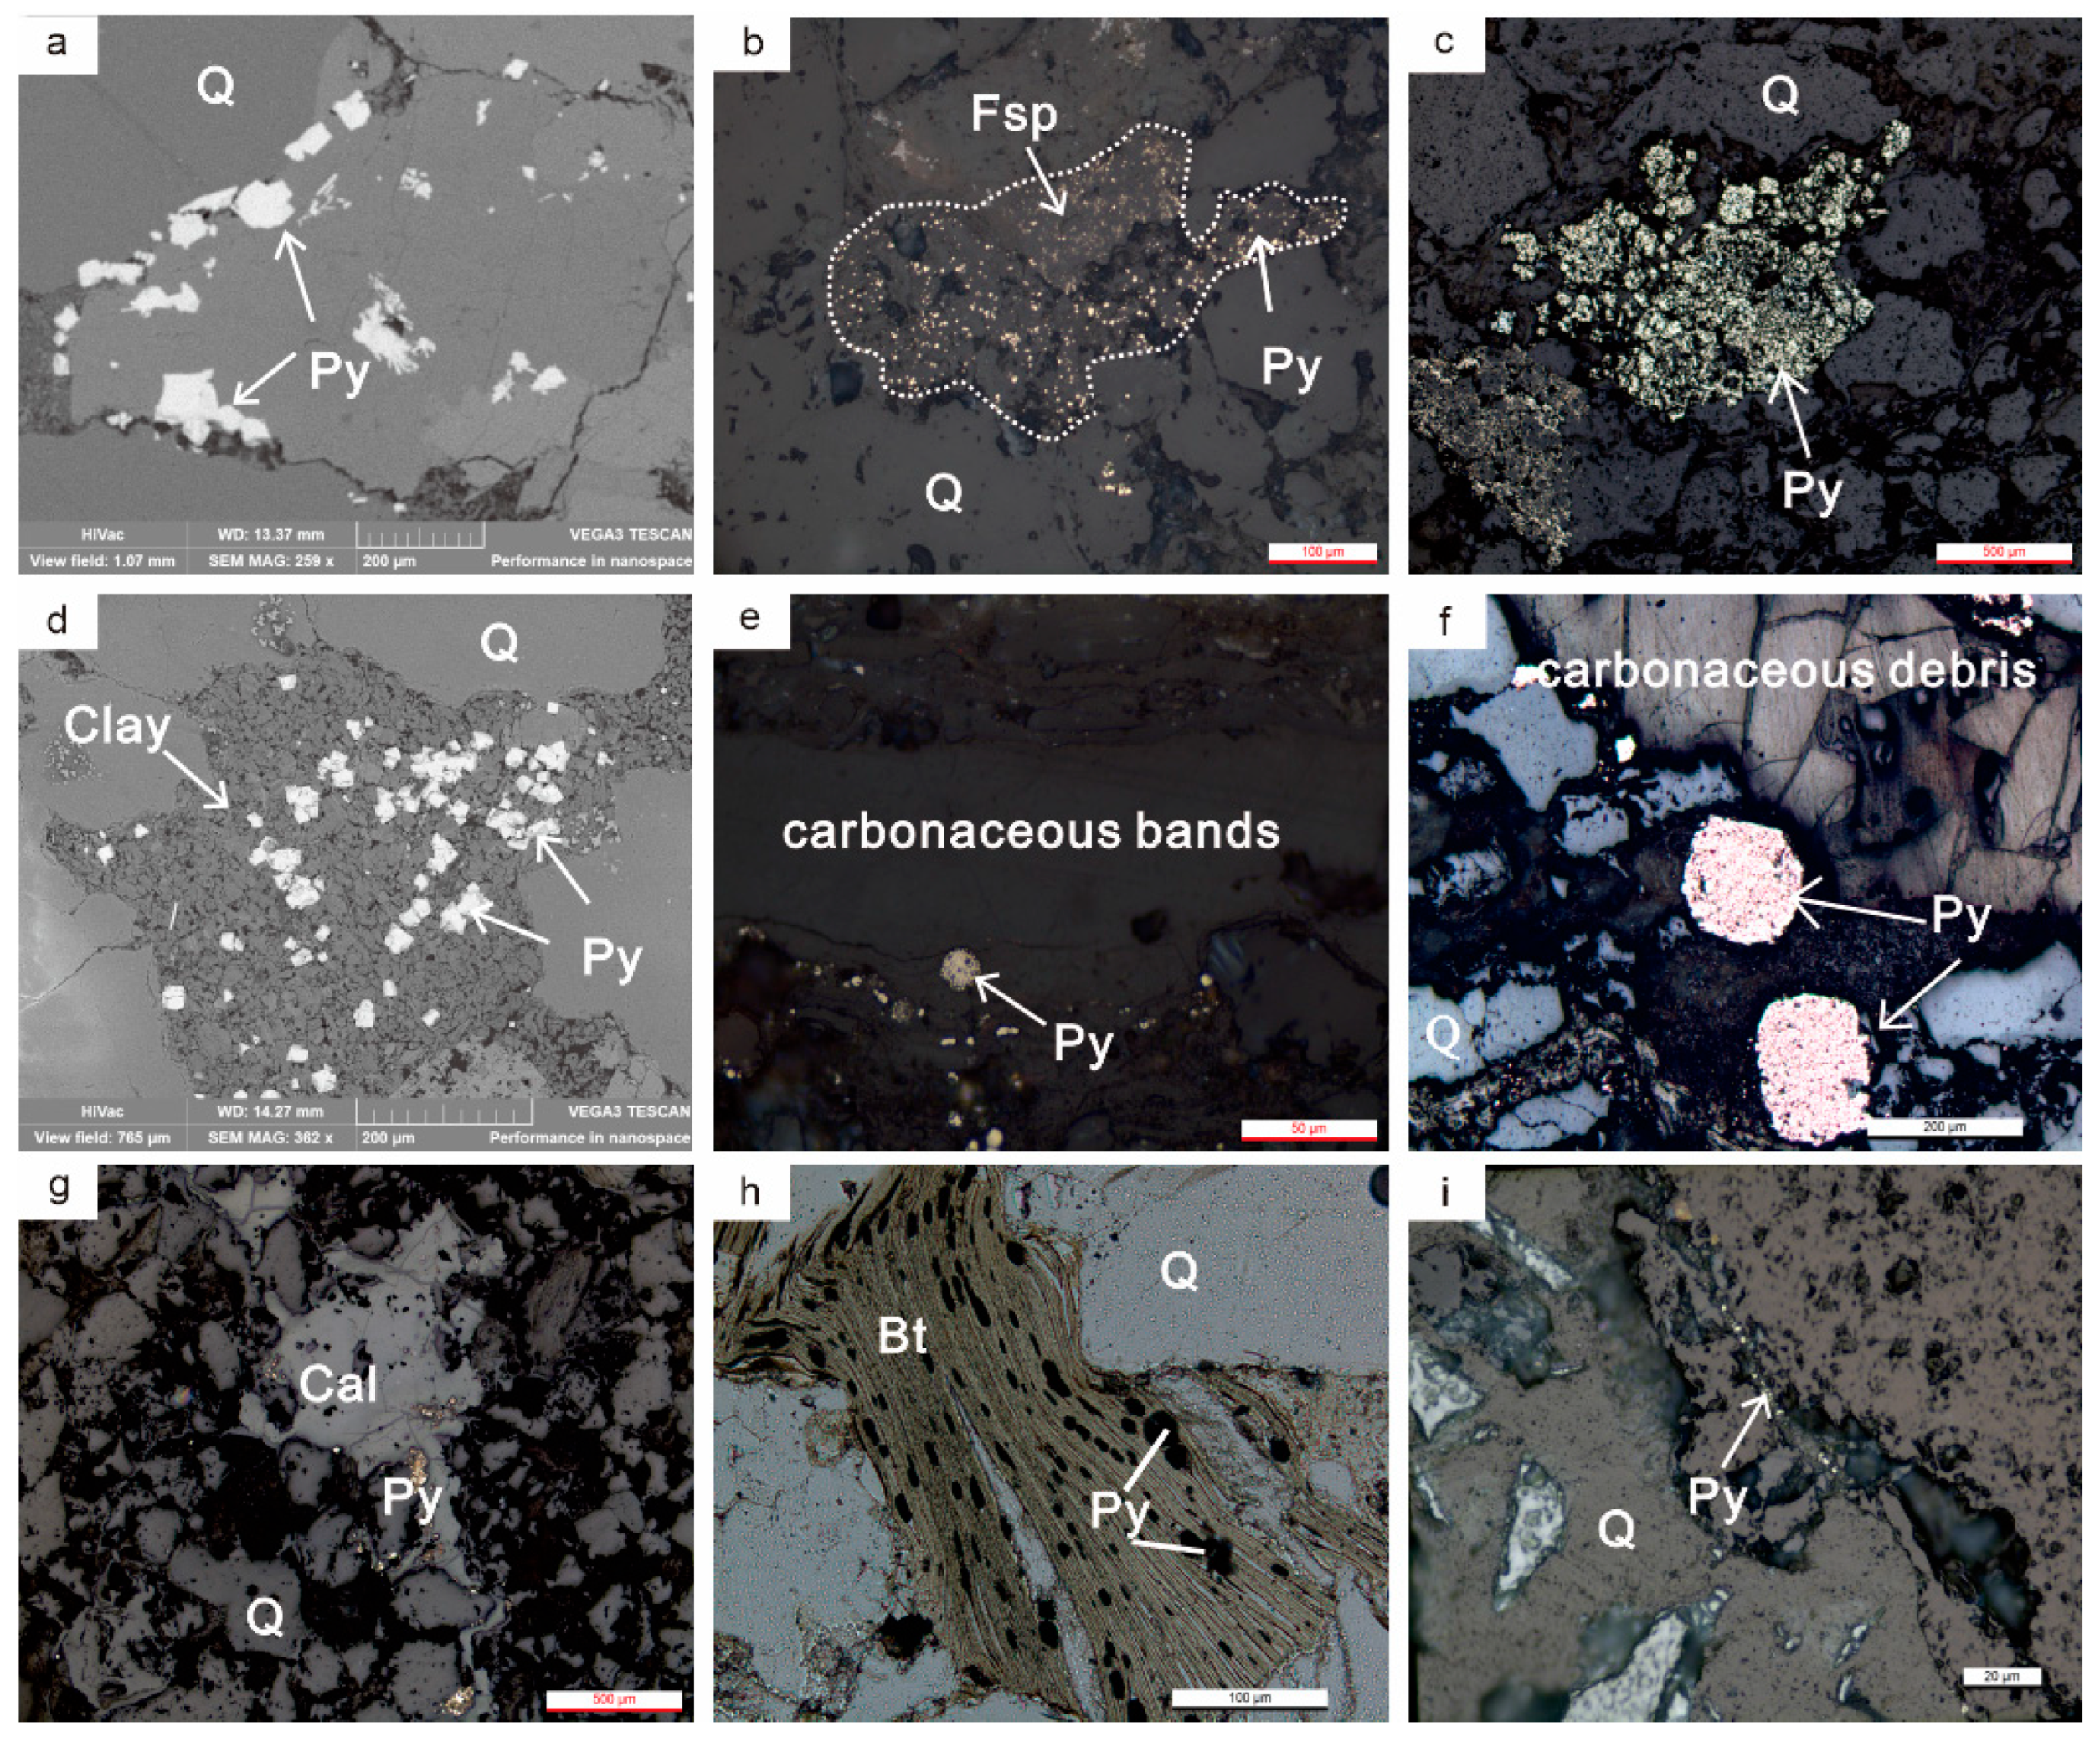
The first type is pore-filling pyrite, which fills intergranular pores and secondary dissolution pores and represents the most widely distributed pyrite type in the studied samples. This pyrite occurs mainly as disseminated, irregular massive, amorphous, colloidal, and locally euhedral cubic crystals, extensively filling intergranular spaces between lithic fragments and quartz grains (Figure 4a). Some pyrite is disseminated within secondary dissolution pores related to feldspar alteration (Figure 4b), or fills microfractures and interstitial spaces formed by mechanical fracturing of quartz grains (Figure 4c). Pyrite occupying the interstices of quartz and other detrital grains is commonly associated with fine-grained clay-mineral aggregates (Figure 4d).
The second type is organic-matter-associated pyrite, which shows a close spatial relationship with carbonaceous material at the microscopic scale. Pyrite is densely developed along the margins and within the micropores of carbonaceous debris and carbonaceous bands. Its morphologies include fine spherical pyrite, typical framboidal pyrite (Figure 4e), and spherical aggregates (Figure 4f). In localized microdomains where organic matter occurs in contact with carbonate cement, pyrite is also concentrated (Figure 4g).
The third type is cleavage- or fracture-hosted pyrite. Part of the pyrite occurs along mineral cleavage planes and micro-fractures, showing oriented filling or cross-cutting relationships. One subtype is distributed mainly along the cleavage planes of phyllosilicates, particularly biotite, where pyrite occurs as spherical or bead-like aggregates (Figure 4h). Another subtype fills micro-fractures and forms vein-like or dense massive aggregates that cross-cut rigid detrital grains such as quartz, with close contacts along the fracture margins (Figure 4i).
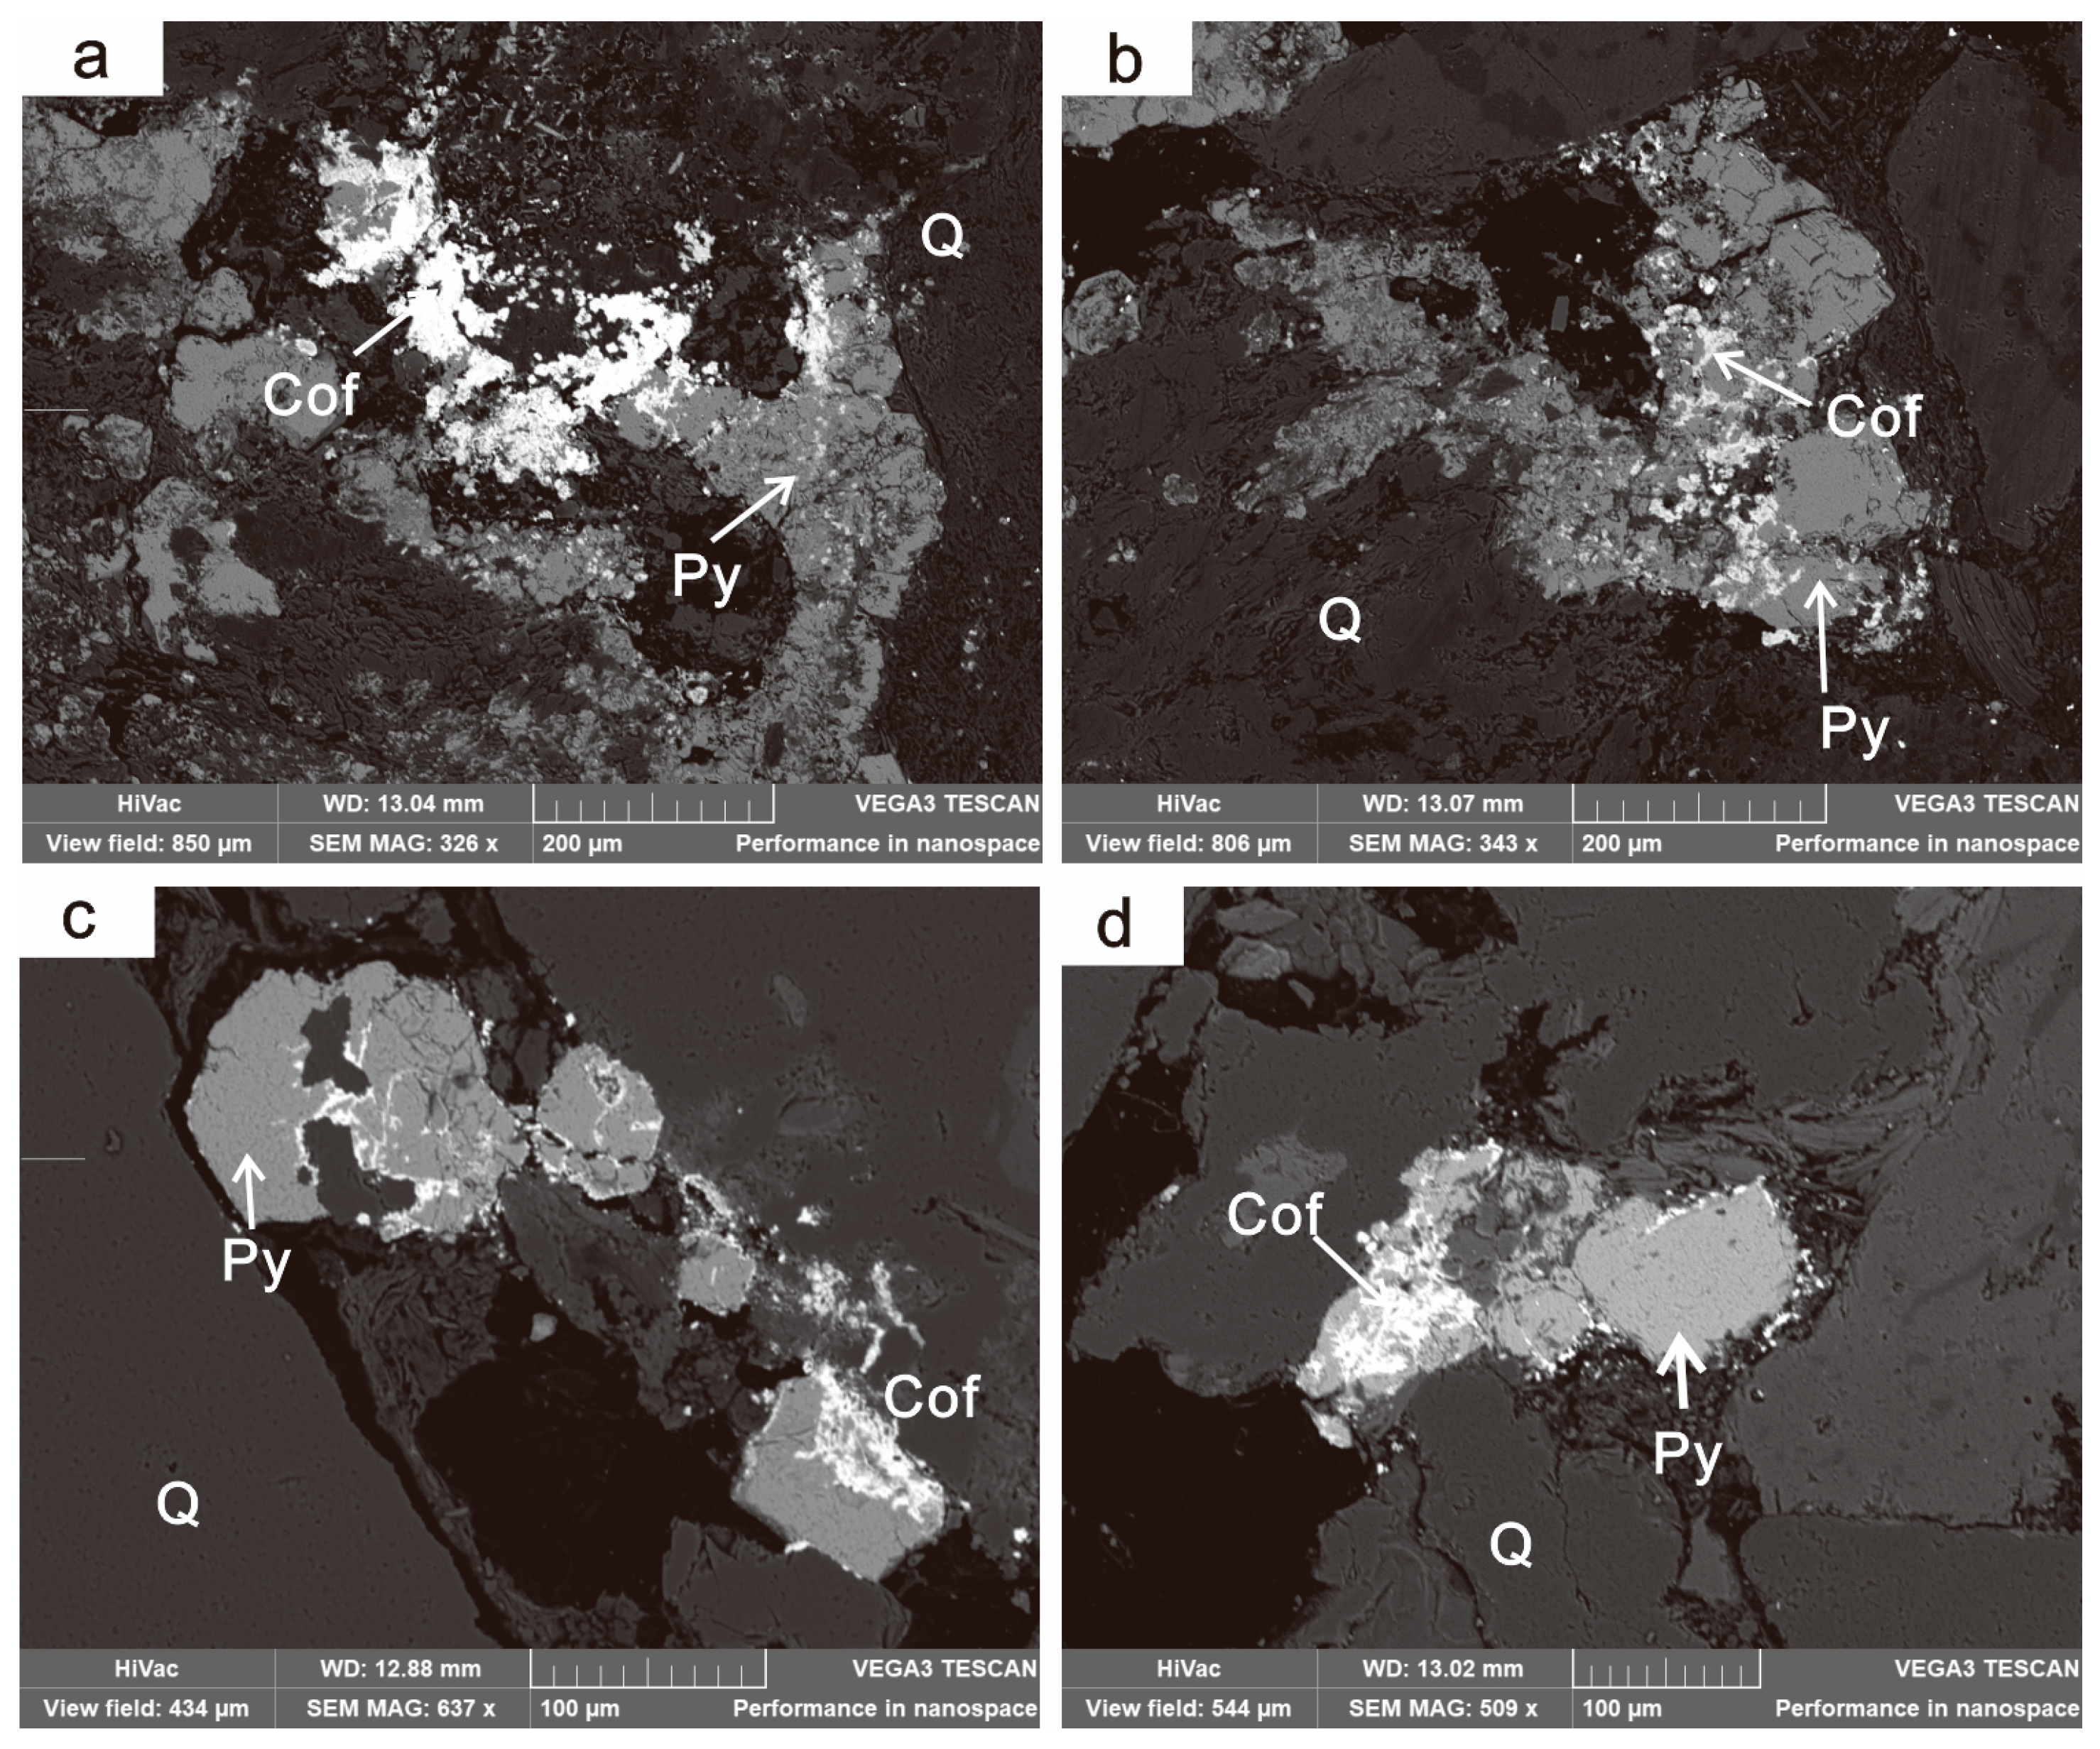
Uranium minerals are closely associated with pyrite in several textural settings. They typically occur as fine grains, veinlets, or irregular aggregates that adhere to the margins of colloidal pyrite (Figure 5a), locally forming partly enclosed or enclosed relationships with pyrite (Figure 5b). In addition, some uranium minerals fill micro-fractures within coarse-grained pyrite (Figure 5c) or occur within pyrite-rich domains (Figure 5d). These petrographic relationships indicate a close spatial association between pyrite and uranium minerals, although the exact host sites of uranium may vary at the microscale.

4.2. Geochemical Composition of Uranium Minerals Associated with Pyrite

To quantitatively determine the chemical composition of the uranium minerals intimately associated with pyrite in the Yahewan uranium deposit, in situ Electron Probe Microanalysis (EPMA) was conducted. A total of 14 valid analytical spots were obtained, with the representative results summarized in Table 1.
The analytical data reveal that the major chemical components of the studied uranium minerals are UO2 and SiO2. Specifically, the UO2 content ranges from 39.60 wt.% to 67.20 wt.% (average: 53.43 wt.%), while the SiO2 content varies between 12.10 wt.% and 19.81 wt.% (average: 15.69 wt.%). Notably, these minerals are significantly enriched in Y2O3 (average: 2.17 wt.%) and CaO (average: 1.77 wt.%), which may reflect the isomorphous substitution or admixture of elements such as yttrium and calcium during the formation of coffinite.
Furthermore, the FeO content exhibits considerable variation, ranging from 0.19 wt.% to 13.41 wt.% (average: 3.83 wt.%). The relatively high FeO values observed in certain analytical spots (up to 13.41 wt.%) are attributed to the excitation of micro-scale pyrite inclusions or intergrowths within the coffinite matrix during microbeam analysis. This geochemical observation corroborates the intimate spatial association between coffinite and pyrite observed under SEM-BSE imaging. Trace amounts of TiO2, MgO, P2O5, and MoO3 were also detected. Based on the major element chemistry and morphological characteristics, the primary uranium mineral phase in this deposit is confidently identified as yttrium-bearing coffinite.
It is noteworthy that the analytical totals for all measured spots are consistently low, ranging from 62.81 wt.% to 90.45 wt.% (average: 80.73 wt.%). This mass deficit is a well-documented phenomenon in the EPMA of coffinite. The analytical shortfall is primarily attributed to the presence of structural water or interlayer hydroxyl groups (OH) incorporated within the crystal lattice, which are undetectable by electron microprobe analysis. Additionally, physical factors such as internal microporosity, commonly caused by radiation-induced metamictization, and surface roughness of the analyzed domains may also have lowered the analytical totals.

4.3. Elemental Characteristics of Pyrite

In situ LA-ICP-MS trace-element analyses were conducted on pyrite grains from light grayish-white pebbly coarse sandstones in the study area. The analytical results are summarized in Table S2.

4.3.1. Major Element Characteristics

The Fe content of the analyzed pyrite ranges from 44.90 to 50.26 wt.% (average: 47.51 wt.%), whereas the S content ranges from 46.42 to 53.01 wt.% (average: 51.19 wt.%). Minor Si and Mn signals were also detected in some analyses. The Si content reaches up to 1.99 wt.%, suggesting that some LA-ICP-MS spots likely sampled quartz, clay minerals, coffinite-like U-silicate phases, or mixed pyrite–mineral microdomains. These spots are therefore interpreted as pyrite-rich microdomain analyses rather than pure pyrite compositions. The Mn content ranges from 0.006 to 1.74 wt.%, indicating compositional heterogeneity among the analyzed pyrite-rich domains.

4.3.2. Trace Element Characteristics

The analytical results reveal broad variations in U, As, Mo, and other trace elements among the analyzed pyrite-rich domains. Uranium shows the most pronounced sample-scale heterogeneity. In the mineralized sample 0-9-2, all six LA-ICP-MS spots show elevated U contents, ranging from 212.04 to 37,915.74 ppm, with an average of 7841.75 ppm. By contrast, U contents in the remaining samples are much lower, ranging from 0.03 to 131.23 ppm, with an average of 11.33 ppm. This distribution indicates that U enrichment is spatially concentrated in pyrite-rich microdomains of sample 0-9-2. However, because several high-U spots are accompanied by lithophile-element signals, these analyses should not be interpreted as direct evidence for lattice-bound U in pyrite. Instead, they record close spatial coupling between pyrite-rich domains and coffinite or coffinite-like U-silicate mineralization. In addition, As contents range from 66.69 to 7183.15 ppm, with an average of 1209.29 ppm, whereas Mo contents vary from 9.58 to 720.78 ppm, with an average of 219.47 ppm.
Regarding iron-group transition metals, the overall concentration of nickel (Ni) is slightly higher than that of cobalt (Co). The Ni content ranges from 13.33 to 2565.57 ppm (average: 444.38 ppm), while the Co content ranges from 2.09 to 1384.17 ppm (average: 243.28 ppm). Among common chalcophile base metals, the average concentrations of lead (Pb) and copper (Cu) are 368.87 ppm and 230.60 ppm, whereas zinc (Zn) shows relatively lower concentrations (average: 28.98 ppm). In addition, several minor associated elements were detected in the analyzed pyrite-rich domains. Sb and Tl were detected in most analyses, with average concentrations of 22.39 ppm and 12.25 ppm, respectively. Se was detected only in part of the analytical spots, with an average concentration of 33.85 ppm for the available data. Minor Cd and Bi were also detected in some analyses.
Furthermore, the analyses detected several lithophile elements and large ion lithophile elements (LILEs) as trace impurities. These include barium (Ba; average: 272.89 ppm), strontium (Sr; average: 156.20 ppm), and zirconium (Zr; average: 48.51 ppm), along with trace amounts of vanadium (V), chromium (Cr), and thorium (Th). Notably, certain analytical spots exhibited distinct localized high-value anomalies for these specific elements.

4.3.3. Rare Earth Element Characteristics

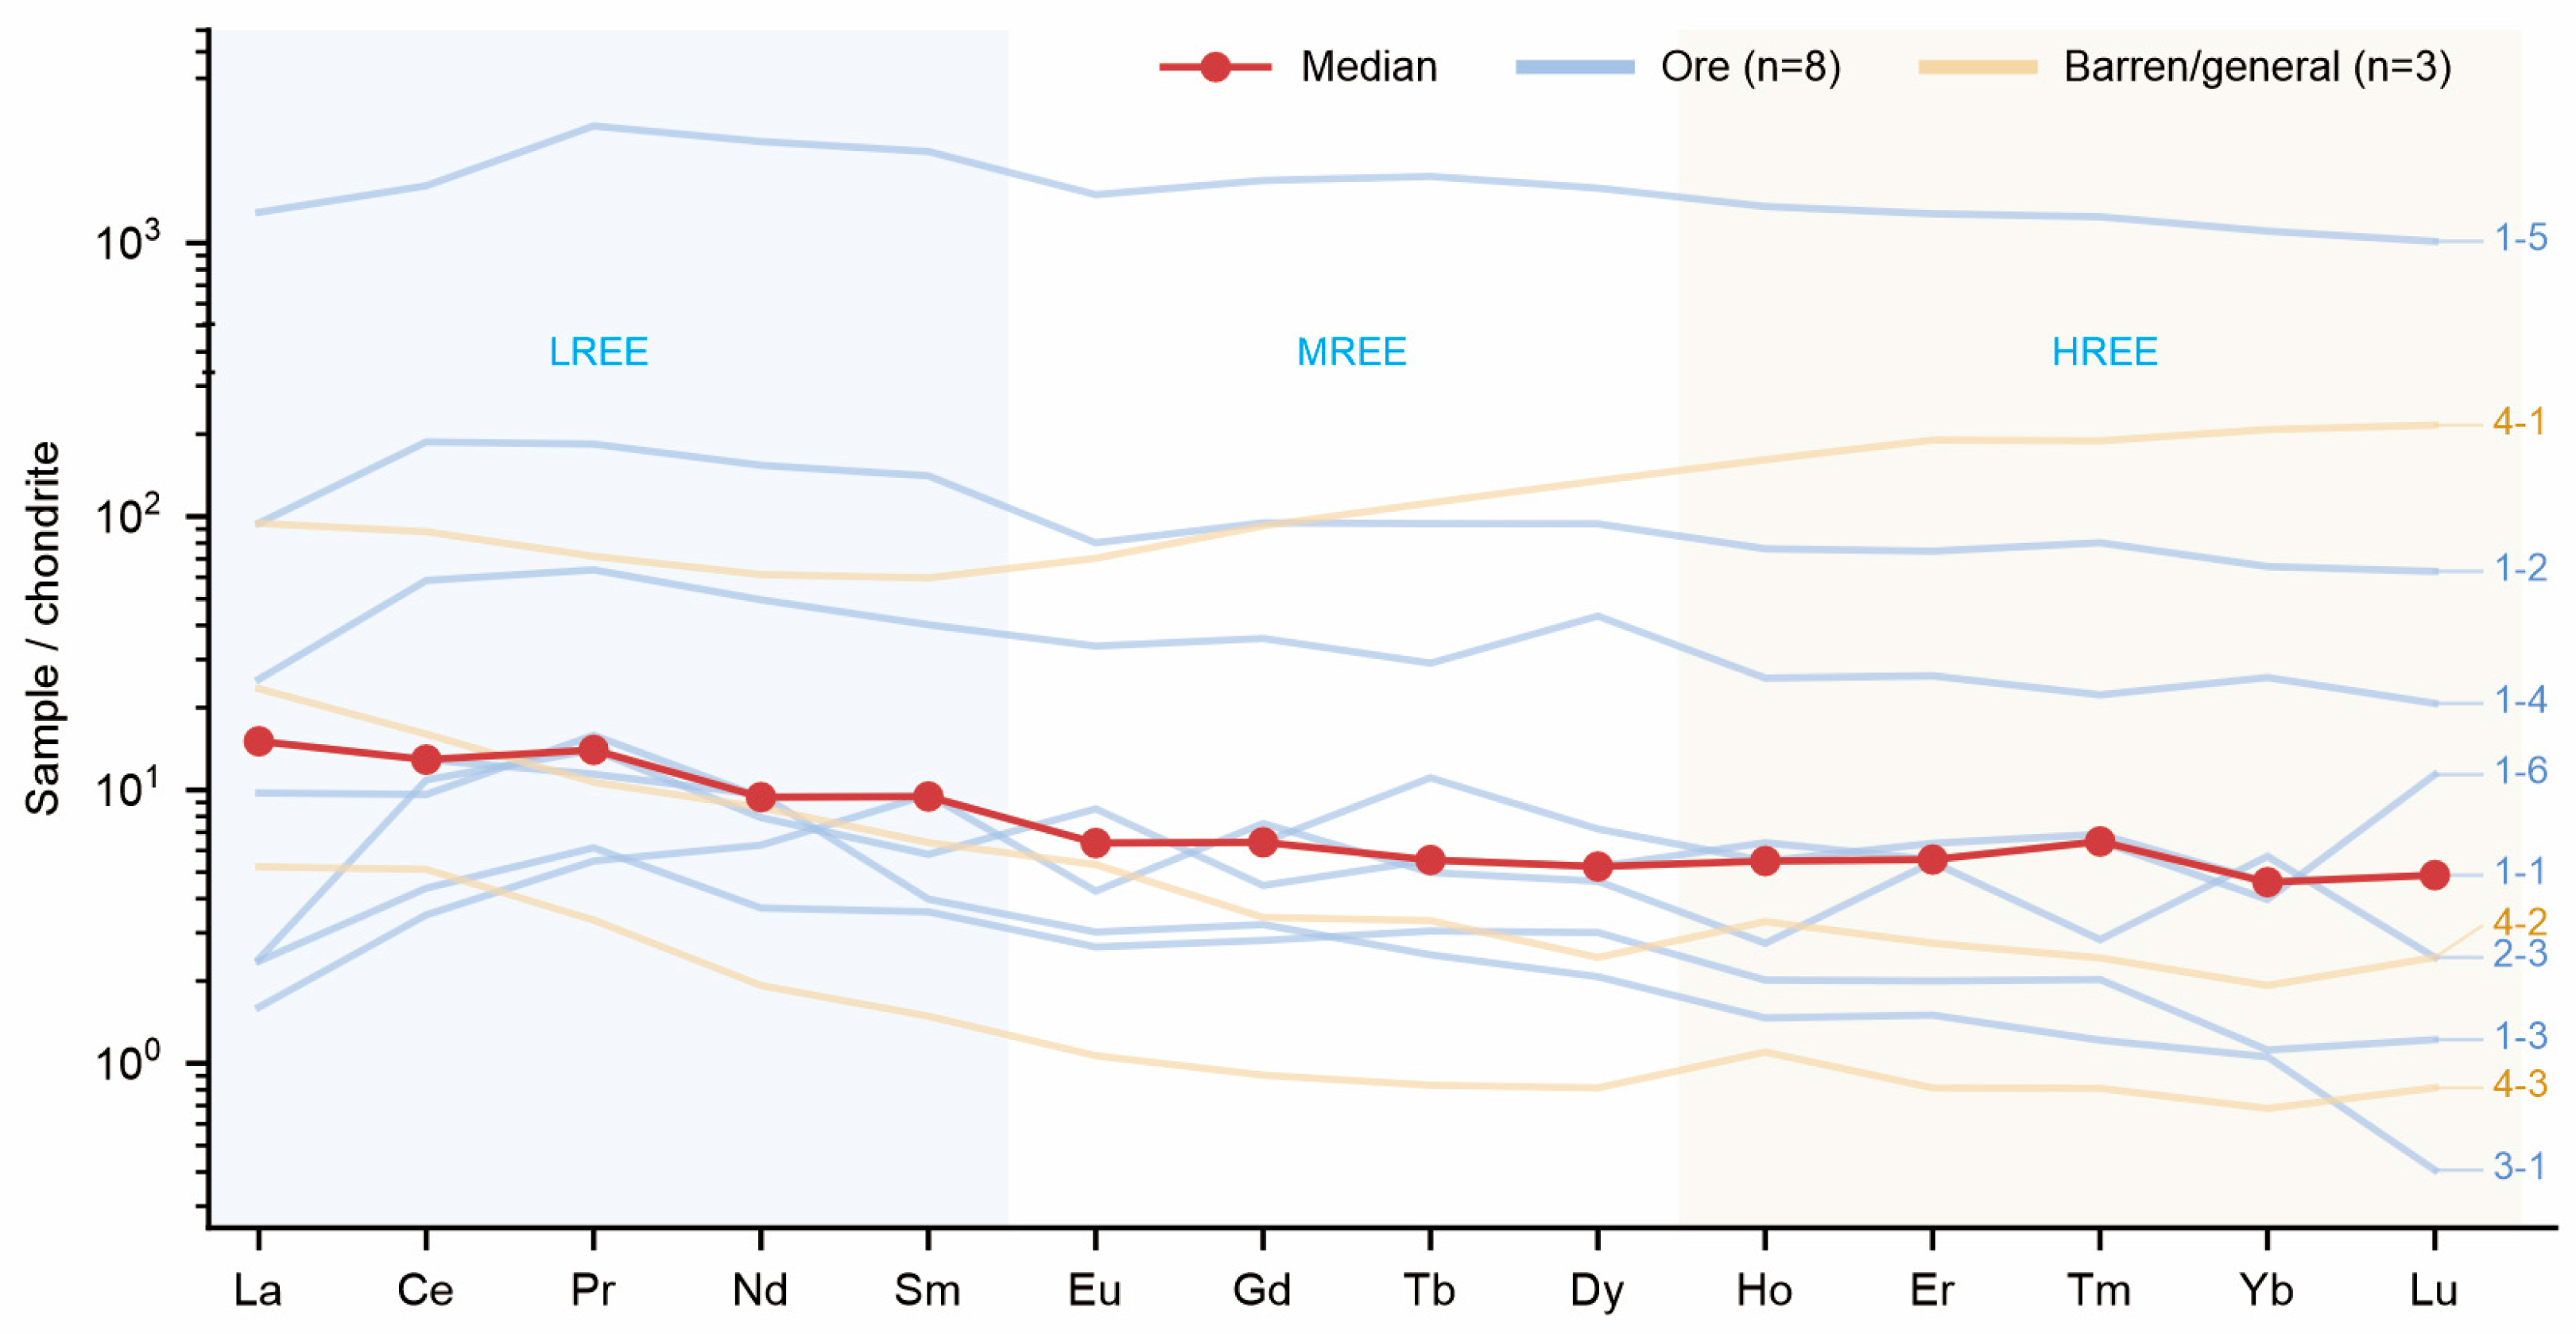
The analytical results and characteristic parameters of rare earth elements (REEs) in pyrite from the Yahewan uranium deposit are summarized in Table 2, and the chondrite-normalized REE patterns are illustrated in Figure 6. REE values of zero or below the detection limit were omitted from the plotted lines and statistical calculations. The normalizing chondrite values are adopted from Sun and McDonough [25].
The results demonstrate that the total REE contents (ΣREE) of the pyrite grains exhibit profound variability, varying from 6.60 to 4329.79 ppm, which indicates highly heterogeneous enrichment at the microscale. Regarding the fractionation between light and heavy rare earth elements (LREEs and HREEs), the ΣLREE/ΣHREE ratios range from 0.89 to 9.99 (average: 4.17). After chondrite normalization, the (La/Yb)N ratios vary from 0.28 to 14.27 (average: 3.93). The overall chondrite-normalized REE patterns display a right-dipping trend, characterized by relative LREE enrichment and HREE depletion.
Eu and Ce anomalies are commonly used as qualitative indicators of fluid–rock interaction, redox heterogeneity, and microdomain-scale geochemical variation [26]. These anomalies were calculated using the standard equations: Eu/Eu* = EuN/(SmN × GdN)1/2 and Ce/Ce* = CeN/(LaN × PrN)1/2. Analytically, the europium anomaly index (Eu/Eu*) of the studied pyrite ranges from 0.50 to 1.67 (average: 0.91). The REE patterns predominantly display a weak negative Eu anomaly, accompanied by localized positive anomalies at certain analytical spots. In contrast, the cerium anomaly index (Ce/Ce*) ranges from 0.77 to 1.87 (average: 1.18), indicating mostly weak to moderate positive Ce anomalies and locally pronounced positive anomalies on the normalized curves.

4.4. Sulfur Isotope Characteristics of Pyrite

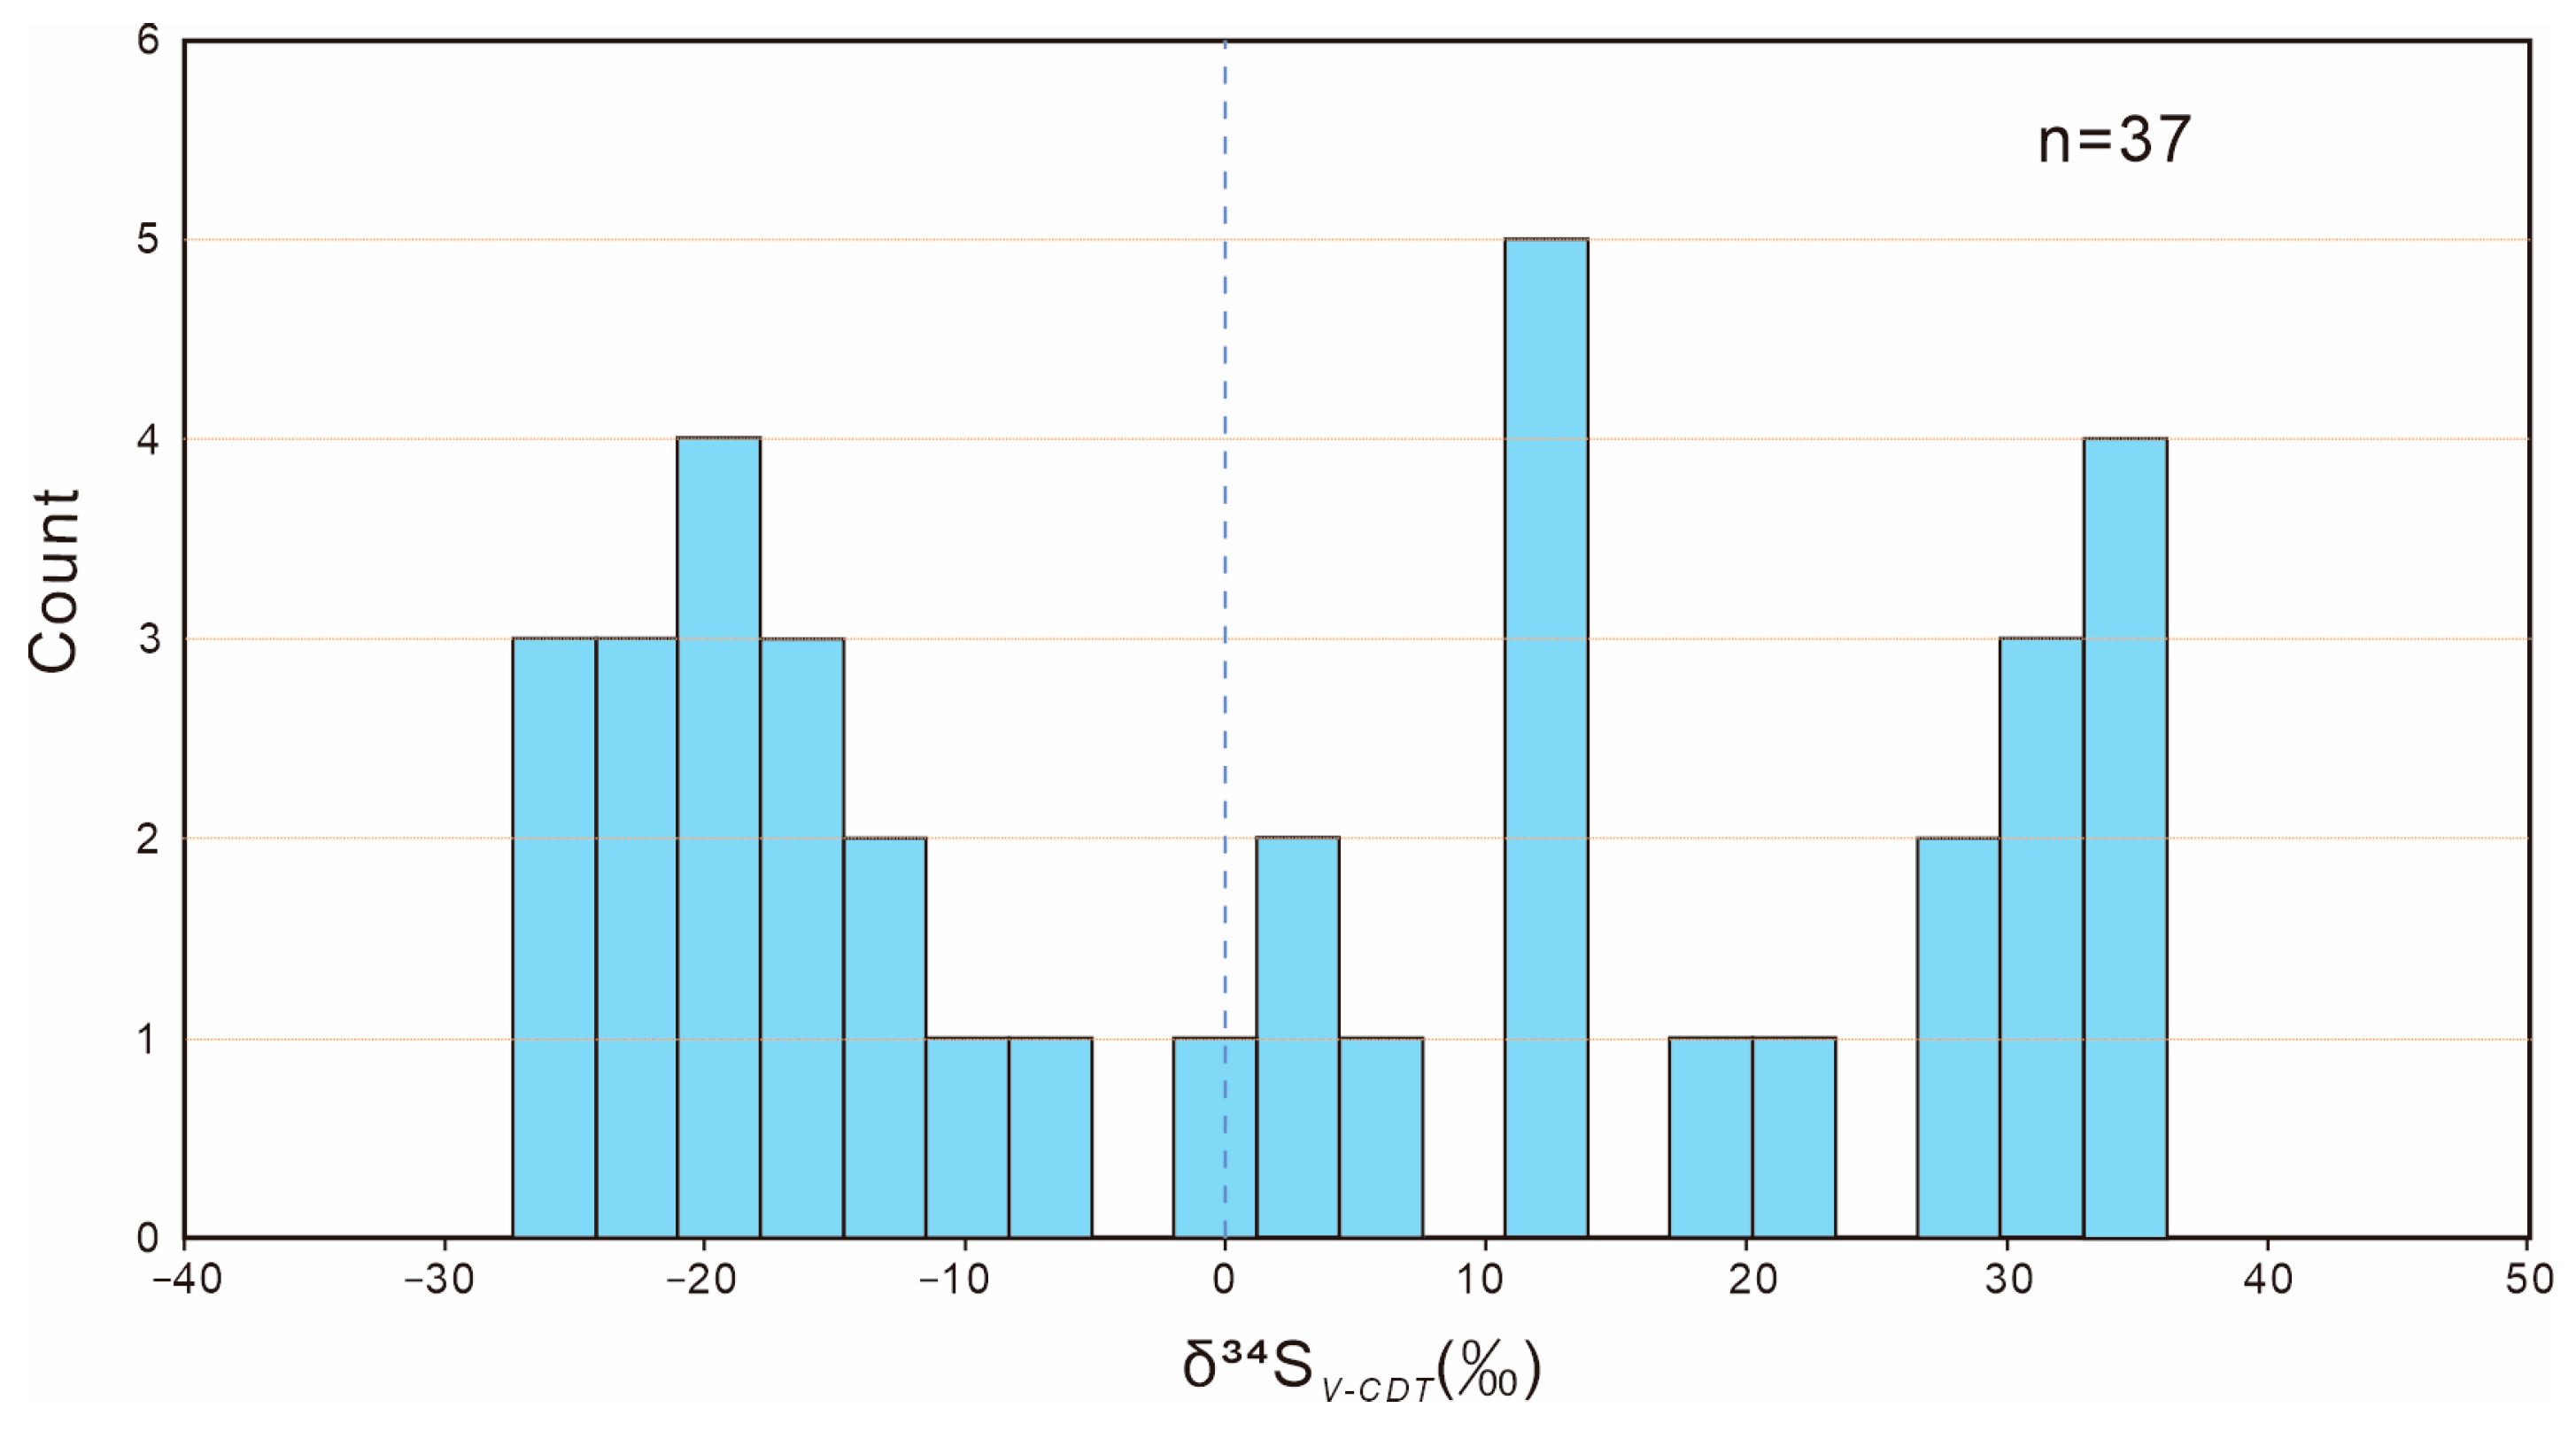
The δ34SV-CDT values of the studied pyrite exhibit a broad range and a high degree of heterogeneity, varying from −27.49‰ to +36.06‰, yielding a maximum absolute variation of 63.55‰ (Table 3). The average measured abundances for 32S, 33S, and 34S are 9.57, 0.0792, and 0.459, with their distribution ranges being 5.12–12.34, 0.0422–0.101, and 0.245–0.578, respectively. Furthermore, the average isotopic ratios for 34S/32S and 33S/32S are calculated to be 0.0480 and 0.0083, respectively, confirming the high reliability of the analytical data.

5. Discussion

5.1. Trace Element Constraints on Pyrite Genesis and Ore-Forming Fluid Properties

In modern sediments and Precambrian syngenetic sedimentary deposits, pyrite typically exhibits low cobalt (Co) concentrations (less than 100 ppm), with Co contents generally lower than nickel (Ni) levels [3]. Conversely, pyrite associated with intrusive and extrusive complex systems shows significantly higher Co and Ni concentrations, often exceeding 1000 ppm. Pyrite in volcano-sedimentary deposits typically has higher Co contents than those in normal sedimentary deposits, with Co/Ni ratios ranging between 5 and 100 [27,28,29]. Furthermore, hydrothermal pyrite also tends to have relatively high Co concentrations, mostly exceeding 100 ppm and commonly higher than Ni contents.
Co/Ni ratios in pyrite are commonly used to distinguish different genetic types, but their interpretation should be combined with petrographic and geochemical evidence. In the study area, most pyrite analyses show Co/Ni ratios below 1, consistent with a mainly sedimentary–diagenetic or authigenic origin under reducing microenvironments associated with organic matter and early pyrite formation [29,30]. A few coarse-grained pyrite domains show Co/Ni ratios near or slightly above 1, together with locally elevated V and U contents. These domains are not interpreted as unequivocal high-temperature hydrothermal pyrite. Instead, they are regarded as fluid-modified pyrite-rich domains, possibly related to later basinal fluid overprinting or local interaction with U-bearing microfractures. The similar trace-element signatures of these domains may indicate modification during a comparable later fluid-flow stage.
Pyrite is typically enriched in iron-group transition elements such as Co and Ni. Due to their similar atomic structures and physicochemical properties under natural conditions, Co2+ and Ni2+ commonly substitute for Fe2+ within the pyrite lattice via isomorphous substitution, forming CoS2 and NiS2 solid solutions [31]. The Co/Ni ratio in pyrite is a sensitive indicator of the specific geological setting and ore-forming fluid properties. In general, relatively high Co/Ni ratios may reflect non-sedimentary or fluid-modified pyrite, whereas low Co/Ni ratios are commonly associated with sedimentary–diagenetic or authigenic pyrite. However, Co/Ni ratios should be interpreted together with petrographic textures and other geochemical evidence.
Based on the genetic classification established by Bralia et al. [32], sedimentary-diagenetic pyrite typically yields Co/Ni ratios below 1.00. In contrast, magmatic-hydrothermal pyrite generally clusters between 1.00 and 5.00, while metamorphic-hydrothermal variants hover around 1.00. Volcanogenic massive sulfide (VMS) deposits exhibit the most extreme values, with ratios ranging from 5.00 to 50.00, characterized by high Co (avg. 480 ppm) and low Ni (<100 ppm).
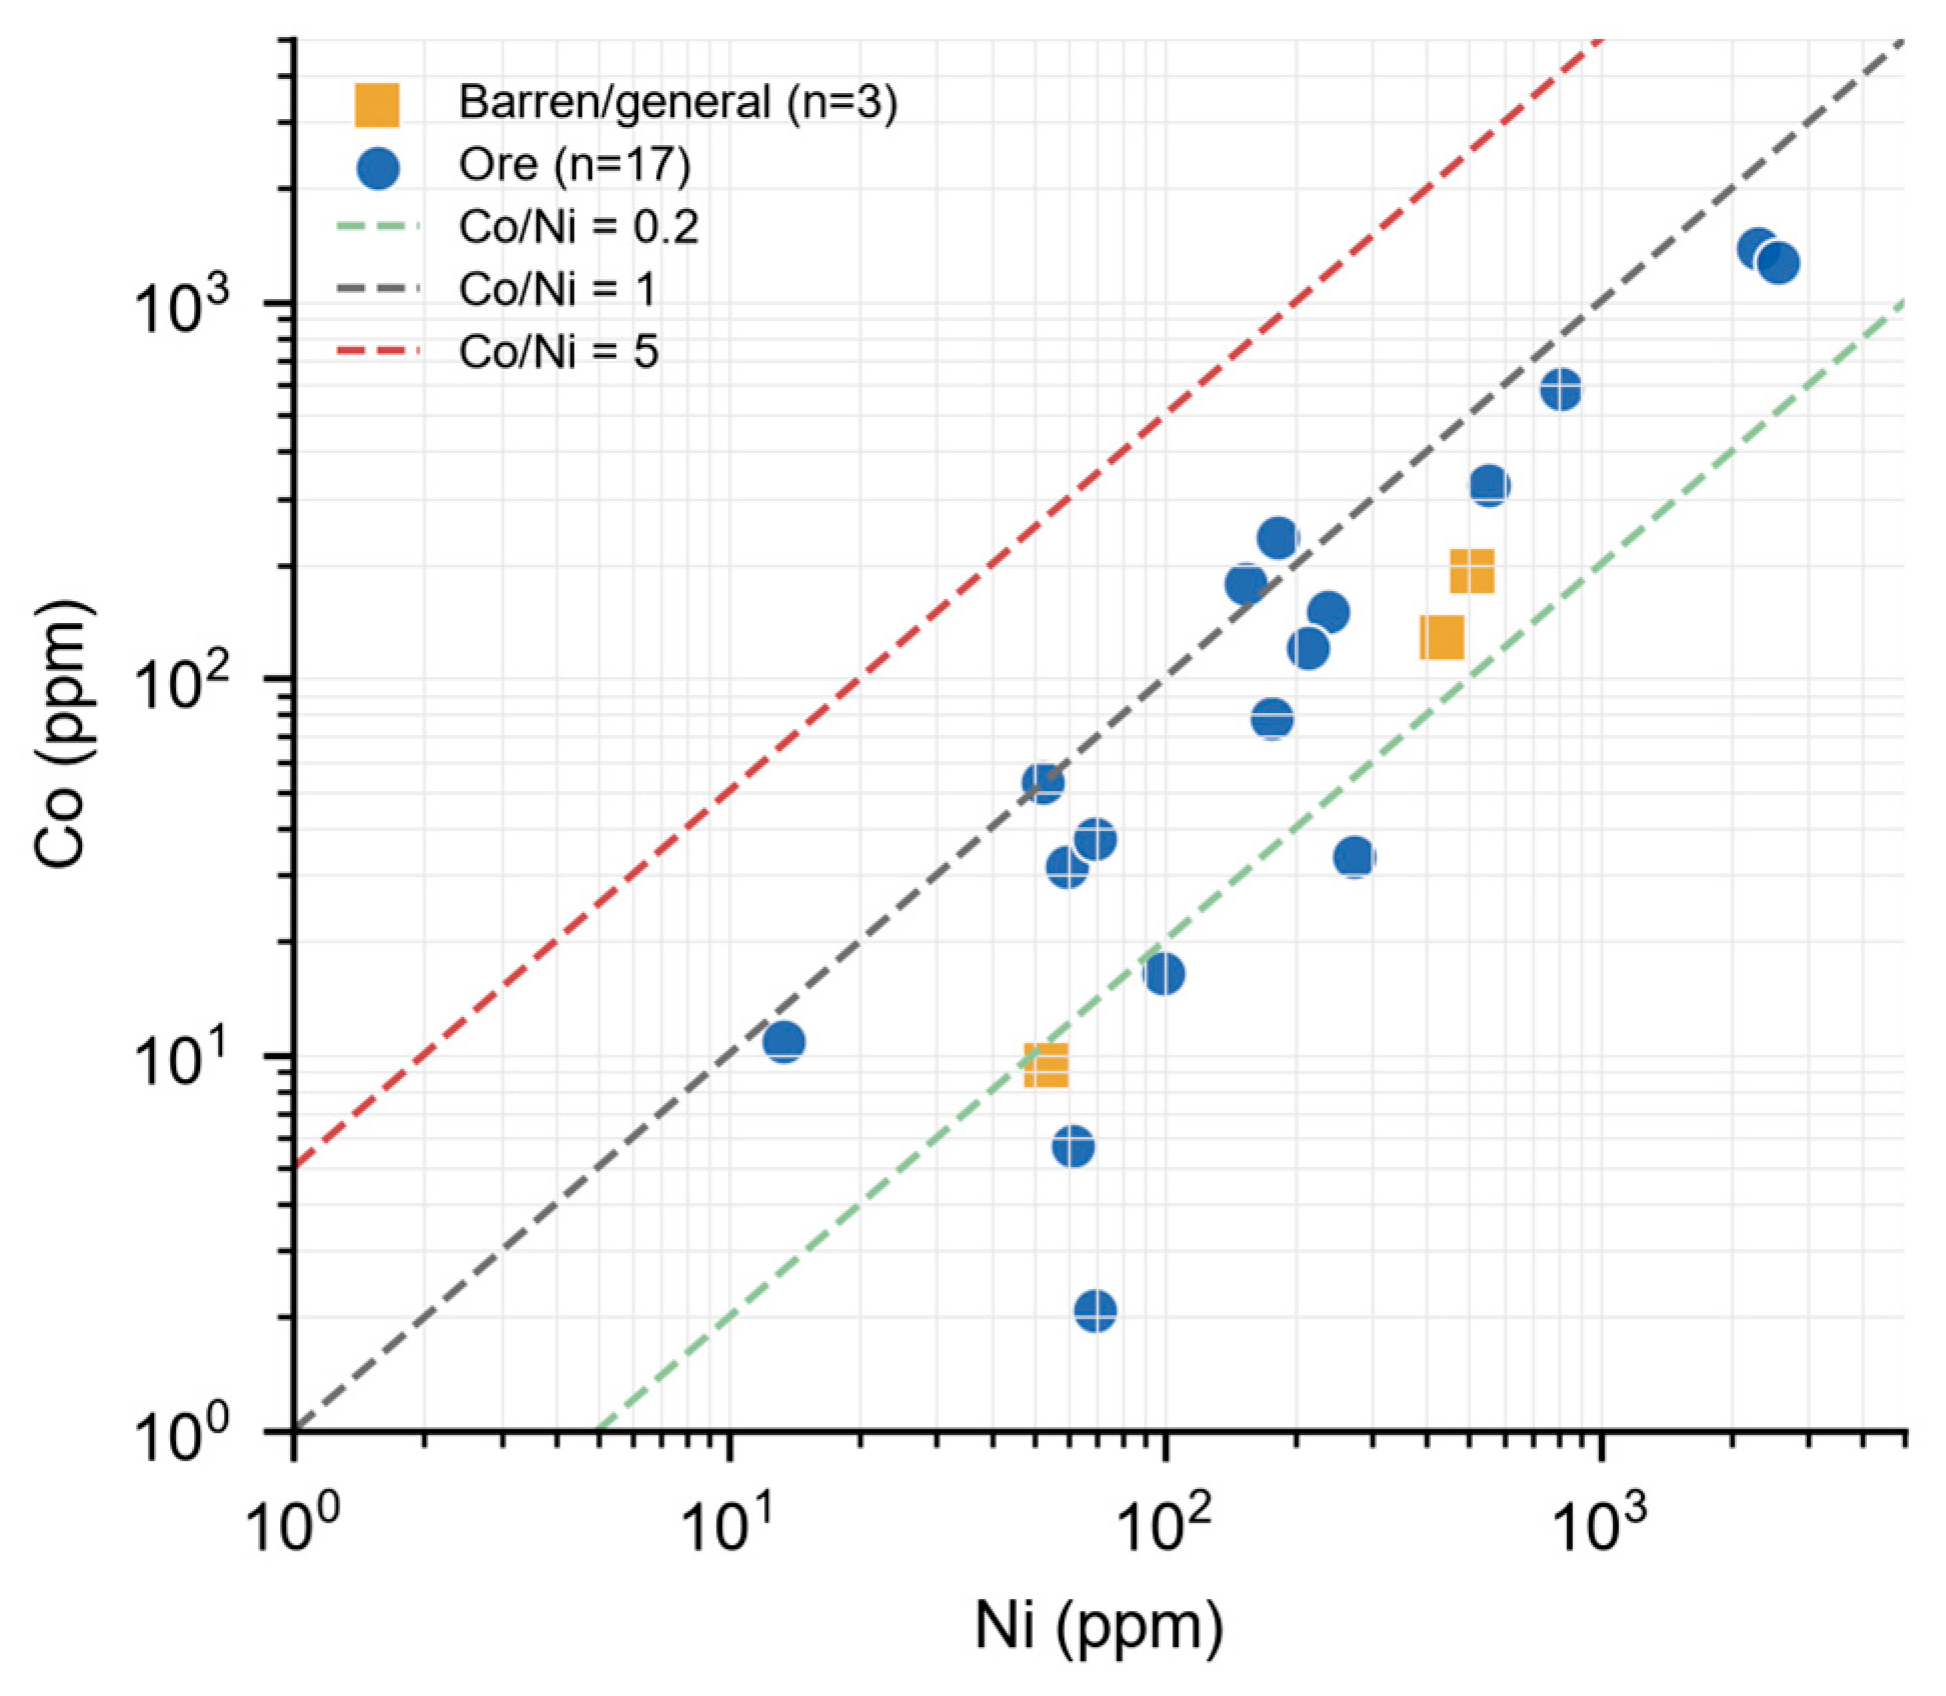
In the study area, the pyrite displays significant variations in Co and Ni concentrations, with Co ranging from 2.09 to 1384.17 ppm (avg. 243.28 ppm) and Ni ranging from 13.33 to 2565.57 ppm (avg. 444.38 ppm). The Co/Ni ratios vary from 0.03 to 1.31, with an average of 0.55. Although the pyrite is characterized by high absolute abundances of both Co and Ni, the overall Co/Ni ratios remain relatively low. When plotted on the Co-Ni genetic discrimination diagram (Figure 7), the majority of the data points fall within the sedimentary-diagenetic field (Co/Ni < 1), yet exhibit a distinct distributional trend toward the fluid-modified field (Co/Ni ≈ 1). A small subset of analyses with Co/Ni ratios near or slightly above 1 may reflect later fluid modification of pyrite-rich domains [33,34,35].
Overall, the low average Co/Ni ratio and the common association of pyrite with organic matter support a mainly authigenic to sedimentary-diagenetic origin for most pyrite. However, a few pyrite-rich domains with Co/Ni ratios near or slightly above 1 and locally elevated U contents indicate modification during later fluid flow. These observations support a two-stage interpretation in which early pyrite formed a reduced diagenetic substrate that was subsequently overprinted by metal-bearing basinal fluids during uranium mineralization.
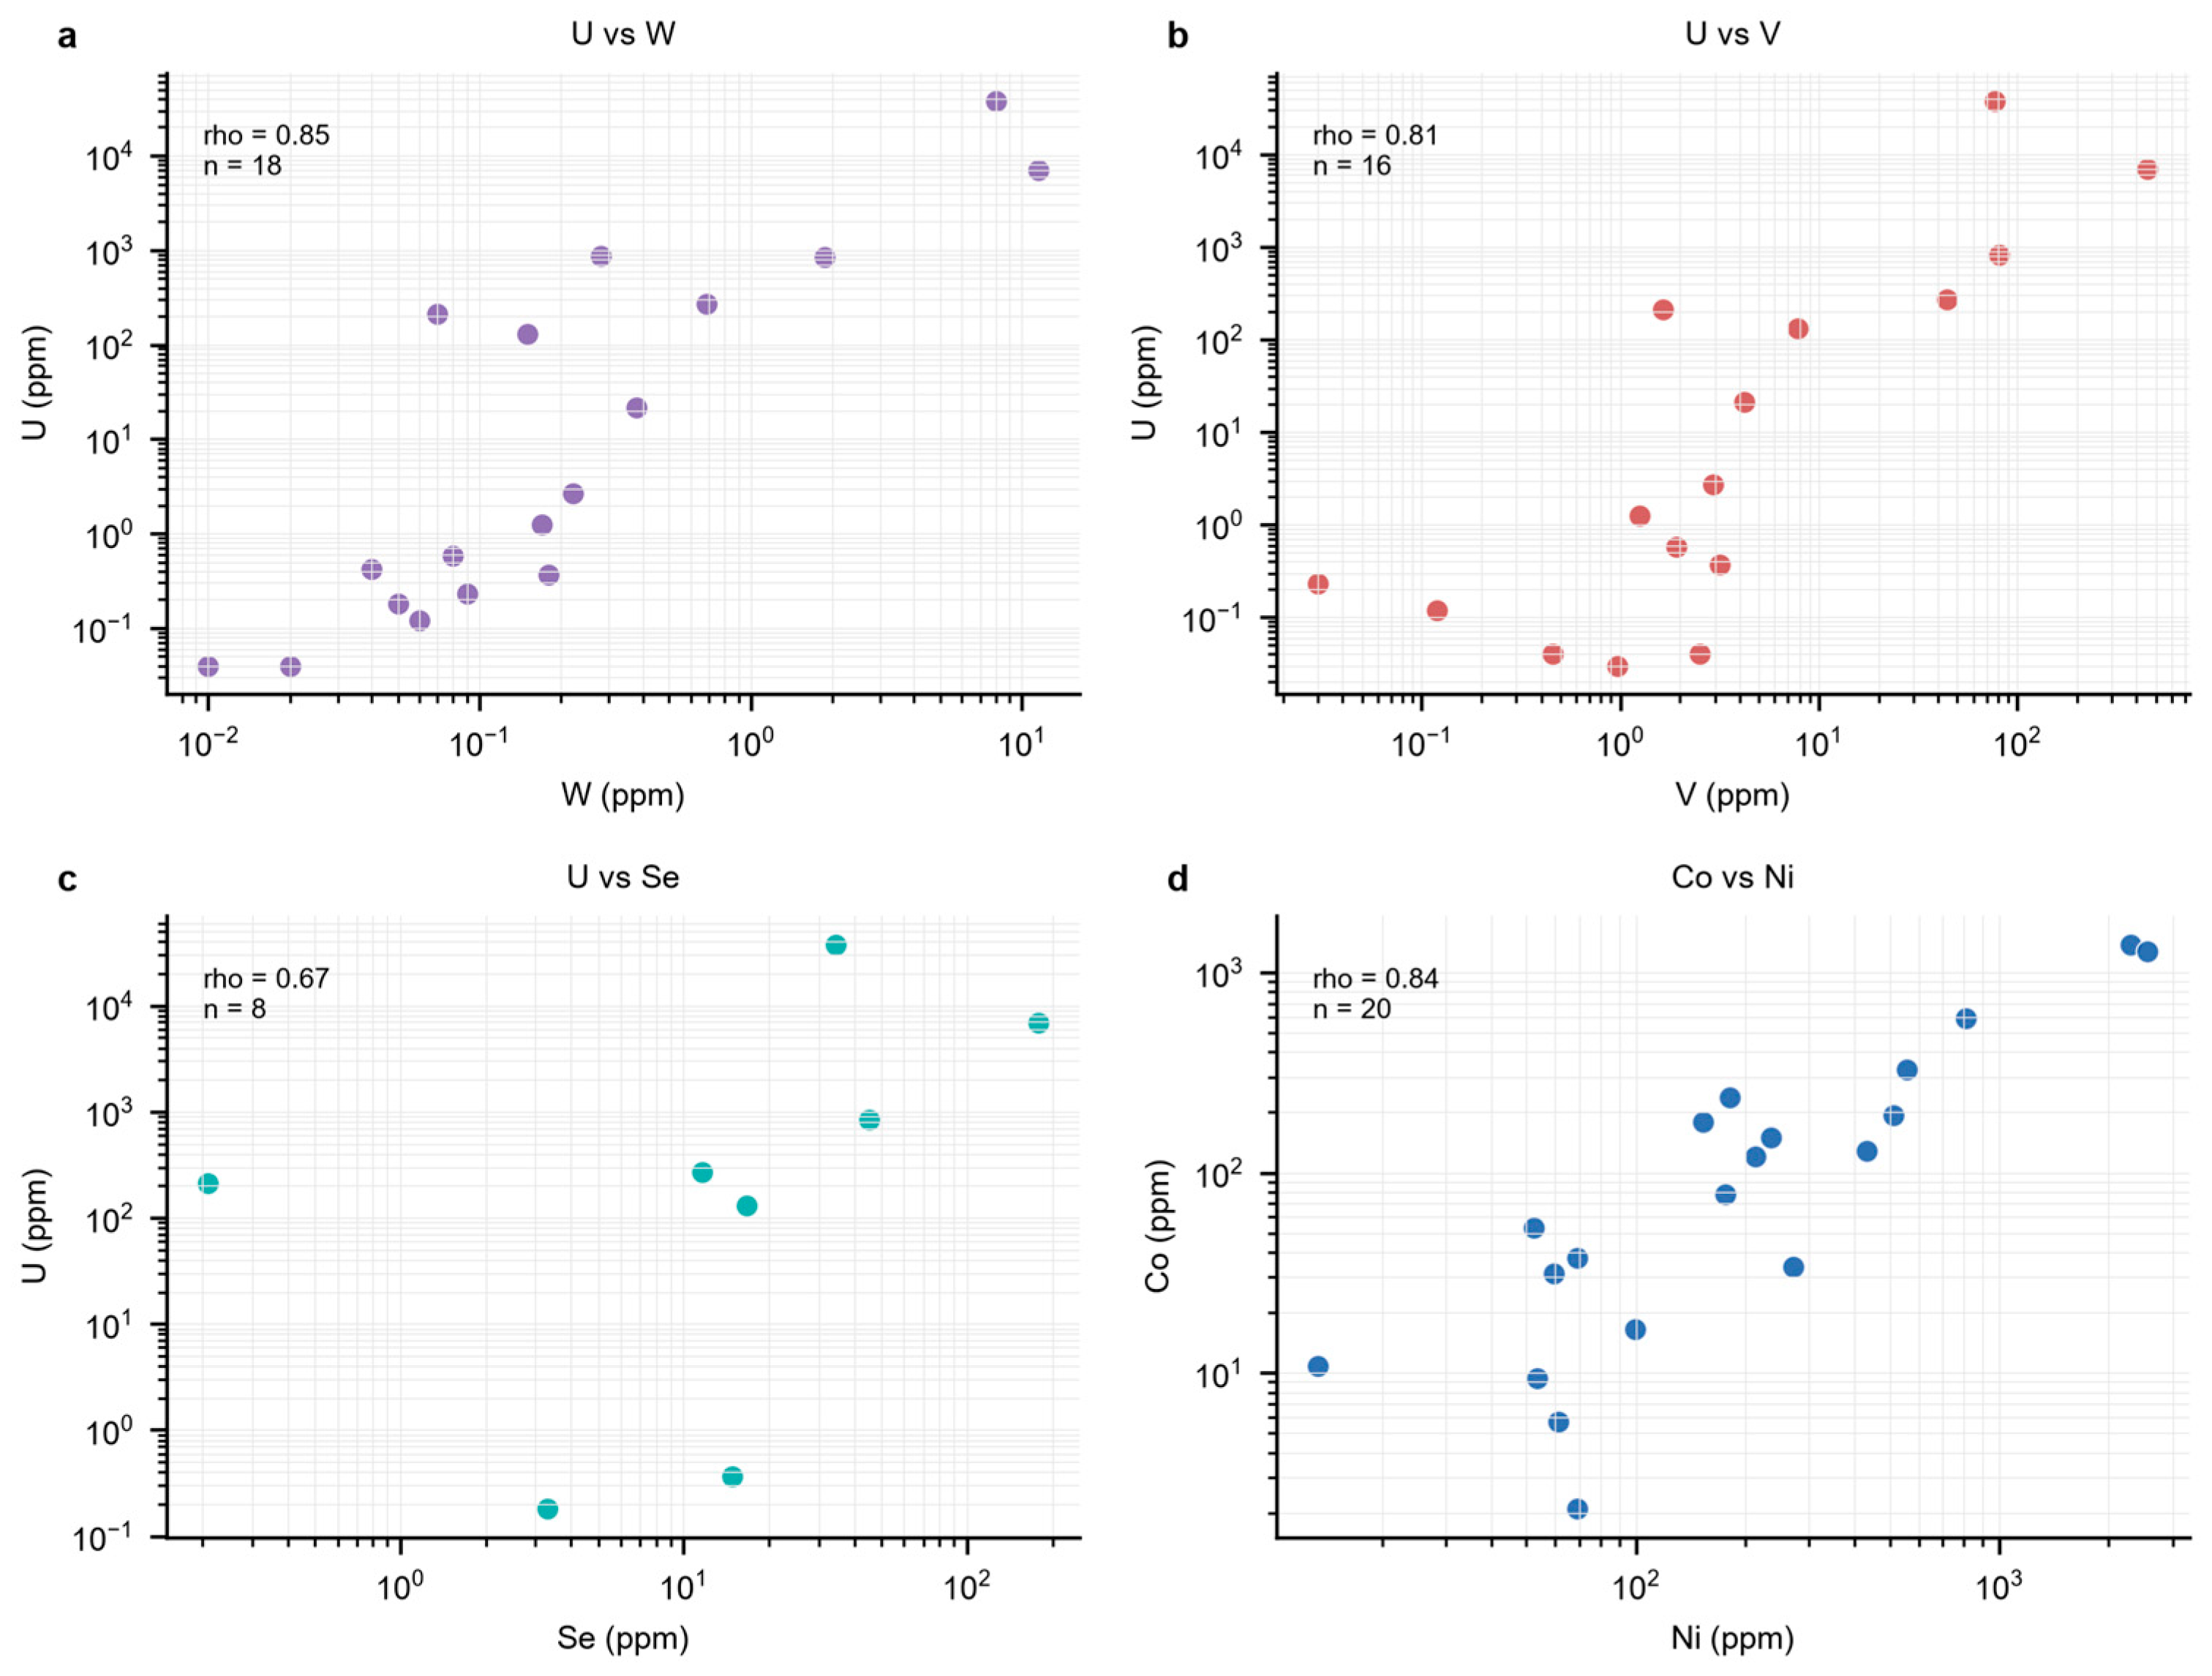
Trace-element covariation diagrams further illustrate the heterogeneous distribution of U and associated elements in the analyzed pyrite-rich domains (Figure 8). Some high-U analyses are accompanied by enrichment in redox-sensitive or lithophile elements, indicating localized geochemical heterogeneity within pyrite-rich microdomains. The repeated occurrence of high U in all analyzed spots from sample 0-9-2 suggests a real sample-scale U enrichment feature rather than a sporadic analytical artifact. However, the coexistence of high U with elevated Si and lithophile elements in some spots indicates that part of the U signal may be related to coffinite or coffinite-like U-silicate micro-inclusions, fracture-hosted uranium minerals, or mixed pyrite–uranium mineral ablation. Therefore, these data are best interpreted as evidence for later U-bearing fluid overprinting of pyrite-rich microdomains, rather than direct proof of lattice-bound U in pyrite.
The iron-group transition elements cobalt (Co) and nickel (Ni) represent the early sedimentary-diagenetic background. Co and Ni demonstrate an exceptionally strong internal correlation (ρ = 0.84), with data points highly clustered in scatter plots. This reflects their shared genetic origin and their broadly similar behavior during early pyrite crystallization.
In stark contrast, this background assemblage shows a negligible correlation with uranium (e.g., ρ = 0.09 for U vs. Ni). This geochemical decoupling suggests that the local U enrichment was not simply inherited from the early sedimentary–diagenetic pyrite-forming system, but was likely related to later U-bearing fluid overprinting with distinct chemical characteristics. The spatial convergence and overprinting of these two fluid end-members—each with distinct physicochemical properties—ultimately shaped the highly heterogeneous trace element patterns observed in the Yahewan pyrite.
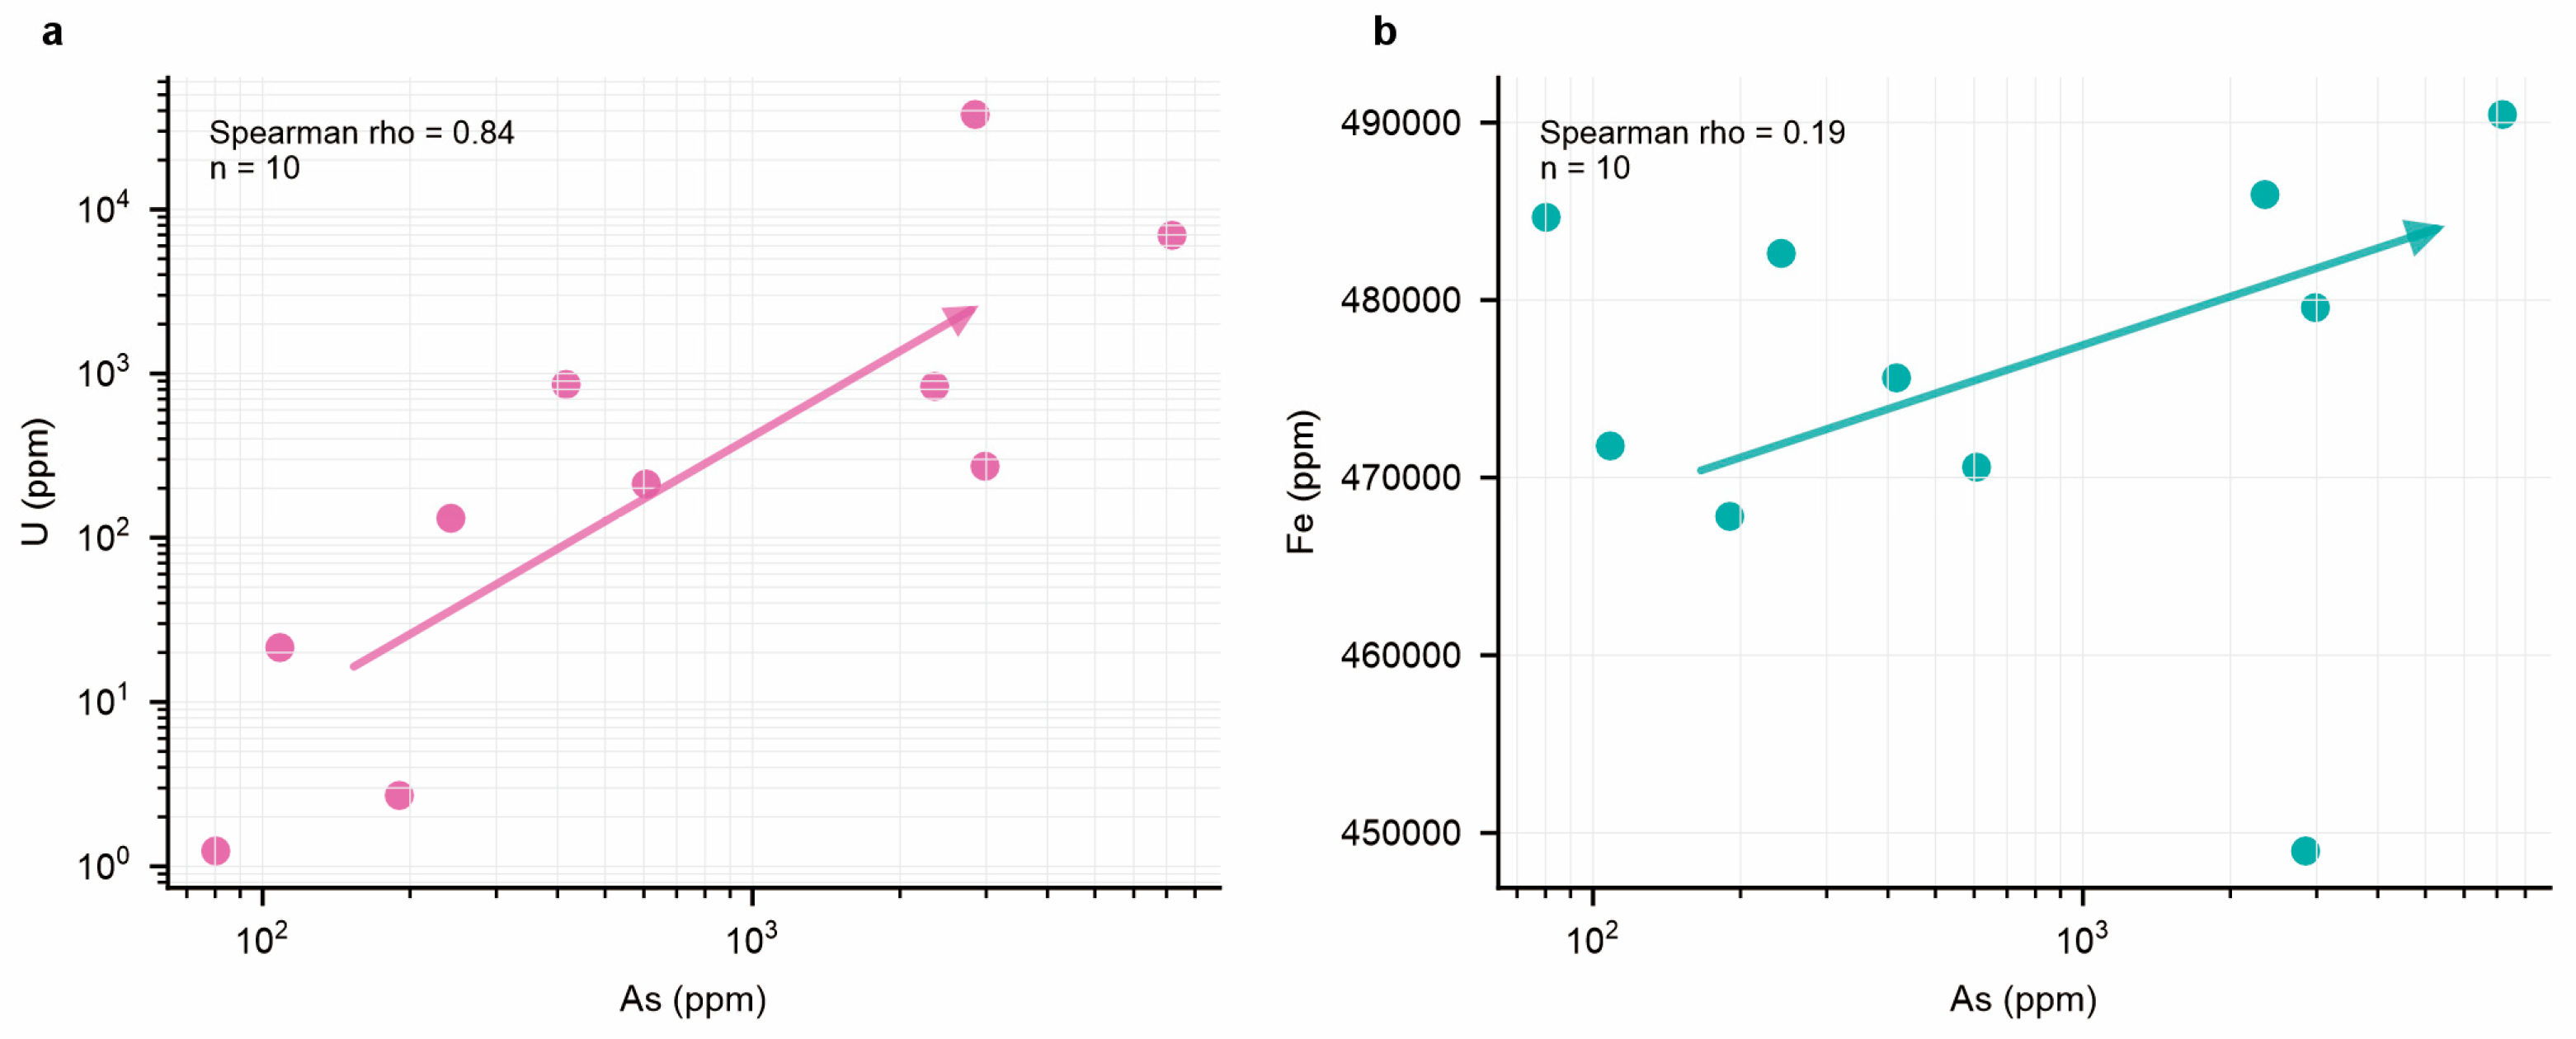
Arsenic (As) exhibits significant enrichment and strong elemental coupling within the pyrite of the Yahewan uranium deposit. Quantitative correlation results between As, the major element Fe, and the key ore-forming element U were obtained through Spearman rank correlation analysis of in situ LA-ICP-MS data (Figure 9).
The scatter plots show positive covariation between As and U in some pyrite-rich domains (Figure 9a), suggesting that As enrichment may be associated with U-rich microdomains. As shows positive covariation with U, Mo, V, Se, and Pb in some pyrite-rich domains, suggesting localized enrichment of these elements during later fluid overprinting.
In the As-Fe correlation plot (Figure 9b), the relationship between As and Fe should be interpreted cautiously because Fe is the major structural component of pyrite and shows a relatively narrow concentration range. The enrichment of As in some U-rich pyrite domains may indicate coupled incorporation or micro-inclusion-related enrichment, but its lattice-bound versus inclusion-related occurrence requires further verification.
REEs can provide qualitative constraints on fluid-rock interaction and microdomain-scale geochemical heterogeneity during pyrite formation [36]. The REE signatures of the Yahewan pyrite provide qualitative information on fluid–rock interaction and microdomain-scale geochemical heterogeneity.
Unlike typical deep-seated magmatic-hydrothermal deposits, the studied pyrite exhibits a right-dipping REE pattern (ΣLREE/ΣHREE ≈ 4.17) with weak negative to localized positive Eu anomalies, aligning with inter-formational groundwaters that have undergone extensive water-rock interaction. Furthermore, the locally positive Ce anomalies may reflect redox heterogeneity during pyrite precipitation, although possible effects of micro-inclusions, mixed mineral phases, or fluid–rock interaction should also be considered.
The studied pyrite displays variable Eu and Ce anomalies, including localized positive Eu anomalies with Eu/Eu* values up to 1.67. These features suggest heterogeneous REE behavior within pyrite-rich microdomains. In low-temperature sandstone-hosted systems, localized positive Eu anomalies are tentatively attributed to fluid–rock interaction, inheritance from micro-inclusions or mineral intergrowths, and variable Eu complexation in basinal fluids. Therefore, Eu and Ce anomalies are used here as qualitative indicators of micro-domain heterogeneity and fluid–mineral interaction, rather than direct evidence for Eu2+ incorporation into the pyrite lattice or intensely reducing conditions.
The ore-hosting Zhiluo Formation contains abundant carbonaceous debris, organic matter, and early pyrite, which could have provided local reducing microenvironments favorable for uranium precipitation. The relatively lower Fe3+/Fe2+ ratios in mineralized intervals are consistent with more reducing conditions, although the redox state of the system likely varied at the microdomain scale. These features suggest that pyrite-rich and organic-rich domains acted as favorable sites for later fluid–mineral interaction during uranium mineralization.

5.2. Constraints of Sulfur Isotopes on Ore-Forming Material Sources and Mineralization Environments

The 37 in situ sulfur isotope (δ34SV-CDT) data obtained from pyrite in this study show a broad range and pronounced isotopic heterogeneity (Figure 10). The analytical results show that the δ34SV-CDT values vary from −27.49‰ to +36.06‰, yielding a substantial total range of 63.55‰ and a mean value of +2.34‰. Specifically, negative values account for 45.9% of the data (descending to −27.49‰), while positive values constitute 54.1% (peaking at +36.06‰). Such variability in sulfur isotopic composition differs from typical deep-seated magmatic-hydrothermal sulfur, which commonly falls within a narrow range around 0 ± 3‰ [29]. This contrast provides geochemical evidence for evaluating the sulfur sources and mineralization environment.
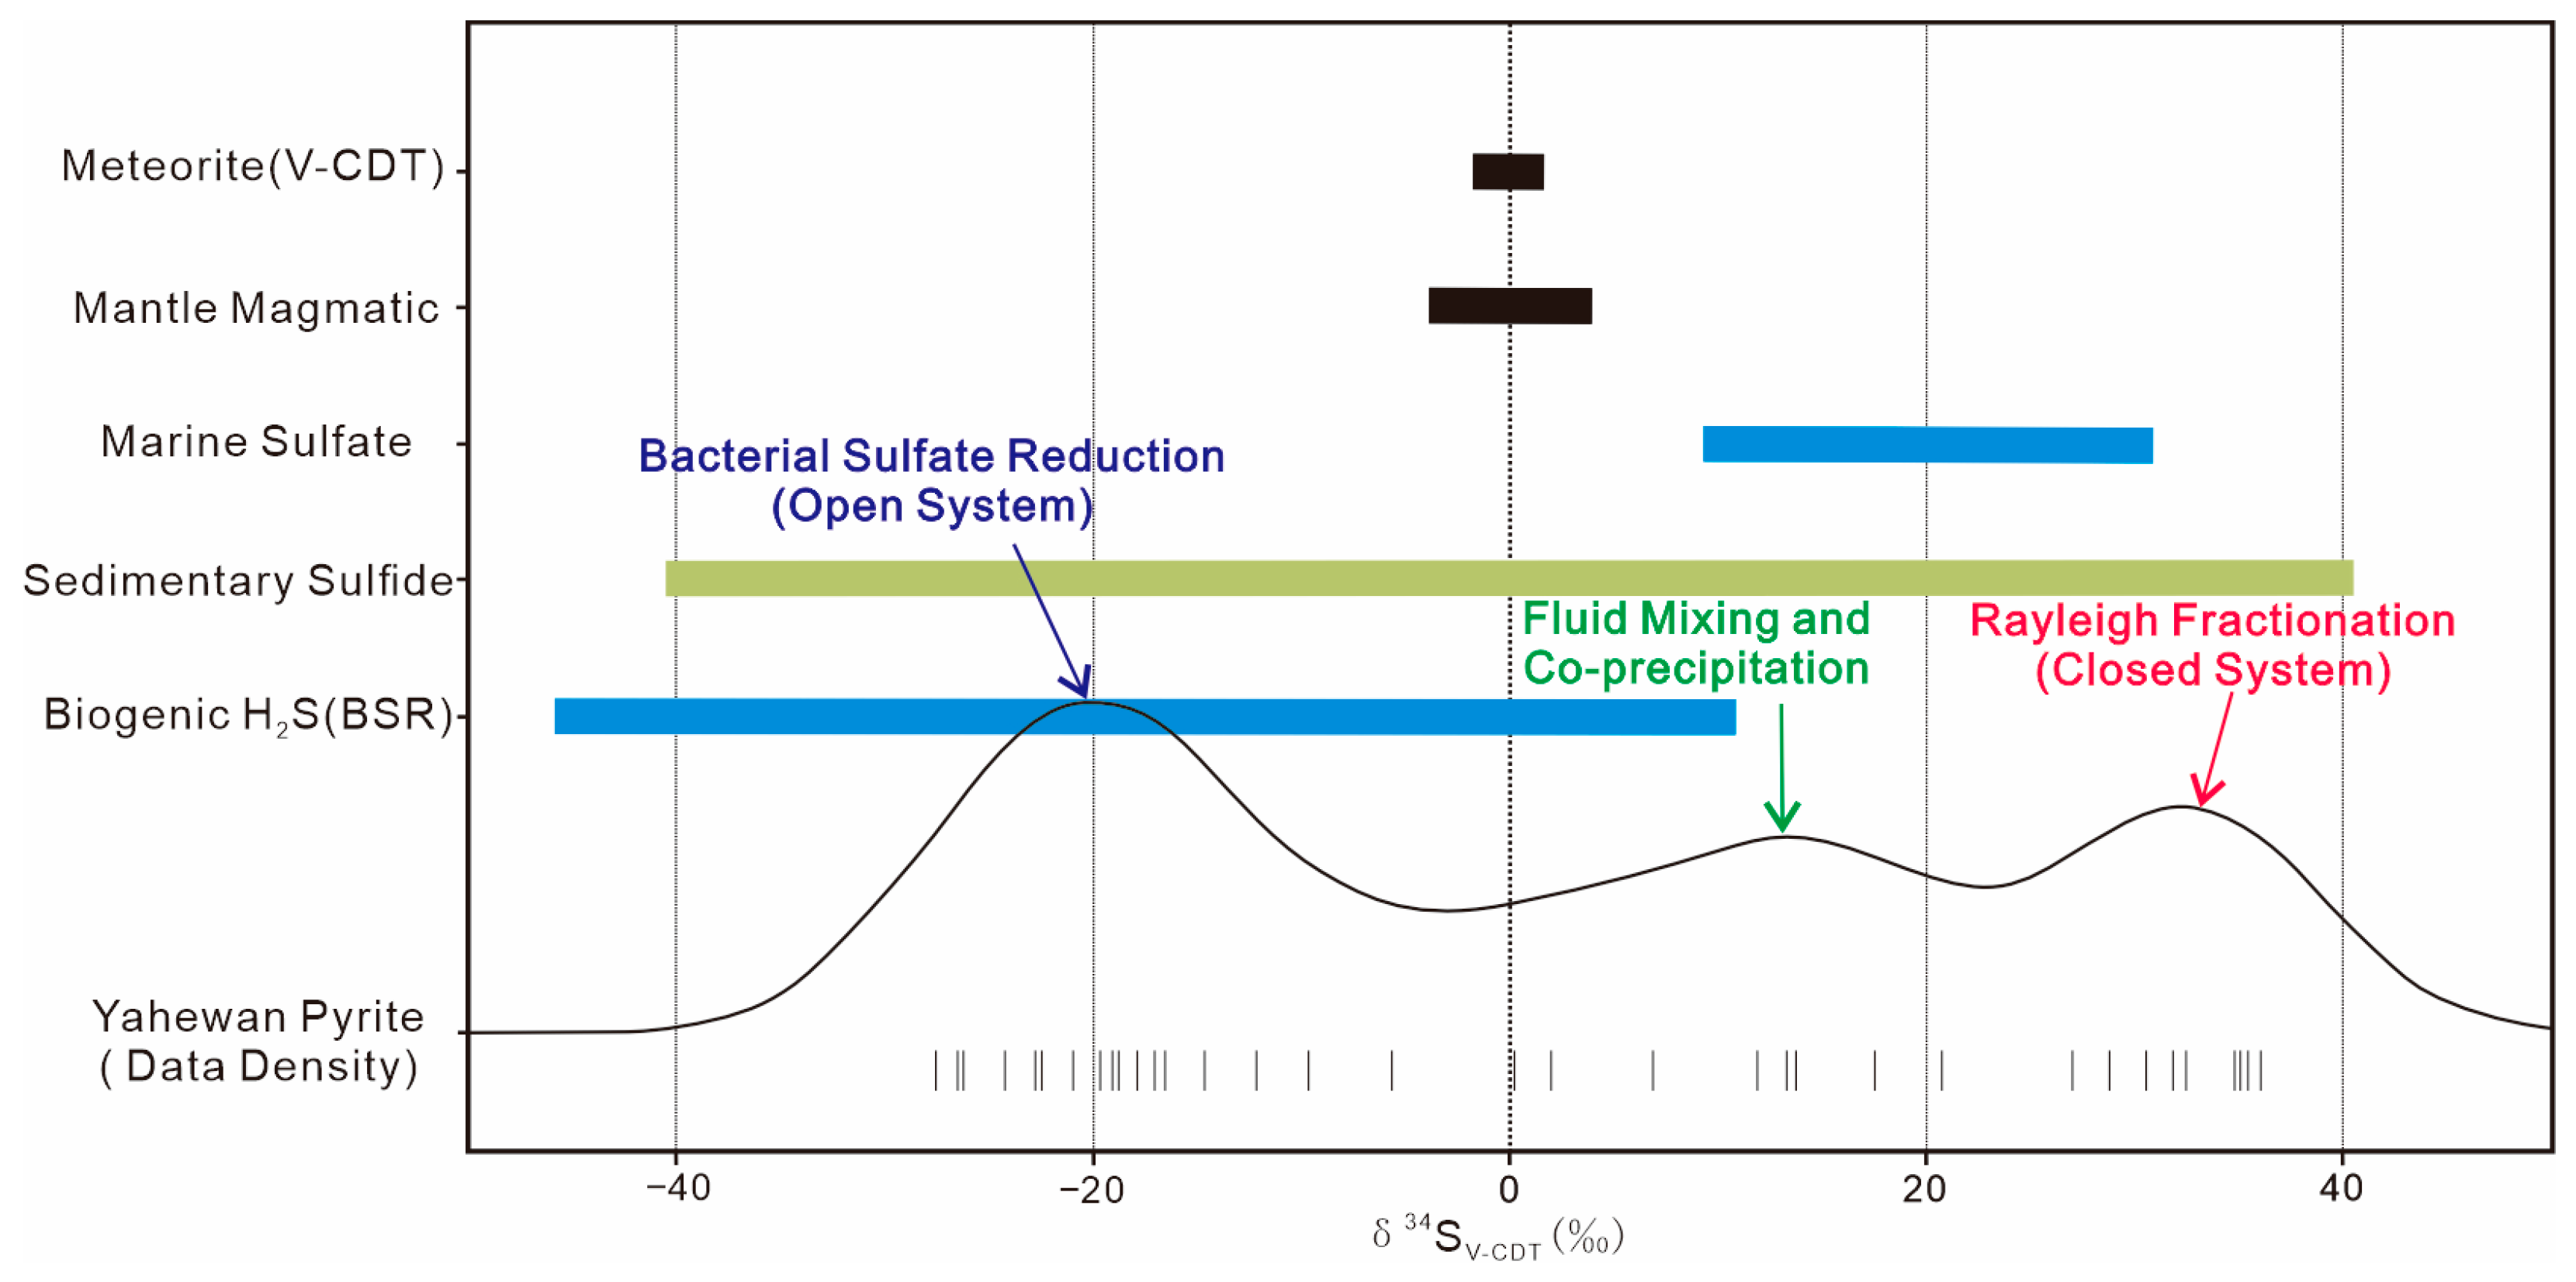
As shown in Figure 11, the sulfur isotopic (δ34S) compositions of different natural reservoirs vary significantly. Mantle-derived or magmatic-hydrothermal sulfur is characterized by its stability within a narrow interval of 0 ± 3‰.
In contrast, modern sediments, coal, petroleum, and sedimentary sulfides influenced by bacterial sulfate reduction (BSR) often display a broad range of sulfur isotopes—frequently biased toward negative values—due to intense kinetic fractionation. Projecting the 37 measured pyrite data points from this study (ranging from −27.49‰ to +36.06‰) onto this diagram yields the following implications [37,38] (Figure 11).
The isotopic distribution of the studied pyrite overlaps with the ranges of sedimentary sulfides, coal, and biogenic modern sediments, while differing from the relatively narrow mantle-derived sulfur range near 0‰. This pattern suggests that sedimentary sulfate, organic sulfur reservoirs, and biogenic sulfur cycling within the host strata contributed to the sulfur budget of pyrite [39,40]. The prevalence of negative δ34S values, particularly those between −27.49‰ and −17.00‰, is consistent with bacterial sulfate reduction under organic-rich pore-water conditions.
Consequently, the sulfur in the Yahewan pyrite was likely derived mainly from sedimentary sulfate and organic sulfur reservoirs within the host strata. These organic- and pyrite-rich sandstones likely provided reducing microenvironments that favored later interaction with U-bearing fluids [41,42,43].
The wide range of δ34SV-CDT values in pyrite indicates heterogeneous sulfur sources and multi-stage isotope fractionation under variable diagenetic to mineralizing conditions. The negative δ34SV-CDT values are consistent with sulfur isotope fractionation related to bacterial sulfate reduction, probably promoted by organic matter in relatively open to semi-open pore-water systems. In contrast, the positive δ34SV-CDT values, reaching up to +36.06‰, may reflect restricted pore-water evolution, residual sulfate enrichment, Rayleigh-type fractionation, or multi-stage pyrite growth. However, these processes cannot be fully distinguished using sulfur isotope data alone. Therefore, the sulfur isotope data are interpreted here as evidence for heterogeneous sulfur sources and evolving pore-water conditions, rather than as unique evidence for a strongly reducing mineralization environment. Together with the petrographic association of pyrite, organic matter, and uranium minerals, these isotopic features suggest that reducing microenvironments were locally developed in the sandstone and may have favored uranium precipitation during later fluid overprinting.

5.3. Implications of Pyrite for Uranium Mineralization

In sandstone-hosted uranium deposits, pyrite commonly acts as a reducing mineral and an indicator of redox conditions within the diagenetic-mineralizing system. The wide δ34SV-CDT range of pyrite, from −27.49‰ to +36.06‰, records heterogeneous sulfur sources and multi-stage sulfur isotope fractionation. Negative δ34SV-CDT values are consistent with bacterial sulfate reduction in organic-rich pore waters, whereas positive values may reflect restricted pore-water evolution, residual sulfate enrichment, Rayleigh-type fractionation, or multi-stage pyrite growth. Together with the close association between pyrite and organic matter, these sulfur isotope features suggest that reducing microenvironments were locally developed in the Zhiluo Formation sandstones and may have provided favorable sites for later interaction with U-bearing fluids.
Upon the influx of later U-bearing basinal fluids, the reducing microenvironments provided by early pyrite and organic matter may have favored localized uranium precipitation. The trace-element data suggest that some pyrite-rich domains were overprinted by later U-bearing fluids during uranium mineralization. The repeated occurrence of high U in sample 0-9-2 indicates localized U enrichment at the sample scale, whereas the association of U with Mo, V, W, Se, and As is consistent with interaction between pyrite-rich reducing domains and metal-bearing basinal fluids. However, because some high-U analyses may include contributions from coffinite or coffinite-like U-silicate micro-inclusions, fracture-hosted uranium minerals, or mixed pyrite–uranium mineral ablation, these data are best interpreted as records of U-bearing fluid overprinting of pyrite-rich microdomains rather than direct evidence for uranium incorporation into the pyrite lattice.
At the microscale, early pyrite and organic matter likely provided reducing microenvironments favorable for uranium precipitation when later U-bearing fluids entered the sandstone. The close spatial association between pyrite and coffinite or coffinite-like U-silicate minerals suggests that pyrite-rich domains acted as important sites for localized fluid–mineral interaction. In these microdomains, reduced sulfur species, ferrous iron, and organic matter may have contributed to the reduction of mobile U(VI) and the precipitation of U(IV) minerals. This process may have involved localized consumption of reduced components and limited material exchange within pore-scale reaction sites, which is broadly consistent with the heterogeneous and locally positive δ34SV-CDT values observed in some pyrite domains. Therefore, pyrite records, and may have partly mediated, the redox transition between early reducing pore waters and later U-bearing fluids. However, the exact timing of pyrite growth and uranium mineralization requires further geochronological and valence-state constraints.

6. Conclusions

  • Pyrite in the Zhiluo Formation sandstones of the Yahewan deposit occurs mainly as framboidal, colloidal, pore-filling, fracture-filling, and massive aggregates. Its textures, close association with organic matter, and mostly low Co/Ni ratios indicate a dominant authigenic to sedimentary–diagenetic origin under reducing pore-water conditions. A few pyrite-rich domains with Co/Ni ratios near or slightly above 1 may record later fluid modification.
  • Coffinite or coffinite-like U-silicate minerals occur along pyrite margins, within microfractures, and locally in pyrite-rich microdomains, indicating a close spatial association between uranium minerals and pyrite. Local enrichment of U, Mo, V, W, Se and As is consistent with U-bearing fluid overprinting of pyrite-rich domains, rather than direct proof of lattice-bound U in pyrite.
  • The wide δ34SV-CDT range of pyrite (−27.49‰ to +36.06‰) records heterogeneous sulfur sources and multi-stage isotope fractionation, likely involving bacterial sulfate reduction and restricted pore-water evolution. These isotopic signatures indicate locally developed organic- and pyrite-rich reducing microenvironments that favored later interaction with U-bearing fluids.
  • The main contribution of this study is to show that pyrite-rich microdomains record the transition from early diagenetic reduction to later uranium mineralization. Early organic matter and authigenic/biogenic pyrite provided local reducing sites, whereas later U-bearing basinal fluids overprinted these sites and promoted localized coffinite or coffinite-like U-silicate precipitation.

Supplementary Materials

The following supporting information can be downloaded at: https://www.mdpi.com/article/10.3390/min16080785/s1, Table S1: Sample information for the Yahewan uranium deposit; Table S2: Raw LA-ICP-MS output concentration data for trace and selected major elements in pyrite from the Yahewan uranium deposit.

Author Contributions

Methodology, M.L. and L.Q.; investigation, M.L. and X.Z.; data curation, M.L., J.W. and M.T.; formal analysis, M.L., S.D. and Y.X.; sample preparation, J.W., H.L. and M.T.; writing—original draft preparation, M.L.; writing—review and editing, M.L., Z.L. and L.Q.; supervision, Z.L. and L.Q.; resources, Z.L. and L.Q.; project administration, Z.L. and L.Q.; funding acquisition, Z.L. and L.Q. All authors have read and agreed to the published version of the manuscript.

Funding

This research was funded by the National Natural Science Foundation of China (Ye Qisun Science Fund, Grant No. U2341292), the Open Fund Project of the National Key Laboratory of Uranium Resources Exploration-Mining and Nuclear Remote Sensing (Grant No. NKLUR-WDZC-2026-01), the Fundamental Research Program of China National Nuclear Corporation (CNNC; Grant No. JCYJ2302), and the CNNC Young Talents Project (Grant No. Di-QNYC2402).

Data Availability Statement

The data presented in this study are available in the article and its Supplementary Materials.

Acknowledgments

The authors would like to thank the anonymous reviewers for their constructive comments and insightful suggestions, which significantly improved the quality of this manuscript. We also appreciate the editor and the editorial office for their efficient handling and professional assistance during the review process.

Conflicts of Interest

The authors declare no conflicts of interest.

References

  1. Zhao, K.; Zhou, Y.; Chen, K.; Bao, Z.; Zhang, Y.; An, F.; Wu, B.; Li, G.; Yuan, H. Compositions of In-Situ Trace Elements, S and Pb Isotopes of Pyrite in Mengqiguer Deposit, Yili Basin, NW China: Implications for Uranium Mineralization Processes of sandstone-type Uranium Deposit. Ore Geol. Rev. 2025, 179, 106503. [Google Scholar] [CrossRef] [Scilit]
  2. Yang, R.; Lou, Q.; Wang, M.; Cao, L.; Luo, L. Using Stable Sulfur Isotopes to Quantify the Formation Mechanism and Sources of SO42− in PM2.5 in Haikou City. ACS Earth Space Chem. 2025, 9, 560–568. [Google Scholar] [CrossRef] [Scilit]
  3. Gregory, D.D.; Large, R.R.; Halpin, J.A.; Baturina, E.L.; Lyons, T.W.; Wu, S.; Danyushevsky, L.; Sack, P.J.; Chappaz, A.; Maslennikov, V.V.; et al. Trace Element Content of Sedimentary Pyrite in Black Shales. Econ. Geol. 2015, 110, 1389–1410. [Google Scholar] [CrossRef] [Scilit]
  4. Liu, G.; Zhao, K.; Jiang, S.; Chen, W. In-Situ Sulfur Isotope and Trace Element Analysis of Pyrite from the Xiwang Uranium Ore Deposit in South China: Implication for Ore Genesis. J. Geochem. Explor. 2018, 195, 49–65. [Google Scholar] [CrossRef] [Scilit]
  5. Zhao, F.; Li, Z.; Tian, T.; Guo, P.; Li, B.; Luo, H.; Qi, Y.; Tian, J.; Zhang, P. Mineralogy and in Situ Sulfur Isotope Geochemistry of Pyrite: Implications for Ore-Forming Processes of the Moshan Gold Deposit, Jiaodong Peninsula, North China. Minerals 2026, 16, 344. [Google Scholar] [CrossRef] [Scilit]
  6. He, Q.; An, Y.; Sun, F.; Lai, C. Genesis of Pyrite Concretions: Constraints from Mineral and Geochemical Features of Longtan Formation in Anhui Province, Eastern China. Minerals 2019, 9, 467. [Google Scholar] [CrossRef] [Scilit]
  7. Wang, L.; Lv, D.; Hower, J.C.; Zhang, Z.; Raji, M.; Tang, J.; Liu, Y.; Gao, J. Geochemical Characteristics and Paleoclimate Implication of Middle Jurassic Coal in the Ordos Basin, China. Ore Geol. Rev. 2022, 144, 104848. [Google Scholar] [CrossRef] [Scilit]
  8. Johnson, E.A.; Liu, S.; Zhang, Y. Depositional Environments and Tectonic Controls on the Coal-Bearing Lower to Middle Jurassic Yan’an Formation, Southern Ordos Basin, China. Geology 1989, 17, 1123–1126. [Google Scholar] [CrossRef] [Scilit]
  9. Li, M.; Qiu, L.; Hu, B.; Wang, Y.; He, Z.; Wang, T.; Yang, L. Elemental Geochemical Characteristics and Geological Significance of Sandstone-Type Uranium Deposits in the Yahewan Area, Southern Ordos Basin. World Nucl. Geosci. 2023, 40, 924–939. [Google Scholar]
  10. Yang, P.; Ren, Z.; Fu, J.; Bao, H.; Xiao, H.; Shi, Z.; Wang, K.; Zhang, Y.; Liu, W.; Li, W. A Tectono-Thermal Perspective on the Petroleum Generation, Accumulation and Preservation in the Southern Ordos Basin, North China. Pet. Sci. 2024, 21, 1459–1473. [Google Scholar] [CrossRef] [Scilit]
  11. Zou, C.N.; Yang, Z.; Tao, S.Z.; Yuan, X.J.; Zhu, R.K.; Hou, L.H.; Wu, S.T.; Sun, L.; Zhang, G.S.; Bai, B.; et al. Continuous Hydrocarbon Accumulation over a Large Area as a Distinguishing Characteristic of Unconventional Petroleum: The Ordos Basin, North-Central China. Earth-Sci. Rev. 2013, 126, 358–369. [Google Scholar] [CrossRef] [Scilit]
  12. Ju, Y.; Hou, X.; Zou, C.; Yang, Z.; Wei, Q.; Lyu, Q.; Tao, L.; Qiao, P.; Xiao, L.; Wang, P.; et al. Conventional-Unconventional Energy and Mineral Resources Coexisting Systems of Cratonic Basins in China. Renew. Sustain. Energy Rev. 2026, 226, 116423. [Google Scholar] [CrossRef] [Scilit]
  13. Zhang, S.; Liu, C.; Yang, M.; Bai, J.; Wang, J. Latest Triassic to Early Jurassic Thrusting and Exhumation in the Southern Ordos Basin, North China: Evidence from LA-ICP-MS-based Apatite Fission Track Thermochronology. Acta Geol. Sin. Engl. Ed. 2018, 92, 1334–1348. [Google Scholar] [CrossRef] [Scilit]
  14. Akhtar, S.; Yang, X.; Pirajno, F. Sandstone Type Uranium Deposits in the Ordos Basin, Northwest China: A Case Study and an Overview. J. Asian Earth Sci. 2017, 146, 367–382. [Google Scholar] [CrossRef] [Scilit]
  15. Xue, C.; Chi, G.; Xue, W. Geochemical Evidence and Hydrodynamic Modeling of Two Fluid Systems Involved in Sandstone-Hosted Uranium Mineralization in the Northeast of the Ordos Basin, China. J. Geochem. Explor. 2009, 101, 117. [Google Scholar] [CrossRef] [Scilit]
  16. Wang, W.; Cui, J.; Cao, Z.; Yang, P.; Tian, T.; Ren, Z.; Li, H.; Guo, K. Fission-track analysis of uplift times and processes of the Weibei Uplift in the Ordos Basin. Chin. Sci. Bull. 2015, 60, 1298–1309. [Google Scholar] [CrossRef] [Scilit]
  17. Li, Z.; Chen, A.; Fang, X.; Ou, G.; Xia, Y.; Sun, Y. Origin and Superposition Metallogenic Model of the Sandstone-type Uranium Deposit in the Northeastern Ordos Basin, China. Acta Geol. Sin. Engl. Ed. 2008, 82, 745–749. [Google Scholar] [CrossRef] [Scilit]
  18. Yu, Q.; Ren, Z.; Li, R.; Chung, L.; Tao, N.; Cui, J.; Wang, B.; Qi, K.; Khaled, A. Cooling History of the Southwestern Ordos Basin (Northern China) since Late Jurassic: Insights from Thermochronology and Geothermometry. J. Asian Earth Sci. 2021, 219, 104895. [Google Scholar] [CrossRef] [Scilit]
  19. Meng, Q.; Hu, J.; Jin, J.; Zhang, Y.; Xu, D. Tectonics of the Late Mesozoic Wide Extensional Basin System in the China–Mongolia Border Region. Basin Res. 2003, 15, 397–415. [Google Scholar] [CrossRef] [Scilit]
  20. Bao, H.; Guo, W.; Liu, G.; Li, L.; Wu, C.Y.; Bai, H. Tectonic evolution in the southern Ordos block and its significance in the tectono-depositional differentiation in the interior of the Ordos Basin. Chin. J. Geol. 2020, 55, 703–725. [Google Scholar]
  21. Cheng, Y.; Petrov, V.; Jin, R.; Miao, P. Neotectonic Controls on Large-Scale Uranium Mineralization in the Meso-Cenozoic Basins, Northern China. Ore Geol. Rev. 2025, 176, 106393. [Google Scholar] [CrossRef] [Scilit]
  22. Cheng, Y.; Jin, R.; Cuney, M.; Petrov, V.A.; Miao, P. The strata constraint on large-scale sandstone-type uranium mineralization in Meso-Cenozoic basins, northern China. Acta Geol. Sin. 2024, 98, 1953–1976. [Google Scholar] [CrossRef]
  23. Pearce, N.J.G.; Perkins, W.T.; Westgate, J.A.; Gorton, M.P.; Jackson, S.E.; Neal, C.R.; Chenery, S.P. A Compilation of New and Published Major and Trace Element Data for NIST SRM 610 and NIST SRM 612 Glass Reference Materials. Geostand. Newsl. 1997, 21, 115–144. [Google Scholar] [CrossRef] [Scilit]
  24. Liu, Y.; Hu, Z.; Gao, S.; Günther, D.; Xu, J.; Gao, C.; Chen, H. In Situ Analysis of Major and Trace Elements of Anhydrous Minerals by LA-ICP-MS Without Applying an Internal Standard. Chem. Geol. 2008, 257, 34–43. [Google Scholar] [CrossRef] [Scilit]
  25. Sun, S.-S.; McDonough, W.F. Chemical and Isotopic Systematics of Oceanic Basalts: Implications for Mantle Composition and Processes. In Magmatism in the Ocean Basins; Geological Society Special Publication: London, UK, 1989; Volume 42, pp. 313–345. [Google Scholar] [CrossRef] [Scilit]
  26. Taylor, S.; McLennan, S. The Continental Crust: Its Composition and Evolution; Blackwell Scientific Publications: Oxford, UK, 1985. [Google Scholar]
  27. Steadman, J.A.; Large, R.R.; Olin, P.H.; Danyushevsky, L.V.; Meffre, S.; Huston, D.; Fabris, A.; Lisitsin, V.; Wells, T. Pyrite Trace Element Behavior in Magmatic-Hydrothermal Environments: An LA-ICPMS Imaging Study. Ore Geol. Rev. 2021, 128, 103878. [Google Scholar] [CrossRef] [Scilit]
  28. Liu, S.; Zhang, Y.; Ai, G.; Xue, X.; Li, H.; Shah, S.A.; Wang, N.; Chen, X. LA-ICP-MS Trace Element Geochemistry of Sphalerite: Metallogenic Constraints on the Qingshuitang Pb–Zn Deposit in the Qinhang Ore Belt, South China. Ore Geol. Rev. 2022, 141, 104659. [Google Scholar] [CrossRef] [Scilit]
  29. Keith, M.; Häckel, F.; Haase, K.M.; Schwarz-Schampera, U.; Klemd, R. Trace Element Systematics of Pyrite from Submarine Hydrothermal Vents. Ore Geol. Rev. 2016, 72, 728–745. [Google Scholar] [CrossRef] [Scilit]
  30. Bajwah, Z.U.; Seccombe, P.K.; Offler, R. Trace Element Distribution, Co:Ni Ratios and Genesis of the Big Cadia Iron-Copper Deposit, New South Wales, Australia. Miner. Depos. 1987, 22, 292–300. [Google Scholar] [CrossRef] [Scilit]
  31. Abraitis, P.K.; Pattrick, R.A.D.; Vaughan, D.J. Variations in the Compositional, Textural and Electrical Properties of Natural Pyrite: A Review. Int. J. Miner. Process. 2004, 74, 41–59. [Google Scholar] [CrossRef] [Scilit]
  32. Bralia, A.; Sabatini, G.; Troja, F. A Revaluation of the Co/Ni Ratio in Pyrite as Geochemical Tool in Ore Genesis Problems. Miner. Depos. 1979, 14, 353–374. [Google Scholar] [CrossRef] [Scilit]
  33. Vukas, R. Basic Structural and Geological Features of the Stolovac Uranium Mineral Occurrence, Eastern Serbia. Resour. Geol. 2007, 57, 338–346. [Google Scholar] [CrossRef] [Scilit]
  34. Chalapathi Rao, N.V.; Anand, M.; Dongre, A.; Osborne, I. Carbonate Xenoliths Hosted by the Mesoproterozoic Siddanpalli Kimberlite Cluster (Eastern Dharwar Craton): Implications for the Geodynamic Evolution of Southern India and Its Diamond and Uranium Metallogenesis. Int. J. Earth Sci. Geol. Rundsch. 2010, 99, 1791–1804. [Google Scholar] [CrossRef] [Scilit]
  35. René, M. Anomalous Rare Earth Element, Yttrium and Zirconium Mobility Associated with Uranium Mineralization. Terra Nova 2008, 20, 52–58. [Google Scholar] [CrossRef] [Scilit]
  36. Bau, M. Rare-Earth Element Mobility during Hydrothermal and Metamorphic Fluid-Rock Interaction and the Significance of the Oxidation State of Europium. Chem. Geol. 1991, 93, 219–230. [Google Scholar] [CrossRef] [Scilit]
  37. Song, H. Micro-XRF Analysis on the Relationship between Pyrite and Uranium Mineralization in Sandstone-Hosted Uranium Deposits. At. Spectrosc. 2023, 44, 450–458. [Google Scholar] [CrossRef] [Scilit]
  38. Rallakis, D.; Michels, R.; Cathelineau, M.; Parize, O.; Brouand, M. Conditions for Uranium Biomineralization During the Formation of the Zoovch Ovoo Roll-Front-Type Uranium Deposit in East Gobi Basin, Mongolia. Ore Geol. Rev. 2021, 138, 104351. [Google Scholar] [CrossRef] [Scilit]
  39. Ingles, C.; Mavrogenes, J.; Wang, Y.; Cherdantseva, M.; Saxey, D.; Fougerouse, D. Biogenic Sphalerite Signatures and pH-Dependent Precipitation Pathways. Appl. Geochem. 2026, 197, 106677. [Google Scholar] [CrossRef] [Scilit]
  40. Canfield, D.E. Biogeochemistry of Sulfur Isotopes. Rev. Mineral. Geochem. 2001, 43, 607–636. [Google Scholar] [CrossRef] [Scilit]
  41. Liu, Y.; Jiang, B.; Zhao, J.; Fan, Z.; Xu, P.; Zhu, X.; Zhang, Y. Genesis and Mineral Exploration of the Daqishan Lead-Zinc Deposit, Beishan Orogenic Belt, NW China: Constraints from In-Situ Trace Element Compositions of Sphalerite, Pyrite, and Chalcopyrite. J. Asian Earth Sci. 2026, 300, 106981. [Google Scholar] [CrossRef] [Scilit]
  42. Tang, Y.; Sun, D.; Gou, J.; Ni, X.; Zeng, X.; Zhang, X.; Liu, W.; Liang, S.; Deng, C. Chalcopyrite Geochemistry: Advancements and Implications in Ore Deposit Research. Ore Geol. Rev. 2025, 179, 106528. [Google Scholar] [CrossRef] [Scilit]
  43. Shen, C.-C.; Lawrence Edwards, R.; Cheng, H.; Dorale, J.A.; Thomas, R.B.; Bradley Moran, S.; Weinstein, S.E.; Edmonds, H.N. Uranium and Thorium Isotopic and Concentration Measurements by Magnetic Sector Inductively Coupled Plasma Mass Spectrometry. Chem. Geol. 2002, 185, 165–178. [Google Scholar] [CrossRef] [Scilit]
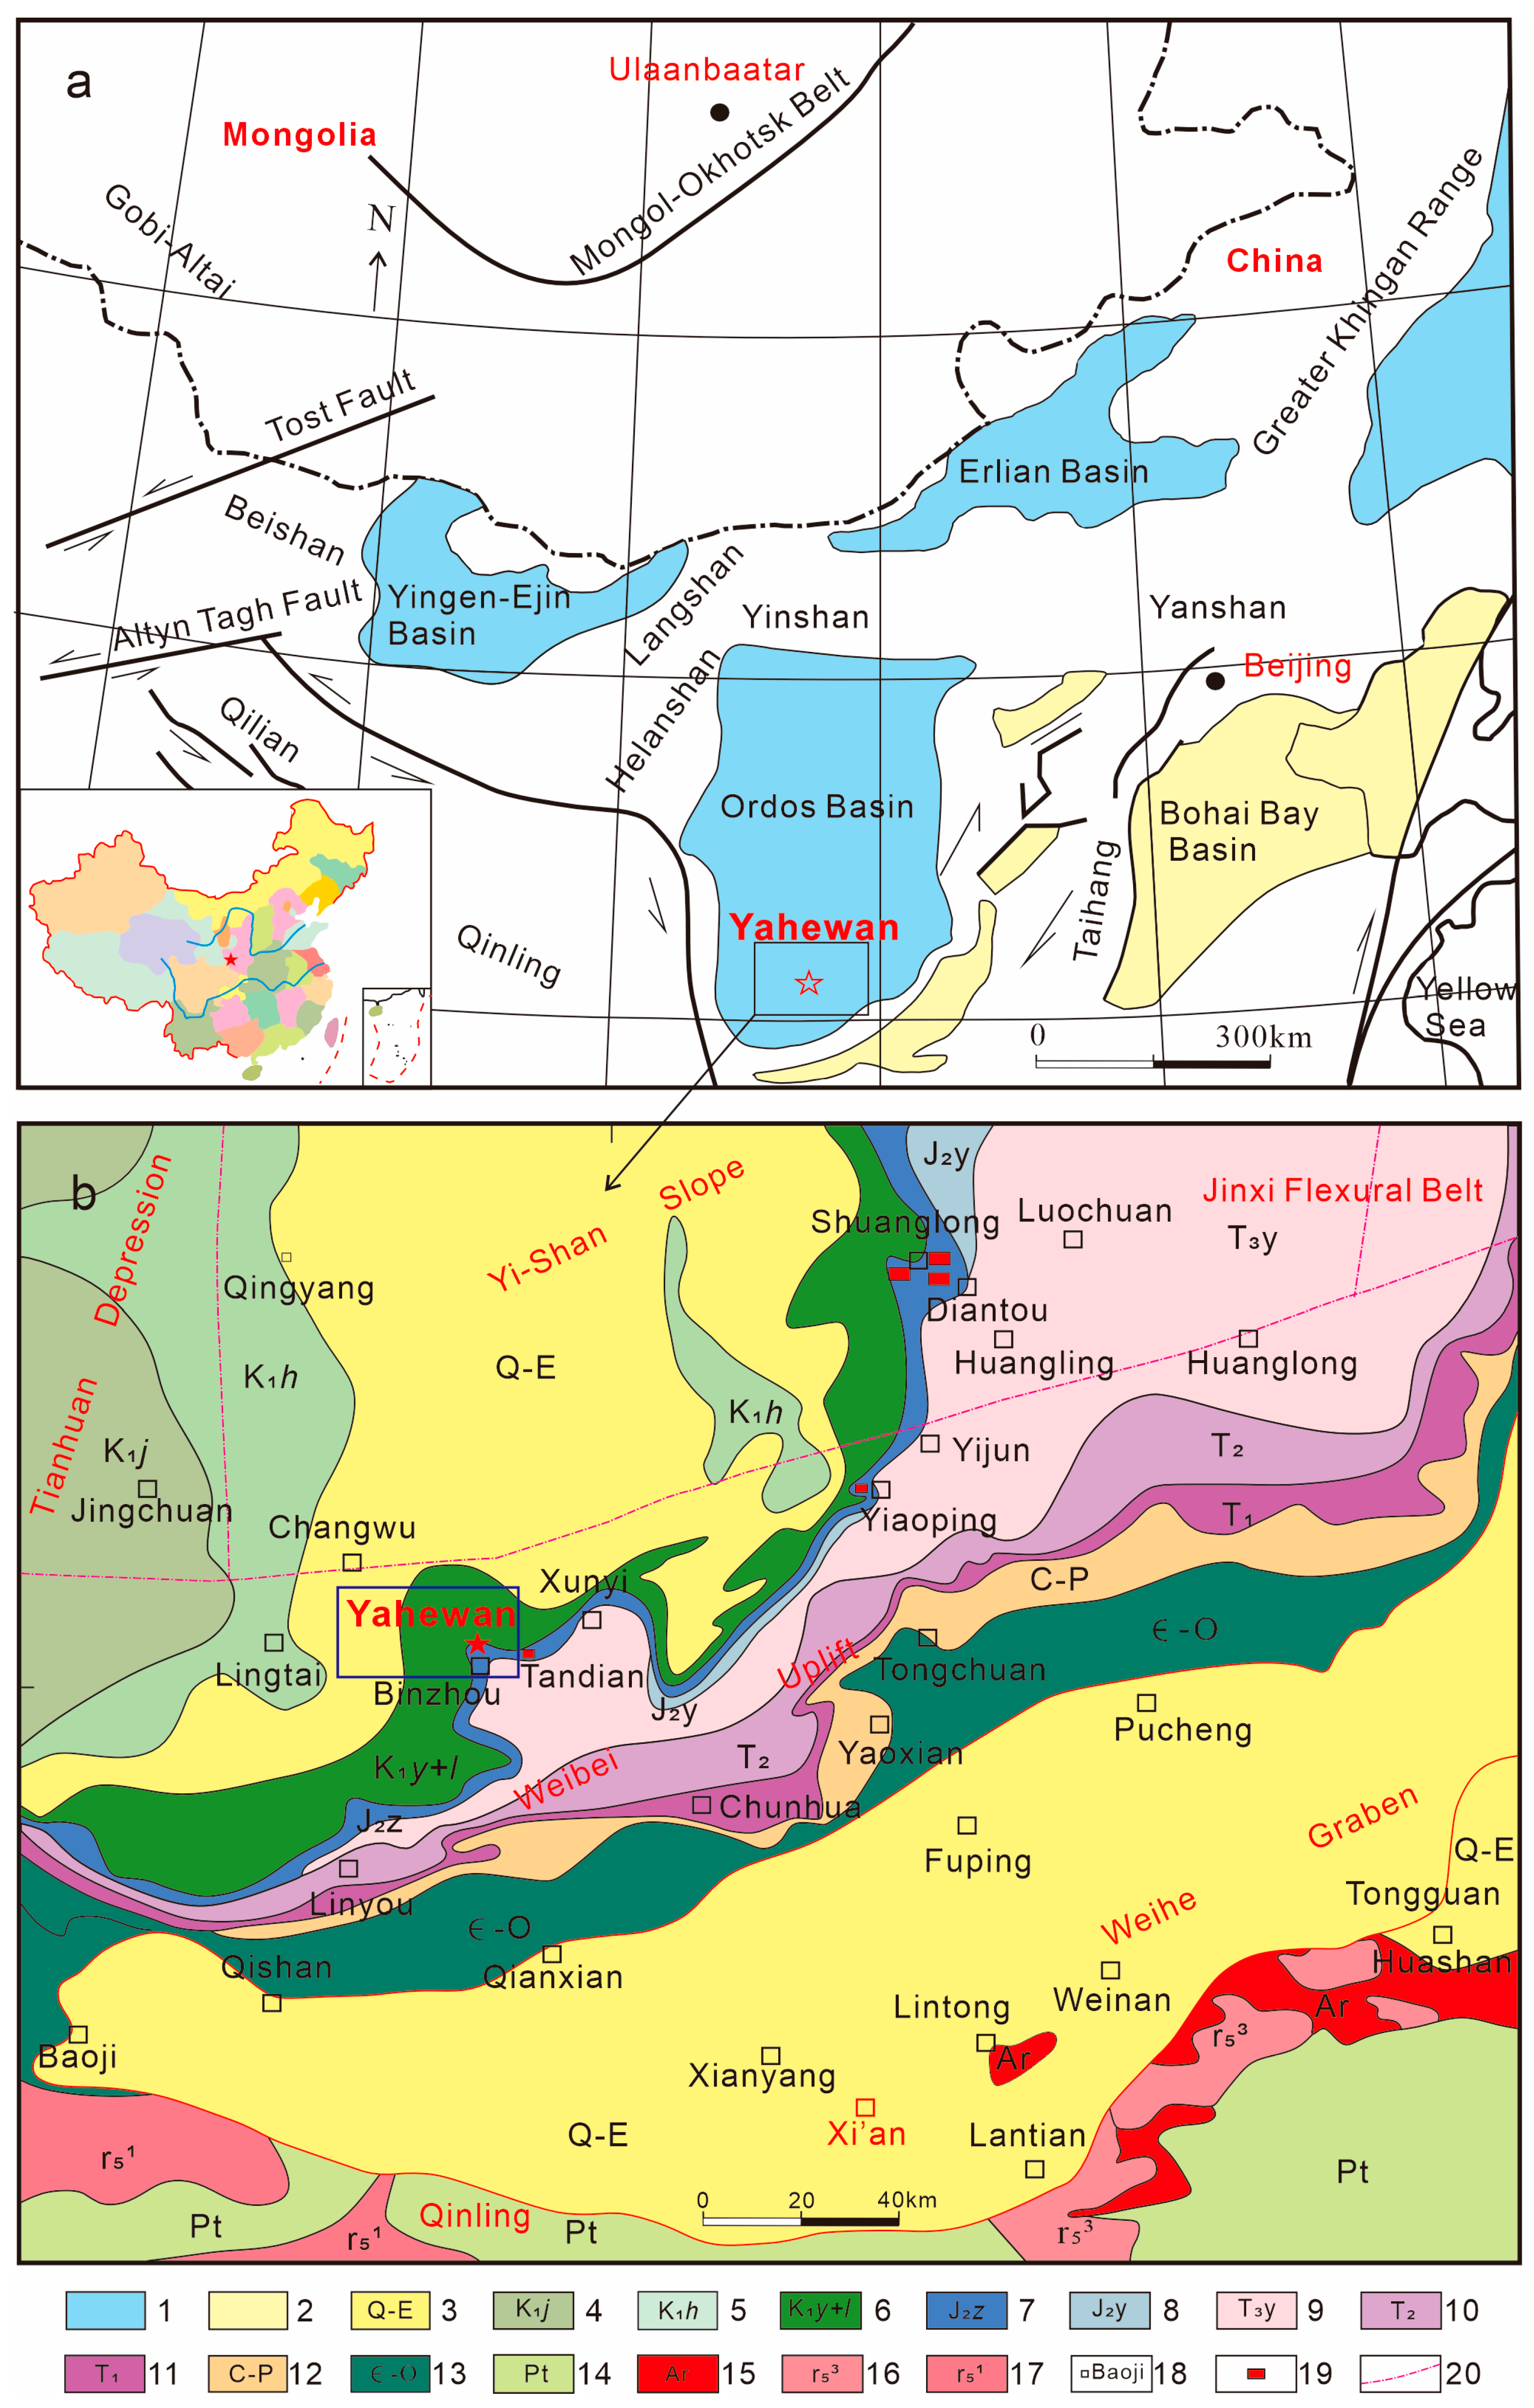
Figure 1. Regional geological map and distribution of uranium deposits in the study area (a) modified from Meng et al. (2003) [19]; (b) modified from Bao et al. (2020) [20]; (1) Mesozoic basin; (2) Cenozoic basin; (3) Quaternary–Paleogene; (4) Lower Cretaceous Jingchuan Formation; (5) Lower Cretaceous Huanhe Formation; (6) Lower Cretaceous Yijun–Luohe formations; (7) Middle Jurassic Zhiluo Formation; (8) Middle Jurassic Yan’an Formation; (9) Upper Triassic Yanchang Formation; (10) Middle Triassic; (11) Lower Triassic; (12) Pre-Permian; (13) Cambrian–Ordovician; (14) Precambrian; (15) Huashan Pluton; (16) Yanshanian granite; (17) Indosinian granite; (18) Location; (19) Sandstone-hosted uranium deposit; (20) Boundary of tectonic units.
Minerals 16 00785 g001
Figure 2. Characteristics of the ore bodies in the Yahewan uranium deposit: (1) Oxidation zone; (2) Transition zone; (3) Reduction zone; (4) Geochemical zonation boundary; (5) Economic ore borehole; (6) Mineralized borehole; (7) Anomaly borehole; (8) Barren borehole; (9) Location of Yahewan Village; (10) Inferred economic orebody.
Minerals 16 00785 g002
Figure 3. Petrographic characteristics of representative samples from the Zhiluo Formation in the Yahewan uranium deposit: (a) Grayish-white uranium-rich drill core segment; (b) hand specimen of pyrite-bearing, grayish-white, uranium-rich fine-pebbly coarse sandstone; (c) hand specimen of grayish-white medium-grained sandstone rich in carbonaceous debris; (d) pyrite filling the intergranular pores between detrital grains, transmitted light; (e) pyrite occurring along the cleavage planes of biotite, transmitted light; (f) pyrite filling the intergranular spaces between detrital grains, reflected light; (g) pyrite distributed along the margins of carbonaceous bands, reflected light; (h) pyrite developing on both sides of carbonaceous debris, reflected light; (i) paragenetic association of pyrite and coffinite or coffinite-like U-silicate minerals, SEM-BSE image. Py = pyrite; Bt = biotite; Cof = coffinite.
Minerals 16 00785 g003
Figure 4. Microscopic characteristics and main types of pyrite in the Yahewan uranium deposit. (a) Pore-filling pyrite occurring as colloidal, irregular massive, and locally cubic crystals within intergranular spaces, BSE image; (b) disseminated pyrite within quartz interstices and secondary dissolution pores related to feldspar alteration, reflected light; (c) pyrite filling mechanical fractures in quartz, reflected light; (d) cubic pyrite closely associated with fine-grained clay-mineral aggregates within intergranular pores, BSE image; (e) fine spherical and framboidal pyrite developed within micropores and along the margins of carbonaceous debris, reflected light; (f) spherical pyrite associated with clay-mineral aggregates adjacent to carbonaceous debris; (g) pyrite associated with organic matter and carbonate cement; (h) spherical and bead-like pyrite aligned along the cleavage planes of biotite; (i) vein-like pyrite filling micro-fractures and cross-cutting quartz grains. Py = pyrite; Bt = biotite; Q = quartz; Cal = calcite; Fsp = feldspar; Clay = clay-mineral aggregates.
Minerals 16 00785 g004
Figure 5. SEM-BSE images showing the spatial association between uranium minerals and pyrite. (a) Uranium minerals adhering to the margins of colloidal pyrite; (b) uranium minerals locally enclosed by or intergrown with pyrite; (c) uranium minerals filling micro-fractures within coarse-grained pyrite; (d) uranium minerals occurring in pyrite-rich domains and microfractures. Cof = coffinite or coffinite-like U-silicate minerals; Py = pyrite; Q = quartz.
Minerals 16 00785 g005
Figure 6. Chondrite-normalized REE distribution patterns of pyrite. Chondrite values are from Sun and McDonough [25].
Minerals 16 00785 g006
Figure 7. Co-Ni distribution diagram of pyrite from the Yahewan uranium deposit.
Minerals 16 00785 g007
Figure 8. Binary scatter plots showing covariation trends among U, W, V, Se, Co, and Ni in pyrite. (a) U versus W; (b) U versus V; (c) U versus Se; (d) Co versus Ni. rho represents Spearman’s correlation coefficient, and n represents the number of data points.
Minerals 16 00785 g008
Figure 9. Scatter plots showing covariation trends of As with U and Fe in pyrite. (a) As versus U; (b) As versus Fe. Spearman rho represents Spearman’s correlation coefficient, n represents the number of data points, and the arrows indicate the overall covariation trends.
Minerals 16 00785 g009
Figure 10. Frequency distribution histogram of δ34SV-CDT values.
Minerals 16 00785 g010
Figure 11. Comparison of δ34SV-CDT values of Yahewan pyrite with typical sulfur reservoirs. Black, blue, and light-green bars represent the ranges of meteorite and mantle-magmatic sulfur, marine sulfate and biogenic H2S, and sedimentary sulfide, respectively. Vertical ticks represent individual Yahewan pyrite analyses, and the black curve shows their distribution trend. Data sources: References [37,38].
Minerals 16 00785 g011
Table 1. EPMA data of uranium minerals paragenetic with pyrite.
SampleSpotAnalytical Results (wt.%)Type
UO2SiO2Y2O3CaOMgOFeOP2O5Al2O3TiO2Others *Total
0-9-2163.8414.362.361.250.020.190.630.870.30.3384.15Cof
267.212.12.331.650.020.550.570.70.060.6885.86
352.8612.892.51.180.17.340.651.017.490.2286.24
462.1417.181.231.980.090.440.841.120.160.9486.12
559.1119.811.482.210.311.360.822.210.242.990.45
657.3718.442.142.130.260.970.652.140.292.5686.95
0-9-3148.9413.582.532.2310.810.52.170.450.8273.03
252.0318.442.472.180.640.940.722.970.491.1682.04
357.9219.182.11.840.20.270.440.360.390.7683.46
443.5817.471.772.380.470.340.923.110.842.8373.71
539.612.262.191.980.930.50.682.720.241.7162.81
647.5114.082.751.270.113.410.910.18-0.1180.32
748.2914.892.31.220.1413.331.040.2-0.5281.93
847.6214.942.291.250.1413.171.130.18-0.6781.39
Max 67.219.812.752.38113.411.133.117.492.990.45
Min 39.612.11.231.180.020.190.440.180.060.1162.81
Avg 53.4315.692.171.770.323.830.751.420.991.2080.73
* Others includes trace amounts of MnO, PbO, V2O3, Gd2O3, ReO2, Sc2O3, CoO, NiO, Na2O, K2O, ThO2, MoO3, Cof = coffinite.
Table 2. Rare earth element compositions of pyrite.
Sam0-9-20-9-386-4-686-4-7
Ore sampleOre sampleOre sampleBarren sample
Dep680 m681 m318 m322 m
StraJ2z1
LithLight grayish-white pebbly coarse sandstone
Element1-11-21-31-41-51-62-33-14-14-24-3
La2.3122.400.566.02306.890.570.383.5722.375.561.24
Ce5.90114.842.6835.78992.676.672.147.9153.929.813.14
Pr1.4717.070.575.92248.591.300.511.066.640.990.31
Nd4.3070.331.6922.661073.823.622.874.3928.033.940.88
Sm1.4020.850.535.95319.700.861.420.598.830.950.22
Eu0.364.510.151.8984.580.480.240.173.960.300.06
Gd1.2818.870.567.13337.060.891.500.6418.400.680.18
Tb0.403.400.111.0563.240.200.180.094.050.120.03
Dy1.7723.130.7410.64390.541.291.140.5133.240.600.20
Ho0.304.160.111.4074.260.350.150.088.810.180.06
Er1.0211.950.324.18204.710.890.870.2430.450.440.13
Tm0.171.980.050.5530.800.160.070.034.670.060.02
Yb0.7410.570.184.15177.980.640.920.1733.470.310.11
Lu0.121.550.030.5124.940.280.060.015.310.060.02
Y5.8983.102.2233.451394.785.966.591.93321.283.631.33
Note: The REE contents of analyses 2-1 and 2-2 from sample 0-9-3, analyses 3-2 and 3-3 from sample 86-4-6, and all analyses from sample 106-1-5 are generally low; these data are therefore not listed or included in the statistical calculations.
Table 3. Sulfur isotope compositions of pyrite.
SampleSpotδ34SV-CDT
(‰)
SampleSpotδ34SV-CDT
(‰)
0-9-210.2986-4-712.10
2−17.01 2−9.61
86-4-61−17.87 31.97
2−24.22 4−20.97
3−19.63 5−22.45
413.69106-1-5134.87
513.78 235.46
613.34 336.06
713.40 427.07
811.96 530.65
9−27.49 631.88
10−26.20 720.75
11−12.14 828.84
12−16.54 932.48
13−18.74 1035.10
14−5.64 1117.53
15−14.64 126.87
16−19.05max36.06
17−22.74min−27.49
18−26.50
Disclaimer/Publisher’s Note: The statements, opinions and data contained in all publications are solely those of the individual author(s) and contributor(s) and not of MDPI and/or the editor(s). MDPI and/or the editor(s) disclaim responsibility for any injury to people or property resulting from any ideas, methods, instructions or products referred to in the content.