Article

PhotonAssay™: Reporting Code Disclosure and the Route to Technology Adoption


by
Simon C. Dominy
1,2,3
1
Novo Resources Corp., Ventnor Avenue, West Perth, WA 6005, Australia
2
E3G Advisory, Church Street, Weybridge, Surrey KT13 8NA, UK
3
Camborne School of Mines, University of Exeter, Penryn, Cornwall TR10 9FE, UK
Minerals 2026, 16(7), 751; https://doi.org/10.3390/min16070751
Submission received: 9 April 2026 / Revised: 12 July 2026 / Accepted: 14 July 2026 / Published: 18 July 2026
(This article belongs to the Section Mineral Exploration Methods and Applications)

Abstract

PhotonAssay™ is a rapid, non-destructive gold assay method that analyses large-mass crushed or pulverised samples while reducing turnaround time, hazardous reagent use, and environmental footprint relative to conventional fire assay. Its growing adoption, however, has exposed a persistent misconception, that CRIRSCO-based reporting codes approve certain analytical methods as being “compliant.” This paper clarifies the reporting position for PhotonAssay™ and outlines the key requirements for its use in Exploration Results, Mineral Resource, and Ore/Mineral Reserve reporting, including sampling context, preparation protocol, quality assurance/quality control and method validation. It also frames adoption as a four-stage journey—awareness, consideration, intent, and implementation—in which peer learning, testwork, business-case development, and deployment planning are as important as analytical performance. Particular attention is given to representative sampling and to interpreting differences from fire assay, especially in coarse-gold systems where larger assay charges are likely to yield more representative results. Two test methods are recommended, the transitional feasibility study (bias between assay methods) and heterogeneity study (bias and precision). The PhotonAssay™ adoption journey is a multidisciplinary process, requiring engagement between practitioners and executives, and between geoscientists, mining and minerals engineers, chemists, data scientists and corporate managers.

1. Introduction and Rationale

1.1. Overview of PhotonAssay™

Gold assays sit at the heart of exploration, resource development, grade control and process-plant decision-making, and therefore must satisfy both technical and reporting requirements. For decades, fire assay (FA) has been the dominant method for gold analysis, but the industry now faces stronger demands for faster turnaround, safer laboratory practice, lower environmental impact, and more representative results in mineralisation styles where heterogeneity can compromise small analytical charges [1,2,3,4].
PhotonAssay™ (Chrysos Corporation, Adelaide, South Australia) has emerged in this context as a rapid, non-destructive analytical method capable of measuring gold, silver and copper in coarse crushed (400–600 g) or pulverised (300–500 g) samples, typically at a rate of about seventy assays per hour [4,5,6,7,8]. The method offers practical advantages over conventional FA, including reduced use of hazardous chemicals, lower staffing intensity, the ability to re-assay the same jarred sample, and materially lower energy use and carbon footprint [9]. In addition, FA samples must be pulverised to assay, whereas PhotonAssay™ samples can be analysed either crushed or pulverised [4,5,6,7,8].
These characteristics have driven rapid industry uptake. PhotonAssay™ is now being applied across the mine value chain, from exploration and resource definition through to grade control and plant control, and across a range of mineralisation styles including systems affected by coarse gold [4,10,11].
Its larger assay mass is particularly attractive where representativity is a concern, because larger charges can reduce the probability of missing rare coarse gold particles relative to conventional 30–50 g FA aliquots [2,3,4,7,10,11,12]. At the same time, the flexibility to assay crushed material directly creates the potential to simplify sample preparation and reduce some sources of sampling error, provided that the full rig-to-assay protocol is properly designed and validated [4,10,11]. Additionally, it has assisted in the development of metallurgical testwork protocols, where its non-destructive nature aids downstream testwork that requires larger sample masses [13].
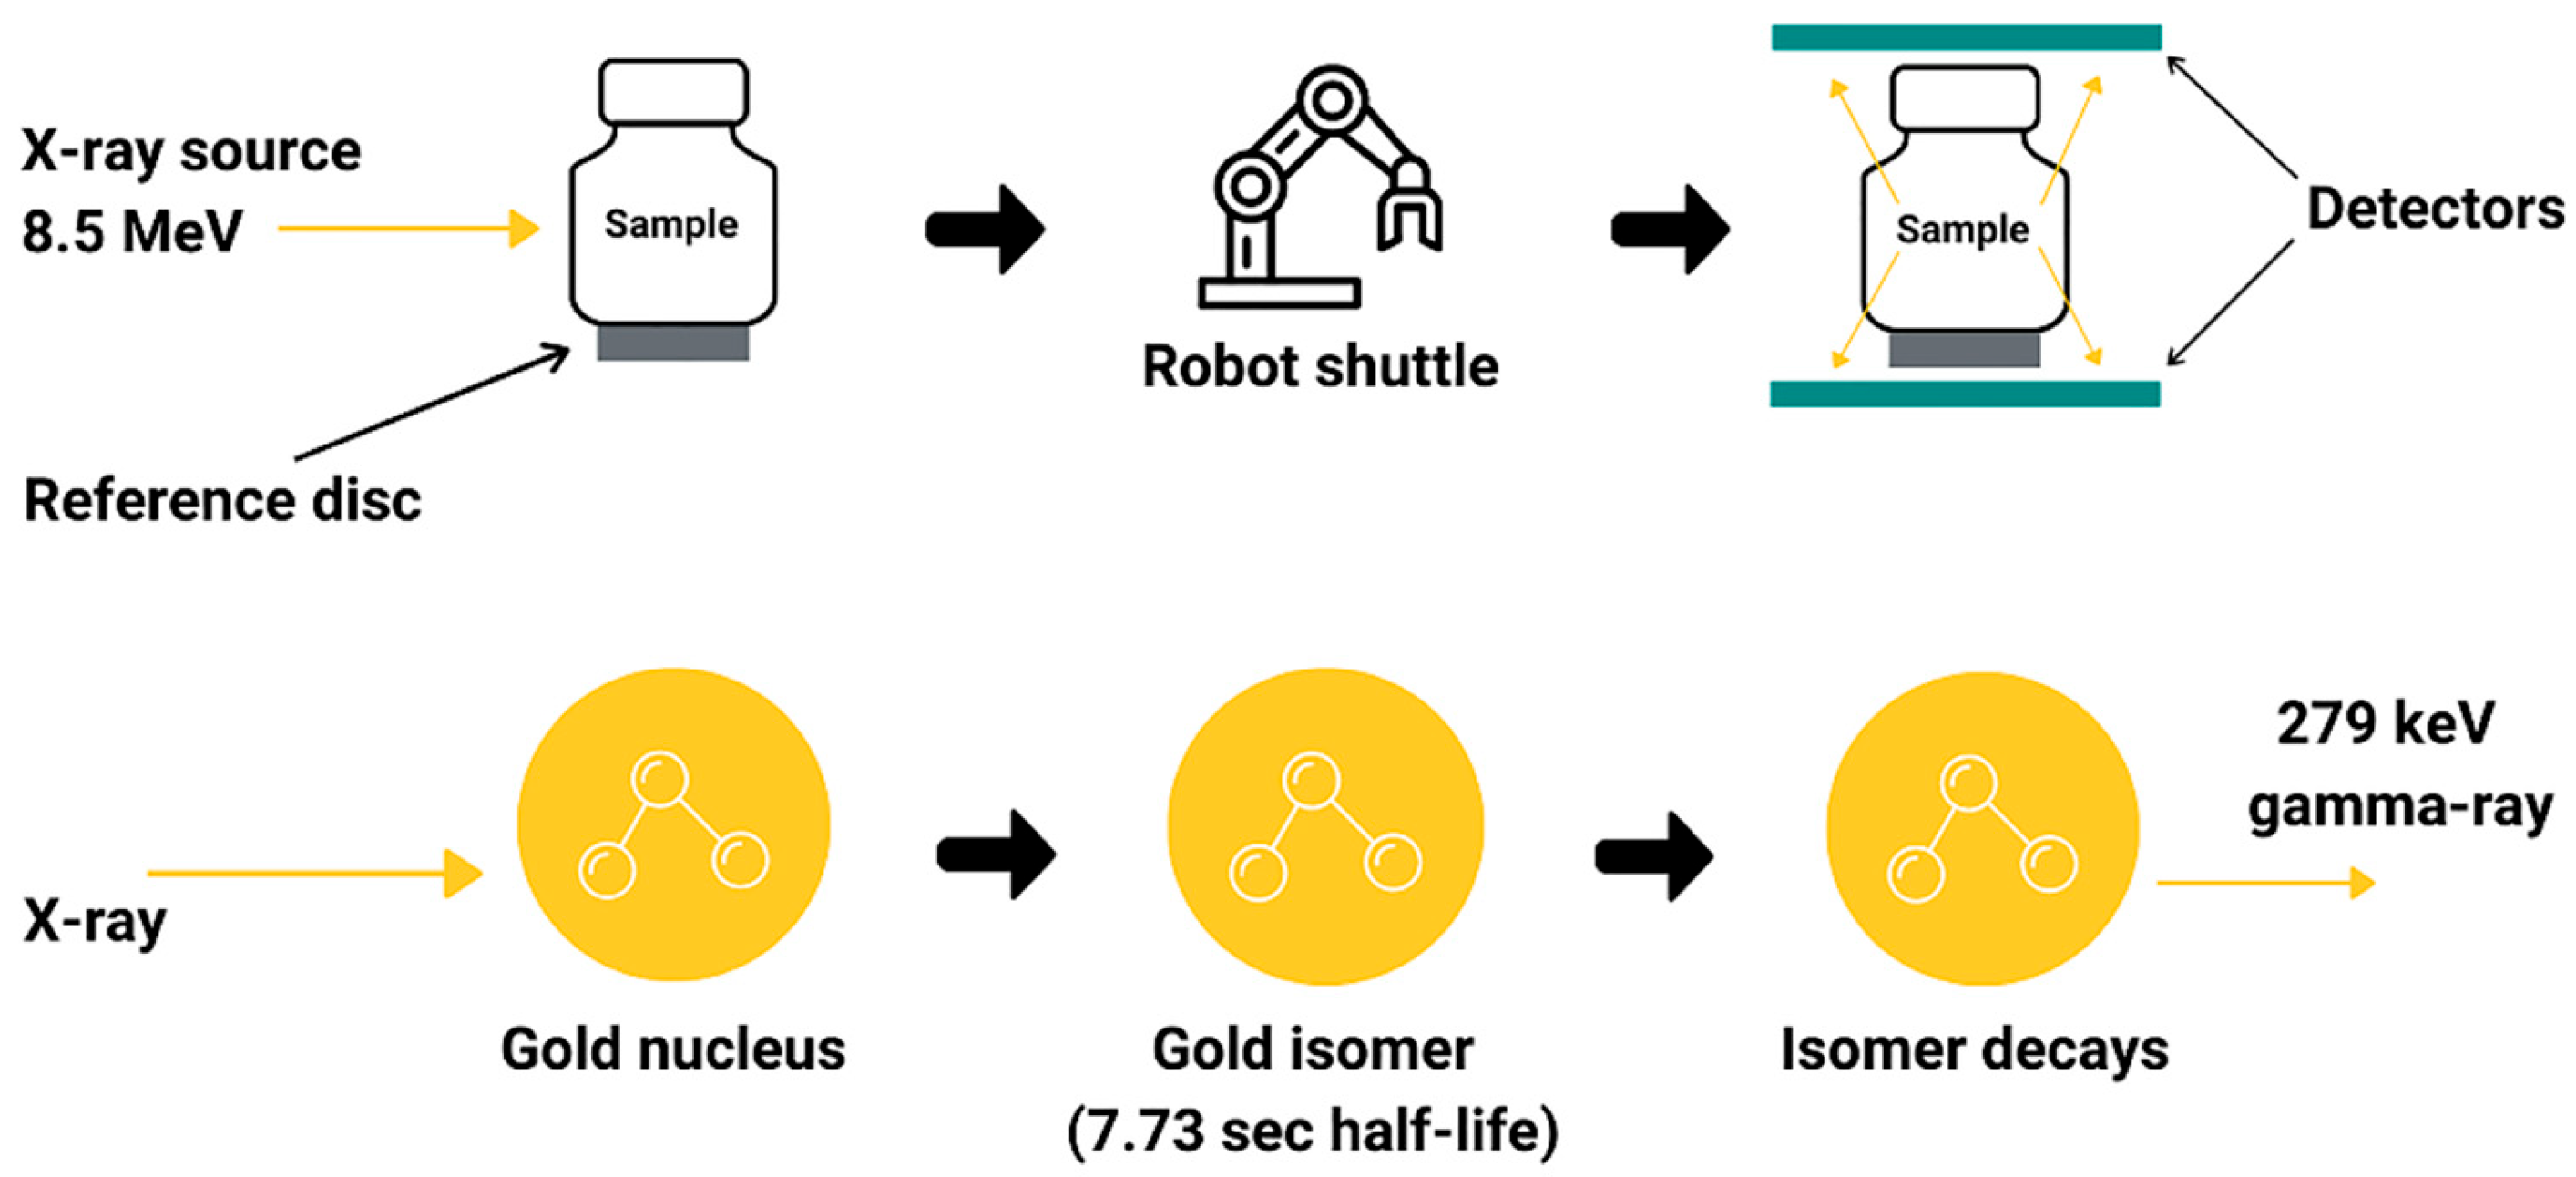
The basic flow of sample jars into the PhotonAssay™ unit is illustrated in Figure 1.
The sample and reference disc are exposed to the same high-energy, high-intensity X-ray beam, typically for 15 s. The high-energy X-rays induce nuclear changes in any gold atoms present in the sample, exciting their atomic nuclei into a short-lived state. When gold nuclei in the sample absorb the high energy X-ray photons created from the linear accelerator, they are transformed into the 197mAu nuclear isomer. This species decays with a half-life of 7.73 s and emits a gamma ray of 279 keV [5,6,7,8].
The sample is transferred to a germanium detector station using a robotic shuttle. As the excited gold nuclei relax back to the ground state, they emit gamma rays with a characteristic “gold energy”. The detectors record and count these gamma rays. Software then relates the strength of the gamma ray signal back to the concentration of gold in the sample, correcting for the sample mass, jar fill level and X-ray attenuation [5,6,7,8]. A standard gold analysis uses two cycles of 15 s (PAAU02), which affords an overall throughput of 70 samples per hour [4,5,6,7,8].
The reference disc contains a bromine compound, which activates in a similar fashion to gold, but emits a lower-energy 207 keV gamma ray. Measurement of the bromine activation signal serves as a reference that can be used to correct for any variations in the power of the X-ray source or efficiency of the detection system. This reference improves measurement accuracy and allows each analysis to be directly tied back to calibration measurements.
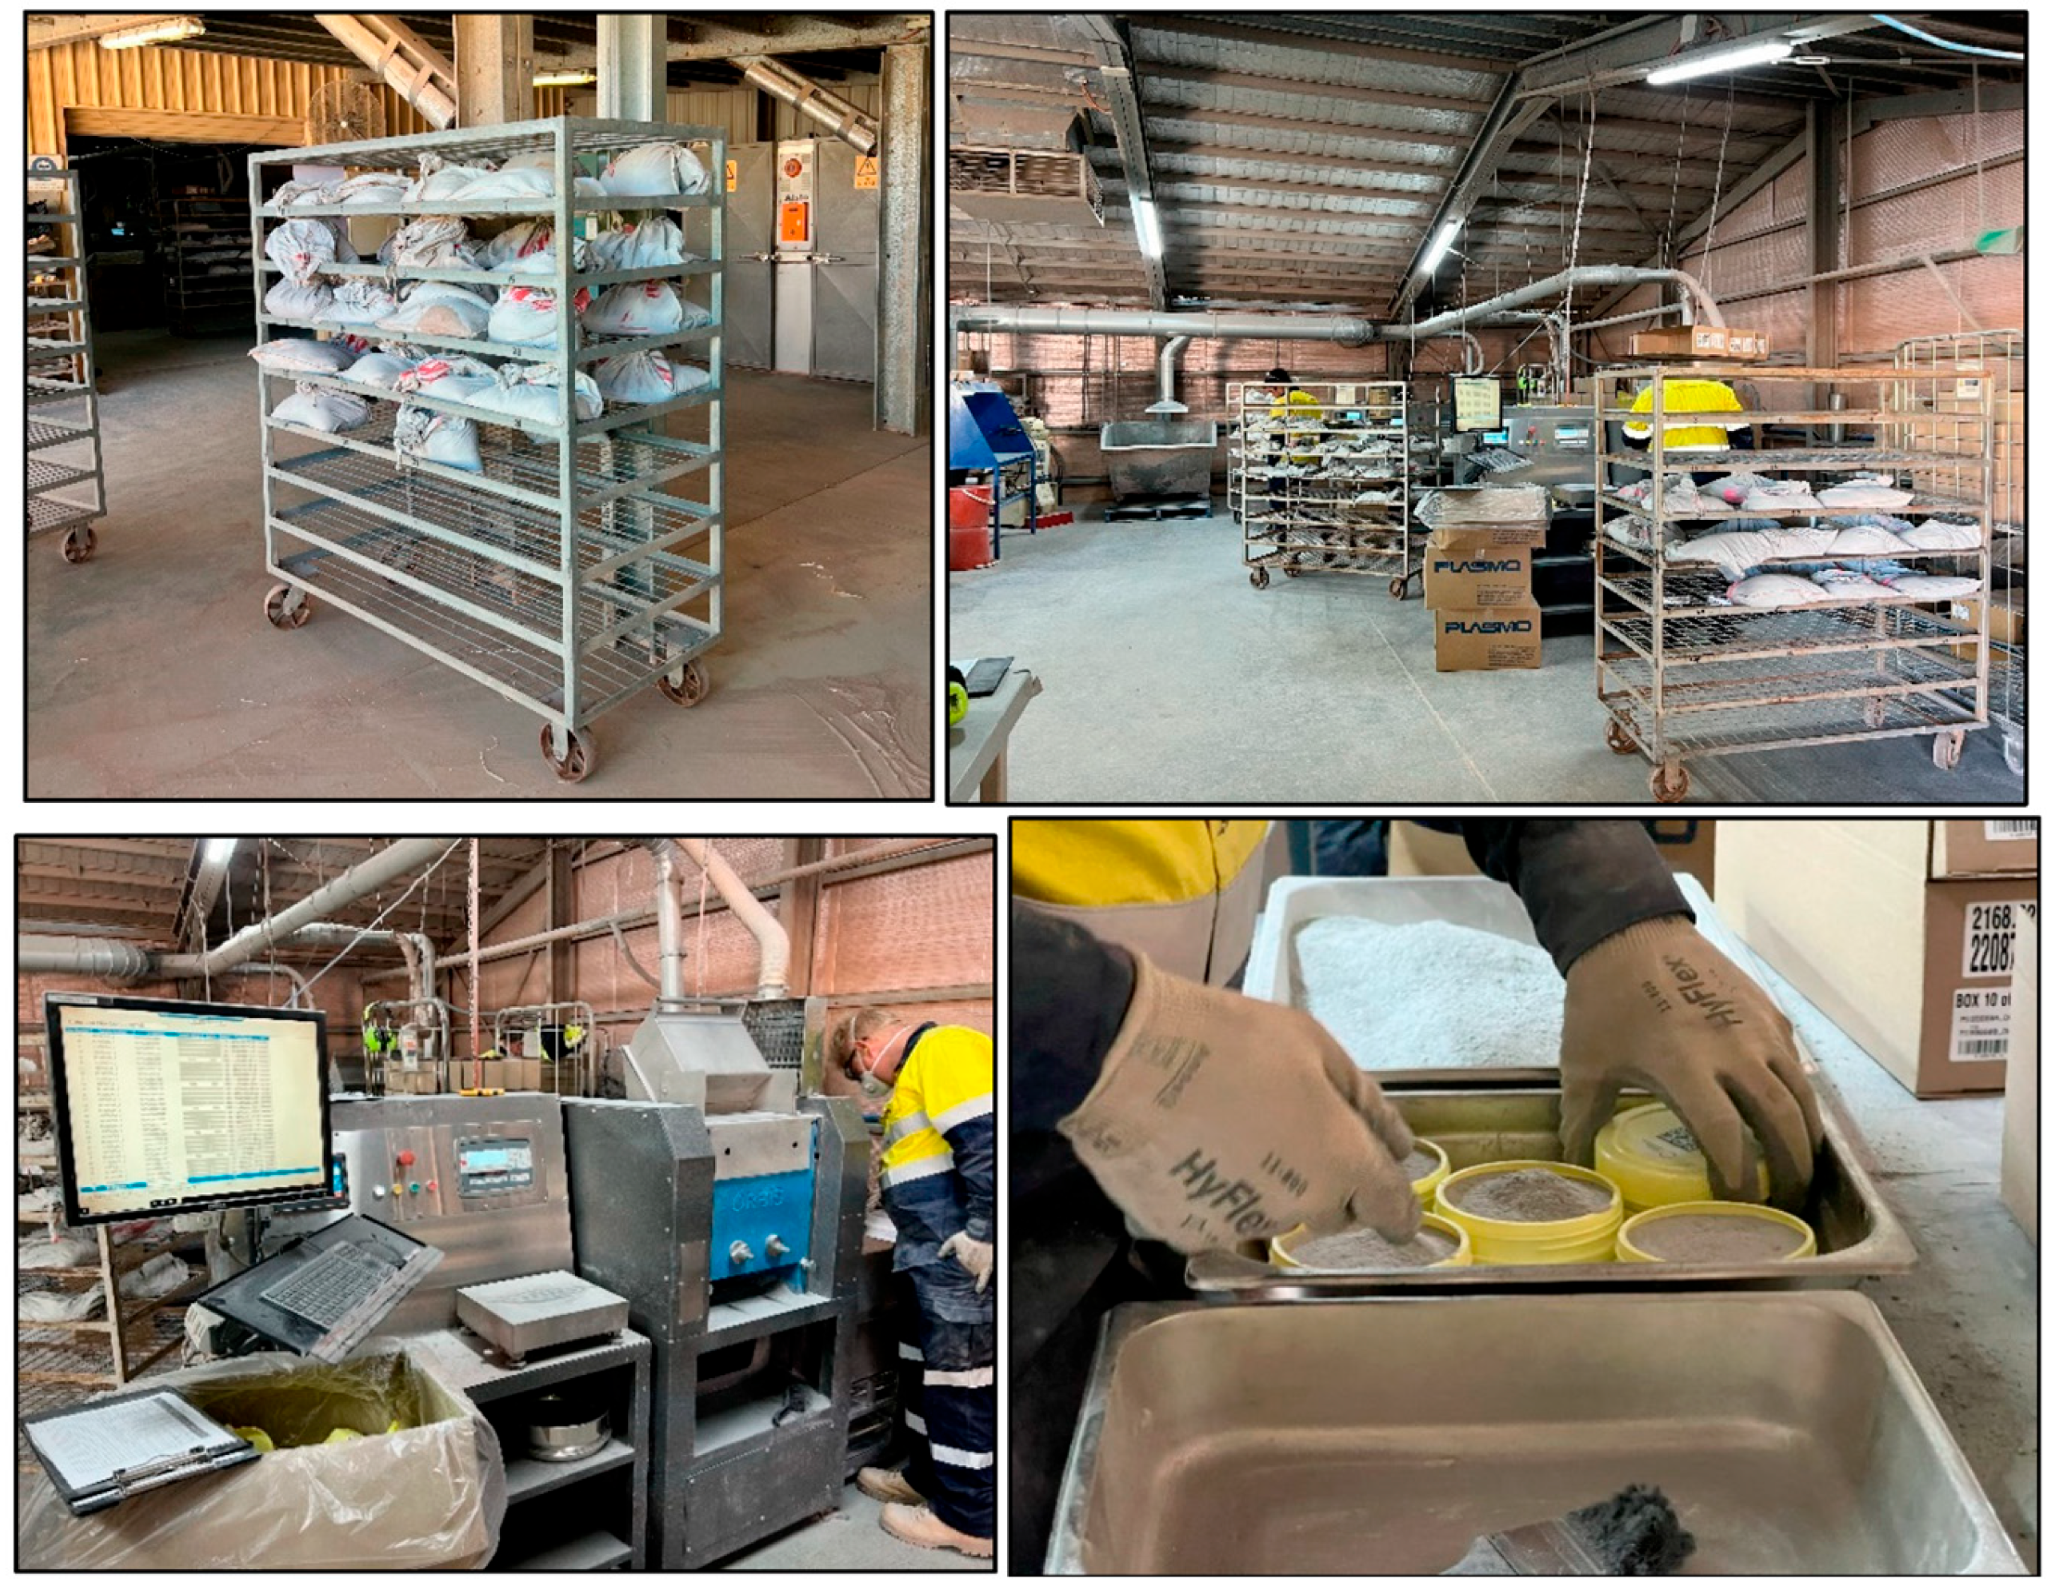
Figure 2 shows a typical laboratory preparation route for PhotonAssay™ samples from receiving and drying, through to crushing and jarring for assay. If pulverisation is mandated, then a pulveriser unit is required (e.g., LM2 or LM5) after the crusher.
The first PhotonAssay™ unit was deployed to a commercial laboratory in Perth, Western Australia during May 2018. In the eight years since launching, an additional 43 units have deployed across the globe (44 in total as of May 2026) [14].

1.2. Rationale of This Contribution

PhotonAssay™ has gained increasing technical and commercial acceptance, yet uncertainty remains over whether it can properly be described as being “JORC compliant” (Joint Ore Reserves Committee [15]), “NI 43-101 compliant” (National Instrument 43-101 [16]) or inherently compliant with any CRIRSCO (Committee for Mineral Resources International Reporting Standards [17])-based reporting code. This contribution argues that this framing is misleading. Reporting codes do not certify analytical methods in isolation; instead, they regulate the transparent, material, and competent disclosure of the methods used and the basis on which results are reported. The relevant issue is therefore not whether PhotonAssay™ is itself compliant, but whether results produced by the method can be reported in accordance with a reporting code when supported by appropriate sampling procedures, sample preparation, quality assurance/quality control (QA/QC), method validation, laboratory verification, and Competent or Qualified Person (CQP) oversight.
This contribution also highlights that adoption of PhotonAssay™ is not simply a technical matter. In practice, implementation is a multidisciplinary organisational process involving geologists, mining and minerals engineers, laboratory specialists, data managers, senior executives, and the CQP(s) responsible for public disclosure. The pathway from first awareness to routine use follows four stages: awareness, consideration, intent, and implementation. Each stage raises distinct questions, including peer comparison, technical due diligence, testwork design, business-case preparation, deployment model selection, and change management.
Accordingly, this contribution sets out two main objectives:
  • To clarify the reporting position of PhotonAssay™ under CRIRSCO-based codes, especially the distinction between method selection and code-compliant disclosure.
  • To outline the practical, technical, commercial, and organisational pathway by which companies evaluate, approve, and embed PhotonAssay™ across the mine value chain (from exploration to production).
This contribution is based on the experience of the author in the design, implementation and review of PhotonAssay™ protocols globally. It is not framed on technology adoption literature. It draws on extensive activity and peer conversations with Chrysos Corporation, consultants, and potential and actual PhotonAssay™ users since 2018. Where appropriate, it presents technical details to complete the discussion. Consideration of the reporting position of PhotonAssay™ and documentation of its adoption route have not been reported elsewhere.

2. Reporting Code Disclosure

2.1. Market Reporting Overview

The fifteen CRIRSCO-based reporting codes and standards explain how listed companies should publicly report Exploration Results, Mineral Resources, and Ore/Mineral Reserves [17]. Their main purpose is to protect investors from misleading or unsupported claims. Some private companies also use these codes for internal reporting. The codes do not define which technical practices are acceptable, and they do not approve specific assay methods. Instead, they focus on making sure results are reported honestly and clearly, and that the CQP uses recognised good industry practice or can justify another approach.
This distinction is important. It is correct to say: “PhotonAssay™ results can be used in reports prepared in accordance with a reporting code.” It is not correct to say: “PhotonAssay™ is code compliant.” The first statement is accurate. The second should be avoided. It is also strongly discouraged by regulators [18].
All reporting codes are built around three main principles:
  • Transparency: information must be clear and unambiguous
  • Materiality: all important information must be included so investors can make informed decisions
  • Competency: reporting must be done by a suitably qualified and experienced CQP
If relevant information is left out, the reason must be explained, through a checklist such as the JORC Code Table 1 [15].
A company must appoint a CQP with the right experience for the work, where the codes provide the definition of the CQP (for example JORC [15] or NI 43-101 [16]). The codes do not prescribe detailed technical expertise beyond the general requirements to act as a CQP. The CQP decides whether they are suitably experienced. Professional organisations are responsible for handling misconduct or ethical breaches through their disciplinary processes. It should be noted that the CQP relates to the company making the release and not the laboratory.
The codes also do not tell the CQP how to sample, assay, estimate resources, or estimate reserves. They do not approve any particular sampling protocol or assay method. What matters is not whether a method is “compliant,” but whether its results can be properly reported under the code with the required disclosure.
For assay reporting, this includes disclosure requirements such as JORC Table 1 Section 3 [15] and Section 3.3 of NI 43-101 [16] or Item 11 of Form 43-101F1 for technical reports [19].
In summary, Exploration Results, Mineral Resources, and Ore/Mineral Reserves do not themselves “comply” with a code. Rather, a company reports them in accordance with a code. The choice of assay method is the responsibility of the CQP, who must stay up to date with available analytical methods and choose the most suitable one for the style of mineralisation and purpose of the work.
Although this discussion focuses on JORC and NI 43-101, the same general approach applies across the other CRIRSCO-based codes. NI 43-101 is a Canadian legal instrument rather than a reporting code itself; its underlying framework is the CIM Standard [20], although it also allows other CRIRSCO-based codes to be used. Both the JORC Code and NI 43-101 (inc. the CIM Standard) are under revision, with updated versions expected in late 2026/early 2027.

2.2. Key Disclosures

2.2.1. Introduction–Key Disclosures

The following sections summarise key disclosure areas that the CQP must consider whilst monitoring programmes that apply PhotonAssay™. Those presented are not intended to be exhaustive and readers are referred to Stanley & Smee [21] and Smee et al. [22] for a detailed discussion on QA/QC. QC actions focus on monitoring accuracy (degree of bias) and reproducibility (precision).

2.2.2. Field Sampling/Sample Preparation and Associated QA/QC

Whilst field/site-based sampling activity is not directly related to PhotonAssayTM, it is important to ensure the integrity of samples through proper drilling techniques; rig/core shed activities; underground sampling; sub-sampling (e.g., core splitting or reverse circulation (RC) splitting); packaging, and chain of custody procedures for onward shipping.
Duplicate sampling programmes document the magnitude of errors (precision) across the sampling process, from field to laboratory (Sampling + Analytical Errors = Total Measurement Error—TME) [21,23]. The key sampling errors as defined by the Theory of Sampling (TOS) are the Fundamental Sampling (FSE) and Grouping and Segregation Errors (GSE) (generators of imprecision) and the Delimitation (DE); Extraction (EE); Preparation (PE) and Analytical Errors (AE) (generators of bias) [24].
Duplicate sample analysis shows that the dominant component of the TME is introduced during primary-sample collection. It is not unusual for the field sampling process to represent ±20%–70%, whereas the preparation stage represents ±5%–20% and analytical stage ±1%–15% of the TME [21,22,23].
As a result, undertaking excessive efforts to reduce errors during preparation and analysis will not necessarily result in substantive error reduction. In contrast, the collection of larger, high-quality field samples will result in significant error reduction provided that other protocols are optimised appropriately. A key QC step during field sampling is therefore the collection of field duplicates, e.g., RC rig splits or half diamond drill core, along with preparation and analytical duplicates at the laboratory so that TME by stage can be evaluated [21,22,23].
In addition, a key QC action is the company submission of Certified Reference Materials (CRM), which monitor analytical accuracy [22]. The choice of CRM is important and should include a range of grades from ten times the Lower Detection Limit (LDL: c. 0.01–0.03 g/t Au for PhotonAssay™), through mining cut-off (a key decision point) to run-of-mine and higher grades. CRMs are usually inserted in the core shed with a sample number prior to shipping, so that they are effectively “blind” to the laboratory. In the case of PhotonAssayᵀᴹ, CRMs are usually pre-jarred (crushed or pulverised) and retained at the laboratory with an instruction from the client to insert a given CRM into the stream at a given point. This is principally driven by the need for larger CRM lots, e.g., 350–500 g as opposed to 30–50 g for FA and the convenience of re-use given the non-destructive nature of PhotonAssay™. Pre-jarred certified coarse CRMs are available for PhotonAssay™ [25].
Whilst the CRIRSCO-based codes do not specify how CRMs should be inserted into the sample stream, NI 43-101 Item 11 does. Submission requires that QC samples be prepared and submitted blind to the laboratory to ensure independent accuracy monitoring. The action of pre-jarred and reused CRMs compromises the independence and effectiveness of QC, as the laboratory knows (or will do ultimately) the expected results, undermining the intent of regulatory guidelines and potentially weakening the reliability of the QA/QC process. Ultimately it is up to the CQP to make a judgement as to how to act. Numerous releases have now been made under NI 43-101 based on pre-jarred and reused CRMs.
CRMs must be jarred using the recommendations of Chrysos to ensure 100% fill [26,27,28] and be re-jarred on/before 120x two-cycle assay runs [26,28].
Field (or coarse) blanks are rock material that consistently has negligible concentrations of gold. They are used to monitor contamination during field handling, transportation and sample preparation [22]. Blanks can be inserted into a batch in the field or laboratory and are analysed in the same batch as the primary samples. They are particularly useful in checking for gold contamination in the presence of coarse gold as they pass through the entire preparation process. Equipment contamination is prevalent during sample pulverisation, where gold can be smeared onto the pulveriser bowl and/or contaminates successive samples if the bowl is not cleaned effectively (PE) [2,3,12,24].

2.2.3. Laboratory Sub-Sampling, Sample Preparation and Associated QA/QC

Sub-sampling and sample preparation at the laboratory is relevant to PhotonAssayTM, as it includes the step(s) that feed the PhotonAssay™ jars directly. The codes require transparency on the methods used, details of any crushing and/or pulverising and riffle or rotary sample divider (RSD) splitting. As with all activities, QA procedures must be in place and declared. Company-defined QC actions include laboratory coarse (crushed) duplicates, blanks, CRMs, and effective hygiene (e.g., barren washes, cleaning of equipment, etc.) of all equipment [22]. The laboratory will also undertake its own QC actions which should be reviewed by the CQP.
The jar fill factor, whether for crushed or pulverised material or samples and CRMs, is a key QC parameter in PhotonAssay™ because it directly influences the attenuation and geometric corrections used to calculate gold grades. PhotonAssay™ analyses large sample masses within a fixed-volume jar and relies on accurate measurements of both sample mass and fill level to correct for X-ray penetration and gamma-ray attenuation. The system uses a calibrated lookup table based on these values to determine the appropriate correction factor. If the fill factor is incorrect due to overfilling, underfilling, poor levelling, or inconsistent sample presentation, the calculated correction may be inaccurate, leading to systematic assay bias. This is particularly important for pulverised samples, where bulk density and packing characteristics can vary significantly. Failure to follow recommended filling procedures is a potential source of discrepancies between PhotonAssay™ and conventional assay methods. Fill factors should be >80%, and if <50% will be rejected by the PhotonAssay™ process.
Maintaining an effective fill is critical for CRM usage [27,28]. A set of recommended mass ranges have been developed to ensure that prepared jars of commonly used pulverised CRMs remain full. Recommended mass ranges were obtained by preparing a set of jars of each material with specifically designed tamp and funnel tools [27,28].

2.2.4. Assaying and Associated QA/QC

The assay/analytical method(s) must be declared. Analytical precision and bias must be monitored via QC tools, such as the insertion of CRMs, blanks and analytical duplicates [22]. Matrix matching of CRMs for PhotonAssayTM is not required. The selected CRM grades should cover the anticipated cut-off, through to run-of-mine and high grade(s). CRMs can be reused given that PhotonAssayTM is non-destructive. An additional advantage of the technology is that the true analytical precision can be determined, as the method is non-destructive and jars can be assayed any number of times.
Check assays can be undertaken via PhotonAssayTM or via another analytical method at a second laboratory. The leading practice is to submit check assays to a second laboratory for analysis by the same method [22]. The CQP may opt to assay via an alternative method, though comparisons must be undertaken carefully to ensure that differences are understood in the light of the protocol used and sub-sampling/splitting actions which could generate sampling errors (e.g., FSE, GSE, DE, etc.).
A common action is to pulverise PhotonAssayTM jar material and undertake a fire assay for comparison. Note that a single pulverised 30–50 g fire assay is not equivalent to a 300–600 g crushed (or pulverised) PhotonAssayTM. If an identical assay, by mass, on the jar lot is required then multiple FA, screen fire assay (SFA), Pulverise-and-Leach (PAL) or LeachWELL™ (with fire assay of tails) are required for direct mass comparison. These methods require pulverisation of the sample prior to analysis which may impart sampling error via the DE, EE and PE [2,24].

2.2.5. Identify the Laboratory and Its Certification

The identity and location of the laboratory used must be stated, with reference to whether the laboratory is located on the mine/company site or elsewhere, and whether it is operated and owned by the issuer/reporting company or owned and independently operated.
It is not a requirement of any code that a laboratory needs to be accredited. The required disclosure is whether the laboratory is accredited or not [15,19]. Accreditation of laboratories via the International Organisation for Standardisation (ISO) is accepted as leading practice. ISO 9001 provides accreditation that a laboratory operates a quality system. It does not, however, assess actual quality or competence [29]. ISO 17025 covers laboratory testing and calibration performed using standard and non-standard methods [30]. ISO 9001 is applicable to all laboratories regardless of the activities undertaken, e.g., sample preparation, assaying, test procedures, etc. It requires laboratories to state their policies and procedures, provide appropriate facilities and equipment, train staff properly and maintain a high level of document control.
Whilst ISO accreditation is no absolute guarantee of rigorous testwork or assay results, it does provide a degree of comfort to the CQP. Total reliance on ISO accreditation is no substitute for personal inspection of the laboratory by the CQP and engagement with laboratory staff as part of the verification process.

2.2.6. Verification Steps by the CQP

Key assay-related verification steps may include:
  • In-person audits of the laboratory to check effective Laboratory Information Systems (LIMS; data management); laboratory organisation; cleanliness and potential for contamination; internal quality systems (QA/QC), including adherence to agreed protocols; analytical equipment calibration methods; compliance with accreditation; and health and safety.
  • Instigation of check assays.
  • Review of laboratory-issued assay certificates and validation against the database.
  • Timely analysis of both QC data and subsequent liaison with the laboratory as required, and internal laboratory QC and liaison with the laboratory.

3. Route to Technology Adoption

3.1. Awareness

Adoption of PhotonAssay™ has enhanced awareness of the method enormously by the interaction of social media, individuals, consultancies, companies, and laboratory service groups. In addition, there have been many references made to the method in webinars, journal/conference papers, press/magazine articles and presentations at seminars and conferences. The plethora of publicly available stock-exchange releases (e.g., Australian Stock Exchange with JORC Table 1) and other reports (e.g., Toronto Stock Exchange NI 43-101 reports) provides peer-level information. The method has also reached several university curricula (e.g., Camborne School of Mines, UK), particularly postgraduate master’s courses in exploration and mining geology. The levels of individual and group awareness range from “heard of it,” through to general knowledge of the method, and on to a deep “expert” understanding.
In addition to the geoscience team, awareness amongst the metallurgical team (e.g., minerals engineers) is also important, given the flexibility of the method to analyse belt and slurry samples; concentrates, loaded carbon and moist/wet material. For process plant applications, a fast turn-around time (TAT) is required, thus needing an on-site unit deployment or a commercial unit located close by.

3.2. Consideration

3.2.1. Overview–Consideration

Once key individuals are aware of and have become supporters of the method and the value of change, the next step relates to consideration.
Crucial to consideration activity is the role of the champion or champions. Depending on company size, the company or each site within the company needs a champion to drive the adoption of the method. The role of the champion(s) is to educate colleagues, project managing samples through the testwork stage, analyse data, and then identify and make recommendations to the decision maker(s). It is helpful if the champion(s) is a CQP to reinforce internal governance, including public reporting. The loss of a champion(s) mid-project can be impactful, as the work may lose impetus. A secondary champion will help if this situation occurs. The champions need to be individuals of influence and intellect to deal with any naysayers. Open and honest communication is important to all stakeholders throughout the process. External experts can assist in the consideration process to provide independent insight.
Based on conversations with both PhotonAssay™ users and active “considerers,” five key points emerge during the consideration process (Table 1).
By far the most important consideration is that of assay precision and bias compared to the existing assay method applied (e.g., FA). This can be investigated via testwork programmes. Improved TAT is an obvious point for review, given assays received quicker allow the business to be more dynamic, particularly at an operational stage. Enhanced ESG parameters are important to all exploration/mining companies and help to drive sustainability. PhotonAssay™ is accepted as a total assay method, though has known interferences (uranium, thorium and barium) that can be managed depending upon concentration [31]. It is otherwise agnostic to sample composition and granulometry.

3.2.2. Testwork—Introduction

Initial consideration of the method usually involves detailed conversations with peers and visits to laboratory service suppliers. Based on the authors’ experience and peer conversations, few companies change to PhotonAssay™ without some degree of testwork. Collaboration between multiple parties has resulted in the development of two test approaches: (1) the transitional feasibility study (“TFS”), and (2) the heterogeneity study (“HS”). It should be noted that this is not the heterogeneity study or variants thereof used to define inputs for the FSE equation [24,32,33,34].
Testwork aims to investigate precision and bias associated with PhotonAssay™ and the existing method (e.g., FA, SFA, LeachWELL™ or PAL).
Some groups may opt to undertake a full “rig-to-assay” assessment leading to changes throughout the given protocol(s), recognising that most imprecision occurs at the initial sampling stage and not at the laboratory [4,10,22,23]. A full assessment may include characterisation of the mineralisation via an integrated programme of mineralogical and metallurgical testwork to evaluate gold-particle sizing, alongside duplicate sample analysis, and traditional heterogeneity testing to support evaluation of protocols via the FSE equation [21,23,24,25,26,27,28,29,30,31,32,35].
A sampling and assaying programme must produce data that is fit-for-purpose in the context of their proposed usage. In this context, fit-for-purpose refers to results that can be reported in accordance with the CRIRSCO codes. Sampling and sub-sampling should result in representative (precise and unbiased) samples. If a batch of samples is deemed to be representative and assaying complies with QA documentation and QC metrics, then fit-for-purpose is indicated.
The level of testwork undertaken comes down to the degree of due diligence required by the technical team, in particular the CQP. Key areas of consideration are summarised in Table 1, where investigation of TME and bias with respect to the existing assay method (e.g., FA) is the most important. It is up to the CQP to decide on what degree of detail they require to be satisfied that the method produces fit-for-purpose results. Testwork may be considered as part of the validation process that supports CQP sign-off using PhotonAssay™.
Testwork can be run by the company or in collaboration with the Chrysos technical team. With either option, oversight by an external expert provides independent review. It may be undertaken in stages, for example an initial trial, which, on successful conclusion, develops into more detailed work across more projects or operations. The level of testwork often reflects the size of the company and its budget, where a junior may undertake a small and/or single programme (e.g., a few 100 test samples), whereas a major company may undertake larger and multiple programmes (e.g., 10,000 s of test samples).
For example, Novo Resources Corp. undertook 150 assay comparisons at its Beatons Creek project, which principally investigated bias between 1 kg LeachWELL (plus tails FA) and 1 kg PhotonAssay™ [10]. In this case, a 1 kg split was taken post-crushing and subjected to PhotonAssay™, then pulverised and subjected to whole-sample LeachWELL plus duplicate tails FA. A +2% bias was identified at 2% uncertainty, which was considered acceptable—indicating the two methods were comparable. Agnico Eagle Fosterville undertook an initial testwork programme of 1450 samples comparing PhotonAssay™ with FA and some SFA [11]. They subsequently continued to undertake routine-paired PhotonAssay™-FA to build a dataset of over 45,000 samples which led to the deployment of PhotonAssay™ for resource development and grade control samples [11]. Benz Mining Corp. assayed 18,143 samples from 8.5 t of diamond core coarse rejects from its Eastmain gold project in Canada to compare PhotonAssay™ grades with FA [36]. A junior explorer with a key project in West Africa undertook a 1000 RC sample comparison between PhotonAssay™ and FA, with most samples by multiple jars (1, 2 and 3 jars). Another junior with an advanced project in South America undertook an initial comparison based on 150 samples. A major gold producer with global projects undertook testwork on closer to 20,000 samples. Apart from the South American example (due to remoteness), PhotonAssay™ was deployed.
The choice of number of test samples is up to the CQP/project team. Based on experience, an absolute minimum of 50–100 could be used, but ≥150 samples per mineralised domain is strongly recommended [4,37].
The grade range should be reviewed for the given domain using a probability plot and weighted according to the distribution. Samples can be randomly selected from decile groups defined across the grade distribution. Consideration must also be given to different geological domains based on variographic and statistical analysis.
Analysis and data presentation for the TFS and HS test approaches are presented in detail by Sterk et al. [37], with additional information by Tickner, Lannan & Preston [38]. It is up to the CQP to select acceptable precision (as TME) and bias levels; in general ±15% or less TME and ±3% bias or less are reasonable. If enough spatially distributed data is available, variography can be undertaken to determine the nugget effect and evaluate any changes to the sampling protocol [10,11]. Optimisation of any sampling protocol should target reduction of the nugget effect [4,24,35].

3.2.3. Testwork—QA/QC

It is noted that testwork programmes must be accompanied by appropriate QA/QC. Testwork QA must include documentation as to how the programme will be run and supported by staff training. This is important to ensure that the programme yields the required outcomes in a timely manner.
QC actions must include CRMs, blanks and check assays. General practice is to include QC actions at a rate of 1 in 20 (5%) [22]. However, given that a testwork programme should be based on >150 samples, a 5% rate will yield only seven or more of each. The insertion rate should be increased as required to 1 in 5, allowing >30 data points per inserted CRM.
Coarse blank insertion may also have to be increased above 1 in 20 (e.g., 1 in 5) to ensure enough data points. If coarse gold is suspected, pulverised blank material must be assayed to check for contamination. Check assays for both PhotonAssay™ (repeat of jars) and FA (pulp reject splits) should be performed at a third-party laboratory.
The importance of the jar fill factor for both CRMs and samples was emphasised in Section 2.2.3.

3.2.4. Testwork—Transitional Feasibility Study

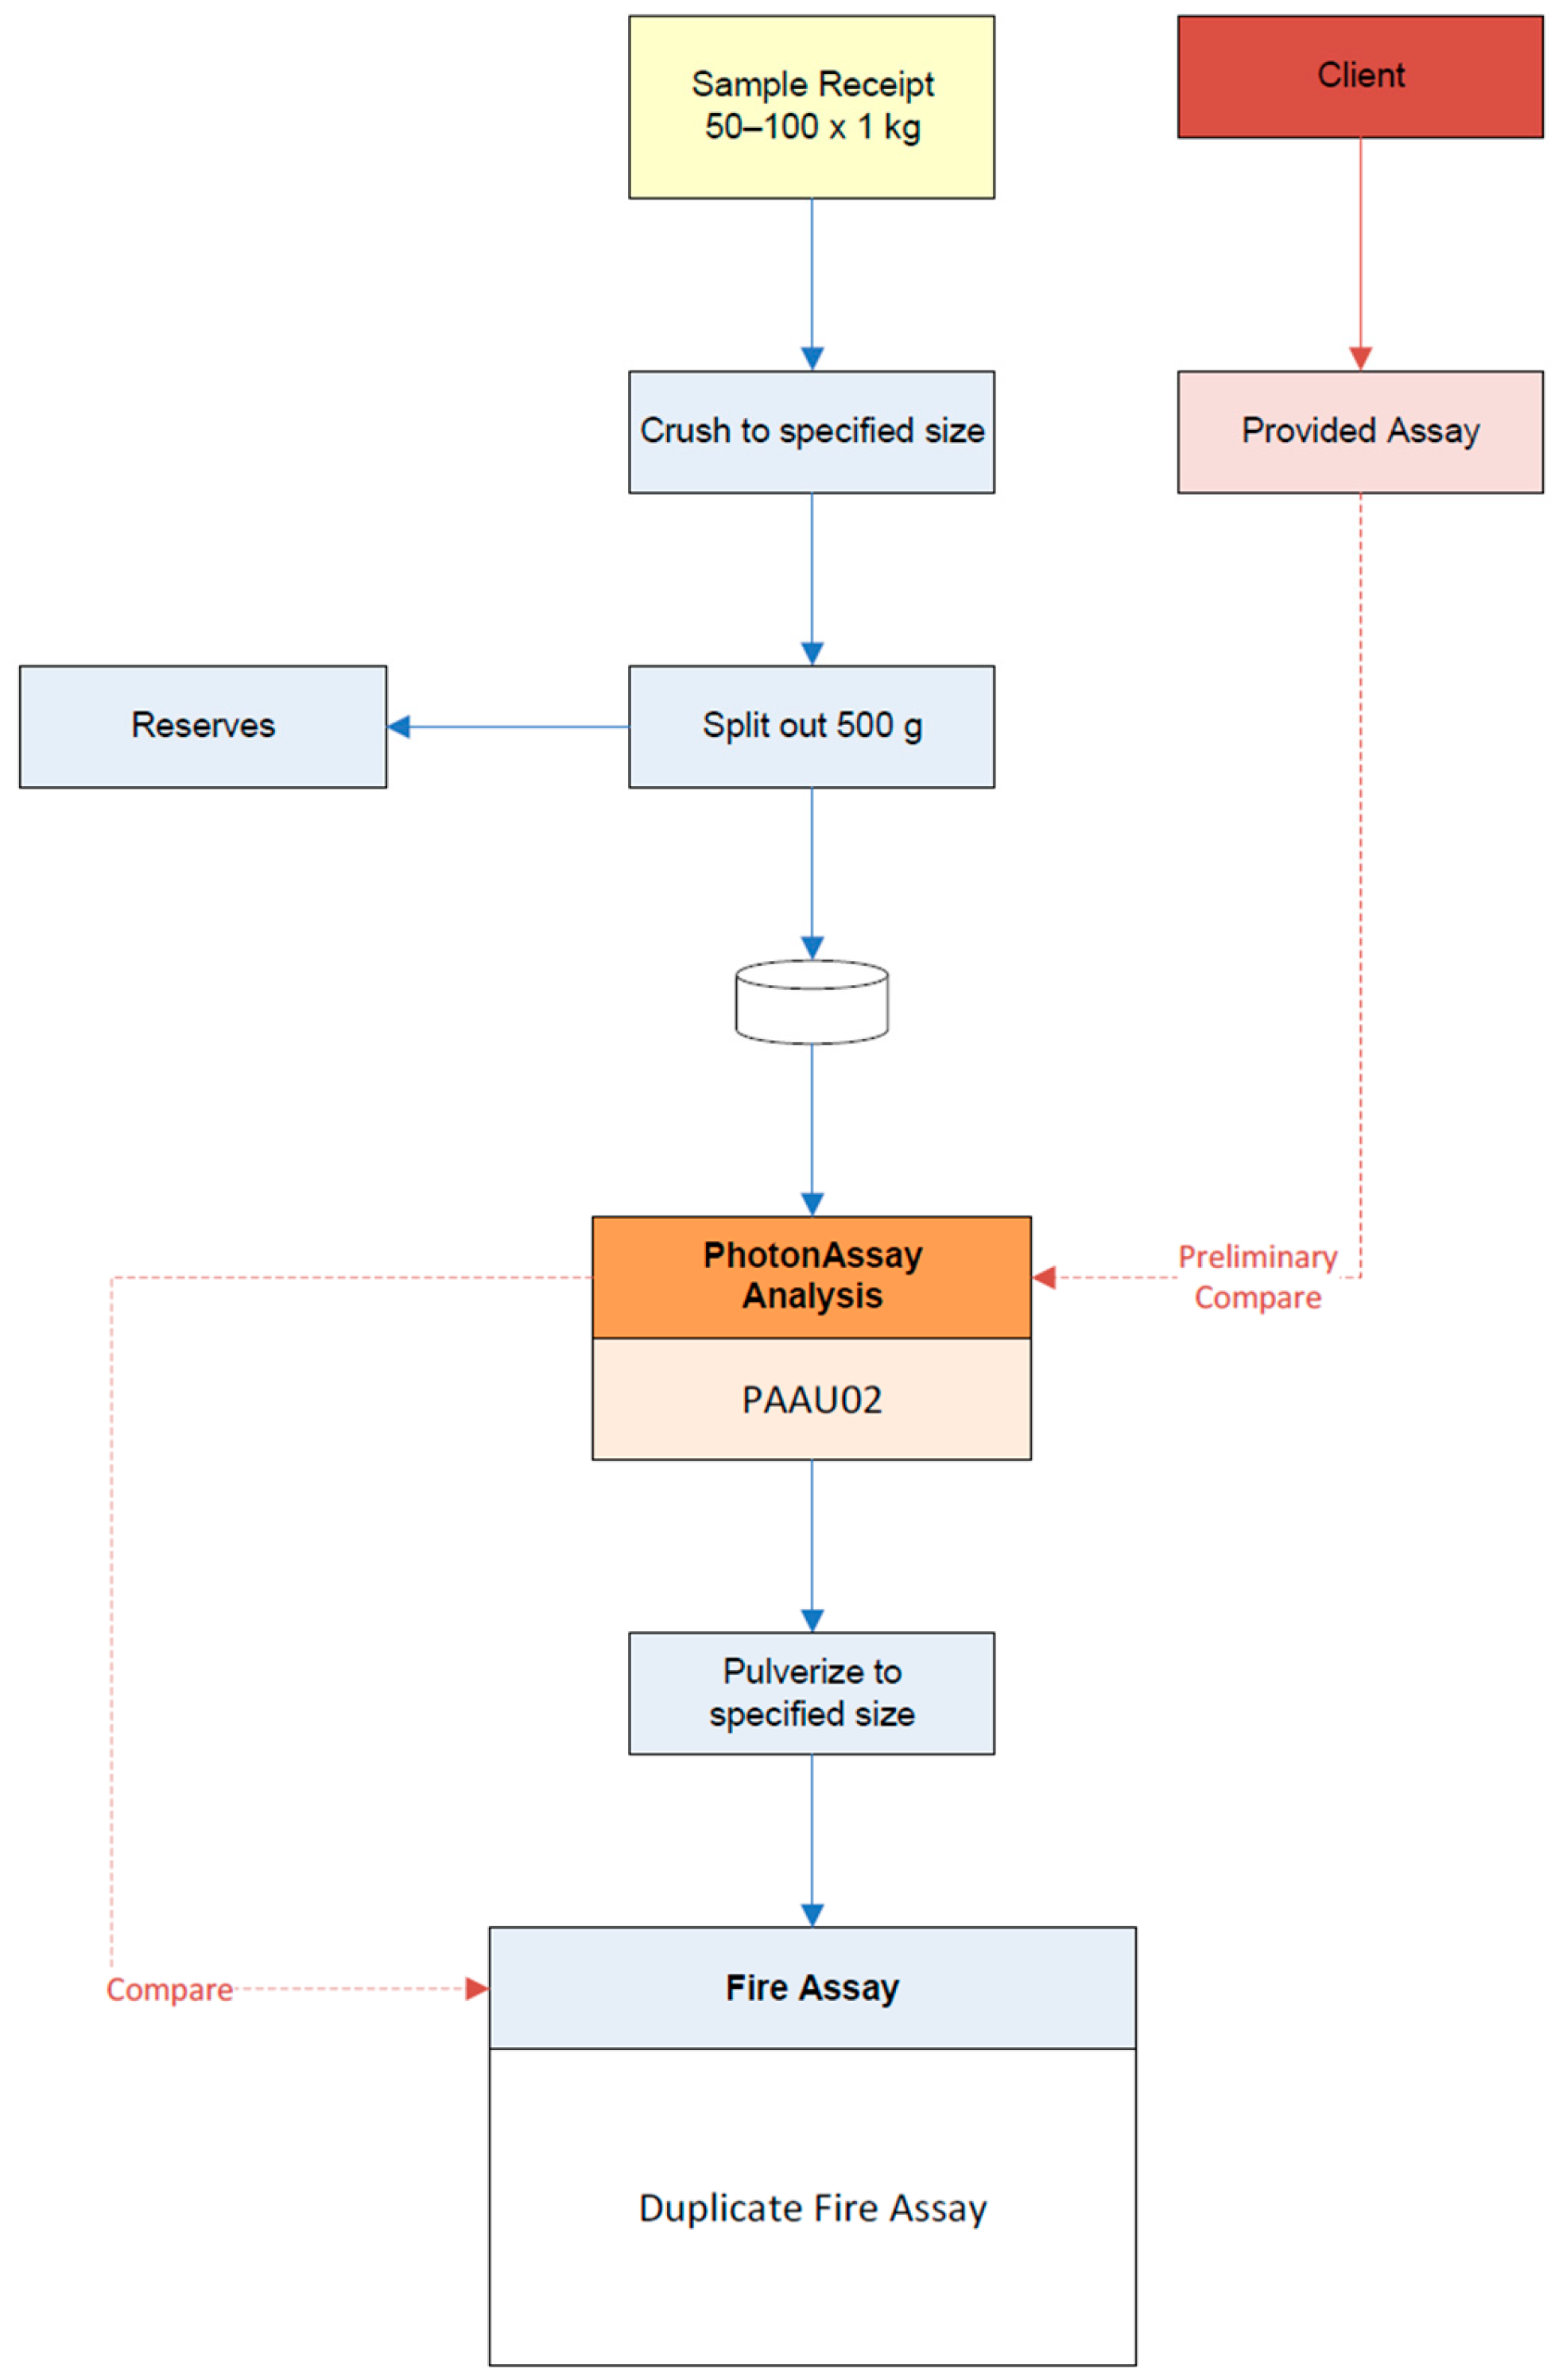
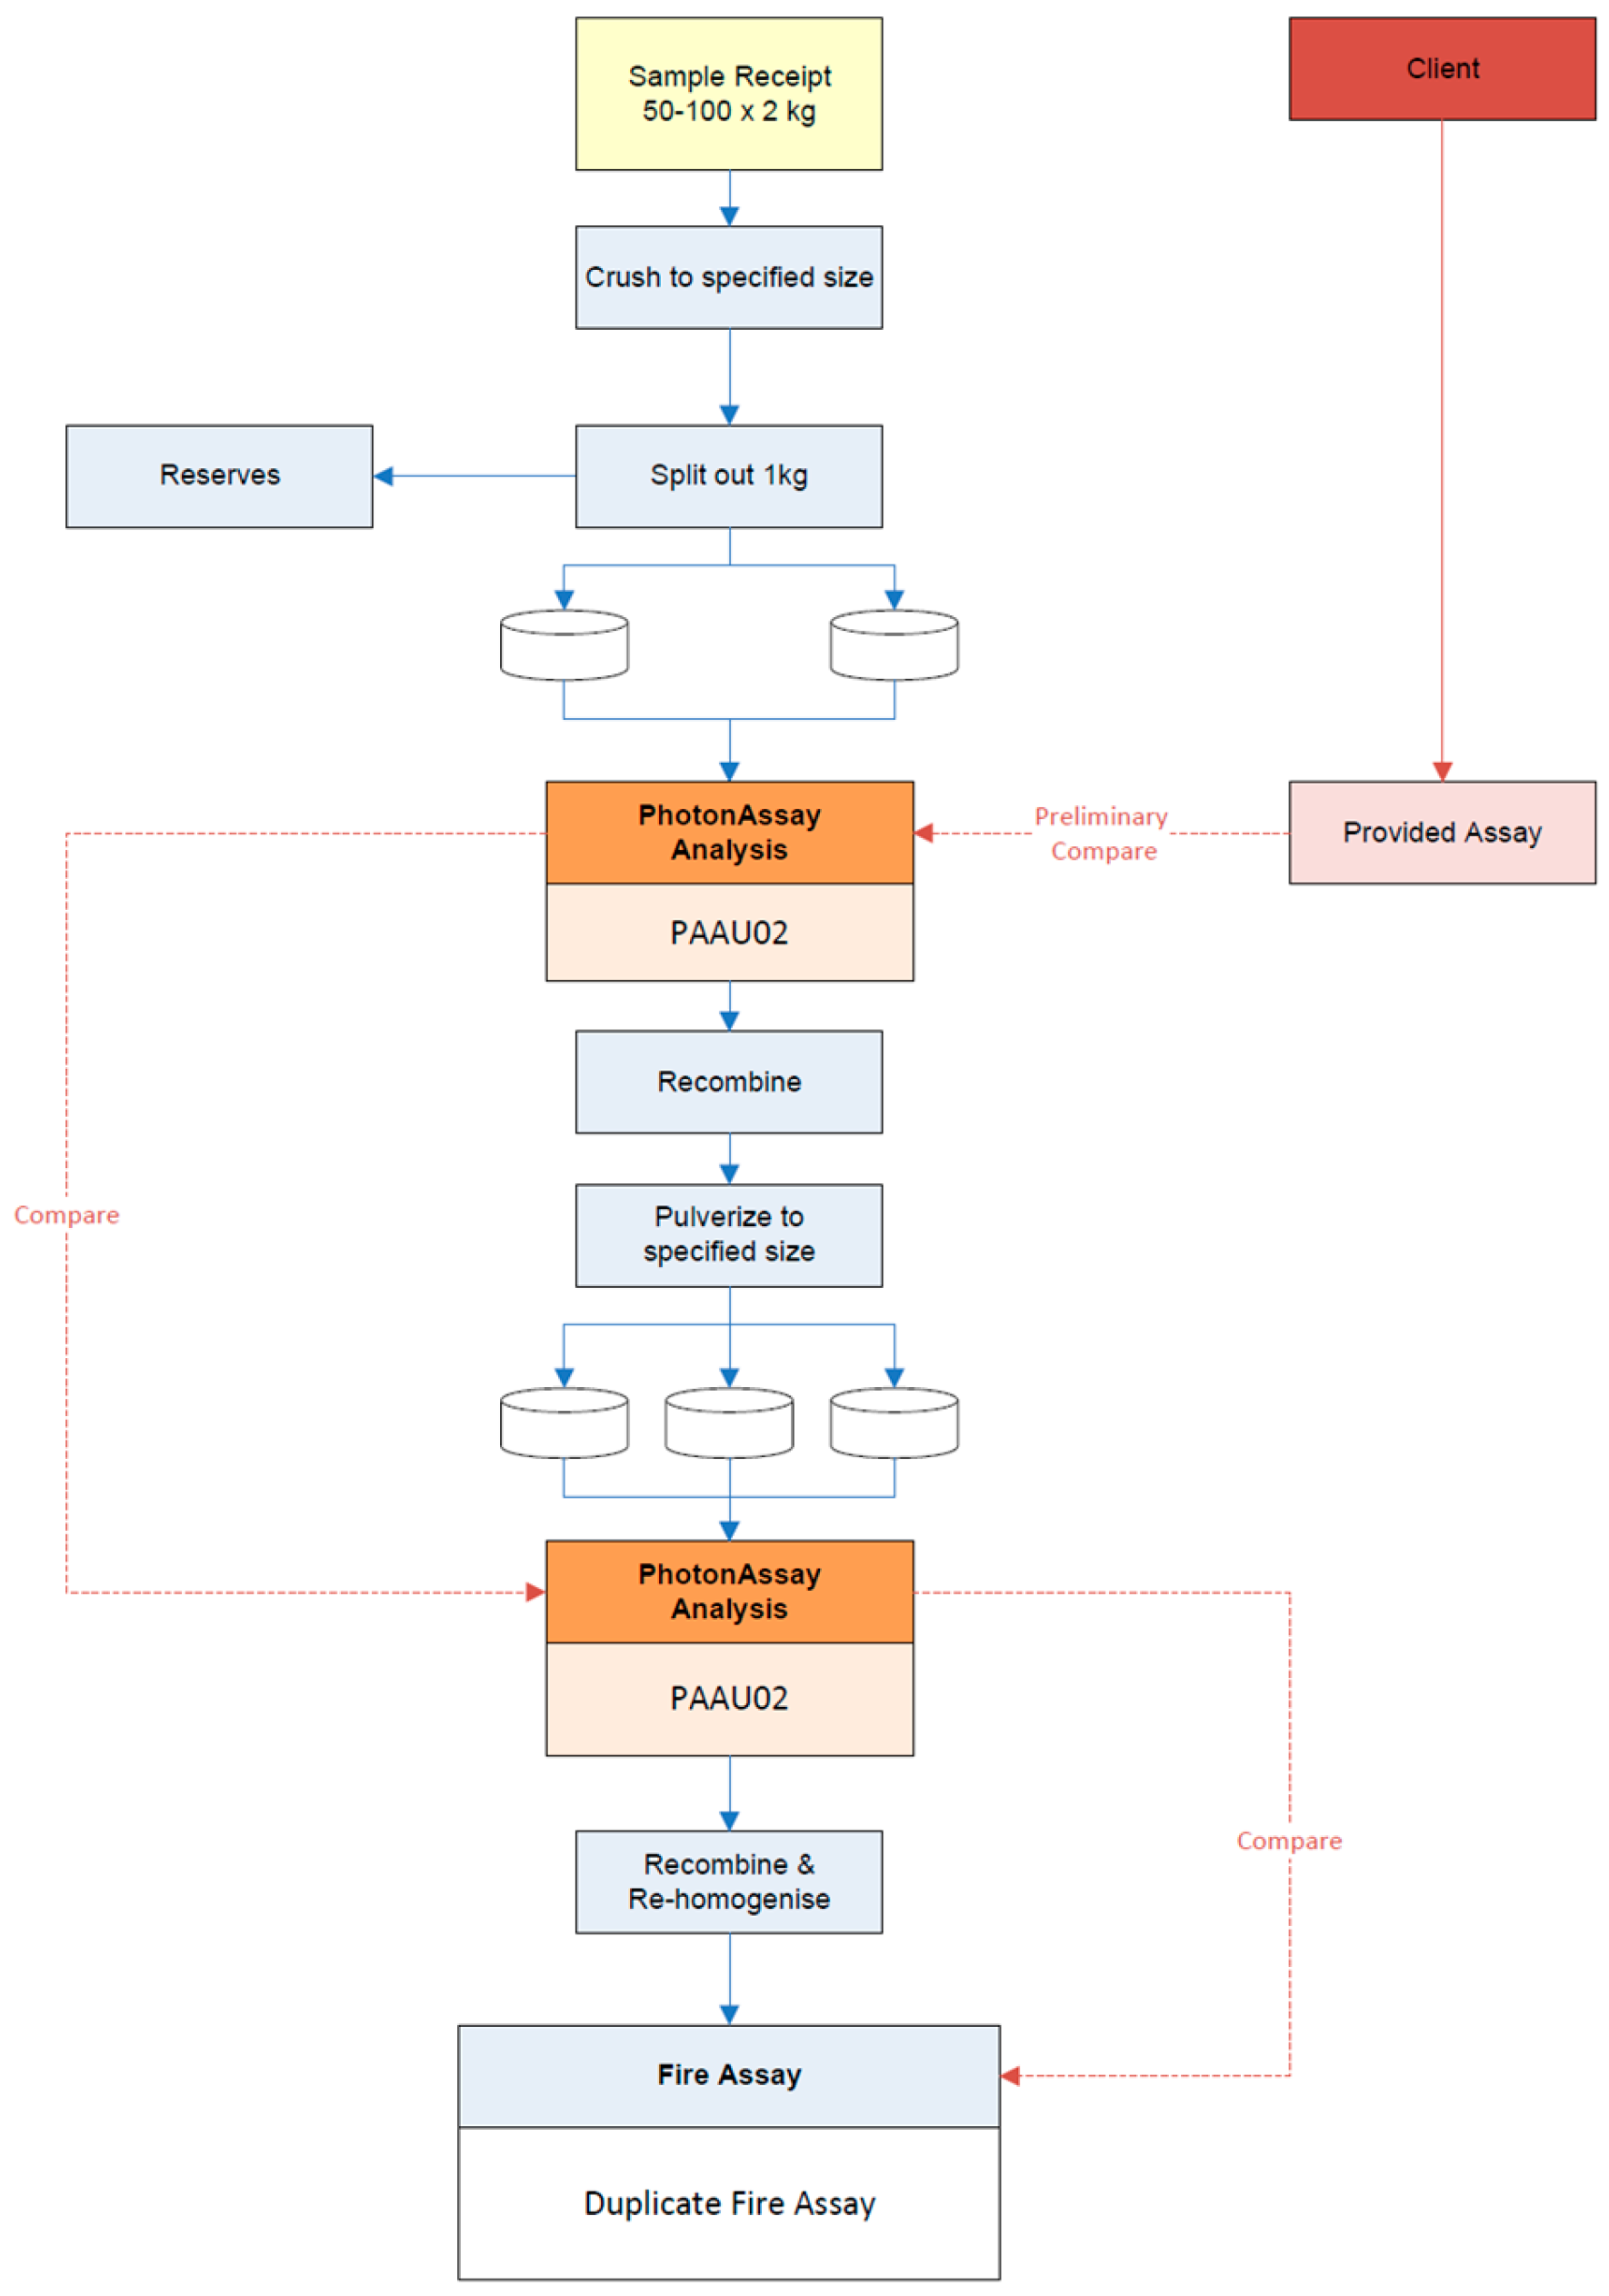
The TFS (Figure 3) is a comparative analysis between PhotonAssay™ and FA or another method. It is a straightforward option that can be managed by the company or a laboratory, providing a simple view as to whether PhotonAssay™ gives a similar result to the existing assay method. It assesses the potential bias that may exist between PhotonAssay™ and FA. If a method other than FA is compared to PhotonAssay™, then the flowsheet will need to be altered accordingly.
The samples are crushed to P80 2 mm (or P80 75 µm for pulverisation) and 500 g is split off and loaded into a PhotonAssay™ jar for a standard PAAU02 service [39]. Sample splitting should be via riffle or RSD splitter. Grab sampling or spooning is not acceptable. Post PhotonAssay™, the 500 g lots are pulverised to P80 75 µm and sub-sampled for duplicate FAs. Sample splitting should be via micro-riffle or micro-RSD. Total FA to extinction can be undertaken if required or another assay method is applied.
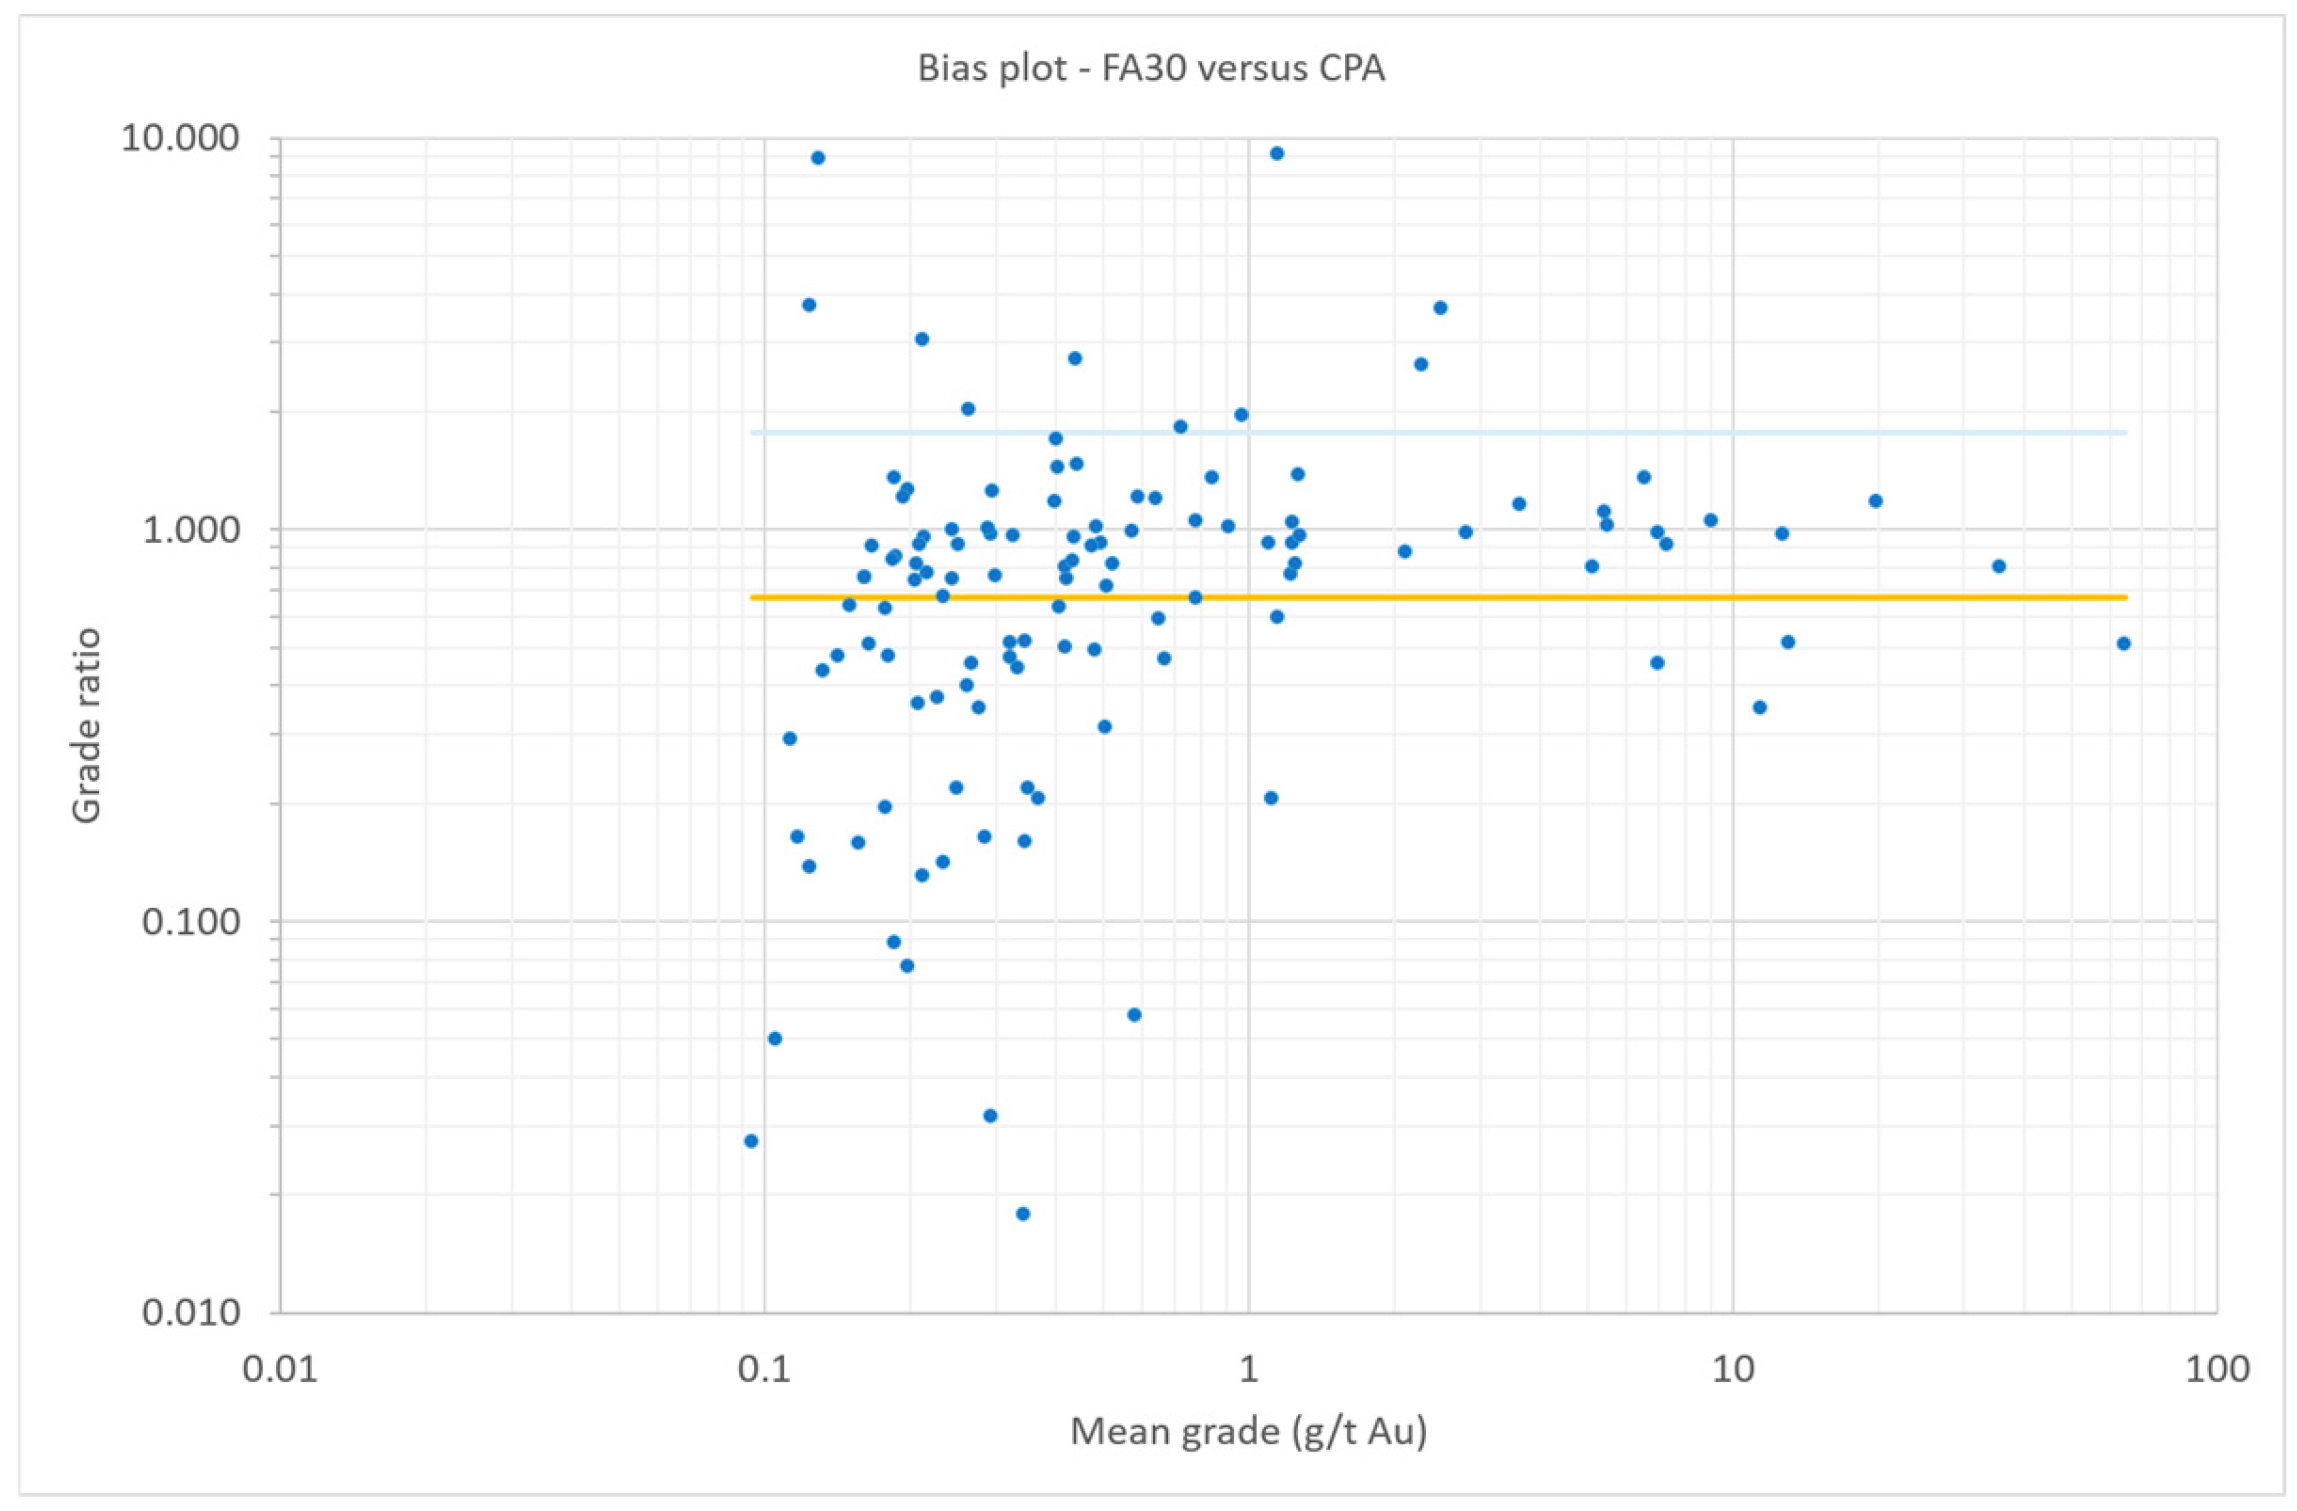
The PhotonAssay™ grade is then compared to the original FA (or other assay) and the test duplicate FAs. Figure 4 shows an example Tukey (bias) plot based on the TFS protocol from coarse gold-bearing quartz vein.
In this case there is a +33% bias (10% uncertainty) between the PhotonAssay™ and FA values. The results are based on a modified TFS where the average of two PhotonAssay™ jars is compared to four 30 g FA. The content of the two jars was recombined and pulverised and then 120 g split off. Thus, 120 g by FA represents 1 kg by PhotonAssay™. The scatter observed in Figure 4 not only represents AE, but also the FSE of sub-sampling 120 g from 1 kg. This is compounded by the presence of coarse gold, which is dominated by >350 µm sized gold.
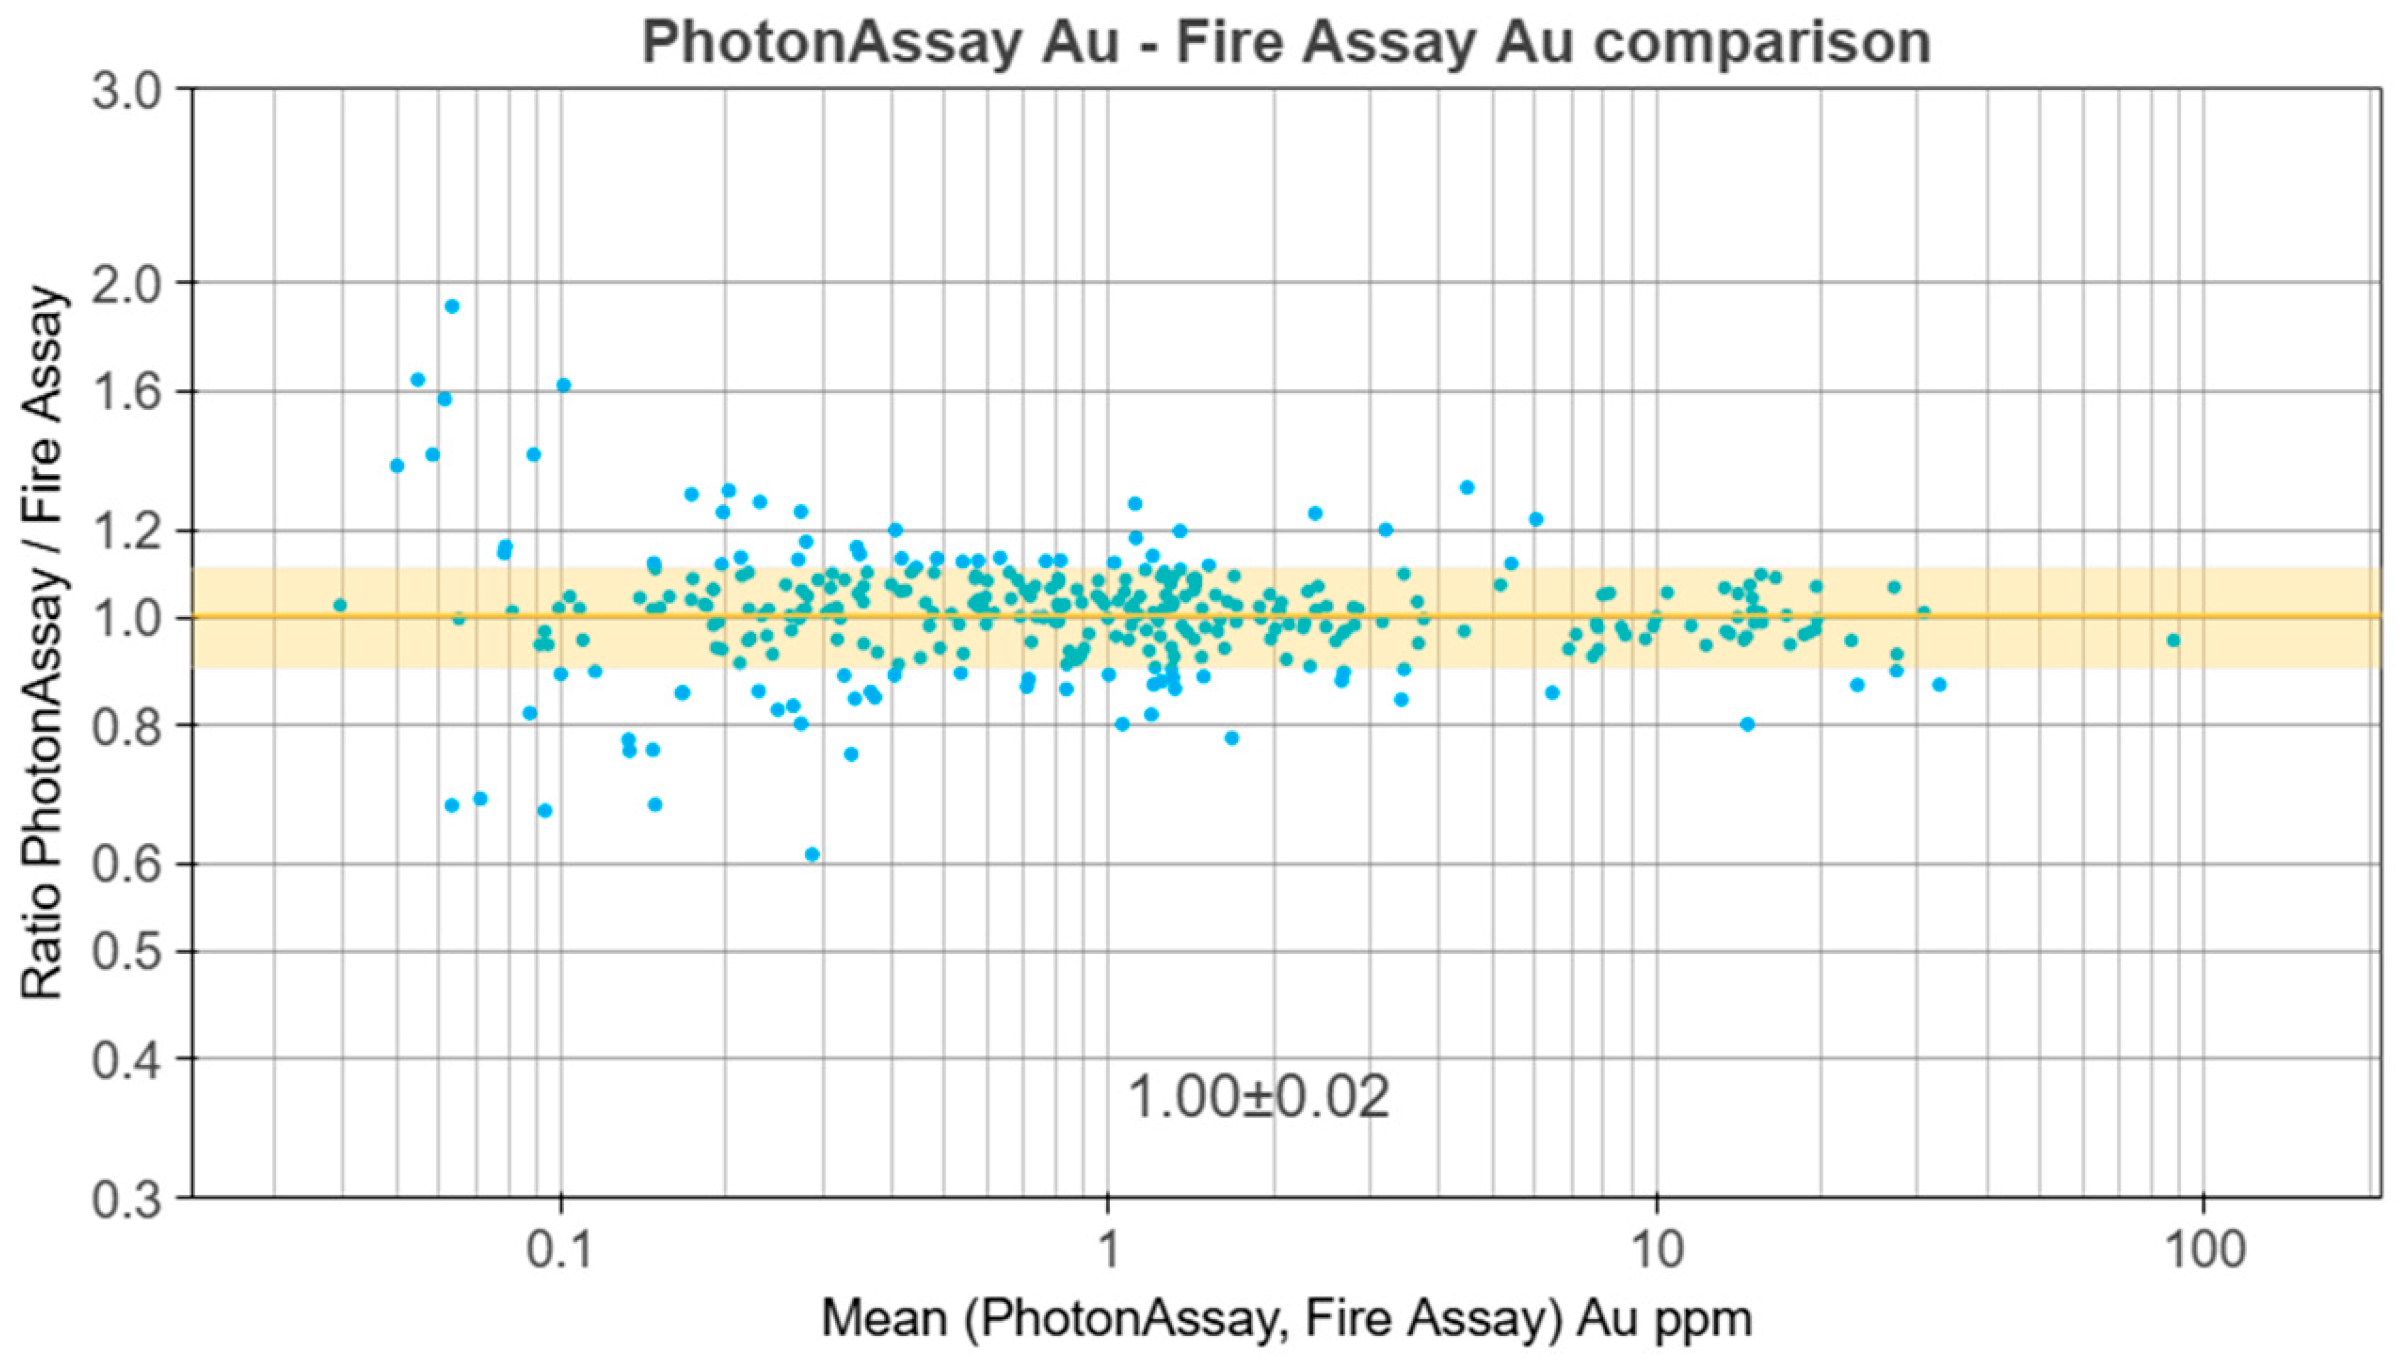
Figure 5 shows an example bias plot based on the TFS protocol from fine gold-bearing porphyry mineralisation.
In this case, there is a zero average bias (2% uncertainty) between the PhotonAssay™ and FA, indicating that the two assays are effectively the same. This could be a typical result for fine gold-dominated mineralisation where the 30 g FA and 500 g PhotonAssay™ aliquots contain proportionally the same amount of gold.
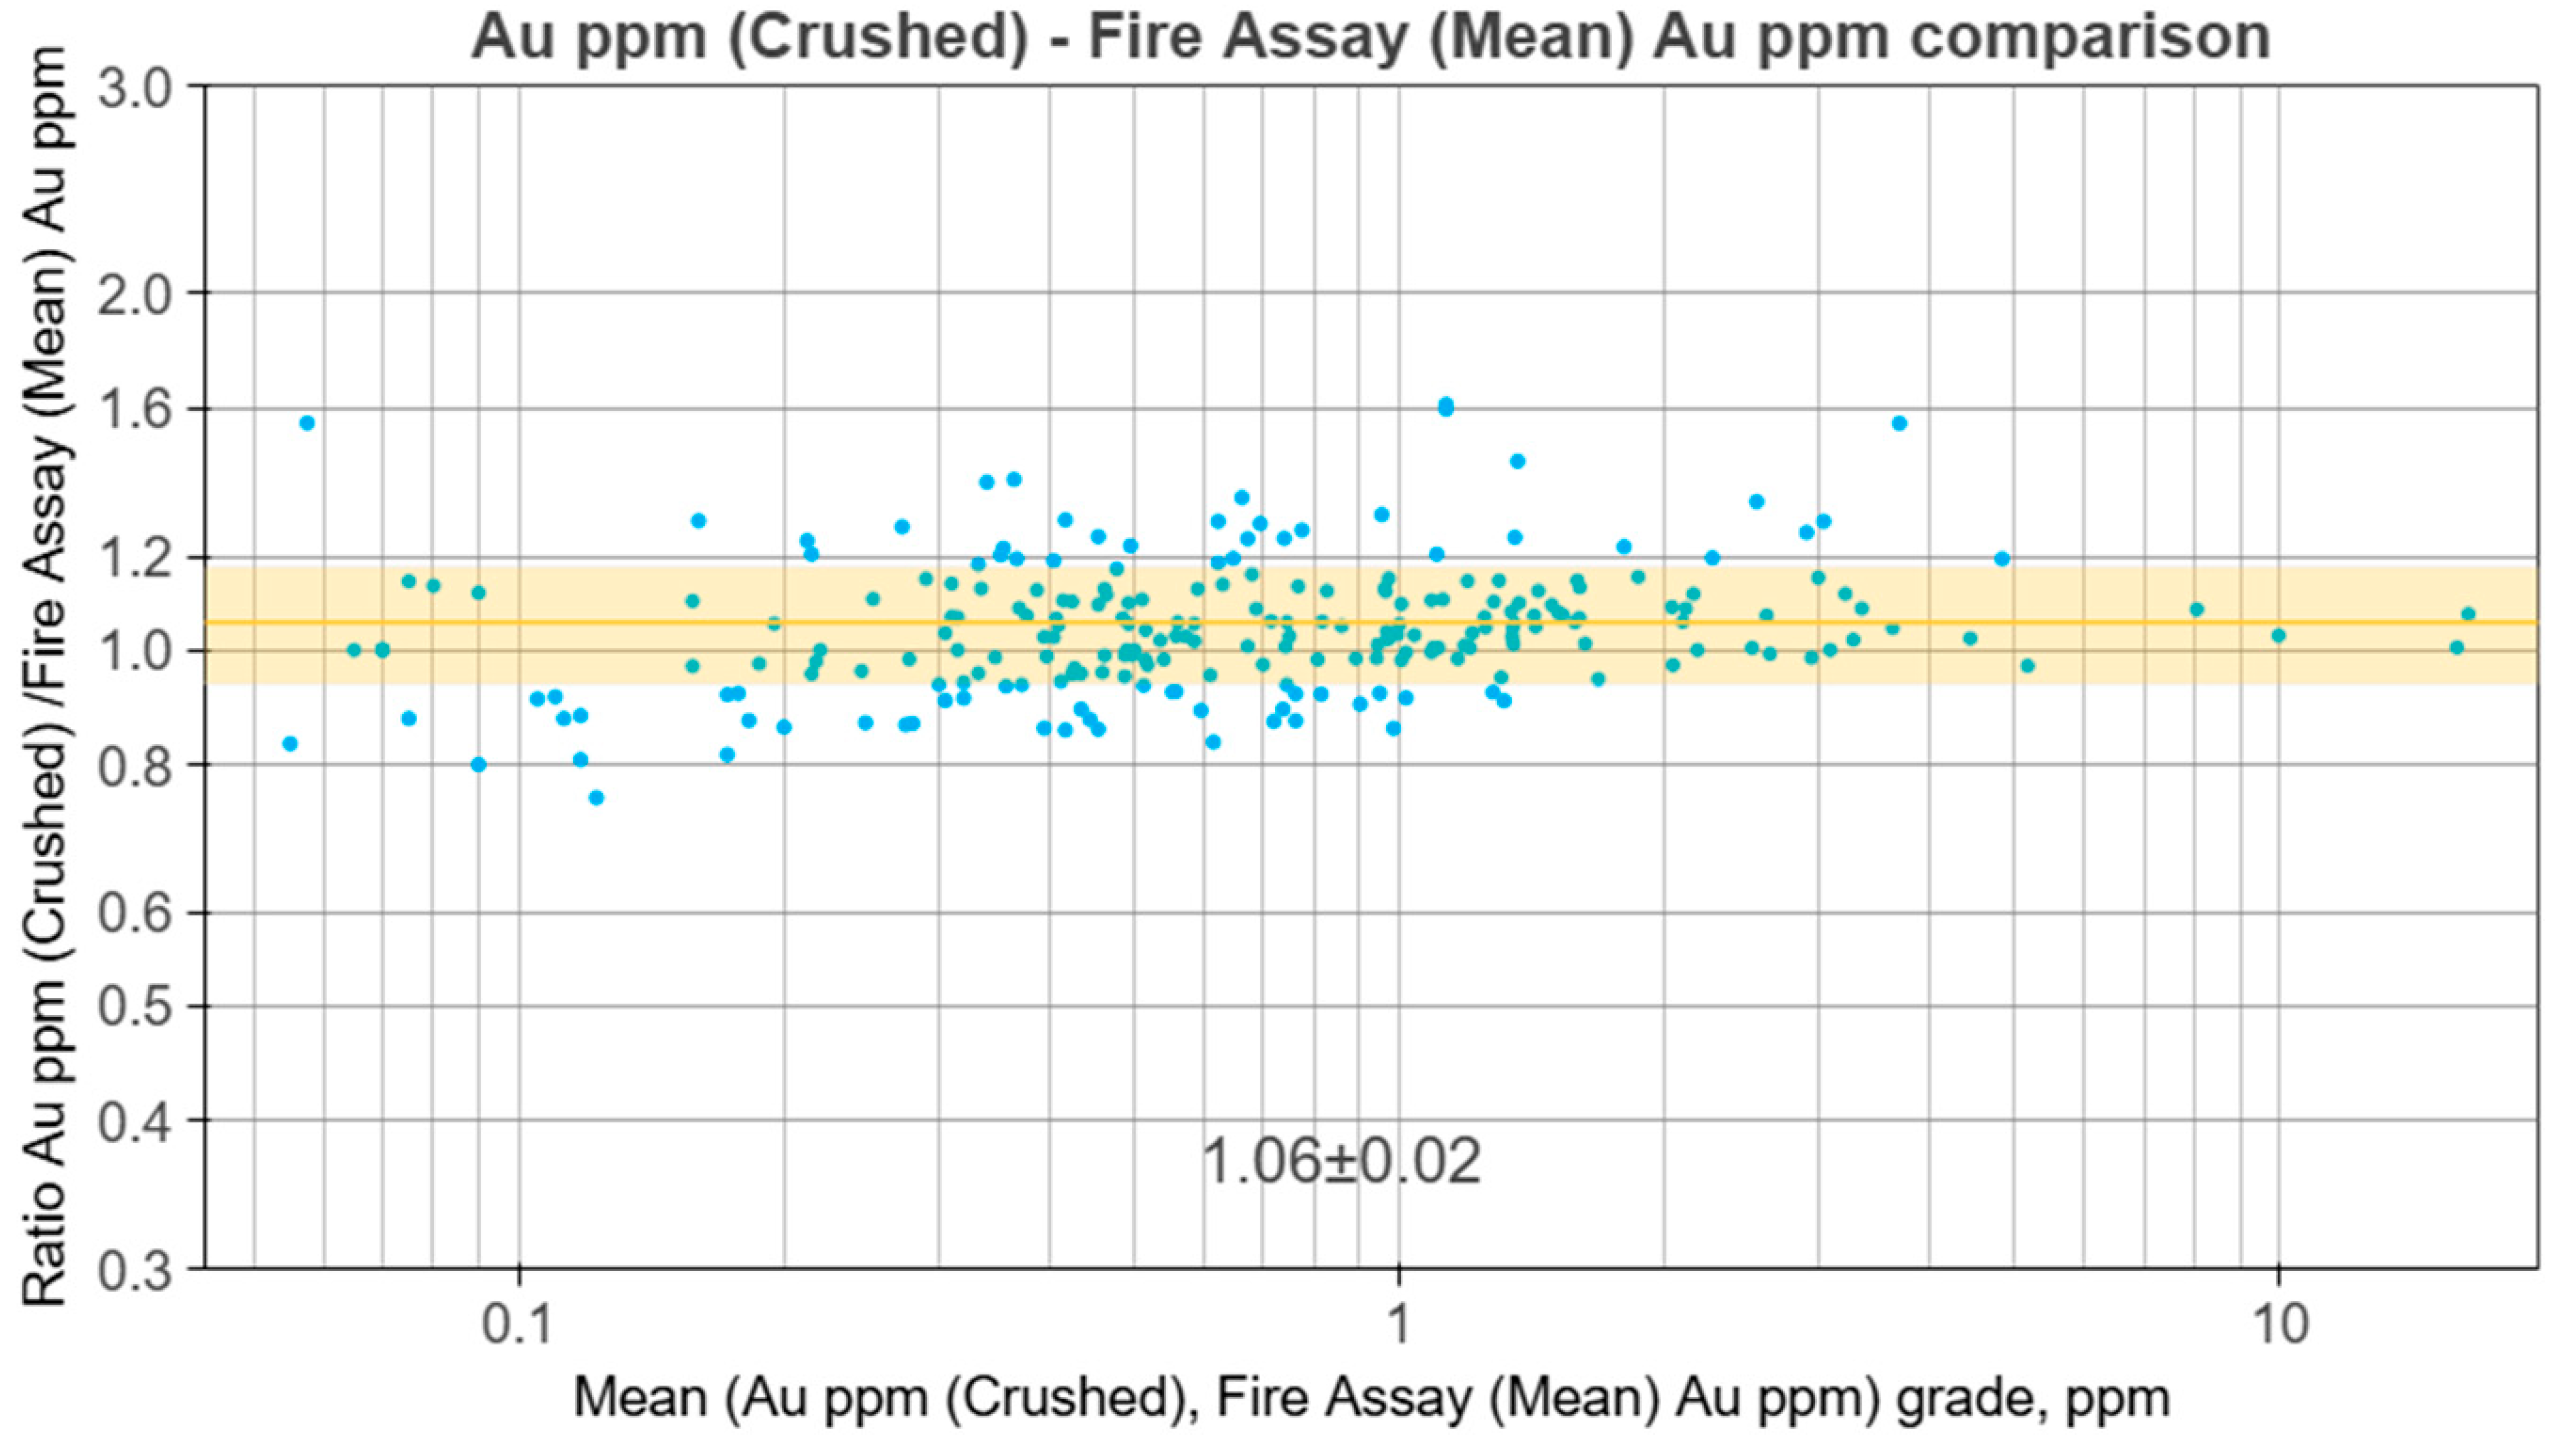
Figure 6 displays high bias at low grades and low bias at high grades, with an overall mean bias of +4% (2% uncertainty). The low bias at low grades is attributable to contamination during pulverisation, resulting in the FA reporting higher than the PhotonAssay™ (crushed). The bias plot is based on the TFS protocol from coarse gold-bearing orogenic mineralisation.

3.2.5. Testwork—Heterogeneity Study

The HS is a comparative analysis between PhotonAssay™ and FA similar to that suggested in Dominy et al. [4] (Figure 7). This is a more involved test programme that aims to assess the sampling error for PhotonAssay™ as crushed and pulverised samples as well as FA aliquots.
It generates estimates of:
  • Sampling errors associated with drawing 500 g splits of coarse material;
  • Reduction in the sampling error achievable when combining results from two or more PhotonAssay™ measurements of crushed material;
  • Sampling errors associated with drawing 350 g splits of pulverised material;
  • Reduction in sampling error achievable when combining results from two or more PhotonAssay™ measurements of pulverised material;
  • Sampling errors associated with drawing 30–50 g splits of pulverised material for FA.
Importantly, the HS allows the role of pulverisation to be assessed. The general paradigm is for crushed material to be used for PhotonAssay™, thus saving time and money on pulverisation. However, in some cases pulverisation is warranted to reduce gold-particle sizes further to achieve some degree of pulp homogeneity, thus reducing the sampling error of splitting coarse material [11,40]. Where pulverisation is used, enhanced PE is possible due to gold contamination of grinding equipment [2,3,12]. This must be monitored by the use of coarse blanks and their subsequent assay.
For example, Agnico Eagle Fosterville opted to continue to pulverise for PhotonAssay™ in coarse-gold mineralisation to minimise variance between the assays they were observing at a 2 mm crush [11]. Crushed material was used for sulphide mineralisation which was not coarse-gold dominated. At the Beatons Creek operation, Novo Resources opted to avoid pulverisation for practical on-site purposes and deployed 5x PhotonAssay™ jars to achieve a 2.5 kg assay charge to minimise sampling error at a coarse split [10].
The samples are crushed to P80 2 mm and two 500 g lots split off and loaded into two PhotonAssay™ jars for a PAAU02 service [39]. Post assay, the two jarred lots are recombined and pulverised to P80 75 µm and split into three PhotonAssay™ jars and assayed via PAAU02. The three jars are then recombined and homogenised (by a light re-pulverisation), after which two 30 g (or 50 g) lots are drawn for FA. Note that two jars of crushed material will fill three jars once pulverised, due to the “fluffing” of pulp making a greater volume than crushed material. The entire pulverised material can undergo FA to extinction if required.
The PhotonAssay™ grade is then compared to the original FA and the test duplicate FAs. The individual measurements of the PhotonAssay™ crushed and pulped and FA stages are then compared for each sample to investigate the precision associated with analysing an individual jar or aliquot [37].
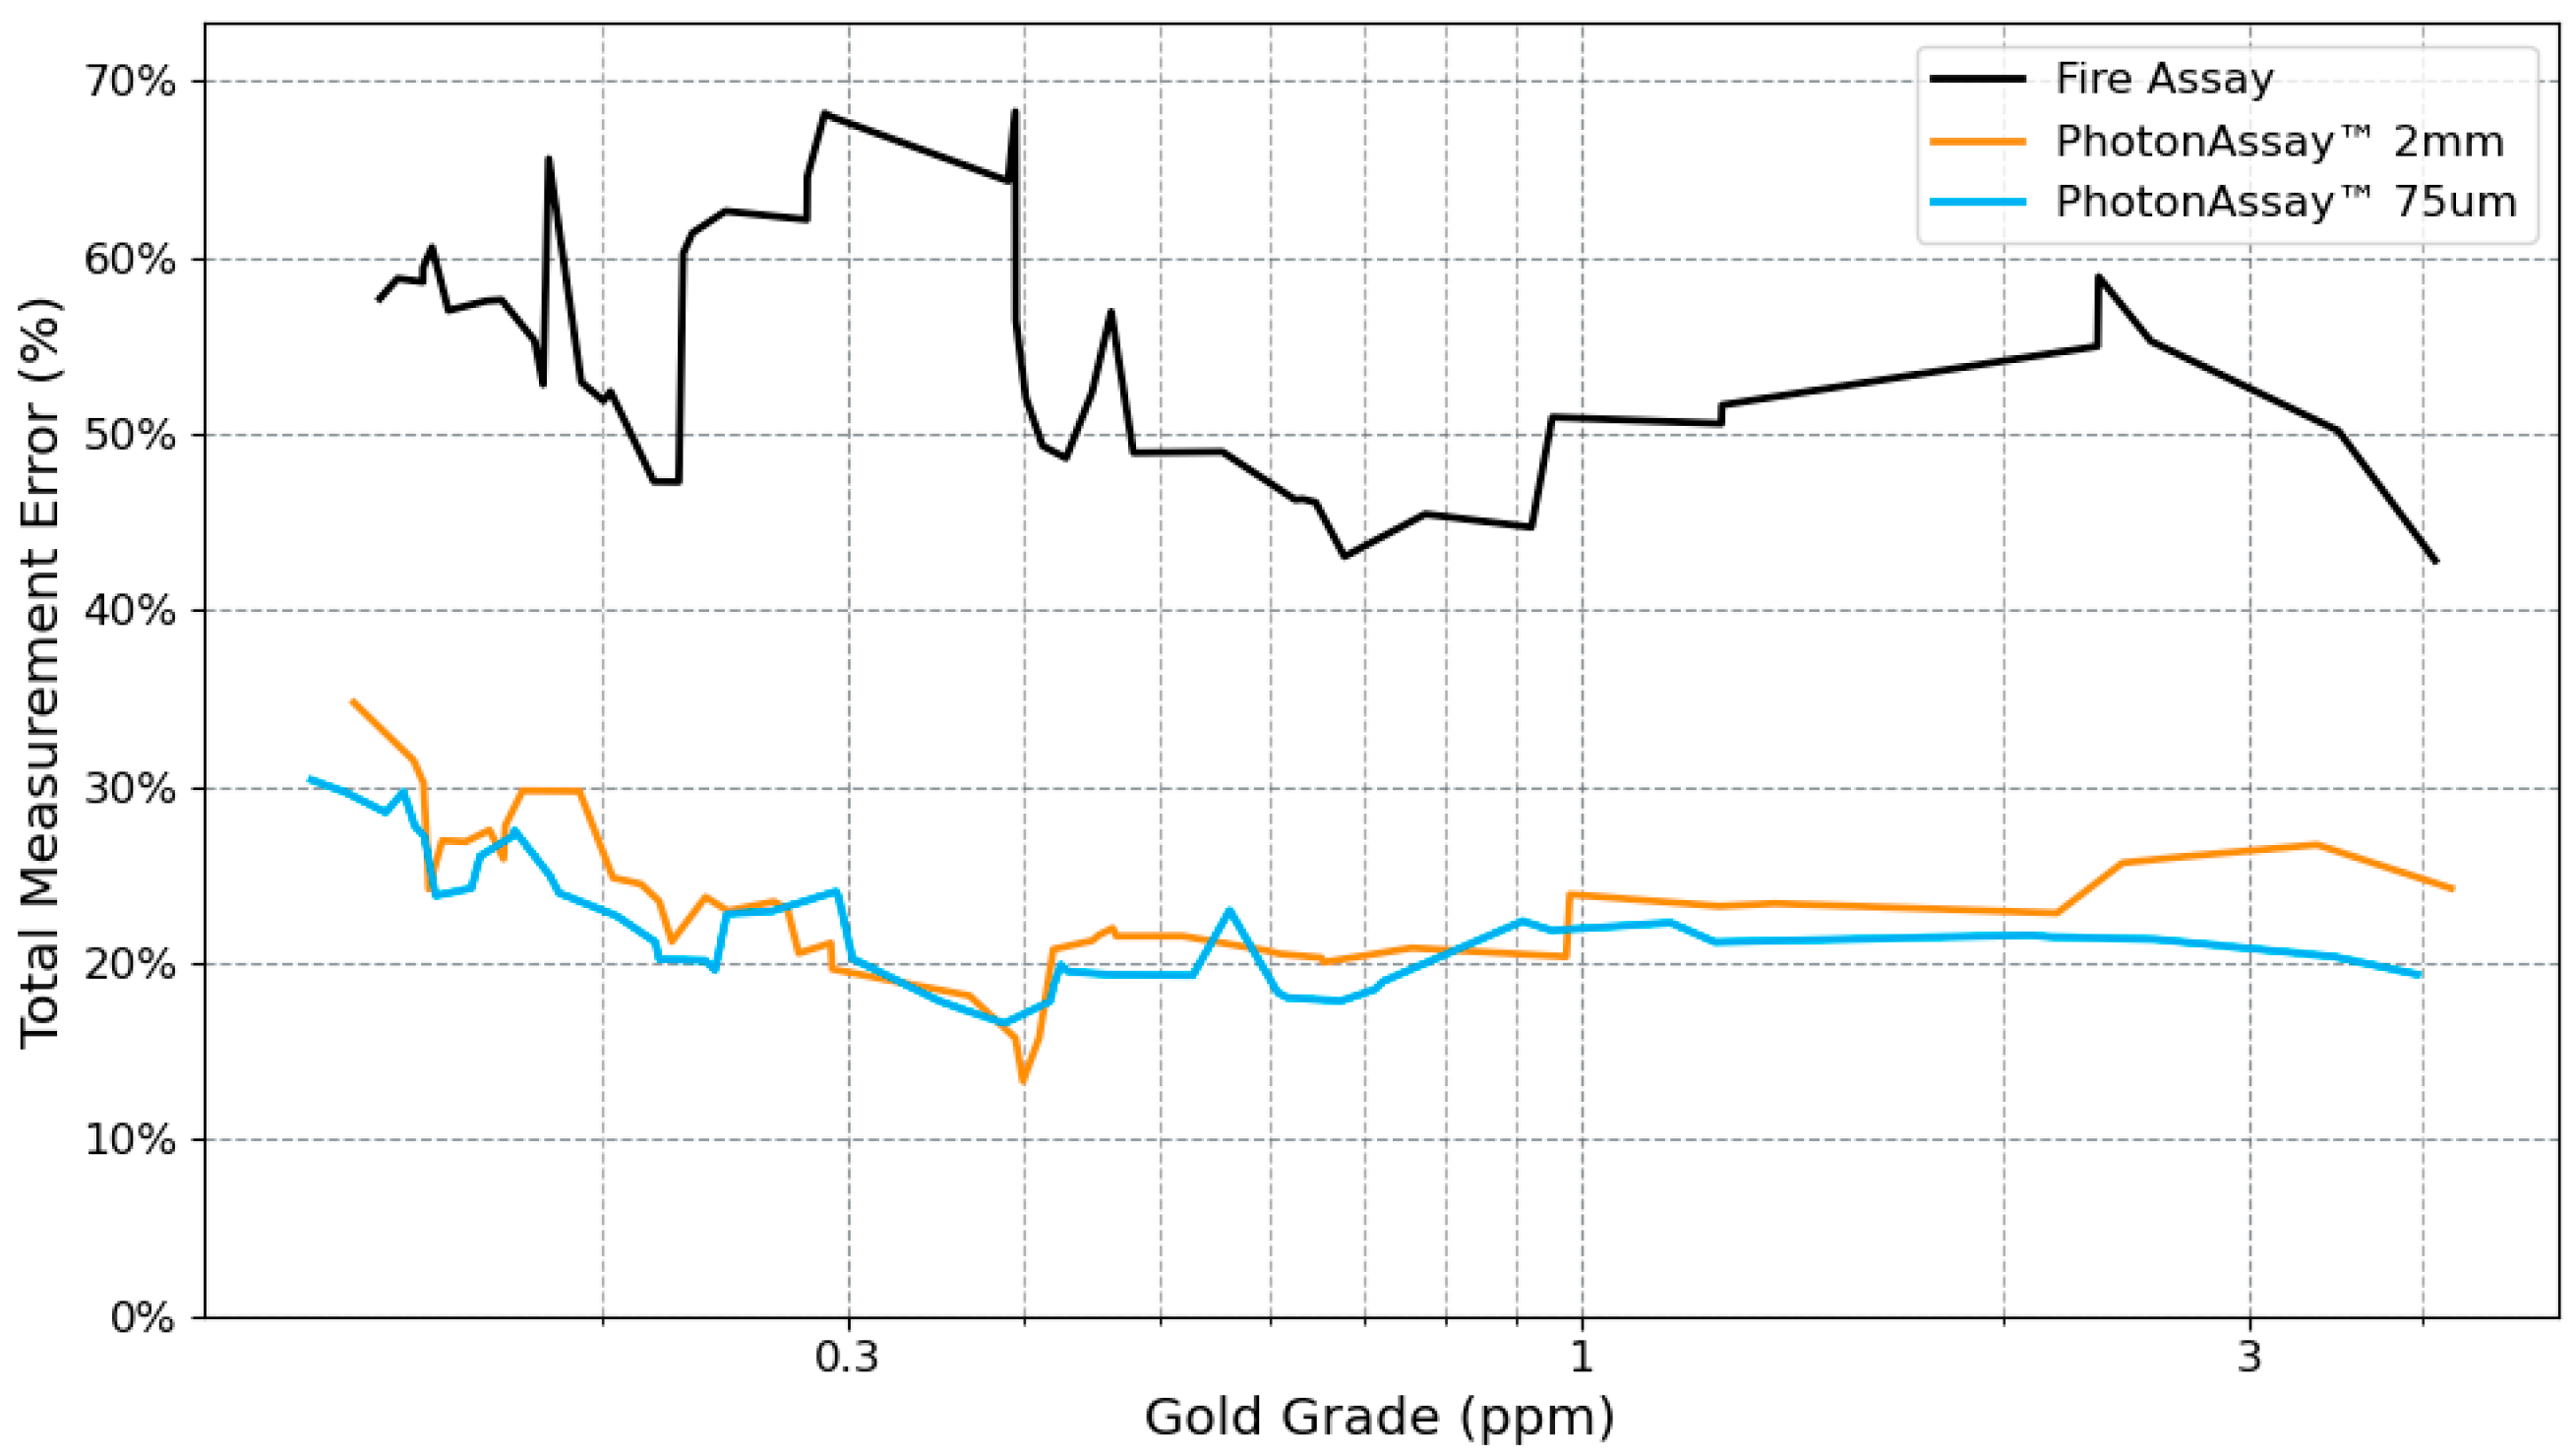
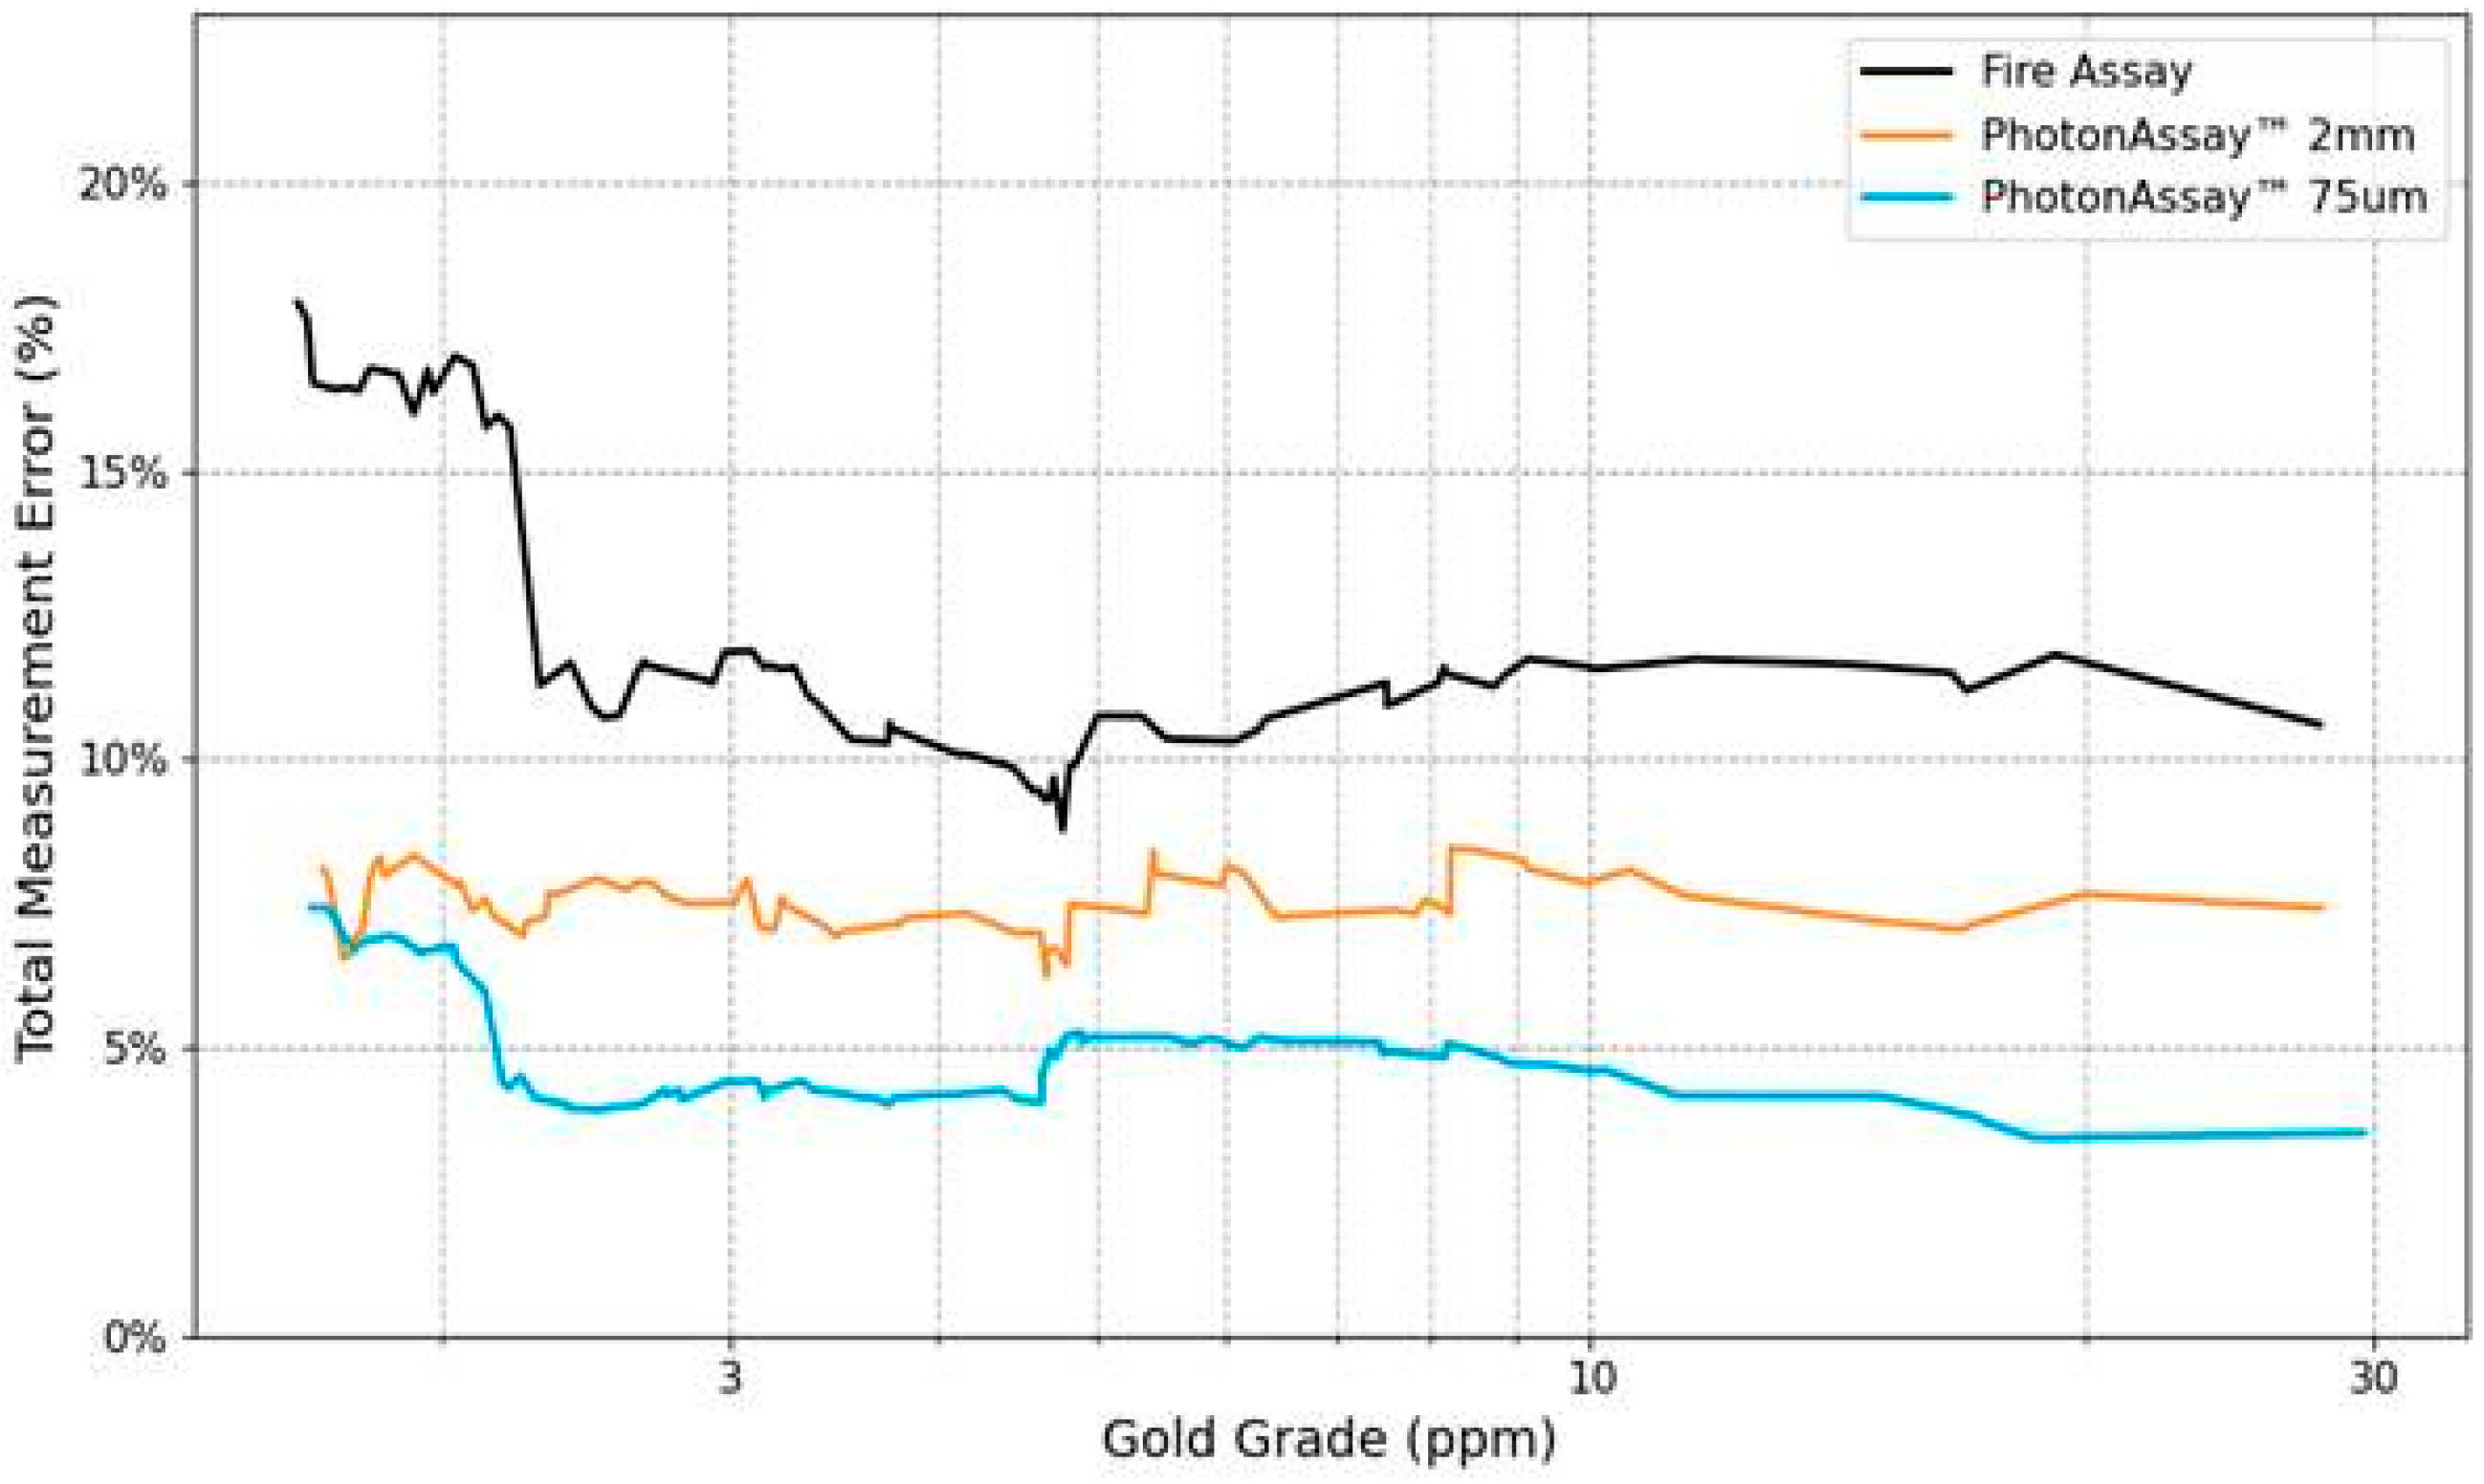
Example outputs from HS programmes are given in Figure 8 and Figure 9.
In this example of coarse gold-bearing mineralisation it can been seen that the FA provides a high TME across the range of grades at ±44% to ±68% (Figure 8). The move to PhotonAssay™ reduces the TME to the ±15% to ±34% range for both the crushed and pulverised material. In this case pulverising for PhotonAssay™ is unnecessary. There is a case for the use of an even larger sample size, e.g., multiple PhotonAssay™ jars to reduce the TME to below ±15%.
This example reflects the effect of coarse gold where the small (30–50 g) FA are driving imprecision and the larger 500 g PhotonAssay™ charges reduce that imprecision. Pulverisation for PhotonAssay™ adds no value (more expensive and takes more time) and could result in contamination of grinding equipment.
In Figure 9 it can be seen that the FA provides an acceptable TME across all grades (<±20%, most <±15%) for fine gold-bearing mineralisation. The move to PhotonAssay™ (crushed) reduces the TME further to less than ±8% and PhotonAssay™ (pulverised) even lower to below ±5%. This example reflects the presence of fine-grained gold where FA is performing well and the application of PhotonAssay™ based solely on TME is not warranted. However, other matters become important, such as TAT and ESG (Table 1). Crushing the material is effective, with no need for pulverisation, thus reducing both cost and TAT.

3.2.6. Summary

In fine gold-dominated and disseminated mineralisation the bias between PhotonAssay™ and FA may be minimal (≤±3%) (Figure 5). This indicates that both methods are working well, and that assay improvement alone may not be the decision point for the change to PhotonAssay™. Other matters such as improved TAT (including no pulverisation), cost reduction, better sustainability metrics and greater safety are important considerations (Table 1).
Challenges may occur in mineralisation bearing coarse gold, where the larger PhotonAssay™ jar size of 500 g (or multiple jars [4,10,13]) may reduce the TME but result in a positive “bias” with respect to PhotonAssay™ (Figure 4 and Figure 6). This does not relate to the method, but because the large assay charge is capturing more coarse gold particles—effectively reducing the FSE [2,3,4].
Bias, in the context of gold assays, is the systematic to non-systematic difference between two assays (e.g., PhotonAssay™ versus FA) observed as results that are higher or lower. The drivers of bias relate to the sampling process (systematic) and/or the sample mass (non-systematic). The bias sometimes recognised between PhotonAssay™ and FA does not relate to any error in the assay method but in the size of the assay lot. In a coarse-gold mineralisation, a 500 g PhotonAssay™ jar (or multiple jars) has a higher probability of capturing “rare” gold particles than a 30 g or 50 g FA. In this case the PhotonAssay™ grades are likely to be higher than FA, as they contain more gold. Again, the PhotonAssay™ method is not biased and gives a more representative assay. If a 500 g PhotonAssay™ charge is drawn from a 3 kg RC sub-sample, then the probability of drawing zero coarse gold particles is 19%, whereas if a 30 g FA charge is taken the probability is 90%. In this case, the PhotonAssay™ is providing a more representative result than FA.
There will always be the question of whether to “crush” or “pulverise” the sample material in question [4,40]. The answer is simple—do the testwork; the HS protocol is well-suited (Figure 7). Crushing-only may result in high FSE during splitting from sample to jar, whereas pulverisation can lead to gold contamination/loss (PE). Both are enhanced in the presence of coarse gold; a compromise may be required. For example, at the coarse gold-bearing Beatons Creek project a reduction in TME with pulverisation was observed; however, the additional time and cost to pulverise was deemed too high, so crushed material was assayed via five PhotonAssay™ jars (Figure 2) [10].
Two test methods are recommended, the TFS and the HS. Given the focus of most CQPs to determine TME and bias between PhotonAssay™ and the existing assay method (e.g., FA), the HS provides the most useful approach. The CQP may opt to devise their own testwork programmes.
Once testwork is complete, the final decision to adopt PhotonAssay™ is required. This will involve the key stakeholders, in particular the CQP, who will have undertaken enough due diligence to be comfortable signing-off on Exploration Results and/or Mineral Resources based on the method.
The question of “how much is enough” is up to the CQP. As a general guideline, if >150 test comparisons have been undertaken across a given mineralised domain covering the full range of grades and show acceptable results, then this is likely to be enough. If mineralisation is heterogeneous and dominated by coarse gold, then a higher number of comparisons may be beneficial.
Assuming an affirmative decision, the journey to PhotonAssay™ moves to the “intent” stage.

3.3. Intent

At this stage of the journey, the focus is on the business case and the pathway to deployment. A number of different deployment models are available to the company which principally includes PhotonAssay™ services via a commercial laboratory provider at their facilities, or a PhotonAssay™ unit deployed to the mine site and operated by either the company or a commercial provider.
Key to the business case is the selection of a deployment model across an on-site unit (self- or laboratory-service-provider operated) or via a laboratory service provider. Selection will come down to company size, number of jars/assays per month and geographic location. A junior may only yield a few thousand assays per month, whereas a major company with multiple regional operations (and exploration) may yield 10,000 s per month, noting that a PhotonAssay™ unit has a capacity of 40,000 single jar assays per month using PAAU02 [39].
This stage will include the contractual negotiations, which may include Chrysos and/or a laboratory service provider. Direct site deployment will require negotiation and agreements with Chrysos to supply, deliver and setup the unit and may also include a laboratory service provider who will operate the facility, including sample preparation. A project management function will need to be implemented to ensure all timelines are understood and performance gates defined.
Off-site options include sending all samples for preparation and analysis at a laboratory service provider or setting up an onsite preparation facility (operated by a laboratory service provider), with forwarding of prepared samples to an offsite PhotonAssay™ facility. The fully off-site model is the quickest to implement, given that the facilities via the service provider are already available.
For example, when Novo Resources Corp. instigated PhotonAssay™ at its then Beatons Creek operation, it opted to have sample preparation undertaken by a third party on site, with filled jars transported to an accredited commercial laboratory in Perth [10]. In this case, the number of jars generated by resource development and grade control drilling was <40,000 per month, therefore it did not warrant deployment to site. The period to implement the assaying protocol was less than 6 months to meet imminent production. The existing sample preparation facilities on site could be made operational quickly in collaboration with the contracted operator (Figure 2). Other operators such as the Agnico Eagle Fosterville operation were able to deploy a unit to a local commercial laboratory (within 29 km) where both sample preparation and PhotonAssay™ are undertaken [11]. Ravenswood Gold Pty Ltd. in Queensland and Pantoro Gold Ltd. in Western Australia have deployed units directly to site [41,42].
If an on-site PhotonAssay™ deployment is planned or even for just a sample preparation facility, this stage must include the appropriate planning and design. It needs to account for the availability of, or installation of buildings, services, etc. Similarly, access to the site needs to be assured given the size of the three PhotonAssay™ cabins. Depending upon geographical location, security of the delivery may also be a consideration. Local regulations with respect to ionising radiation will need to be considered and approvals sought.

3.4. Implementation

Once the business case and contractual agreements are executed, the journey passes to the implementation stage.
On-site deployment needs to see buildings and services installed, ready for unit delivery. On delivery, the Chrysos team install and test, train staff and handover the unit, which takes six to eight weeks. For an off-site deployment, this stage sees the company start to ship samples to the given laboratory. If an on-site sample preparation facility is planned, this needs to see the buildings and services installed, and the drying, crushing (and pulverising if required) and jarring systems in place and evaluated. A LIMS system is required to log and track the samples and control transfer to the offsite PhotonAssay™ facility.
Whichever deployment option is taken, keys steps during implementation relating to sampling, assaying and QA/QC include:
  • Final rig-to-assay optimisation (detailed work should have been undertaken during the consideration–testwork phase).
  • Draft, review and complete all QA documentation from rig to assay.
  • Ensure QC actions and analysis are planned and documented in the QA across duplicates (field, laboratory coarse, and assay duplicates); CRMs; blanks; and check assays.
  • Staff from the rig to the laboratory must be trained in the new procedures.
  • Integration of the LIMS and QC.
  • PhotonAssay™ outputs merged into the database.
During the initial implementation period of 1–3 months, a company may opt to continue to use its original assay route to facilitate additional verification and have dual systems in case of any issues.

3.5. Adoption Timing and Complexity

Adoption of PhotonAssay™ varies between companies, with a general correlation between enterprise size and management structure. Junior explorers and smaller mine operators are more easily/quickly self-selecting into the method. They move from awareness into adoption quickly, as the Geology Manager or equivalent (who may or may not be the CQP) and the Board (the ultimate decision makers) engage easily. This process may be on the scale of a few to 12 or more months.
For example, in the case of Novo Resources Corp. the awareness of PhotonAssay™ was gained in late 2017. After completing a technical review and discussion with Chrysos staff (around three months), the CQPs trialled the technique during the Beatons Creek and Karratha bulk sampling programmes using the first unit. This included pilot plant tails samples; ore sorter testwork samples; diamond core and RC samples; and metallurgical samples (head and tails samples). Subsequent to this, the method was deployed across various projects and in October 2020 to support resource development and grade control drilling at the Beatons Creek mine [10].
In larger companies, particularly operators with multiple sites and layers of corporate management, the pathway from awareness to adoption is more complex and prolonged. That pathway may include Exploration Managers, Mine Geology Managers, Group or Regional Geological Managers, Technical Vice-President, Chief Operating Officer, Chief Financial Officer, relevant CQPs and Quality Managers, and potentially the Board of Directors. The period from awareness to implementation is more likely to be on a scale of >18 months, though it may need to include testwork at multiple operations/projects.

3.6. Barriers Adoption

Despite the wide global adoption of PhotonAssay™, there are still barriers to adoption which may include (in random order):
  • The method is not appropriate to the data outputs required, where for example LeachWELL or PAL is required to map the presence of refractory gold, or SFA is required to map the presence of gravity recoverable gold. This could also include the downstream need to pulverise for other assays (e.g., sulphur, carbon or multi-element analyses), albeit those that can be ameliorated by post-PhotonAssay™ pulverisation and sub-sampling.
  • The method is well-suited to the situation, but geographically no unit is located conveniently to provide a realistic TAT. The logistics across country or continent boundaries to the nearest unit may be difficult and/or costly.
  • The mineralisation in question may generate interferences, usually driven by the presence of uranium and thorium-bearing (e.g., uraninite) and/or barium-bearing minerals (e.g., barites) [31].
  • A reluctance to adopt driven by the “this is the way we have always done this” mentality. This is often lead by a CQP(s) who does not trust the method as they see it as being too “new” or “black box”. Occasionally this reluctance may be transferred across different projects or even companies due to the action of an influential individual(s).
  • Even when the method is technically attractive, an operation has to train staff, change operating procedures, update QAQC dashboards, integrate LIMS, educate management and manage stakeholder perceptions. For an on-site location, space and power need to be provided which can locally require substantial capital investment and take time to provide. In some cases, adoption is seen as “too hard”.
  • For a project near a PhotonAssay™-equipped laboratory, access may be straightforward. For an on-site unit, the economics usually need a steady sample volumes, because Chrysos leases units, and the model is capital-intensive with long-term recurring commitments. The technology is still infrastructure-constrained compared with the global installed base of conventional FA laboratories.
A key discussion point presented by some against PhotonAssay™ adoption relates to “positional heterogeneity”. This refers to variations in assay sensitivity depending on where gold particles are located within the sample jar [4,7,43]. Because X-rays and emitted gamma rays are attenuated as they pass through the sample, gold particles near the centre of the jar are detected more efficiently than those near the jar walls. Theoretical modelling shows that a single gold particle randomly located within a jar can experience a sensitivity variation of approximately 32%, although vertical variations are much smaller (typically ±12%–17%) [7].
The practical impact of positional heterogeneity is generally modest. In real samples, gold is distributed across numerous particles, reducing positional effects through averaging. When combined with the much larger FSE associated with coarse-gold mineralisation, positional heterogeneity increases total uncertainty by about 2.5%–5.0%, equivalent to reducing a 500 g sample to an effective mass of 475–490 g [7]. Extreme segregation may cause bias, but such cases are atypical. The PhotonAssay™ heterogeneity (“HET”) detection flag can be used as a first pass to identify areas with coarse gold mineralisation where gold segregation may occur. [7].

4. Conclusions

Junior explorers through to major mining companies have adopted PhotonAssay™ technology to support activities across the mine value chain. This includes a range of different gold mineralisation styles over five continents.
PhotonAssay™ should not be described as “JORC compliant,” or inherently compliant with any other CRIRSCO-based reporting code. Reporting codes do not certify analytical methods; rather, they require that the method used be demonstrated as fit-for-purpose and disclosed transparently by the CQP. Where sampling, sample preparation and laboratory procedures, QA/QC, and validation outcomes are properly documented, PhotonAssay™ results can be reported in accordance with CRIRSCO-based codes.
The key technical question is therefore not whether PhotonAssay™ is “compliant,” but whether it is appropriate for the mineralisation style and decision context. That judgement must be supported by testwork, robust QA/QC, and clear disclosure.
Two test methods are recommended, the simple TFS (bias between assay methods) and more the complex HS (bias and precision). Comparisons with conventional FA (or other assay method) must be interpreted carefully, as differences may reflect sample representativity and assay mass effects, rather than analytical failure or bias. In addition, it is important for the CQP to understand the nature of the mineralisation in question and its gold deportment [35].
Adoption of PhotonAssay™ is also more than a laboratory decision. In practice, implementation follows a staged pathway of awareness, consideration, intent, and implementation, with each stage requiring technical due diligence, business-case development, and cross-functional engagement. Effective communication between stakeholders is critical across the adoption process, where failure will result in delayed workflows and in some cases no adoption. Successful deployment depends on optimising the rig or face-to-assay workflow, integrating QA/QC and data systems, and ensuring that the CQP is satisfied the method is robust, transparent, and produces fit-for-purpose results. PhotonAssay™ is therefore never a compliance problem, but a technical and organisational pathway to better assay representativity, faster TATs, and more sustainable gold analysis.
Several factors may limit the use of PhotonAssay™ in certain circumstances. The method is not suitable where alternative techniques are required to identify refractory or gravity-recoverable gold. Limited geographic availability can result in costly and slow sample transport affecting rig-to-laboratory TATs. Mineral assemblages, particularly those containing uranium, thorium and/or barium may interfere with results depending on concentration. Adoption is also hindered by resistance to change, especially among practitioners who favour traditional methods or simply do not like change. Operational challenges such as staff training, procedure updates, LIMS integration, and stakeholder education can further discourage implementation. Additionally, on-site deployment requires high sample volumes and a long-term commitment.

Funding

This research received no external funding.

Data Availability Statement

Data is contained within the article.

Acknowledgments

The author acknowledges input from the Chrysos team, particularly James Tickner, Naomi Potter, Tim Sennett and Robyn Cornish-Hall. Staff from various exploration and mining companies are thanked for helpful conversations. In particular, colleagues from Novo Resources Corp. and Snowden Optiro are thanked for discussions. Figure 4, Figure 5, Figure 6, Figure 8 and Figure 9 are reproduced with permission from client-based reports.

Conflicts of Interest

The author is a contractor to Novo Resources Corp. The author has acted occasionally as a consultant to Chrysos Corporation and regularly to mining and exploration entities that wish to, and/or utilise PhotonAssay™ through E3G Advisory. The paper reflects the views of the author and no particular entity.

References

  1. Hoffman, E.L.; Clark, J.R.; Yeager, J.R. Gold analysis—Fire assaying and alternative methods. Explor. Min. Geol. 1999, 7, 155–160. [Google Scholar]
  2. Dominy, S.C. Importance of good sampling practice throughout the gold mine value chain. Min. Technol. 2016, 125, 129–141. [Google Scholar] [CrossRef] [Scilit]
  3. Dominy, S.C. Sampling coarse gold-bearing mineralisation—Developing effective protocols and a case study from the Ballarat mine, Australia. In Proceedings of the World Conference on Sampling and Blending, Perth, Australia, 9–11 May 2017; Australasian Institute of Mining and Metallurgy: Melbourne, Australia, 2017; pp. 71–84. [Google Scholar]
  4. Dominy, S.C.; Graham, J.C.; Esbensen, K.H.; Purevgerel, S. Application of PhotonAssay™ to coarse-gold mineralization: The importance of rig to assay optimization. Sampl. Sci. Technol. 2024, 1, 2–30. [Google Scholar] [CrossRef] [Scilit]
  5. Tickner, J.; Ganly, B.; Lovric, B.; O’Dwyer, J. Improving the sensitivity and accuracy of gamma activation analysis for the rapid determination of gold in mineral ores. Appl. Radiat. Isot. 2017, 122, 28–36. [Google Scholar] [CrossRef] [Scilit] [PubMed]
  6. Tickner, J.; Preston, R.; Treasure, D. Development and operation of PhotonAssay™ system for rapid analysis of gold in mineral ores. In Proceedings of the ALTA Conference, Perth, Australia, 19–26 May 2018; ALTA Metallurgical Services Publications: Melbourne, Australia, 2018; pp. 50–60. [Google Scholar]
  7. Tickner, J.; Chuah, J.; Weatherstone, A.; Sennett, T. PhotonAssay™: A review of real-world performance on heterogeneous gold ores. Sampl. Sci. Technol. 2026, 5, 76–94. [Google Scholar] [CrossRef] [Scilit]
  8. Tremblay, C.D.; Tickner, J.; Treasure, D.; Oteri, A.; Wheeler, G. PhotonAssay™—Efficient and bulk gold analysis in the modern world. In Proceedings of the International Mining Geology Conference, Perth, Australia, 25–26 November 2019; Australasian Institute of Mining and Metallurgy: Melbourne, Australia, 2019; pp. 88–98. [Google Scholar]
  9. GHD. Emissions, Energy and Waste Assessment—PhotonAssay™ and Fire Assay; Assessment Report for Chrysos Corporation; GHD Pty Ltd.: Melbourne, Australia, 2025; 18p. [Google Scholar]
  10. Dominy, S.C.; Graham, J.C.; Glacken, I.M. Evaluation of coarse gold-bearing conglomerate mineralisation at Beatons Creek, Pilbara, Western Australia: Sampling for resource development and grade control. Minerals 2024, 14, 337. [Google Scholar] [CrossRef] [Scilit]
  11. Hitchman, S.P.; Simbolon, S.; Symons, D.J.; Hoare, J.P.; Carpenter, J.B. Implementation of the Chrysos PhotonAssay™ method at Fosterville gold mine, Victoria. In Proceedings of the International Mining Geology Conference, Perth, Australia, 7–8 May 2024; Australasian Institute of Mining and Metallurgy: Melbourne, Australia, 2024; pp. 341–345. [Google Scholar]
  12. Dominy, S.C.; Petersen, J.S. Sampling coarse gold-bearing mineralisation—Developing effective protocols and a case study from the Nalunaq deposit, Southern Greenland. In Proceedings of the World Conference on Sampling and Blending, Sunshine Coast, Australia, 9–12 May 2005; Australasian Institute of Mining and Metallurgy: Melbourne, Australia, 2005; pp. 151–165. [Google Scholar]
  13. Dominy, S.C.; Glass, H.J. Geometallurgical sampling and testwork for gold mineralisation: General considerations and a case study. Minerals 2025, 15, 370. [Google Scholar] [CrossRef] [Scilit]
  14. Chrysos. Corporate Presentation; Chrysos Corporation: Adelaide, Australia, 2026; p. 18. Available online: https://wcsecure.weblink.com.au/pdf/C79/03085971.pdf (accessed on 20 June 2026).
  15. JORC. Australasian Code for Reporting of Exploration Results, Mineral Resources and Ore Reserves—The JORC Code; Joint Ore Reserves Committee of the Australasian Institute of Mining and Metallurgy, Australian Institute of Geoscientists and Minerals Council of Australia: Melbourne, Australia, 2012; p. 44. Available online: https://www.jorc.org/docs/JORC_code_2012.pdf (accessed on 26 March 2026).
  16. NI 43-101; National Instrument 43-101 Standards of Disclosure for Mineral Projects. British Columbia Securities Commission: Vancouver, BC, Canada, 2023. Available online: https://www.bcsc.bc.ca/-/media/PWS/New-Resources/Securities-Law/Instruments-and-Policies/Policy-4/43101-NI-July-25-2023.pdf?dt=20230720163240 (accessed on 1 July 2026).
  17. CRIRSCO. International Reporting Template for the Public Reporting of Exploration Targets, Exploration Results, Mineral Resources and Mineral Reserves; CRIRSCO: Montreal, QC, Canada, 2024; p. 79. Available online: https://crirsco.com/wp-content/uploads/woocommerce_uploads/2024/06/CRIRSCO_International_Reporting_Template_June2024_Update_Approved_for_Release_20240627-dl8515.pdf (accessed on 26 March 2026).
  18. ASIC. Corporate Finance Update—Issue 27. February 2026. Available online: https://www.asic.gov.au/about-asic/corporate-publications/newsletters/asic-corporate-finance-update/corporate-finance-update-issue-27/ (accessed on 26 March 2026).
  19. Form 43-101F1: Technical Report; British Columbia Securities Commission: Vancouver, BC, Canada, 2011; p. 12. Available online: https://www.bcsc.bc.ca/-/media/PWS/Resources/Securities_Law/Policies/Policy4/43101F1F.pdf (accessed on 1 July 2026).
  20. CIM. Definition Standards for Mineral Resources and Mineral Reserves; CIM: Montreal, QC, Canada, 2014; p. 9. Available online: https://mrmr.cim.org/media/1128/cim-definition-standards_2014.pdf (accessed on 26 March 2026).
  21. Stanley, C.R.; Smee, B.W. Strategies for reducing sampling errors in exploration and resource definition drilling programmes for gold deposits. Geochem. Explor. Env. Anal. 2007, 7, 329–340. [Google Scholar] [CrossRef] [Scilit] [PubMed]
  22. Smee, B.W.; Bloom, L.; Arne, D.; Heberlein, D. Practical applications of quality assurance and quality control in mineral exploration, resource estimation and mining programmes: A review of recommended international practices. Geochem. Explor. Env. Anal. 2024, 24. [Google Scholar] [CrossRef] [Scilit]
  23. Dominy, S.C.; Purevgerel, S.; Esbensen, K.H. Quality and sampling error quantification for gold mineral resource estimation. Spectrosc. Eur. 2020, 32, 21–27. [Google Scholar] [CrossRef] [Scilit]
  24. Pitard, F.F.; Pitard, M.A. Theory of Sampling and Sampling Practice; CRC Press: Boca Raton, FL, USA, 2026; p. 683. [Google Scholar]
  25. IMS. The Worlds Only CRMs Specifically Designed for Chrysos PhotonAssay™. Independent Mineral Standards. 2025, p. 2. Available online: https://imstandards.com.au/wp-content/uploads/2025/03/IMS_CrushedCRMs-Primary_A4.pdf (accessed on 26 March 2026).
  26. Chrysos. Quality Control Procedures for PhotonAssay™ Systems; Technical Note 401; Chrysos Corporation: Adelaide, Australia, 2024; p. 12. [Google Scholar]
  27. Chrysos. Recommended CRM Gross Masses—Pulverised Materials; Knowledge Base Article (Application Note 001); Chrysos Corporation: Adelaide, Australia, 2024; p. 4. [Google Scholar]
  28. Chrysos. Preparation of Pulverised CRM Jars; Work Instruction WI-023C; Chrysos Corporation: Adelaide, Australia, 2026; p. 6. [Google Scholar]
  29. ISO 9001:2015; Quality Management Systems—Requirements. ISO: Geneva, Switzerland, 2015. Available online: https://www.iso.org/standard/62085.html (accessed on 26 March 2026).
  30. ISO/IEC 17025:2017; General Requirements for the Competence of Testing and Calibration Laboratories. ISO: Geneva, Switzerland, 2017. Available online: https://www.iso.org/standard/66912.html (accessed on 26 March 2026).
  31. Chrysos. Impact of U, Th and Ba on Measurement Performance for Gold with PhotonAssay™; Technical Note TN-106; Chrysos Corporation: Adelaide, Australia, 2024; p. 6. [Google Scholar]
  32. Minnitt, R.C.A.; Rice, P.; Spangenberg, C. Experimental calibration of sampling parameters K and alpha for Gy’s formula by the sampling tree method. J. S. Afr. Inst. Min. Metall. 2007, 107, 513–518. [Google Scholar]
  33. Chieregati, A.C. A brief review of Heterogeneity Tests for estimating the variance of the FSE. Sampl. Sci. Technol. 2024, 2, 19–29. [Google Scholar] [CrossRef] [Scilit]
  34. Chieregati, A.C.; Prado, G.C.; Fernandes, F.L.; Villanova, F.L.S.P.; Dominy, S.C. A comparison between the standard Heterogeneity Test and the simplified Segregation Free Analysis for sampling protocol optimisation. Minerals 2023, 13, 680. [Google Scholar] [CrossRef] [Scilit]
  35. Dominy, S.C.; Platten, I.M.; Glass, H.J.; Purevgerel, S.; Cuffley, B.W. Determination of gold particle characteristics for sampling protocol optimisation. Minerals 2021, 11, 1109. [Google Scholar] [CrossRef] [Scilit]
  36. Benz Mining. PhotonAssay Delivers Increase in Reported Gold and Confirms Coarse Gold; News Release dated 3 November 2021; Benz Mining: Vancouver, BC, Canada, 2021; p. 37. [Google Scholar]
  37. Sterk, R.; Nessler, J.; van der Ven, M.; Knorsch, M.; Woestenburg, D. PhotonAssay™—Techniques and workflows to establish fitness for purpose. In Proceedings of the International Mining Geology Conference, Brisbane, Australia, 21–22 April 2026; Australasian Institute of Mining and Metallurgy: Melbourne, Australia, 2026; pp. 95–114. [Google Scholar]
  38. Tickner, J.; Lannan, O.; Preston, R. Comparing different assay methods for the determination of mineral grade. Journ. Geochem. Exp. 2021, 226, 106780. [Google Scholar] [CrossRef] [Scilit]
  39. Chrysos. PhotonAssay™ Measurement Performance for PAAU02; Performance Note PN-001; Chrysos Corporation: Adelaide, Australia, 2022; p. 2. [Google Scholar]
  40. Francois-Bongarcon, D.F.; Abzalov, M. The elusive fine gold problem or the distractive power of coarse gold. In Proceedings of the World Conference on Sampling and Blending, Johannesburg, RSA, 21–23 May 2024; Southern African Institute of Mining and Metallurgy: Johannesburg, South Africa, 2024; pp. 75–79. [Google Scholar]
  41. Pantoro. Site Visit Presentation. ASX Release 17 November 2025. Available online: https://app.sharelinktechnologies.com/announcement-preview/asx/c9f6320b0cc16723b31c01b5e464fcb0 (accessed on 26 March 2026).
  42. Ravenswood. How Ravenswood Gold Reduced Assay Costs. 2024. Available online: https://photonassay.com/ravenswood-gold-mine/ (accessed on 26 March 2026).
  43. Oliver, R.; François-Bongarçon, D. PhotonAssay™: A new, revolutionary technique everybody wants to see succeed—An independent evaluation Part 2: The effect of positional heterogeneity on gold determinations using PhotonAssay. Sampl. Sci. Technol. 2026, 5, 64–72. [Google Scholar] [CrossRef] [Scilit]
Figure 1. Illustration of the PhotonAssay™ process.
Minerals 16 00751 g001
Figure 2. Novo Resources Corp. former Nullagine (WA) site preparation laboratory. (Top left) received samples ready to be placed into dryers. (Top right) general view of the sample preparation area. (Bottom left) Orbis smart crusher. (Bottom right) five filled PA jars which comprise one assay sub-sample.
Minerals 16 00751 g002
Figure 3. Flowsheet of the transitional feasibility study.
Minerals 16 00751 g003
Figure 4. Tukey bias plot showing comparison between 120 FA and PhotonAssay™ (crushed) for coarse gold-bearing mineralisation. Horizontal lines: blue—mean plus 1x standard deviation; yellow—mean grade ratio.
Minerals 16 00751 g004
Figure 5. Tukey bias plot showing comparison between FA and PhotonAssay™ (crushed) for fine gold-bearing mineralisation. Yellow area—mean plus 1x standard deviation; yellow horizontal line—mean grade ratio.
Minerals 16 00751 g005
Figure 6. Tukey bias plot showing comparison between FA and PhotonAssay™ (crushed) for coarse gold-bearing mineralisation. Yellow area—mean plus 1x standard deviation; yellow horizontal line—mean grade ratio.
Minerals 16 00751 g006
Figure 7. Flowsheet of the heterogeneity study.
Minerals 16 00751 g007
Figure 8. Example precision plot based on a HS comparing FA and PhotonAssay™ (crushed to 2 mm and pulverised to 75 µm) for coarse gold-bearing mineralisation.
Minerals 16 00751 g008
Figure 9. Example precision plot based on a HS comparing FA and PhotonAssay™ (crushed to 2 mm and pulverised to 75 µm) for fine gold-bearing mineralisation.
Minerals 16 00751 g009
Table 1. Key considerations for potential users. PA: PhotonAssay™; ESG: Environment, Social and Governance.
Key ConsiderationCommentAction
Precise and unbiased assaysBy far the most important, seeking improved TME compared to FA and no biasLarger assay mass of PA (400–600 g) compared to FA
Undertake testwork (refer to next section) [5,6,7,8]
Fast/improved TATAll parties are looking for improved speed for getting assays from the rig (core or RC) and/or underground face samples, and/or from the process plantPA is generally faster than the FA process. Consideration needs to evaluate all options for unit location and impact on total TAT. If pulverisation is not required, this results in a time saving [5,6,7,8]
Cost effectiveAs a new method it is important for it to be cost effectivePA is priced around the same as a standard FA, though local variations are observed, and it can be more expensive than FA. If pulverisation is not required, this results in a cost saving
Improved ESG parametersRemoval of lead and waste (FA process)
Reduction in energy consumption and CO2 footprint
Reuse or recycling of PA jars
Refer to GHD [9] for analysis.
PA jars can be reused after appropriate cleaning; robotic emptying and cleaning is available
Free from interferencesAcross matrix and gangue, and granulometry of the assayed sub-sample (e.g., crushed or pulverised)PA has documented interferences which increase the LDL and decrease precision [5,6,31]
Total gold assayTotal gold assay in the context of detector efficiency and X-ray interaction with the samplePA is known to be a total gold assay method [5,6,7,8]
Disclaimer/Publisher’s Note: The statements, opinions and data contained in all publications are solely those of the individual author(s) and contributor(s) and not of MDPI and/or the editor(s). MDPI and/or the editor(s) disclaim responsibility for any injury to people or property resulting from any ideas, methods, instructions or products referred to in the content.