Article

A New Two-Step Approach to Studying Early Medieval Lustre Ceramics from Sudan: Minimizing Destructiveness by Preliminary Micro-X-Ray Fluorescence Analysis


1
Department of Analytical Chemistry, Faculty of Chemistry, Lomonosov Moscow State University, 119992 Moscow, Russia
2
Research Institute and Museum of Anthropology, Lomonosov Moscow State University, 125009 Moscow, Russia
3
Faculty of Chemistry, Lomonosov Moscow State University, 119992 Moscow, Russia
4
Discipline of Biological and Chemical Sciences, School of Agriculture, Geography, Environment, Ocean and Natural Sciences (SAGEONS), The University of the South Pacific, Suva, Fiji
*
Authors to whom correspondence should be addressed.
Minerals 2026, 16(7), 713; https://doi.org/10.3390/min16070713
Submission received: 20 May 2026 / Revised: 21 June 2026 / Accepted: 3 July 2026 / Published: 7 July 2026
(This article belongs to the Special Issue Mineral Pigments: Properties Analysis and Applications)

Abstract

The present study introduces a novel two-step multi-analytical approach for studying lustre ceramics, aiming to minimize damage to valuable artifacts. The method combines a completely non-destructive preliminary micro-X-ray fluorescence (micro-XRF) analysis, providing semi-quantitative information and elemental mapping, with micro-destructive transmission electron microscopy (TEM) for detailed nanoparticle (NP) morphology studies on selected areas. Diffuse reflectance spectroscopy (DRS) is also employed as a non-destructive method to quantify lustre colour. This approach was applied to 20 samples of 9th- to 12th-century AD lustre ceramics from the Deraheib site in Northern Sudan. The research aimed to verify the lustre technique, characterize lustre properties (nanoparticle size, colour), and identify the ceramic production center based on glaze composition. The results from micro-XRF and TEM confirmed the presence of silver (Ag) and copper (Cu) in the lustre, with Ag NPs having a median size of 8 nm. Semi-quantitative micro-XRF analysis of the glaze indicated a composition rich in lead and tin oxides (PbO and SnO2, 5%–15%) and magnesium oxide (MgO, 3%). This composition strongly correlates with published data for lustre ceramic production in Basra, Iraq, suggesting it as the likely origin, and ruling out Fustat, Egypt.

Graphical Abstract

1. Introduction

Lustre, a technique for decorating glazed ceramics that produces vibrant colours with a metallic sheen and iridescent reflections, first appeared in the Middle East in the 8th–9th centuries CE [1]. The vibrant colour and metallic sheen of the glaze are imparted by a thin layer of metallic (Ag) and copper (Cu) nanoparticles (NPs). This layer, which does not exceed 1 micron in thickness, consists of NPs ranging from 5 to 50 nm. The interaction of these NPs with incident light creates a phenomenon known as plasmon resonance, which is responsible for the characteristic vibrant colour and metallic sheen [2]. The technology for producing such coatings involves applying a special paint to the surface of glazed ceramics, consisting of Ag and/or Cu salts and a binder. The ceramic piece is then fired in a kiln at a low temperature, with a reducing atmosphere maintained to reduce the metals from the salts [3]. Archaeological lustre ceramics have been studied using a wide range of analytical methods [4,5], including synchrotron micro-X-ray diffraction and XANES spectroscopy. Of equal interest to researchers is the technology and composition of Islamic ceramic glazes [6].
Lustre ceramics are valuable cultural heritage objects, as is the lustre technique itself, with its rich history of creation, development, and dissemination. Therefore, studying these objects requires carefully balancing the information gained about their production technology with the destructiveness of the research methods employed. Classic bench-top X-ray fluorescence (XRF) is often used as a non-destructive method for studying archaeological ceramics. However, achieving reliable results typically necessitates at least mechanical cleaning and polishing of the sample surface [7]. Furthermore, obtaining more precise data often requires grinding 150 milligrams [8] to 1 g of sample for subsequent pressing into a tablet or fusion into glass [9]. In contrast, portable XRF allows for the analysis of ceramic sample surfaces without destructive sample preparation. However, the uncertainty associated with such measurements and their comparability with results obtained by other methods has been the subject of a long-standing debate in the literature [10].
Using a scanning electron microscope equipped with energy-dispersive X-ray spectroscopy (SEM-EDX), while a micro-destructive method for studying archaeological ceramics, allows for the separate analysis of glaze and ceramic body composition [9,11]. However, the requirement to sample only a few milligrams of material often results in a poorly representative sample. Thus, the present study introduces a novel two-step approach designed to minimize damage to valuable artifacts, where completely non-destructive bench-top micro-XRF mapping data is employed to select points for micro-destructive sampling. Individual small sections of the sample are examined using the transmission electron microscopy (TEM) method to study NP morphology. To the best of our knowledge, this two-step analysis scheme for lustre ceramics has not been previously reported in the literature. Additionally, diffuse reflectance spectroscopy (DRS) serves as another non-destructive analytical method in this study [12]. Therefore, this proposed approach was successfully applied to 20 samples of early Medieval lustre ceramics, believed to date from the 9th to 12th centuries AD, discovered during archaeological excavations at the Deraheib site in the Northern Sudan. This research report aimed to achieve several key objectives: firstly, to verify that the discovered samples were indeed produced using the lustre technique; secondly, to determine lustre characteristics, such as NP size and coating colour; and thirdly, to identify the potential center of ceramic production based on the glaze composition.

2. Archaeological Context

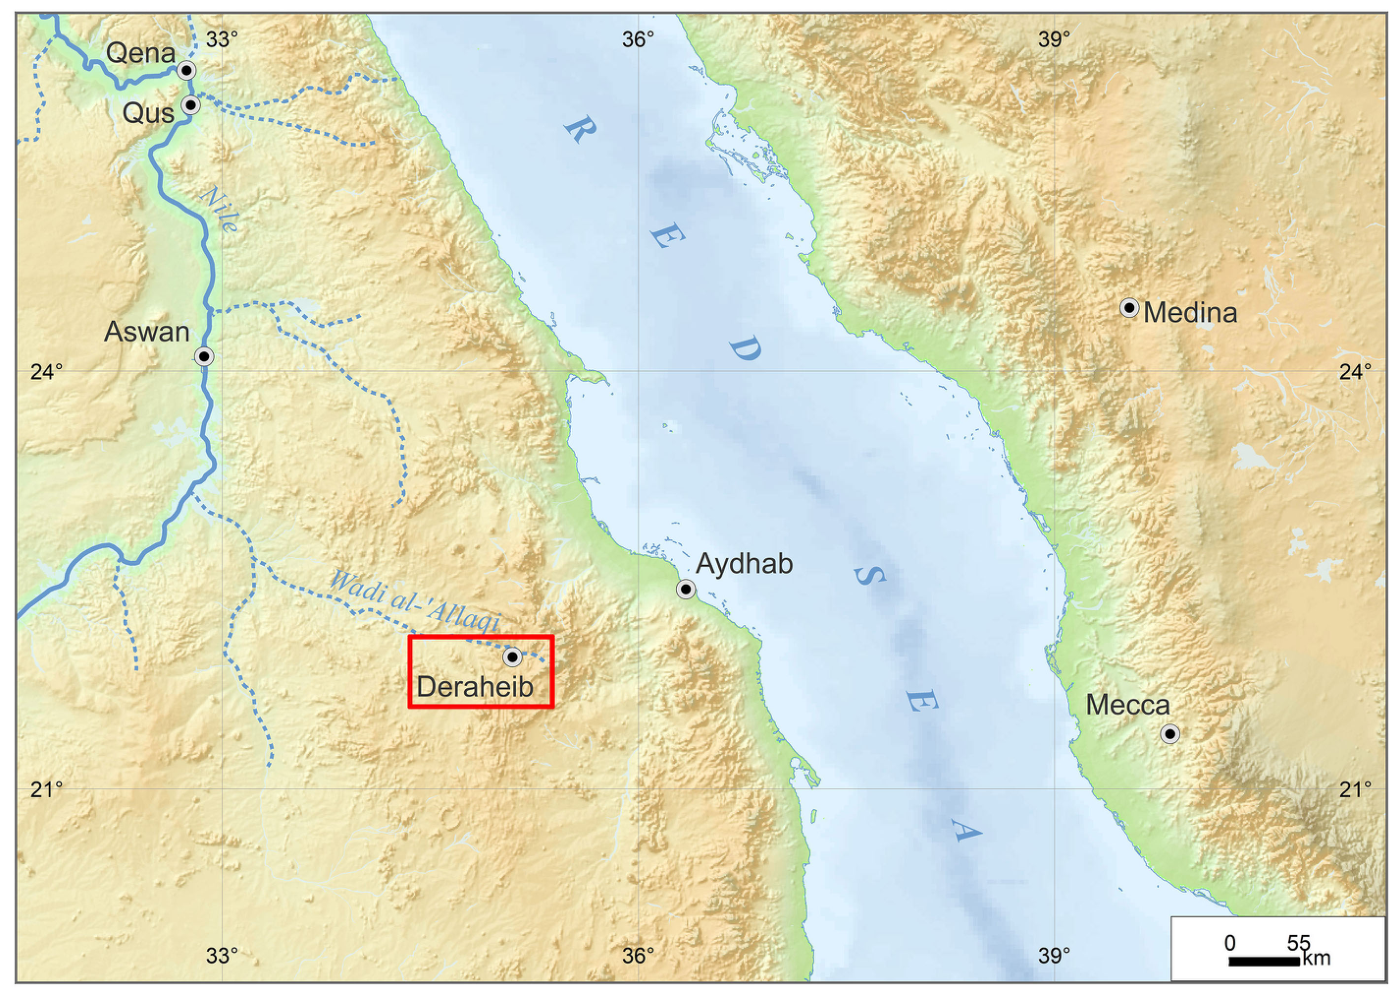
Since 2017, the Nubian Archaeological and Anthropological Expedition of the Research Institute and Museum of Anthropology of the Moscow State University has been working at the site of Deraheib (Figure 1), located in the upper reaches of Wādī al-ʽAllāqī in the Republic of Sudan [13]. So far, six seasons of field research have been conducted at the Deraheib site [13].
The pottery discovered at the Deraheib site exhibits a remarkable diversity, with a primary focus on the Medieval era spanning the 9th to 12th centuries. One of the most prominent features of the ceramic assemblages from Deraheib is the presence of luxury wares, including lustre ceramics and imports from Palestine and China. During the archaeological excavations conducted at the site, 23 fragments of glazed ceramic vessels were unearthed. Based on preliminary analysis, these sherds were identified as fragments of lustre wares. The majority of these lustre fragments (20 in number, Table 1) were recovered from a test trench near the Northern Fortress, which was excavated during the February–March 2022 season. These sherds have become the focus in the present study.
All the ceramic fragments discovered at the site were subjected to preliminary analysis in order to identify them according to the groups and types of vessels documented in the literature [13,14]. A preliminary examination of the drawings represented on the glazed sherds, as well as an analysis of the fabric’s samples using high-resolution videomicroscopy (RH-2000 microscope, Hirox, Limonest, France), concluded that all these pottery fragments can be confidently attributed to a single category, most likely monochromatic Iraqi lustre wares dating back to the 10th century. However, in certain instances, the historical and ceramic analysis of the vessel fragments does not allow for a definitive recognition of their precise origin. The deliberations have been centered on Basra and Fustat as potential production sites [13,14]. In initial studies, the archaeological team expressed optimism that further research will clarify whether the pottery fragments in question have a common or differing way of production, enabling us to understand whether the samples constitute a single group in terms of their composition, and whether they originate from one or multiple production centers [13].
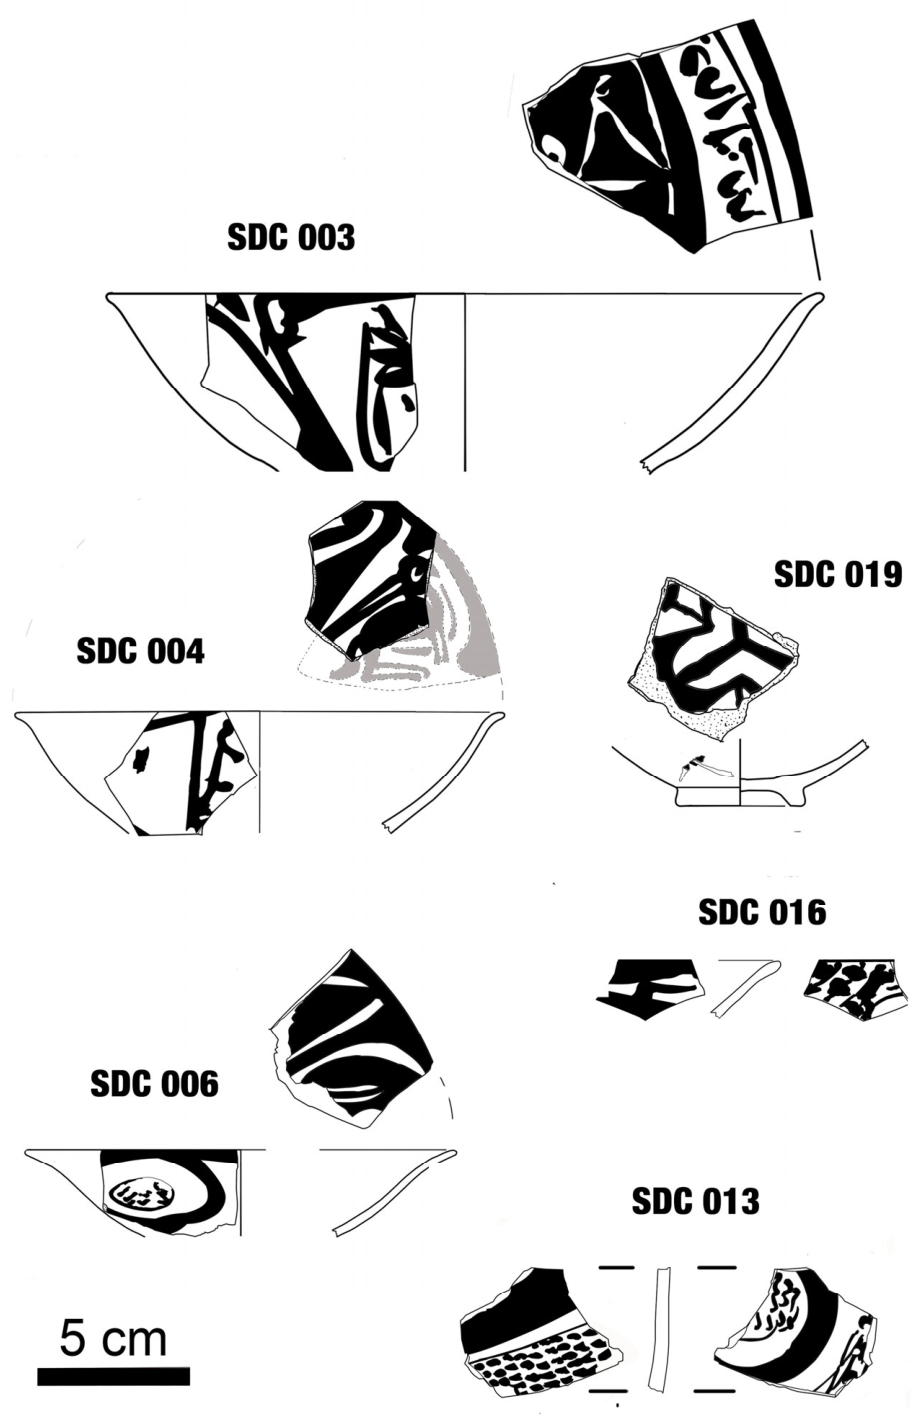
In particular, it was confirmed that the presence of a significant number of similar lustre fragments from various vessels nonetheless belong to the same group—elegant, figurative, and floral-adorned small bowls that could form complete table sets with depictions of the so-called “palace pleasures” (Figure 2). Among the most intriguing fragments, there is a sherd (SDC-016) with a representation of a foot on its inner surface. Based on certain analogies from museum collections worldwide (a bowl found in Nishapur from the Metropolitan Museum of Art [15]; the bowl from the National Museum of Kuwait [16]), it appears to be a fragment of a bowl with a representation of a musician playing the lute. The exterior of the lustre wares is often adorned with depictions of oval medallions, within which are inscribed blessings for the drinker, either in Arabic script or in a style that imitates it (SDC-006, SDC-010, SDC-013). There are several fragments of lustre sherds among the Deraheib site findings (a potsherd with an Arabic inscription and a floral ornament (SDC-003), a fragment of bowl with a rosette (SDC-019), and a bowl with hare depictions (SDC-004)) whose origin is uncertain. Visual analysis of the fabric of these fragments suggests a Mesopotamian origin: a typical pinkish-cream Basra clay [1,17]. However, similar bowls are often attributed to Egyptian lustre of the late 10th century, which originated in Fustat [18,19]. It will not be feasible to resolve this issue without undertaking further investigation employing chemical analysis techniques.

3. Materials and Methods

3.1. Analytical Instruments

The micro-X-ray fluorescence elemental mapping was performed using a Tornado M4+ spectrometer (Bruker, Berlin, Germany). The spectrometer was equipped with an X-ray tube with a Rh anode and polycapillary focusing optics. Area mapping was conducted with a 60 µm pixel size and a 50 ms dwell time. The sample chamber was maintained at a 25 mbar vacuum, and the sample was analyzed without any pre-treatment. High-resolution transmission electron microscopy (HR-TEM) images were acquired using a JEM2100F aberration-corrected TEM (Jeol, Tokyo, Japan) operated on 200 kV, equipped with a JEOL JED2300 series energy-dispersive X-ray spectrometer (EDX). The High-Angle Annular Dark-Field (HAADF) images and EDX spectra were recorded in scanning TEM (STEM) mode with a probe size of 1 nm. The portable UV–vis diffuse reflectance spectrometer EyeOne i1 Pro (X-Rite, Grand Rapids, MI, USA) was used for quantitative evaluation of sample colours. Data registration was carried out using the EyeOne Share v. 1.4 software (X-Rite, Grand Rapids, MI, USA). The diffuse reflectance spectrum was recorded in the range of 380–730 nm, with a step of 10 nm.

3.2. Transmission Electron Microscopy Sample Preparation

A small fragment of a ceramic shard was cut using a precision diamond disc cutter, as illustrated in Figure S1. Subsequently, the ceramic layer was detached from the glaze layer employing the same disc cutter. The glaze layer was manually thinned through polishing until it became perforated. Following this, the polished fragment was placed into a 1.5 mL test tube and crushed. Then, 0.5 mL of ethanol was added, and the sample was subjected to treatment in an ultrasonic bath for 15 min. Several drops of the resulting suspension were deposited onto copper mesh for TEM analysis. The mesh was allowed to dry for a duration of 15 min.

4. Results and Discussion

The first objective was to confirm that the ceramic decorations were indeed made using the lustre technique. For this, micro-X-ray fluorescence (micro-XRF) analysis was employed, enabling a completely non-destructive examination of samples without sample preparation. The micro-XRF data also facilitated the selection of a small fragment from one of the samples for subsequent transmission electron microscopy (TEM). This two-stage approach to lustre ceramics analysis minimized damage to the entire sample set. The micro-XRF and TEM data were further supplemented by a quantitative determination of the sample colour characteristics using DRS. The second objective was to acquire semi-quantitative data on the glaze composition of the samples, a task also addressed using micro-XRF.

4.1. Micro-X-Ray Fluorescence Mapping

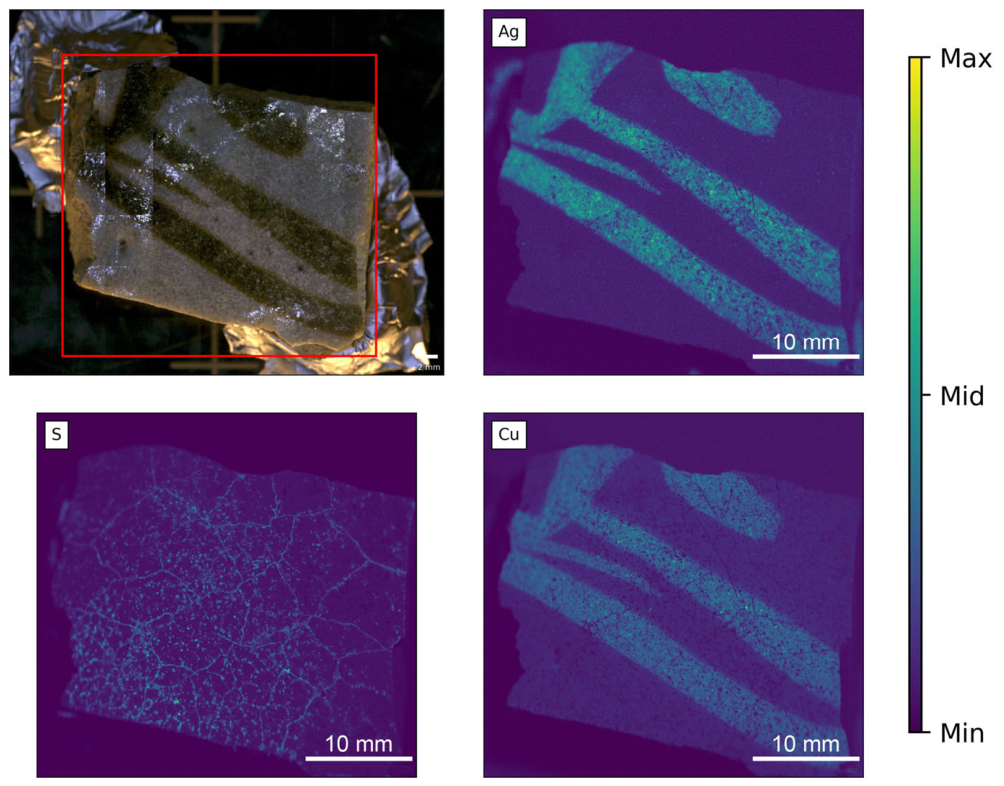
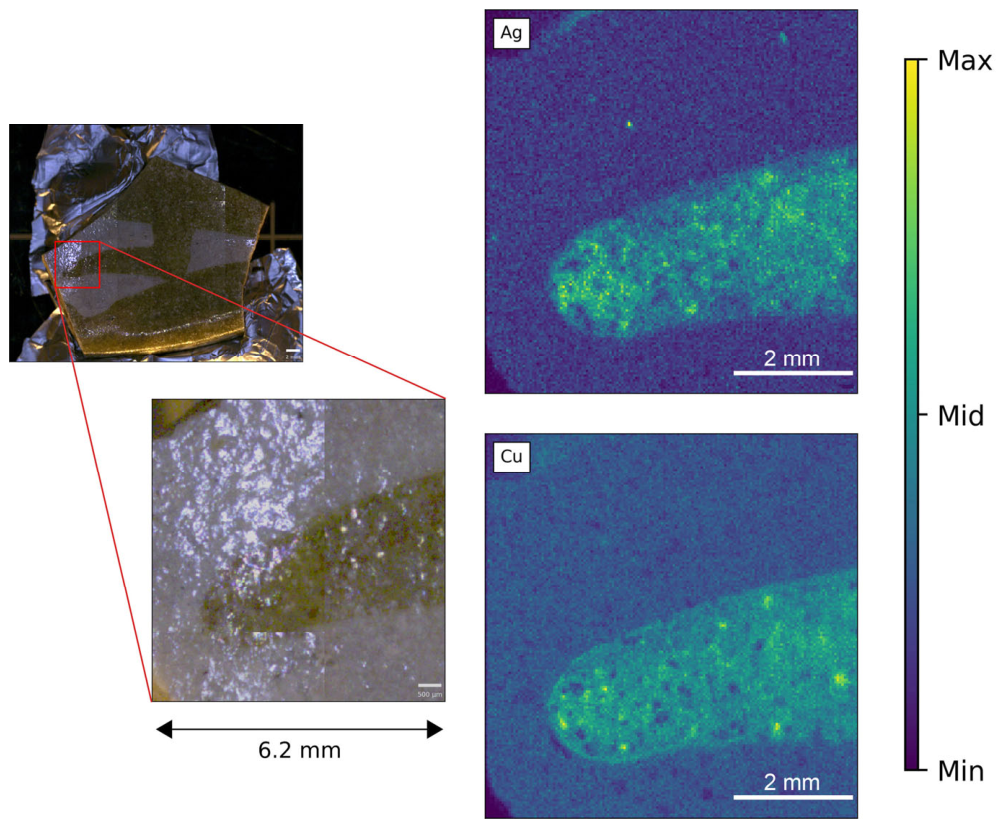
The micro-XRF mapping was carried out for 18 samples. The maps show the qualitative distribution of elements across the sample surface. A quantitative analysis of the obtained data was not performed, as X-ray fluorescence results are known to be significantly dependent on the surface geometry of the sample being studied and its microheterogeneity. At this stage of the work, qualitative data regarding the distribution of silver and copper across the sample surfaces were of value. Two samples were not mapped due to their concave shape and sharp edges, which could damage the XRF instrument. An example of a map representing the entire specimen is depicted in Figure 3, while an example illustrating a close-up view of a specific portion of another specimen is presented in Figure 4. The remaining maps for the rest of the samples are included in the Supplementary Materials.
The regions of the ceramic surface exhibiting an amber hue display elevated intensities of Ag and Cu fluorescence lines, in contrast to the white glaze. This observation suggests that the lustre pigment comprised a combination of Ag and Cu. The determination of the Ag/Cu ratio from micro-XRF data is problematic because precise calculations require a priori knowledge of the lustre layer’s thickness. These calculations are further complicated due to the variations in the thicknesses of the lustre and glaze layers across the sample’s surface, as well as the non-planar surface of the ceramic shard. As shown in Figure 5, the Cu distribution exhibits sharp contours, with a slightly greater intensity than the internal solid colouring area.
According to Pradell et al. [1], lustre paint recipes are very diverse but in all cases include clay, Cu or/and Ag compounds and a sulphur (S)-containing compound. In this regard, it was of interest to look at the S distribution map, as well as maps for the elements that could be contained in the clay. Therefore, for all 18 studied samples, no correlation was found between the distribution of S and Cu/Ag in the lustre pigment. Therefore, S is either distributed uniformly over the surface or concentrated in cracks in the glaze, as shown in Figure 3.

4.2. Transmission Electron Microscopy

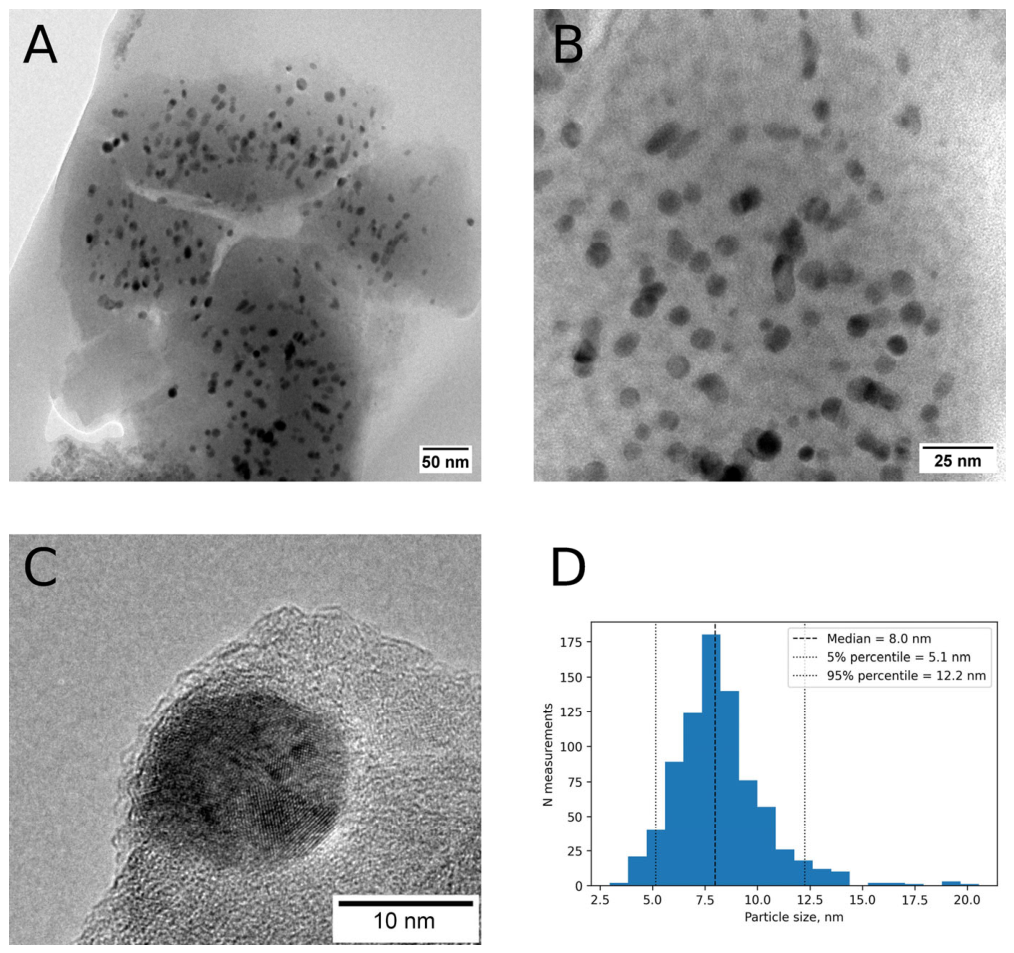
A small fragment of a glaze layer from the SDC-014 sample was studied using TEM. Any microscopic examination inherently provides information only on a small fragment of the specimen. To improve the representativeness of the data obtained, it would be necessary to select several microfragments of the specimen, and to do this for several specimens from the collection. Since one of the key objectives of this study was to confirm that the drawing was executed using the lustre technique, we decided to limit the scope of the TEM examination—both due to funding constraints and to minimize damage to the specimens. Bright-field images were captured at various magnifications, with examples shown in Figure 5 and the complete dataset available in the Supplementary Materials (files “tem jpg.zip”).
Figure 5. Bright-field transmission electron microscopy (TEM) images of lustre nanoparticles. Medium magnification (A,B), high magnification (C) and particle (NP) size distribution (D).
Minerals 16 00713 g005
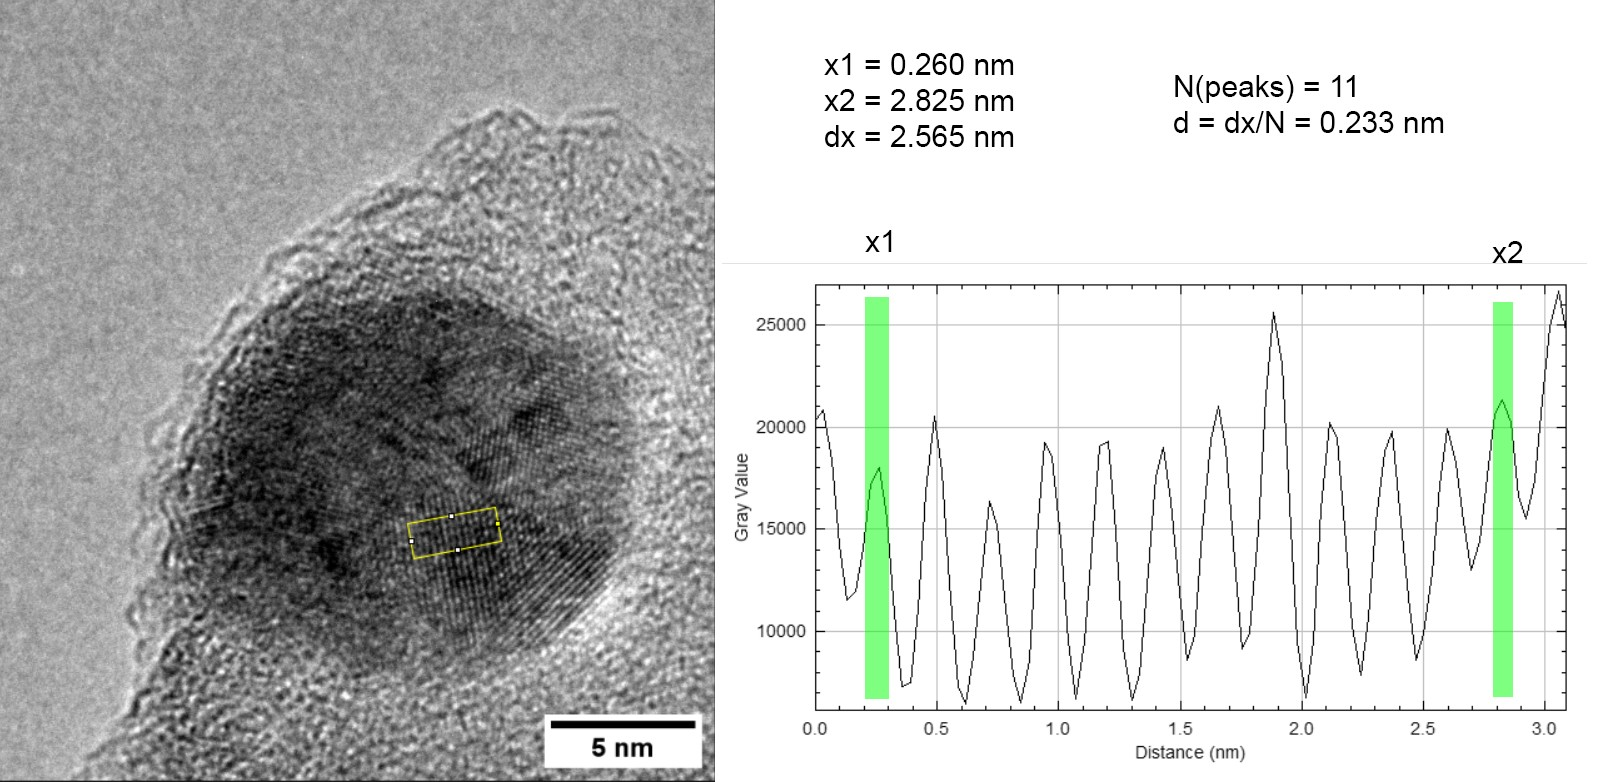
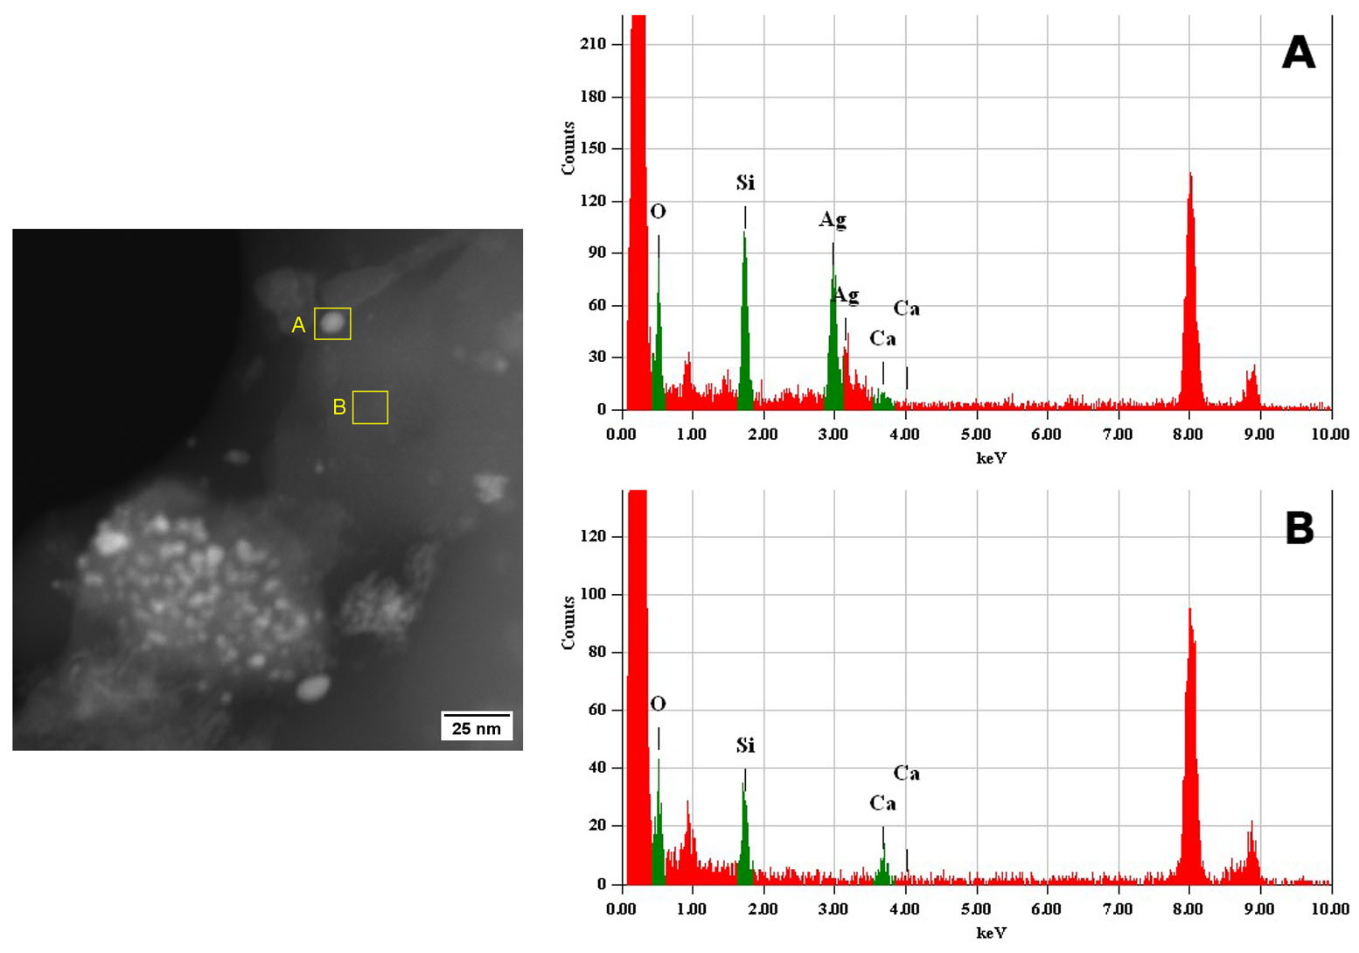
The images clearly show metal NPs of a metal with a high atomic number (i.e., Cu or Ag), appearing as dark regions located in a matrix that absorbs less electrons. The images were used to estimate the sizes of the NPs; a total of more than 200 individual measurements were made. Two dimensions were recorded for each NP: the major and minor axes of the ellipse. The particle size distribution of the NPs is shown in Figure 5D. The median particle size was found to be 8.0 nm, and 90% of the particles were determined to be between 5 and 12 nm in size. The high-resolution images shown in Figure 5C confirmed the crystalline structure of the NPs. The STEM mode was used to acquire HAADF scanning mode images and to carry out EDX local analysis of individual NPs, and the results are shown in Figure 6.
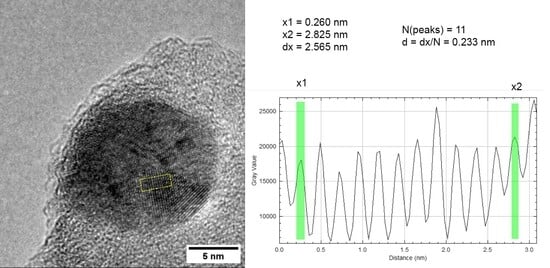
It is known that crystal lattice parameters can be estimated from high-resolution TEM images [20]. We estimated the interplanar spacing of the atomic layers in the nanoparticle crystal lattice and obtained a value of 0.233 nm, which is in very good agreement with the literature data [21] for metallic silver nanoparticles (see calculation details in the Supplementary Materials, HRTEM calculations.png). This allows us to conclude that the silver in the nanoparticles is in the “zero” oxidation state, which in turn is consistent with the literature data on lustre nanoparticles [2].
According to the EDX spectra shown in Figure 6, the NPs contain Ag (an intensive Ag Lα line was observed at 2.98 keV). Copper Kα and Kβ lines are also clearly seen at 8.05 and 8.91 keV. In this case, the presence of a copper line in the spectrum is not reliable evidence of its presence in the sample, since, due to the design features of the microscope, we were forced to use a copper sample holder grid. However, micro-XRF data confirmed the presence of Cu in the lustre.

4.3. Diffuse Reflectance Spectroscopy

Colour is a very important characteristic of lustre ceramics. Lustre colour reflects both the manufacturing traditions and the vision of the master who created the ceramic vessel. Moreover, lustre colour is directly related to the manufacturing technology and is determined by NP sizes, their chemical composition, and the NP layer thickness in the glaze. The lustre colour is determined visually or by using DRS [12]. In the latter case, interpretation is possible by means of the colour’s quantitative characteristics within a particular colour coordinate system.
The DRS was used to quantify the lustre colour of ceramic fragments. For each fragment, diffuse reflectance spectra were recorded at several amber-coloured spots on the surface. The spectra are presented in the Supplementary Materials (file DR_spectra.xlsx). These spectra were then converted to CIE L*a*b coordinates for statistical processing [22] and to red, green and blue (RGB) coordinates for visualization using the Colour-science library (version 0.4.6 2024) in Python 3.13 [23].
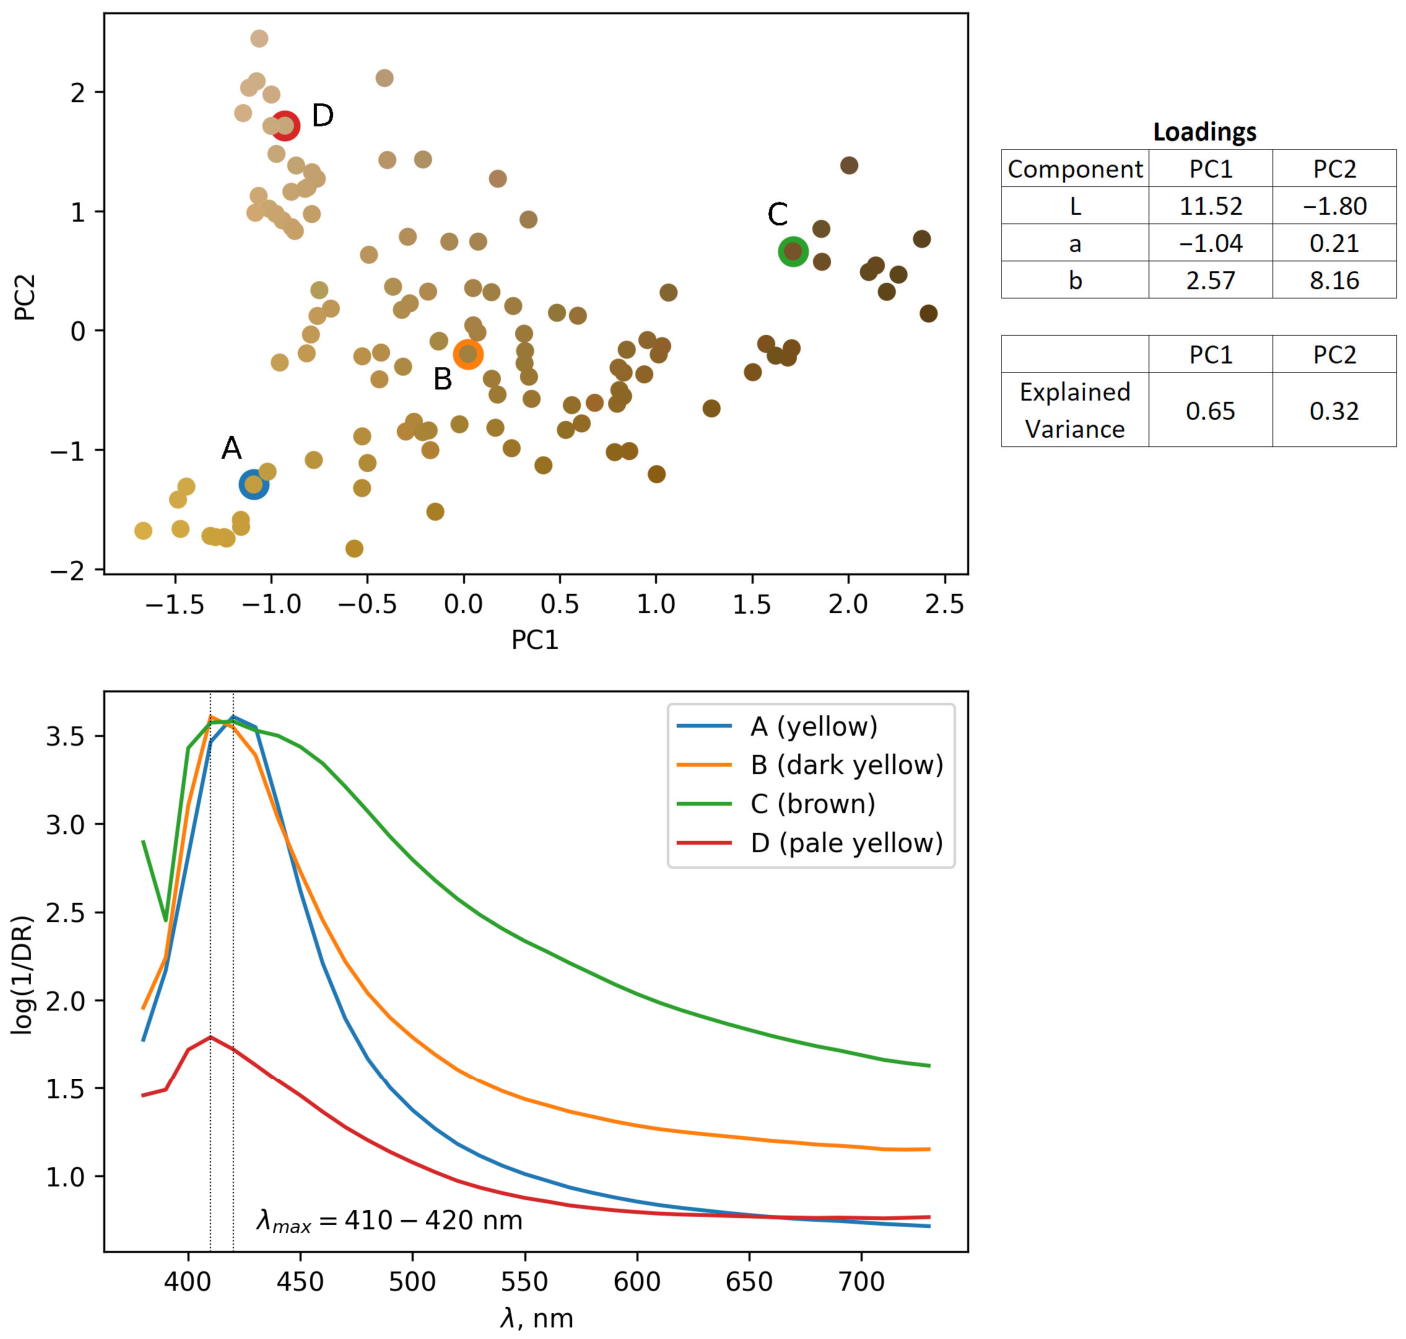
One of the research goals was to evaluate whether the samples form a homogenous group or whether it is possible to separate samples into different groups. For this purpose, the lustre colour data were processed using principal component analysis (PCA), and the results are shown in Figure 7. Principal component analysis was applied primarily to simplify the graphical representation of the data in coordinates as a 2D graph. However, an examination of the loadings table reveals that the largest contribution to the first principal component is made by the L colour coordinate, which corresponds to the lightness of the colour, while the second principal component is primarily associated with the b coordinate, whose positive values correspond to yellow. Both principal components explain over 97% of the data variance. The same figure also shows the DRS spectra of four selected samples, marked on the PCA plot as A, B, C, and D. The diffuse reflectance spectra are given in the coordinates of wavelength (λ) and nm versus log (1/DR) as per the recommendation by Gutierrez et al. [12]. Most of the samples form a single group, with these points located diagonally on the graph (Figure 7).
The colour of the samples of this group changes from yellow through amber to dark brown. In the upper left part of the plot, there is a group of pale yellow points. These points mainly correspond to regions of the samples where the lustre layer was damaged or worn out. Based on a comparison of DRS spectra from several samples, the wavelength corresponding to the maximum reflection is determined to be 410–420 nm. Variations in the spectra profiles were observed, with the pale yellow samples exhibiting lower intensity at the maximum reflection, while the dark brown samples showed a tail in the range above 420 nm. The PCA results and the comparison of DRS spectrum types indicated that the studied samples were manufactured with only minor variations in technology.

4.4. Semi-Quantitative Micro-XRF Study of Glaze Properties

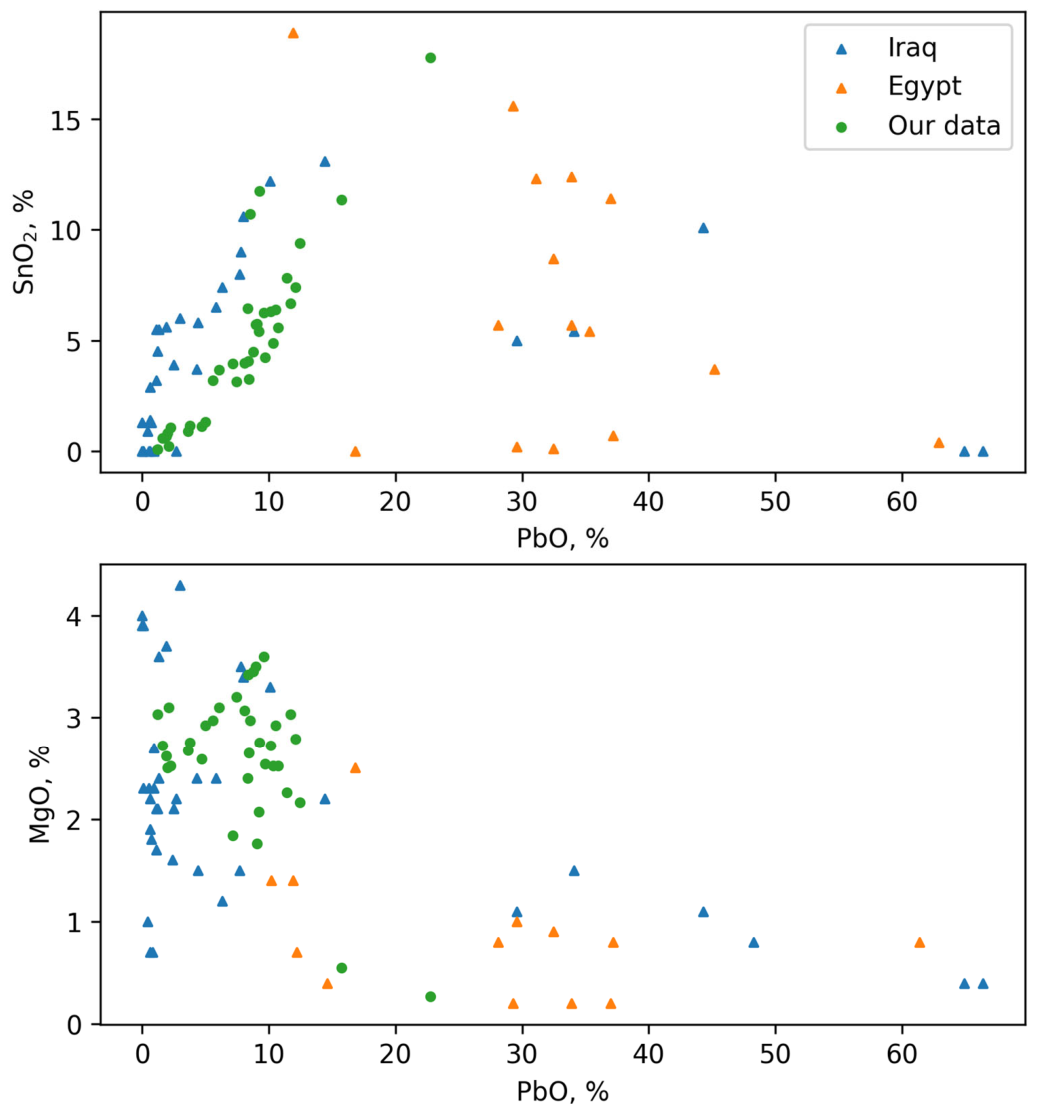
Semi-quantitative micro-XRF analysis of glaze composition was carried out for each of the obtained micro-XRF maps. A rectangle or circular region with a uniform distribution of major elements was selected on each map (typical area was 1–2 mm2), a summed spectrum was calculated for the region, and semi-quantitative composition data were calculated using the XRF instrument software (Bruker Nano, Berlin, Germany). Two such regions were chosen for each map—one corresponding to the white glaze, and the other to the amber lustre. The composition data of the glaze is presented in the Supplementary Materials (“glaze-oxides.xlsx”). According to Mason [17], early Medieval Islamic lustreware glaze composition varies significantly for different centers and periods of production. The main marker elements in glaze composition are lead (Pb), tin (Sn) and magnesium (Mg) [17]. The data from the present investigation, as well as a compilation of data from Tables 3.4 (Basra, Iraq) and 4.3 (Fustat, Egypt) from Mason’s monograph [17], are collectively plotted in Figure 8.
Semi-quantitative micro-XRF analysis concluded that, in terms of the composition of the glaze, ceramics from the Deraheib site are close to ceramics made in Iraq—both in terms of PbO content (up to 20%) and MgO content (2%–3%), and differ significantly from ceramics made in Egypt. Of course, these results require careful assessment, as the glaze composition data in the literature and in this study were obtained using different methods, and the micro-XRF results are semi-quantitative. However, the overall picture indicates a greater similarity between the studied samples and those produced in Basra. Additionally, it should be noted that, for ceramics from Deraheib and Iraq, a proportional relationship was observed between the content of PbO and SnO2. This indicates the use of a glaze recipe that included a fixed ratio between the components containing Pb and Sn. An alternative explanation is that both Pb and Sn were introduced into the glaze mixture as a single natural mixture of minerals that already contained these metals in the proportion shown above. For ceramics produced in Egypt, according to the data from the tables in the monograph [17], such a relationship was not observed.

5. Conclusions

The present investigation proposed a novel two-step analysis approach that was successfully applied to early Medieval lustre ceramics from Northern Sudan. Micro-XRF and TEM data confirmed that the lustre recipe included Ag and Cu, and Ag forms NPs with an 8 nm median size.
The non-destructive micro-XRF spectroscopy data provided semi-quantitative information on the glaze composition. The ceramic glaze composition was characterized by PbO and SnO2 oxide contents of about 5%–15%, along with a MgO content of approximately 3%. This composition aligns well with published data on glaze compositions from the lustre ceramic production center in Basra (Iraq), making it unlikely that the samples originated from an alternative center in Fustat (Egypt). The DRS results show only minor variations in colour and the technology used to obtain the coloured layer, further confirming that the ceramic fragments may have originated from the same source.

Supplementary Materials

The following supporting information can be downloaded at: https://www.mdpi.com/article/10.3390/min16070713/s1. High-resolution sample photos—folder “photos_of_the_samples”; muXRF maps of the samples—folder “muXRF maps”; the complete TEM dataset—folder “tem jpg”; HRTEM calculation details—file “HRTEM calculations.png”; Diffuse reflectance spectra—file “DR_spectra.xlsx”; The composition data of the glaze file—“glaze-oxides.xlsx”; Figure S1: TEM sample preparation.

Author Contributions

M.S.: Conceptualization, formal analysis, visualization, writing—original draft, writing—review and editing, supervision. E.T.: Conceptualization, investigation (historical and iconographical studies), resources, writing—original draft, writing—review and editing, visualization, supervision, funding acquisition. A.K.: Conceptualization, resources, writing—original draft, writing—review and editing. I.A.: Investigation (micro-XRF). A.E.: Investigation (transmission electron microscopy). E.R.: Investigation (diffuse reflectance spectrometry). V.K.: Writing—original draft, writing—review and editing. S.P.: Writing—review and editing. All authors have read and agreed to the published version of the manuscript.

Funding

This work was funded by the Russian Science Foundation (project No. 25-28-01025).

Data Availability Statement

Data are available upon reasonable request.

Acknowledgments

M.S. and I.A. are grateful to Moscow University Development Program for access to their Bruker Tornado M4+ X-ray fluorescence spectrometer. The authors are also grateful for support from the MSU Equipment Center “Nanochemistry and Nanomaterials” acting under the Lomonosov Moscow State University Program of Development for TEM studies. The authors are grateful to V.V. Apyari and M.V. Matyash for lending their diffuse reflectance spectrometer for this study. The author (S. Prasad) is grateful to the University of the South Pacific, Suva, Fiji, for support in various ways.

Conflicts of Interest

The authors declare no conflicts of interest.

Abbreviations

The following abbreviations are used in this manuscript:
XRFX-ray fluorescence
Micro-XRFMicro-X-ray fluorescence
TEMTransmission electron microscopy
EDXEnergy-dispersive X-ray spectrometry
XANESX-ray absorption near edge structure
EXAFSExtended X-ray absorption fine structure
PCAPrincipal component analysis

References

  1. Pradell, T.; Molera, J.; Smith, A.D.; Tite, M.S. The Invention of Lustre: Iraq 9th and 10th Centuries AD. J. Archaeol. Sci. 2008, 35, 1201–1215. [Google Scholar] [CrossRef]
  2. Pradell, T. Lustre and Nanostructures—Ancient Technologies Revisited. In Nanoscience and Cultural Heritage; Dillmann, P., Bellot-Gurlet, L., Nenner, I., Eds.; Atlantis Press: Paris, France, 2016; pp. 3–39. [Google Scholar]
  3. Pradell, T.; Molera, J.; Roque, J.; Vendrell-Saz, M.; Smith, A.D.; Pantos, E.; Crespo, D. Ionic-Exchange Mechanism in the Formation of Medieval Luster Decorations. J. Am. Ceram. Soc. 2005, 88, 1281–1289. [Google Scholar] [CrossRef]
  4. Sadurní, R.; Molera, J.; Hole, C.; Juanhuix, J.; Cotte, M.; Pradell, T. The Role of Iron Oxide in the Formation of Silver and Copper Luster Layers. J. Sci. Adv. Mater. Devices 2026, 11, 101181. [Google Scholar] [CrossRef]
  5. Pradell, T.; Fernandes, R.; Molina, G.; Smith, A.D.; Molera, J.; Climent-Font, A.; Tite, M.S. Technology of Production of Syrian Lustre (11th to 13th Century). J. Eur. Ceram. Soc. 2018, 38, 2716–2727. [Google Scholar] [CrossRef]
  6. Salinas, E.; Pradell, T.; Molera, J. Glaze Production at an Early Islamic Workshop in Al-Andalus. Archaeol. Anthropol. Sci. 2019, 11, 2201–2213. [Google Scholar] [CrossRef]
  7. Hunt, A.M. (Ed.) The Oxford Handbook of Archaeological Ceramic Analysis, 1st ed.; Oxford University Press: Oxford, UK, 2020. [Google Scholar]
  8. Pashkova, G.V.; Statkus, M.A.; Mukhamedova, M.M.; Finkelshtein, A.L.; Abdrashitova, I.V.; Belozerova, O.Y.; Chubarov, V.M.; Amosova, A.A.; Maltsev, A.S.; Demonterova, E.I.; et al. A Workflow for Uncertainty Assessment in Elemental Analysis of Archaeological Ceramics: A Case Study of Neolithic Coarse Pottery from Eastern Siberia. Heritage 2023, 6, 4434–4450. [Google Scholar] [CrossRef]
  9. Buraca, I.; Oliveira, C.; Bottaini, C.; Correia, V.H.; Schiavon, N.; Mirão, J.; Beltrame, M. Tracing Local Production and Agricultural Trade: A Multi-Analytical Study of Roman Amphorae at Conímbriga (Central Portugal). Heritage 2025, 8, 405. [Google Scholar] [CrossRef]
  10. Demirsar Arli, B.; Simsek Franci, G.; Kaya, S.; Arli, H.; Colomban, P. Portable X-Ray Fluorescence (p-XRF) Uncertainty Estimation for Glazed Ceramic Analysis: Case of Iznik Tiles. Heritage 2020, 3, 1302–1329. [Google Scholar] [CrossRef]
  11. Panagopoulou, A.; Vroom, J.; Hein, A.; Kilikoglou, V. Production Technology of Glazed Pottery in Chalcis, Euboea, during the Middle Byzantine Period. Heritage 2021, 4, 4473–4494. [Google Scholar] [CrossRef]
  12. Gutierrez, P.C.; Pradell, T.; Molera, J.; Smith, A.D.; Climent-Font, A.; Tite, M.S. Color and Golden Shine of Silver Islamic Luster. J. Am. Ceram. Soc. 2010, 93, 2320–2328. [Google Scholar] [CrossRef]
  13. Krol, A.; Zaitsev, Y.; Tolmacheva, E.; Savinetski, A.; Bashilov, A.; Dmitrieva, Y.; Malishev, N.; Kalinina, O.; Fedorova, D. The 4th and 5th Seasons of the Nubian Expedition of the Anuchin Research Institute and Museum of Anthropology, Lomonosov Moscow State University at the Sites of Deraheib and Onib (the Republic of Sudan). Part II. The Test Trench Near North-Western Wall of the Northern Fortress. Mosc. Univ. Anthropol. Bull. (Vestn. Mosk. Univ. Ser. XXIII Antropol.) 2025, 157–174. [Google Scholar] [CrossRef]
  14. Krol, A.A.; Tolmacheva, E.G. “Northern Fortress” of the Medieval City of Al-’Allāqī, Based on the Written and Archaeological Sources of 9th–12th Centuries. In Encounters of Distant Worlds. From the Exploration Journeys of the Late 19th Century to the Research of Angelo and Alfredo Castiglioni (Incontri di Mondi Lontani Dai Viaggi D’esplorazione di Fine ‘800 alle Ricerche di Angelo e Alfredo Castiglioni). Exhibition Catalogue; Sagep Editori: Varese, Italy, 2023; pp. 251–262. [Google Scholar]
  15. The Metropolitan Museum of Art. Imported Luster Bowl. Available online: https://www.metmuseum.org/art/collection/search/449723 (accessed on 18 October 2025).
  16. Watson, O. Ceramics from Islamic Lands; Thames & Hudson: London, UK, 2004. [Google Scholar]
  17. Mason, R.B.J. Shine Like the Sun: Lustre-Painted and Associated Pottery from the Medieval Middle East; Bibliotheca Iranica Islamic Art and Architecture Series; Mazda Publishers: Costa Mesa, CA, USA, 2004. [Google Scholar]
  18. Philon, H.; Benakē, M. Early Islamic Ceramics: Ninth to Late Twelfth Centuries; Islamic Art Publications: Sarajevo, Bosnia and Herzegovina, 1980. [Google Scholar]
  19. The Metropolitan Museum of Art. Bowl. Available online: https://www.metmuseum.org/art/collection/search/451702 (accessed on 18 October 2025).
  20. Naaz, F.; Farooq, U.; Khan, M.A.M.; Ahmad, T. Multifunctional Efficacy of Environmentally Benign Silver Nanospheres for Organic Transformation, Photocatalysis, and Water Remediation. ACS Omega 2020, 5, 26063–26076. [Google Scholar] [CrossRef] [PubMed]
  21. Wani, I.A.; Khatoon, S.; Ganguly, A.; Ahmed, J.; Ganguli, A.K.; Ahmad, T. Silver Nanoparticles: Large Scale Solvothermal Synthesis and Optical Properties. Mater. Res. Bull. 2010, 45, 1033–1038. [Google Scholar] [CrossRef]
  22. Anisovets, Y.; Zhitenev, V.; Vinogradova, E.; Statkus, M. Color of Small Ochre Fragments from the Upper Paleolithic Sites Kapova Cave and Kamennaya Balka II (Russia): Combining Visual Color Identification and Cluster Analysis. Heritage 2024, 7, 6857–6870. [Google Scholar] [CrossRef]
  23. Mansencal, T.; Mauderer, M.; Parsons, M.; Shaw, N.; Wheatley, K.; Cooper, S.; Vandenberg, J.D.; Canavan, L.; Crowson, K.; Lev, O.; et al. Colour, version 0.4.6; Zenodo: Geneva, Switzerland, 2024. [CrossRef]
Figure 1. Deraheib archaeological site location (author of the map: E. Grishin; the map was prepared specifically for this publication).
Minerals 16 00713 g001
Figure 2. Lustre ceramic fragments from Deraheib. Drawings by E. Tolmacheva.
Minerals 16 00713 g002
Figure 3. Micro-XRF maps of the SDC-001 sample. Maps illustrate the qualitative distribution of Ag La, S Ka, and Cu Ka fluorescence lines across the sample surface. The intensity values for each element are normalized independently.
Minerals 16 00713 g003
Figure 4. Micro-XRF maps of the SDC-016 sample. Maps illustrate the qualitative distribution of Ag La and Cu Ka fluorescence lines across the sample surface. The intensity values for each element are normalized independently.
Minerals 16 00713 g004
Figure 6. Dark-field transmission electron microscopy (TEM) image of lustre nanoparticles (left). X-ray spectra of nanoparticle (A) and background (glaze) spectra (B).
Minerals 16 00713 g006
Figure 7. Results of principal component analysis (PCA) of lustre colour data (top) and diffuse reflectance spectra of selected samples (bottom).
Minerals 16 00713 g007
Figure 8. Plots of lead oxide (PbO), tin oxide (SnO2), and magnesium oxide (MgO) concentration in glaze sample. Triangle markers are for data from Basra (Iraq) and Fustat (Egypt) compiled from [17]. Circle markers represent the present investigation data.
Minerals 16 00713 g008
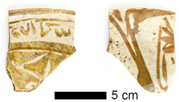
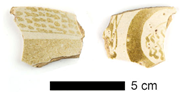
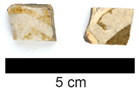
Table 1. Ceramic samples excavated from several locations on the Deraheib site.
Sample IDPhotoSample IDPhoto
SDC-001, 2022/0013/001/01, fragment of a bowl with inscriptionMinerals 16 00713 i001SDC-011, 2022/0013/001, fragment of a bowlMinerals 16 00713 i002
SDC-002, fragment of a bowlMinerals 16 00713 i003SDC-012, 2022/0014/001/01, rim of a bowlMinerals 16 00713 i004
SDC-003, 2022/0011, rim of a bowl with inscriptionMinerals 16 00713 i005SDC-013, 2022/0014/001/03, fragment of a bowl; representation of the medallion with imitation of inscription on the outer sideMinerals 16 00713 i006
SDC-004, 2022/0012/001/01, rim of a bowl with a representation of a hareMinerals 16 00713 i007SDC-014, fragment of a bowlMinerals 16 00713 i008
SDC-005, 2022/0013/001/02, rim of a bowlMinerals 16 00713 i009SDC-015, 2022/0016/001, fragment of a bowlMinerals 16 00713 i010
SDC-006, 2022/0013/001/03, rim of a bowl; representation of the medallion with imitation of inscription on the outer sideMinerals 16 00713 i011SDC-016, 2022/0016/001/1, rim of a bowl; representation of a footMinerals 16 00713 i012
SDC-007, 2022/0013/001, rim of a bowlMinerals 16 00713 i013SDC-017, 2022/0013/001/04, rim of a bowlMinerals 16 00713 i014
SDC-008, 2022/0013/001, fragment of a bowlMinerals 16 00713 i015SDC-018, 2022/0016/001, fragment of a bowlMinerals 16 00713 i016
SDC-009, fragment of a bowlMinerals 16 00713 i017SDC-019, 2022/0012/001/02, base of a bowlMinerals 16 00713 i018
SDC-010, 2022/0013/001, fragment of a bowlMinerals 16 00713 i019SDC-020, 2022/0012/001, base of a bowlMinerals 16 00713 i020
Scale bar in each photo is 5 cm long. High-resolution photos are provided in Supplementary Materials: “photos_of_the_samples.zip”.
Disclaimer/Publisher’s Note: The statements, opinions and data contained in all publications are solely those of the individual author(s) and contributor(s) and not of MDPI and/or the editor(s). MDPI and/or the editor(s) disclaim responsibility for any injury to people or property resulting from any ideas, methods, instructions or products referred to in the content.