Article

Assessment of Cu, As, Pb, Zn and Fe Enrichment in Intertidal Sediments Along the Atacama Coast, Northern Chile


1
Centro de Investigaciones Costeras-Universidad de Atacama (CIC-UDA), University of Atacama, 1531772 Copiapó, Chile
2
Departamento de Estadística e Investigación Operativa, Universidad de Sevilla, Avda. Reina Mercedes, s/n, 41012 Sevilla, Spain
3
Centro de Ciências e Tecnologias Nucleares (C2TN), Departamento de Engenharia e Ciências Nucleares (DECN), Instituto Superior Técnico, Universidade de Lisboa, E.N. 10 (km 139.7), 2695-066 Bobadela, Portugal
4
Departamento de Geología, Física y Química Inorgánica, Escuela Superior de Ciencias Experimentales y Tecnología (ESCET), Universidad Rey Juan Carlos, c/Tulipán s/n, 28933 Móstoles, Spain
5
Departamento de Ciencias de la Tierra, Universidad de Huelva, Avda. Tres de Marzo, s/n, 21071 Huelva, Spain
6
Centro de Investigación en Patrimonio Histórico, Cultural y Natural (CIPHCN), Facultad de Humanidades, Universidad de Huelva, Avda. Tres de Marzo s/n, 21071 Huelva, Spain
*
Author to whom correspondence should be addressed.
Minerals 2026, 16(6), 643; https://doi.org/10.3390/min16060643
Submission received: 15 April 2026 / Revised: 13 June 2026 / Accepted: 16 June 2026 / Published: 18 June 2026
(This article belongs to the Topic Environmental Pollution and Remediation in Mining Areas)

Abstract

Textural and geochemical analysis of intertidal sediments in the southern Atacama region makes it possible to identify sites primarily affected by mining-related pollution, based on a multivariate statistical analysis of the concentrations of five elements (Fe, Cu, Zn, As, Pb) and their geoaccumulation indices. These concentrations are not correlated with grain size, which is dominated by the sandy fractions. Spearman’s matrix and principal component analysis make it possible to distinguish between two groups of elements (group A: Fe-Cu-As; group B: Zn-Pb), with a strong correlation between them (ρ ≥ 0.51; p < 0.01) and the first two components explain 96.3% of the variance. Three heavily polluted sites (Playa Blanca, Bahía Sarco and Chañaral de Aceituno; Igeo Cu > 8) have been identified linked to waste from the washing of tailings, a copper smelter and frequent boat trips. In addition, four moderately polluted sites (Playa Grande, Balneario Caldera, the mouth of the Copiapó River and Carrizal Bajo; 1.7 < Igeo Cu < 8; 1.2 < Igeo Pb < 2.6), mainly due to activities associated with mining and oil refineries, have been identified.

1. Introduction

Recent advances in coastal sedimentology and marine geochemistry have shown that contamination patterns in coastal and intertidal environments are strongly influenced by sedimentary and hydrodynamic processes, including episodic sediment supply, remobilization, and limited preservation potential. Sediment transport dynamics, the energy regime and human activity inland influence the distribution of benthic communities, the alteration of sedimentary facies and even the spatial and temporal expression of metal contamination in coastal systems [1,2,3,4]. These land–sea transition zones have been subjected to increasing anthropogenic pollution from mining and industrial discharges, agricultural effluents, landfills, untreated wastewater, uncontrolled aquaculture, domestic sources and port activities, among others [5,6,7,8,9,10]. One of the effects of these interventions is an increase in metals and metalloids in coastal sediments, which can cause serious damage to the environment and enter the food chain through processing by plants or by sediment-eating animals, with a consequent danger to humans due to the ingestion of contaminated food [11,12,13,14].
Some of the most studied chemical elements are Fe and, in particular, Cu, Pb, Zn and As, which are potentially toxic elements (PTEs) for human health [15,16,17]. Various indices are used to measure the degree of contamination of these coastal sediments, such as the geoaccumulation index (Igeo), with a prior calculation of the regional background [18,19,20]. Given the granulometric variability of the sediments to which it is applied, it is advisable to understand the relationship between their textural distribution and the chemical elements being studied by this index [21,22].
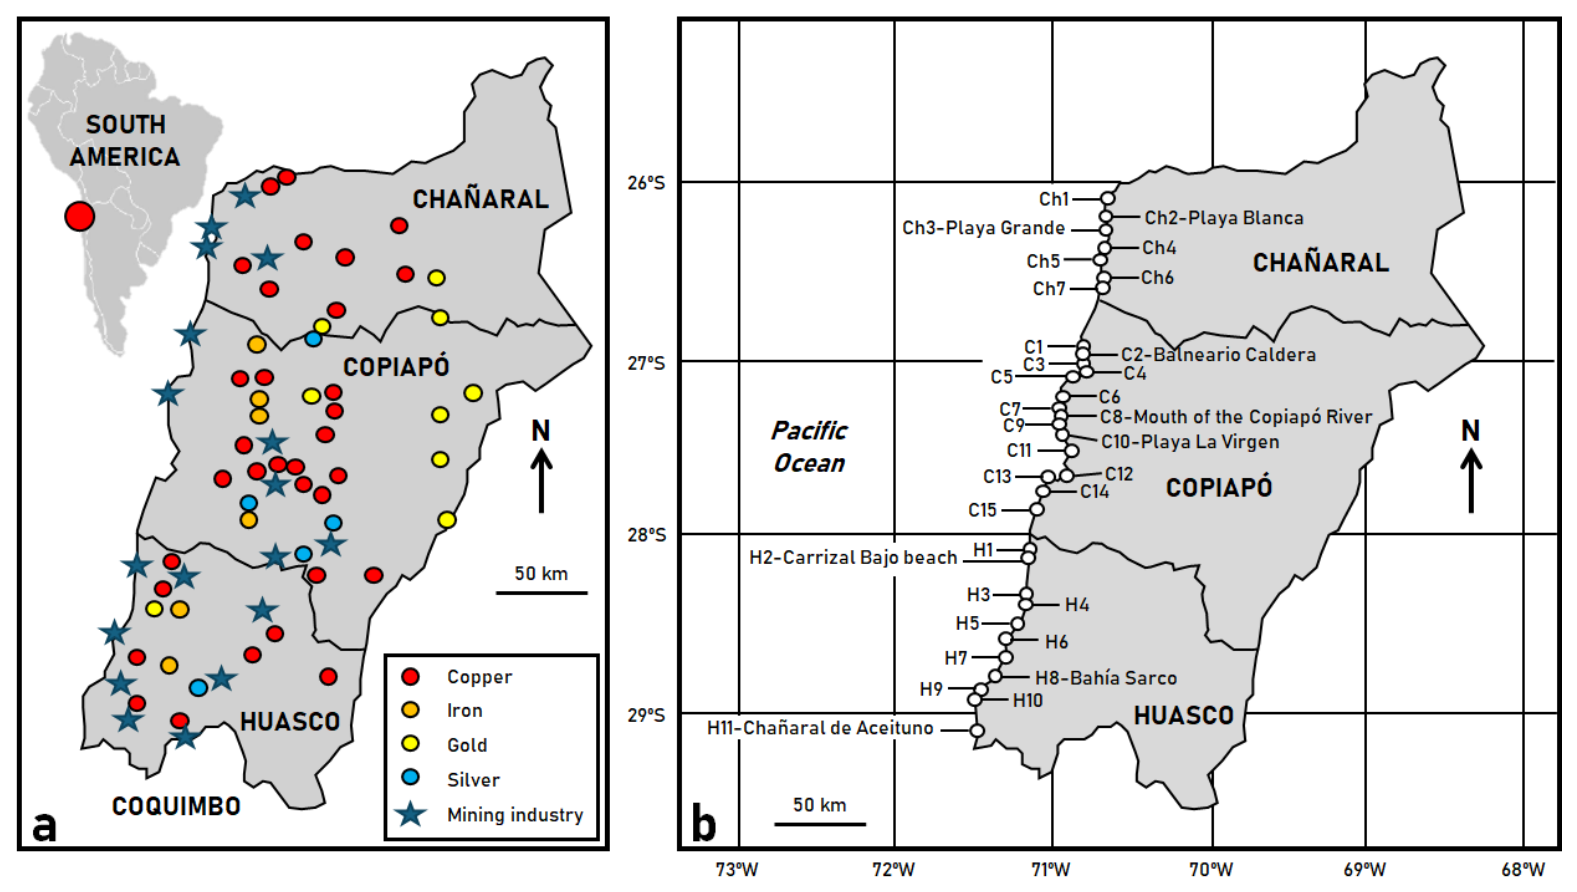
Chile is one of the countries with the longest mining tradition in the Americas. It is currently the world’s largest copper producer (5.5 MTPA), as well as the world’s seventh largest producer of silver (1.22 MTPA), and contributes 1% of global iron production (11 MTPA) [23]. A substantial portion of the mines and associated industries are located in the Atacama region, which includes the provinces of Chañaral, Copiapó, and Huasco (Figure 1a). These provinces, together with the southern province of Coquimbo, have a total of 624 active and inactive tailings ponds [24]. The effects of these activities are reflected in high levels of contamination from these metals, as well as mercury, near the mining environments [25,26].
The coastline of these three provinces presents a striking contrast between national parks, beaches, fishing areas and towns with a high concentration of current and historical mining industries [see review in [10]]. Studies on pollution in these areas are still limited to some bays and beaches [27,28,29], but a more comprehensive assessment is required to identify the regional context and apply it in order to pinpoint potential sources of contamination and their origin. Cu and As are particularly relevant in northern Chile due to their strong association with historical copper mining and smelting activities.
The objectives of this study are: (i) to analyze the geochemistry of the intertidal sediments in the southern part of the Atacama region to assess the spatial distribution and contamination levels of key mining-related elements (Fe, Cu, Zn, Pb and As); (ii) to carry out a bivariate statistical analysis to establish the correlation between the metal content and the grain size distribution of the sediments; (iii) to define groups of elements based on a principal component analysis; (iv) to establish a regional background based on a cluster analysis of geochemical concentrations; (v) to identify geochemical hotspots by applying the geoaccumulation index as a measure of pollution; and (vi) to determine the source of the high concentrations of the elements studied in these hotspots.

2. Materials and Methods

2.1. Study Area

The Atacama Region is located between parallels 26° S and 29°20′ S (Figure 1b) and covers an area of 75,669 km2 divided into three provinces: Chañaral (24,749 km2), Copiapó (32,712 km2) and Huasco (18,208 km2). The climate is conditioned by the presence of the South Pacific Subtropical Anticyclone and the cold Humboldt Current, resulting in a predominantly semi-arid climate, with desert areas and rainfall ranging from 18 mm to 250 mm per year. The flow of the main rivers depends on snowmelt from their Andean headwaters and is reduced by withdrawals for agricultural use. This flow can increase significantly due to the El Niño–Southern Oscillation (ENSO) phenomenon, which causes years with abnormally high rainfall. These extreme flow events carry highly metal-contaminated material from tailings into river channels and flood urban centers [30].
Mining in this area experienced its first boom during its annexation to the Inca Empire around the 14th–15th centuries, focusing on the production of gold, silver and copper [31]. Extractive mining increased during the period of Spanish rule, with the initial exploitation of gold washings and later focusing on silver and copper deposits [32]. The major mining expansion in this area began in the mid-19th century, with the establishment of large-scale copper mining and associated industrial facilities in the early 20th century, leading to the large-scale operations seen today [33]. Currently, the mining sector contributes 41% of the GDP of the Atacama region (~2.7 billion dollars) [34], with more than 50 active mines, mainly copper and, to a lesser extent, silver and gold (Figure 1a). The environmental consequences of this mining development are still poorly understood, although recent reports point to significant contamination of soil and wildlife [25,35].

2.2. Analytical Methods

A total of 33 surface samples (0–5 cm depth) were collected (in triplicate) from intertidal sediments in the Atacama region (Figure 1b; Ch: Chañaral; C: Copiapó; H: Huasco) for granulometric and geochemical analysis. Stations were selected according to neighboring coastal uses, activities of impact (e.g., urban sewage, tourism, or industrial areas) and ecological relevance (presence of endemic species, protected areas, river mouths), and the dataset represents surface sediment conditions at the time of sampling. The samples were placed in plastic bags, labelled and transported to the laboratories of the University of Atacama, where they were frozen. In the laboratory, samples were dried, homogenized and sieved prior to the granulometric and geochemical analyses. The grain size distribution was determined through sieving and Wentworth classification.
Subsamples of dried sediment were digested using microwave-assisted acid digestion in closed Teflon vessels. The digestion procedure employed a mixture of concentrated nitric acid (HNO3), hydrochloric acid (HCl) and hydrofluoric acid (HF). After digestion, the solutions were diluted with ultrapure water, and the concentrations of Fe, Cu, Zn, Pb and As were determined by inductively coupled plasma mass spectrometry (ICP-MS). Certified reference materials (HISS-1 and PACS-2 marine sediment standards) were used to verify the analytical accuracy, with a recovery rate of over 90%. The detection limits were 0.2 ppm for all elements analyzed. The values shown are the mean values of triplicates, which were obtained by dividing the original sample into three subsamples and analyzing them individually.

2.3. Statistical Analysis

This analysis was developed using the R program, a free software environment for statistical computing and graphics. Descriptive statistics (mean, median, coefficient of variation) were calculated for all variables. In addition, the Shapiro–Wilk test was applied to test the normality of both granulometric and geochemical variables and p-values lower than 5% were obtained, implying a lack of normality for all of them; consequently, Spearman’s correlation coefficient was used for the bivariate statistical analysis. Principal component analysis was then applied to the five elements analyzed (Fe, Cu, Zn, As and Pb). Cluster analysis (Ward’s method) was used to classify the samples according to their geochemical similarity. The group showing the lowest metal concentrations was interpreted as the least contaminated population, and its mean values were used to estimate the regional geochemical background for the studied elements. The mean of the least polluted group was considered as the regional background for the intertidal zone of the Atacama region and was used to calculate the geoaccumulation index [36] of the five elements in each sample (Fe: 6315.8 mg/kg; Cu: 4.4 mg/kg; Zn: 8.6 mg/kg; As: 1.7 mg/kg; Pb: 1.2 mg/kg). This index is calculated according to the following formula:
Igeo = log2 Cn/1.5Bn
where Cn is the value of a variable in a sample and Bn is the regional background obtained in the previous cluster analysis. Based on this index, the degree of pollution of a sample for each of the five variables was classified as follows: unpolluted (Igeo ≤ 0), very lowly polluted (0 < Igeo ≤ 1), lowly polluted (1 < Igeo ≤ 2), moderately polluted (2 < Igeo ≤ 3), highly polluted (3 < Igeo ≤ 4), very highly polluted (4 < Igeo ≤ 5) and extremely highly polluted (Igeo > 5). Given the region’s long history of mining, the presence of mining-related industries in the study area, the lack of geochemical data predating human activity in the intertidal zone under investigation, and the considerable fluctuations in the trace element chemistry, this analysis is in no way representative of the long-term average concentrations of this area. It is a ‘snapshot’ of the chemical situation of the Atacama littoral during the time of sampling.

3. Results and Discussion

3.1. Grain Size

The intertidal sediments of the Atacama coast are predominantly composed of sand-size particles, ranging from fine to coarse fractions (Table 1). Coarse sizes may be abundant due to the presence of gastropod fragments and shells (mainly turritellids).
Medium sand represents the dominant fraction in most samples (0%–87.43%; mean—M: 35.41%), followed by fine sand (0%–92.06%; M: 26.61%) and coarse sand (0%–77.66%; M: 14.54%). Finer fractions (silt and clay) are generally scarce and only show a significant presence in sample C3 (47.58%), while they do not exceed 1.71% in the rest of the samples. The granulometric dominance of sandy fractions reflects the high-energy hydrodynamic conditions that characterize much of the exposed Atacama coastline. This grain size distribution is not conducive to metal deposition in these intertidal sediments, as finer fractions usually favor metal adsorption and retention [37,38]. Consequently, the hydrodynamics of the Atacama coast clearly influence the geochemical composition of its intertidal sediments.

3.2. Geochemistry

In general, large discrepancies between the mean and the median were common (Table 2; Cu: 262.87 mg/kg vs. 56.7 mg/kg; Zn: 35.06 mg/kg vs. 11.3 mg/kg), with ranges extending to extremely high values (e.g., Cu: 4734.7 mg/kg; As: 159 ppm) and coefficients of variation exceeding 100% (e.g., Pb: 437%; Cu: 438%). These descriptive features reveal strong heterogeneity in coastal sediment concentrations, which may be driven by the large spatial extent of the study area and/or by anthropogenic influences that skew natural distributions.
Iron concentrations range from 1841.2 mg/kg at Playa La Virgen (Table 3: C10) to 126,189.3 mg/kg at Bahía Sarco (H8). Concentrations above 20,000 mg/kg were obtained in Playa Blanca (Ch2), at the mouth of the Copiapó River (C7–C8) and in Chañaral de Aceituno (H11). The highest Cu contents were measured in Bahía Sarco (4734.7 mg/kg), Playa Blanca (Ch2: 1857.4 mg/kg) and Playa Grande (Ch3: 1691.6 mg/kg), while the concentrations in most of the remaining samples did not exceed 25 mg/kg.
The highest concentrations of Zn were detected in Playa Blanca (607.4 mg/kg) and Chañaral de Aceituno (H11: 88.5 mg/kg). In the remaining samples, this metal only exceeds 30 mg/kg at the mouth of the Copiapó River and in adjacent areas (Ch7 to Ch9). Playa Blanca and Bahía Sarco also have the highest As contents, both exceeding 135 mg/kg. Playa Blanca also stands out for exceeding 45 mg/kg of Pb, while most of the remaining samples do not reach 10 mg/kg.

3.3. Statistical Analysis

Spearman’s matrix (Table 4) shows that there is no correlation between the different grain sizes and the five elements analyzed, and only a significant correlation is observed between very fine sands and the silt + clay content. Within these elements, all correlations are very significant (ρ ≥ 0.51; p < 0.01), although two groups can be differentiated based on the values of the coefficients found: (i) group A: Fe-Cu-As and (ii) group B: Zn-Pb.
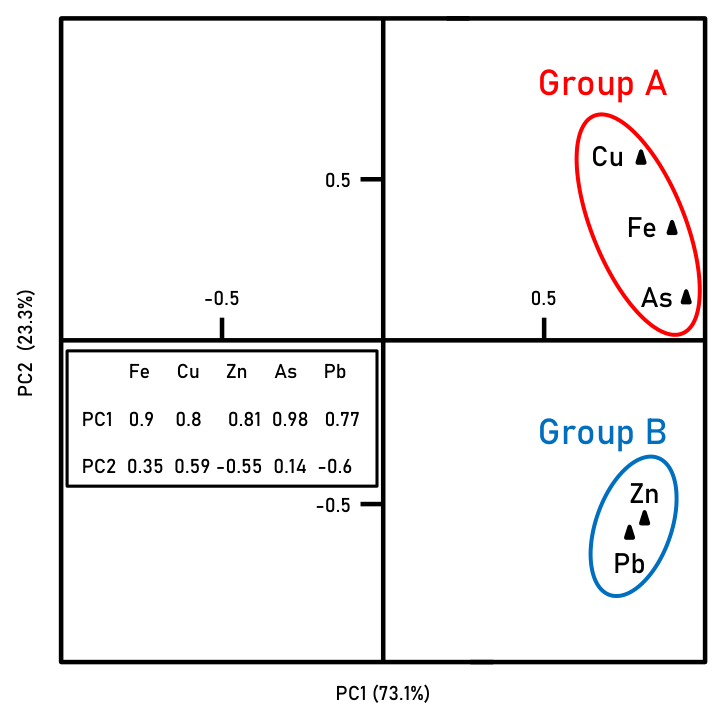
In the principal component analysis, the first two components explain 96.3% of the variance (PC1: 73.1%; PC2: 23.2%). This analysis also supports the division between the two groups mentioned above, with PC2 > 0 for group A and PC2 < 0 for group B (Figure 2; group A: PC2 > 0; group B: PC2 < 0).
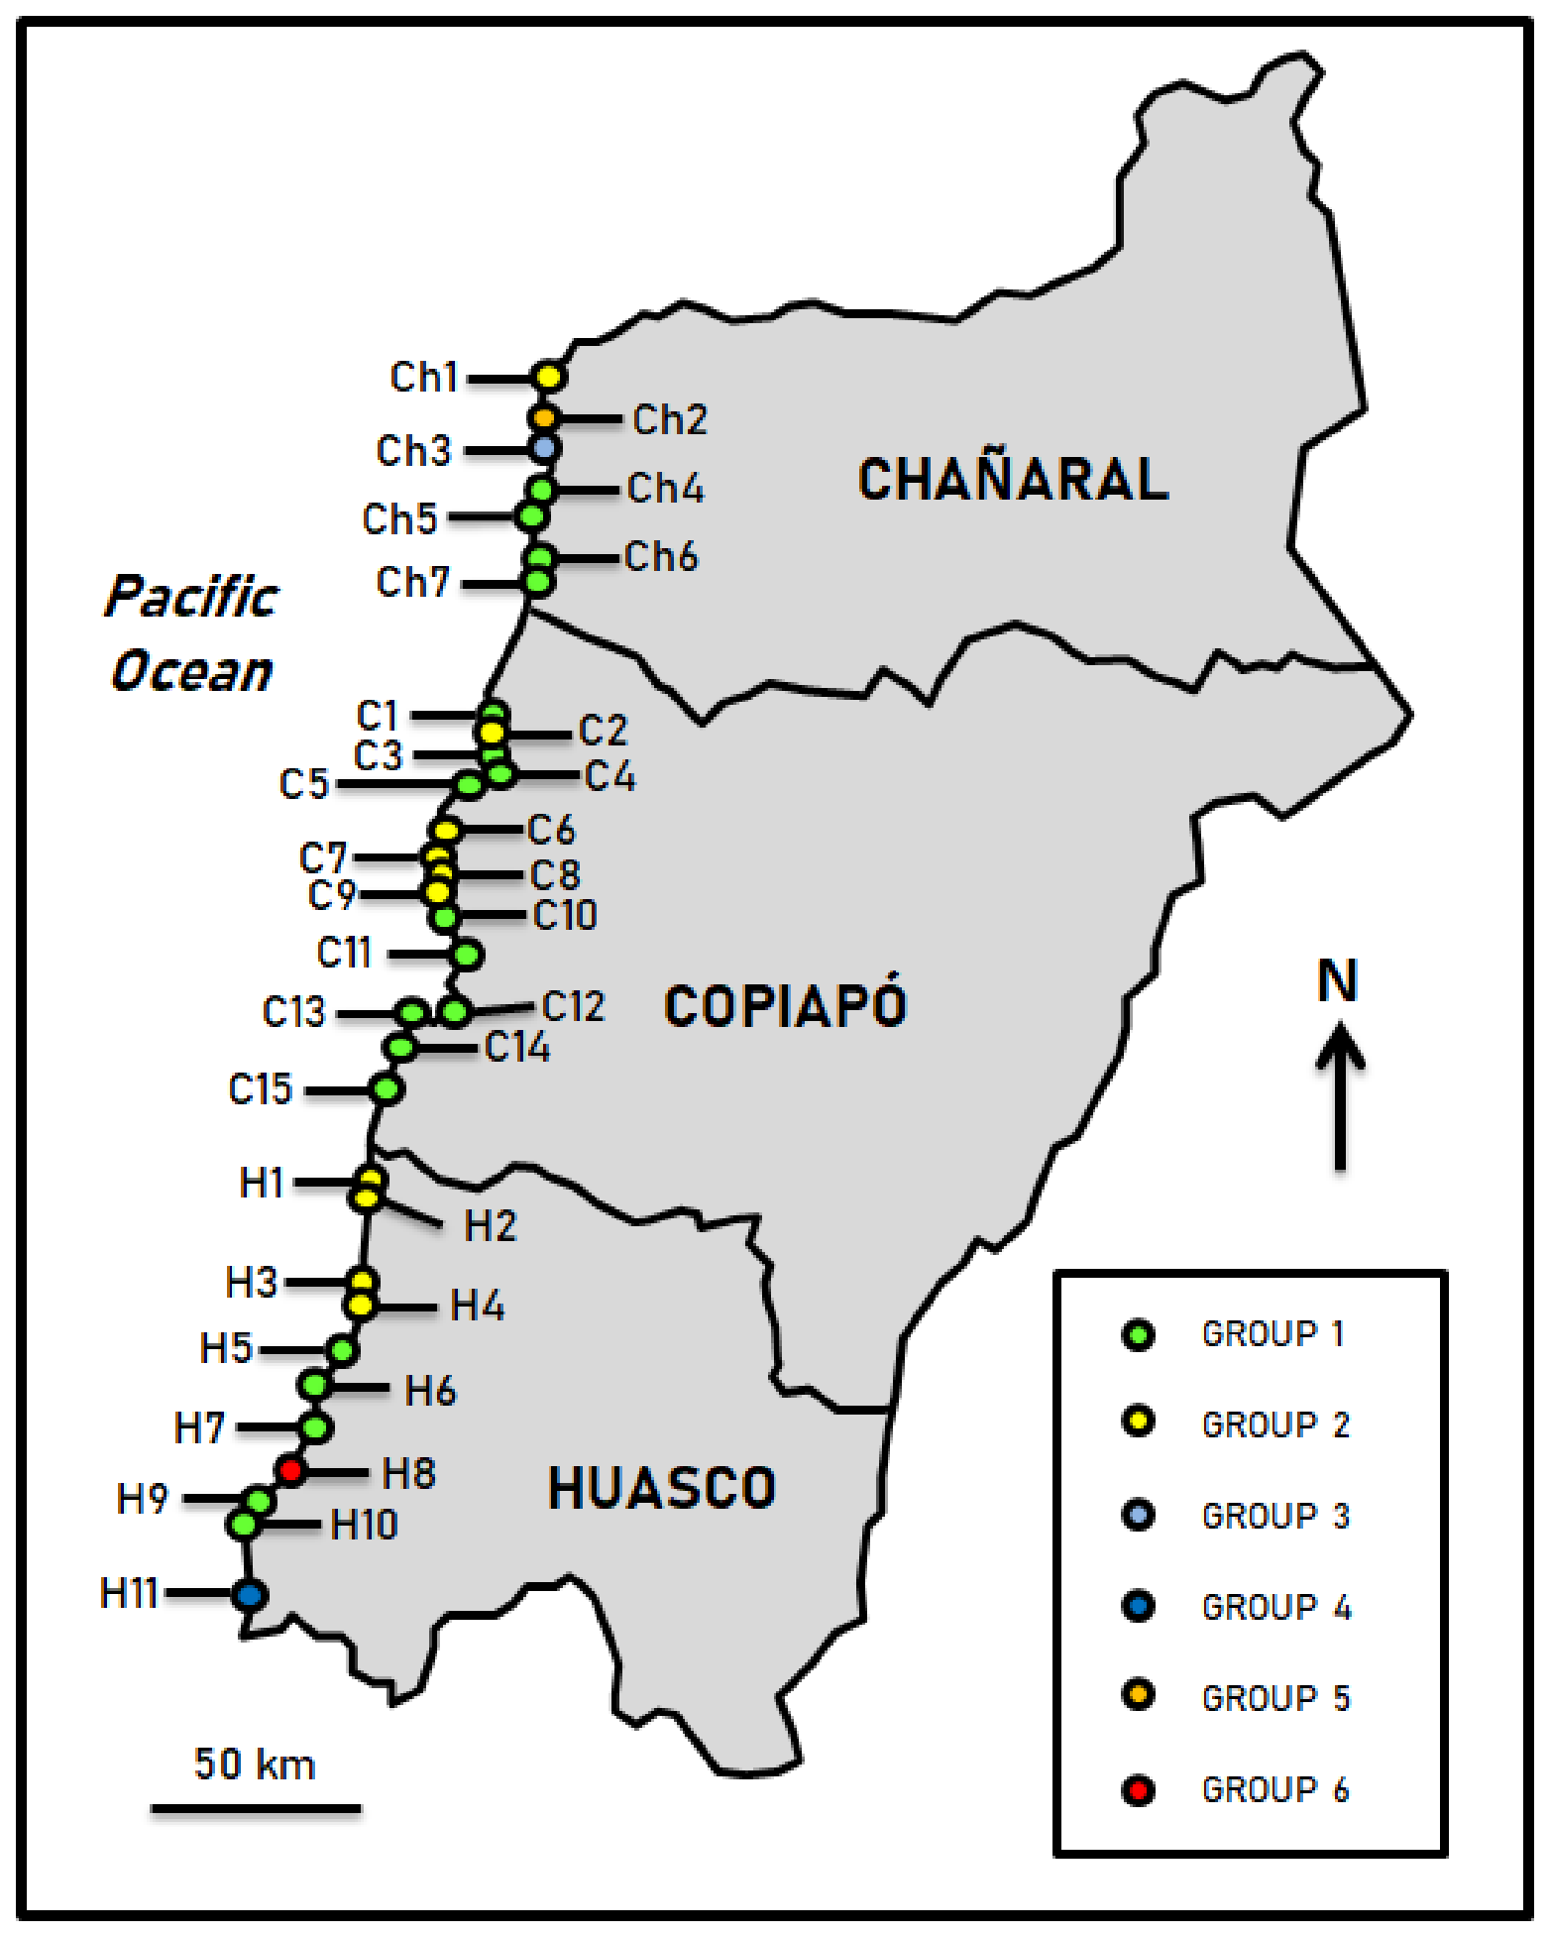
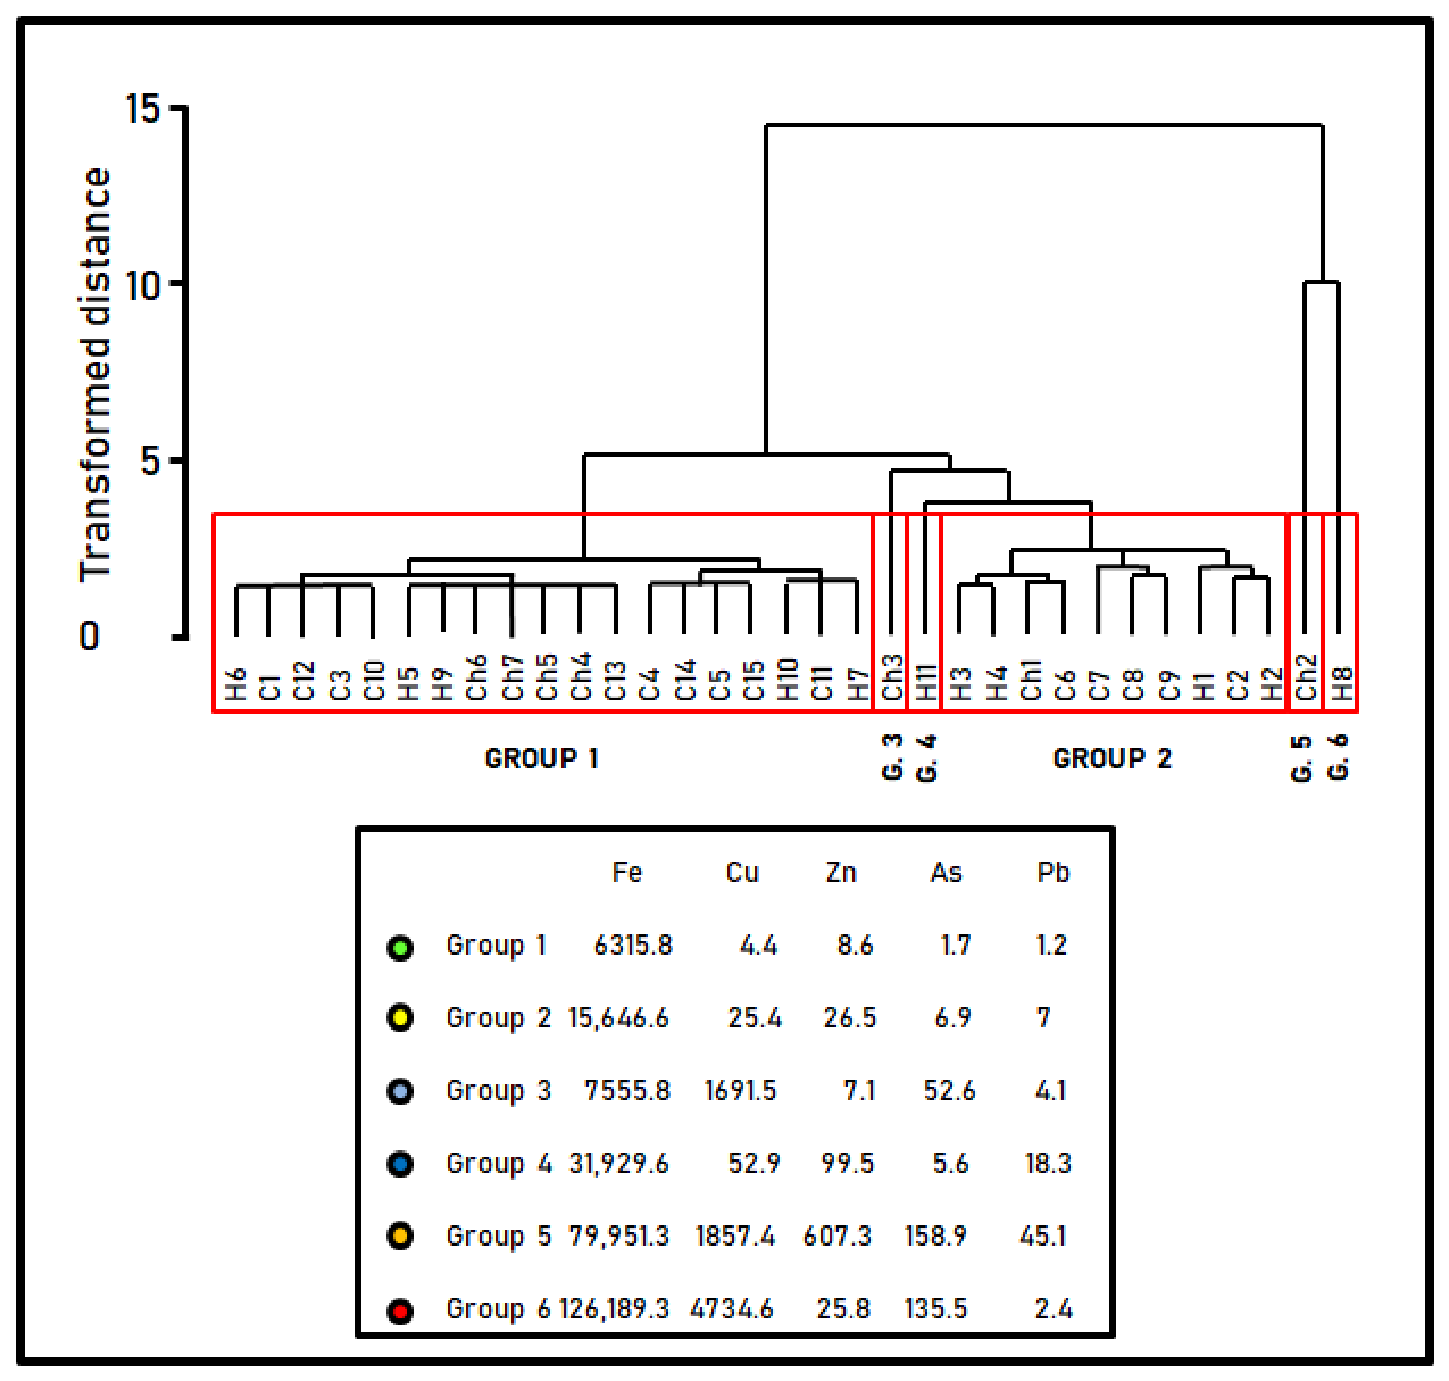
The cluster analysis distinguishes two main groups of samples (G1 and G2), as well as four outliers (G3 to G6) (Figure 3). G1 (19 samples) has the lowest average concentrations of four elements (Fe, Cu, As, and Pb) and is only slightly lower than the outlier G3 in terms of Zn. This group is distributed across the three provinces, and its average values are considered as the regional background of the intertidal samples from Atacama for the subsequent calculation of the geoaccumulation index. The ten G2 samples are concentrated in the central part of Copiapó and the northern sector of Huasco (Figure 4). Their concentrations of the five elements are between 2.5 and 6 times higher than those for G1.
The four outliers are located in the northern sector of Chañaral (G3: Ch3-Playa Grande; G5: Ch-2-Playa Blanca) and the southern part of Huasco (G4: H11-Chañaral de Aceituno; G6: H8-Bahía Sarco). They are characterized by the highest contents of Fe (G4 to G6: 31,929.6 mg/kg to 126,189.3 mg/kg), Cu (G3-G5-G6: 1691.5 mg/kg to 4734.6 mg/kg), Zn (G4-G5: 99.5 mg/kg to 607.3 mg/kg), As (G3-G5-G6: 52.6 mg/kg to 158.9 mg/kg) and Pb (G4-G5: 18.3 mg/kg to 45.1 mg/kg).

3.4. Geoaccumulation Index

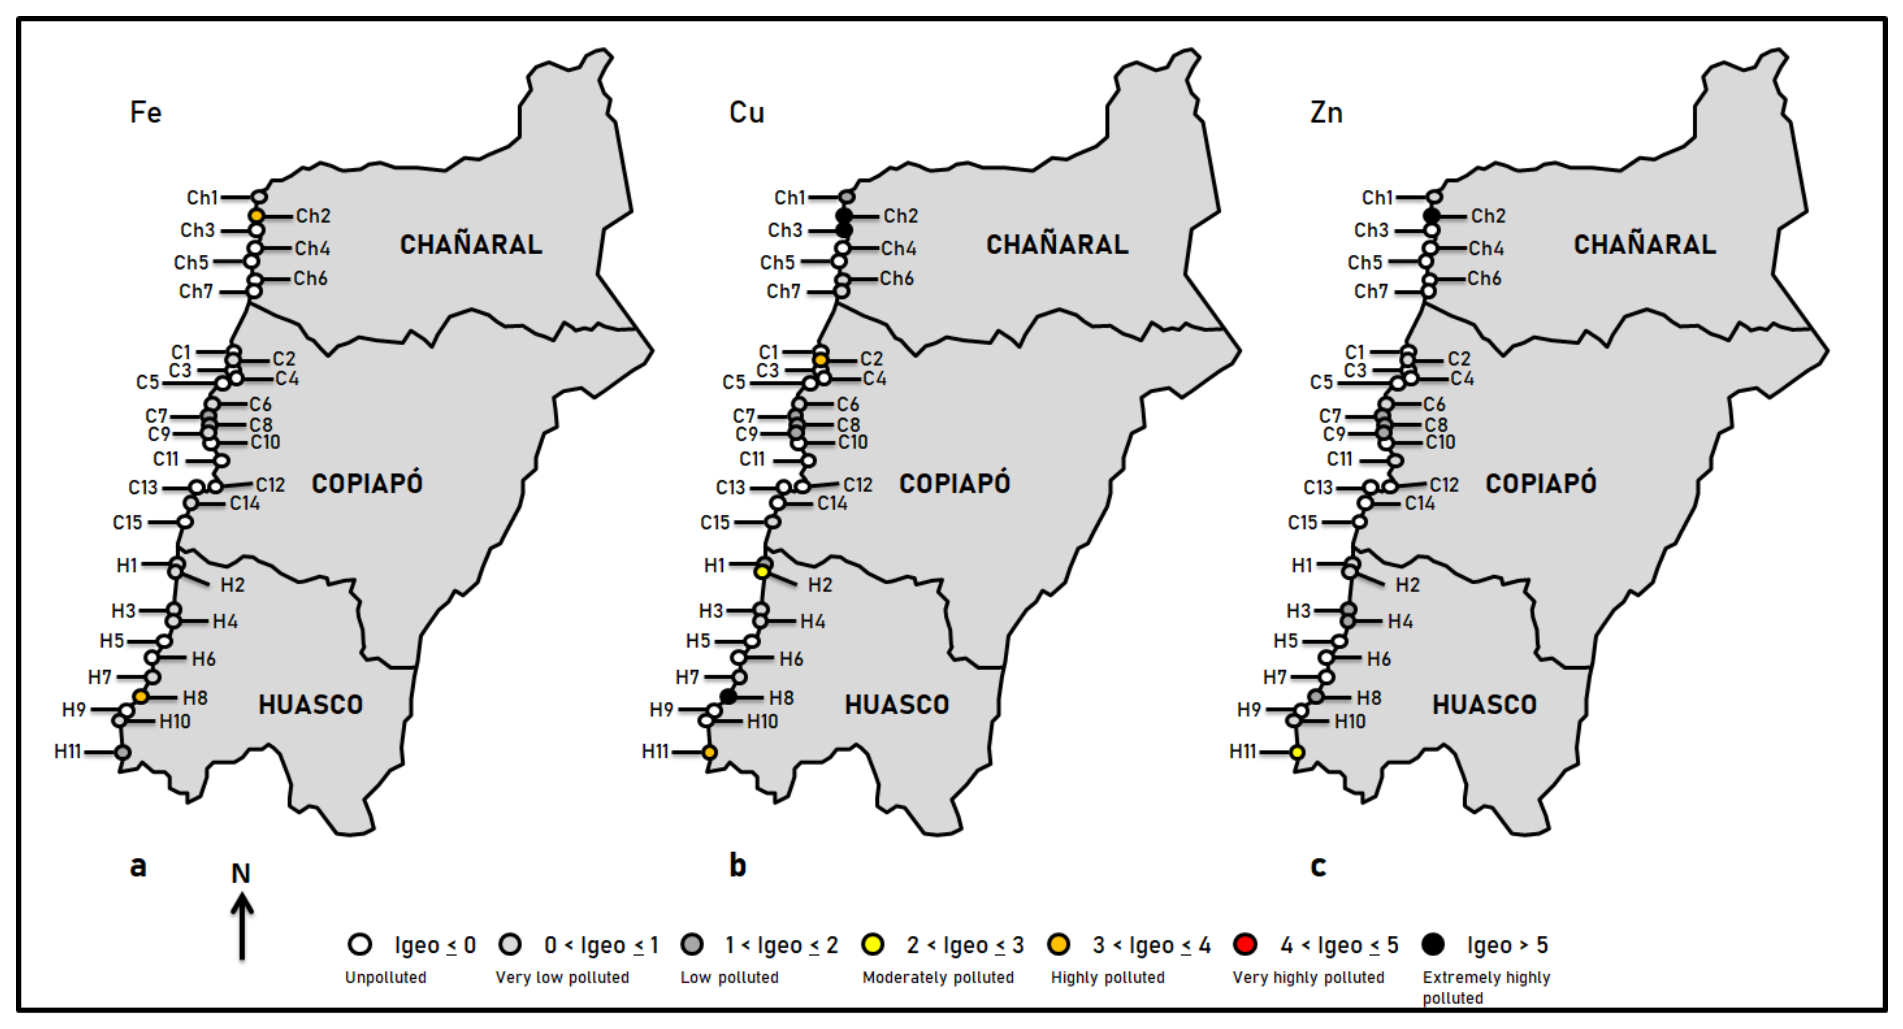
The geoaccumulation index allows us to estimate the level of contamination in the intertidal sediments of Atacama. Sediments highly contaminated with Fe (3.07 ≤ Igeo Fe ≤ 3.74) were found in Playa Blanca (Ch2) and Bahía Sarco (H8) (Figure 5a). These two samples, together with that from Playa Grande (Ch3), were extremely contaminated with copper, with Igeo Cu values exceeding 8. Balneario Caldera (C2) and Chañaral de Aceituno (H11) also showed high levels of contamination from this metal (3 ≤ Igeo Cu ≤ 3.87), while moderate pollution was also found on Carrizal Bajo beach (H2) (Figure 5b). The intertidal sediments of Playa Blanca were also extremely contaminated with Zn (Igeo Zn: 5.56), and only Chañaral de Aceituno showed moderate to high contamination (Igeo Zn: 2.95) among the remaining samples (Figure 5c).
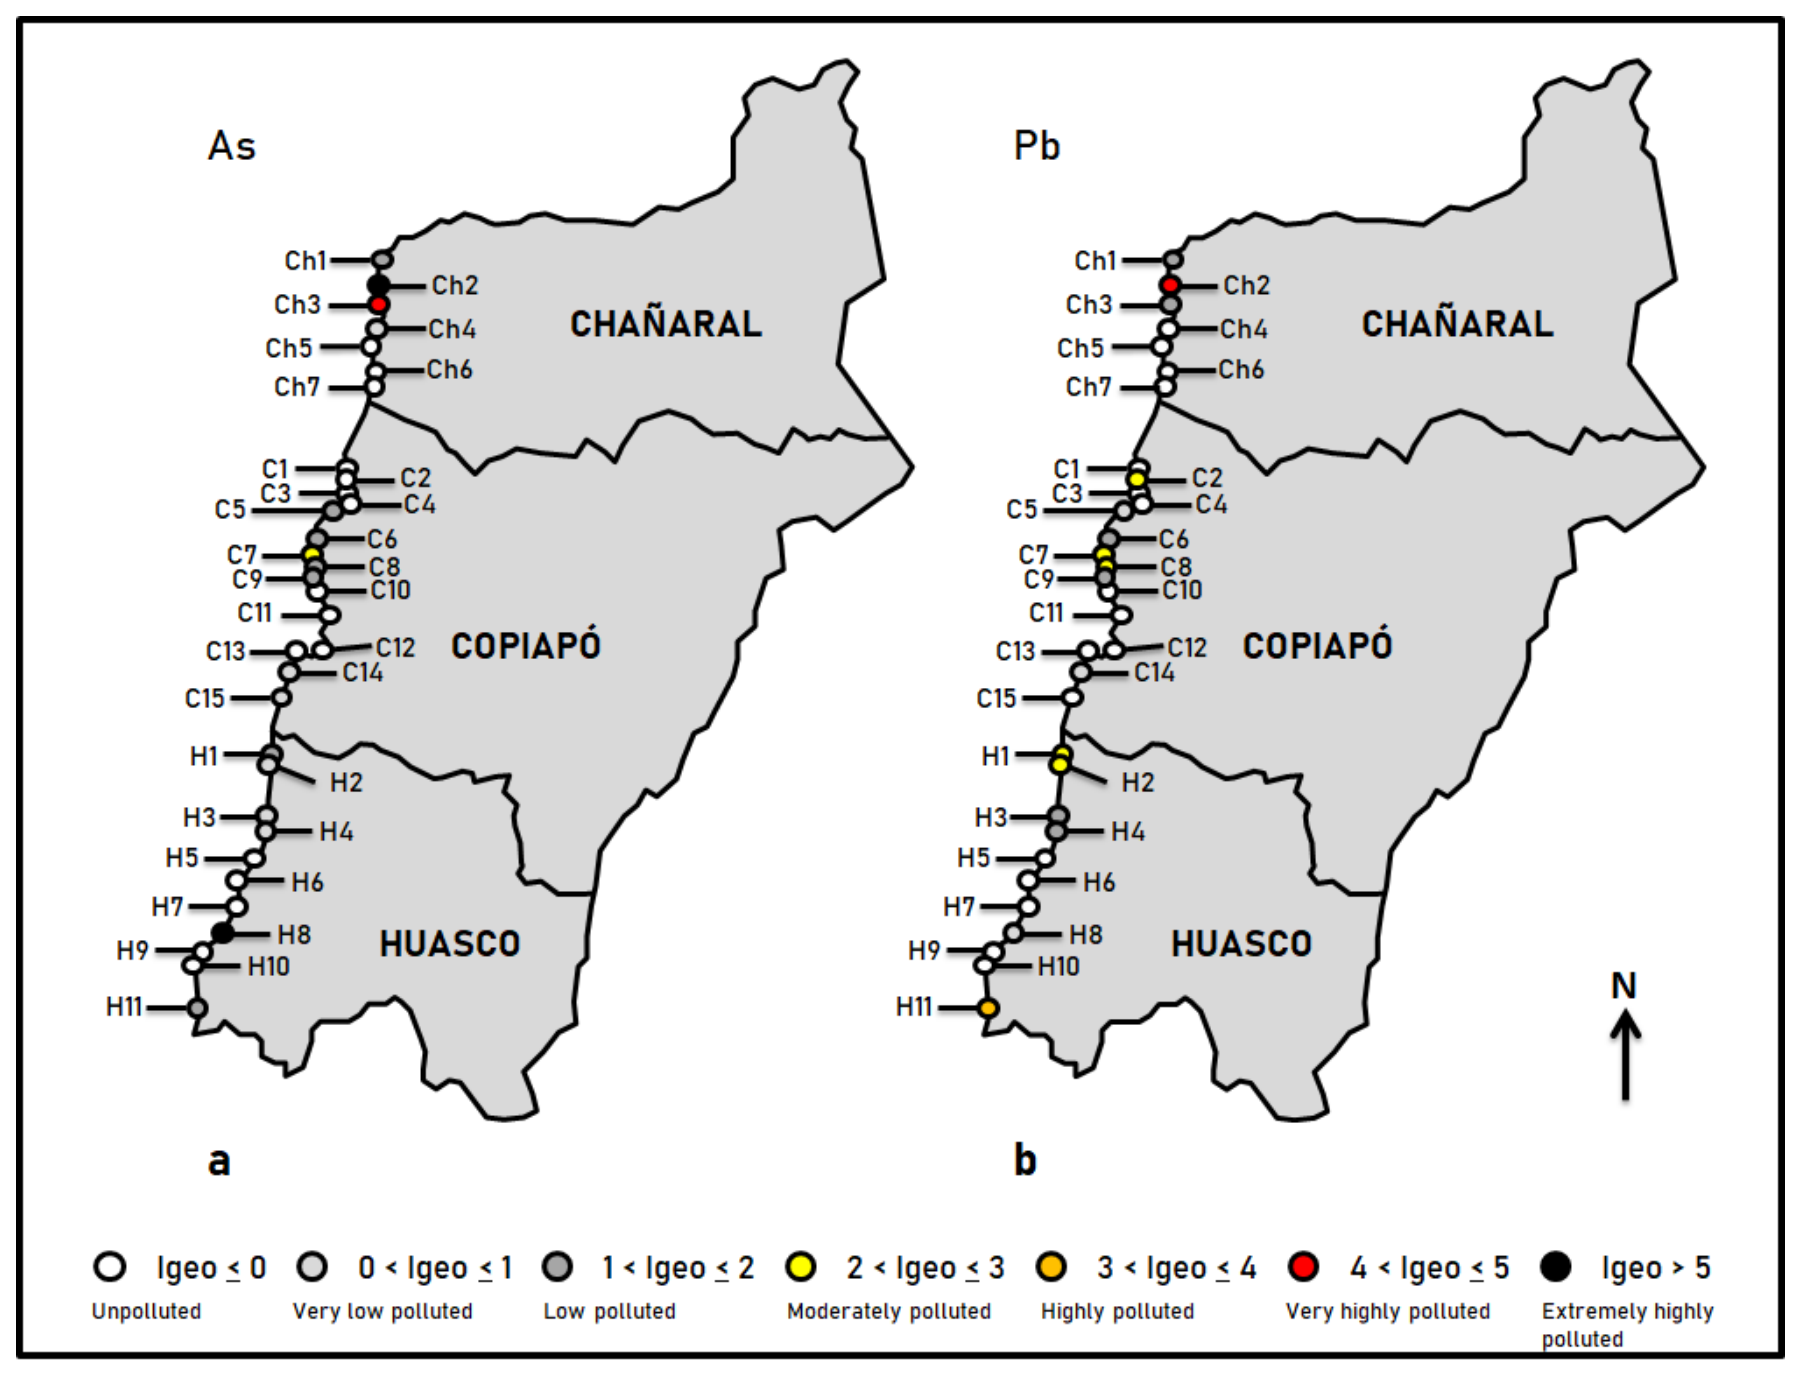
The geoaccumulation index reveals extremely high As pollution in Playa Blanca and Bahía Sarco (5.73 ≤ Igeo As ≤ 5.96), while Playa Grande is heavily contaminated by this metalloid (Igeo As: 4.37) and moderate pollution was also detected at the mouth of the Copiapó River (C7; I geo As: 2.81) (Figure 6a). Playa Blanca is also heavily contaminated with Pb, a metal that is also highly concentrated in Bahía Sarco and causes moderate pollution (2.04 < Igeo Pb < 2.63) in Balneario Caldera, at the mouth of the Copiapó river and in Carrizal Bajo (Figure 6b).

3.5. Sources of Geochemical Pollution

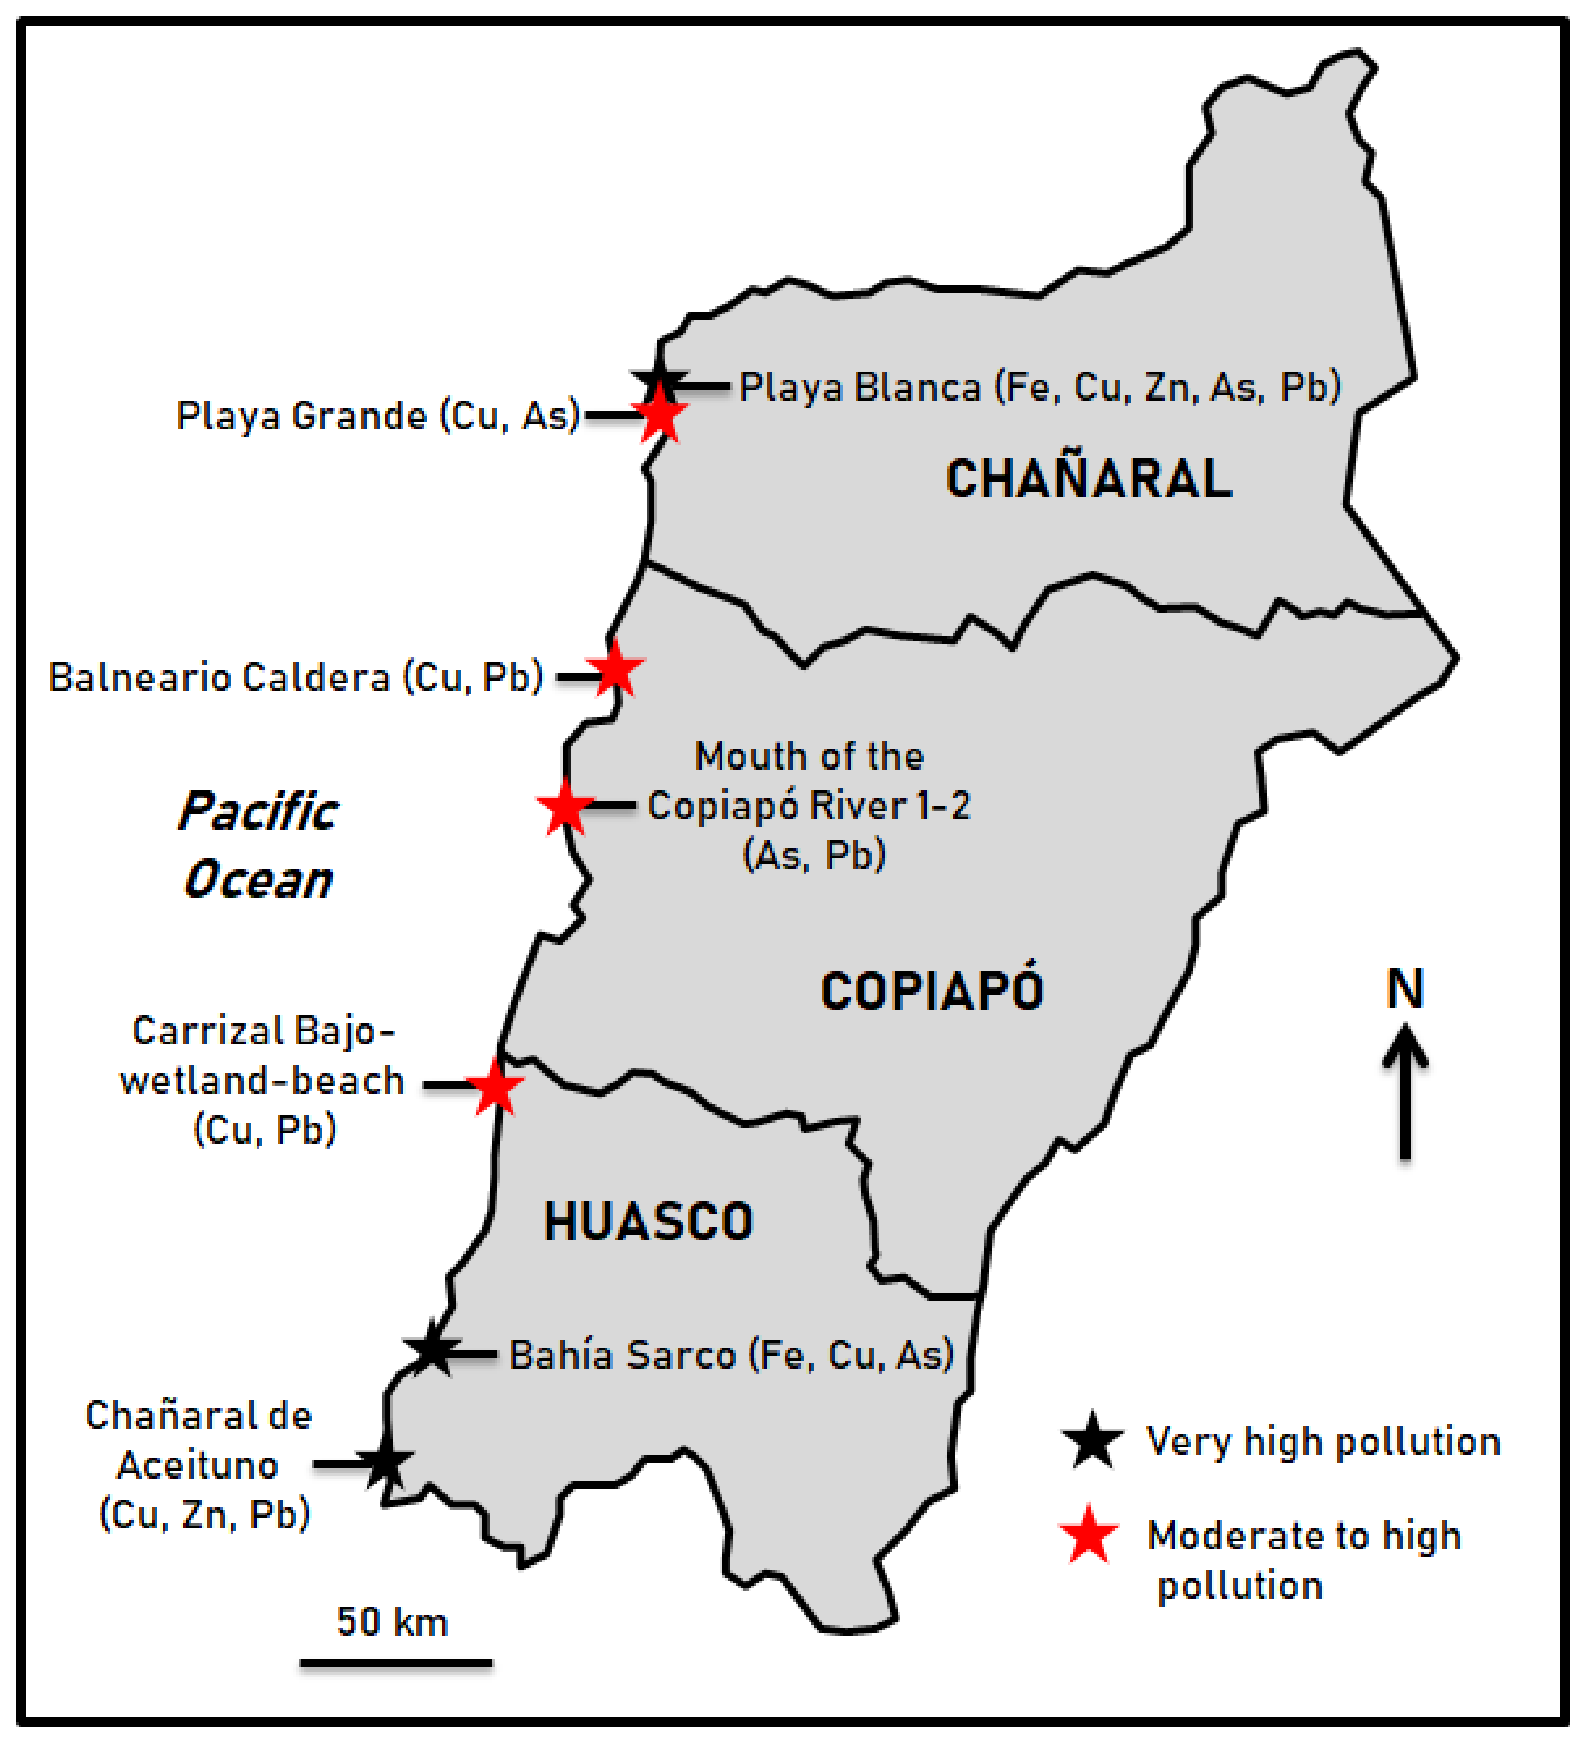
An overall view of the geoaccumulation indices for the five elements analyzed makes it possible to distinguish between moderately and heavily contaminated sites along the southern coast of Atacama and to make a rough estimate of the possible sources of pollution (Figure 7). In the province of Chañaral, the sediments at Playa Blanca stand out for their very high pollution levels of the five elements studied. This site, together with Playa Grande (e.g., outliers G3 and G5), forms part of Chañaral Bay, an enclave where waste from copper mining for over a century converges with waste from the washing of tailings resulting from periodic flooding (e.g., 2015 or 2017) [39]. These high levels have had a significant impact on the reduction and even disappearance of part of the biota, as well as on humans in the area, who have higher levels of these elements in their urine than people in other parts of Chile [review in [40]].
The most polluted intertidal sediments (especially with Cu, As and Pb) in the province of Copiapó were found in Balneario Caldera and the nearby mouth of the Copiapó River. Balneario Caldera is a public beach with high concentrations of organic pollutants, such as polycyclic aromatic hydrocarbons, and this combination of inorganic and organic pollution is related to harbor activities, fishing, urban sewage discharges and, most importantly, the immediacy of a fuel refinery [41]. On the other hand, the Copiapó River basin includes numerous dumps and mine tailings produced by historical Au–Ag processing and by today’s Cu mining (Figure 1a) [42]. Surface runoff and flash flows [43] cause the transport of the analyzed elements towards the mouth of this river and may explain the pollution detected.
In the province of Huasco, sediments highly to extremely polluted by group A were detected in Bahia Sarco. This bay is a historic mining site that served as a port for mines in adjacent mining areas and housed a copper smelter [43]. On the other hand, Carrizal Bajo is currently a wetland protected by a coastal spit, but it was one of the most important ports in Chile during the second half of the 19th century. A rail link connected it to some of the main mining regions in the north of the country (e.g., Carrizal Alto, Astillas, Quebrada Blanca, Jarilla), where significant quantities of polymetallic sulphides were mined. The copper ores were processed in a smelter [44], the slag from which is now scattered all over the land around the village [45]. The moderate to high pollution detected in Chañaral de Aceituno is concerning, given that this cove is a marine reserve with high biodiversity. It is a tourist and artisanal fishing area, but this site has high concentrations of polycyclic aromatic hydrocarbons; these are associated with the frequent boat trips towards Humboldt Penguin Island, which hosts 80% of this penguin species’ population, as well as numerous colonies of sea lions and birds [41].

4. Conclusions

Multivariate statistical analysis and the calculation of the geoaccumulation index for five elements analyzed in the intertidal sediments of the southern Atacama region indicate that most of this stretch of the Chilean coastline is uncontaminated or slightly contaminated with respect to Fe, Cu, Zn, As and Pb. However, various sites in the provinces of Chañaral (Playa Blanca, Playa Grande), Copiapó (Balneario Caldera, mouth of the Copiapó River) and Huasco (Carrizal Bajo, Bahía Sarco, Chañaral de Aceituno) exhibit high to extremely high concentrations of these elements, due to the presence of nearby tailings, former smelting plants, port activities or the passage of ships through nature reserves. These outliers would require attention in order to reduce the level of contamination present in these sediments. It is recommended that the pollution levels of these outliers be monitored and that environmental mitigation measures be adopted to reduce their rates of geoaccumulation.

Author Contributions

Conceptualization, E.B., E.C. and J.S.; methodology, E.B., E.C., J.S., J.M.M., M.I.P., M.I.D., R.M., M.A., T.I. and F.R.; investigation, E.B., E.C., J.S., J.M.M., M.I.P., M.I.D., R.M., M.A., T.I. and F.R.; data curation, E.B., E.C. and J.S.; writing—original draft preparation, E.B., E.C., M.A. and F.R.; writing—review and editing, E.B., E.C., J.S., J.M.M., M.I.P., M.I.D., R.M., M.A., T.I. and F.R.; visualization, E.B. supervision, E.B., E.C., M.A. and F.R.; funding acquisition, E.B. All authors have read and agreed to the published version of the manuscript.

Funding

This work is a contribution to the ANID/CONICYT/FONDECYT 11180015 project and the TRAMPA/PID2021-127268NB-100 project funded by MICIU/AEI/10.13039/501100011033 and FEDER, UE. Other funds were provided by the Andalusian Government (project RNM-238). This is a contribution to the Research Center for Historical, Cultural, and Natural Heritage (CIPHCN) at the University of Huelva.

Data Availability Statement

The raw data supporting the conclusions of this article will be made available by the authors on request.

Conflicts of Interest

The authors declare no conflicts of interest.

References

  1. Trincardi, F.; Francocci, F.; Pellegrini, C.; d’Alcalà, M.R.; Sprovieri, M. The Mediterranean Sea in the Anthropocene. In Oceanography of the Mediterranean Sea; Schroeder, K., Chigiatto, J., Eds.; Elsevier: Amsterdam, The Netherlands, 2023; pp. 501–553. [Google Scholar]
  2. Pellegrini, C.; Saliu, F.; Bosman, A.; Sammartino, I.; Raguso, C.; Mercorella, A.; Gálvez, D.S.; Petrizzo, A.; Madricard, F.; Lasagni, M.; et al. Hotspots of microplastic accumulation at the land-sea transition and their spatial heterogeneity: The Po River prodelta (Adriatic Sea). Sci. Total Environ. 2023, 895, 164908. [Google Scholar] [CrossRef] [PubMed]
  3. Pellegrini, C.; Sammartino, I.; Schieber, J.; Tesi, T.; Paladini de Mendoza, F.; Rossi, V.; Chiggiato, J.; Shroeder, K.; Gallerani, A.; Langone, L.; et al. On depositional processes governing along-strike facies variations of fine-grained deposits: Unlocking the Little Ice Age subaqueous clinothems on the Adriatic shelf. Sedimentology 2024, 71, 941–973. [Google Scholar] [CrossRef]
  4. Pellegrini, C.; Basili, M.; Sammartino, I.; Tesi, T.; Frapiccini, E.; Quero, G.M.; Pizzini, S.; Zangrando, R.; Luna, G.M.; Catena, S.; et al. River flooding reshapes sediments, contaminants and benthic microbial communities in a Mediterranean coastal system. Biogeosciences 2026, 23, 2389–2412. [Google Scholar] [CrossRef]
  5. Zhang, G.; Fan, J.; Wang, J.; Xue, G.; Ma, B.; Ruan, M.; Zhou, J.; Ling, W. Distribution, Sources, and Ecological Risk Assessment of Potentially Toxic Elements in Surface Sediments of Dongzhai Harbor, Hainan Island, China. Minerals 2025, 15, 349. [Google Scholar] [CrossRef]
  6. Alharbi, T.; El-Sorogy, A.S.; Rikan, N.; Algarni, H.M. Impact of Landfill Sites on Coastal Contamination Using GIS and Multivariate Analysis: A Case from Al-Qunfudhah in Western Saudi Arabia. Minerals 2025, 15, 802. [Google Scholar] [CrossRef]
  7. Seif, R.A.; Ene, A.; Zakaly, H.M.H.; Sallam, A.M.; Taalab, S.A.; Fnais, M.S.; Saadawi, D.A.; Amer, S.A.; Awad, H.A. Distribution of Heavy Metals along the Mediterranean Shoreline from Baltim to El-Burullus (Egypt): Consequences for Possible Contamination. Minerals 2024, 14, 931. [Google Scholar] [CrossRef]
  8. Dimiza, M.D.; Triantaphyllou, M.V.; Portela, M.; Koukousioura, O.; Karageorgis, A.P. Response of Living Benthic Foraminifera to Anthropogenic Pollution and Metal Concentrations in Saronikos Gulf (Greece, Eastern Mediterranean). Minerals 2022, 12, 591. [Google Scholar] [CrossRef]
  9. Liu, B.; Zhang, W.; Chi, G. Distribution and Risk Assessment of Heavy Metals in Sediment from Bohai Bay, China. Minerals 2019, 9, 111. [Google Scholar] [CrossRef]
  10. Bonnail, E.; Díaz-García, A.; Cruces, E.; García, A.; Borrero-Santiago, A.R. Coastal uses and contaminant spread in the desert coastal región of Atacama. Chemosphere 2020, 288, 132519. [Google Scholar] [CrossRef]
  11. Velychamy, C.; Sharma, A.; Thiagarajan, T. Assessment of heavy metal pollution and human health risk along the Southeast coast of India: A comprehensive ecotoxicological study. Mar. Pollut. Bull. 2025, 221, 118512. [Google Scholar] [CrossRef] [PubMed]
  12. Ben Ameur, W.; Annabi, A.; Rania, K.; Marini, M. Assessment of Heavy Metal Contamination and Human Health Risk in Parapenaeus longirostris from Coastal Tunisian Aquatic Ecosystems. Pollutants 2025, 5, 23. [Google Scholar] [CrossRef]
  13. El-Sharkawy, M.; Alotaibi, M.O.; Li, J.; Du, D.; Mahmoud, E. Heavy Metal Pollution in Coastal Environments: Ecological Implications and Management Strategies: A Review. Sustainability 2025, 17, 701. [Google Scholar] [CrossRef]
  14. Zhu, W.; Cai, J.; Ma, W.; Li, B.; Feng, W. Distribution, sources and risk assessment of heavy metals in Yangshan port and its adjacent sea áreas. Front. Mar. Sci. 2025, 11, 1512115. [Google Scholar] [CrossRef]
  15. Alorda-Montiel, I.; Rodellas, V.; Arias-Ortiz, A.; Palanqués, A.; Bravo, A.G.; Rodríguez-Puig, J.; Alorda-Kleinglass, A.; Green-Ruiz, C.; Diego-Feliu, M.; Marqué, P.; et al. A century of sediment metal contamination of Mar Menor, Europe’s largest saltwater lagoon. Mar. Pollut. Bull. 2025, 220, 118347. [Google Scholar] [CrossRef] [PubMed]
  16. Abdelaal, A.; Saleh, G.M.; Lasheen, E.R.; Sami, M.; Khaleal, F.M.; Sanislav, I.V.; Abdalla, F. Heavy metals and radioactivity assessment of the coastal sediments at Abu Ghusun, southern Red Sea, Egypt. J. Radiat. Res. Appl. Sci. 2025, 18, 101976. [Google Scholar] [CrossRef]
  17. Al-Kahtany, K.; El-Sorogy, A.; Alharbi, T.; Giacobbe, S.; Nour, H.E. Health risk assessment and contamination of potentially toxic elements in southwest of the Red Sea coastal sediment. Reg. Stud. Mar. Sci. 2023, 65, 103103. [Google Scholar] [CrossRef]
  18. Bat, L.; Sahin, F.; Oztekin, A.; Ozsandikci, U.; Ozkan, E.Y. Trace elements pollution in surface sediment of the Sea of Marmara coastal and transition water. Mar. Pollut. Bull. 2025, 218, 118067. [Google Scholar] [CrossRef] [PubMed]
  19. Zhand, S.; Dong, C.; Wang, J.; Zheng, M.; Chen, X.; Zhou, Y.; Yang, J.; Mao, X. Spatial variations and potential risks of heavy metals in sediments, seawater, and marine organisms of Yuhuan coastal area, China. Front. Mar. Sci. 2025, 12, 1708328. [Google Scholar] [CrossRef]
  20. Aquilano, A.; Marrocchino, E.; Paletta, M.G.; Tessari, U.; Vaccaro, C. Geochemical Characterization of Sediments from the Bibione Coastal Area (Northeast Italy): Details on Bulk Composition and Particle Size Distribution. J. Mar. Sci. Eng. 2023, 11, 1650. [Google Scholar] [CrossRef]
  21. Thangaraj, K.; Rajendran, M.; Karthikeyan, S.; Velmayil, P.; Kulandaisamy, P.; Sundaram, B.; Arumugam, M. Assessment of heavy metal contamination and pollution load in surface sediments of Putheri Lake cluster, Nagercoil, Southern India. J. Sediment. Environ. 2025, 10, 409–428. [Google Scholar] [CrossRef]
  22. Sung, B.; Friedmann, J.L.; Lima, P.A.; Michaelovich, M.; Lopes, C. Critical evaluation of different methods to calculate the Geoaccumulation Index for environmental studies: A new approach for Baixada Santista—Southeastern Brazil. Mar. Pollut. Bull. 2018, 127, 548–552. [Google Scholar] [CrossRef] [PubMed]
  23. Consejo Minero. Cifras Actualizadas de la Minería. Octubre 2025. PLUSmining 2025. Available online: https://consejominero.cl/wp-content/uploads/2025/11/20251030-CAM-octubre-1.pdf (accessed on 3 April 2026).
  24. Comisión Chilena del Cobre. Monitoreo del Estado de Los Relaves en Chile. Dirección de Estudios y Políticas Públicas. 2022. Available online: https://www.comicivyt.cl/wp-content/uploads/2025/03/Cochilco-2022-Informe-Monitoreo-del-estado-relaves-min.pdf (accessed on 4 April 2026).
  25. Pérez, L.A.; Izquierdo, T.; Abad, M.; Caraballo, M.; Ureta, S.; Ruiz, F. The Past Is Never Dead: Soil Pollution from Mining in the Copiapó River Basin (Northern Chile). Soil Syst. 2024, 8, 106. [Google Scholar] [CrossRef]
  26. Izquierdo, T.; Bonnail, E.; Abad, M.; Dias, M.I.; Prudencio, M.I.; Marques, R.; Rodríguez Vidal, J.; Ruiz, F. Pollution and potential risk assessment of flood sediments in the urban area of the mining Copiapó basin (Atacama Desert). J. S. Am. Earth Sci. 2020, 103, 102714. [Google Scholar] [CrossRef]
  27. Tapia, J. El desastre ambiental de la Bahía de Chañaral. Okeanos 2016, 2, 50–55. [Google Scholar]
  28. Ramírez, M.; Massolo, S.; Franche, R.; Correa, J.A. Metal speciation and environmental impact on sandy beaches due to El Salvador copper mine, Chile. Mar. Pollut. Bull. 2005, 50, 62–72. [Google Scholar] [CrossRef] [PubMed]
  29. Izquierdo, T.; Rivera, A.-L.; Galeano, A.; Gallardo, D.I.; Salas, V.; Aparicio, O.; Buylaert, J.-P.; Ruiz, F.; Abad, M. Historical catastrophic floods at the southern edge of the Atacama Desert: A multi-archive reconstruction of the Copiapó river extreme events. Glob. Planet. Chang. 2024, 236, 104411. [Google Scholar] [CrossRef]
  30. Valdés, J.; Tapia, J.S. Spatial monitoring of metals and As in coastal sediments of northern Chile: An evaluation of background values for the analysis of local environmental conditions. Mar. Pollut. Bull. 2019, 145, 624–640. [Google Scholar] [CrossRef] [PubMed]
  31. Cantarutti, G.E. Mining Under Inca Rule in North-Central Chile: The Los Infieles Mining Complex. In Mining and Quarrying in the Ancient Andes; Tripcevich, N., Vaughn, K.J., Eds.; Springer: New York, NY, USA, 2013; pp. 185–211. [Google Scholar] [CrossRef]
  32. Jeria, Y.; González, C. Chañaral. Minería y Sociedad; Mantos Copper S.A.: Región de Atacama, Chile, 2017. [Google Scholar]
  33. Lorca, M. Minería y patrimonialización en el Norte Chico de Chile. Re Met. 2015, 25, 75–84. [Google Scholar]
  34. Centro de Estudios y Documentación Mineros de SONAMI. Distritos Productivos Para el Desarrollo de la Minería Chilena; SONAMI: Santiago, Chile, 2025; Available online: https://www.sonami.cl/v2/wp-content/uploads/2025/04/Estudio-Distritos-Productivos-SONAMI.pdf (accessed on 3 April 2026).
  35. Marambio-Alfaro, Y.; Valdés, J.; Enciso, L.N.; López, A.; Serrano, A.E.; Martínez, R.; Castillo, A.; Álvarez, G.; Vidal, M. Data on metal accumulation in the tails of the lizard Microlophus atacamensis in a coastal zone of the Atacama Desert, northern Chile: A non-destructive biomonitoring tool for heavy metal pollution. Data Brief 2020, 32, 106032. [Google Scholar] [CrossRef] [PubMed]
  36. Muller, G. Index of geoaccumulation in sediments of the Rhine River. Geojournal 1969, 2, 108–118. [Google Scholar]
  37. Svetlana Maslennikova, S.; Larina, N.; Larin, S. The effect of sediment grain size on heavy metal content. Lakes Reserv. Ponds 2012, 6, 43–54. [Google Scholar]
  38. Fang, F.; Li, Y.; Lin, Y.; Xu, M. Grain-size distribution and chemical speciation of heavy metals in Chinese street dust. Pol. J. Environ. Stud. 2017, 26, 1501–1509. [Google Scholar] [CrossRef] [PubMed]
  39. Bonnail, E.; Cruz-Hernández, P.; Galleguillos, S.; Izquierdo, T.; Abad, M. La contaminación metálica en la bahía de Chañaral (norte de Chile): Retrospección, prospección y proyección. Geogaceta 2020, 67, 59–62. [Google Scholar]
  40. Cortés, S.; González, P.; Leiva, C.; Vargas, Y.; Vega, A.; Pastén, P. Environmental and Public Health Impacts of Mining Tailings in Chañaral, Chile: A Narrative Case-Based Review. Sustainability 2025, 17, 7732. [Google Scholar] [CrossRef]
  41. Tovar-Salvador, M.; Pintado-Herrera, M.G.; Lara-Martín, P.A.; Bonnail, E. Occurrence, sources and environmental risk assessment of organic micropollutants in coastal sediments from the Atacama Region (Chile). Sci. Total Environ. 2023, 900, 165871. [Google Scholar] [CrossRef] [PubMed]
  42. Aguilar, G.; Valdés, A.; Cabré, A.; Galdames, F. Flash floods controlling Cu, Pb, As and Hg variations in fluvial sediments of a river impacted by metal mining in the Atacama Desert. J. S. Am. Earth Sci. 2021, 109, 103290. [Google Scholar] [CrossRef]
  43. Griem, W. Ruinas de la ex Caleta Sarco—Región de Atacama. 2020. Available online: https://www.geovirtual2.cL/minas/Sarco02esp.htm (accessed on 4 April 2026).
  44. Nazer, A.; Pavez, O. Sistema constructivo de una fundición de cobre del siglo XIX en Atacama, Chile. Obras Proy. 2023, 33, 64–73. [Google Scholar] [CrossRef]
  45. Abad, M.; Izquierdo, T.; Forch, M.; Cortés, P.; Easton, G.; González-Alfaro, J.; Alvarado-Justo, A.; Ruiz, F. El registro de tsunamis en costas áridas: 100 años después del tsunami de 1922 de Atacama en el norte de Chile. Geogaceta 2023, 74, 47–50. [Google Scholar] [CrossRef]
Figure 1. (a) Distribution of current and historical mining sites in northern Chile; (b) locations of coastal samples studied. Chañaral-Copiapó-Huasco-Coquimbo: provinces of Chile.
Minerals 16 00643 g001
Figure 2. Principal component analysis applied to the five elements analyzed.
Minerals 16 00643 g002
Figure 3. Cluster analysis (Ward’s method), with the average concentrations (in mg/kg) of the differentiated groups.
Minerals 16 00643 g003
Figure 4. Spatial distribution of differentiated groups. Chañaral-Copiapó-Huasco: provinces of Chile.
Minerals 16 00643 g004
Figure 5. Geoaccumulation index: (a) Fe; (b) Cu; (c) Zn. Chañaral-Copiapó-Huasco: provinces of Chile.
Minerals 16 00643 g005
Figure 6. Geoaccumulation index: (a) As; (b) Pb. Chañaral-Copiapó-Huasco: provinces of Chile.
Minerals 16 00643 g006
Figure 7. Most polluted areas of southern Atacama coastline. Chañaral-Copiapó-Huasco: provinces of Chile.
Minerals 16 00643 g007
Table 1. Grain size distributions of the samples studied.
ProvinceSampleLocationGRVCSCSMSFSVFSSILT + CLAY
ChañaralCh1Pan de Azúcar13.0578.387.660.880.0300
Ch2Playa Blanca000.3487.1811.391.090
Ch3Playa Grande 0.030.012.3187.439.440.740.03
Ch4Los Médanos26.3916.627.8236.1712.710.290
Ch5Los Toyos100000000
Ch6Flamenco (beach)00.231.011.019.786.271.77
Ch7Flamenco (management area)0.030.021.4160.6836.261.60
CopiapóC1Ramada0.110.140.747.2650.161.630
C2Balneario Caldera0.230.834.6949.5641.43.290
C3Las Machas00.440.440.441.7649.3447.58
C4Rocas Negras02.39.9970.3116.870.530
C5Bahía Cisne00.150.8956.9941.660.320
C6Río Copiapó (wetland)13.776.3210.6652.9414.061.880.36
C7Mouth of the Copiapó River (1)0.410.070.4363.3434.960.750.04
C8Mouth of the Copiapó River (2)0.010.1770.9223.495.260.160
C9Puerto Viejo0.060.120.5429.3767.192.720.01
C10Playa La Virgen00.011.1484.8113.970.080
C11Barranquilla0.23.6642.3143.610.120.120
C12Caleta del Medio00.040.233.0592.254.420
C13Bahía Chasco0.240.070.4518.6875.684.880
C14Pajonales0.820.67120.7975.521.210
C15Caleta Totoral5.2929.4450.1913.032.010.020.02
HuascoH1Carrizal Bajo (wetland)13.776.3210.6652.9414.061.880.36
H2Carrizal Bajo (beach)00.080.9630.664.941.711.71
H3Mouth of the Huasco River00.040.0448.9149.031.960.02
H4Huasco beach0.090.030.094.2192.063.470.03
H5Playa Brava00.182.3375.3222.110.060
H6Punta Tongoy00.0624.9871.223.730.010
H7La Chépica3.812.3976.8913.213.520.180
H8Bahía Sarco49.915.8626.537.280.390.030.01
H9Los Burros Sur6.296.4877.667.891.670.020
H10Agua la Zorra36.840.3722.510.20.050.050.02
H11Chañaral de Aceituno38.1226.4622.195.614.262.910.45
Table 2. Descriptive statistics of elements.
ElementMean ± Standard DeviationMedianRangeCoefficient of Variation (%)
As13.75 ± 35.762.80.3–159323
Cu262.87 ± 909.416.70.4–4734.7438
Fe15,820.99 ± 24,278.28906.61841.2–126,189.3275
Pb4.92 ± 8.23 1.70.6–45.2437
Zn35.06 ± 104.0111.32.4–607.4391
Table 3. Geochemical contents (in mg/kg). Bold: three highest concentrations of each metal(loid).
ProvinceSampleLocationFeCuZnAsPb
ChañaralCh1Pan de Azúcar13,633.918.320.96.15.4
Ch2Playa Blanca79,951.31857.4607.415945.2
Ch3Playa Grande7555.81691.67.252.64.1
Ch4Los Médanos4655.95.9102.91.5
Ch5Los Toyos3468.16.17.61.31.4
Ch6Flamenco (Beach)5021.89.97.91.20.9
Ch7Flamenco (southern management area)4716.98.3111.41.1
CopiapóC1Ramada3842.43.75.11.40.7
C2Balneario Caldera9707.896.918.41.87.4
C3Las Machas2596.92.56.11.30.8
C4Rocas Negras8906.63.19.62.11.7
C5Bahía Cisne7740.23.911.35.82.2
C6Copiapó River (wetland)12,088.610.924.66.35.7
C7Mouth of the Copiapó River (1)28,50224.441.117.97.7
C8Mouth of the Copiapó River (2)23,098.513.934.98.37.9
C9Puerto Viejo18,154.713.535.27.67.1
C10Playa La Virgen1841.20.42.40.40.6
C11Barranquilla8379.23.6151.40.9
C12Caleta del Medio4019.52.25.81.30.9
C13Bahía Chasco5272.65.36.42.31.7
C14Pajonales9910.96.111.32.81.9
C15Caleta Totoral7221.46.78.431.7
HuascoH1Carrizal Bajo (wetland)16,142.821.519.27.911.2
H2Carrizal Bajo (beach)10,321.639.115.84.59.4
H3Mouth of the Huasco River 12,503.1727.74.44.3
H4Huasco beach12,313.28.527.64.34.2
H5Playa Brava5717.42.48.30.40.8
H6Punta Tongoy43102.84.61.30.6
H7La Chépica11,625.75.76.80.90.7
H8Bahía Sarco126,189.34734.725.8135.52.4
H9Los Burros Sur5859.32.98.80.40.7
H10Agua la Zorra14,894.22.716.20.31.4
H11Chañaral de Aceituno31,929.652.988.55.618.3
Table 4. Spearman’s correlation matrix. 0.93: p < 0.01; −0.37: p < 0.05; NS: Not significant.
GravelVery Coarse SandCoarse SandMedium SandFine SandVery Fine SandSilt and ClayFeCuZnAsPb
Gravel1
Very coarse sandNS1
Coarse sandNSNS1
Medium sand−0.4−0.39NS1
Fine sand−0.37−0.37−0.47NS1
Very fine sandNSNSNSNSNS1
Silt and clayNSNSNSNSNS0.51
FeNSNSNSNSNSNSNS1
CuNSNSNSNSNSNSNS0.891
ZnNSNSNSNSNSNSNS0.52NS1
AsNSNSNSNSNSNSNS0.890.870.731
PbNSNSNSNSNSNSNS0.51NS0.930.651
Disclaimer/Publisher’s Note: The statements, opinions and data contained in all publications are solely those of the individual author(s) and contributor(s) and not of MDPI and/or the editor(s). MDPI and/or the editor(s) disclaim responsibility for any injury to people or property resulting from any ideas, methods, instructions or products referred to in the content.