Article

Pre-Concentration of Low-Grade Hard-Rock Uranium Ore by Dense Medium Cyclone Separation: Mineralogical Constraints and CFD Validation

by
Guang Li
,
Xue-Bin Su
*,
Ai-Fei Yi
,
Jia Ma
and
Xian-Ming Hou
Beijing Research Institute of Chemical Engineering and Metallurgy, China National Nuclear Corporation, Beijing 101149, China
*
Author to whom correspondence should be addressed.
Minerals 2026, 16(6), 640; https://doi.org/10.3390/min16060640
Submission received: 24 April 2026 / Revised: 12 June 2026 / Accepted: 13 June 2026 / Published: 17 June 2026
(This article belongs to the Section Mineral Processing and Extractive Metallurgy)

Abstract

The mineralogical characteristics of low-grade hard-rock uranium ore from the Zoujiashan deposit were systematically investigated via multiple analytical techniques, including chemical analysis, X-ray fluorescence (XRF) spectrometry, uranium occurrence analysis, 3D X-ray micro-computed tomography (CT), an automated mineral identification and characterization system (AMICS), and scanning electron microscopy coupled with energy-dispersive X-ray spectroscopy (SEM-EDS). The results revealed that the uranium grade of the ore was only 0.202%, among which 65.87% existed in the form of independent uranium minerals, while the remaining 34.13% existed in a dispersed ionic state. Except for quartz, most uranium minerals and gangue minerals were finely disseminated and closely intergrown. The pre-concentration of the ore is therefore necessary to separate uranium-rich particles from barren particles at a coarse particle size. Ore density analysis demonstrated that the feed particle size exerted a significant impact on the separation performance, and the optimum feed particle size was determined to be 20 mm. Subsequently, dense medium cyclone (DMC) separation tests were conducted. The experimental results indicated that fine grains were prone to report to low-density products (tailings) during mixed-size beneficiation. Under a tailings yield of 54%, for the −20 + 8 mm coarse fraction, the tailings uranium grade was 0.025% and the uranium recovery of the concentrate was 88.05%. Therefore, classified separation can effectively promote separation efficiency. To reveal the density control mechanism of the particle separation behavior inside the DMC, computational fluid dynamics (CFD) simulations were implemented with the Eulerian–Eulerian multiphase model in ANSYS-Fluent (version 2020R2). The simulation results suggested that a density difference of 8.6% realized effective separation. This work achieved the effective treatment of low-grade hard-rock uranium ore via DMC separation, providing a novel technical route for uranium ore pre-concentration.

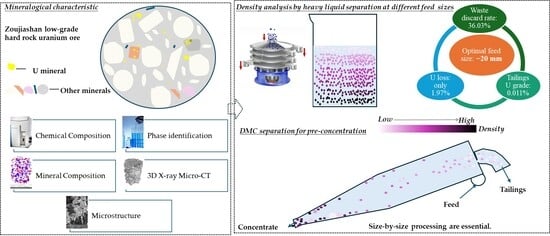
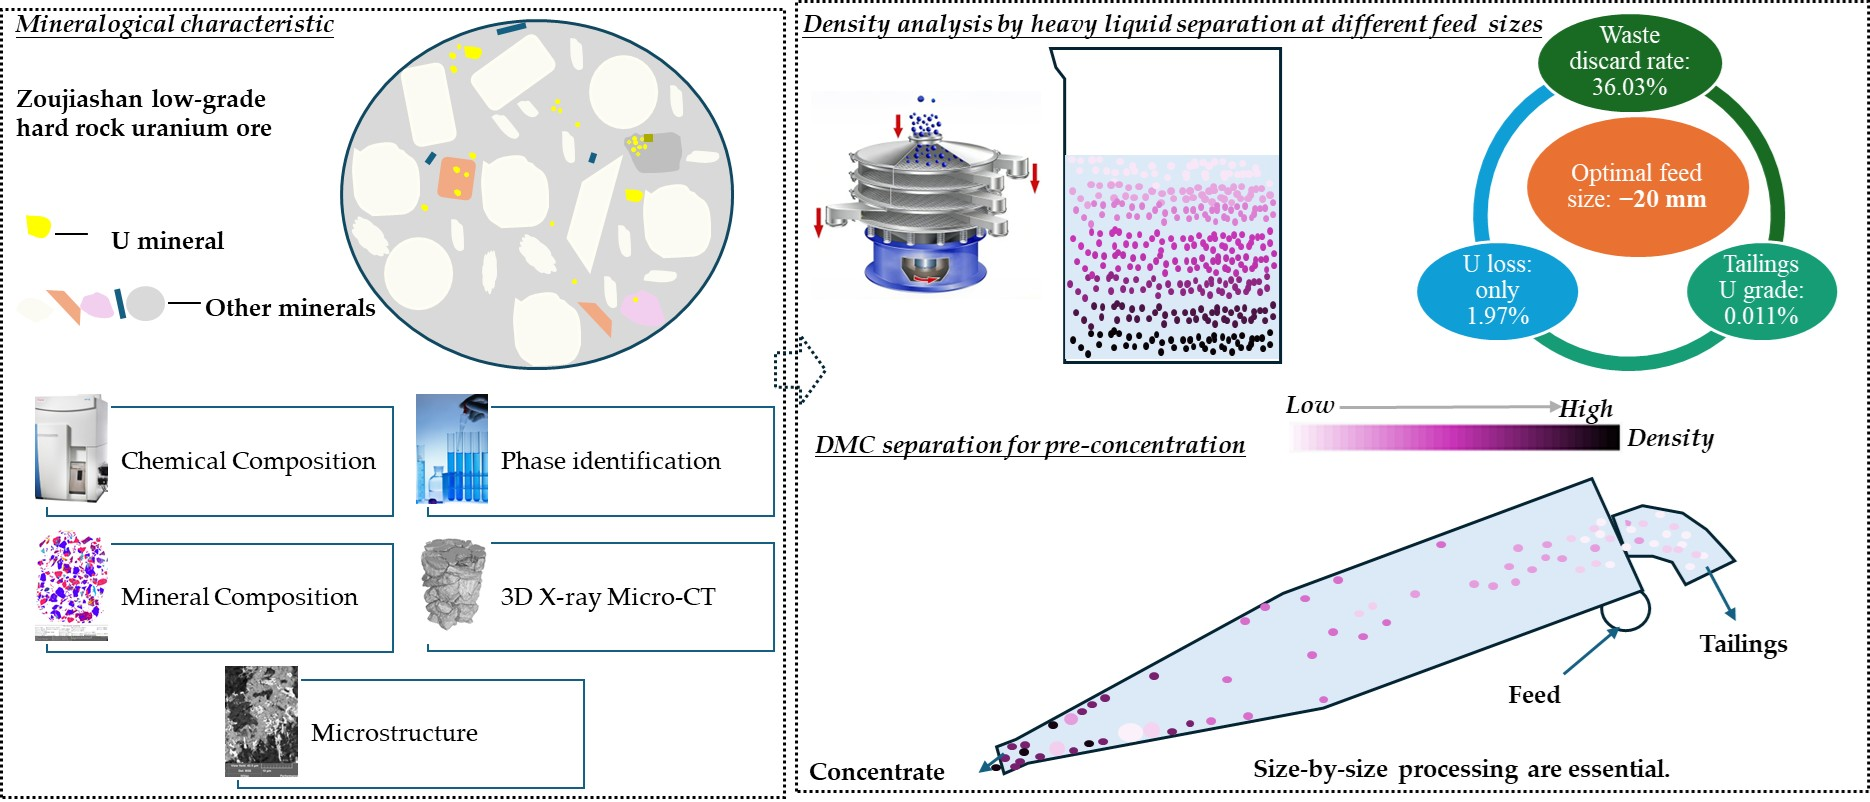
Graphical Abstract

1. Introduction

Uranium is a vital strategic resource, bearing close ties to national security and energy development [1,2]. With the rapid development of the nuclear power industry, the demand for natural uranium has increased significantly [3,4,5]. Industrial uranium deposits are mainly classified into the hard-rock type, sandstone type, coal-rock type, and other categories [6,7]. Volcanic-type uranium ore is a subcategory of hard-rock uranium ores [8]. Currently, leaching is the primary technology for uranium extraction [9,10]. However, when extracting uranium from hard-rock uranium deposits, the ore must be finely ground to achieve the effective liberation of uranium minerals. This hydrometallurgical process faces several challenges, including high consumption of leaching agents, elevated production costs per ton of uranium metal, and the generation of large quantities of leaching residues [11]. Along with severe safety and environmental concerns, most hard-rock uranium mines are currently shut down or remain undeveloped. To address these issues and cut production costs, a pre-concentration process to reject tailings, followed by the hydrometallurgical treatment of concentrates, is proposed. This process aims to improve the uranium grade of the leaching feed, thereby reducing the subsequent processing load and mitigating environmental risks.
In uranium ore beneficiation, only radiometric sorting has been widely applied [12,13], whereas conventional methods including gravity separation, flotation, and magnetic separation are less commonly used. Radiometric sorting utilizes the natural radioactivity of uranium ores to determine the ore grade by detecting the radiation emitted from ore fragments, thus separating uranium ore from waste rock [14,15]. However, this technique suffers from high equipment investment as well as high operation and maintenance costs. Considerable research efforts have been dedicated to conventional uranium ore beneficiation methods [7,16,17,18]. Given the relatively high density of uranium minerals, gravity separation shows potential for uranium pre-concentration. Nonetheless, challenges still exist, including the fine dissemination of uranium minerals and low uranium recovery [19]. Furthermore, the negligible differences in floatability between most uranium minerals and gangue minerals result in poor separation selectivity. To date, efficient flotation has been reported only for betafite [20]. In addition, the conventional flotation process suffers from drawbacks such as long flowsheets and difficulties in the treatment and recycling of radioactive wastewater [19], with no major breakthroughs achieved over many years. The difficulties in uranium ore beneficiation have restricted the application of beneficiation technology in uranium mining and metallurgy. Therefore, the development of novel and efficient beneficiation techniques for uranium ores is crucial for the sustainable exploitation of hard-rock uranium resources.
The continuous expansion of the nuclear power installed capacity is further posing threats to China’s uranium resource security [21]. Therefore, accelerating the development and utilization of low-grade uranium ores is the key to alleviating the shortage of high-grade uranium resources and breaking through the bottleneck hindering the future development of the uranium industry [7,22]. For low-grade uranium ores, agitation leaching delivers the highest uranium leaching rate (exceeding 90% in some cases) with a short leaching time (generally less than 10 h). Nevertheless, this process suffers from extremely high energy consumption as ores must be finely ground to ≤0.075 mm, alongside high acid consumption, substantial impurity dissolution, and elevated capital and operating costs. Concentrated acid curing leaching takes advantage of exothermic reactions. However, it requires dry grinding prior to blending with a high-concentration acid. Dry grinding generates large amounts of dust and severe environmental pollution and places strict requirements on the processing equipment. It still causes the considerable leaching of impurities and has a long curing period. Heap leaching eliminates fine grinding and boasts the lowest energy consumption, simple process flows, limited impurity leaching, and low capital and operational costs. Its drawbacks lie in the relatively long leaching cycle (over 12 days) and moderate uranium recovery (around 80%) [23]. While bioleaching avoids excessive acid consumption, it is plagued by core bottlenecks including an extremely long treatment cycle, low uranium extraction rate, and negligible improvement via particle size reduction [24].
This study takes the low-grade Zoujiashan hard-rock uranium ore from the Xiangshan deposit in Jiangxi Province as the research object and investigates its mineralogical characteristics in detail. Mineralogical studies reveal that the Zoujiashan uranium ore cannot be beneficiated through conventional methods to liberate uranium minerals as discrete particles. Instead, uranium-rich particles can be effectively separated from gangue at a coarse particle size to achieve pre-concentration, and DMC separation is identified as the optimal process to achieve this goal. Therefore, with full consideration of the interference from the particle size effect in the separation process, ore classification–dense medium separation tests were conducted. To further reveal the coupling control mechanism between the particle density and particle size during the separation process, CFD numerical simulations were carried out on the ANSYS-Fluent platform using the Eulerian–Eulerian multiphase model. By investigating the motion behavior of particles with different densities in a dense medium cyclone at a uniform particle size of 8 mm, the respective effects of the particle density and particle size on the separation efficiency were clarified, providing theoretical and experimental support for the efficient pre-concentration of low-grade hard-rock uranium ores.

2. Materials and Methods

2.1. Materials

The Xiangshan uranium deposit in Jiangxi Province is a large-scale hard-rock uranium deposit [25] and a well-known volcanic-type uranium deposit in China [26]. The Zoujiashan uranium deposit constitutes one of the major deposits within the Xiangshan ore field [27]. It is characterized by a wide variety of hydrothermal alteration types. Early-stage alteration is alkaline, dominated by albitization and potassic feldspathization. However, late-stage alteration is acidic, mainly including hydromicatization and fluoritization [28]. The samples used in this study were collected from the Zoujiashan uranium ore stockpile at the Xiangshan uranium hydrometallurgical plant. The ore samples were crushed to −50 mm using a jaw crusher (PEX-100×125; Wuhan Prospecting Machinery Factory, Wuhan, China) and homogenized via repeated coning blending for subsequent research.

2.2. Methods

2.2.1. Mineralogy Analysis

Major non-uranium elements were analyzed by X-ray fluorescence (XRF, PANalytical Axios mAX PW4400/40, Malvern Panalytical, Almelo, Netherlands) quantitative spectrometry. Trace uranium content was determined by inductively coupled plasma mass spectrometry (ICP-MS, Agilent 7700X, Agilent Technologies, Santa Clara, CA, USA), with a relative analytical error of ±5%. Bulk uranium grades were obtained via the chemical titration method (EJ/T 267.3-1984), with a relative analytical error of ±3%.
The uranium speciation was determined via the Tessier sequential chemical extraction procedure. Exchangeable uranium was leached by oscillating samples in 1 mol·L−1 magnesium chloride solution (pH 7) in an air-bath shaker at 25 °C for 3 h. For carbonate- associated uranium, 1 mol·L−1 sodium acetate solution (pH 5, adjusted with acetic acid) was used under identical shaking and temperature conditions for 6 h. Residual uranium hosted in mineral lattices was released via microwave digestion using a mixed-acid system of aqua regia and hydrofluoric acid.
The mineral morphology and mineral phase compositions were characterized using a TIMA3-LMH automated mineral analyzer (TESCAN, Brno, Czech Republic).
The spatial morphology, internal structure, and particle size of the uranium minerals in the ore were characterized by 3D X-ray micro-CT. Measurements were performed on a Diondo d2 high-resolution 300 kV microfocus industrial CT scanner (diondo GmbH, Hattingen, Germany). Three-dimensional reconstruction and visualization were completed via the VG Studio MAX 3.4 software. The main operating parameters for CT were as follows: focus-to-object distance (FOD) = 24 mm, standard cone-beam CT scanning mode, 1795 projection images acquired, a reconstruction matrix of 4000 × 4000, and a voxel size of 0.003 mm.
The microstructural morphology and micro-area elemental distribution of the ore were characterized using a ZEISS Sigma 300 scanning electron microscope (ZEISS Sigma, Oberkochen, Germany) equipped with an energy-dispersive spectrometer.

2.2.2. Experimental Methods

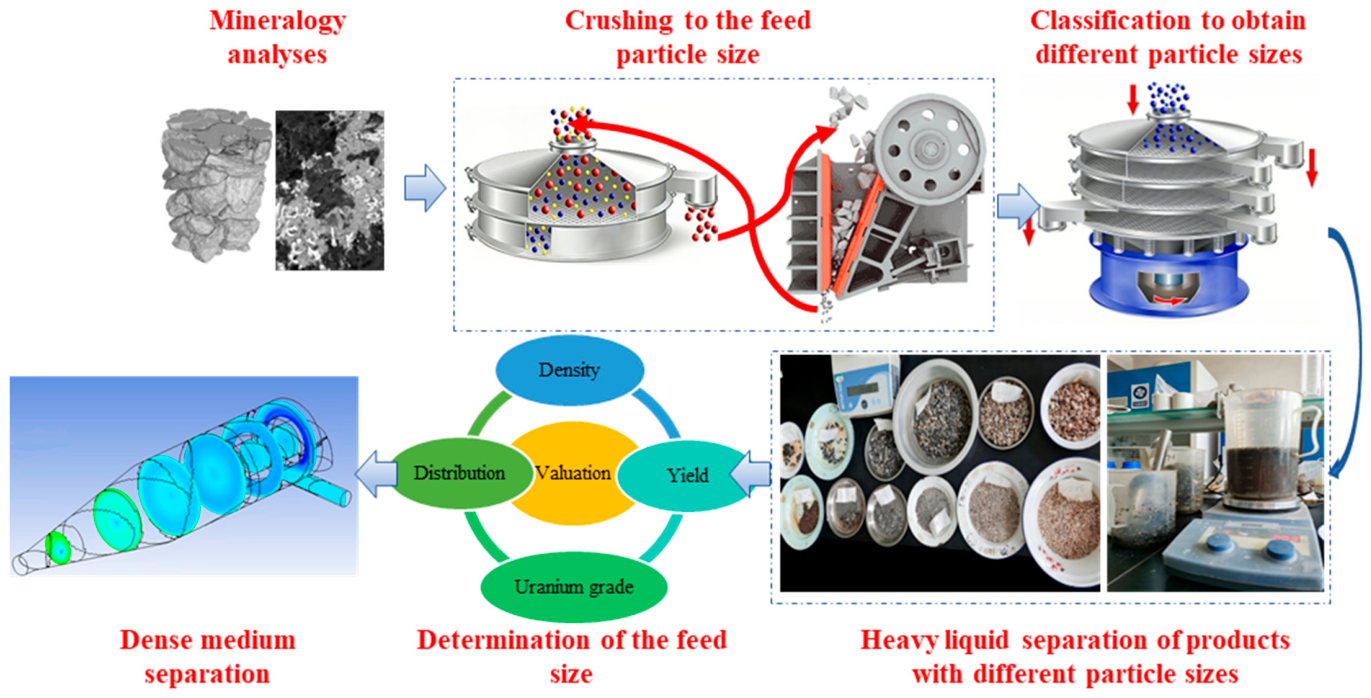
The research technical flowchart is illustrated in Figure 1. The ore was processed by pre-screening, crushing, and check screening to prepare feed materials with three target particle sizes (−50 mm, −20 mm, and −5 mm). For each size, the sample was homogenized by repeated coning blending. The minimum required sample mass Q (kg) for the different sizes was calculated by the empirical formula Q = KD2, where D refers to the maximum particle size (mm) of crushed ore, and coefficient K was set to 0.1 throughout the test. Accordingly, 250 kg of −50 mm ore, 40 kg of −20 mm ore, and 5 kg of −5 mm ore were prepared for heavy liquid separation experiments. Each sample was further sieved into several size fractions, whose density characteristics were measured using heavy liquid tests. A series of heavy liquids with gradient densities were formulated with sodium polytungstate. Separation experiments were carried out in 2 L plastic beakers. Low-density floating fractions were skimmed off with a steel wire mesh. The heavy liquid density was adjusted stepwise from high to low, and floating products were collected successively to obtain products with different density intervals. Subsequently, all products, grouped by size and density, were weighed and analyzed for their uranium grades, and the uranium distribution ratio was calculated. Trace uranium grades in low-density products were analyzed by ICP-MS, while bulk uranium grades in high-density products were determined by chemical titration analysis. According to the correlations between the particle density, uranium grade, and uranium distribution ratio, the optimal feed size was determined.
On this basis, DMC separation experiments were performed to compare size-by-size beneficiation and mixed-size beneficiation for different particle size fractions and further determine the optimal separation flowsheet. The dense medium suspension was prepared using ferrosilicon powder with a density of 6.9 × 10³ kg·m−3 and a particle size of −0.045 mm. Ferrosilicon powder was mixed with water to reach a preset density. Water was first added into the dense medium mixing tank. The separation pump was then started and ferrosilicon medium was added gradually. A digital densitometer was used to monitor the apparent suspension density, and the pump feeding pressure was controlled by a frequency converter. Subsequently, 2–4 kg of prepared ore sample was fed into the tank. Low-density and high-density products were separately collected from the cyclone overflow and underflow using 0.5 mm aperture sieves.
Both heavy liquid separation and DMC separation tests were conducted in triplicate independent replicates. All test samples were split from the same batch of crushed ore via coning and quartering to ensure sample representativeness.

2.2.3. CFD Simulation Calculation

CFD simulations were carried out based on the Eulerian–Eulerian multiphase model on the ANSYS-Fluent platform to investigate the motion and separation behavior of 8 mm ore particles inside the DMC. A systematic analysis was performed on the concentration distribution, velocity distribution, and overflow-to-underflow flow rate ratio for four particle groups with small density disparities. Particle densities varied from 2528 kg·m−3 to 2745 kg·m−3, and the maximum density gap was below 10%. The inlet volume concentration was kept at 1.64%–1.84%.
The geometric parameters of the cyclone computational model were consistent with the experimental prototype. The cyclone body diameter was 250 mm. The heights of the cylindrical and conical sections were 640 mm and 570 mm, respectively. The feed inlet diameter was 50 mm, the underflow outlet diameter was 60 mm, the overflow outlet diameter was 100 mm, and the overflow insertion depth was 300 mm. The cyclone was vertically configured. The computational domain consisted of around 724,000 hexahedral cells, with mesh refinement applied in regions with sharp flow gradients. The realizable k-ε turbulence model with swirl correction was selected to characterize the intense swirling flow field. Particles were set as spherical bodies, and the Schiller–Naumann drag model was employed to calculate the interphase slip velocity. The dense medium was ferrosilicon powder (7000 kg·m−3, 20 μm), and the continuous aqueous phase was room-temperature water at 20 °C (998.2 kg·m−3, dynamic viscosity of 1.003 × 10⁻³ kg·m−1·s−1).

3. Mineralogical Characteristics

3.1. Chemical Composition

The ore sample was ground to −0.074 mm for quantitative XRF analysis and chemical titration. The multi-element analysis results are presented in Table 1. As shown in Table 1, the predominant valuable component of the Zoujiashan ore is uranium, with a grade of only 0.202%. Trace associated valuable elements are also present, including rare earth elements, molybdenum, and tungsten.

3.2. Phase Identification of Uranium

The occurrence state of uranium is presented in Table 2. Uranium partitioning is expressed on a mass percentage basis. Uranium hosted in independent uranium minerals accounts for 65.87%, whereas the remaining 34.13% of the total uranium exists as dispersed ionic species. This occurrence characteristic hinders the recovery efficiency of conventional beneficiation processes targeting uranium mineral particles.

3.3. Mineral Composition

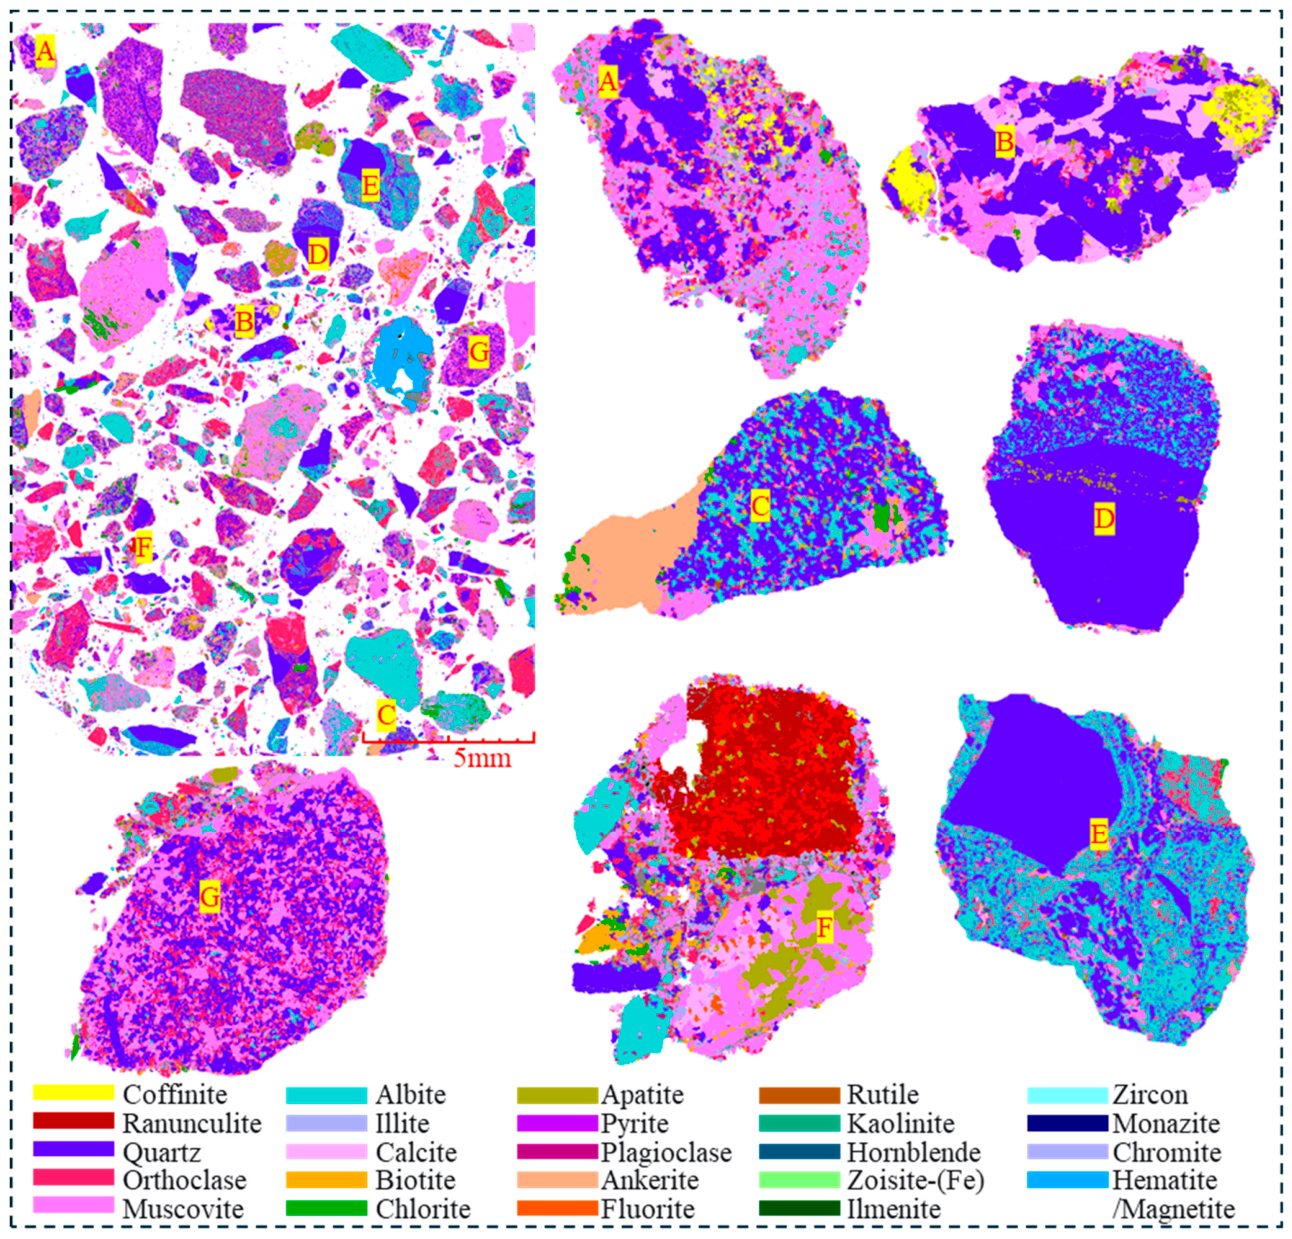
Mineral species and their mass fractions in the ore were quantified using a TIMA3-LMH automated mineral analyzer. The results are listed in Table 3, and the corresponding mineral mapping images are shown in Figure 2.
As shown in Table 3, the total content of uranium minerals is 0.36%. The main gangue minerals are quartz and feldspar, accounting for 25.38% and 36.03%, respectively. Several minerals undergo argillic alteration, represented by clay minerals including illite, kaolinite, and chlorite.
As shown in Figure 2, uranium-bearing minerals (yellow) in particle A are closely associated with illite and exhibit intimate intergrowth. In particle B, uranium minerals interlock with apatite, muscovite, pyrite, and other minerals and are further enclosed by calcite, muscovite, and illite, indicating complex textural association. In particle C, uranium occurs as ultrafine grains (<10 μm) finely disseminated in the particle, making complete mineral liberation difficult. For particles D and E, some quartz grains (bluish purple) are relatively clean and almost free of uranium mineral inclusions. However, apart from these coarse pure quartz grains, most minerals are finely disseminated and tightly interlocked with each other. The complex intergrowth of uranium minerals and gangue phases (e.g., illite, muscovite, calcite, pyrite) poses a great challenge to mineral liberation.
Thus, it is difficult to fully liberate uranium minerals into individual discrete particles for this ore. Moreover, most gangue minerals cannot be effectively liberated either, except for a small quantity of pure quartz grains. Therefore, a pre-concentration step is recommended to discard coarse tailings and selectively remove coarse pure quartz as well as low-grade barren rock. This strategy can effectively decrease the feed volume of subsequent grinding and leaching, cut down production costs, improve the uranium grade, and provide favorable conditions for subsequent uranium extraction.

3.4. Micro-CT Analysis

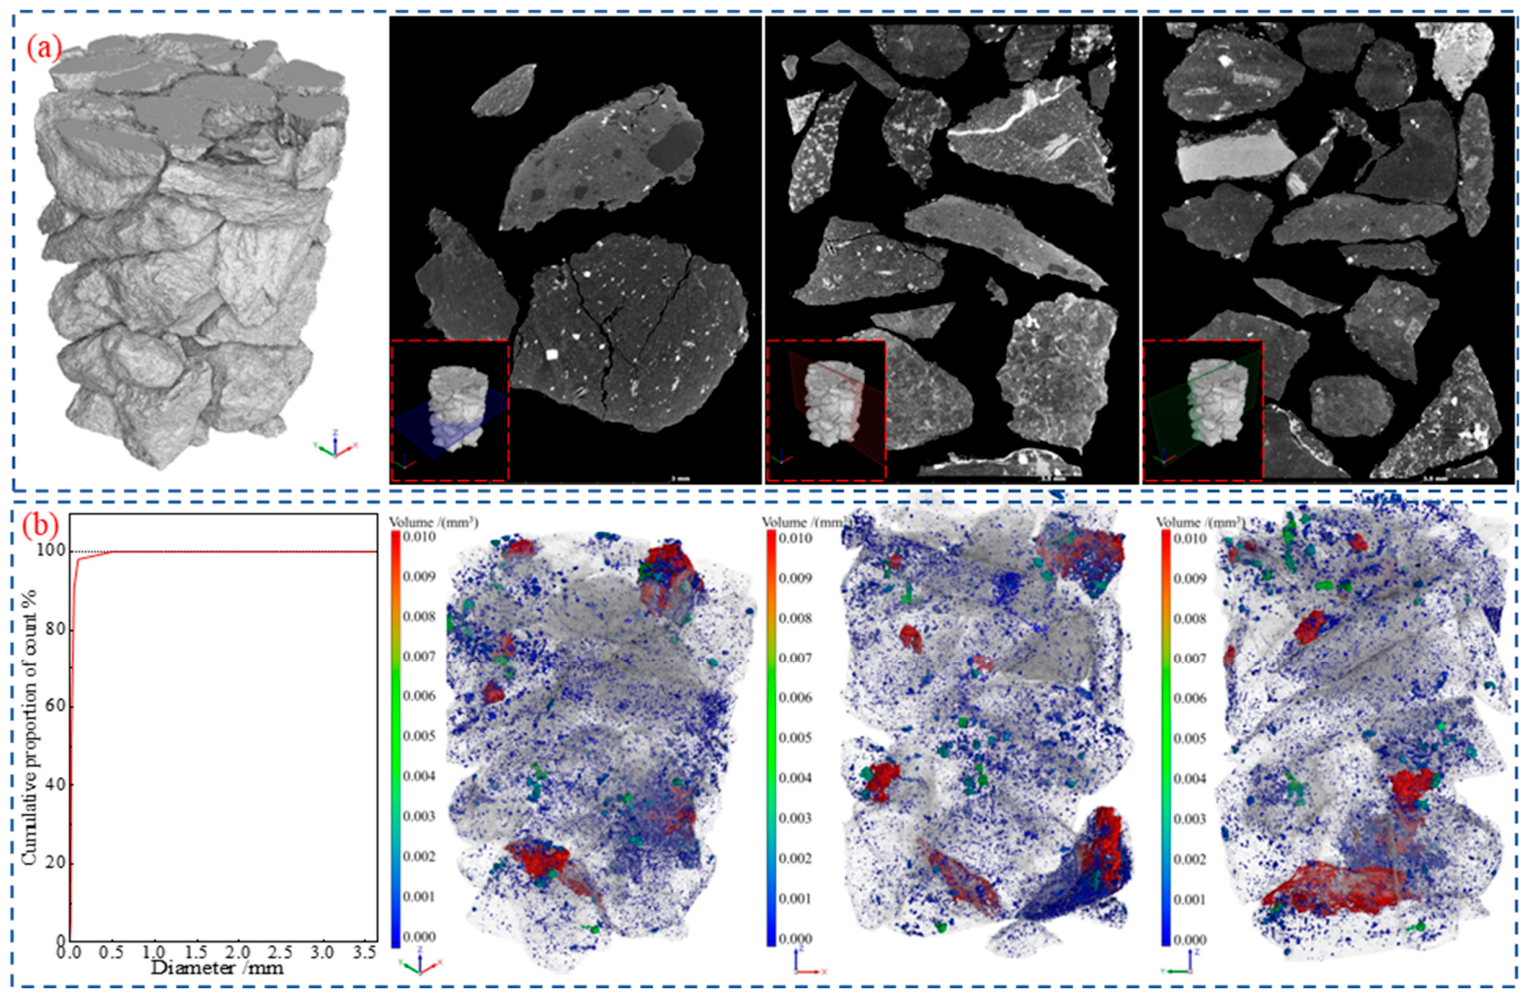
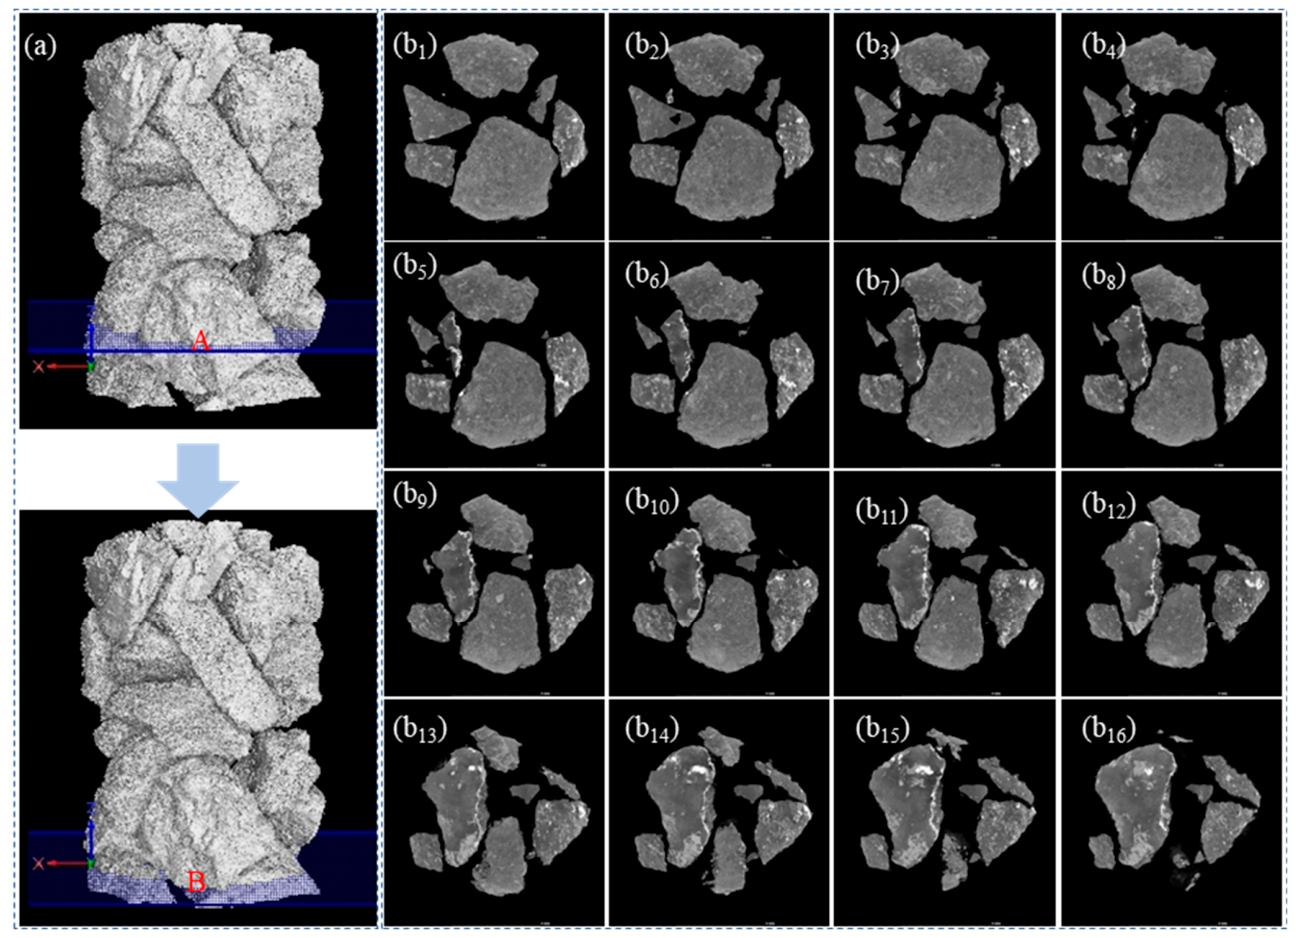
The 3D X-ray micro-CT technique possesses outstanding advantages, including non-destructiveness, a high resolution, and rapid imaging. This technique enables the visualization of the microscale 3D internal structures of ore samples [29]. X-ray CT non-destructive testing has been widely used in characterizing pore structures and rock minerals. Nevertheless, its application to uranium ore research remains rather limited. The CT analysis results are illustrated in Figure 3 and Figure 4.
In Figure 3a, the highlighted regions with grayscale values above 10,000 correspond to high-density mineral phases, including uranium and thorium minerals. The grayish white areas with grayscale values ranging from 6501 to 10,000 represent medium-density components, mainly fluorite, calcite, dolomite, chlorite, and mica. The dark gray regions with grayscale values ranging from 4501 to 6500 are low-density minerals, primarily quartz and feldspar. The particle size statistics of high-density minerals (Figure 3b) reveal that over 95% of the uranium mineral grains are finer than 0.045 mm, and over 90% are smaller than 0.024 mm.
In Figure 4a, a series of X-ray horizontal CT slices are sequentially shown from position A to position B. Figure 4(b1–b16) display consecutive horizontal CT sections of the ore. As observed from Figure 4(b2), fine uranium-bearing particles initially appear in the upper-left area of the sample. From Figure 4(b2) to Figure 4(b15), these particles gradually develop in size, and uranium minerals occur as uneven thin layers with variable thickness. The average thickness of these uranium-bearing layers is 25 μm, which makes complete liberation extremely difficult during grinding. Consequently, uranium loss tends to take place in subsequent beneficiation processes.

3.5. Microstructure

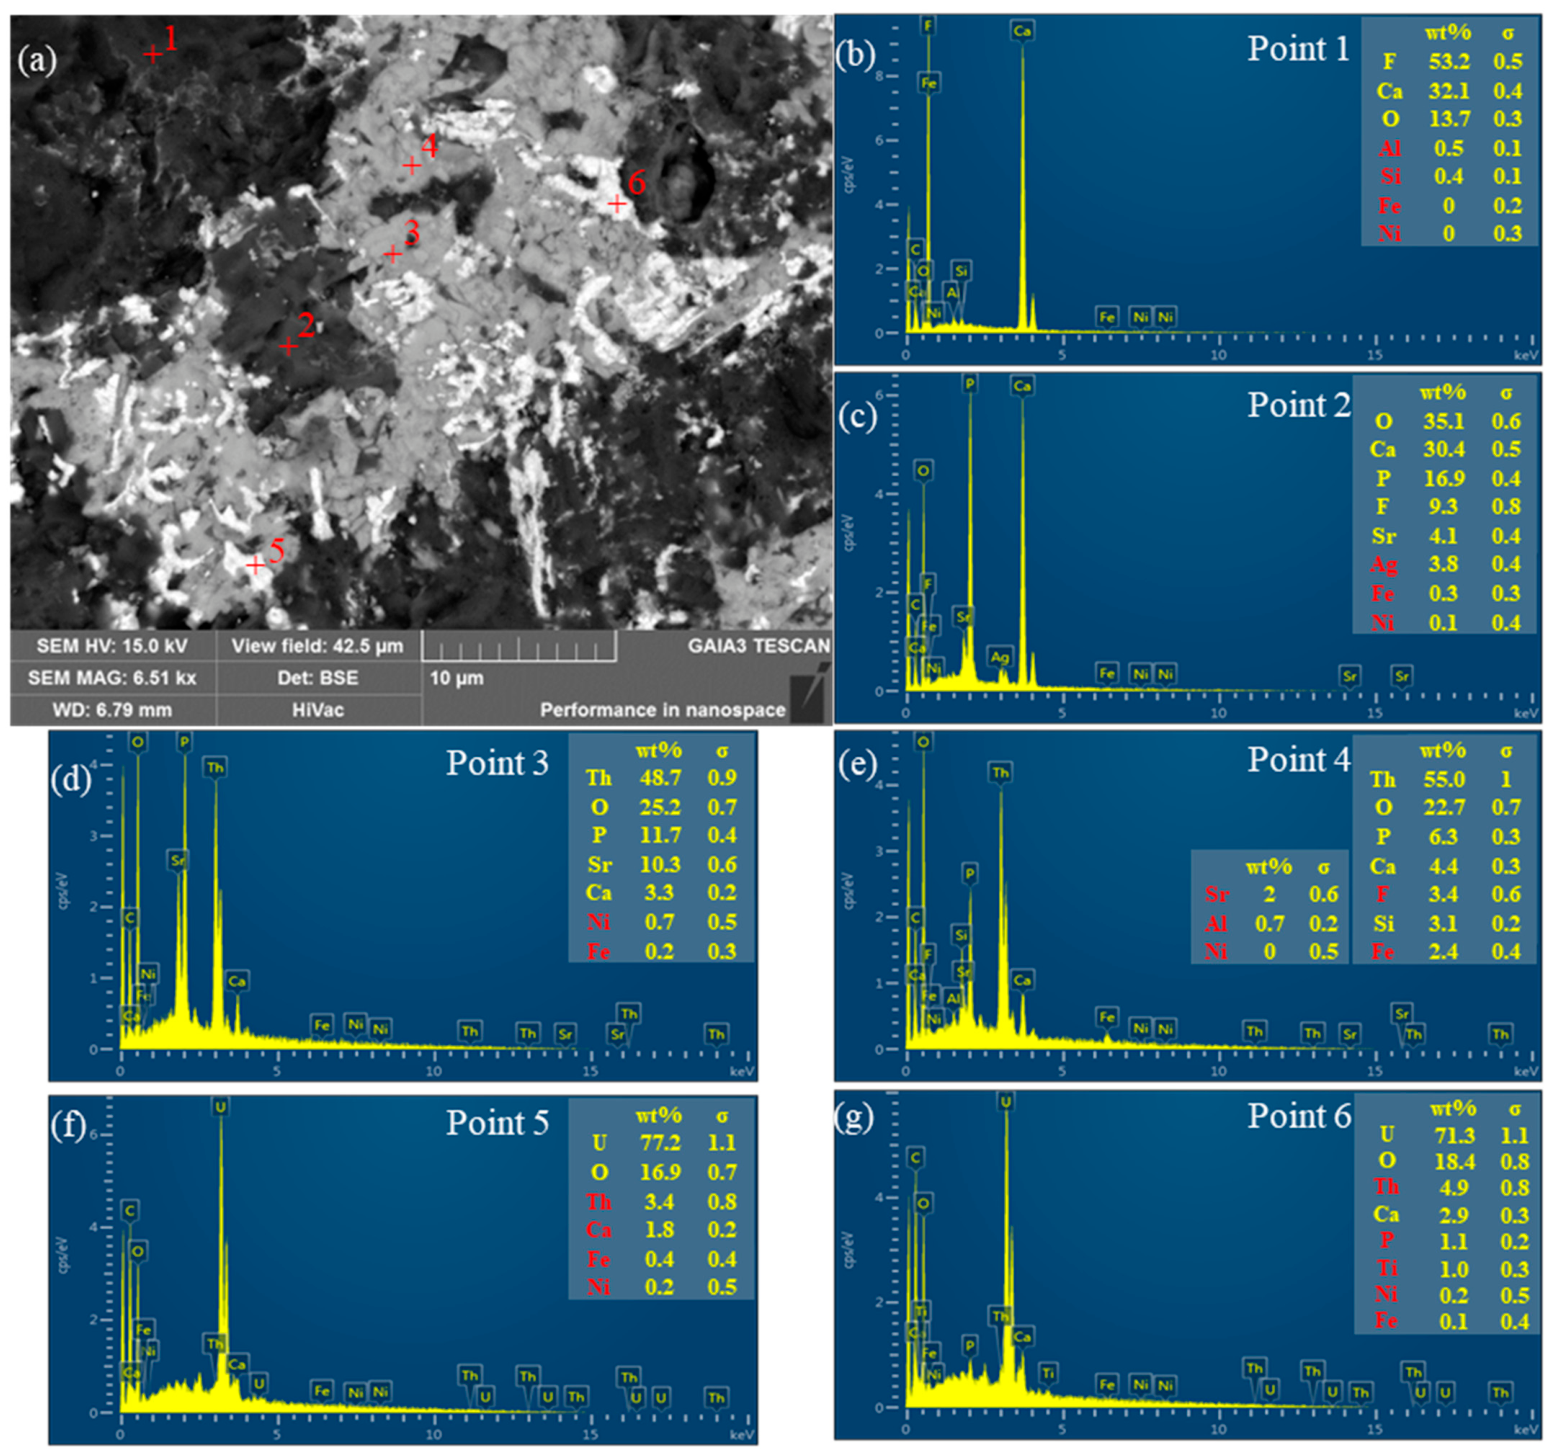
SEM-EDS analyses were conducted to further clarify the intergrowth and dissemination characteristics of the main minerals. The results are presented in Figure 5.
As shown in Figure 5a, points 1 and 2 are located in the dark gray area. The EDS spectra in Figure 5b,c demonstrate that the dominant elements consist of oxygen, fluorine, calcium, and phosphorus. Combined with mineralogical characterization, the dark gray minerals are non-metallic phases, primarily fluorapatite and fluorite. Points 3 and 4 are distributed in the light gray regions, and the corresponding EDS analyses (Figure 5d,e) reveal that the primary elements are thorium, oxygen, phosphorus, strontium, and calcium. Based on mineralogical analysis, the light gray phases are identified as radioactive thorium apatite. The bright white areas (points 5 and 6) are mainly composed of uranium, oxygen, and thorium (Figure 5f,g), which are identified as uraninite. In the ore sample, uraninite predominantly exhibits fern-like and moss-like morphologies, featuring irregular shapes, fine dendritic branches, and complex bifurcations. Its size is generally less than 5 μm. Fine particles below 10 μm are typical refractory components in mineral processing. Conventional grinding cannot achieve adequate liberation of such finely disseminated uraninite particles.

4. Pre-Concentration for DMC Separation

4.1. Density Analysis by Heavy Liquid Separation

Based on the mineralogical analysis, the beneficiation of the Zoujiashan uranium ore cannot rely on the recovery of fully liberated uranium mineral particles. Instead, it is more feasible to separate uranium-rich particles from uranium-free particles at coarse particle sizes to realize pre-concentration. The DMC separation process is highly suitable for coarse particle separation. The technical indicators obtained from heavy liquid separation can be regarded as the theoretical indices for gravity separation. Accordingly, the effects of the feed particle sizes on the gravity separation performance of the ore were systematically investigated. The ore was crushed into three different feed particle sizes, namely 50 mm, 20 mm, and 5 mm. The ore samples with different feed particle sizes were then classified into multiple narrow size fractions to clarify the density distribution characteristics for each fraction.
To illustrate the distribution characteristics of each fraction, Table 4 presents the complete classification data, detailing the yield and uranium grade for each narrow size fraction across the three feed sizes (50 mm, 20 mm, and 5 mm). Notably, the sieve analysis results of the ore indicated that the uranium grade increased as the particle size decreased, and the finest fraction had the highest uranium grade. Thus, all of the finest size fractions obtained under different feed sizes were collected as concentrate.

4.1.1. Heavy Liquid Separation at a Feed Particle Size of −50 mm

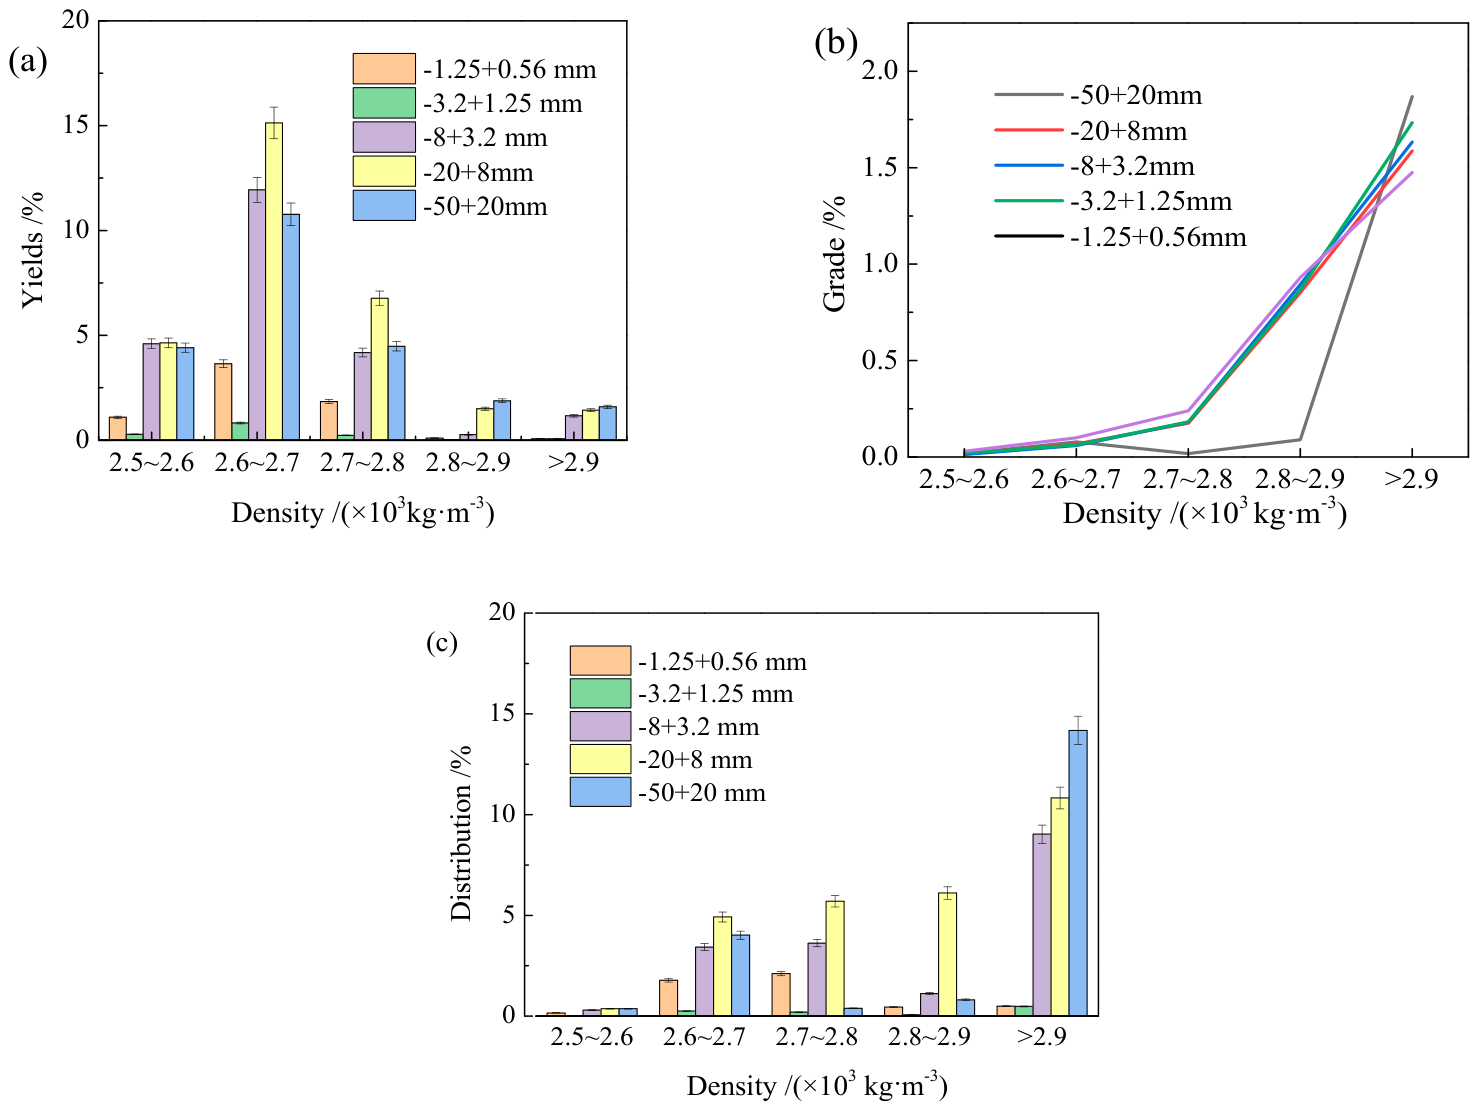
The ore crushed to −50 mm was sieved into six size fractions, namely −50 + 20 mm, −20 + 8 mm, −8 + 3.2 mm, −3.2 + 1.25 mm, −1.25 + 0.56 mm, and −0.56 mm. The −0.56 mm fine slime was directly collected as uranium concentrate. For the coarse −50 + 20 mm fraction, the mass and density of individual ore particles were measured using a density balance. For the intermediate −20 + 0.56 mm size fractions, heavy liquid separation was performed using sodium polytungstate solutions with different densities to obtain a series of products with various density levels. The density interval for testing was set at 0.1 × 10³ kg·m−3. All separated products were subsequently ground and analyzed for their uranium grades. The results of the heavy liquid separation are shown in Figure 6.
Figure 6b shows that the uranium grade exhibits a positive correlation with the density for all tested size fractions. However, for the coarse −50 + 20 mm fraction, the grade–density correlation is poor at low densities. The reason is that low-grade uranium minerals exert a negligible effect on the density of large particles, resulting in an obscure relationship between the density and grade within the low-density region. As illustrated in Figure 6a, for the five fractions of −50 + 20 mm, −20 + 8 mm, −8 + 3.2 mm, −3.2 + 1.25 mm, and −1.25 + 0.56 mm, the yields of material with a density below 2.6 × 10³ kg·m−3 are 4.41%, 4.64%, 4.60%, 0.28%, and 1.09%, respectively. The corresponding uranium distribution rates shown in Figure 6c are 0.37%, 0.37%, 0.30%, 0.03%, and 0.16%, respectively. When the ore is crushed to −50 mm, the cumulative yield of the +0.56 mm fractions with a density of less than 2.6 × 10³ kg·m−3 is 15.02%, with an average uranium grade of 0.012%. In addition, light fractions grading below the cut-off grade of industrial leaching residues (0.03%) can be separated from all size fractions at a separating density below 2.6 × 10³ kg·m−3. Accordingly, 2.6 × 10³ kg·m−3 was defined as the critical separation density for subsequent tests.

4.1.2. Heavy Liquid Separation at a Feed Particle Size of −20 mm

Heavy liquid separation tests were then carried out on the ore crushed to −20 mm. The −20 mm ore was screened into five size fractions, namely −20 + 8 mm, −8 + 3.2 mm, −3.2 + 1.25 mm, −1.25 + 0.56 mm, and −0.56 mm. Among these fractions, the −0.56 mm fine slime was directly taken as a concentrate, while the other four size fractions were subjected to heavy liquid separation. The detailed results are presented in Figure 7.
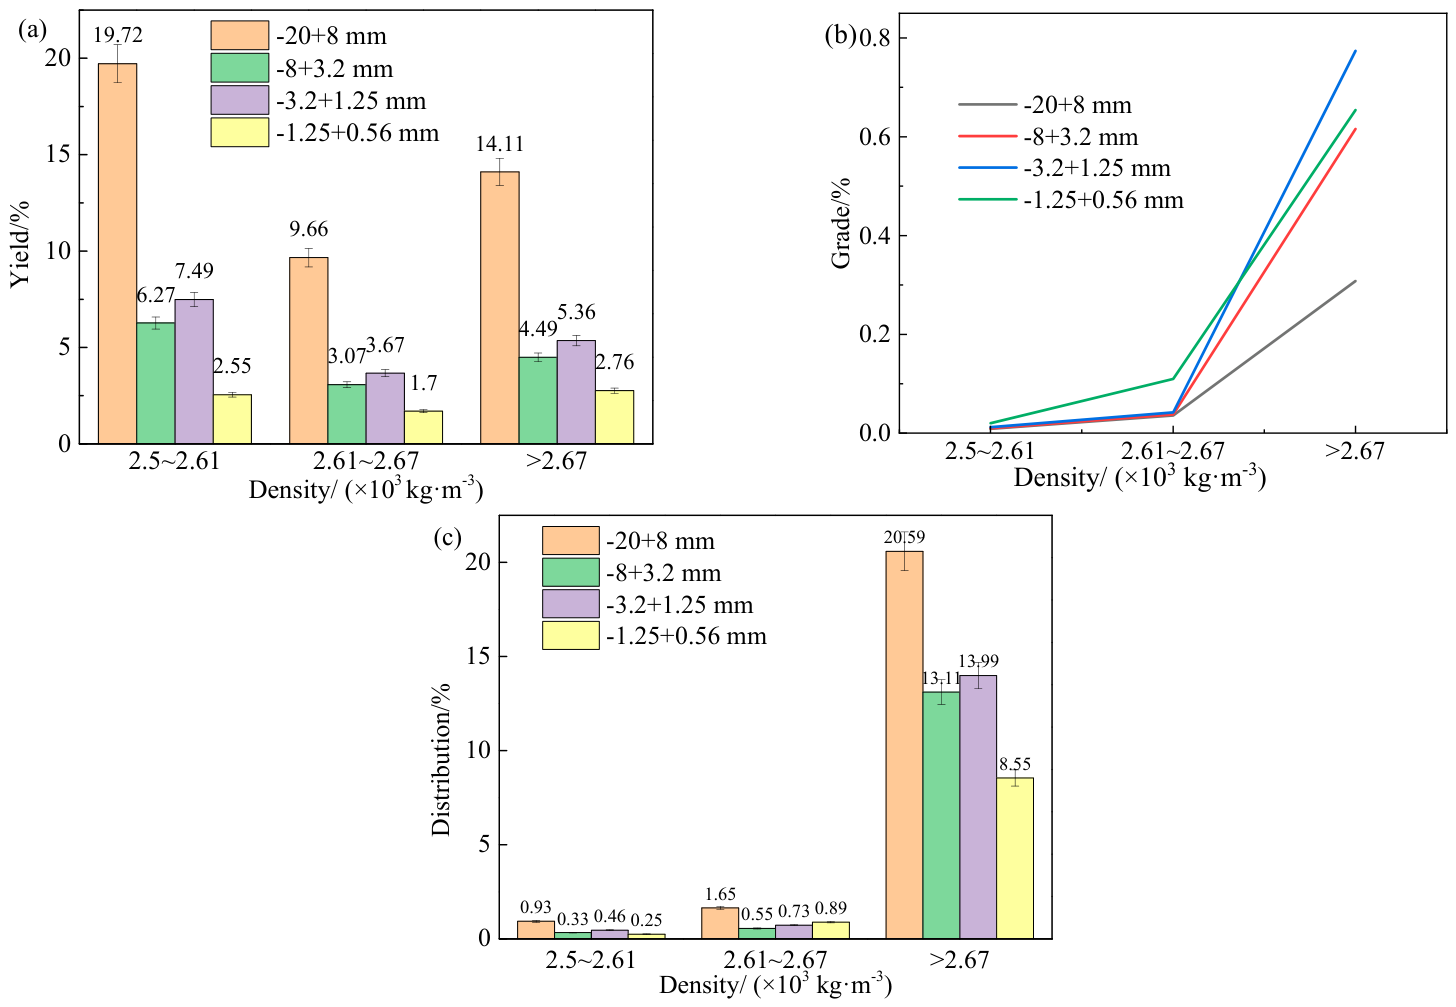
As shown in Figure 7a, for the four size fractions −20 + 8 mm, −8 + 3.2 mm, −3.2 + 1.25 mm, and −1.25 + 0.56 mm, the yields of low-density products (density < 2.61 × 10³ kg·m−3) are 19.72%, 6.27%, 7.49%, and 2.55%, respectively. The corresponding uranium grades are 0.009%, 0.010%, 0.012%, and 0.020% (Figure 7b), with uranium distribution ratios of 0.93%, 0.33%, 0.46%, and 0.25%, respectively (Figure 7c). For the combined +0.56 mm fractions, the low-density tailings (<2.61 × 10³ kg·m−3) have an average uranium grade of 0.011%, with uranium loss of 1.97%. Accordingly, the maximum theoretical tailings rejection rate reaches 36.03%.

4.1.3. Heavy Liquid Separation at a Feed Particle Size of −5 mm

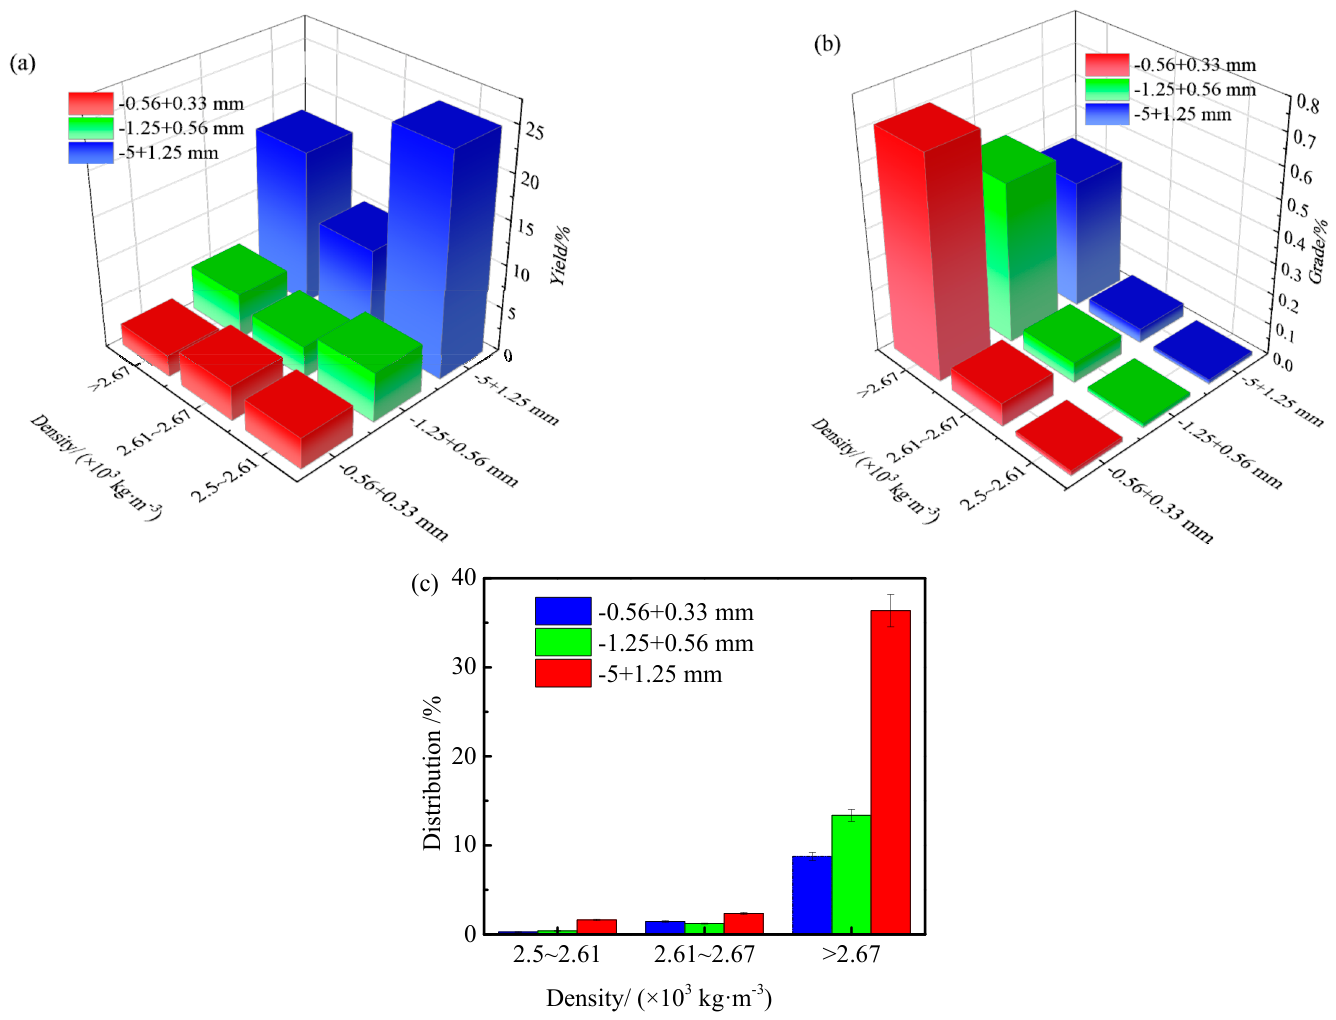
The ore was crushed to −5 mm and screened into four size fractions: −5 + 1.25 mm, −1.25 + 0.56 mm, −0.56 + 0.33 mm, and −0.33 mm. The −0.33 mm fine slimes were directly taken as concentrate, whereas the other three coarser fractions underwent heavy liquid separation. The corresponding experimental results are presented in Figure 8.
As shown in Figure 8, the mass yields of low-density products (<2.61 × 10³ kg·m−3) for the −5 + 1.25 mm, −1.25 + 0.56 mm, and −0.56 + 0.33 mm fractions are 25.03%, 5.59%, and 3.49%, respectively. Their corresponding uranium grades are 0.013%, 0.014%, and 0.015%, with uranium distribution ratios of 1.61%, 0.39%, and 0.27%. For the combined +0.56 mm fractions, low-density tailings (<2.61 × 10³ kg·m−3) have an average uranium grade of 0.013% and a total uranium loss of 2.00% in the discarded tailings, with a theoretical tailings rejection rate of 30.62%.
A comprehensive comparison was performed on the heavy liquid separation data for various feed sizes. Among all tested feed sizes, low-density tailings (<2.61 × 10³ kg·m−3) from −20 mm crushed ore deliver the optimal separation performance, featuring the highest discard yield and the lowest uranium grade.

4.2. DMC Separation

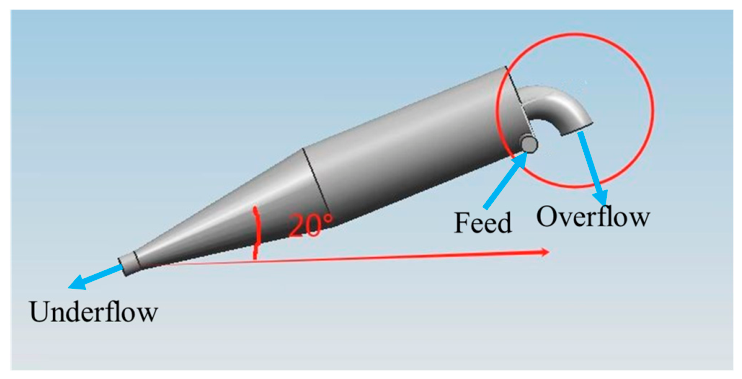
Heavy liquids are generally expensive and therefore unsuitable for large-scale industrial ore separation. In industrial production, solid media such as ferrosilicon powder [19] are blended with water to replicate the separation performance of heavy liquids. Moreover, the high-speed centrifugal force generated inside a hydrocyclone helps to improve the separation efficiency. The raw ore was crushed to −20 mm before classification and subsequent DMC separation tests. The crushed feed was sieved into three narrow size fractions: −20 + 8 mm, −8 + 3.2 mm, and −3.2 + 1.25 mm. Size-by-size beneficiation and mixed-size beneficiation (where individual fractions were blended in accordance with their natural mass proportions in the run-of-mine ore) were both performed for comparative analysis. In the size-by-size beneficiation, the tailings yield of each particle fraction was calibrated with the low-density product yields determined via heavy liquid separation. The suspension density of the dense medium was then modified to adjust the resultant tailings yields. To minimize the interference caused by particle size variation within each size fraction, the cyclone was installed at an inclination, with its central axis tilted 20° from the horizontal plane (Figure 9). The apparent density of the prepared dense medium suspension was controlled between 1.85 × 10³ and 2.05 × 10³ kg·m−3, and the feed pressure was maintained at 0.13 MPa.
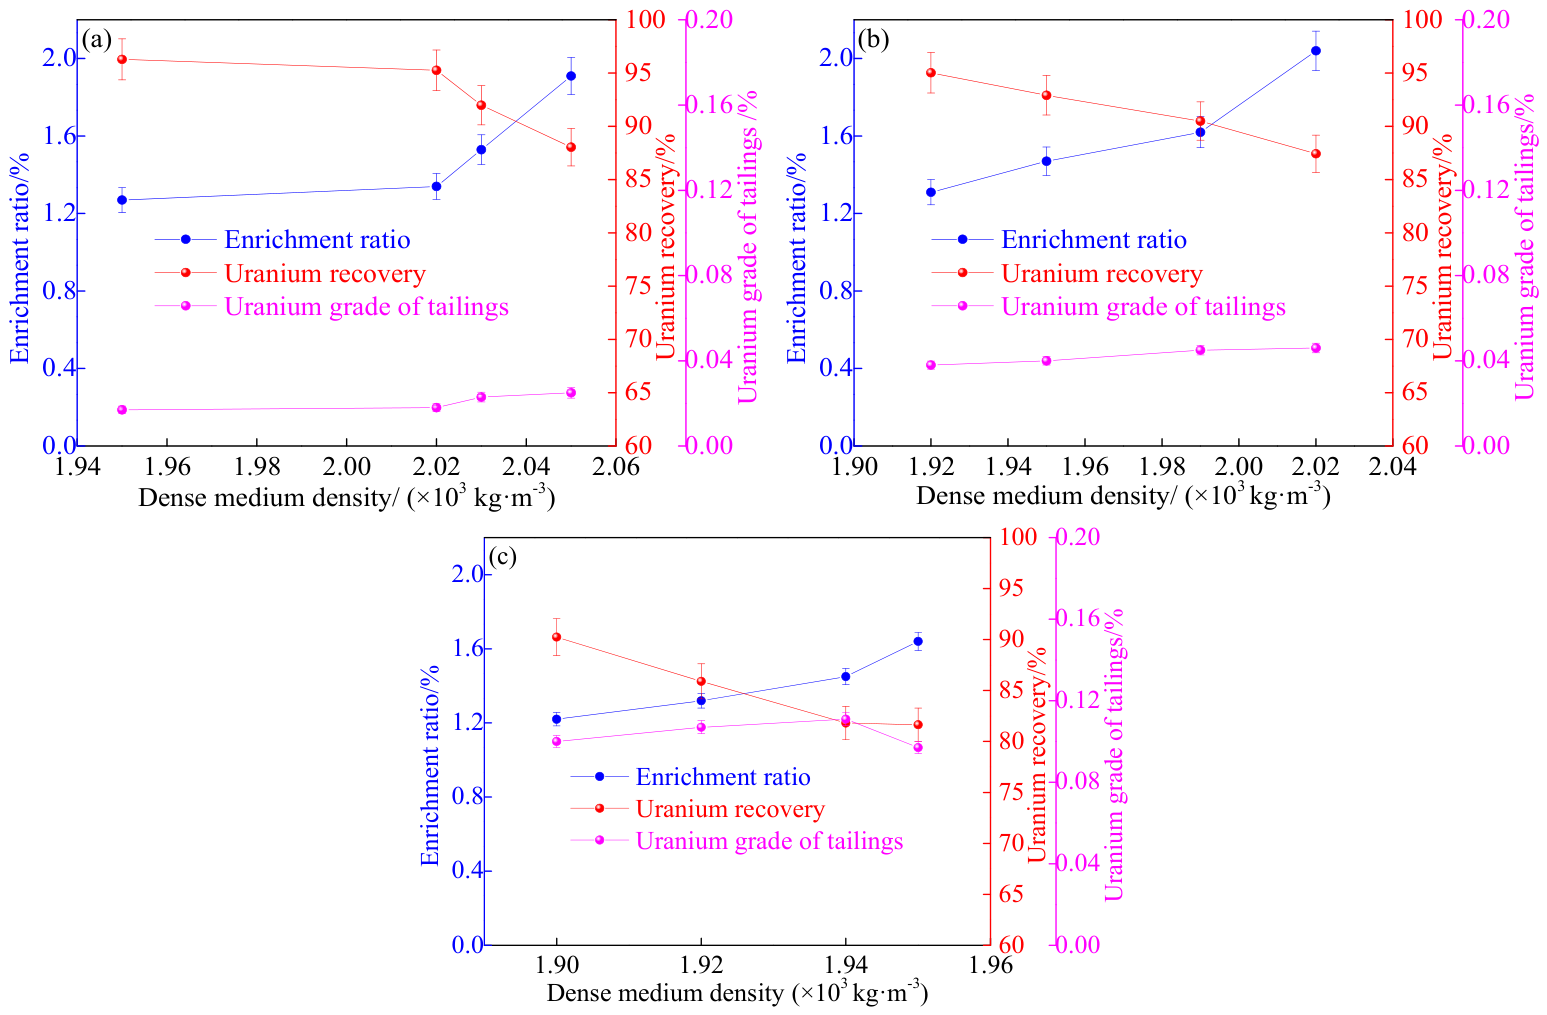
The separation results of size-by-size beneficiation for each fraction are presented in Figure 10. As illustrated in Figure 10, the dense medium separation of all classified fractions presents a consistent variation trend: the concentrate uranium grade increases with rising suspension densities, whereas the uranium recovery of the concentrate declines correspondingly. Meanwhile, the tailings uranium grade increases as the feed size fraction decreases. The coarse −20 + 8 mm fraction exhibits the optimal separation performance. At the dense medium density of 2.05 × 10³ kg·m−3, the recovery of concentrates is as high as 88.05%. The corresponding tailings uranium grade and uranium loss are only 0.025% and 11.95%. By contrast, the −3.2 + 1.25 mm fine fraction yields comparatively high tailings uranium grades ranging from 0.097% to 0.107%. To address the poor separation performance of the DMC for the −3.2 + 1.25 mm fine particles, a dedicated small-diameter DMC can be used. Its smaller diameter generates a higher centrifugal force so as to achieve the further recovery of uranium resources and minimize uranium losses in this size fraction.
Additionally, comparative tests were conducted to investigate DMC separation in mixed-size beneficiation. At the dense medium suspension density of 1.95 × 10³ kg·m−3, the minimum yield and uranium grade of the tailings were both obtained. The detailed test results are presented in Table 5 and Table 6.
Table 5 indicates that, during the mixed-size beneficiation of different size fractions, the tailings grade remains high even at relatively low tailings yields, inhibiting effective tailings rejection. Table 6 shows that, under the multi-size-fraction combined feed condition, the proportion of fine −3.2 + 1.25 mm fractions in the tailings (low-density product) is 39.53%, which is considerably higher than the corresponding proportion in the feed (22.38%). This suggests that fine-sized particles are preferentially lost into the tailings relative to coarse particles. In contrast, the coarse particles (−20 + 8 mm) account for 66.18% of the concentrates (high-density product) exceeding 58.89% (feed proportion), indicating that coarse particles are preferentially accumulated within the concentrates.
Therefore, the particle size exerts a significant influence on the separation performance, which verifies the necessity of size-by-size beneficiation. From the sieve analysis of the tailings, coarse fractions have lower grades than fine fractions in the dense medium separation tailings. Consequently, dense medium separation is recommended to be conducted on feeds with a similar size to eliminate the adverse effects caused by particle size variation.

4.3. Mechanism

To reveal the controlling mechanism of the particle density and size on the separation behavior inside the DMC, a series of CFD simulations were performed to investigate the particle motion characteristics across particle diameters of 20 mm, 10 mm, 8 mm, 5 mm, and 1.25 mm, where particles with various densities were modeled. DMC tests via size classification followed by size-by-size beneficiation verified the optimal separation efficiencies of the −20 + 8 mm and −8 + 3.2 mm fractions. Therefore, the simulation results for the 8 mm particle size were selected to elaborate on the particle enrichment mechanism. However, note that the CFD results are mainly used as mechanistic support rather than as direct quantitative validation of the DMC experimental results.
Simulated particles were divided into four groups by density, with inlet volumetric concentrations ranging from 1.64% to 1.84%: Group 1 (density 2528 kg·m−3, volume concentration 1.67%), Group 2 (density 2583 kg·m−3, volume concentration 1.64%), Group 3 (density 2640 kg·m−3, volume concentration 1.79%), and Group 4 (density 2745 kg·m−3, volume concentration 1.84%). The relative density difference between Group 4 and Group 1 was 8.6%.

4.3.1. Control Effect of Particle Density on Separation Behavior Inside DMC

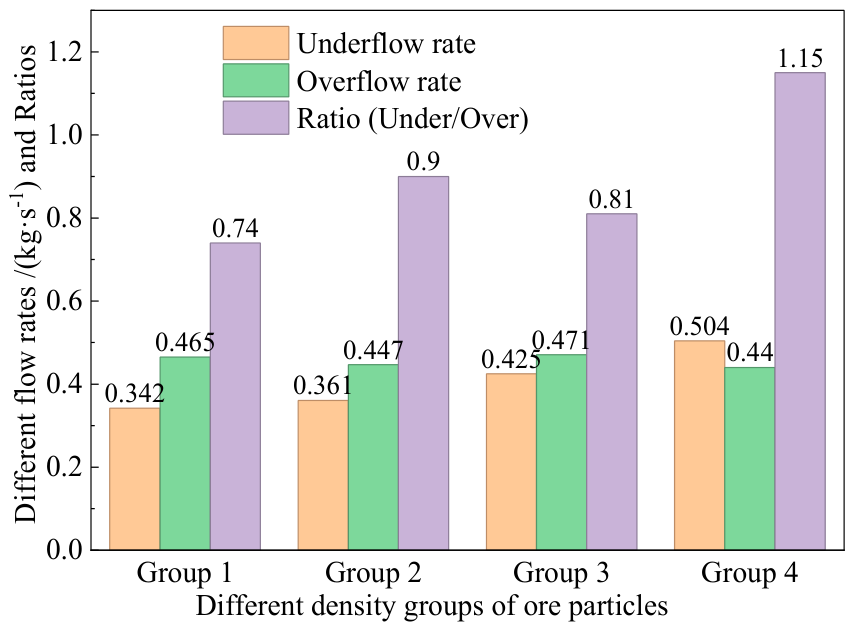
Figure 11 presents the flow rate distribution and the underflow-to-overflow flow ratios (R) of the four density particle groups with different densities. For Group 1, with the lowest density, the flow rate of 0.465 kg·s−1 at the overflow is higher than that of 0.342 kg·s−1 measured at the underflow. In contrast, Group 4, with the highest density, exhibits the opposite trend, with its underflow flow rate of 0.504 kg·s−1 exceeding its overflow flow rate of 0.440 kg·s−1.
Further analysis was conducted based on R. The critical density difference threshold required for effective DMC separation can be evaluated via the calculated R values of particles with various densities. For Group 1, the R value is 0.74 below 1.0, indicating that low-density particles tend to report to the overflow. For Group 4, the R value is 1.15, exceeding 1.0, suggesting that high-density particles are prone to enter the underflow. R values of 0.90 and 0.81 are acquired for Groups 2 and 3, respectively, falling between 0.74 and 1.15 and indicating a moderate distribution tendency between the overflow and underflow. The average R value (Raver) of the four groups is 0.90, and the maximum difference (Rdiff) is 0.41.
These results indicate that, at the fixed particle size of 8 mm, particles with different densities already show a clear separation tendency. This trend is consistent with the DMC test results. This further demonstrates that the density serves as a dominant factor affecting the particle separation behavior within the DMC.

4.3.2. Density Dependence of the Particle Velocity Field

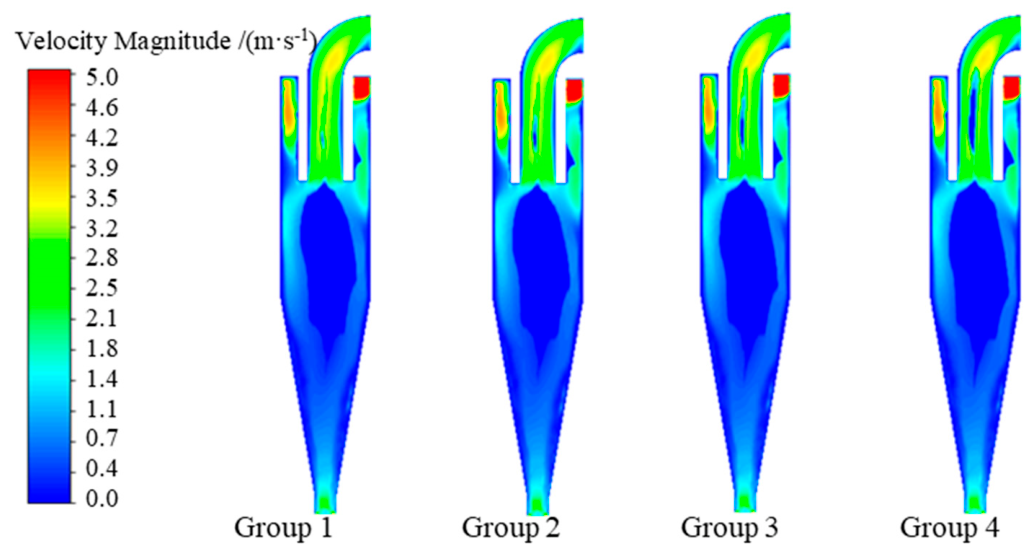
The particle velocity distribution further reveals how the density affects particle motion within the DMC. As shown in Figure 12, significant differences in velocity distribution are observed among the four particle groups at the vertical mid-section of the cyclone. In general, higher-density particles exhibit lower upward velocities and greater downward velocities, which stems from the difference in the absolute weight of individual particles. Specifically, high-density particles possess larger inertial forces, facilitating their migration toward the cyclone wall under centrifugal action and subsequent downward movement along the wall. In contrast, low-density particles are easily entrained upward by the inner vortex flow. In the underflow region, spatial contraction enhances interphase coupling, meaning that the particle velocities of different density groups tend to converge. Conversely, the main cyclone body exhibits a prominent interphase slip effect, resulting in obvious differences in velocity distributions between the particle and liquid phases.

4.3.3. Volume Distribution and Separation Paths

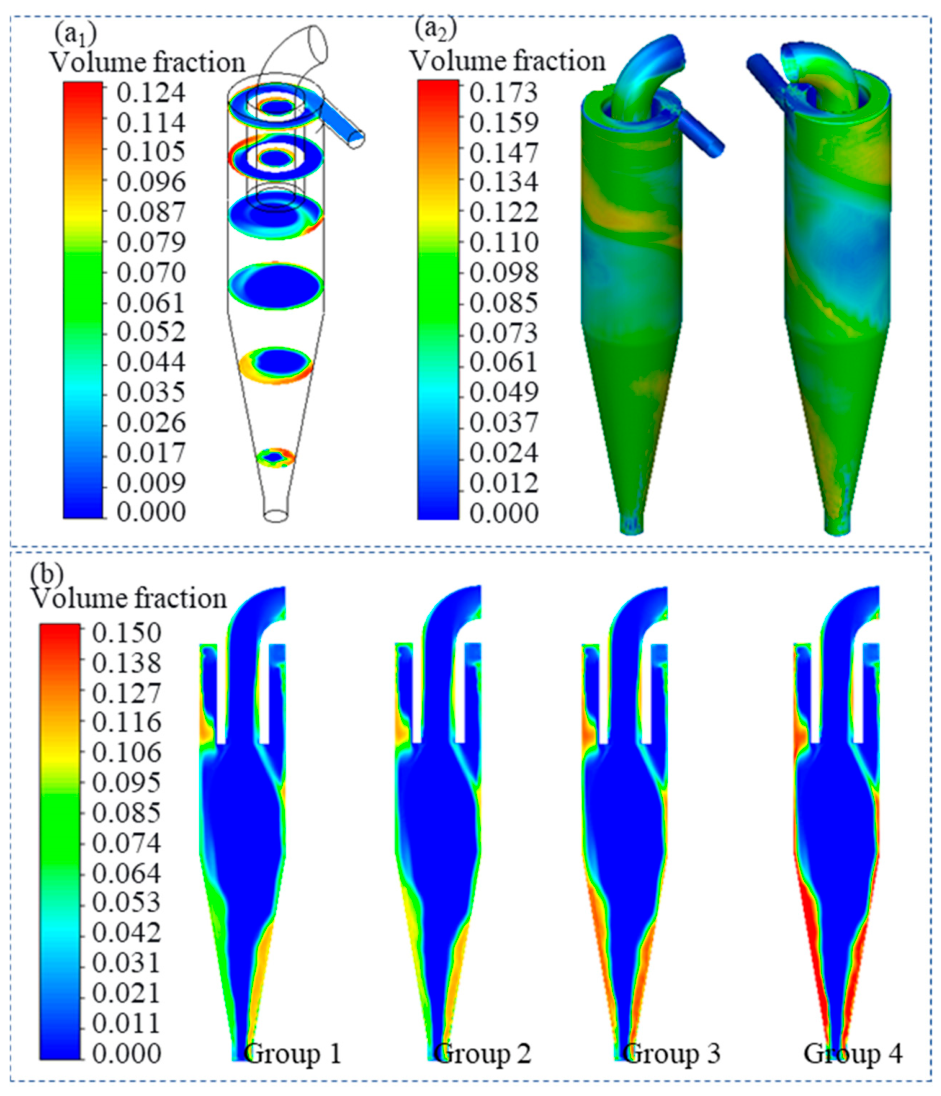
Figure 13 illustrates the volume distribution characteristics of particles with four different densities on the cyclone wall. As shown in Figure 13(a1,a2), the simulation results indicate that, after entering the cylindrical section, particles gradually migrate toward the cyclone wall under centrifugal force. The maximum particle concentration appears within a narrow, diagonally distributed zone on the side opposite the inlet. As particles move downward along the cylindrical section, part of the particle flow enters into the overflow pipe, forming a broad low-concentration band on the wall directly below the inlet. The remaining particles keep moving downward through the conical section and finally accumulate near the underflow outlet. The decreasing circumference of the conical section increases the thickness of the particle layer on the wall. A comparison of the wall concentration across the four groups (Figure 13b) shows that Groups 3 and 4 exhibit much higher particle concentrations on the cyclone wall than Groups 1 and 2. This finding further illustrates that high-density particles preferentially migrate to and accumulate on the wall region, which conforms to the basic separation principle of the DMC method.

4.3.4. Disruptive Effect of Particle Size on Separation

The above analysis indicates that mono-sized feeding at 8 mm can produce obvious density-based separation effects (Rdiff = 0.41). However, industrial raw ores usually have a wide particle size distribution, which interferes with density-based separation. During DMC separation, ore particles moving in the rotating slurry are primarily subjected to four forces, namely the slurry drag force (Fd), slurry resistance (Fr), centrifugal force (Fc), and gravity–buoyancy force (Fg).
Among these forces, Fc plays a dominant role in the centrifugal field of the cyclone. The Fc acting on a single particle is proportional to the cube of its particle size. This means that, for particles with the same density, a twofold difference in particle size could lead to a nearly order-of-magnitude difference in Fc.
F d = 1 8 C D π d p 2 ρ ( u s − u p ) 2
F r = 3 π μ d p ( u s − u p )
F c = π ρ p d p 3 6 u p 2 R
F g = π g d p 3 6 ( ρ p − ρ s )
Therefore, the particle size greatly affects the force state and motion behavior of particles in rotating flow fields. Even for particles with identical densities, variations in particle size lead to significant differences in Fc and further produce distinct motion trajectories and separation responses in the cyclone. Specifically, under the same density condition, coarse particles bear larger Fc, which drives them toward the cyclone wall and eventually into underflow concentrates. In comparison, fine particles experience much lower Fc and are easily entrained by the inner vortex flow, thus reporting to the overflow products with a low density.
This size-induced separation deviation severely weakens the ideal density-based separation performance. On one hand, high-density fine particles fail to move toward the wall due to insufficient Fc and are lost in the tailings, resulting in the loss of valuable uranium-bearing minerals. On the other hand, low-density coarse particles are mistakenly collected into the concentrate due to excessive Fc, which reduces the concentrate grade.
The above analysis explains the necessity of size-by-size beneficiation. Through narrowing the particle size range via ore pre-classification, the particle density becomes the decisive factor governing particle separation, so as to realize efficient separation. For refractory hard-rock uranium ores with a wide particle size distribution and uneven dissemination of uranium minerals, classified size-by-size processing is essential to maintain stable separation performance and reduce uranium resource loss.
Notably, the present simulations simplify ore particles as regular spheres, while actual ore particles have irregular shapes that also affect the separation behavior. According to the hydrodynamic principle of slurry flow, particles with an identical density and mass but smaller minimum projected areas suffer from lower Fd, exhibiting motion velocities equivalent to those of particles with a higher density. Consequently, flat and irregular particles tend to be enriched in concentrates rather than tailings, bringing extra interference to density-dominated separation.

5. Conclusions

A pre-concentration strategy via gravity separation is proposed for the refractory low-grade hard-rock uranium ores from the Zoujiashan deposit. To address the high operational cost and poor economic performance of the conventional fine grinding followed by leaching process, dense medium separation is adopted to remove coarse gangue. At a feed size of −20 mm, dense medium separation can greatly reduce the subsequent grinding capacity and acid consumption in downstream leaching. This provides an innovative approach for the efficient and cost-effective development of low-grade uranium ores.
(1)
The Zoujiashan uranium ore has a low grade of 0.202%. Uranium mainly occurs as uraninite with fine dissemination characteristics. More than 95% of the uraninite particles are below 0.045 mm, and over 90% are below 0.024 mm. Uranium minerals exhibit complex intergrowth with gangue minerals including illite, muscovite, calcite, and pyrite. Conventional grinding process cannot fully liberate uranium minerals. Therefore, direct beneficiation targeting fully liberated uranium mineral particles is impractical. Pre-concentration via coarse gangue rejection is recommended.
(2)
Heavy liquid separation tests were performed on three feed size fractions (−50 mm, −20 mm, and −5 mm). The results reveal that ore crushing to −20 mm followed by size classification yields the optimal pre-concentration performance. Under this optimized condition, the low-density fraction (density below 2.61 × 10³ kg·m−3) achieves a total gangue rejection rate of 36.03%, with an ultra-low uranium grade of 0.011% and a uranium loss rate of 1.97%.
(3)
DMC separation tests verify that ore classification followed by size-by-size beneficiation is essential for alleviating the adverse effects of a wide particle size distribution. Among all tested fractions, the −20 + 8 mm coarse fraction exhibits the optimal separation behavior. Under a medium density of 2.05 × 10³ kg·m−3, the tailings uranium grade and uranium loss were 0.025% and 11.95%, respectively. Conversely, mixed-size beneficiation leads to severe particle misplacement. Fine particles are incorrectly discharged into the tailings, while coarse particles report to the concentrate, thereby obtaining a tailings grade of 0.074% and uranium loss rate of 9.32%.
(4)
CFD simulations qualitatively reveal the separation law of mono-sized particles. A density difference of 8.6% can achieve favorable separation under a uniform particle size. However, the centrifugal force acting on a particle is proportional to the cube of its diameter, indicating that a broad particle size distribution will greatly disturb the density-dominated separation mechanism. For hard-rock uranium ores with a wide size distributions, ore classification and size-by-size beneficiation are necessary to weaken size interference, to prioritize the density as the dominant separation factor, and to minimize uranium loss. This is favorable for improved separation efficiency.

Author Contributions

Investigation, data curation, formal analysis, visualization, writing—original draft, funding acquisition, G.L.; conceptualization, methodology, supervision, writing—review and editing, X.-B.S.; supervision, resources, A.-F.Y.; investigation, methodology, J.M.; project administration, X.-M.H. All authors have read and agreed to the published version of the manuscript.

Funding

This research was funded by the National Natural Science Foundation of China, grant number U2341266.

Data Availability Statement

All data presented are original.

Acknowledgments

The authors would like to express their sincere gratitude to An-kun Ji, Jin-lu Zhang, Yang Liu, and other staff members from the dense medium separation test platform at Weihai Haiwang Cyclone Co., Ltd. for their great assistance in the dense medium separation experiments.

Conflicts of Interest

All authors are affiliated with the company China National Nuclear Corporation. The paper reflects the views of the scientists and not the company.

References

  1. Liu, H.W.; Wang, X.G.; Long, J.; Wan, Z.C.; Gao, Y.Y.; Chen, S.Y.; Liu, C.; Sun, Z.X. Enhanced bioleaching of granite-type uranium ore using an applied electric field. J. Clean. Prod. 2023, 415, 137811. [Google Scholar] [CrossRef] [Scilit]
  2. Qiu, J.; Zhang, Y.; Fu, C.Q.; Yang, Y.C.; Ye, Y.J.; Wang, R.B.; Tang, B. Study on photofluorescent uranium ore sorting based on deep learning. Miner. Eng. 2024, 206, 108523. [Google Scholar] [CrossRef] [Scilit]
  3. Khaleel, M.; Yusupov, Z.; Rekik, S.; Kiliç, H.; Nassar, Y.F.; El-Khozondar, H.J.; Ahmed, A.A. Harnessing nuclear power for sustainable electricity generation and achieving zero emissions. Energy Explor. Exploit. 2025, 43, 1126–1148. [Google Scholar] [CrossRef] [Scilit]
  4. Xin, J.Y.; Hong, C.S.; Jia, W.; Qie, J.W.; Wang, H.; Lei, B.; Li, X.Y.; Cai, Z.Q.; Kang, Q.; Zeng, Z.W.; et al. A comprehensive review of radioactive pollution treatment of uranium mill tailings. Environ. Sci. Pollut. Res. Int. 2023, 30, 102104–102128. [Google Scholar] [CrossRef] [Scilit] [PubMed]
  5. Monnet, A.; Gabriel, S.; Percebois, J. Analysis of the long-term availability of uranium: The influence of dynamic constraints and market competition. Energy Policy 2017, 105, 98–107. [Google Scholar] [CrossRef] [Scilit]
  6. Wang, H.F. Current situation and prospect of uranium resources mining and metallurgy technology in China. Uranium Min. Metall. 2026, 45, 10–22. (In Chinese) [Google Scholar]
  7. Cheng, H.W.; Lv, Z.H.; Wu, D.Y.; Zhao, D.K. Characterization and concentration of U, Nb, Pb, Ag, and Fe from the Huayangchuan polymetallic ore. Physicochem. Probl. Miner. Process 2024, 60, 188070. [Google Scholar] [CrossRef] [Scilit]
  8. Zhao, J.N.; Chen, S.Y.; Zuo, R.G.; Zhou, M. Controls on and prospectivity mapping of volcanic-type uranium mineralization in the Pucheng district, NW Fujian, China. Ore Geol. Rev. 2019, 112, 103028. [Google Scholar] [CrossRef] [Scilit]
  9. Liu, X.F.; Liu, J.H.; Xing, Y.G.; Yang, Y.H.; Wang, R.Y.; He, T. Spatiotemporal evolutionary patterns of mineral dissolution and precipitation (formation) amount in acid in situ leaching of uranium. J. Radioanal. Nucl. Chem. 2025, 334, 2949–2962. [Google Scholar] [CrossRef] [Scilit]
  10. Liu, C.; Liu, H.W.; Long, J.; Liao, B.Y.; Wang, X.G.; Sun, Z.X.; Guo, Y.D.; Zheng, Z.H. Interaction of dry and water-saturated uranium ore with microwave and enhanced extraction of uranium. Miner. Eng. 2023, 196, 108047. [Google Scholar] [CrossRef] [Scilit]
  11. Cui, S.F.; Yang, S. New progress in beneficiation and metallurgy technology of low-grade hard rock type uranium ore. Uranium Min. Metall. 2020, 39, 75–78. (In Chinese) [Google Scholar]
  12. Lunt, D.; Boshoff, P.; Boylett, M.; El-Ansary, Z. Uranium extraction: The key process drivers. J. South. Afr. Inst. Min. Metall. 2007, 107, 419–426. [Google Scholar]
  13. Wang, D.Y.; Zhang, X.J.; Liu, Y.; Yan, Y.T.; Wang, B.; Wu, S.W.; Liu, Q.; Cai, X.Q.; Wang, R.B.; Tang, B. Study on Radiometric Sorting of Uranium Ore Based on Deconvolution. Minerals 2026, 16, 267. [Google Scholar] [CrossRef] [Scilit]
  14. Lim, J.M.D.; de Jesus, J.M.C.; Choi, A.E.S.; Futalan, C.C.M. Balancing efficiency and cost in uranium recovery: A fuzzy optimization approach. Nucl. Eng. Des. 2025, 444, 114424. [Google Scholar] [CrossRef] [Scilit]
  15. Robben, C.; Wotruba, H. Sensor-Based Ore Sorting Technology in Mining-Past, Present and Future. Minerals 2019, 9, 523. [Google Scholar] [CrossRef] [Scilit]
  16. Tian, Y.H.; Li, G.; Li, Z.; Ma, J.; Li, C.F.; Zhang, C.; Zhang, S.X.; Hou, X.M. Flotation of a beryllianite-type uranium-beryllium co-associated ore in Xinjiang. Hydrometall. China 2025, 44, 433–439. (In Chinese) [Google Scholar]
  17. Fawzy, M.M.; Saleh, G.M.; Kamar, M.S.; Maged, A.; Fathy, M.M.; Kharbish, S. Characterization and optimized upgrading for kasolite in the mineralized lamprophyre dyke, Abu Rusheid Area, Southern Eastern Desert, Egypt. Sep. Sci. Technol. 2025, 60, 1614–1629. [Google Scholar] [CrossRef] [Scilit]
  18. Abdellah, W.M.; Khalafalla, M.S.; Abu Khoziem, H.A.; El Hussaini, O.M. Physical and chemical processes of Abu Rusheid cataclastic rocks for recovering niobium, zirconium and uranium compounds. Physicochem. Probl. Miner. Process 2021, 57, 137–152. [Google Scholar] [CrossRef] [Scilit]
  19. Lv, Z.H.; Wei, M.; Zhao, D.K.; Wu, D.Y.; Liu, C.M.; Cheng, H.W. Preconcentration of a low-grade betafite ore by dense medium cyclone. Physicochem. Probl. Miner. Process 2022, 58, 1–14. [Google Scholar]
  20. Li, S.Q.; Zhu, Y.G.; Cui, S.F.; Hu, J.P.; Cui, Q.; Zheng, G.B. Recovery of betafite by positive flotation from a low-grade uranium ore. Min. Metall. 2020, 29, 22–26. (In Chinese) [Google Scholar]
  21. Li, S.; Xu, H.X.; Cao, Y.J.; Deng, J.S.; Sun, X.; Kang, Y.T.; Ma, L.; Xie, M.J. Uranium in coal by-product and unconventional resources: Occurrence characteristics and extraction methods. Sep. Purif. Technol. 2025, 379, 135163. [Google Scholar] [CrossRef] [Scilit]
  22. Liu, Z.C.; Li, C.F.; Ma, J.; Qiang, D.L.; Jia, X.M.; Wu, C.L.; Li, G.; Liu, Z.C.; Tang, B.B. Study on pretreatment technology of a mudstone type uranium ore. Mod. Min. 2021, 37, 98–101. (In Chinese) [Google Scholar]
  23. Van, L.T.; Dinh, T.T.; Dung, N.T.K. Study on leaching systems and recovery for PALUA–PARONG low grade uranium sandstone ores. Hydrometallurgy 2020, 191, 105164. [Google Scholar] [CrossRef] [Scilit]
  24. Wang, X.G.; Sun, Z.X.; Liu, Y.J.; Min, X.B.; Guo, Y.D.; Li, P.; Zheng, Z.H. Effect of particle size on uranium bioleaching in column reactors from a low-grade uranium ore. Bioresour. Technol. 2019, 281, 66–71. [Google Scholar] [CrossRef] [Scilit] [PubMed]
  25. Wang, Y.J.; Nie, J.T.; Lin, J.R.; Wang, H.Z. Geochronology and geochemistry of the felsic-intermediate dikes from Xiangshan uranium ore field, South China: Implications for petrogenesis, tectonic setting and uranium mineralization. Mineral. Petrol. 2022, 116, 287–310. [Google Scholar] [CrossRef] [Scilit]
  26. Deng, J.Z.; Yu, H.; Chen, H.; Du, Z.J.; Yang, H.Y.; Li, H.X.; Xie, S.P.; Chen, X.; Guo, F.S. Ore-controlling structures of the Xiangshan volcanic Basin, SE China: Revealed from three-dimensional inversion of Magnetotelluric data. Ore Geol. Rev. 2020, 127, 103807. [Google Scholar] [CrossRef] [Scilit]
  27. Yu, Z.Q.; Ling, H.F.; Mavrogenes, J.; Chen, P.R.; Chen, W.F.; Fang, Q.C. Metallogeny of the Zoujiashan uranium deposit in the Mesozoic Xiangshan volcanic-intrusive complex, southeast China: Insights from chemical compositions of hydrothermal apatite and metal elements of individual fluid inclusions. Ore Geol. Rev. 2019, 113, 103085. [Google Scholar] [CrossRef] [Scilit]
  28. Guo, J.J. The Characteristics of Apatite Fluid Inclusions of the Ultra-Rich Ore in Zoujiashan Uranium Deposit in XiangShan Ore-Field. Master’s Thesis, East China University of Technology, Nanchang, China, 2021. (In Chinese) [Google Scholar]
  29. Zhang, Y.L.; Francois, N.; Deakin, L.; Barron, A.; Evans, C.; Bensley, S.; Losel, P.D.; Kandula, N.; Henley, R.; Knackstedt, M. Improved particle separation, characterisation and analysis for ore beneficiation studies using 3D X-ray micro-computed tomography. Miner. Eng. 2024, 216, 108835. [Google Scholar] [CrossRef] [Scilit]
Figure 1. Schematic diagram of mineralogy analyses and ore selectivity by gravity separation.
Minerals 16 00640 g001
Figure 2. Automated mineral analysis images of Zoujiashan uranium ore.
Minerals 16 00640 g002
Figure 3. CT images of ore in different directions: (a) different cross-sections; (b) particle size distribution of high-density uranium minerals.
Minerals 16 00640 g003
Figure 4. CT images of Zoujiashan ore: (a) range of CT horizontal slices; (b1–b16) X-ray CT images of continuous horizontal slices from position A to position B.
Minerals 16 00640 g004
Figure 5. SEM images of bright minerals in CT images and EDS analyses of different points: (a) SEM; (b) Point 1; (c) Point 2; (d) Point 3; (e) Point 4; (f) Point 5; (g) Point 6.
Minerals 16 00640 g005
Figure 6. Density analysis by heavy liquid separation when the feed particle size is −50 mm: (a) yield; (b) uranium grade; (c) uranium distribution.
Minerals 16 00640 g006
Figure 7. Density analysis by heavy liquid separation when the feed particle size is −20 mm: (a) yield; (b) uranium grade; (c) uranium distribution.
Minerals 16 00640 g007
Figure 8. Density analysis by heavy liquid separation when the feed particle size is −5 mm: (a) yield; (b) uranium grade; (c) uranium distribution.
Minerals 16 00640 g008
Figure 9. Schematic diagram of DMC installation and operation.
Minerals 16 00640 g009
Figure 10. Dense medium separation indicators of materials with different particle sizes as a function of the dense medium density: (a) −20 + 8 mm; (b) −8 + 3.2 mm; (c) −3.2 + 1.25 mm.
Minerals 16 00640 g010
Figure 11. Flow rate distribution and underflow-to-overflow ratio R for particles with different densities.
Minerals 16 00640 g011
Figure 12. Particle phase velocity distributions of different density groups (vertical mid-section).
Minerals 16 00640 g012
Figure 13. Volume distribution of particle phase for Group 1 (a1,a2) and vertical mid-section volume distributions of different density groups (b).
Minerals 16 00640 g013
Table 1. Multi-element analysis results for Zoujiashan uranium ore (%).
ElementContentElementContentElementContentElementContentElementContent
U0.202Fe2.81F0.62ZrO20.032Cl0.02
SiO262.02Na2O2.09TiO20.42Rb2O0.031WO30.015
Al2O317.74SO31.37MnO0.13ThO20.03ZnO0.015
CaO5.16MgO1.25REO0.092PbO0.03CuO0.006
K2O3.98P2O50.77SrO0.04MoO30.02NiO0.006
Table 2. Phase analysis results for uranium (%).
Exchangeable UraniumCarbonate-Bound UraniumU MineralsTotal
8.6725.4665.87100.00
Table 3. Types and content of minerals in Zoujiashan ore (%).
TypeContentTypeContentTypeContentTypeContent
Quartz25.38Ankerite0.89Hematite/magnetite3.01Zoisite0.04
Orthoclase36.03Fluorite0.65Biotite2.56Ilmenite0.036
Muscovite18.05Rutile0.35Chlorite1.93Zircon0.027
Illite4.12U minerals0.36Apatite1.73Monazite0.014
Calcite3.58Kaolinite0.09Pyrite1.02
Table 4. Yield, uranium grade, and uranium distribution of each narrow size fraction under different feed particle sizes (50 mm, 20 mm, and 5 mm) (%).
FeedSize Fraction/mmYieldUranium GradeUranium Distribution
50 mm−50 + 2023.130.17919.77
−20 + 829.470.19827.93
−8 + 3.222.140.16517.50
−3.2 + 1.251.410.1521.03
−1.25 + 0.566.750.1555.00
−0.5617.100.35228.77
Feed100.000.209100.00
20 mm−20 + 843.490.11023.17
−8 + 3.213.830.20913.99
−3.2 + 1.2516.520.19015.18
−1.25 + 0.567.010.2869.69
−0.5619.150.41037.97
Feed100.000.207100.00
5 mm−5 + 1.2553.160.15240.34
−1.25 + 0.5614.430.20814.97
−0.56 + 0.339.870.21210.46
−0.3322.540.30434.23
Feed100.000.200100.00
Table 5. Results for mixed-size beneficiation of samples with different size fractions at the cut density of 1.95 × 10³ kg·m−3 (%).
ProductYieldUranium GradeUranium Distribution Rate
Concentrate79.240.18990.68
Tailing20.760.0749.32
Feed100.000.165100.00
Table 6. Sieve analyses of products for mixed-size beneficiation of different size fractions (%).
Particle Size/mmSize Fraction MassUranium Grade
FeedConcentrateTailingsFeedConcentrateTailings
−20 + 858.8966.1828.730.1120.1220.018
−8 + 3.218.7315.5831.740.2090.2840.056
−3.2 + 1.2522.3818.2439.530.2660.3490.122
Total100.00100.00100.000.1650.1890.074
Disclaimer/Publisher’s Note: The statements, opinions and data contained in all publications are solely those of the individual author(s) and contributor(s) and not of MDPI and/or the editor(s). MDPI and/or the editor(s) disclaim responsibility for any injury to people or property resulting from any ideas, methods, instructions or products referred to in the content.