A Robust GDF-ML Framework for Dynamic Grade Modeling: Adaptive Resource Estimation in Complex Porphyry Systems


Abstract
1. Introduction
2. Geological Characteristics and Data Sources
2.1. Geological Characteristics
2.2. Data Sources and Processing
3. Methods
3.1. Implicit Modeling
3.2. Calculation of Geological Distance Fields
3.2.1. Geometric Computing Workflow
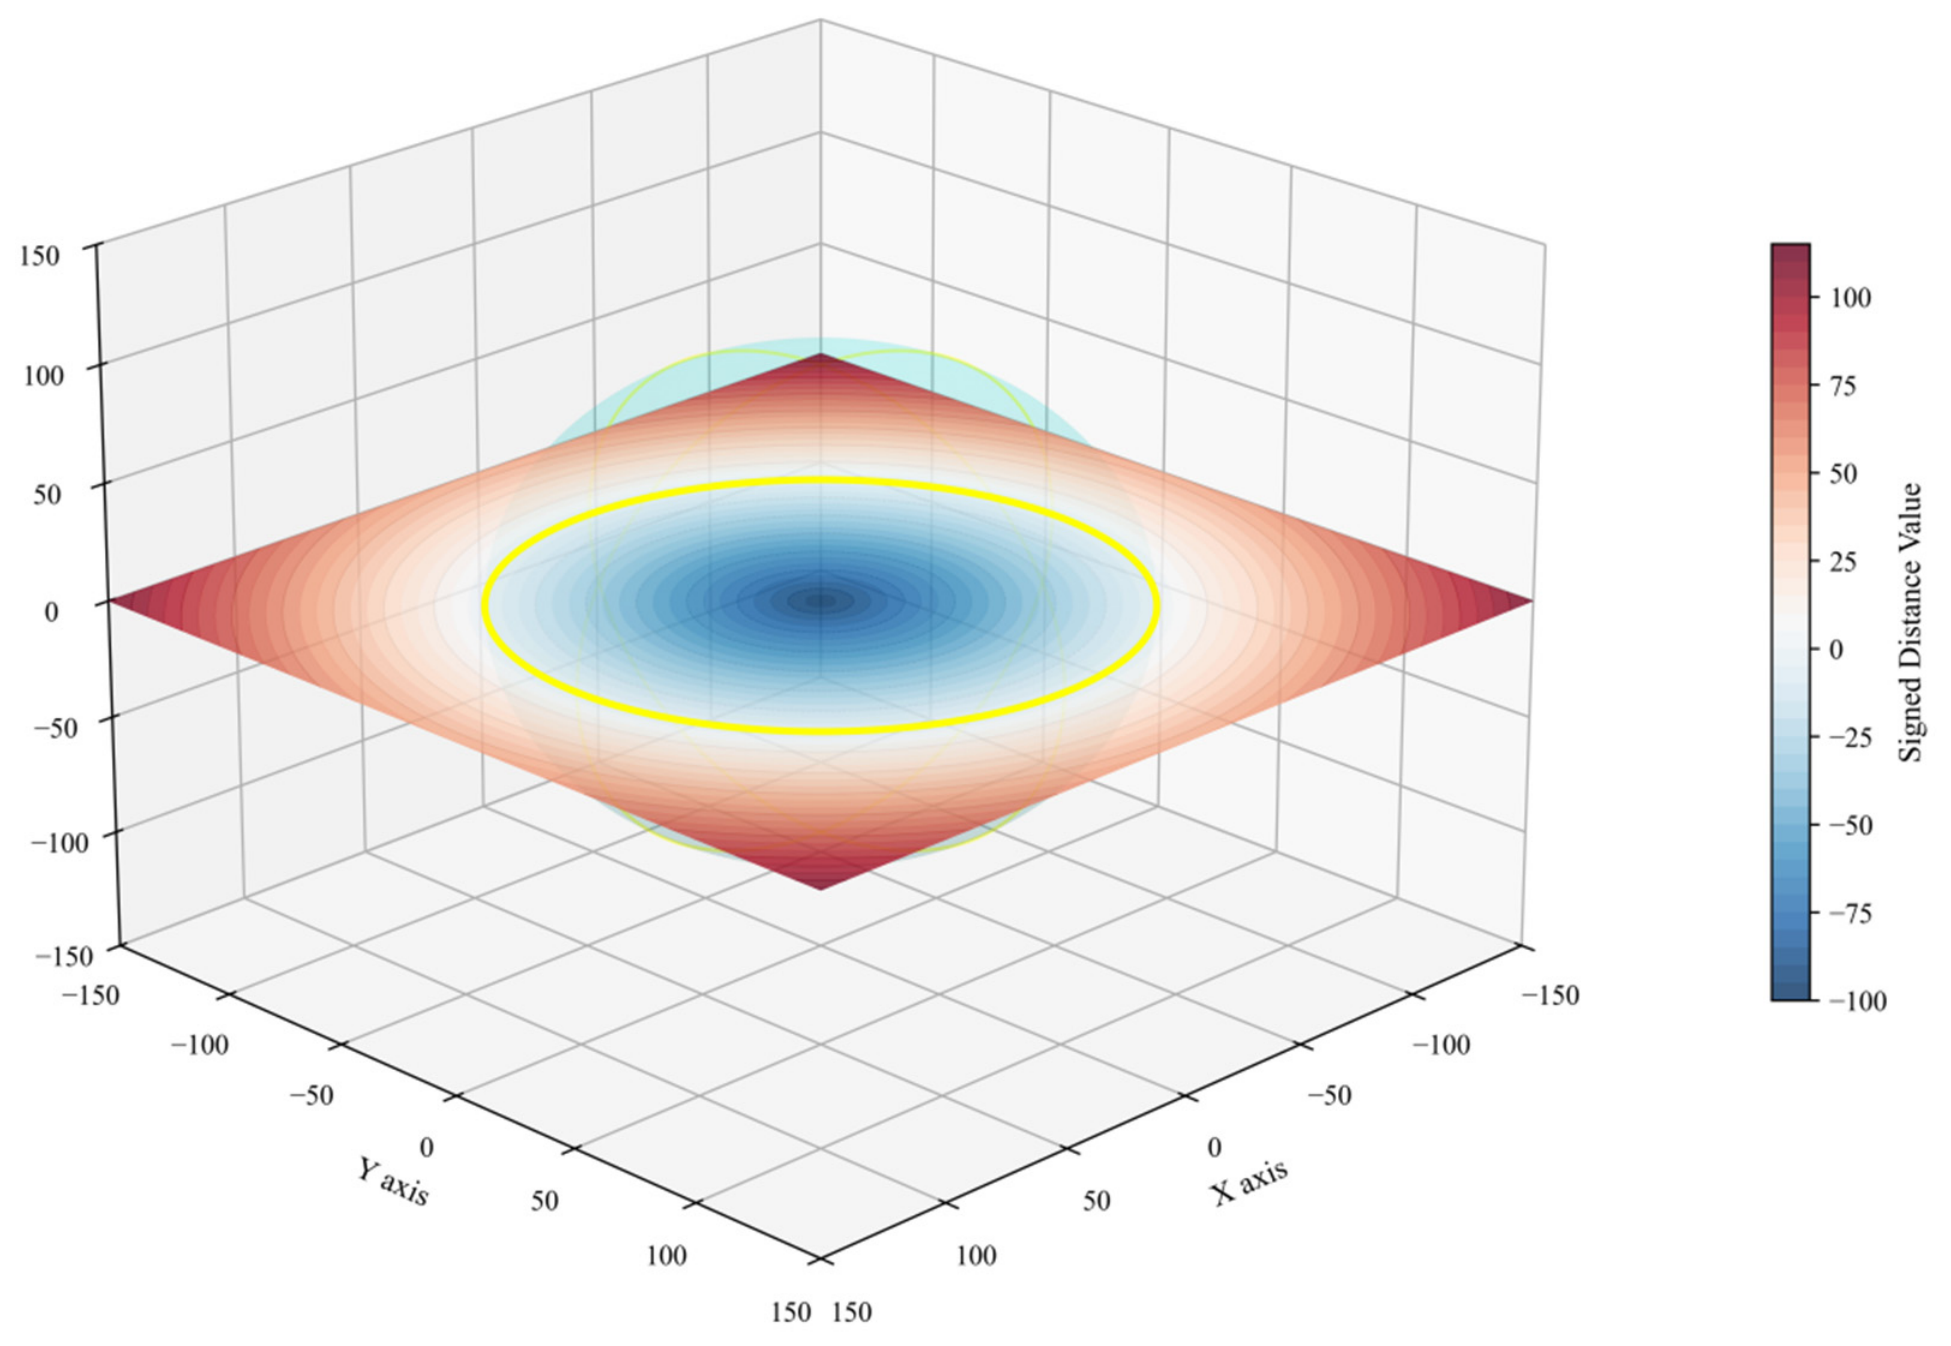
3.2.2. Geological Attribution of the Signed Distance Field
3.2.3. Evaluation of Feature Independence and Mitigation of Circular Data Leakage
3.3. Methods of Machine Learning
3.3.1. Model Selection
3.3.2. Random Forest
3.3.3. XGBoost
3.3.4. CatBoost
3.3.5. Hyperparameter Optimization via Optuna
3.3.6. Operational Pipeline for Ensemble Training
3.4. SHAP Analysis
3.5. Separation and Decoupling Between Geological Framework and Model Training
4. Model Training and Evaluation
4.1. Implicit Modeling and GDF Construction
4.2. Model Construction and Validation Strategy
4.2.1. Construction of Model and Validation Based on Shuffled Data
4.2.2. Construction of Model and Validation Based on Non-Shuffled Data
4.2.3. Construction of Model and Validation Based on Geographically Separated Data
4.2.4. Selection of Model
4.3. Feature Sensitivity and Structural Robustness Analysis
4.3.1. Structural Perturbation Experiment
4.3.2. Sensitivity Results and Analysis
4.3.3. Implications for Geological Modeling
4.3.4. Rationale for Validating on a Complete GDF Framework
4.4. SHAP Interpretation
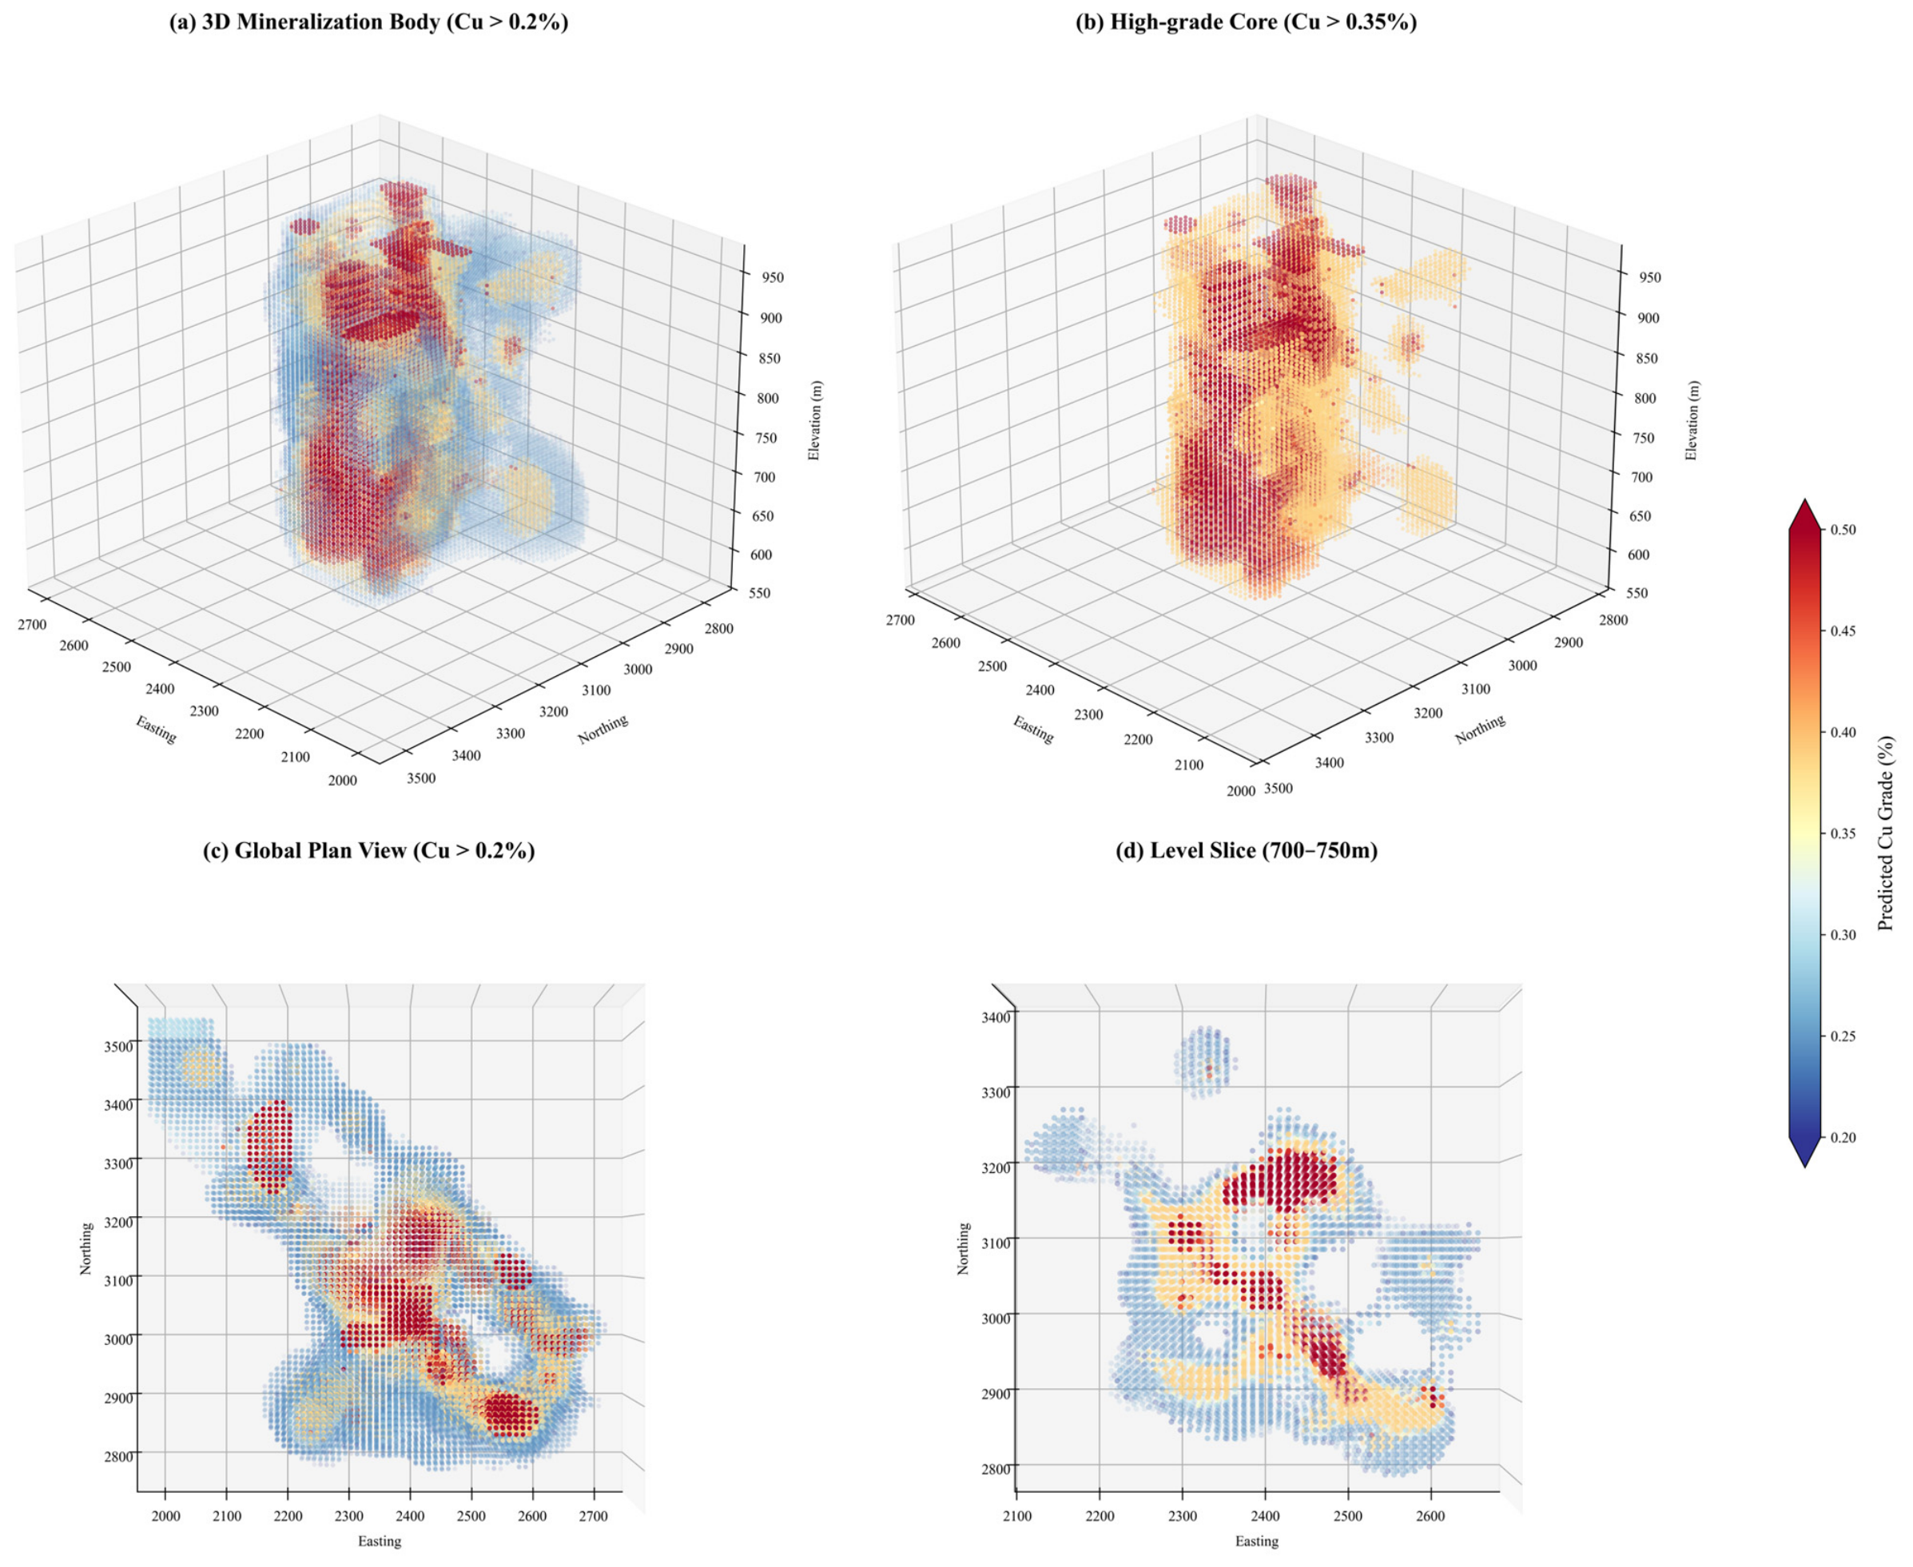
4.5. Grade Model Estimation and 3D Spatial Analysis
5. Discussion
5.1. Acknowledgment of Target-Informed Priors and Methodological Limitations
- Validation Strategy Constraints: A fundamental limitation of the current validation pipeline is that cross-validation is inherently performed within the context of the established structural GDF framework. Because the GDFs themselves encapsulate the geometry derived from the complete deposit dataset, the evaluation measures the model’s ability to interpolate within these defined structures, rather than its capacity to predict mineralization in the absence of such structures. Consequently, our cross-validation reflects the model’s precision as an internal estimation tool—optimizing grade distribution within known geological constraints—rather than its standalone predictive performance in a completely blind scenario without structural priors.
- Dependency on Structural Interpretation Accuracy: The framework’s predictive performance is intrinsically bounded by the accuracy of the initial structural interpretation. Where these interpretations are incorrect or incomplete, the model’s performance may decay. In this context, performance metrics serve as a diagnostic indicator of structural inconsistency rather than purely a failure of the machine learning engine.
- Reconciliation vs. Predictive Forecasting: The validation strategy presented herein focuses on the model’s effectiveness in reproducing known mineralization patterns (reconciliation) within an established framework. Consequently, this architecture is best defined as an expert-constrained optimization tool designed to enhance resource estimation precision, rather than a standalone predictive model intended for virgin, undrilled volumes devoid of prior structural guidance.
5.2. Conceptual Validity and Mitigation of Circularity
5.2.1. Statistical Evaluation of Input Feature Attributes
5.2.2. Spatial Distance Covariates as Geometric Constraints
5.2.3. Structural Alignment and Feature Hierarchies
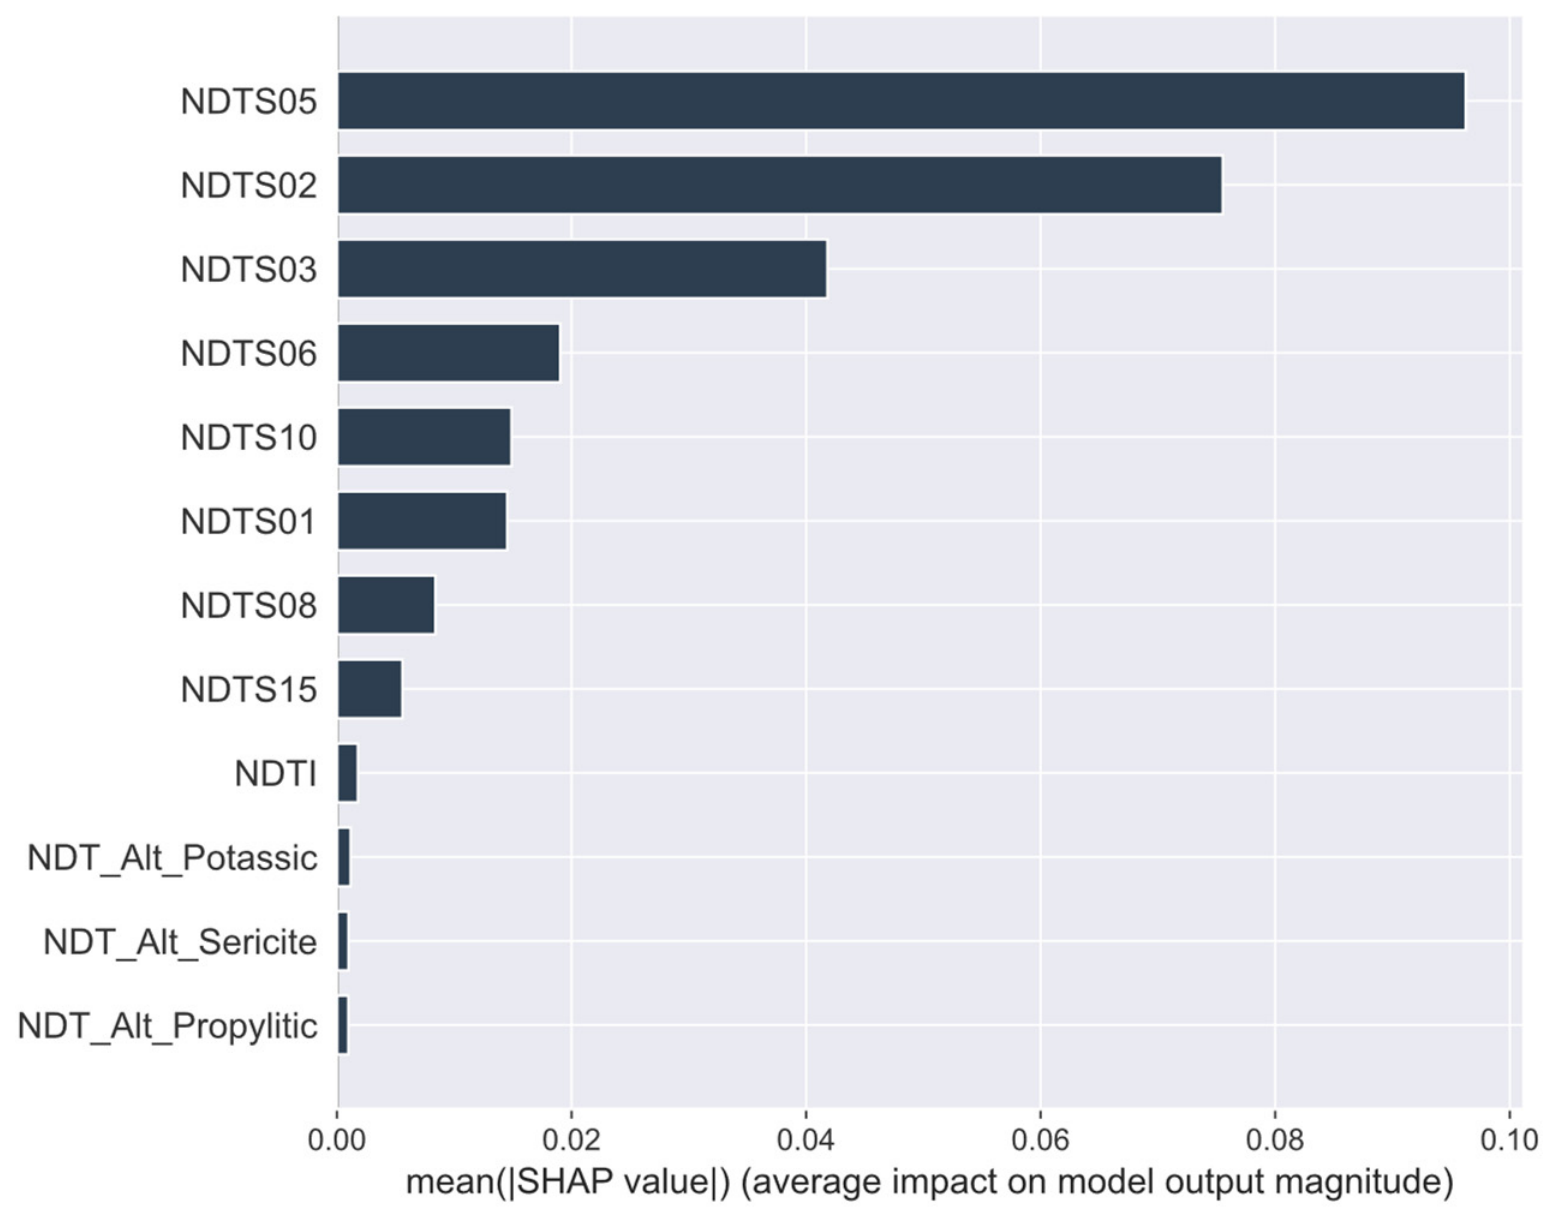
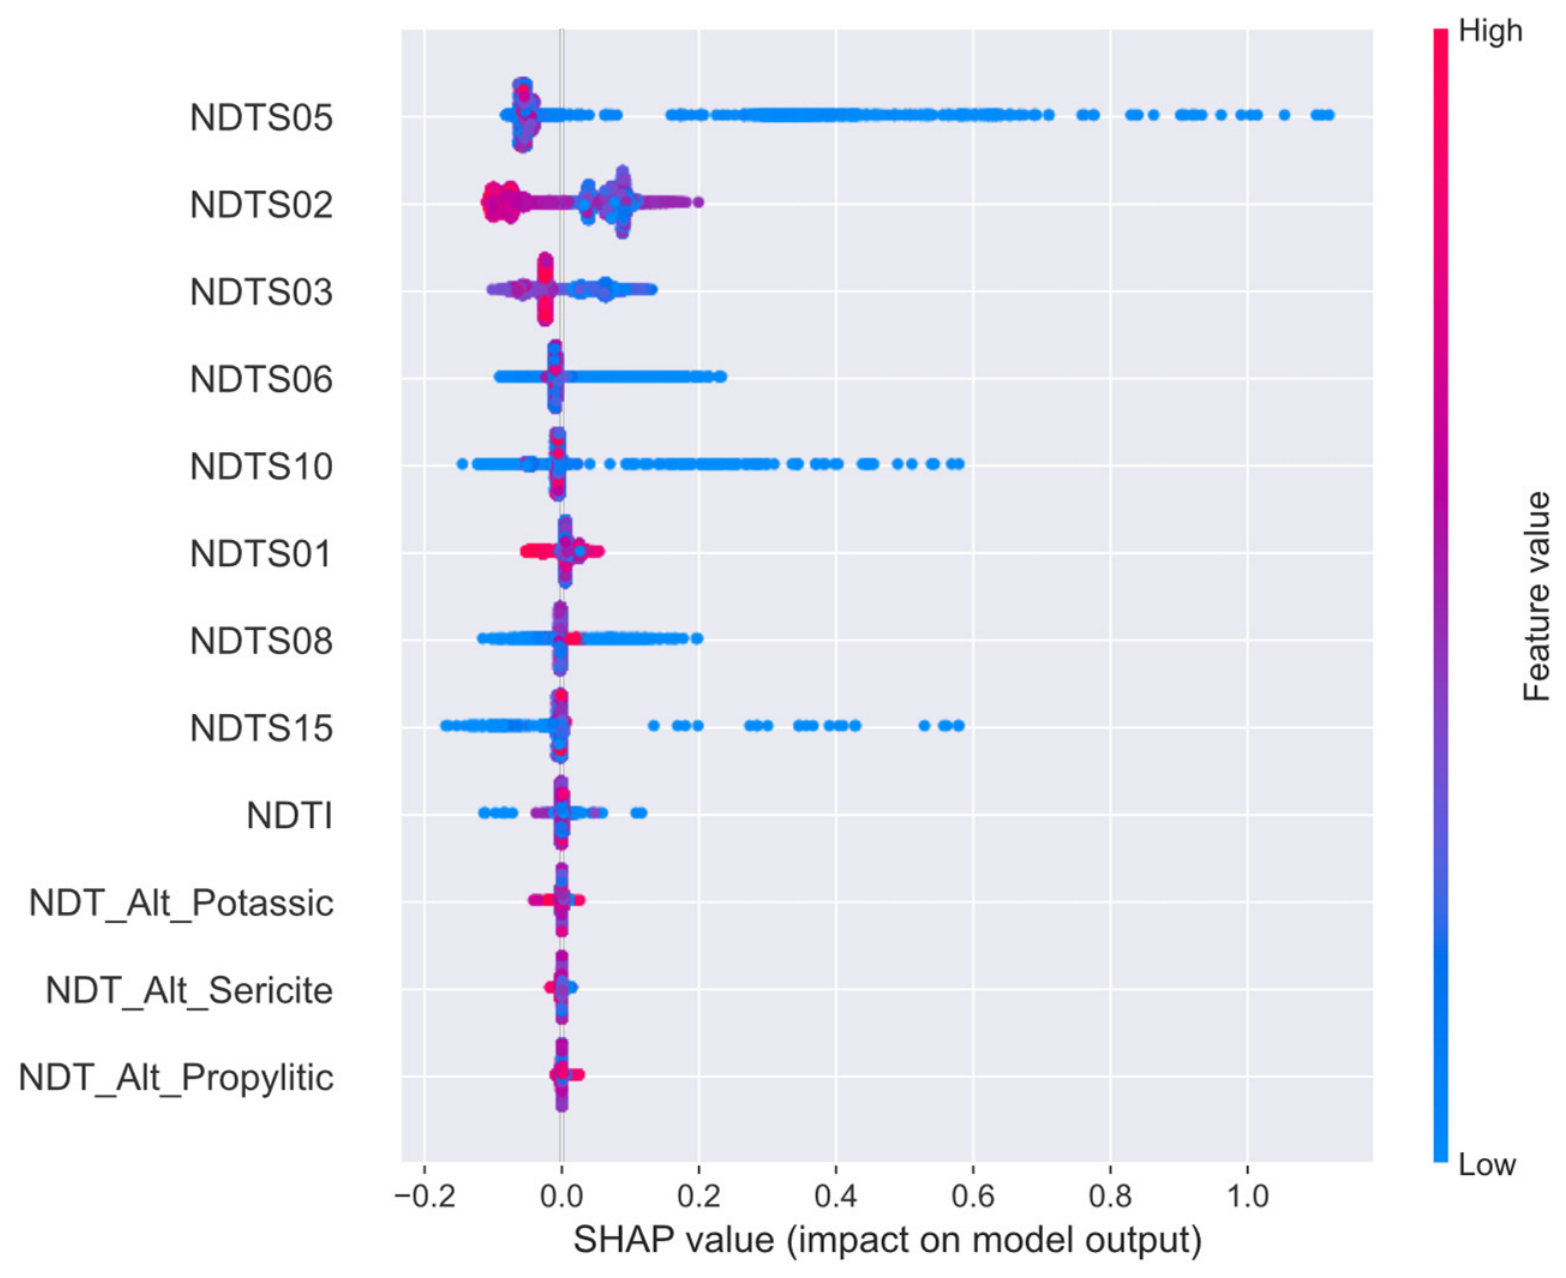
- Identification of Primary Statistical Drivers: The higher relative weights assigned to the grade-shell distance fields indicate that the regression algorithm prioritizes these continuous spatial variables to capture global variance. Within the ensemble optimization process, the algorithm assigns greater splitting priority to the geometric frameworks that exhibit the strongest statistical correlation with the continuous target variable, thereby aligning the numerical framework with the dominant spatial controls of the deposit.
- Statistical Implication of Secondary Covariates: The lower relative importance scores associated with the lithological or alteration distance fields suggest a weaker direct spatial correlation with localized grade variations at the scale of observation. The model’s capacity to discount these redundant dimensions suggests that the regression pathways can differentiate between primary geometric correlates and broader geological background contexts, providing an empirical basis for assessing feature relevance under joint data constraints.
- Feature Redundancy and Model Stability: Crucially, the inclusion of these secondary geometric variables does not degrade cross-validation stability or lead to numerical variance inflation. Instead, these secondary fields function as continuous spatial constraints during node partitioning. By incorporating multiple continuous spatial distance inputs, the workflow evaluates the target variable across overlapping geometric domains, which assists in constraining estimations within bounded volumetric limits. Even with minimal attribution weights, these features provide a structural reference that reduces unconstrained mathematical extrapolation in sparse data regions, ensuring that the final output remains consistent with the generalized geological context of the deposit.
5.3. Analysis of Non-Linear Feature Interaction and Variable Attribution
5.3.1. Evaluation of Spatial Non-Linearity vs. Linear Interpolation
5.3.2. Multivariable Feature Interaction and Joint Attribution
5.3.3. Spatial Compatibility and Multivariable Regression Consistency
5.4. Unified Spatial Regression and Operational Integration Analysis
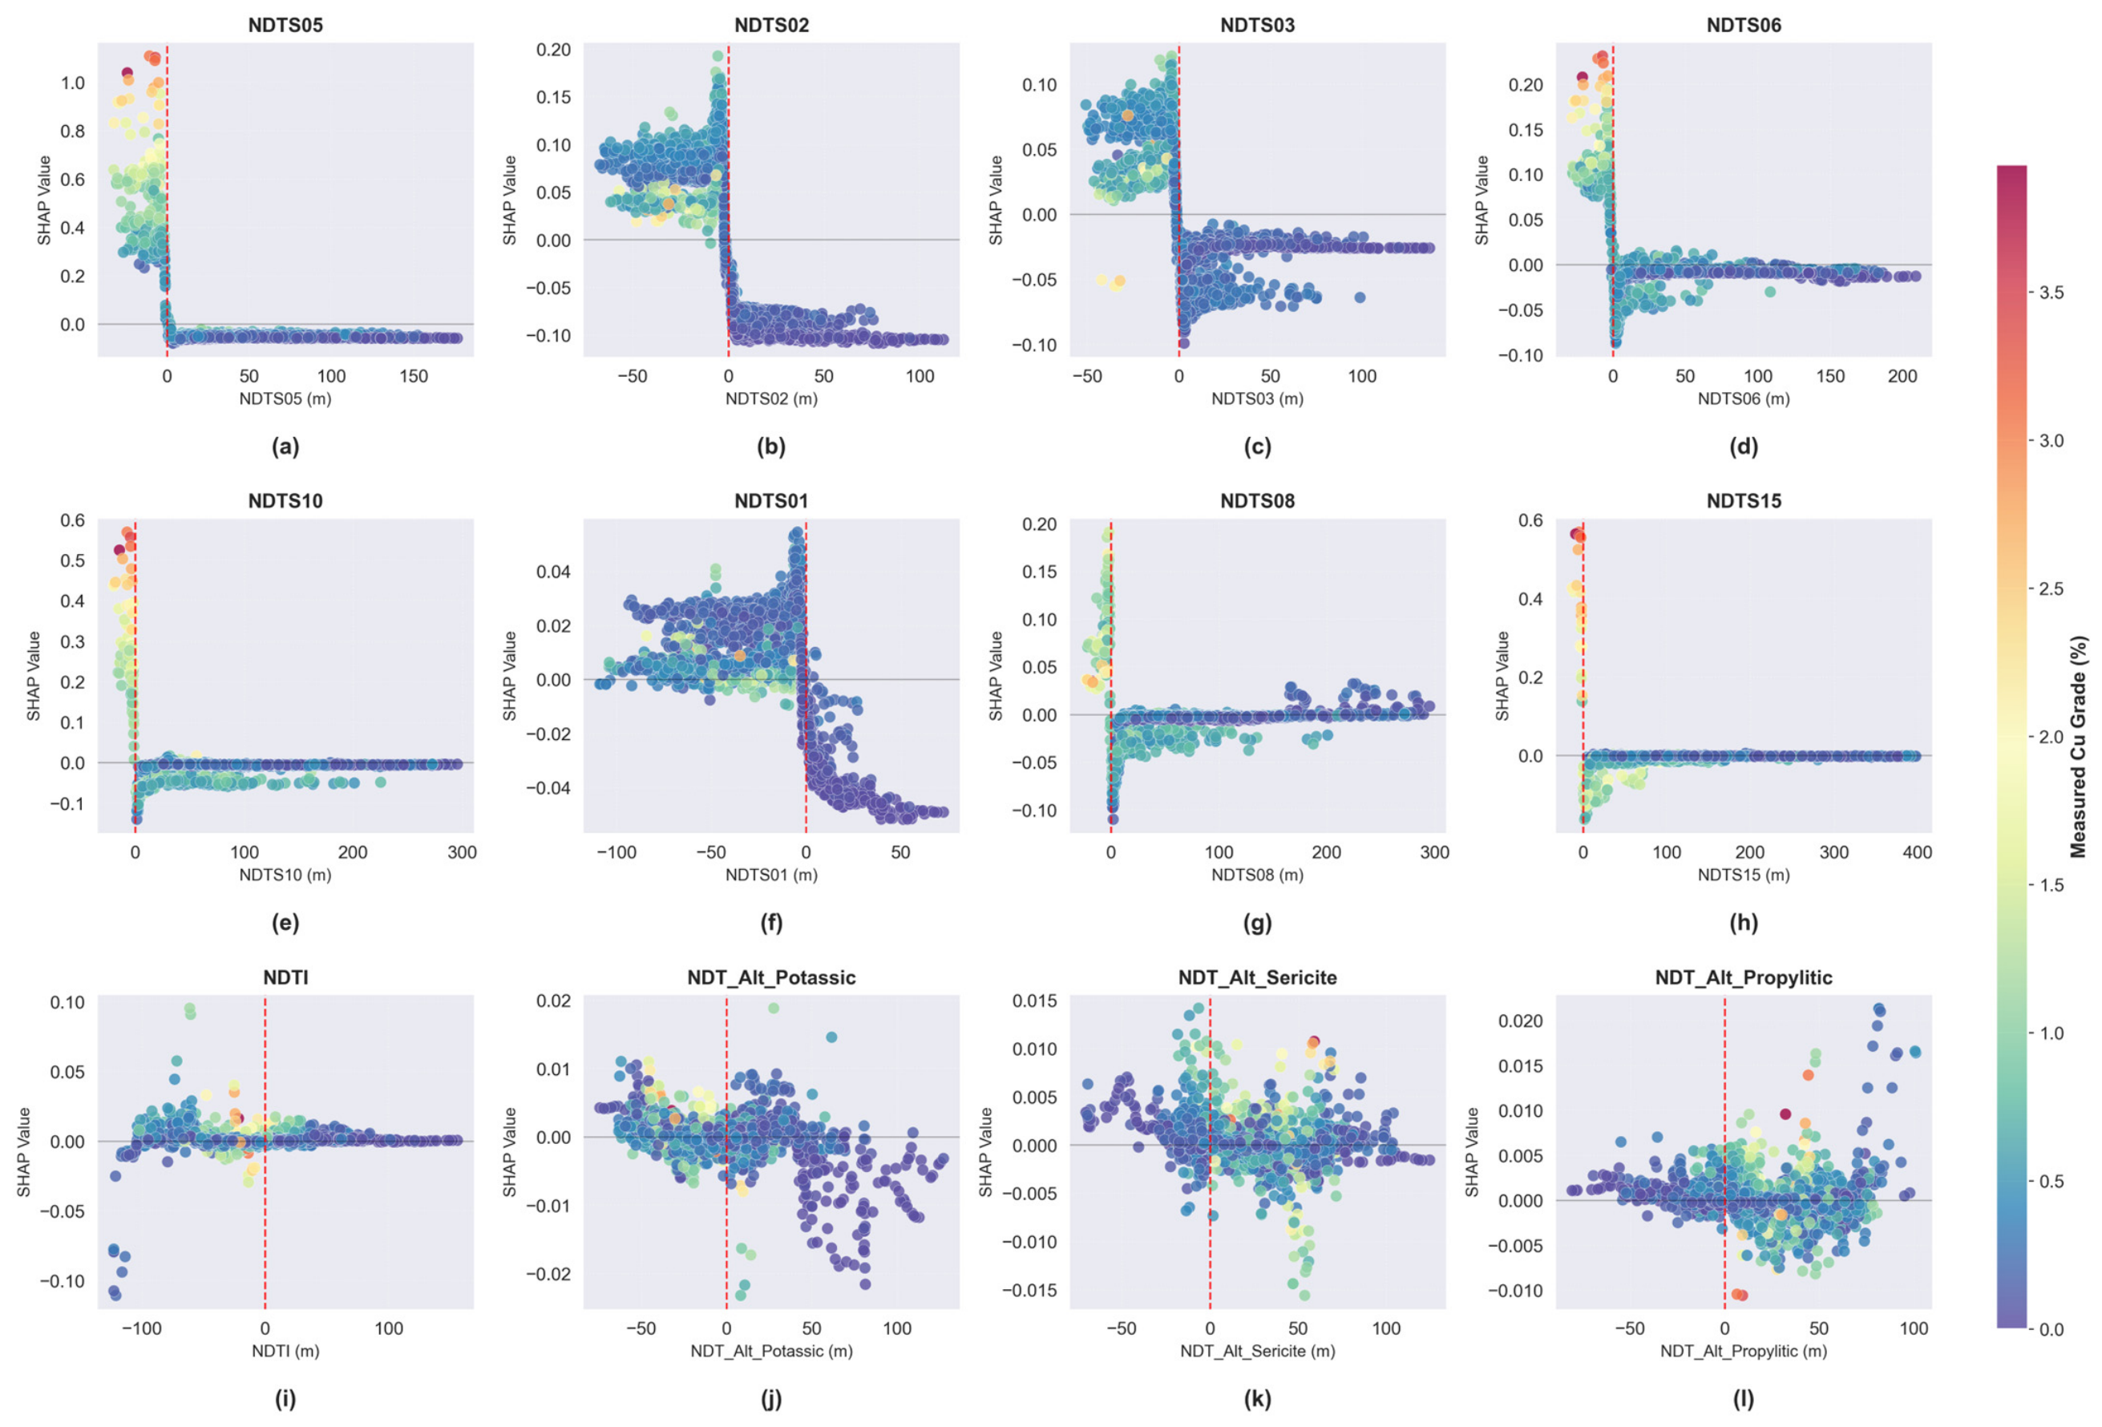
- Covariate-Based Grading vs. Hard Domaining: The continuous distance fields derived from GDF mapping provide domain-wide spatial constraints across the entire deposit volume, minimizing the reliance on manual sub-domaining. Consequently, the requirement for individual variogram fitting within isolated structural blocks is minimized; the regression algorithm characterizes the transitional gradients between the higher-grade core and the peripheral mineralized halos based entirely on the continuous feature space.
- Integrated Regression Framework via Continuous Features: A operational advantage of the GDF-ML workflow is its capacity to synthesize multiple spatial domains into a single regression envelope. Rather than decomposing the deposit into independent, hard-bounded sub-domains for isolated interpolation, the workflow evaluates the mineralized system within a unified feature space. By encoding structural controls into continuous distance covariates, the model accounts for localized variations and grade gradients within a globally consistent coordinate framework. This continuous approach allows the generalized geological transitions—extending from the high-temperature core to the peripheral alteration domains—to be evaluated as a coherent trend, mitigating the operational burden of managing fragmented, independent sub-estimation files while maintaining the geometric consistency of the 3D block estimates.
- Sensitivity to Initial Interpretative Constraints: Despite reducing the necessity for manual geometric partitioning, the GDF-ML framework is not an unconstrained, purely data-driven mechanism; instead, its mathematical performance remains highly dependent on the initial delineation of the reference geological structures. The feature construction phase requires input from exploration geologists to translate multi-scale structural data into representative distance variables. If systematic errors exist within the initial structural interpretation relative to the true subsurface distribution, the regression workflow will inevitably propagate these geologically defined biases into the final estimation outputs. Therefore, while this workflow minimizes repetitive manual partitioning steps, its performance relies strictly on the fidelity and accuracy of the conceptual geological model, shifting the engineering focus from empirical variogram tuning toward rigorous structural model validation.
5.5. Comparison Between GDF-ML and Ordinary Kriging
5.5.1. Ordinary Kriging Configuration and Variogram Parameterization
5.5.2. Trend Characterization vs. Numerical Interpolation
5.5.3. Analysis of Statistical Proximity Effects Under High Spatial Variance
5.5.4. Structural Constraints as Regularizers
5.5.5. R2 as a Measure of Structural Information Extraction
5.5.6. Operational Viability and Geological Integrity
5.6. Production Reconciliation
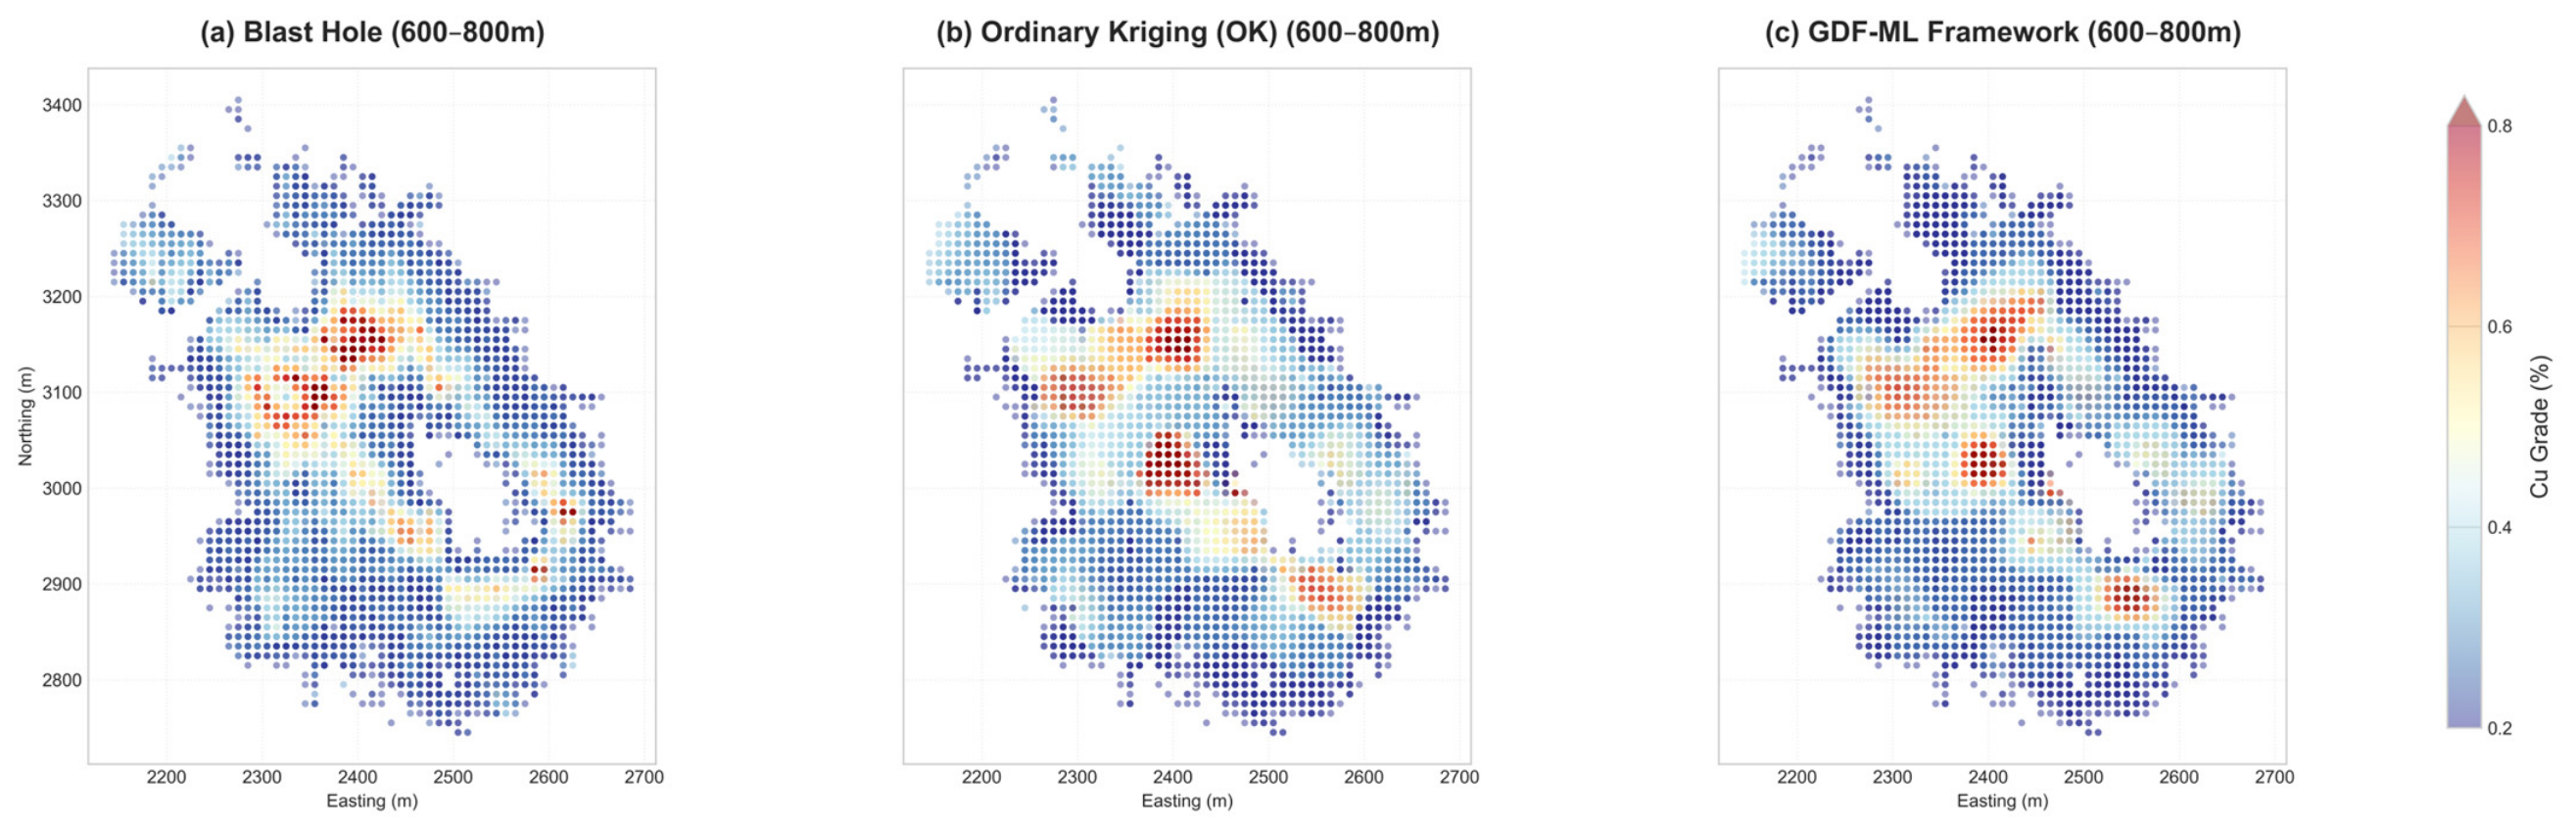
5.6.1. Operational Validation of Spatial Patterns
5.6.2. Morphological Fidelity and Spatial Patterns
5.6.3. Quantitative Analysis of Resource Reliability
5.6.4. Impacts of Anisotropy on Estimation Bias
5.7. The Role of Expert Knowledge
5.7.1. Structural Encoding of Geological Expertise
5.7.2. Inference and Validation of Structural Frameworks
5.7.3. Explainable AI (XAI) as a Diagnostic Interface
5.8. Boundary Conditions and Practical Applicability of the GDF-ML Framework
6. Conclusions
Funding
Data Availability Statement
Acknowledgments
Conflicts of Interest
Abbreviations
| GDF-ML | Geological Distance Field–Machine Learning |
| SDF | Signed Distance Field |
References
- Sillitoe, R.H. Porphyry Copper Systems. Econ. Geol. 2010, 105, 3–41. [Google Scholar] [CrossRef]
- Afzal, P.; Alghalandis, Y.F.; Khakzad, A.; Moarefvand, P.; Omran, N.R. Delineation of mineralization zones in porphyry Cu deposits by fractal concentration–volume modeling. J. Geochem. Explor. 2011, 108, 220–232. [Google Scholar] [CrossRef]
- James, C.; David, R.C.; John, L.W.; Holly, S. Geology, Mineralization, Alteration, and Structural Evolution of the El Teniente Porphyry Cu-Mo Deposit. Econ. Geol. 2005, 100, 979–1003. [Google Scholar] [CrossRef]
- Lewis, B.G.; Jorge, Q.G. Patterns of Mineralization and Alteration Below the Porphyry Copper Orebody at El Salvador, Chile. Econ. Geol. 1995, 90, 2–16. [Google Scholar] [CrossRef]
- Liu, H.; Wang, Q.; Zhang, C.; Lou, D.; Zhou, Y.; He, Z. Spatial pattern and dynamic control for mineralization in the Pulang porphyry copper deposit, Yunnan, SW China: Perspective from fractal analysis. J. Geochem. Explor. 2016, 164, 42–53. [Google Scholar] [CrossRef]
- Cressie, N. Spatial Prediction and Ordinary Kriging. Math. Geol. 1988, 20, 405–421. [Google Scholar] [CrossRef]
- Yamamoto, J.K. Correcting the Smoothing Effect of Ordinary Kriging Estimates. Math. Geol. 2005, 37, 69–94. [Google Scholar] [CrossRef]
- Emery, X.; Ortiz, J.M. Estimation of Mineral Resources Using Grade Domains: Critical Analysis and a Suggested Methodology. J. South. Afr. Inst. Min. Metall. 2005, 105, 247–256. [Google Scholar]
- Maleki, M.; Mery, N.; Soltani-Mohammadi, S.; Plaza-Carvajal, J.; Varouchakis, E.A. Integrating Geological Domains into Machine Learning for Ore Grade Prediction: A Case Study from a Porphyry Copper Deposit. Minerals 2025, 15, 1175. [Google Scholar] [CrossRef]
- Hong, J.; Khalil, Y.S.; Narejo, A.A.; Yang, X.; Khan, T.; Wang, Z.; Tang, H.; Zhang, H.; Yang, B.; Li, W. Magmatic Evolution at the Saindak Cu-Au Deposit: Implications for the Formation of Giant Porphyry Deposits. Minerals 2025, 15, 768. [Google Scholar] [CrossRef]
- Wang, L.; Zheng, Y.; Hou, Z.; Xue, C.; Yang, Z.; Shen, Y.; Li, X.; Ghaffar, A. The subduction-related Saindak porphyry Cu-Au deposit formed by remelting of a thickened juvenile lower crust underneath the Chagai belt, Pakistan. Ore Geol. Rev. 2022, 149, 105062. [Google Scholar] [CrossRef]
- Rose, A.W. Zonal Relations of Wallrock Alteration and Sulfide Distribution at Porphyry Copper Deposits. Econ. Geol. 1970, 65, 920–936. [Google Scholar] [CrossRef]
- Sillitoe, R.H. The Tops and Bottoms of Porphyry Copper Deposits. Econ. Geol. 1973, 68, 799–815. [Google Scholar] [CrossRef]
- Basson, I.J.; Anthonissen, C.J.; McCall, M.J.; Stoch, B.; Britz, J.; Deacon, J.; Strydom, M.; Cloete, E.; Botha, J.; Bester, M.; et al. Ore-structure relationships at Sishen Mine, Northern Cape, Republic of South Africa, based on fully-constrained implicit 3D modelling. Ore Geol. Rev. 2017, 86, 825–838. [Google Scholar] [CrossRef]
- Wang, J.; Zhao, H.; Bi, L.; Wang, L. Implicit 3D Modeling of Ore Body from Geological Boreholes Data Using Hermite Radial Basis Functions. Minerals 2018, 8, 443. [Google Scholar] [CrossRef]
- Oleynikova, H.M.; Alexander; Taylor, Z.; Galceran, E.; Nieto, J.; Siegwart, R. Signed Distance Fields: A Natural Representation for Both Mapping and Planning. In Proceedings of the RSS 2016 Workshop: Geometry and Beyond—Representations, Physics, and Scene Understanding for Robotics, Ann Arbor, MI, USA, 19 June 2016. [Google Scholar]
- Zhang, J.Y.; Yao, Q.L. Learning Signed Distance Field for Multi-View Surface Reconstruction. In Proceedings of the IEEE/CVF International Conference on Computer Vision (ICCV), Virtually, 11–17 October 2021; pp. 6525–6534. [Google Scholar]
- Jeong Joon, P.P.; Florence; Julian, S.; Richard, N.; Steven, L. DeepSDF: Learning Continuous Signed Distance Functions for Shape Representation. In Proceedings of the IEEE/CVF Conference on Computer Vision and Pattern Recognition (CVPR), Long Beach, CA, USA, 16–20 June 2019; pp. 165–174. [Google Scholar]
- Rolo, R.M.; Radtke, R.; Costa, J.F.C.L. Signed distance function implicit geologic modeling. REM-Int. Eng. J. 2017, 70, 221–229. [Google Scholar] [CrossRef]
- Leo, B. Random Forests. Mach. Learn. 2001, 45, 5–32. [Google Scholar]
- Chen, T.; Guestrin, C. XGBoost. In Proceedings of the 22nd ACM SIGKDD International Conference on Knowledge Discovery and Data Mining, San Francisco, CA, USA, 13–17 August 2016; pp. 785–794. [Google Scholar]
- Zhang, P.; Jia, Y.; Shang, Y. Research and application of XGBoost in imbalanced data. Int. J. Distrib. Sens. Netw. 2022, 18, 15501329221106935. [Google Scholar] [CrossRef]
- Liudmila, P.; Gleb, G.; Aleksandr, V.; Anna Veronika, D.; Andrey, G. CatBoost: Unbiased boosting with categorical features. In Proceedings of the 32nd Conference on Neural Information Processing Systems (NeurIPS 2018), Montréal, QC, Canada, 2–8 December 2018. [Google Scholar]
- Rodríguez, P.; Bautista, M.A.; Gonzàlez, J.; Escalera, S. Beyond one-hot encoding: Lower dimensional target embedding. Image Vis. Comput. 2018, 75, 21–31. [Google Scholar] [CrossRef]
- Akiba, T.; Sano, S.; Yanase, T.; Ohta, T.; Koyama, M. Optuna. In Proceedings of the 25th ACM SIGKDD International Conference on Knowledge Discovery & Data Mining, Anchorage, AK, USA, 4–8 August 2019; pp. 2623–2631. [Google Scholar]
- Watanabe, S. Tree-Structured Parzen Estimator: Understanding Its Algorithm Components and Their Roles for Better Empirical Performance. arXiv 2023, arXiv:2304.11127. [Google Scholar] [CrossRef]
- Eyal, W. The Shapley Value. In Handbook of Garne Theory, Volume 3; North-Holland: Amsterdam, The Netherlands, 2002; pp. 2027–2054. [Google Scholar]
- Zhang, M.; Wang, X.; Chen, C.; Ding, J.; Zhou, X.; Qu, J. Interpretable ore classification using SHAP-enhanced LightGBM: A case study from the Qiaomaishan deposit, China. Appl. Comput. Geosci. 2025, 28, 100295. [Google Scholar] [CrossRef]
- Chen, Y.; Chen, B.; Shayilan, A. Combining categorical boosting and Shapley additive explanations for building an interpretable ensemble classifier for identifying mineralization-related geochemical anomalies. Ore Geol. Rev. 2024, 173, 106263. [Google Scholar] [CrossRef]
- Jairo, M.-A.; Marco, C.-T.; Jose, M.-Q.; Eduardo, N.-V.; Juan, V.-G.; Juan, C.-G. Copper Ore Grade Prediction using Machine Learing Techniques in a Copper Deposit. J. Min. Environ. 2024, 15, 1011–1027. [Google Scholar] [CrossRef]
- Jafrasteh, B.; Fathianpour, N.; Suárez, A. Comparison of machine learning methods for copper ore grade estimation. Comput. Geosci. 2018, 22, 1371–1388. [Google Scholar] [CrossRef]
- Kaplan, U.E.; Dagasan, Y.; Topal, E. Mineral grade estimation using gradient boosting regression trees. Int. J. Min. Reclam. Environ. 2021, 35, 728–742. [Google Scholar] [CrossRef]
- Kaplan, U.E.; Topal, E. A New Ore Grade Estimation Using Combine Machine Learning Algorithms. Minerals 2020, 10, 847. [Google Scholar] [CrossRef]
- Maniteja, M.; Samanta, G.; Gebretsadik, A.; Tsae, N.B.; Rai, S.S.; Fissha, Y.; Okada, N.; Kawamura, Y. Advancing Iron Ore Grade Estimation: A Comparative Study of Machine Learning and Ordinary Kriging. Minerals 2025, 15, 131. [Google Scholar] [CrossRef]





| Model | R2_5-Fold CV | Full_Data_R2 | Best_Params |
|---|---|---|---|
| Random Forest | 0.868 | 0.940 | n_estimators: 729, max_depth: 17, min_samples_leaf: 5 |
| CatBoost | 0.849 | 0.913 | iterations: 1178, depth: 4, learning_rate: 0.0197 |
| XGBoost | 0.854 | 0.916 | n_estimators: 1500, max_depth: 3, learning_rate: 0.0101, subsample: 0.688 |
| Model | R2_2-Fold CV | Full_Data_R2 | Best_Params |
|---|---|---|---|
| Random Forest | 0.872 | 0.940 | n_estimators: 489, max_depth: 13, min_samples_leaf: 4 |
| CatBoost | 0.846 | 0.905 | iterations: 743, depth: 4, learning_rate: 0.0229 |
| XGBoost | 0.844 | 0.932 | n_estimators: 1040, max_depth: 4, learning_rate: 0.0132, subsample: 0.679 |
| Model | R2_2-Fold CV | Full_Data_R2 | Best_Params |
|---|---|---|---|
| Random Forest | 0.867 | 0.918 | n_estimators: 512, max_depth: 8, min_samples_leaf: 4 |
| CatBoost | 0.841 | 0.945 | iterations: 968, depth: 7, learning_rate: 0.0323 |
| XGBoost | 0.838 | 0.915 | n_estimators: 518, max_depth: 8, learning_rate: 0.0287, subsample: 0.800 |
| Model | R2_2-Fold CV | Full_Data_R2 | Best_Params |
|---|---|---|---|
| Random Forest | 0.851 | 0.925 | n_estimators: 994, max_depth: 10, min_samples_leaf: 5 |
| CatBoost | 0.788 | 0.966 | iterations: 998, depth: 9, learning_rate: 0.0428 |
| XGBoost | 0.819 | 0.906 | n_estimators:880, max_depth: 3, learning_rate: 0.0114, subsample: 0.802 |
| Model Type | Mean Grade (Cu %) | Tonnage (t) | Grade Bias (vs. Actual) |
|---|---|---|---|
| blast-hole | 0.376 | 70,475,600 | — |
| Ordinary Kriging (OK) | 0.413 | 72,922,200 | +9.68% |
| GDF-ML Framework | 0.379 | 73,265,400 | +0.79% |
Disclaimer/Publisher’s Note: The statements, opinions and data contained in all publications are solely those of the individual author(s) and contributor(s) and not of MDPI and/or the editor(s). MDPI and/or the editor(s) disclaim responsibility for any injury to people or property resulting from any ideas, methods, instructions or products referred to in the content. |
© 2026 by the author. Licensee MDPI, Basel, Switzerland. This article is an open access article distributed under the terms and conditions of the Creative Commons Attribution (CC BY) license.
Share and Cite
Yan, L. A Robust GDF-ML Framework for Dynamic Grade Modeling: Adaptive Resource Estimation in Complex Porphyry Systems. Minerals 2026, 16, 573. https://doi.org/10.3390/min16060573
Yan L. A Robust GDF-ML Framework for Dynamic Grade Modeling: Adaptive Resource Estimation in Complex Porphyry Systems. Minerals. 2026; 16(6):573. https://doi.org/10.3390/min16060573
Chicago/Turabian StyleYan, Liwei. 2026. "A Robust GDF-ML Framework for Dynamic Grade Modeling: Adaptive Resource Estimation in Complex Porphyry Systems" Minerals 16, no. 6: 573. https://doi.org/10.3390/min16060573
APA StyleYan, L. (2026). A Robust GDF-ML Framework for Dynamic Grade Modeling: Adaptive Resource Estimation in Complex Porphyry Systems. Minerals, 16(6), 573. https://doi.org/10.3390/min16060573