Article

Petrological Characteristics, Pore Structures, and Diagenetic Models of Slump-Type Gravity-Flow Deposits in the Jiufotang Formation, Naiman Sag, China

1
School of Earth Sciences, Northeast Petroleum University, Daqing 163318, China
2
National Key Laboratory for Multi-Resources Collaborative Green Production of Continental Shale Oil, Daqing 163712, China
*
Author to whom correspondence should be addressed.
Minerals 2026, 16(6), 569; https://doi.org/10.3390/min16060569
Submission received: 9 March 2026 / Revised: 17 May 2026 / Accepted: 21 May 2026 / Published: 25 May 2026
(This article belongs to the Section Mineral Exploration Methods and Applications)

Abstract

Slump-type gravity-flow deposits are extensively developed in the Jiufotang Formation of the Naiman Sag, representing a core frontier for deep-water subtle hydrocarbon reservoir exploration. However, these deposits exhibit strong internal reservoir heterogeneity, while their diagenetic mechanisms are complex and their development pattern remains unclear. Integrating macroscopic and microscopic investigation of cores, scanning electron microscopy (SEM), micro-CT, and high-pressure mercury injection capillary pressure (MICP) data, a systematic study was conducted on the petrological characteristics and diagenesis of the gravity-flow reservoirs. The results indicate that the lithology is dominated by feldspathic lithic sandstones with low compositional maturity. The present-day reservoir quality is governed by the high spatiotemporal coupling between deposition and burial diagenesis. Compaction is the absolute dominant diagenetic factor driving the densification of these reservoirs. The strong compaction resistance, derived from a low argillaceous matrix content and a well-developed grain-supported framework, is the key to the formation of high-quality reservoirs. Furthermore, three distinct diagenetic pathways are revealed: the “high-energy freezing—rigid pore preservation” pathway controls the development of high-quality exploration sweet spots; the “shear mixing—plastic pore reduction” pathway forms low-permeability transitional reservoirs; and the “viscous suspension—compaction densification” pathway indicates widespread tight sandstone exploration targets.

1. Introduction

Deep-water slump-type gravity-flow deposits not only record the dynamic processes of sediment transport from basin margins to deep-water areas, but also represent a core frontier in current global deep-water hydrocarbon and unconventional subtle reservoir exploration within continental rift basins [1,2,3,4]. With the continuous deepening of exploration, the search for high-quality reservoirs (i.e., “sweet spots”) with economies of scale has become a critical bottleneck restricting hydrocarbon exploration in gravity-flow deposits. However, the proximal and rapid accumulation characteristics [5,6,7] of slump-type gravity flows lead to complex internal rheology (e.g., sliding, slump deformation, debris flows, and localized turbidity currents). Such rapid flow transformations lead to intense heterogeneity within the deposits, manifesting at both the macroscopic facies scale and in microscopic pore-throat networks.
In recent years, the sedimentary processes, fluid transformation mechanisms, and macroscopic depositional models of deep-water gravity flows have been widely studied, significantly advancing sedimentological theories [8,9,10,11,12,13]. Nevertheless, research on the controlling factors of gravity-flow reservoir quality is often limited to either single macroscopic qualitative descriptions of sedimentary microfacies or isolated microscopic analyses of diagenesis [14,15]. There is still a lack of systematic and in-depth quantitative characterization and theoretical models regarding the linkage between depositional processes, initial fabric, and diagenesis. Specifically, it remains unclear how rheological dynamics shape the initial petrophysical fabric, which then serves as a physical template to regulate subsequent differential diagenetic trajectories. These processes ultimately determine the present-day differentiation of reservoir quality. This fragmentation in theoretical understanding severely restricts the accurate prediction of high-quality reservoirs within complex gravity-flow systems.
Similar to typical continental rift lake basins in eastern China during the Early Cretaceous, such as the Luanping Basin, Bohai Bay Basin, and Fuxin Basin [16,17,18,19,20], the depositional models and basin-fill characteristics of the Naiman Sag are representative of such lacustrine basins. During the intense rifting period of the Early Cretaceous, proximal slump-type gravity-flow deposits of the Jiufotang Formation, controlled by faults and paleotopography, were extensively developed in the western steep slope zone. The deep-water gravity-flow sand bodies exhibit excellent hydrocarbon potential, as demonstrated by petrophysical and geochemical data. The average porosity in some intervals reaches up to 15.1%, with physical properties significantly superior to conventional fan-delta front sand bodies. Tens of millions of tons of reserves have been proven, and commercial oil flows have been achieved. However, due to drastic facies changes and complex deep-burial diagenetic modifications of the gravity flows, conventional high-quality reservoirs and tight sandstone reservoirs are highly interwoven. The genesis of sweet spots remains ambiguous, and their distribution patterns are unclear, which severely limits the exploration success rate.
In light of the mentioned facts, focusing on the slump-type gravity-flow reservoirs of the Jiufotang Formation in the Naiman Sag, this study comprehensively utilizes cross-scale analytical techniques, including core observation, casting thin sections, scanning electron microscopy (SEM), micro-CT, and high-pressure mercury injection capillary pressure (MICP). A dual-scale evaluation logic of “macroscopic sedimentary microfacies—microscopic lithofacies” is introduced. The purpose is to systematically dissect the lithofacies characteristics, pore-throat structures, and diagenesis patterns of the reservoirs, to ascertain the innate control of flow transformations on rock fabrics and the acquired modification mechanisms of differential diagenesis on reservoir quality, and ultimately to construct a multi-dimensional coupled reservoir development model of “fluid-fabric-diagenesis”. This research not only helps to deepen the theoretical understanding of the genetic mechanisms of deep-water gravity-flow reservoirs in rift lake basins, but also provides a solid geological basis for exploring high-quality sweet-spot hydrocarbon resources in similar basins.

2. Regional Geological Setting

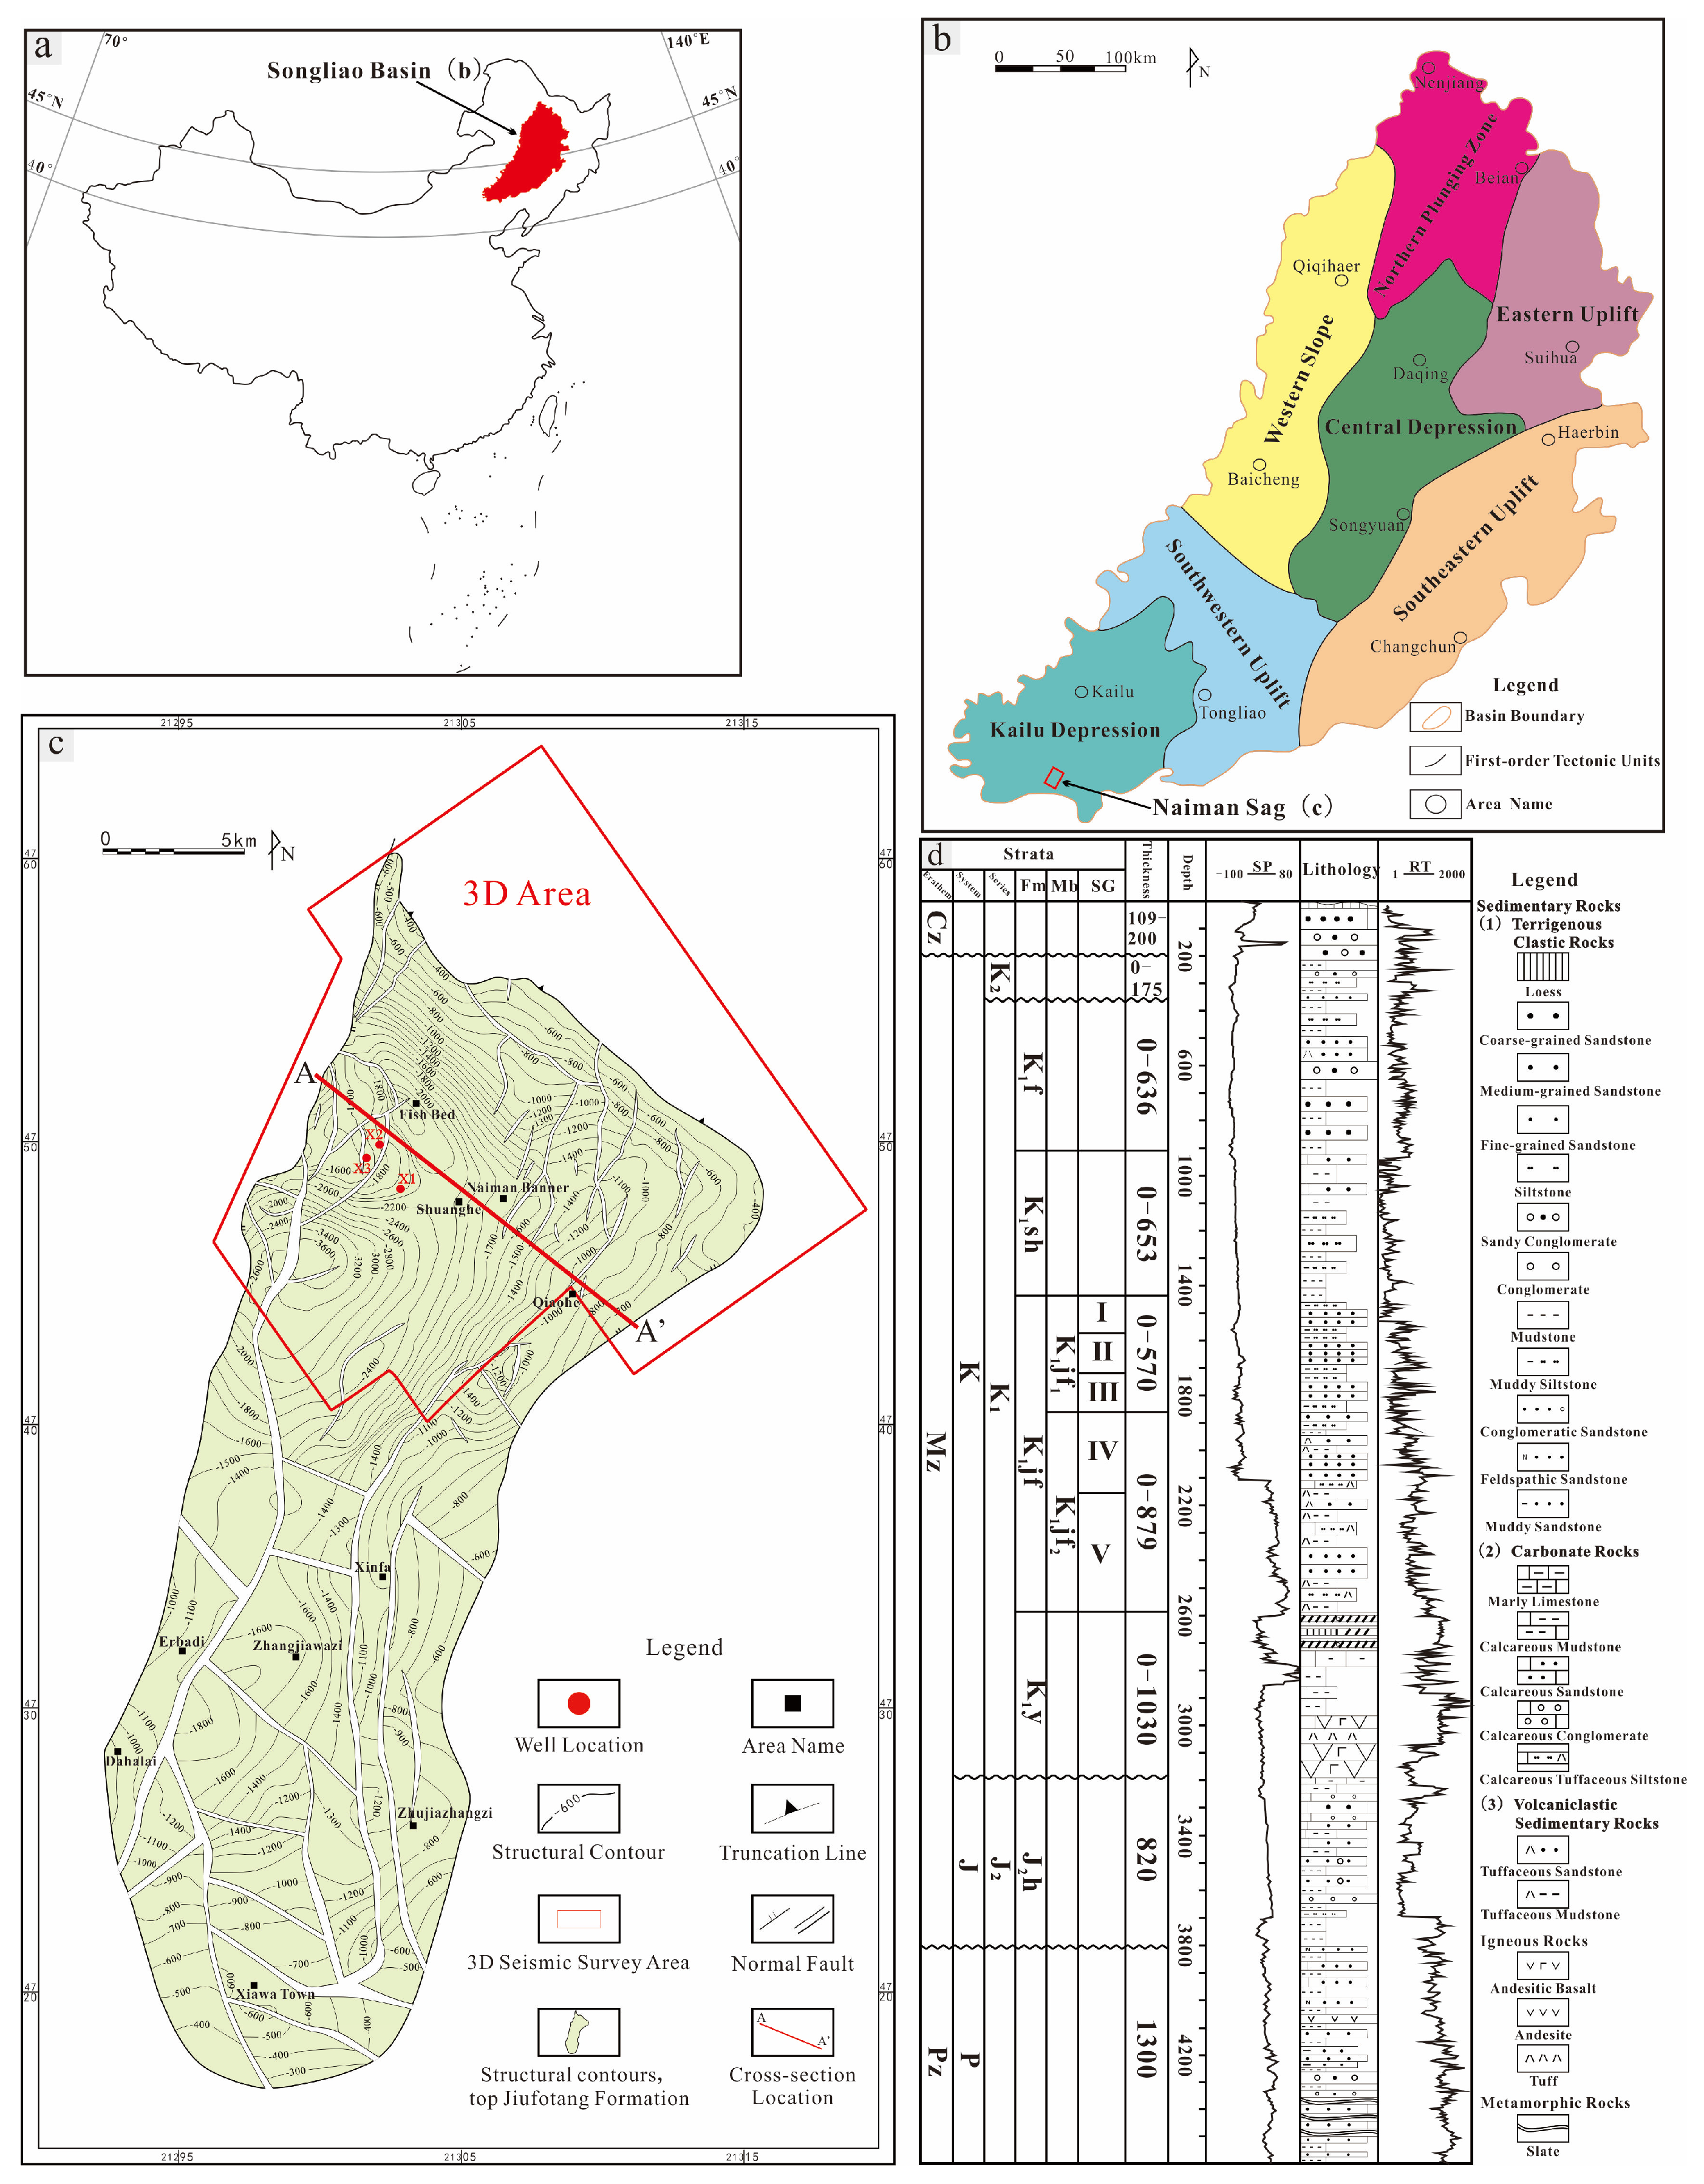
The Naiman Sag is a secondary negative structural unit located in the southwestern part of the Kailu Basin, which itself occupies the southwestern region of the Songliao Basin, generally extending as a narrow, elongated belt in a north-northeast (NNE) direction [21,22]. The formation and development of the sag were governed by boundary faults, primarily controlled by the fault system developed from the early stage of the Jiufotang Formation to the late stage of the Fuxin Formation. The study area of this paper is located in the northern part of the Naiman Sag, covered by a 3D seismic survey, with an area of approximately 450 km2 (Figure 1a). Regionally, the Kailu Basin is a continental volcanic basin. Combined with previous regional geological studies and well data in the Naiman Sag, it is evident that the strata are fully developed and well preserved. From bottom to top, the strata consist successively of the Paleozoic Permian basement, the Middle Jurassic Haifanggou Formation (J2h), the Lower Cretaceous Yixian Formation (K1y), Jiufotang Formation (K1jf), Shahai Formation (K1sh), and Fuxin Formation (K1f), as well as the Upper Cretaceous (K2) and the Cenozoic Neogene and Quaternary strata (Figure 1b). The depositional models and basin-fill characteristics of the Naiman Sag during the Early Cretaceous are highly representative among continental rift lake basins in China.
During the Early Cretaceous, driven by the plate-scale tectonic movement of the Izanagi Plate subducting beneath the Eurasian continent, a back-arc extensional environment formed along the eastern margin of the Asian continent. The regional stress field was characterized by NW–SE regional rift extension. Under this stress regime, a series of NNE–, NE–, and nearly E–W–trending normal faults developed within the Naiman Sag. The sag generally exhibits an asymmetric half-graben structure (steep in the west and gentle in the east), characterized by a structural framework that is shallow on the eastern and western flanks and deep in the center. Based on the regional tectonic background and fault development characteristics, the sag can be divided into three secondary structural units: the western steep slope zone, the central depression zone, and the eastern gentle slope zone. Basement faults had already been initially reactivated during the Late Jurassic, and the extensional stress continued to intensify during the Early Cretaceous, governing fault activity and paleogeographic differentiation of the basin, thus establishing the tectonic foundation for the sedimentary infill of the rift lake basin [23,24].
As a typical Mesozoic rift basin, it is characterized by strong coupling among tectonics, sedimentation, and sequence development. The depression formed in a Yanshanian extensional tectonic setting, with distinct sequence boundaries and stratigraphic patterns that fully conform to the classic tectono-sedimentary model of rift basins. The sedimentary system is dominated by fan-delta and lacustrine facies, with high-quality source rocks developed, and the sedimentary records clearly reflect the greenhouse climate fluctuations of the Early Cretaceous. Compared with typical rift basins such as the Erlian Basin, Songliao Basin, and Bohai Bay Basin, it not only shares common characteristics of tectonic control on basin development and climatic control on facies, but also, due to its simple structural style, moderate rift intensity, and well-preserved source rocks, allows a dissection of the lake basin’s developmental history. It is an ideal case study for investigating the tectonic-sedimentary coupling relationship in Mesozoic rift basins. Especially during the intense rifting period, the severe tectonic activity resulted in diverse sedimentary systems and complex filling characteristics, providing an important sedimentary archive and ample space for sedimentological studies of rift basins [25,26,27,28,29].

3. Data and Methods

3.1. Background of Sample Selection

The target unit of this study is the Jiufotang Formation. The Lower Cretaceous sequence is the hydrocarbon-bearing system, within which the Jiufotang Formation overlaps the underlying Yixian Formation and has a wide areal distribution. During the deposition of the target stratum, the rift subsidence rate of the sag accelerated, resulting in abundant sediment supply and sufficient accommodation space. These conditions formed a favorable configuration, leading to the extensive development of steep-slope fan-delta deposits in the west. The stratum possesses the attributes of a source-reservoir integrated system, representing not only considerable hydrocarbon generation potential but also the primary reservoir sequence within the sag. Meanwhile, the Jiufotang Formation is a cored interval, from which direct core analysis data can be obtained, facilitating subsequent research work.
Wells X1, X2, and X3 were selected as the primary research wells for this study (Figure 1a). The core rationales are: first, the target intervals penetrated by these three wells are all located within the slump-type gravity flow depositional area of the western slope zone; second, core observations indicate that the target intervals develop thick sections of sedimentary structures and lithological associations with typical characteristics of slump-type gravity flows, providing direct physical data support for the study.

3.2. Research Methods

This study comprehensively utilizes multiple techniques, including core observation, optical microscopy, scanning electron microscopy (SEM), X-ray diffraction (XRD), high-pressure mercury injection capillary pressure (MICP), micro/nano-CT scanning, and physical property testing, to conduct a cross-scale systematic characterization of the macroscopic sedimentary characteristics and microscopic pore structures of the slump-type gravity-flow reservoirs in the Jiufotang Formation of the Naiman Sag.
(1) Detailed core description
Based on the core data from the cored intervals, detailed core observation and description were carried out. By identifying color, lithology, grain size variations, and typical gravity flow sedimentary structures (e.g., slump folds, massive bedding), sedimentary units were divided, and sedimentary microfacies types were determined. Simultaneously, macroscopic physical property trends and the development of cementation and fractures were observed, providing a macroscopic geological basis for subsequent microscopic sampling and analysis.
(2) Petrographic observation of thin sections
An Olympus BX53 optical microscope (Olympus Corporation, Tokyo, Japan) was used to observe conventional and casting thin sections. Conventional thin sections were used to identify mineral components, textural characteristics (sorting, rounding), and grain contact relationships to determine rock types and compositional maturity. Casting thin sections were used to visually identify reservoir space types, such as primary intergranular pores and secondary dissolution pores, and to statistically analyze the thin-section porosity and pore morphology, thereby revealing the control mechanisms of diagenesis on pore evolution.
(3) Physical property testing
Considering the wide variation of physical properties in slump-type gravity-flow reservoirs, adaptive testing methods were adopted. Porosity was uniformly tested using the helium porosity method via an UltraPore-200 porosimeter (Core Laboratories, Houston, TX, USA), utilizing the strong penetrability of helium molecules to accurately measure micro-pores. Permeability was tested using a PDP-200 pulse decay permeameter (Core Laboratories, Houston, TX, USA) with a gas medium, where the steady-state method was applied to medium-to-high permeability samples, and the pulse-decay method was used for low-permeability to tight samples, ensuring the accuracy and validity of the test data.
(4) High-pressure MICP testing
Representative core samples covering different lithofacies were selected for high-pressure mercury injection experiments using an AutoPore IV 9500 mercury porosimeter (Micromeritics Instrument Corporation, Norcross, GA, USA). The experimental measurement of pore-throat radii ranges from 0.003 μm to 1000 μm. This aims to quantitatively characterize the microscopic pore-throat size distribution and heterogeneity of the medium-to-low permeability reservoirs through capillary pressure curve characteristics and pore-throat parameters (e.g., displacement pressure, median radius, maximum mercury intrusion saturation).
(5) Whole-rock X-ray diffraction (XRD) analysis
A D8 Advance X-ray diffractometer (Bruker Corporation, Billerica, MA, USA) was used for whole-rock analysis of bulk rock samples. Through qualitative identification and quantitative calculation of diffraction patterns, the mineral composition and relative content of the reservoir rocks were accurately obtained. The focus was on identifying the types and contents of clay minerals (e.g., kaolinite, illite, chlorite) and carbonate cements, providing a mineralogical basis for diagenetic facies classification and reservoir sensitivity evaluation.
(6) Scanning electron microscopy (SEM)
A Quanta 200 scanning electron microscope (FEI Company, Hillsboro, OR, USA) was used for high-magnification observation of the microscopic surface morphology of the samples. The analysis focused on the crystal morphology and occurrence of clay minerals (pore-filling or grain-coating), as well as the secondary enlargement and dissolution characteristics of minerals such as quartz and feldspar. This reveals the mechanisms of cementation and dissolution on pore preservation and destruction at the microscopic scale.
(7) Micro-CT scanning
To overcome the limitations of 2D observation, a Zeiss Xradia 520 Versa Micro-CT (Carl Zeiss AG, Oberkochen, Germany) was employed for 3D non-destructive imaging of typical tight sandstone samples. This method aims to visually construct the 3D spatial topology of micro-scale pores and throats, and accurately quantify key parameters such as pore size distribution, coordination number, and connectivity using Avizo software version 2020.1 (Thermo Fisher Scientific, Waltham, MA, USA), effectively characterizing the complex microscopic pore-throat networks in low-porosity and low-permeability reservoirs.

4. Results

4.1. Reservoir Microfacies and Lithofacies

To accurately characterize the features and heterogeneity of slump-type gravity-flow reservoirs, this study adopts a facies-based workflow that integrates macroscopic sedimentary microfacies with microscopic lithofacies analysis in the reservoir evaluation system.

4.1.1. Sedimentary Microfacies and Spatial Distribution Characteristics

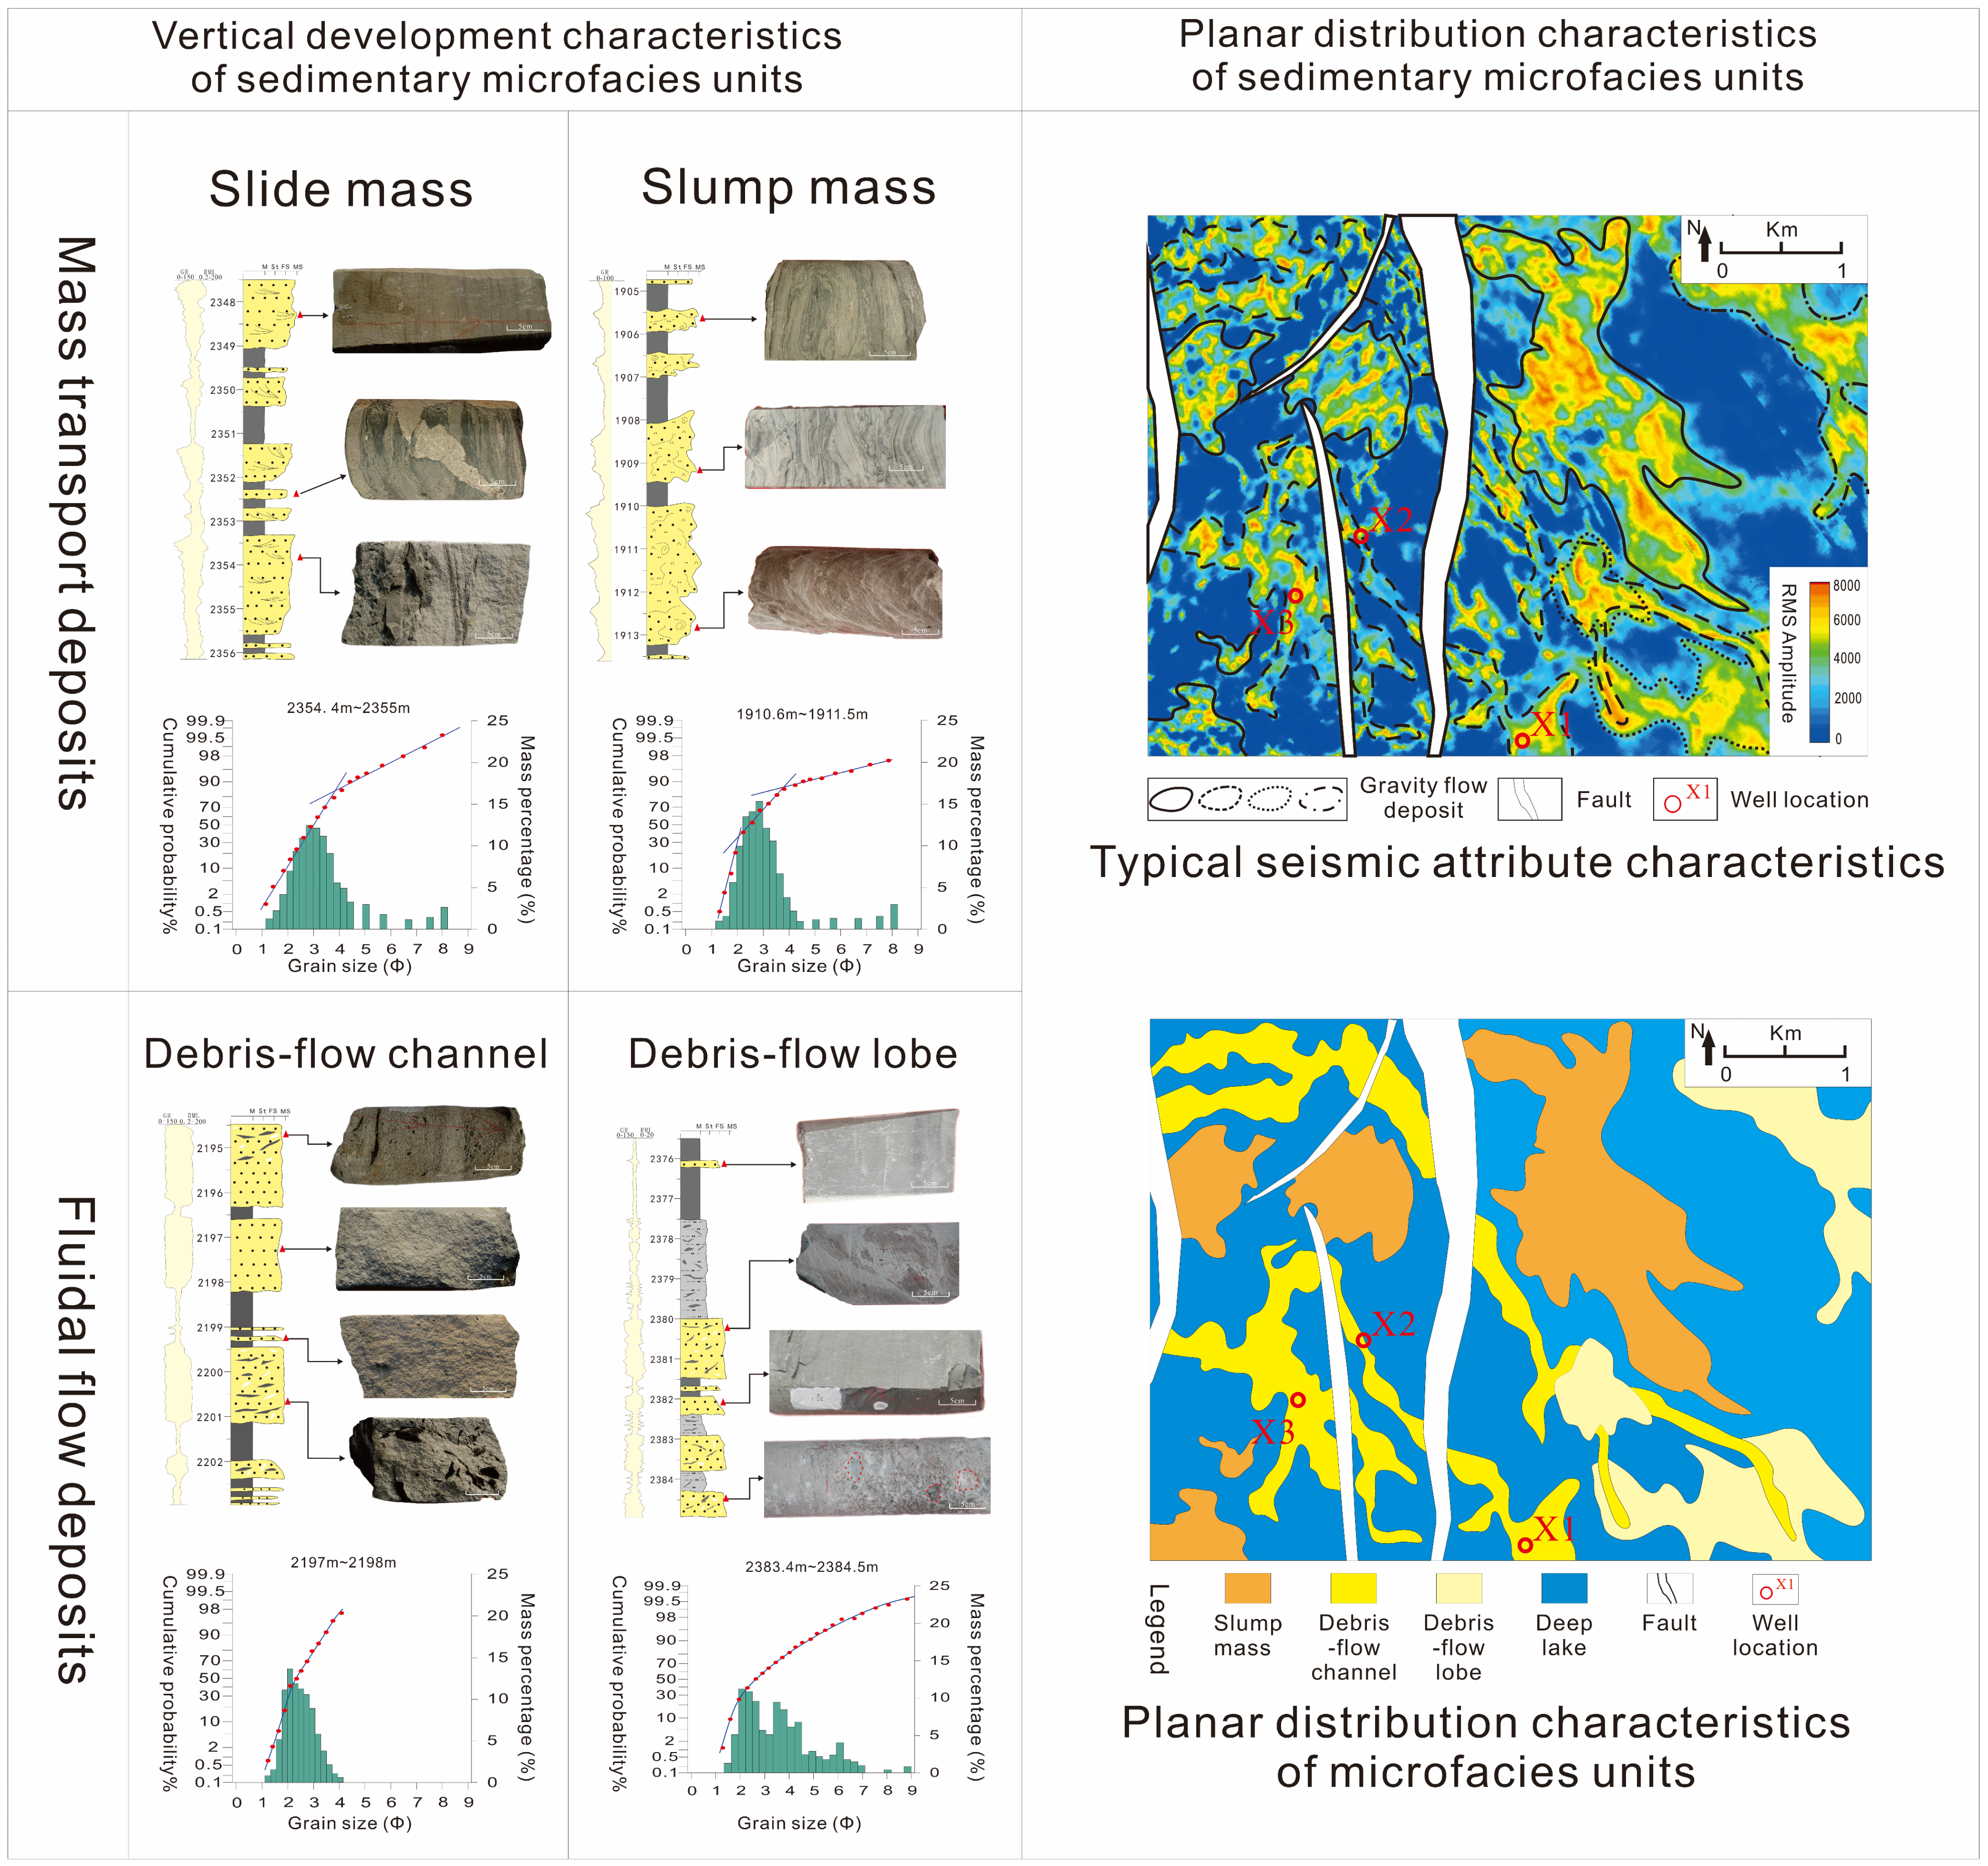
At the macroscopic scale, the gravity-flow deposits can be divided into two subfacies: mass-transport deposits and fluidal flow deposits. Among them, the mass-transport subfacies includes two microfacies: slide mass and slump mass. Slide deposits represent the initial transitional stage of block transport, in which the original sedimentary structures are partially preserved but accompanied by mild deformation and localized liquefaction. Slump deposits are products of subsequent instability and reworking, characterized by strong plastic deformation and complete bedding disruption. Together, they record the progression of gravity-driven displacement from mildly deformed sliding to strongly deformed slumping. The fluidal flow subfacies includes two microfacies: debris-flow channels and debris-flow lobes, which record fluid-dominated unloading processes driven by gravity (Table 1).
The vertical sedimentary sequences and planar distribution morphologies of the four core microfacies units with reservoir capacity are distinctively different (Figure 2):
(1) Slide mass: Slide deposits form during the initial gravitational displacement of unconsolidated sediments triggered by external events such as earthquakes or tsunamis, moving downward along a slip surface. In deltaic systems, such sliding frequently initiates at the delta front where sedimentation rates are high. Representing a transitional state between the stable delta front and fully collapsed slumps, these blocks experience partial liquefaction and mild shear during this early stage. Consequently, while the primary internal stratification remains generally recognizable, it typically exhibits mild deformation and localized fluid escape structures. Thus, acting as a transitional flow state, slide bodies generally indicate a short transport distance prior to complete collapse [30,31]. In terms of sedimentary characteristics, slide masses reflect their transitional nature. Rather than being entirely rigid, these sand bodies partially preserve the original traction-current features of the fan-delta front source area but are distinctly modified by the initial failure. The lithology is dominated by fine-grained sandstone. While primary structures such as cross-bedding are still recognizable, they are commonly accompanied by mild syn-sedimentary deformation and localized fluid-escape structures, such as sand dikes or blurred laminae, induced by earthquake-triggered liquefaction. Occasional thin muddy laminae intercalations are also observed. The top and bottom of the sand masses often display obvious, abrupt lithological contacts. The combination of the gamma-ray (GR) and resistivity curves (RML) displays a funnel-shaped pattern, which well inherits the coarsening-upward rhythm characteristics of the original mouth bars.
(2) Slump mass: With the intensification of liquefaction during transport, the sedimentary body collapses and undergoes strong internal deformation, and its planar distribution area can reach several square kilometers [32]. In terms of sedimentary characteristics, the lithology is dominated by argillaceous fine sandstone or muddy sandstone. Original sedimentary structures are difficult to preserve; instead, syn-sedimentary deformation structures such as deformed bedding and convolute bedding are widely developed. They are often associated with deep-water mudstones in a crumpled and mixed manner, with highly irregular interfaces [33]. Due to the extremely strong internal structural and lithological heterogeneity, the logging gamma-ray curves mostly exhibit complex serrated responses or composite funnel shapes.
(3) Debris-flow channel: In this study, debris-flow channels predominantly comprise sandy debris flows characterized by plastic rheology, where grains are transported in suspension. When the downslope gravity-driven shear stress falls below the yield strength, an en masse “freezing” deposition occurs, primarily driven by intergranular frictional locking. This mechanism is fundamentally distinct from the freezing deposition of slides, in which the original grain-to-grain positions have not yet had time to alter. On the plane, it extends towards the deep basin as meandering belts, serving as an important channel for sediment transport by gravity flows and acting as high-quality reservoirs [34]. In terms of sedimentary characteristics, single-stage channel sand bodies are thick and frequently superimposed over multiple stages. The internal filling is mainly composed of extremely thick, clean, massive medium-to-fine sandstones and massive sandstones containing mudstone rip-up clasts/floating gravels. The overall lithology is relatively pure with low argillaceous content. Logging curves mostly show a thick box-shaped combination with low gamma-ray and high resistivity, with minor curve fluctuations [35].
(4) Debris-flow lobe: It mainly develops at the terminus of debris-flow channels [34]. Friction between the fluid and the bed results in energy dissipation and concentrated sediment unloading, exhibiting a fan-shaped, large-area contiguous distribution on the plane. In terms of sedimentary characteristics, vertically, it is manifested as multi-stage superimpositions of frequent sand-mud interbeds, with small single-layer thicknesses. The lithology is complex and diverse, dominated by massive muddy sandstones and muddy sandstones with floating gravels/mud clasts, often intercalated with a small amount of thin-bedded turbidite sandstones with normal graded bedding or ripple cross-bedding. Logging curves mostly show reverse rhythm characteristics (inverse grading) or frequently superimposed small-amplitude box-shaped and finger-shaped curve combinations.

4.1.2. Characteristics of Dominant Reservoir Lithofacies

The microscopic reservoir properties are controlled by grain fabric and matrix content [36]. In slump-type gravity-flow deposits, the dominant lithofacies serves as a physical proxy for the sedimentary microfacies—its physical characteristics directly map the macroscopic reservoir behavior of the corresponding microfacies.
Based on core observations, this study identified five dominant sandstone lithofacies with effective reservoir capacity from four microfacies units, namely: clean massive sandstone (Scm), massive sandstone with floating gravels (Sfc), cross-bedded fine sandstone (Scb), deformed bedded muddy sandstone (MSdb), and muddy sandstone with floating gravels (MSfc). The specific characteristics of each dominant lithofacies are as follows:
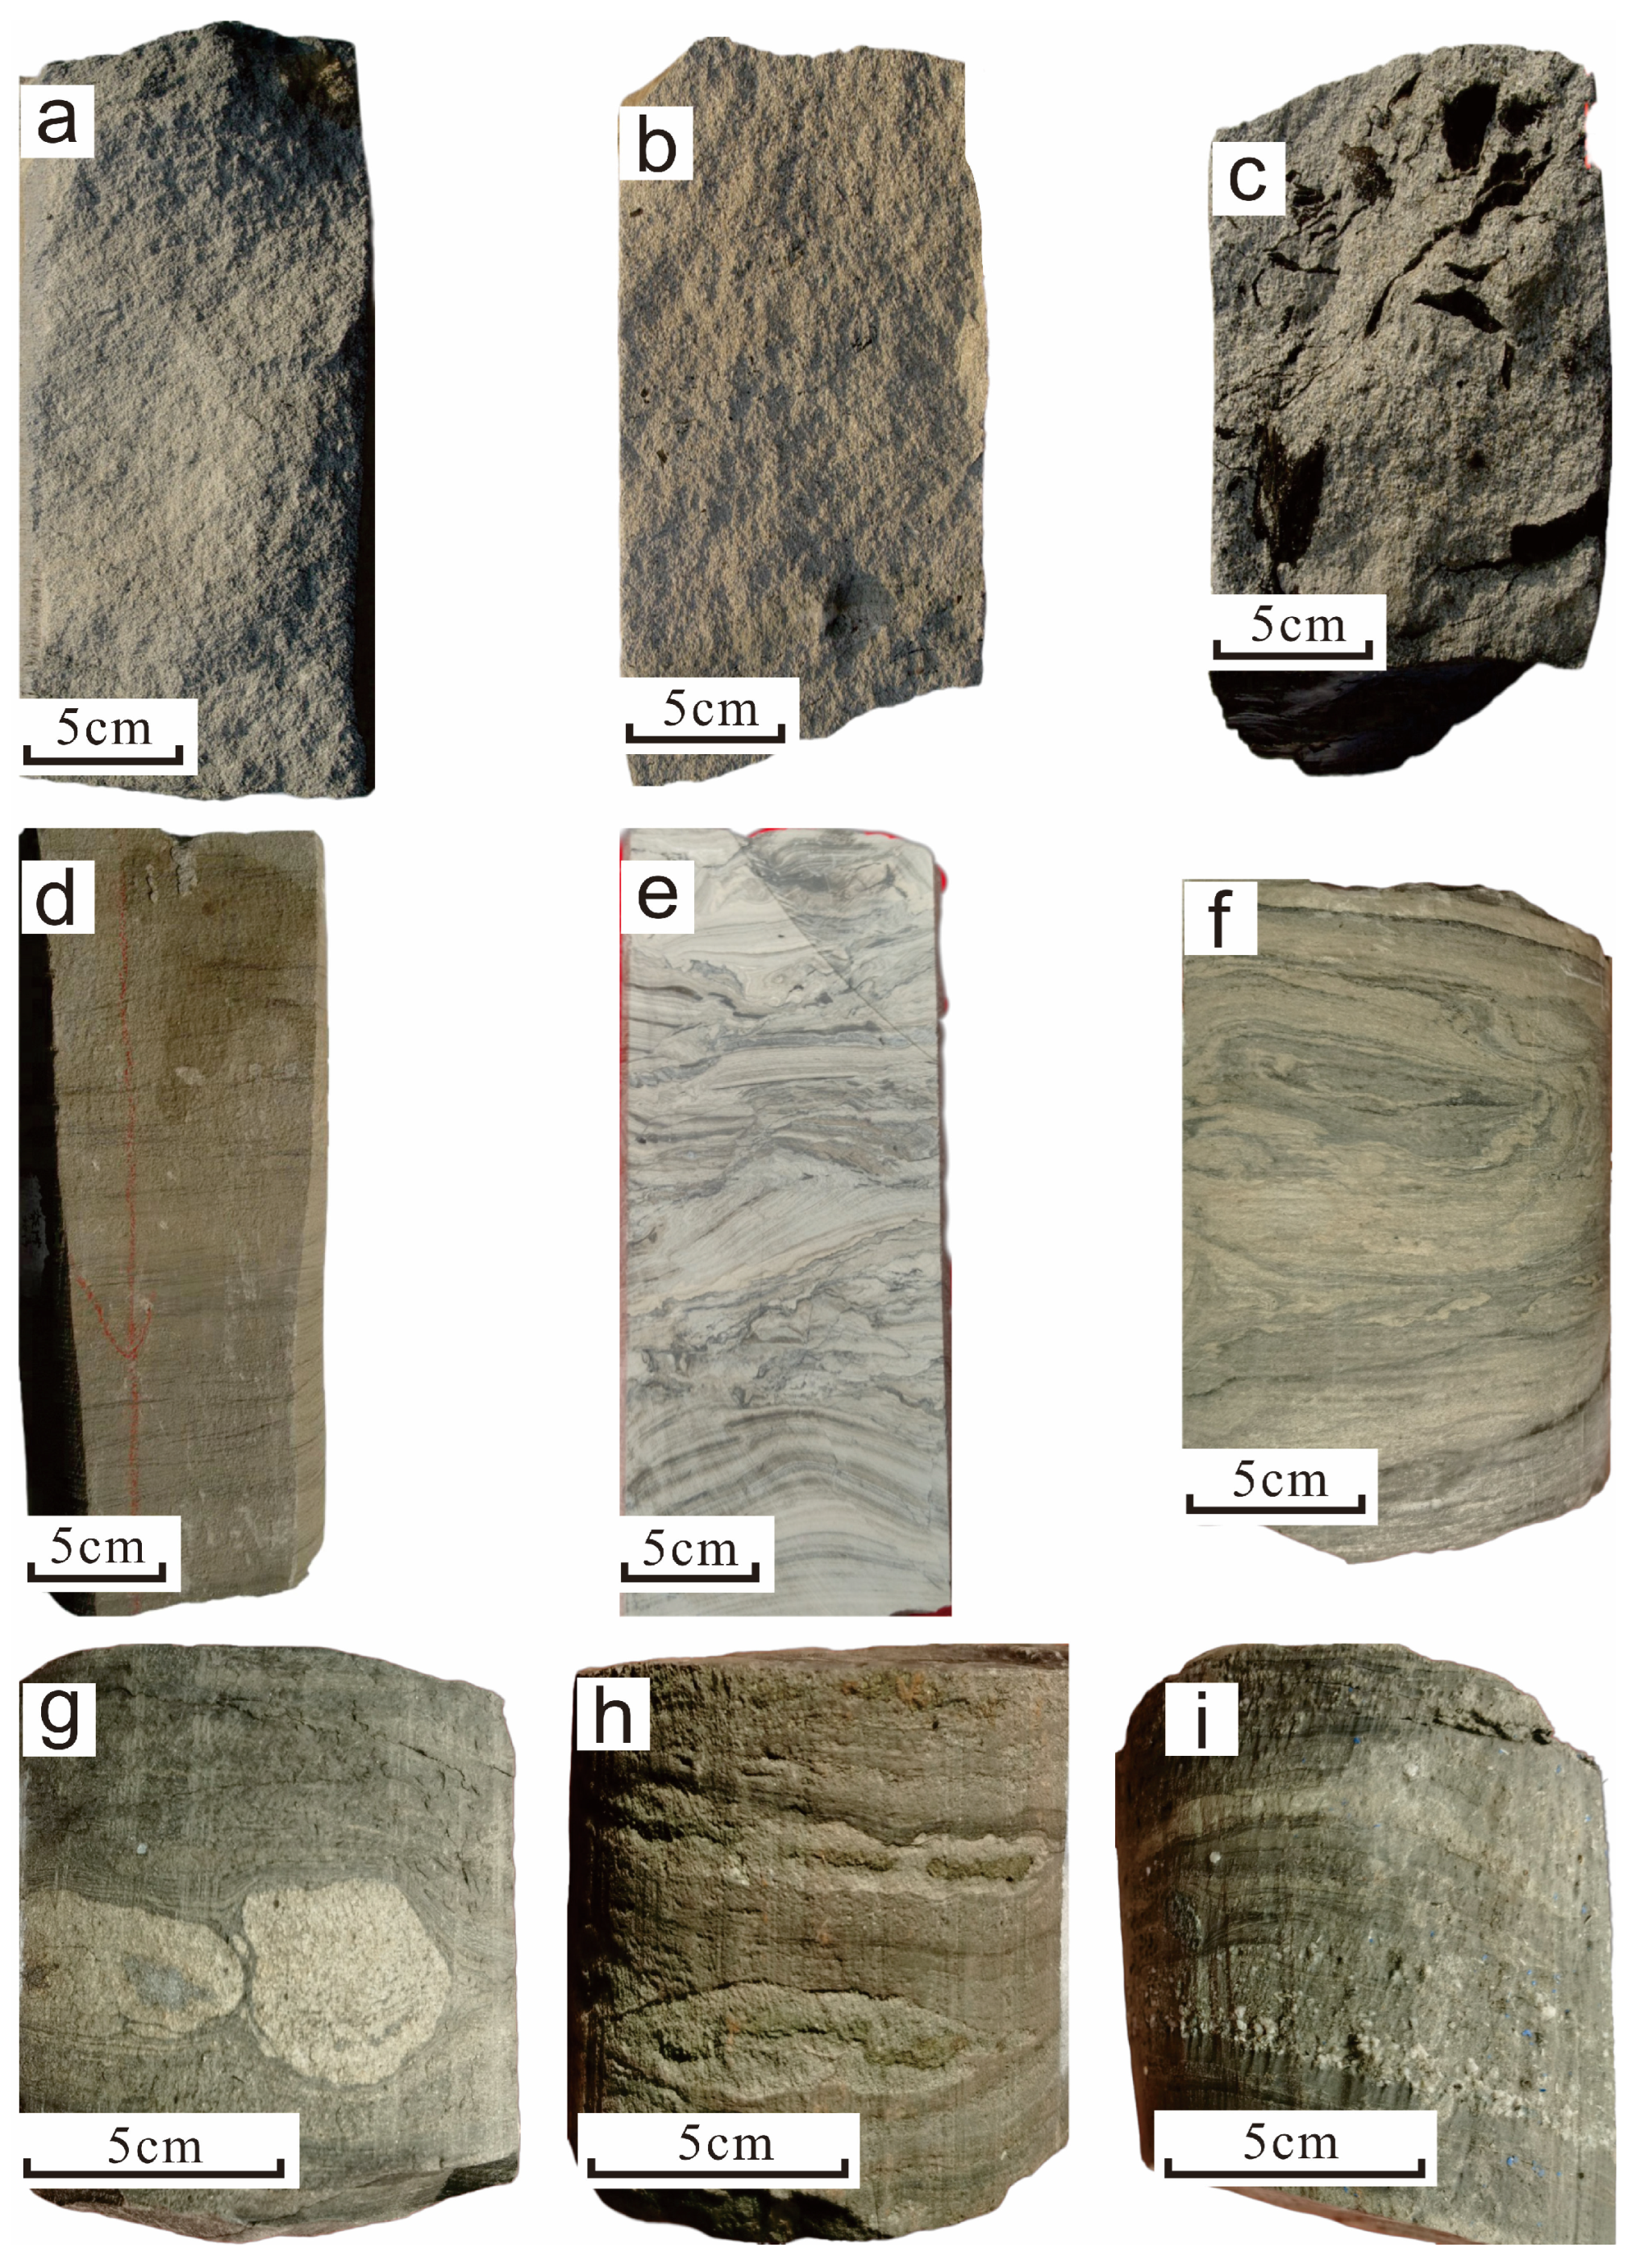
(1) Clean massive sandstone (Scm): This lithofacies is mainly composed of light-gray fine or medium sandstone, with grain sizes generally concentrated between 0.125 and 2 mm. It exhibits typical massive structures, without obvious vertical grain-size sequence variations. The sandstone generally has good sorting and low argillaceous content, usually less than 5% (Figure 3a,b). The extremely low argillaceous matrix content and good grain-supported framework indicate relatively high compositional and textural maturity, theoretically providing a superior material basis for the preservation of primary pores. This lithofacies is a typical diagnostic lithofacies of sandy debris flows.
(2) Massive sandstone with floating gravels (Sfc): This lithofacies is light-gray or dark-gray fine-to-medium sandstone with massive structures, containing floating debris such as muddy gravels, rip-up mudstone clasts, and sandy lumps. It is the most widely distributed lithofacies. Thin-section analysis shows that its matrix is dominated by silt (content 10%–25%) with low clay content. The floating debris ranges in size from <1 cm to >5 cm. The sandstone grains are mostly sub-rounded, while the muddy gravels are sub-rounded or torn. Their distribution can be parallel to bedding or random, with diverse intra-layer positions; some appear as “rafted clasts” floating at the top of the layer [37] (Figure 3c). The relatively clean sandy matrix provides the necessary fabric conditions for the formation of fluid seepage networks. The presence of floating debris reflects the erosional entrainment of the sedimentary fluid on the bed.
(3) Cross-bedded fine sandstone (Scb): This lithofacies is mainly composed of light-gray fine sandstone. Although originally characterized by wedge-shaped or tabular cross-bedding, these primary structures often exhibit mild syn-sedimentary deformation and localized liquefaction features (such as blurred lamina boundaries or slight convolutions) due to initial sliding. The sandstone layer thickness typically reaches about 1 m, commonly showing coarsening-upward features (Figure 3d). It maintains good sorting and a relatively coarse grain size, reflecting its transitional nature prior to strong mud mixing and complete structural collapse. This lithofacies is a typical lithofacies developed in slide rocks. Its good sorting and relatively coarse grain size inherit the characteristics of delta-front sand bodies deposited under strong hydrodynamics and rapid unloading (e.g., mouth bar sand bodies) [38], forming a mechanically competent grain framework.
(4) Deformed bedded muddy sandstone (MSdb): This lithofacies is composed of silty fine sandstone and muddy laminae, belonging to folded heterolithic facies [39]. The laminae are strongly curled and torn, with small faults and sandstone intrusions visible within the layers (Figure 3e,f). A shear plane is developed at the base of the lithofacies, showing irregular contact with the overlying strata. The high-frequency interbedded argillaceous components and strong plastic deformation severely fragment the continuity of the framework grains within the sand body. The sandstone intrusions imply liquefaction or fluidization of the sedimentary layers, corroborating a high-energy sedimentary dynamic environment. This lithofacies formed in a deep-water gravity slumping or turbidity current/bottom-current transition environment, recording multiple dynamic factors of deposition and subsequent modification.
(5) Muddy sandstone with floating gravels (MSfc): This lithofacies is dominated by dark-gray to grayish-black muddy sandstone. Its core feature is the presence of floating gravel-sized debris: the debris size is generally < 10 cm, mostly angular or sub-rounded in shape, with compositions mainly of sandy lumps and rip-up mudstone clasts, arranged at high angles or nearly parallel; some sandy lumps show extensional deformation (Figure 3g–i). The thickness of this lithofacies varies significantly, ranging from thin layers of 20 cm to thick layers over 1 m. The mud-matrix support and extremely poor sorting cause the pore space to be largely filled by argillaceous components. The thickness variation reflects changes in local dynamic conditions during deposition. The floating gravels reflect the thixotropic characteristics of plastic fluids and the kinematic depositional process, making this a typical lithofacies of muddy debris flows [40,41].

4.2. Petrological and Petrophysical Characteristics

4.2.1. Petrological Composition and Textural Characteristics

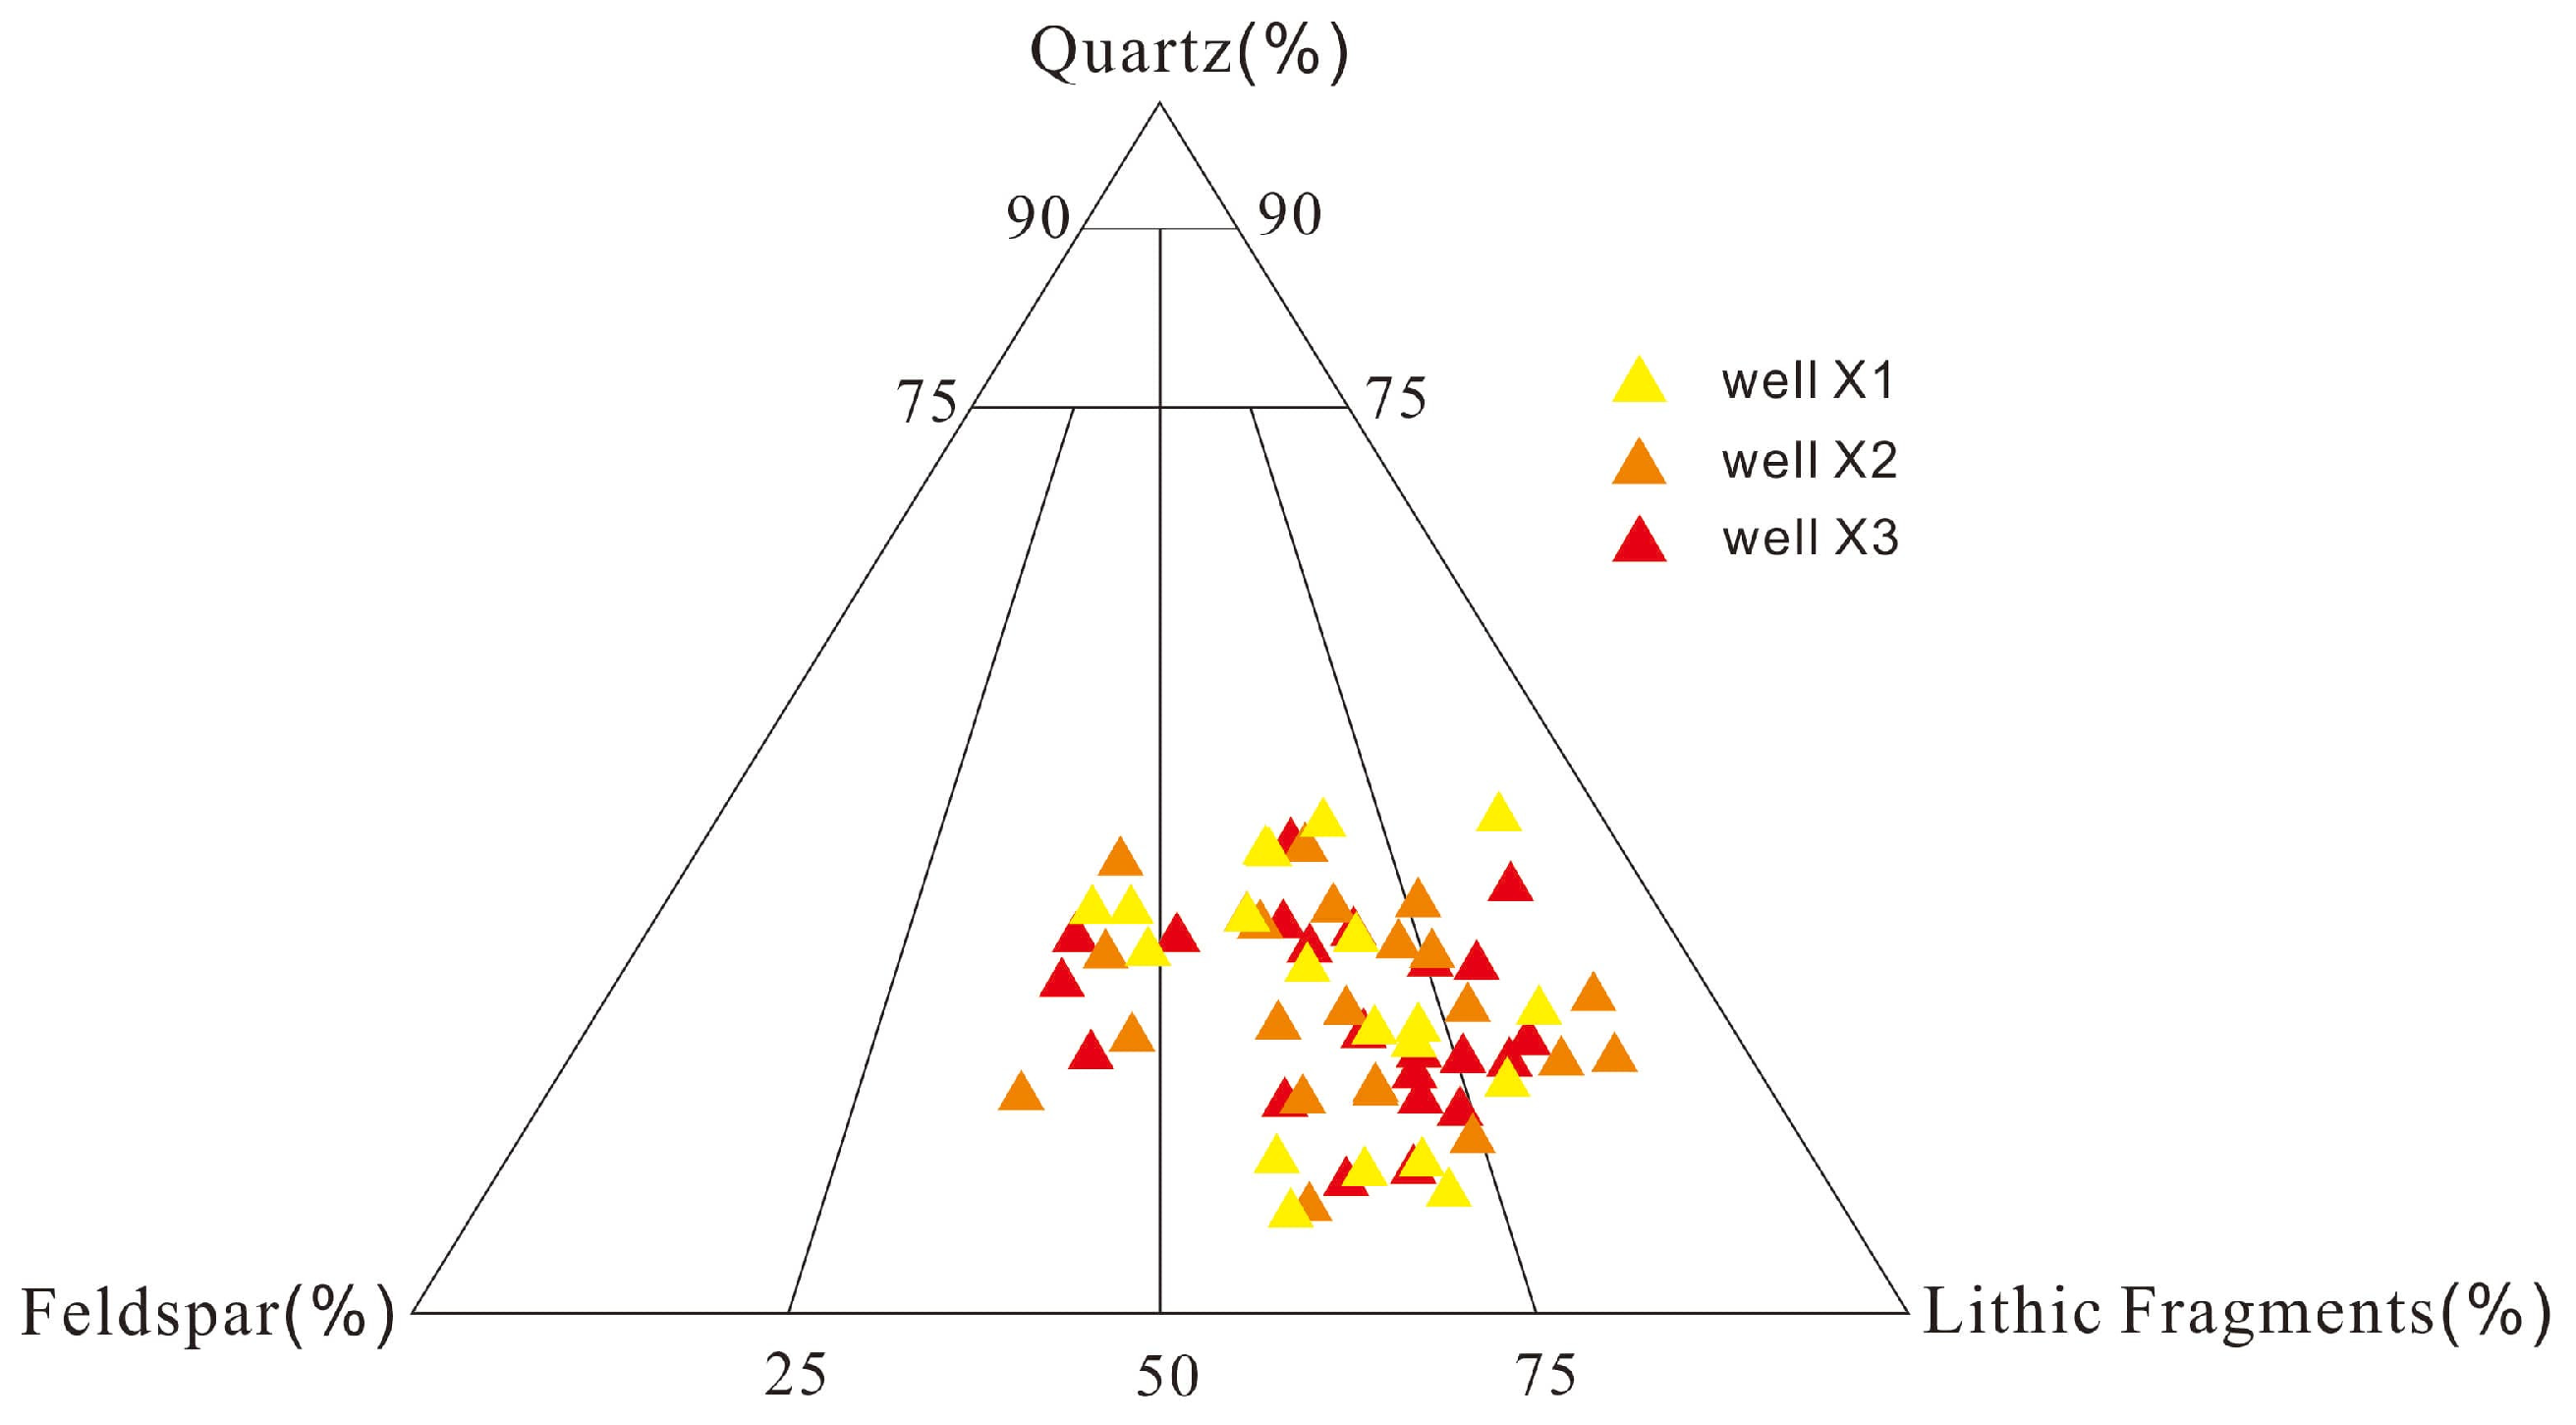
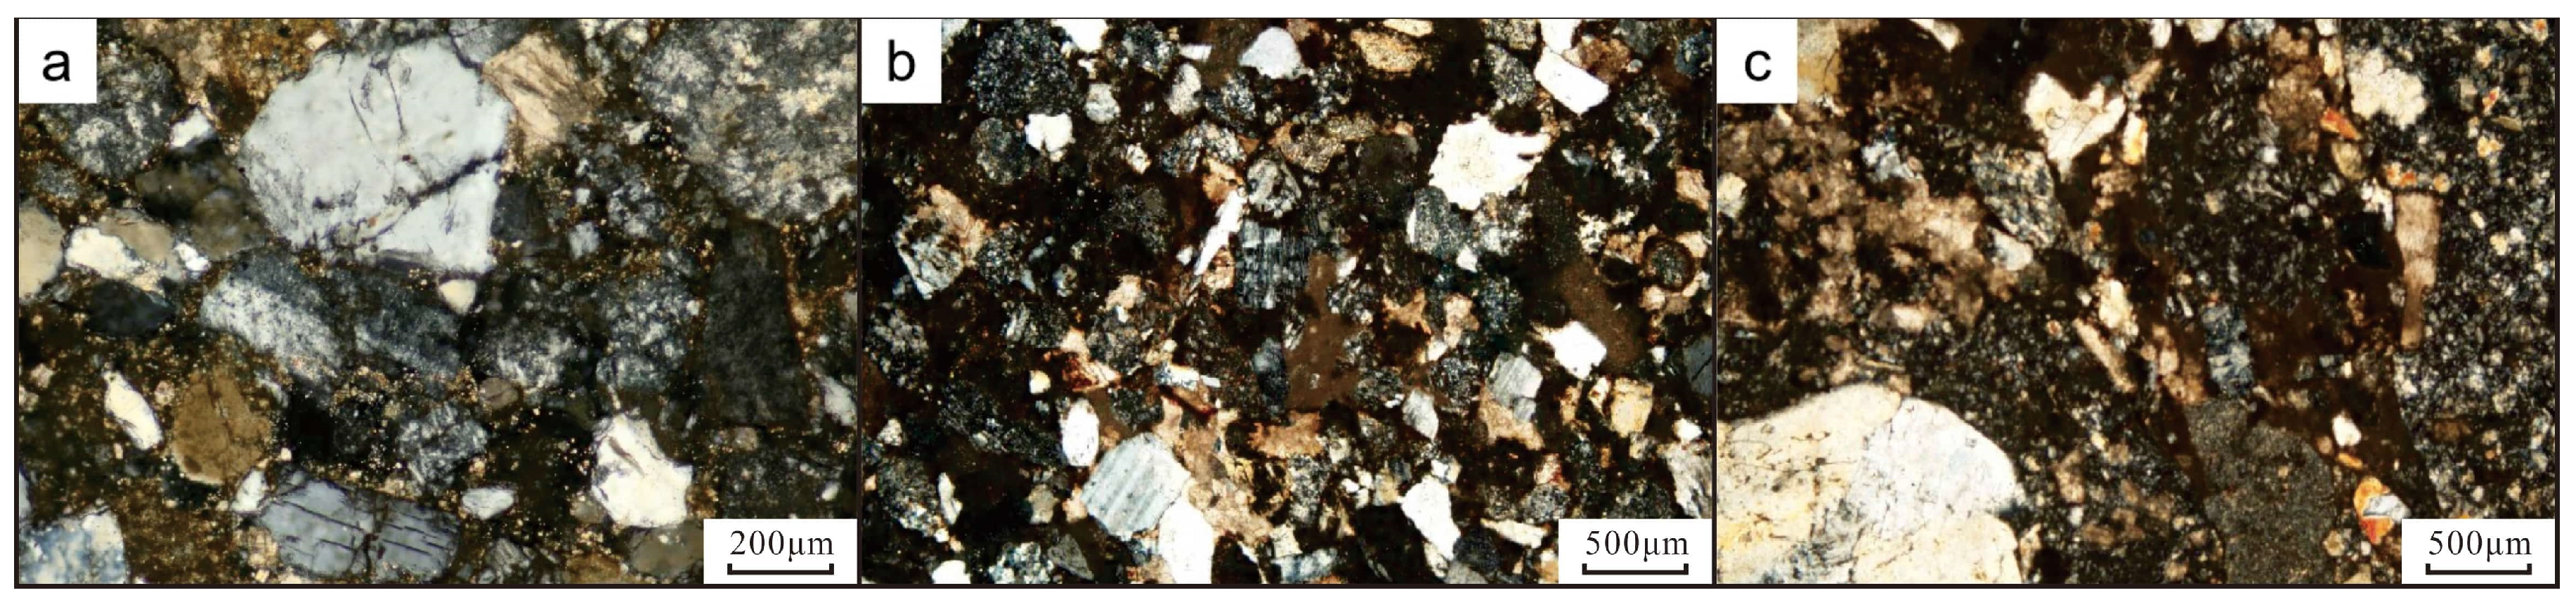
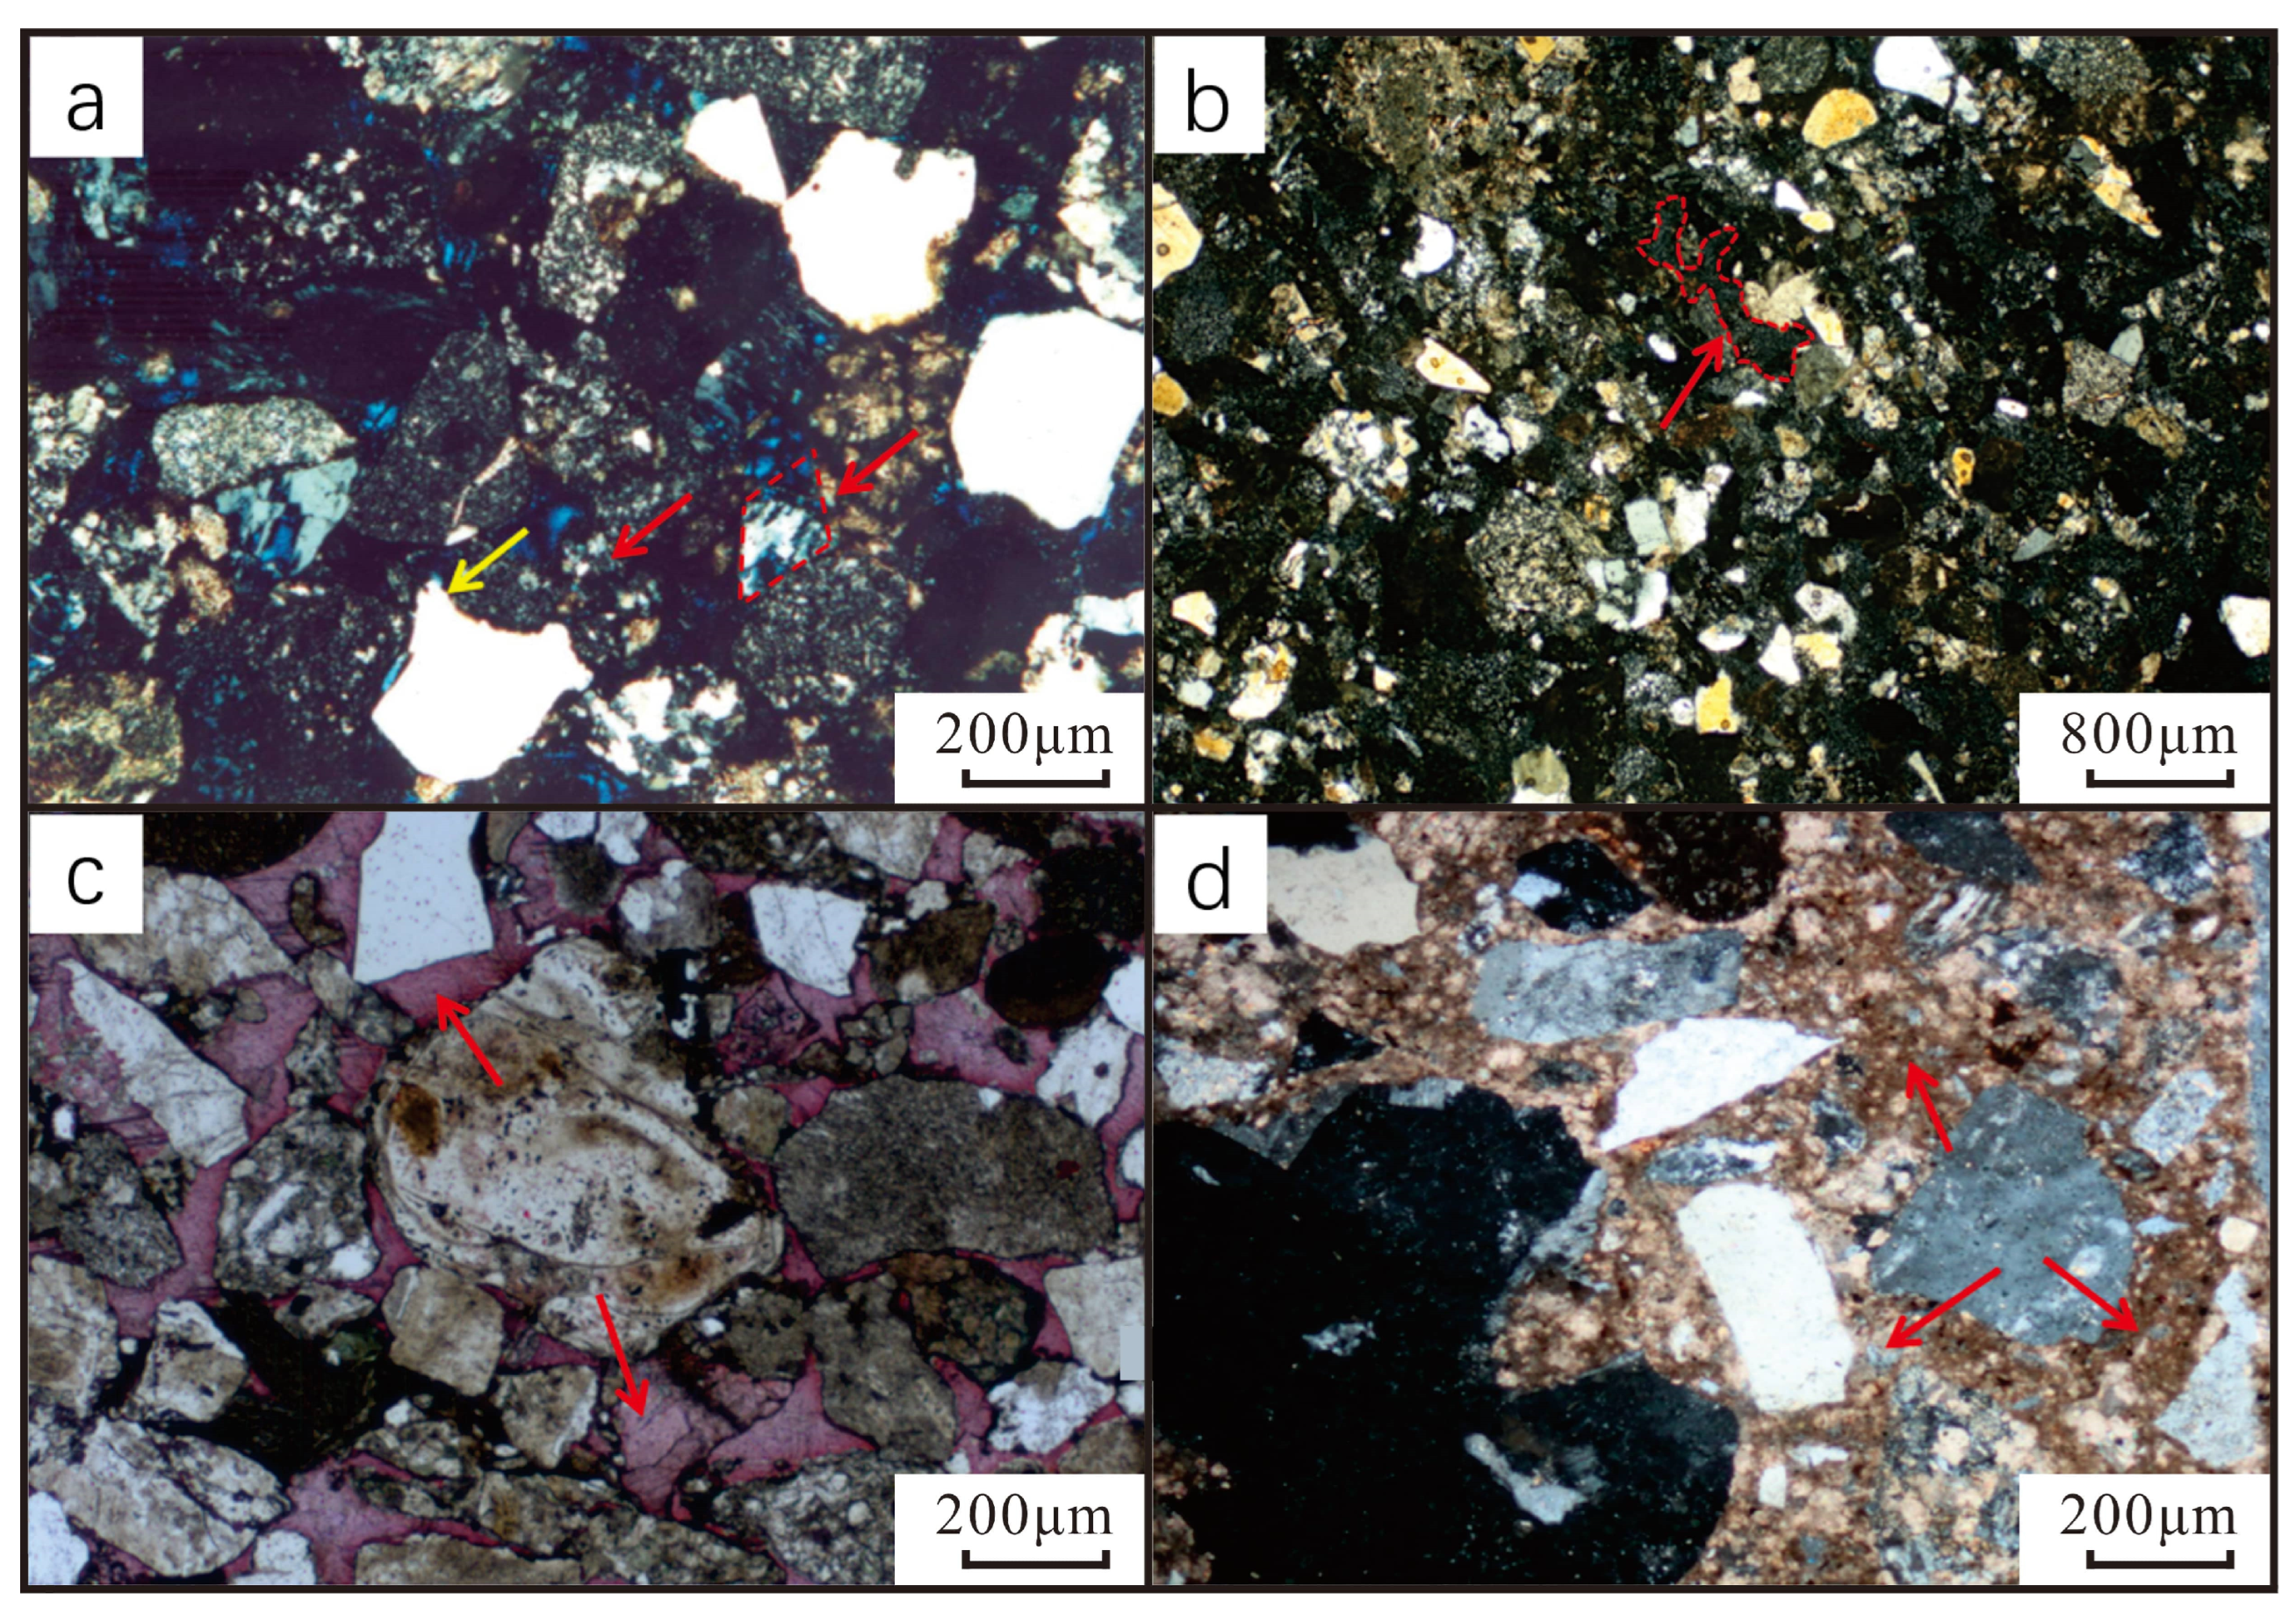
Based on the identification results of dyed epoxy resin-impregnated thin sections from three cored wells, the rock types of the slump-type gravity-flow reservoirs are mainly feldspathic lithic sandstones and lithic sandstones (Figure 4). The detrital composition shows: quartz content ranges from 23% to 29%, feldspar from 12% to 43%, and lithic fragments are as high as 31% to 61%. Among them, magmatic rock fragments (mainly intermediate and acidic effusive rocks and hypabyssal rocks) account for the highest proportion (Figure 5), averaging 57.4% of the detrital components. Regarding interstitial materials, the reservoir generally has a high interstitial content (averaging 15.66%), dominated by compositionally heterogeneous argillaceous matrix and cements. The cements are primarily composed of calcite, dolomite, and a small amount of clay minerals, with visible siliceous cementation (Figure 6).
This relatively low compositional maturity is highly consistent with the geological background of proximal, short-distance, and rapid accumulation experienced by the slump-type gravity flows after instability on the steep slope zone.
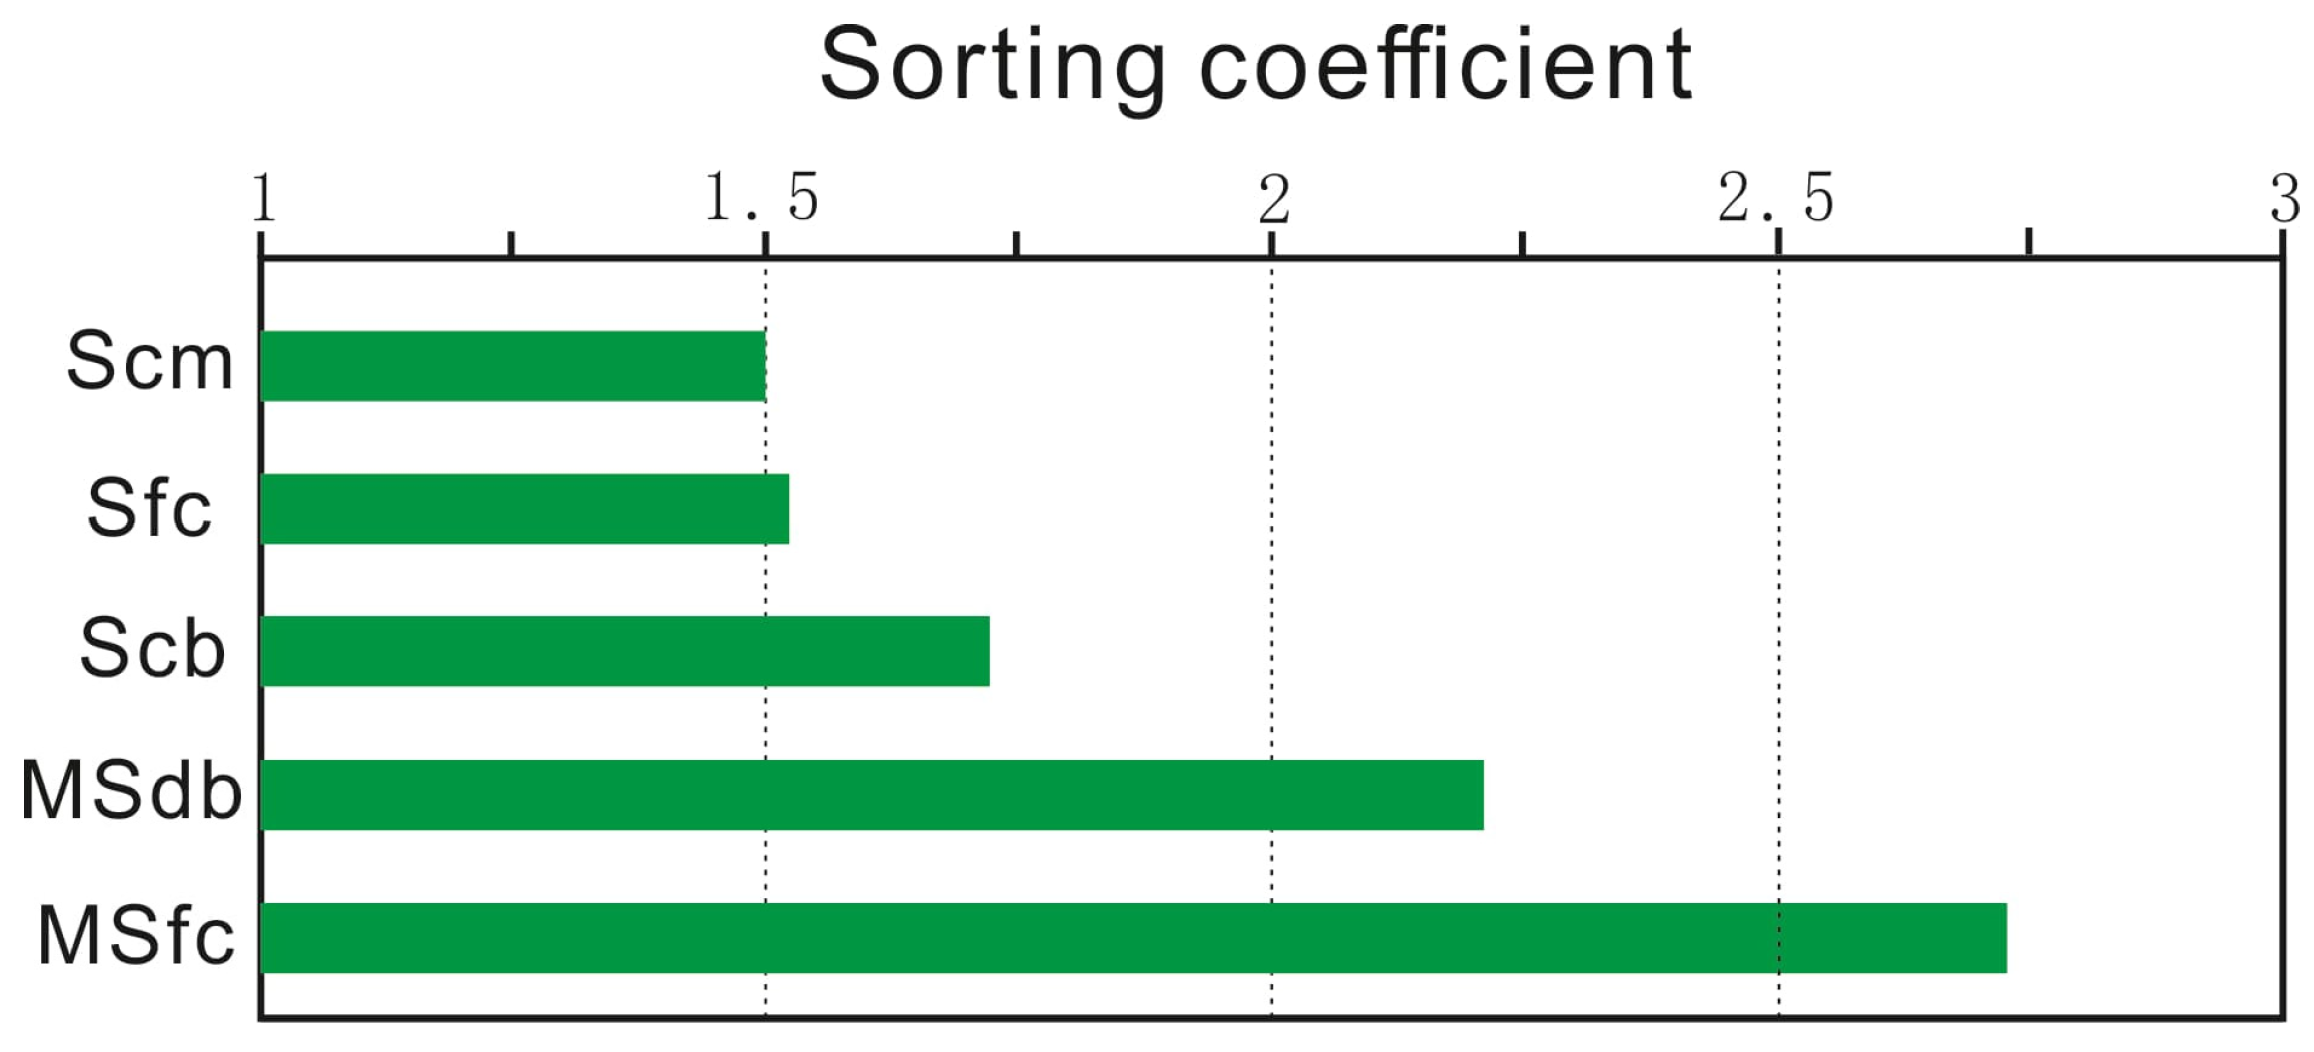
In terms of rock texture, controlled by the rapid transport and “freezing” depositional mechanism, the roundness of reservoir detrital grains is generally dominated by sub-angular to sub-rounded. The average grain size of the reservoir is 0.22 mm, predominantly consisting of medium and fine sand (accounting for about 50%), followed by very fine sand and silt (accounting for about 30%), with relatively little coarse sand and gravel. Further quantitative evaluation using the Trask sorting coefficient [42] reveals that the grain sorting exhibits significant textural differentiation among different lithofacies, and is generally positively correlated with grain size (Figure 7). Specifically, in relatively coarse-grained lithofacies such as Scm, Sfc, and Scb, grain sorting is better, with average sorting coefficients all less than 1.7; whereas in the two fine-grained lithofacies of MSdb and MSfc, due to the significant increase in argillaceous content, the overall sorting deteriorates sharply, with average sorting coefficients both greater than 2.0. This lithofacies-dominated differentiation of rock texture is essentially the direct product of changes in the rheological dynamic mechanism.

4.2.2. Porosity and Permeability Characteristics

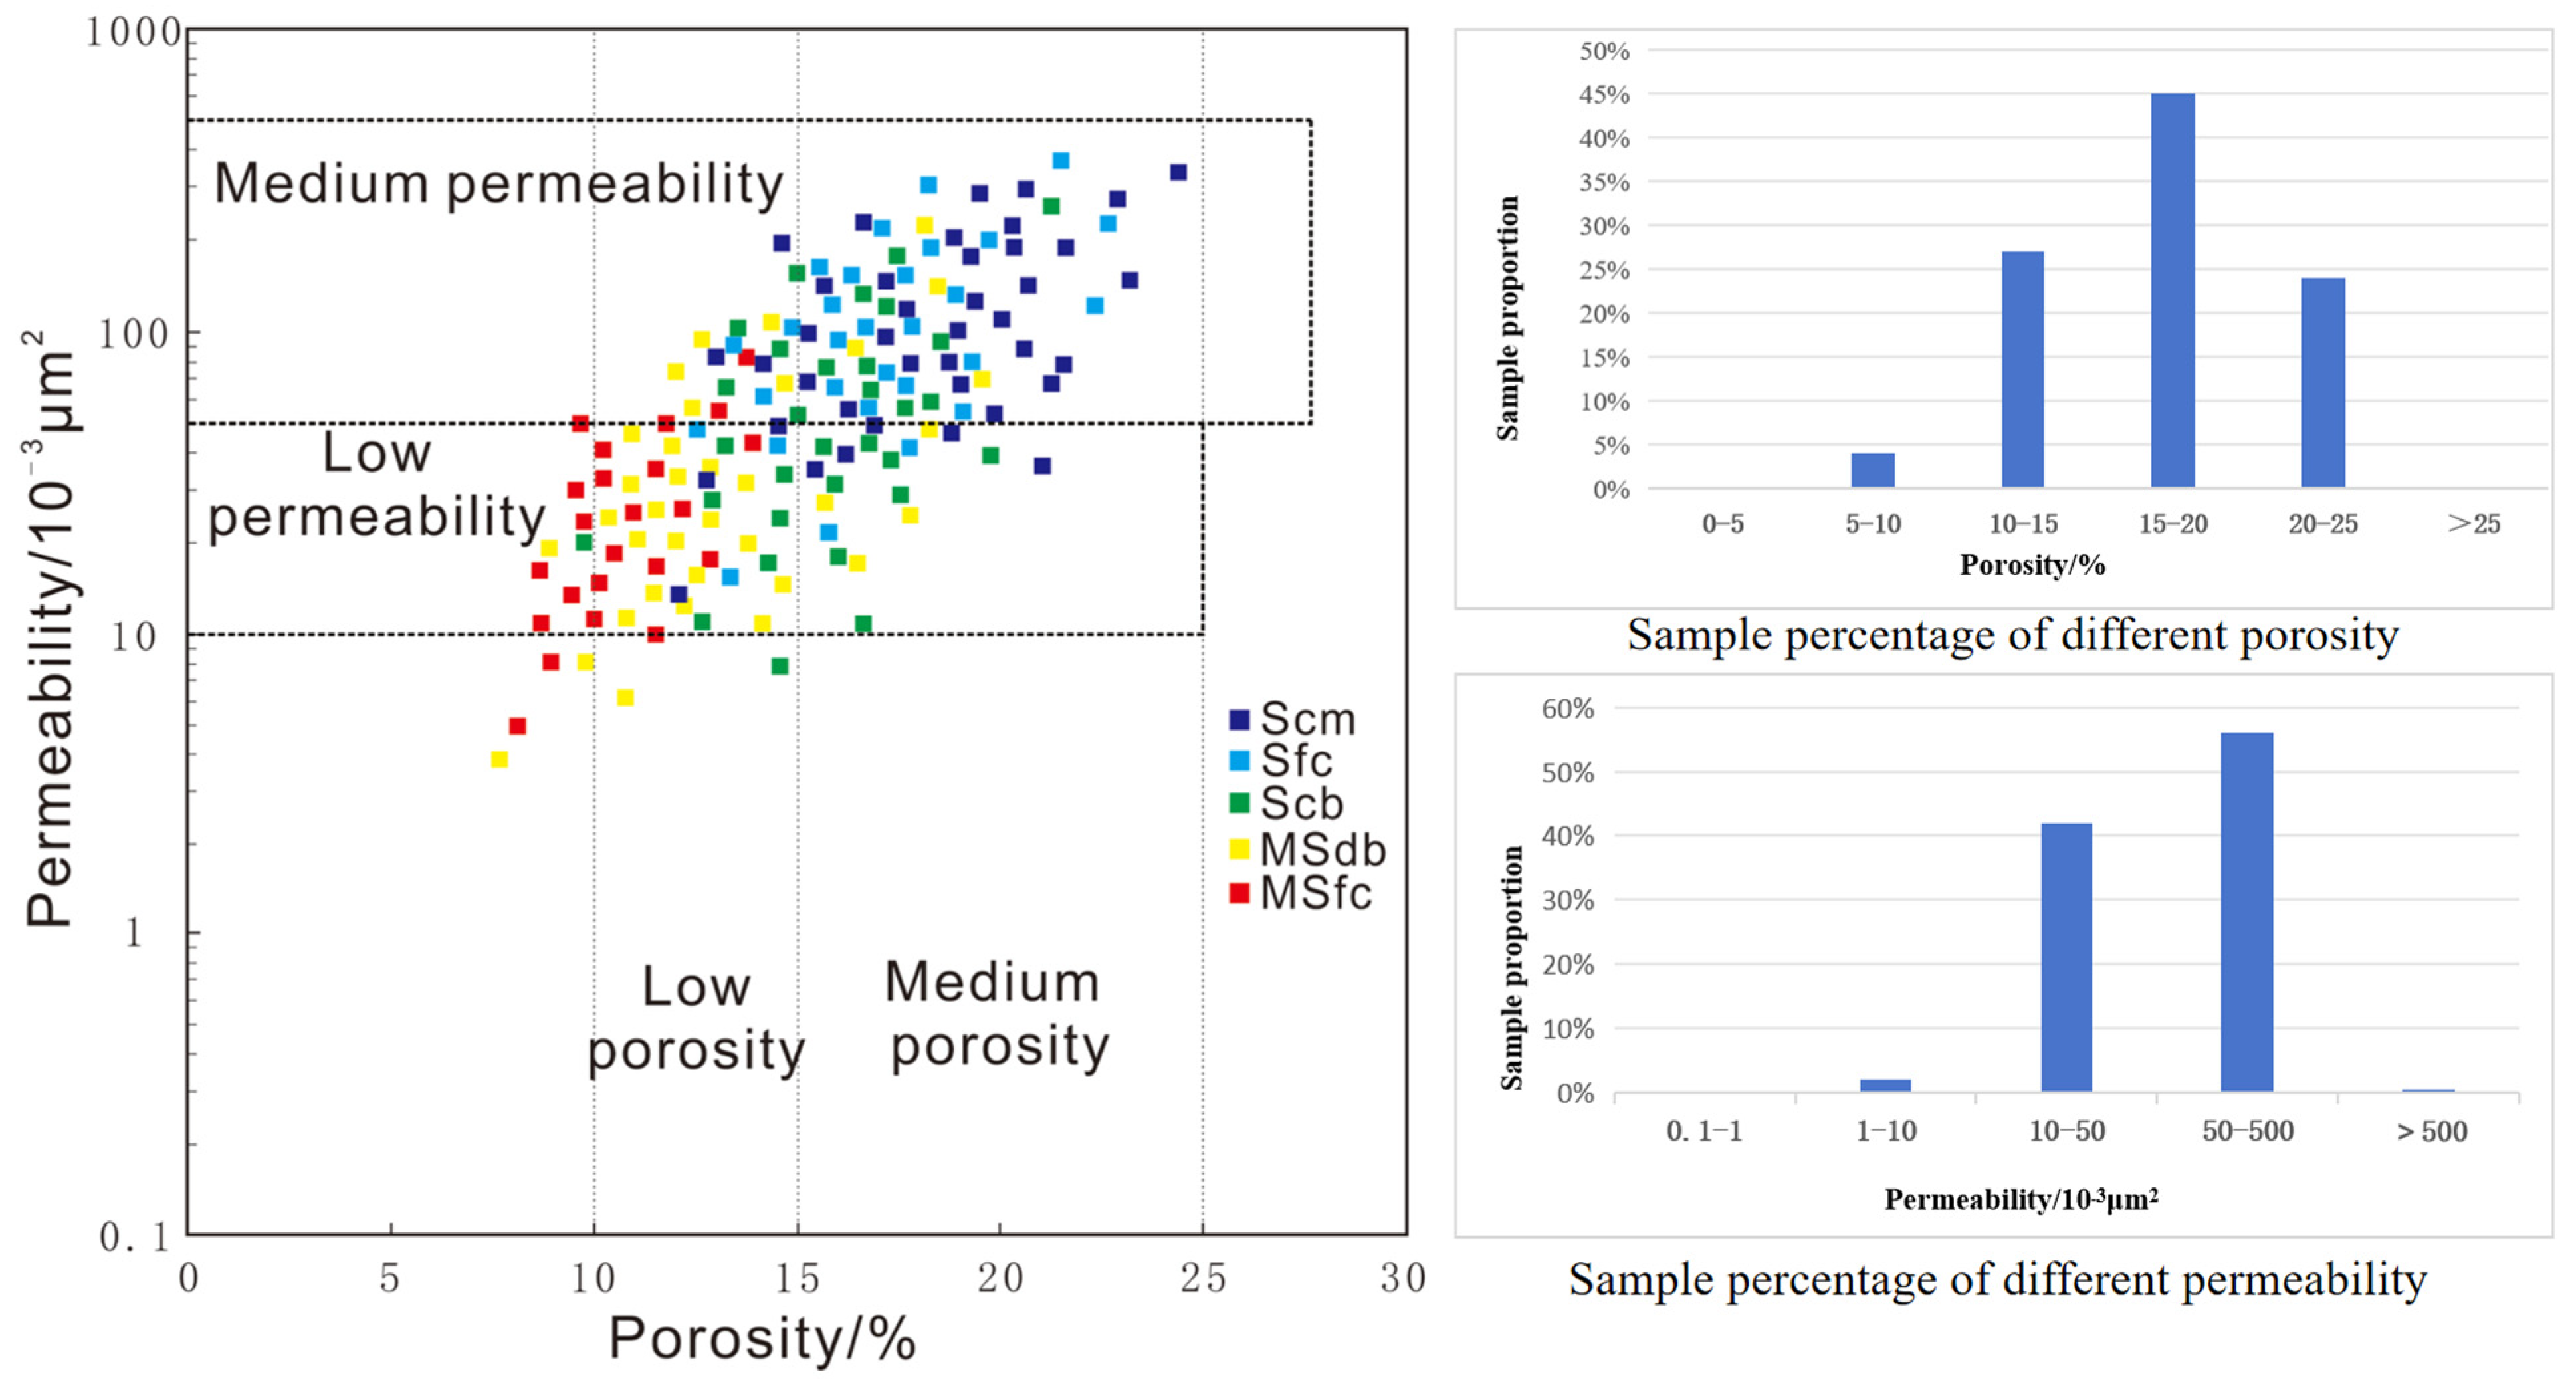
The physical property data in this study were obtained from the porosity and permeability analysis of different lithofacies samples from the three cored wells. The number of samples taken for each lithofacies was kept roughly equal to avoid altering the perceived patterns due to excessive differences in sample proportions. Statistical results show that the overall porosity and permeability of the Jiufotang Formation gravity-flow reservoirs exhibit a clear positive correlation, primarily characterized by low porosity–low permeability and medium porosity–medium permeability. The reservoir porosity follows a normal distribution, mainly ranging from 10% to 25%, with the 15%–20% interval being the peak zone (accounting for about 45% of the samples). Permeability is mainly distributed in the low-to-medium permeability range of 10–500 × 10−3 μm2, which accounts for over 90% of the samples (Figure 8).
Due to the large difference in single-layer depositional thickness of different types of lithofacies, the thickness-weighted average porosity and permeability for each lithofacies were calculated separately using a thickness-weighted formula (Table 2). The test data indicate significant differentiation in the physical parameters of each lithofacies:
(1) The Scm and Sfc lithofacies have the highest thickness-weighted porosity and permeability parameters, generally exhibiting medium porosity and medium permeability characteristics;
(2) The Scb lithofacies has the second-highest parameters, also exhibiting medium porosity and medium permeability characteristics;
(3) The physical property data of the MSdb and MSfc lithofacies are similar and fall in the lowest value zone, generally exhibiting low porosity and low permeability characteristics.

4.3. Pore Structure Characteristics

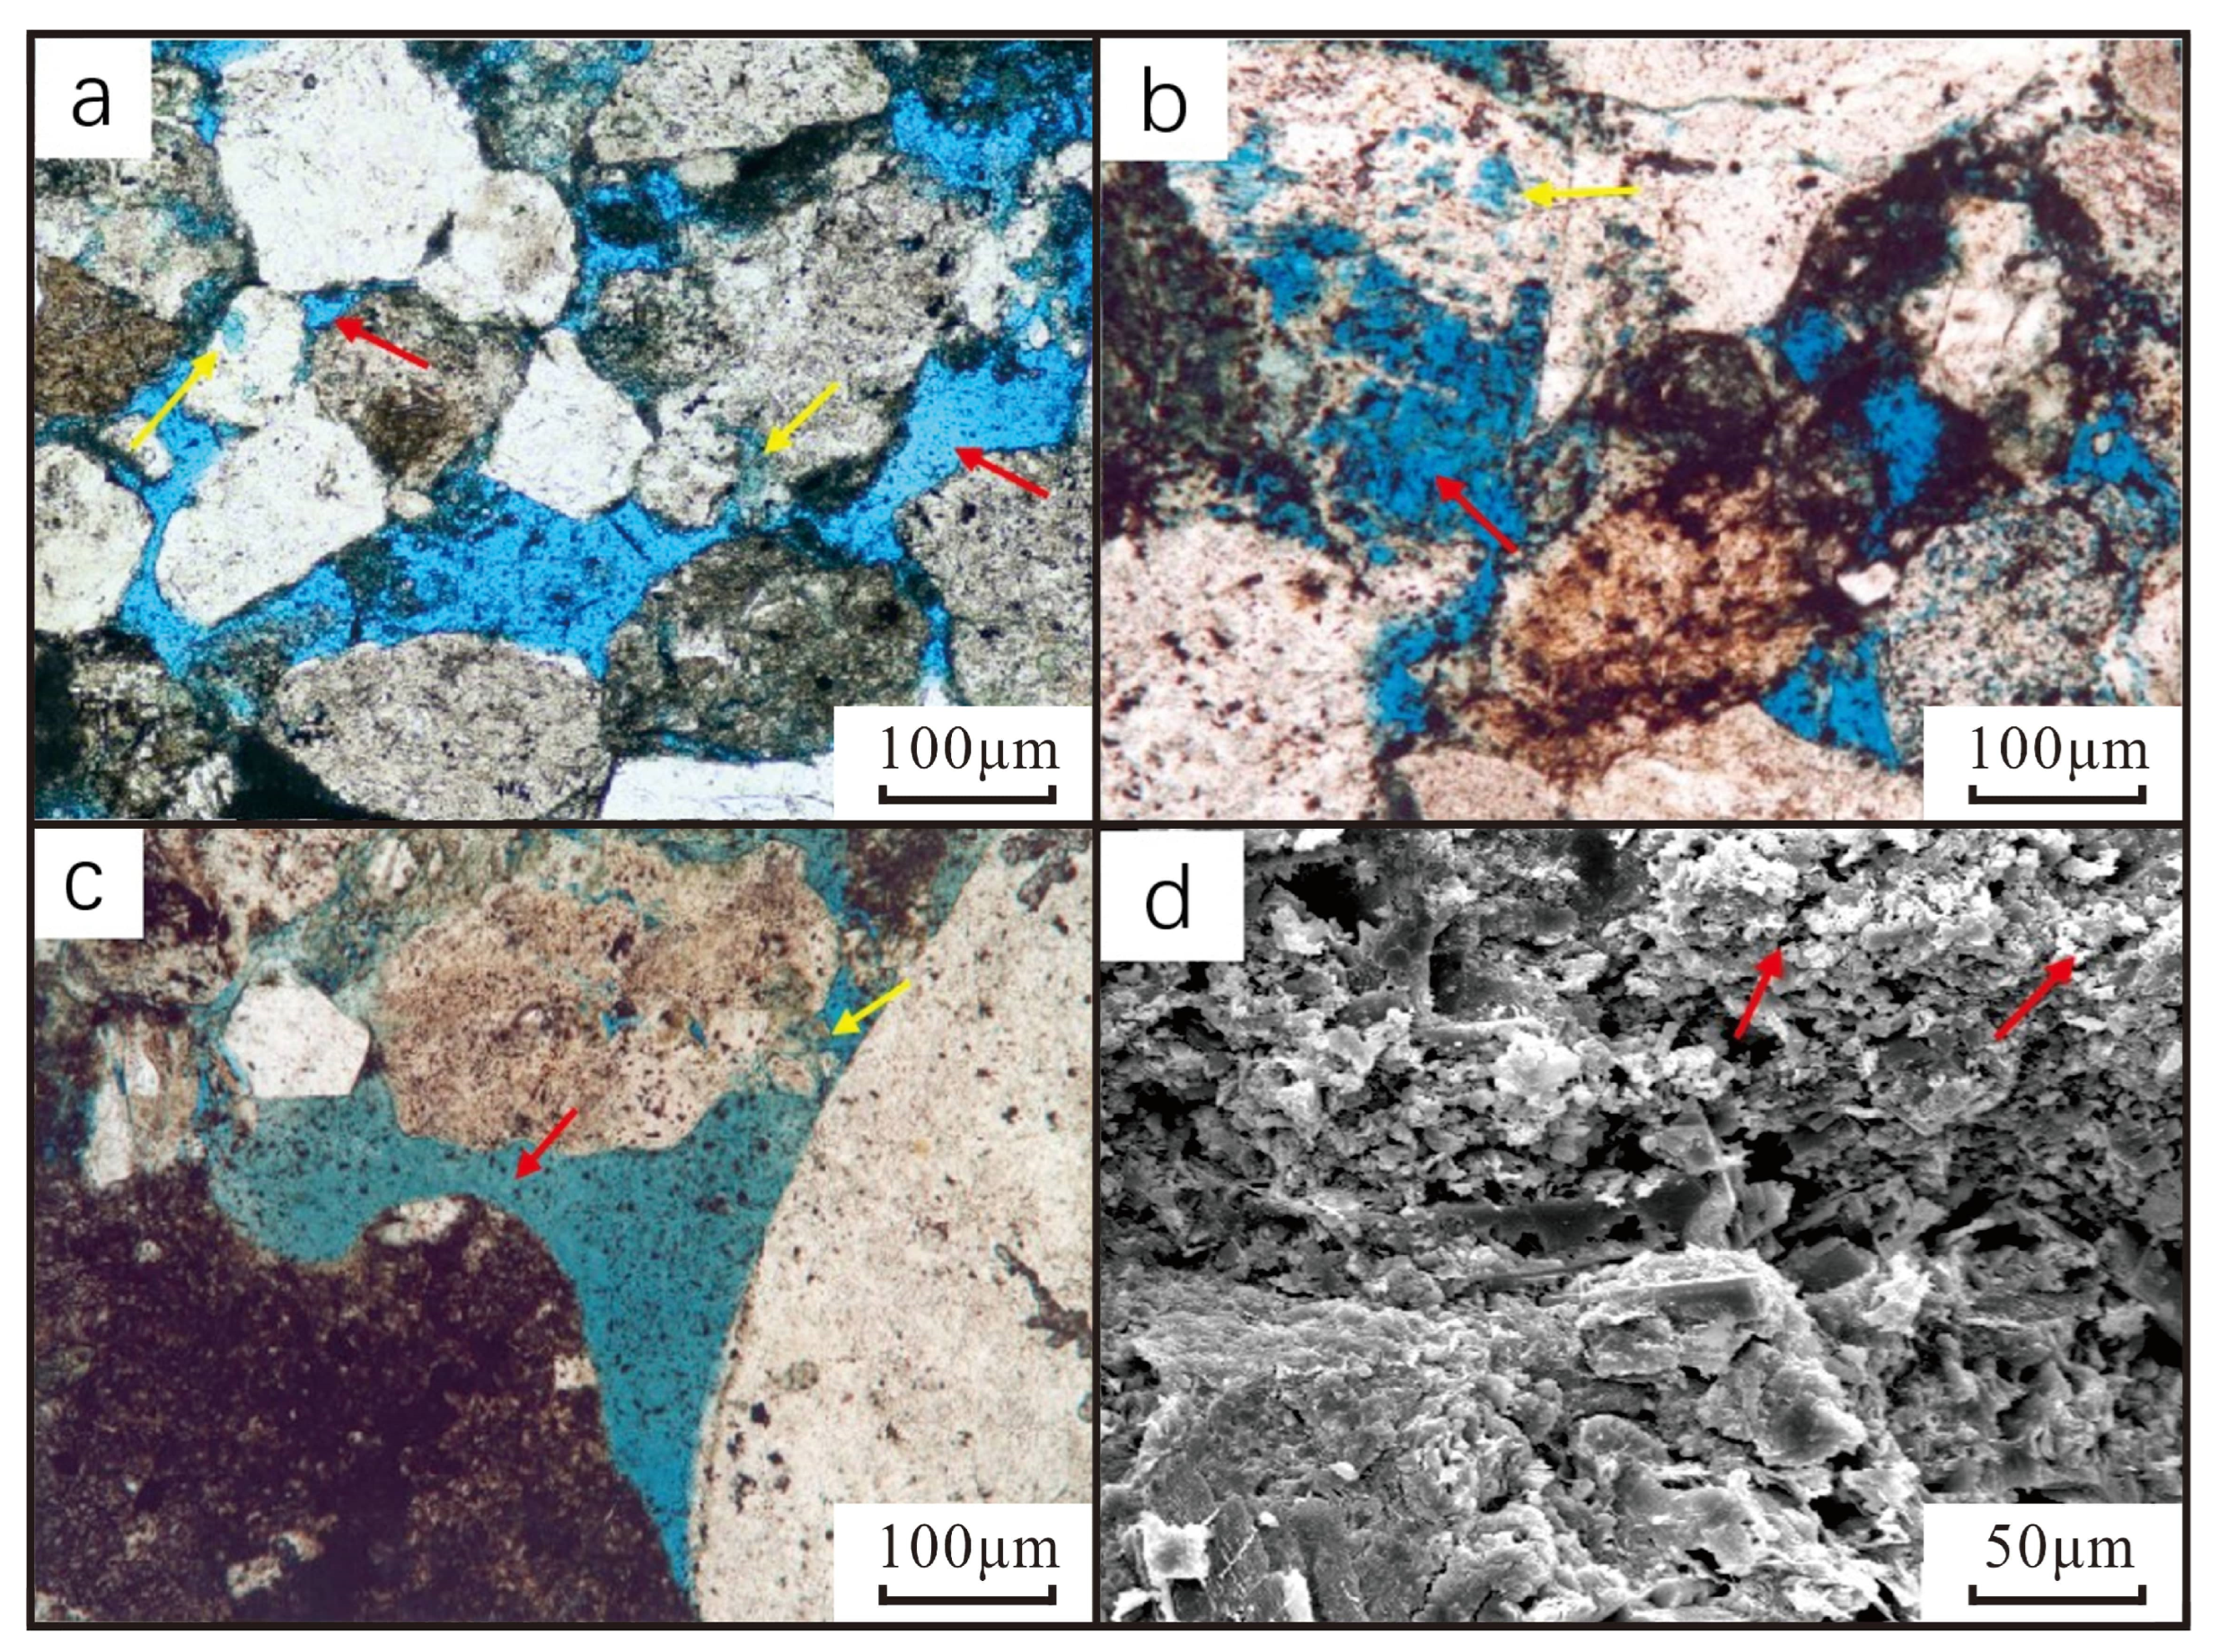
Microscopic observation shows that the reservoir space of the slump-type gravity-flow reservoirs is dominated by residual primary intergranular pores, followed by dissolution pores (accounting for about 10%–20%, mainly intergranular dissolution pores), with very few moldic pores and compound pores (both less than 5%). The size and morphology of the throats are strictly controlled by the sedimentary lithofacies: in ultra-thick massive sandstones (e.g., Scm, Sfc lithofacies), because the framework grains are subjected to balanced stress and are not prone to deformation, the throat distribution is relatively uniform, dominated by regular necking and sheet-like throats; whereas in high-mud, strongly deformed sand bodies (e.g., MSdb, MSfc lithofacies), due to the superimposed effects of syn-sedimentary structural deformation and compactional fracturing, the throat morphology is extremely irregular, with widely developed tube-bundle and curved sheet-like throats (Figure 9).
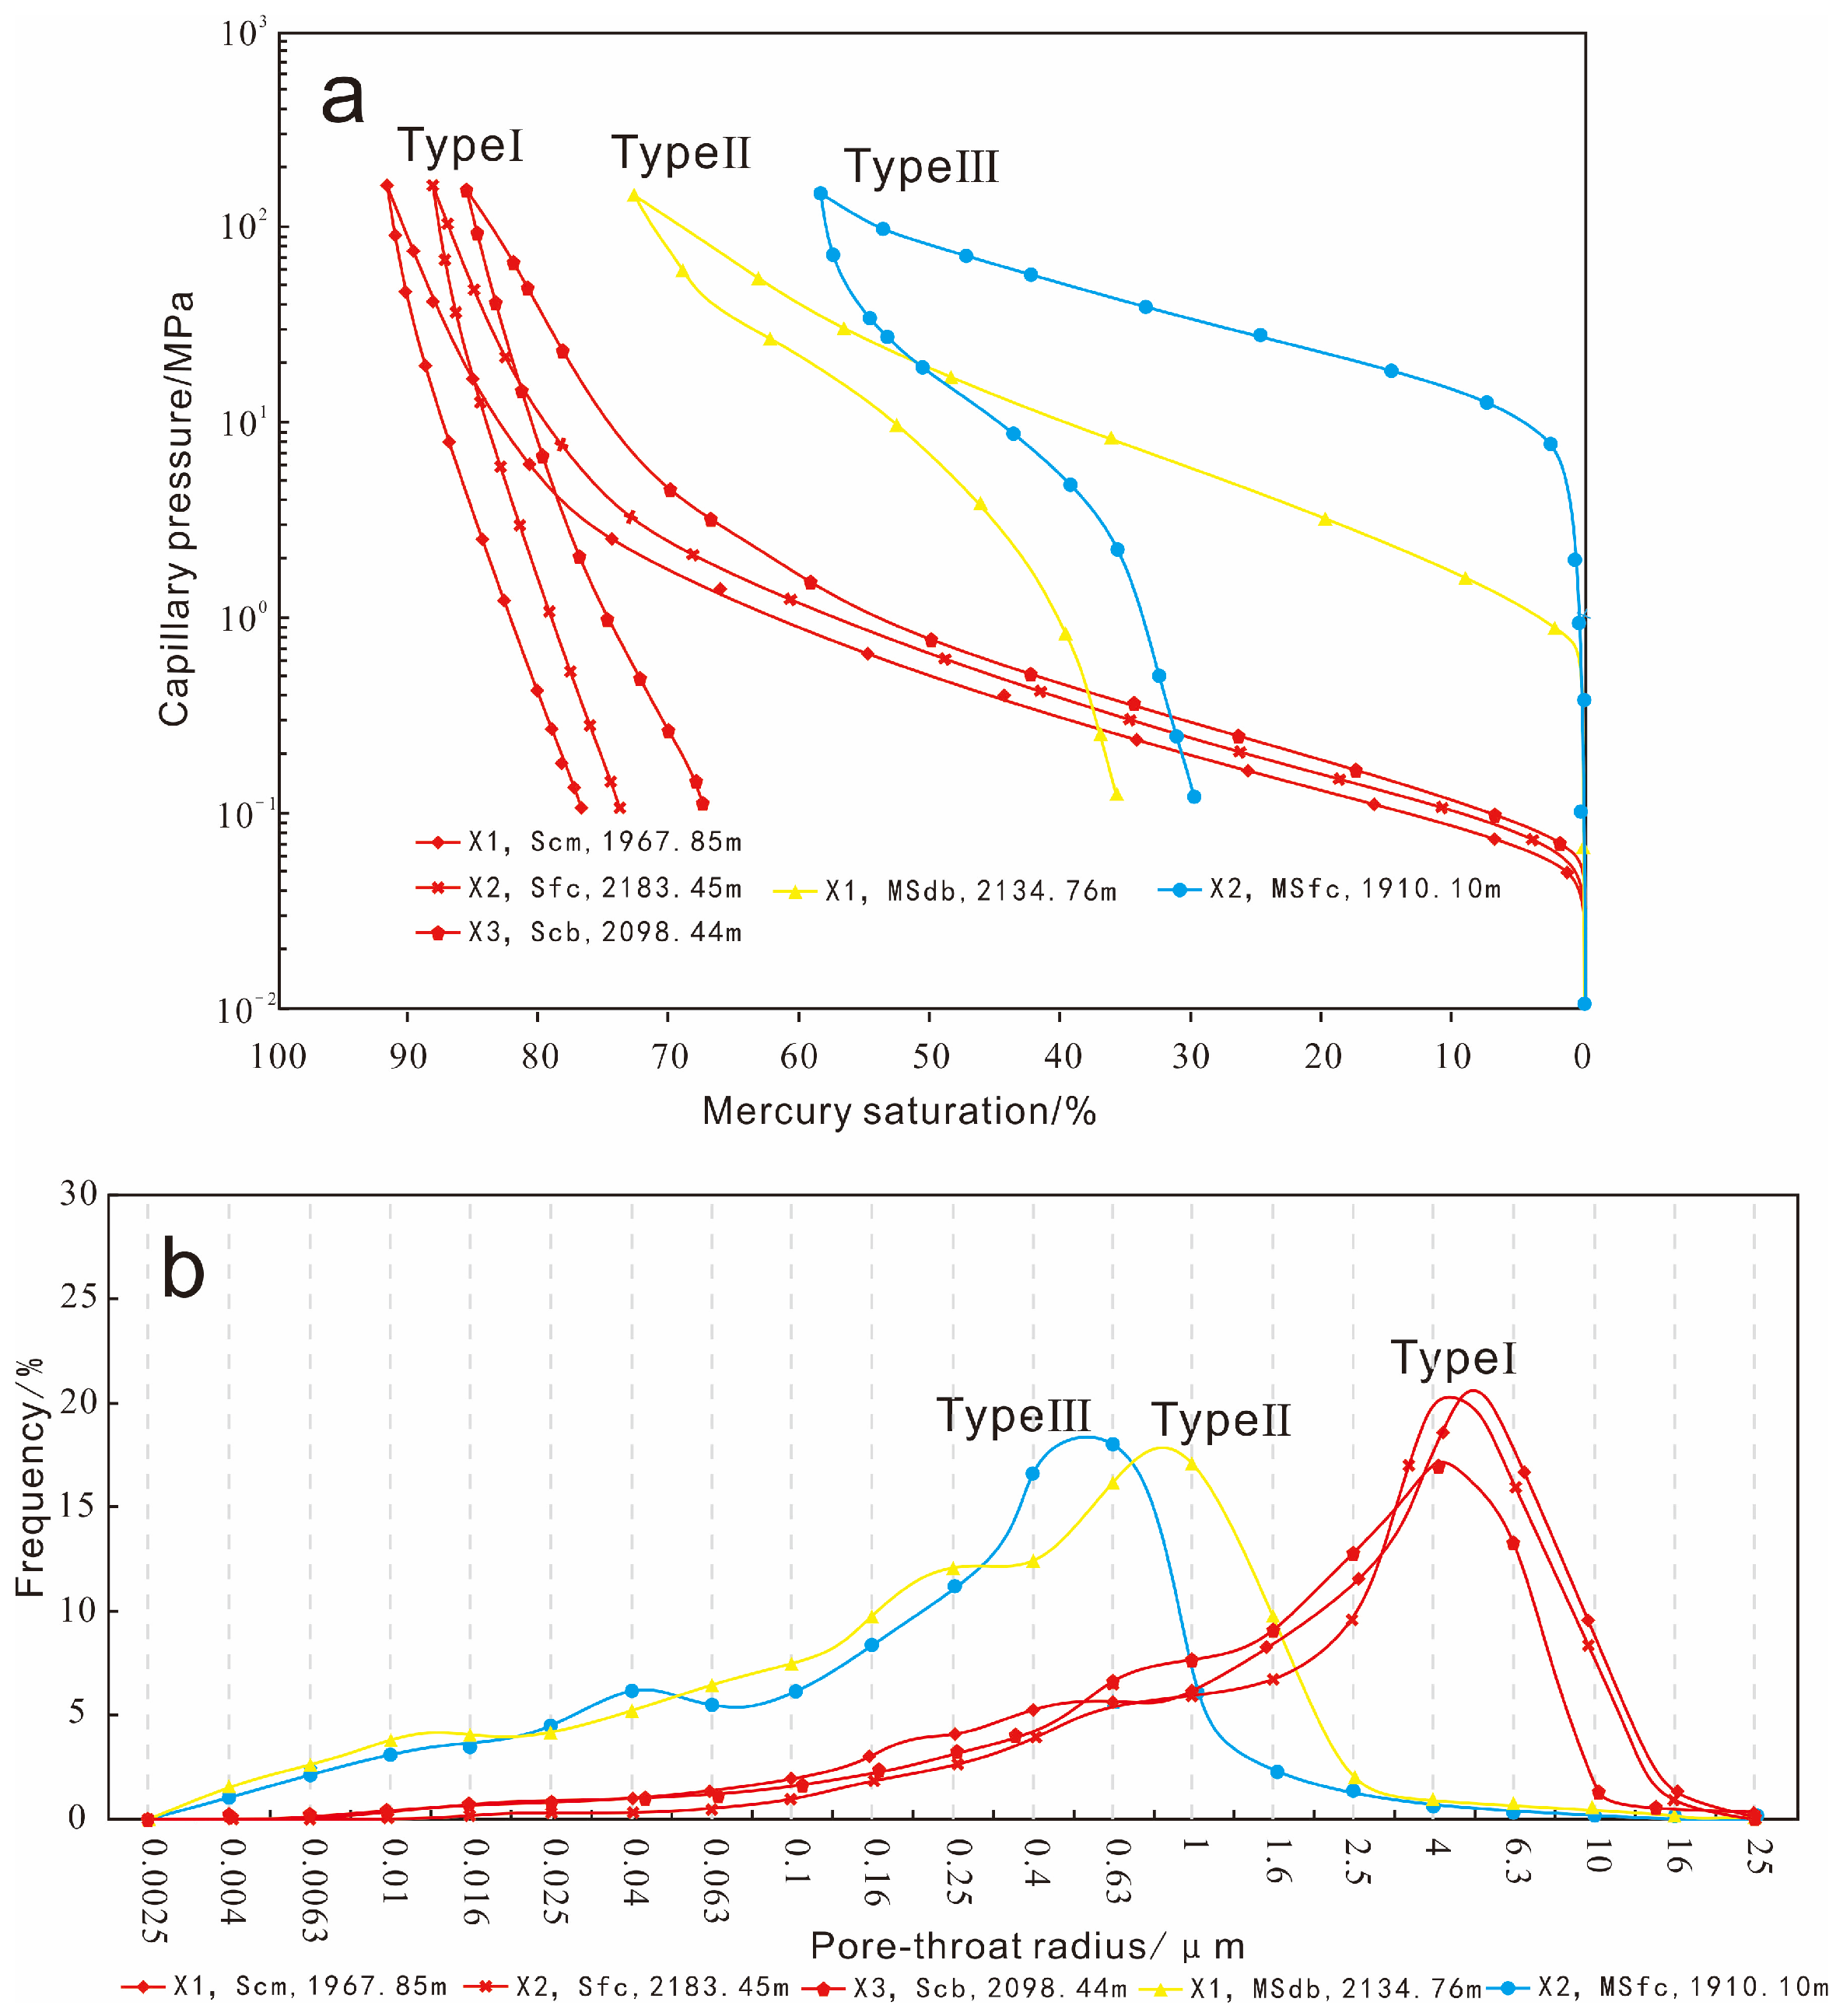
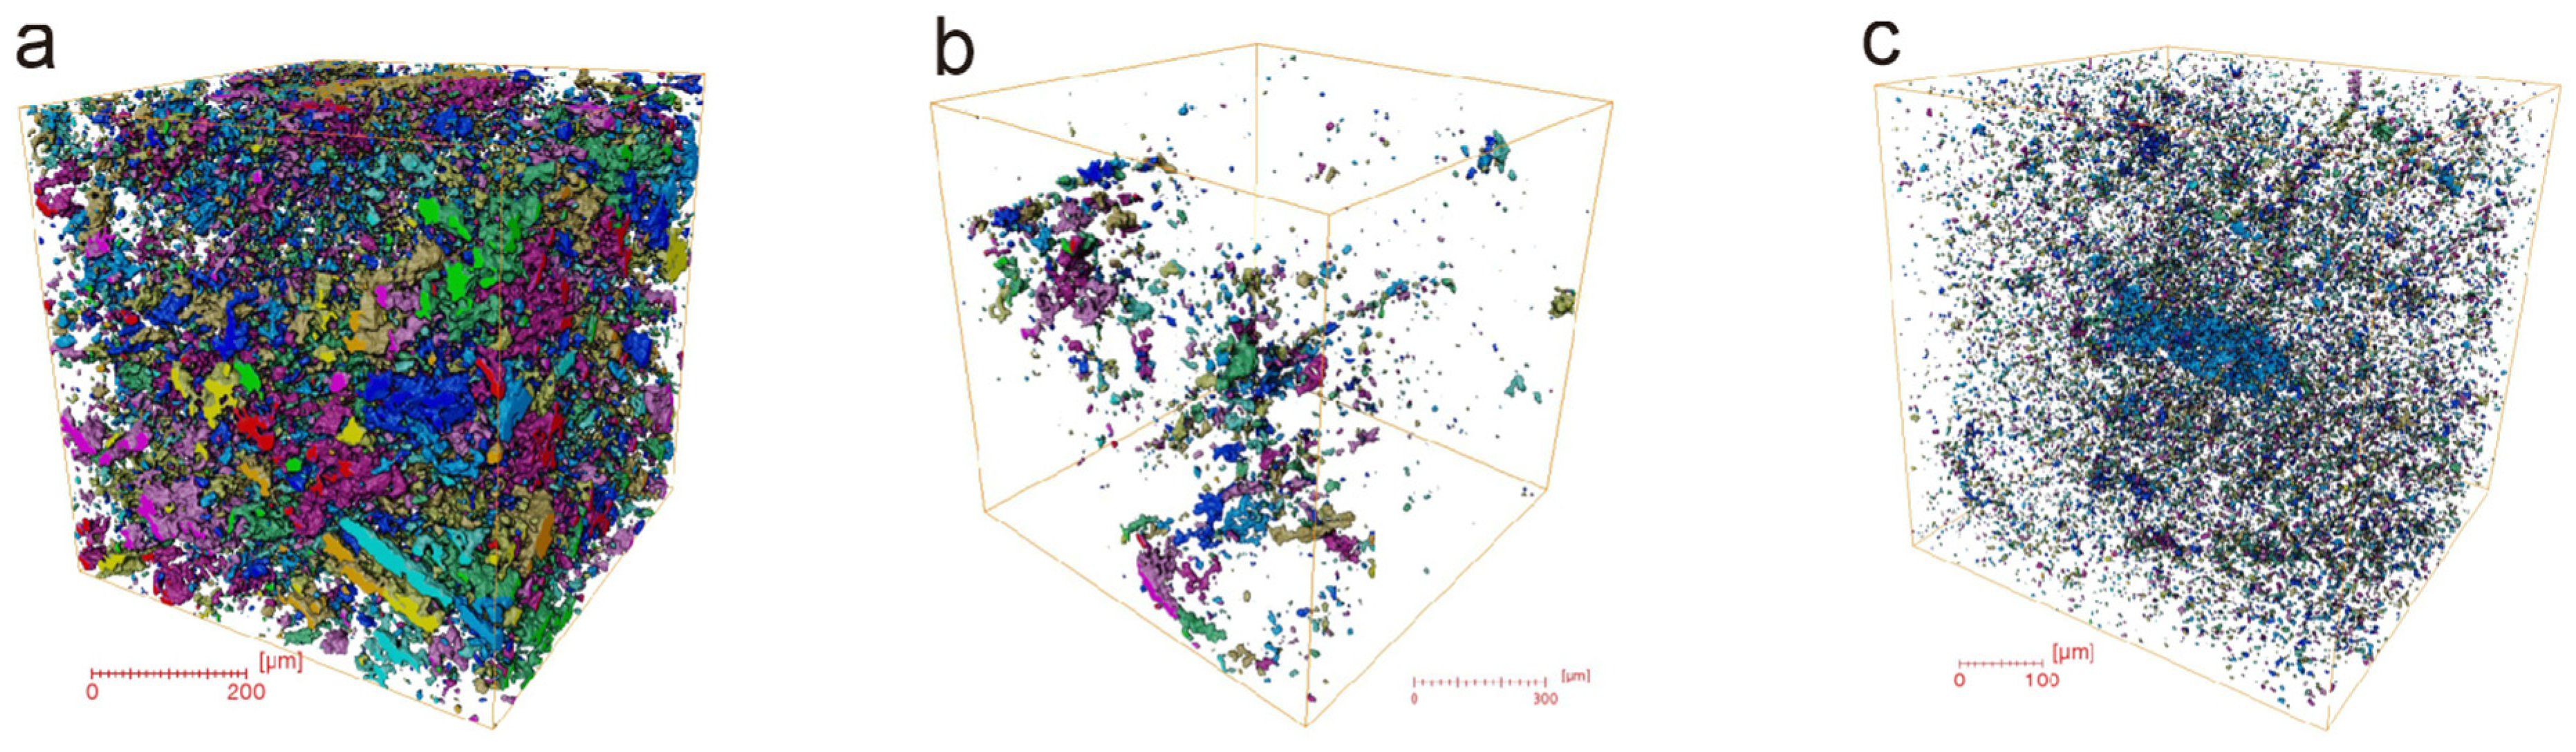
Integrating High-Pressure Mercury Injection (HPMI) characteristic parameters, 3D topological characterization from micro-CT scanning, and microscopic observation results, the microscopic pore-throat networks of the reservoirs are divided into three types. This classification exhibits a high degree of correlation with the lithofacies types and macroscopic physical properties (Figure 10 and Figure 11, Table 3):
(1) Type I pore structure (mainly developed in Scm, Sfc, and Scb lithofacies): It is mainly composed of relatively large residual primary intergranular pores and intergranular dissolution pores (including a small amount of compound pores and moldic pores), as well as necking and broad sheet-like throats. The skewness of the mercury injection curve is biased towards the coarse-grained end, the intrusion curve is gentle without an obvious plateau section, and the mercury extrusion hysteresis is minor. This type of pore-throat has good sorting and superior connectivity, with an extremely low displacement pressure (<0.1 MPa). The permeability is overwhelmingly contributed by large pore-throats of 4–10 μm. Micro-CT scanning results show a large-area contiguous distribution of massive and club-shaped pore-throats, indicating a highly developed pore-throat system with good connectivity. The macroscopic physical parameters are excellent (porosity generally > 15%, permeability > 50–150 × 10−3 μm2), representing the high-quality pore network with the strongest storage and seepage capacity.
(2) Type II pore structure (mainly developed in MSdb lithofacies): It is mainly composed of medium-sized residual primary intergranular pores, intra/intergranular dissolution pores, as well as sheet-like and curved sheet-like throats. The skewness of the mercury injection curve is biased towards the fine-grained end, the intrusion curve is relatively steep, and the degree of mercury extrusion hysteresis increases. The pore-throat radius exhibits a bimodal distribution characteristic of “low on the left and high on the right”. The displacement pressure ranges between 0.1 and 0.8 MPa (averaging about 0.6 MPa), and the permeability is mainly contributed by medium pore-throats of 0.7–2 μm. Micro-CT scanning results show that the pore-throats are distributed in scattered small clumps, indicating a moderately developed pore-throat system. The porosity of such samples ranges from 12% to 18%, and the permeability ranges from 10 to 80 × 10−3μm2, showing good storage capacity but moderate seepage performance.
(3) Type III pore structure (mainly developed in MSfc lithofacies): It is mainly composed of micro-residual primary pores, dissolution micropores, intercrystalline pores, as well as tube-bundle and curved sheet-like throats. Micro-CT scanning results show that these pores are mainly distributed in an isolated, granular, and scattered manner, forming connected structures only in limited localized areas. The pore-throat radius distribution is extremely narrow, and the pore-throat ratio is extremely high. The skewness of the mercury injection curve is the finest, developing a plateau section with a small slope. This type has an extremely high displacement pressure (usually > 5 MPa), and its permeability relies solely on the contribution of minute pore-throats of 0.2–0.7 μm. Its porosity is typically < 12%, and permeability is generally < 20–40 × 10−3 μm2, classifying it as a low-porosity and ultra-low-permeability reservoir. It represents the poorest pore structure type, where fluid migration is the most difficult under natural conditions.

4.4. Diagenetic Characteristics

Microscopic and scanning electron microscope (SEM) observations indicate that the slump-type gravity-flow reservoirs have primarily undergone compaction, cementation, and dissolution. Overall, the reservoirs are dominated by destructive diagenetic modifications (moderate compaction and early cementation), while constructive dissolution is relatively weak.

4.4.1. Characteristics of Compaction

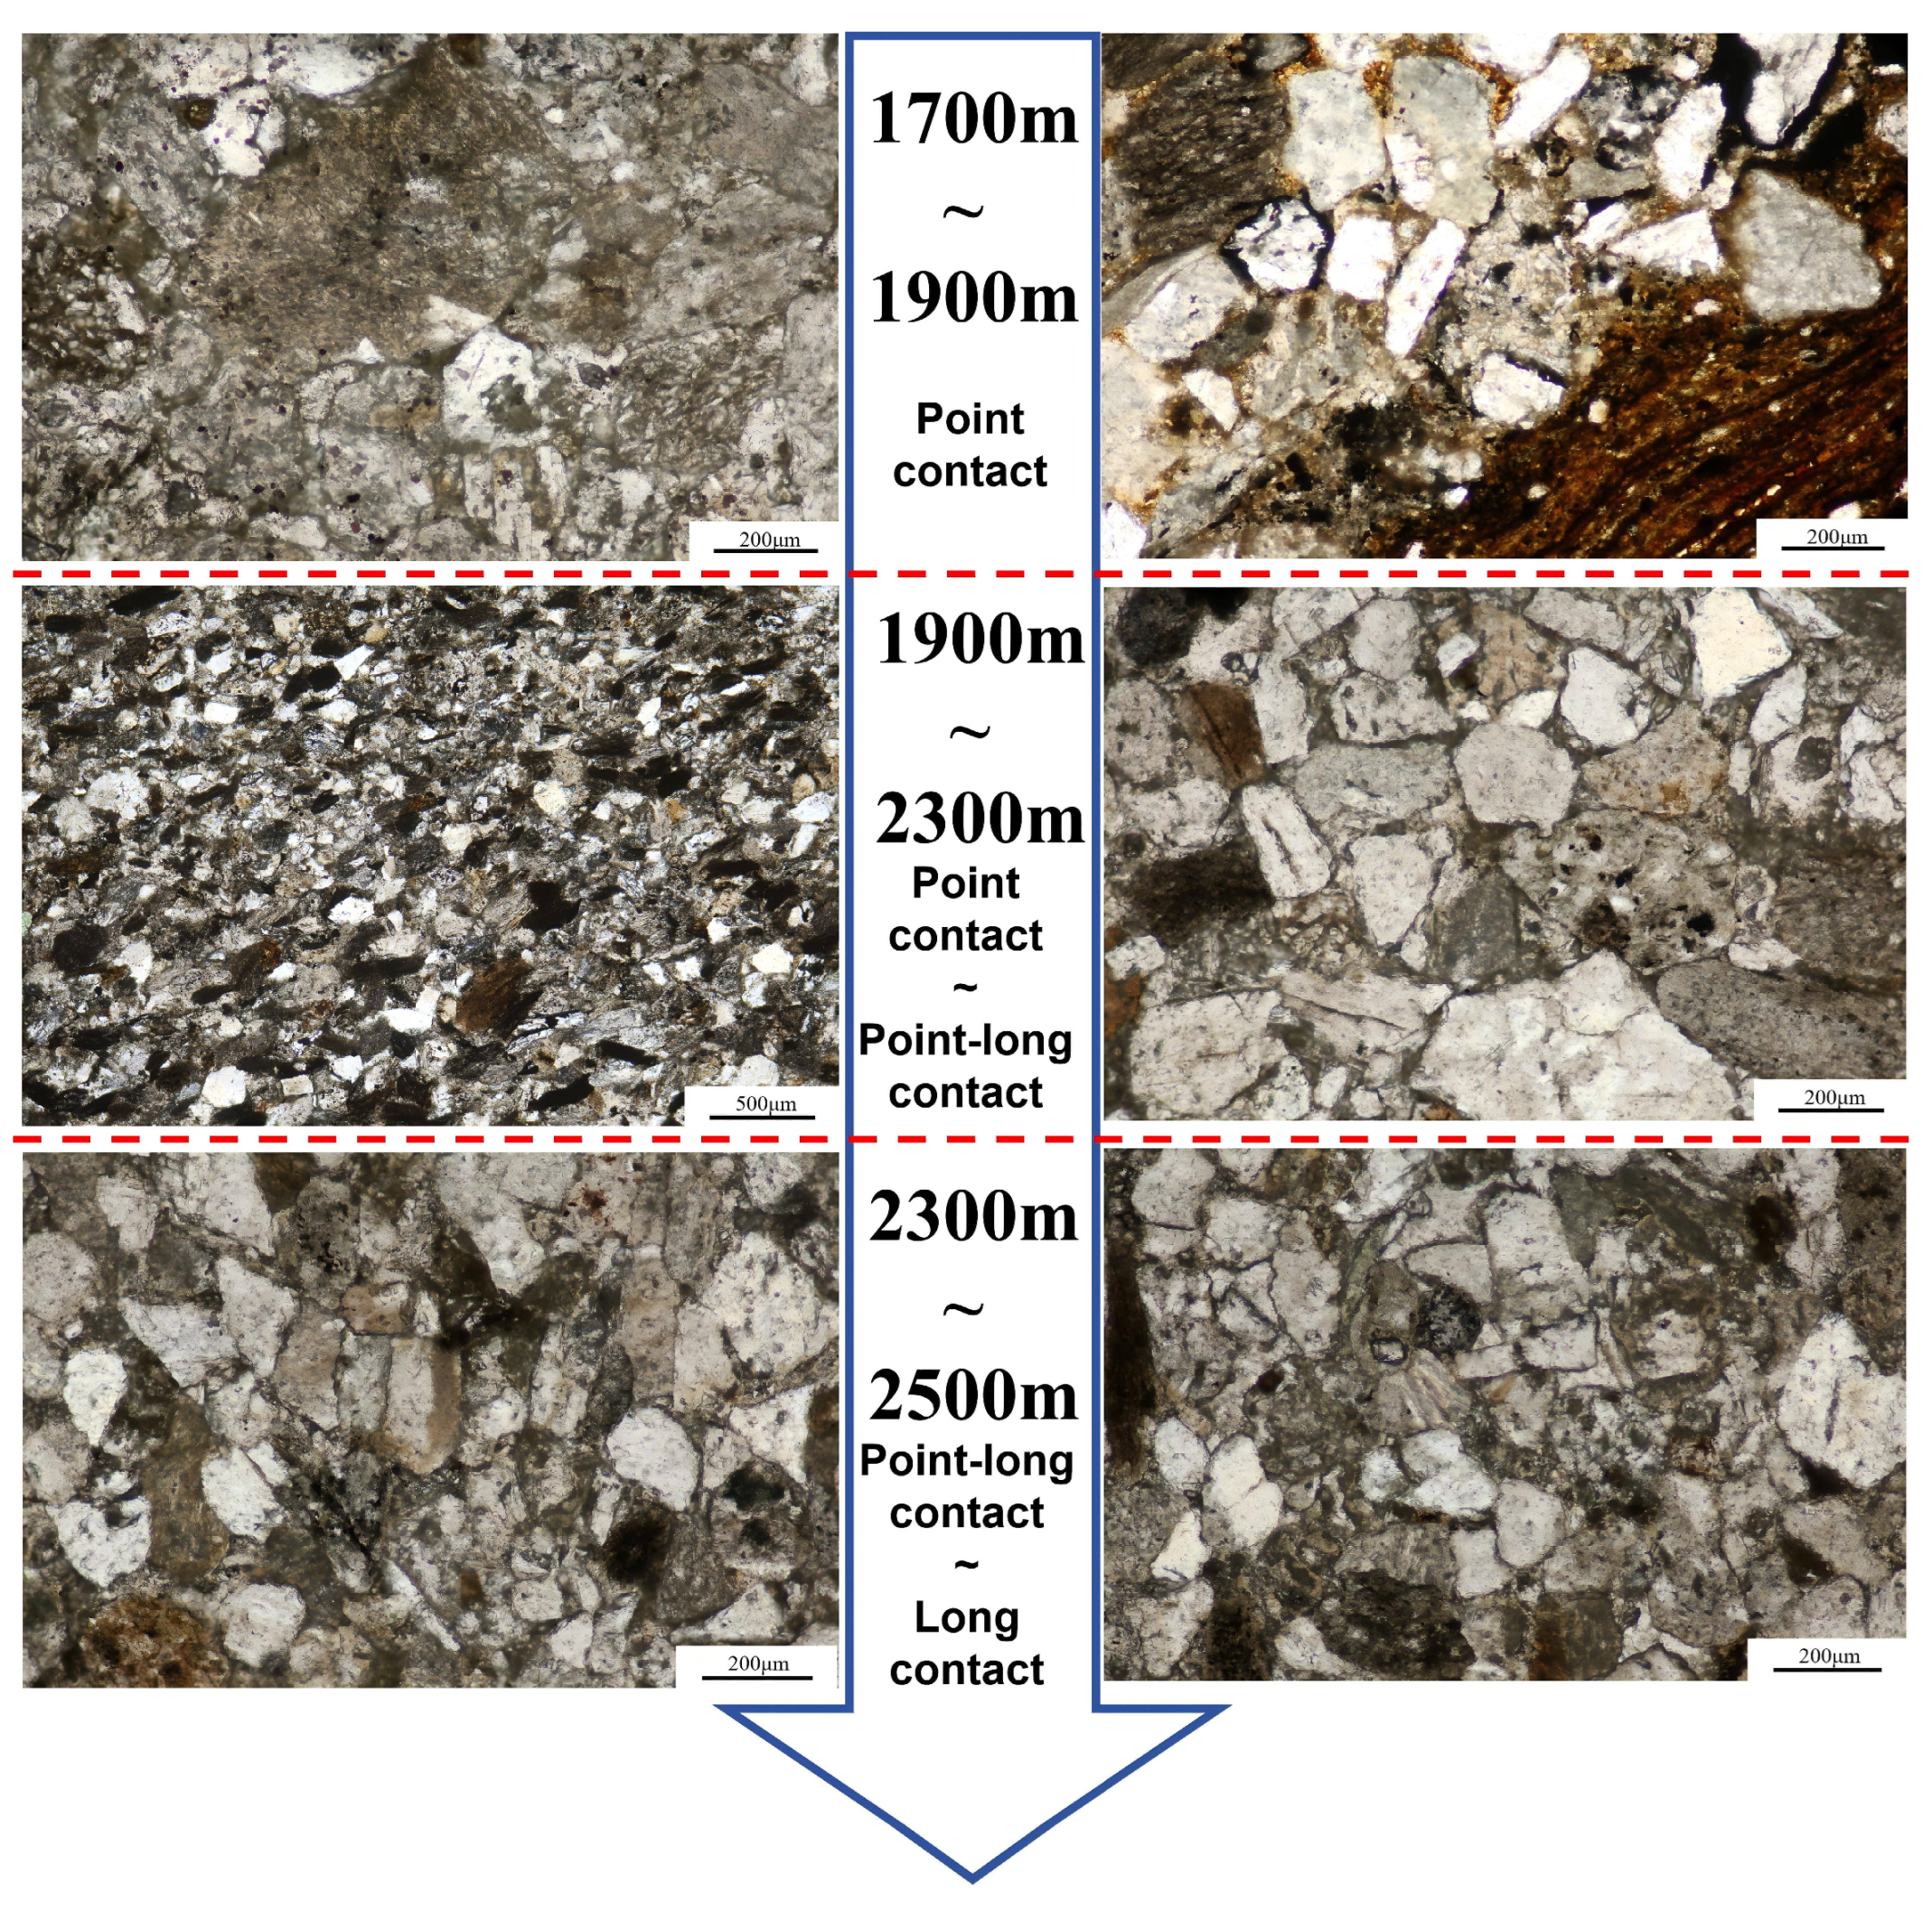
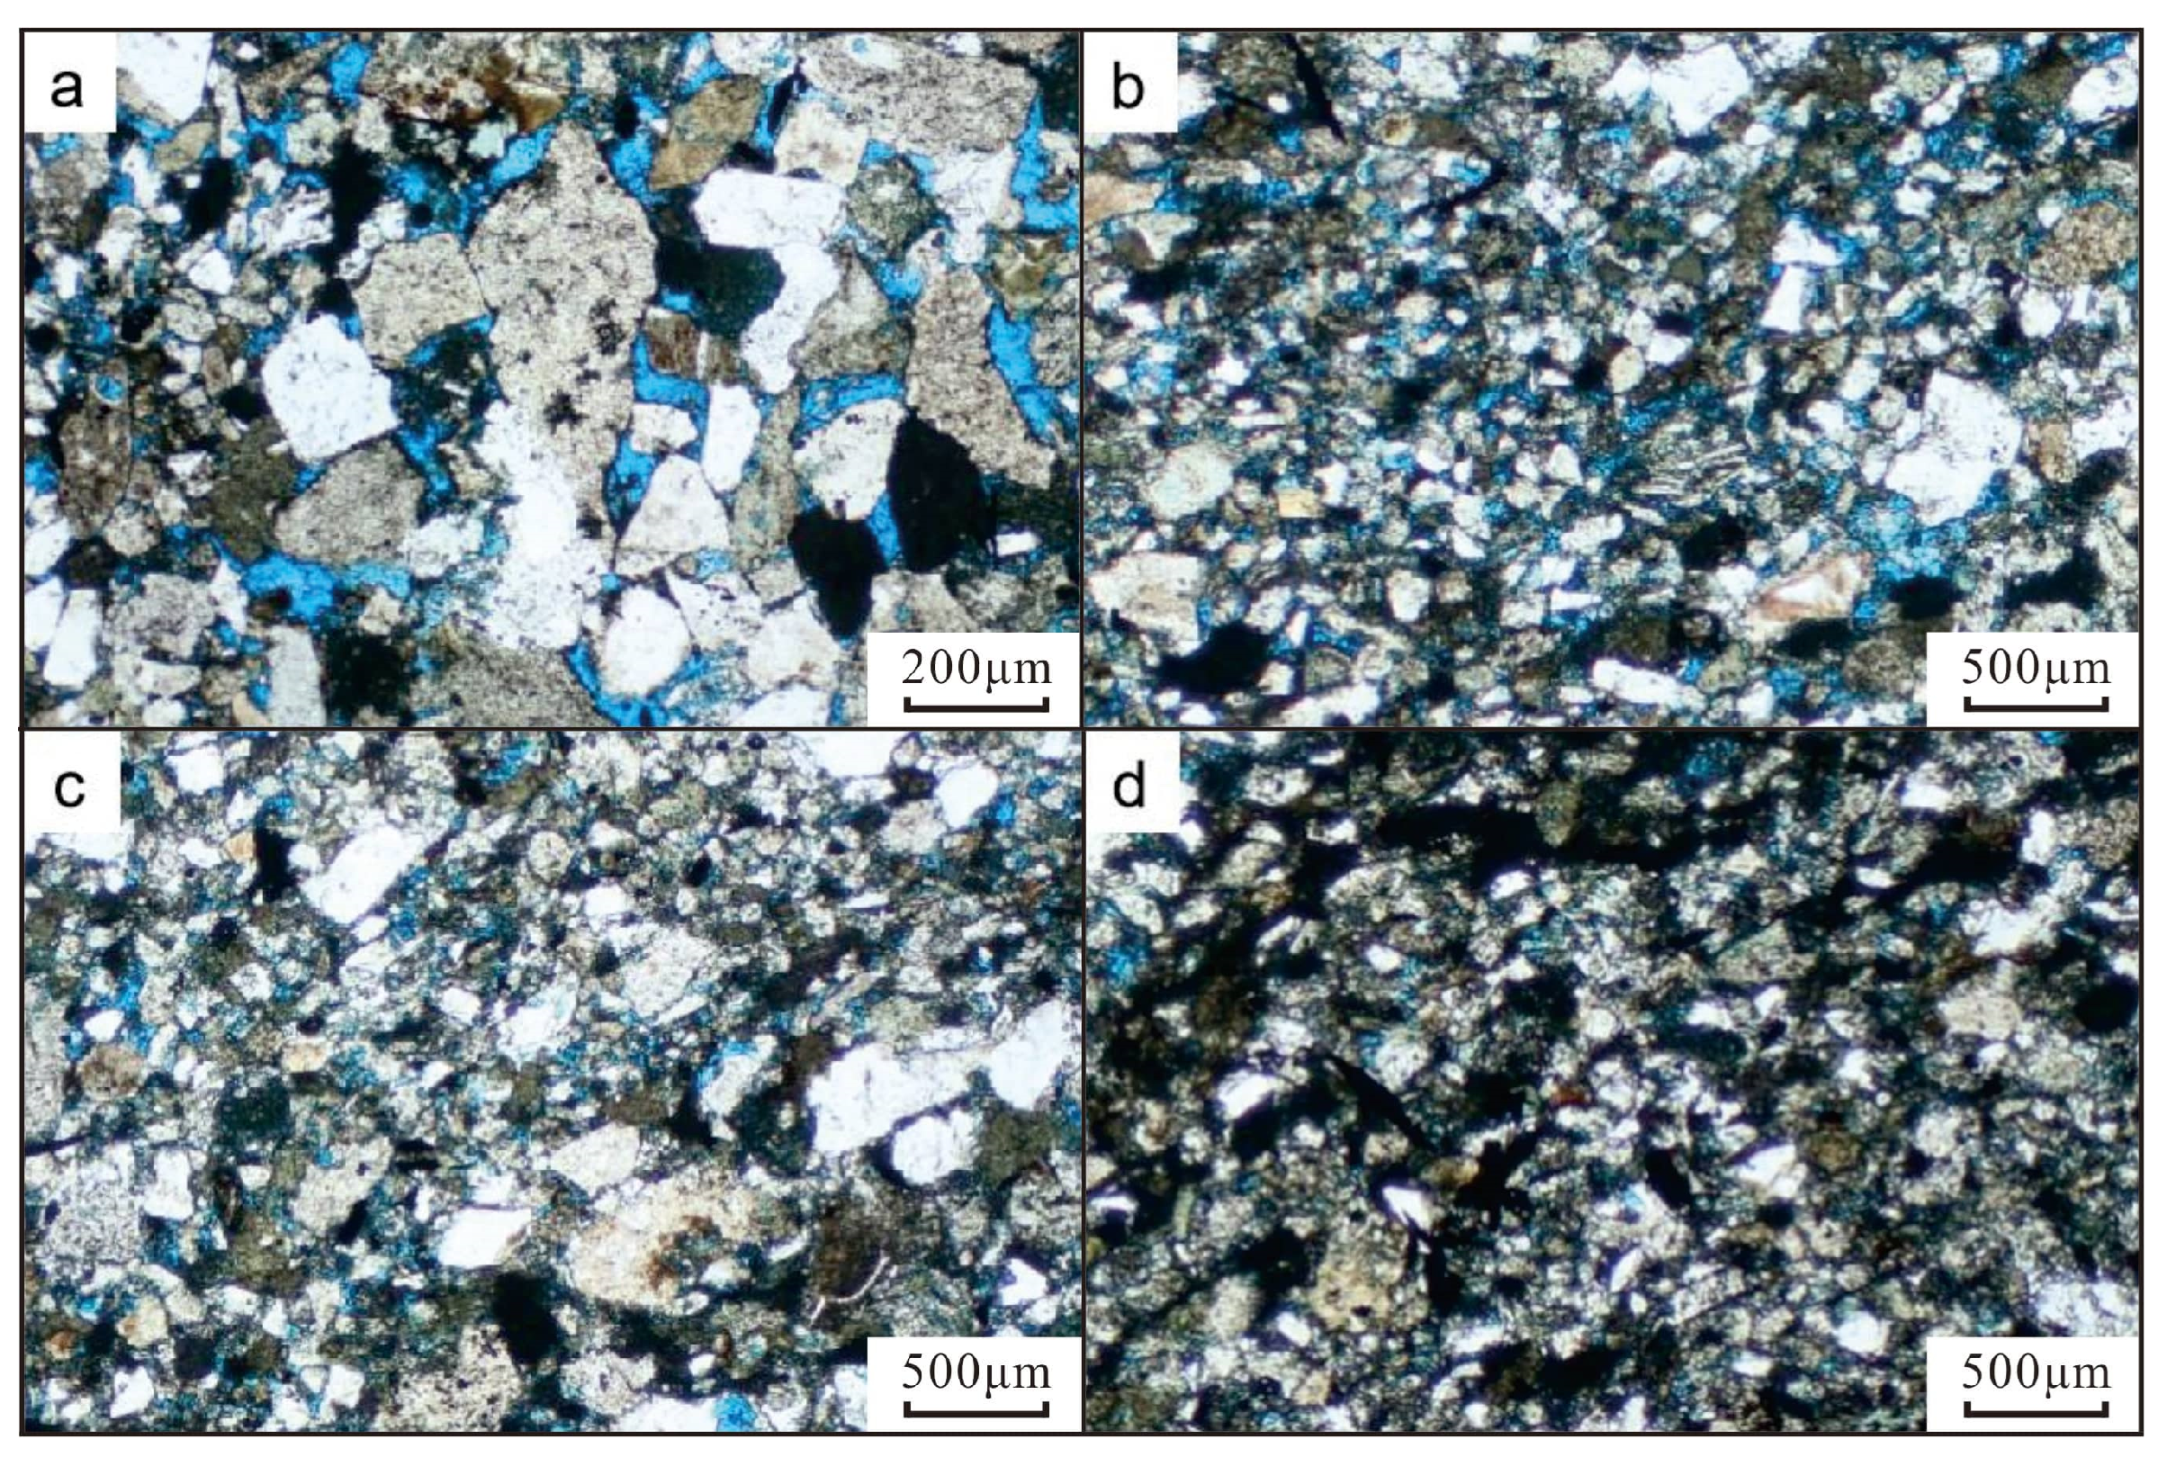
The gravity-flow reservoirs of the Jiufotang Formation generally exhibit moderate compaction intensity, and the grain contact relationships are mainly point contacts and point-long contacts. The compaction characteristics are strictly controlled by burial depth vertically, presenting three evolutionary stages: (1) 1700–1900 m shallow burial interval: Compaction is relatively weak. Grains are dominated by point contacts, and primary pores have intact morphologies and good connectivity. (2) 1900–2300 m medium burial interval: The degree of compaction increases to moderate. Large grains maintain point contacts, while fine grains mostly exhibit long contacts distributed within the crevices. (3) 2300–2500 m deep burial interval: It exhibits moderate to strong compaction characteristics. Grains are tightly packed, dominated by long contacts, with localized occurrences of concavo-convex contacts, directional arrangement of grains (grain orientation), and feldspar grain fracturing (Figure 12).
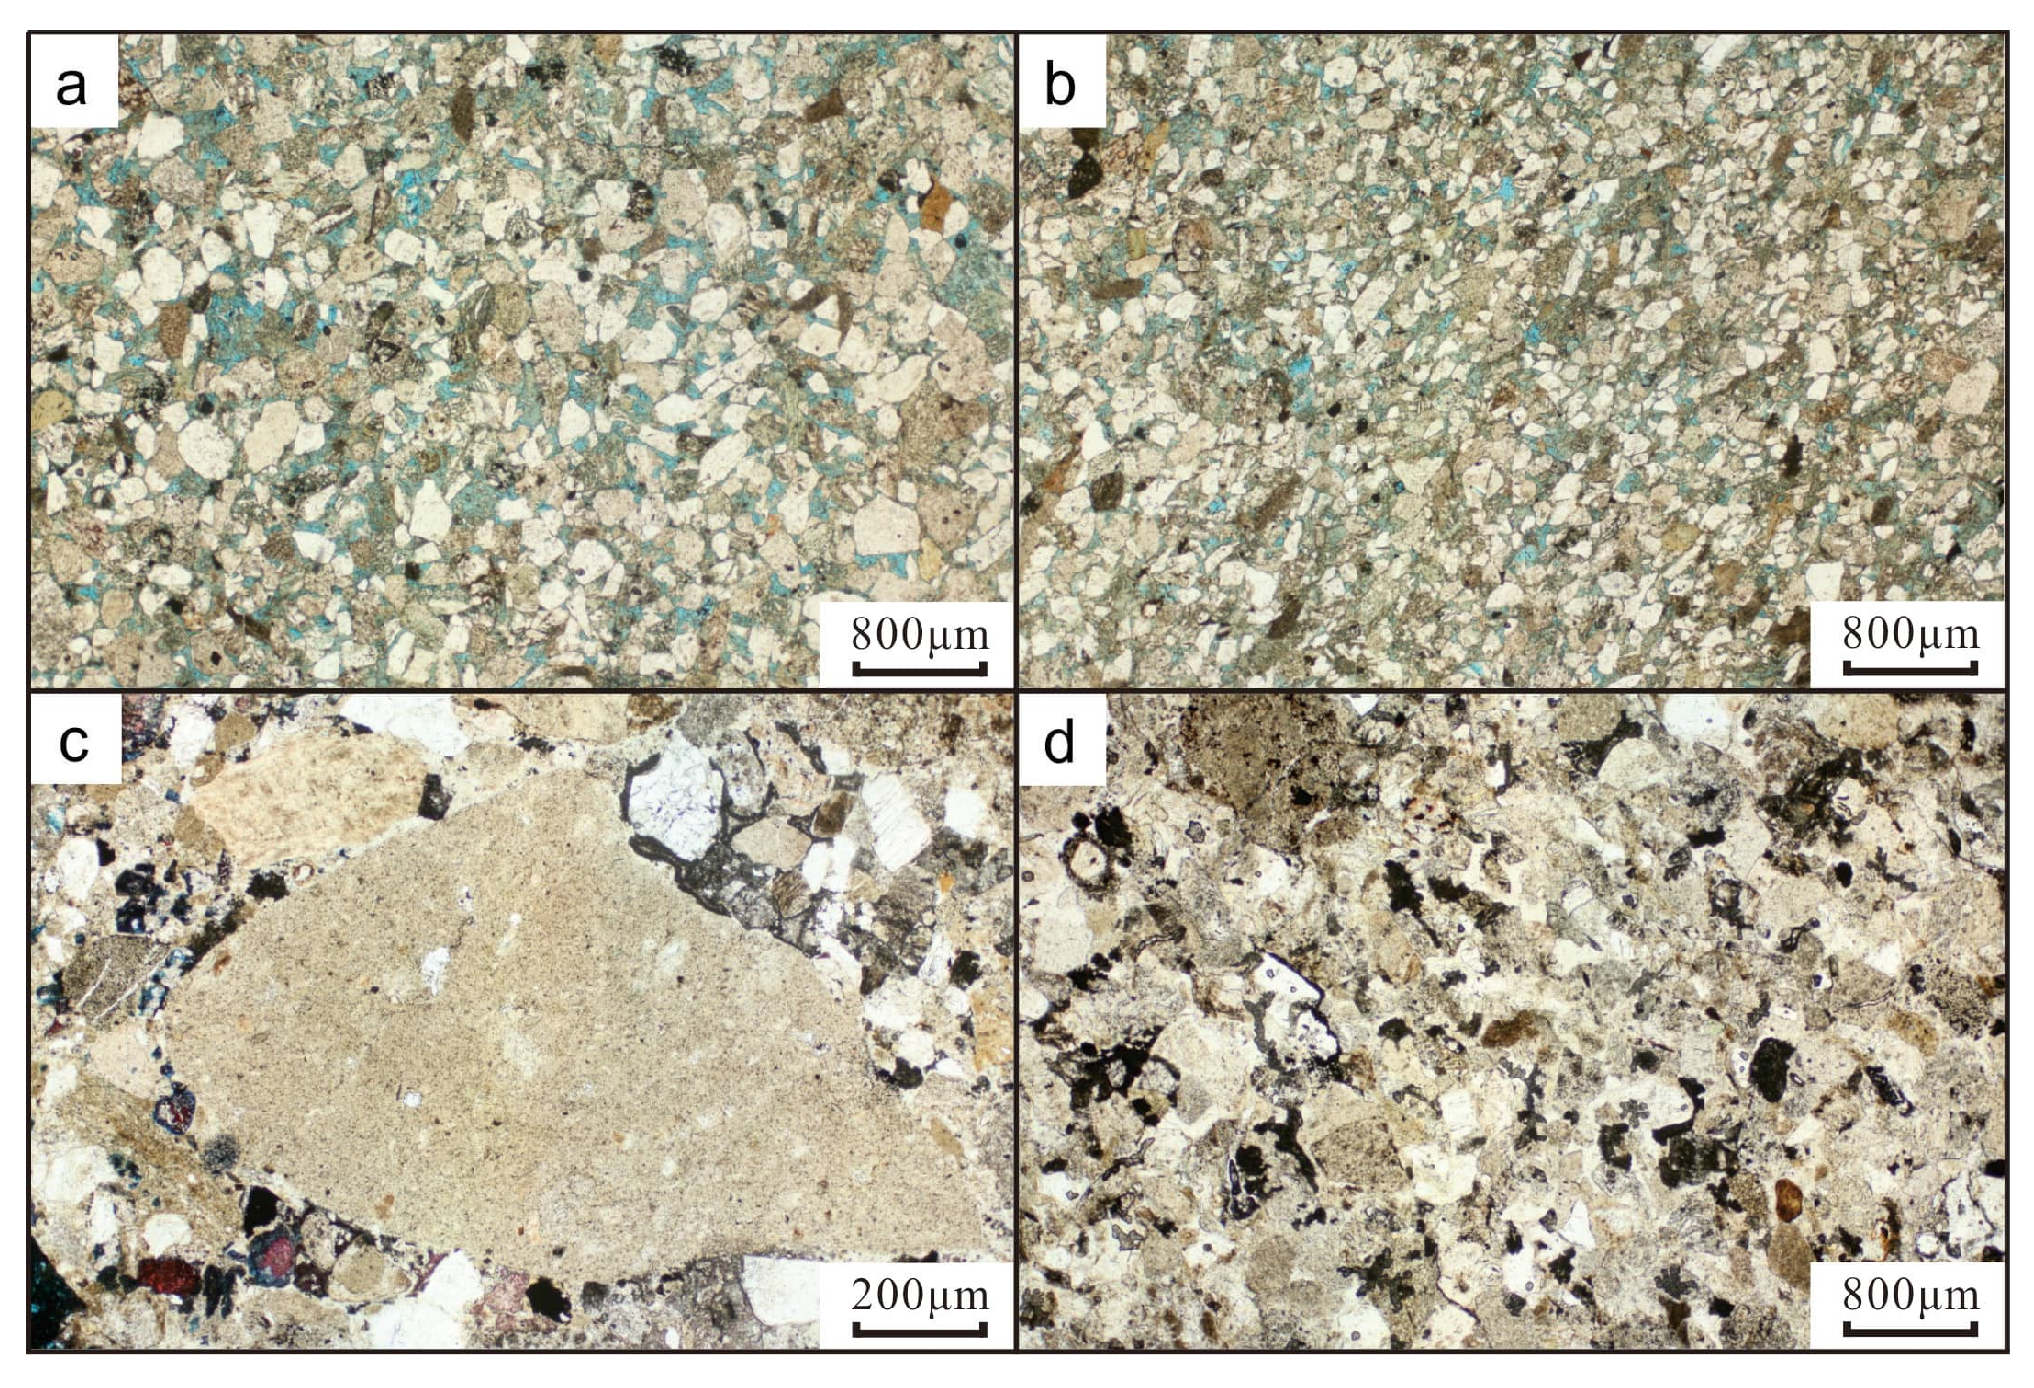
Furthermore, under the same burial depth background, the compaction resistance of different dominant lithofacies shows significant differences. The Scm and Sfc lithofacies, representing debris-flow channels, have the strongest compaction resistance, still retaining some point contacts and abundant primary pores at a burial depth of 2200.3 m. The Scb lithofacies, representing slide masses, ranks second, with point-long contacts and primary intergranular pores still visible at a depth of 2351.6 m. The MSdb lithofacies, representing slump mass, has weak compaction resistance, with directional grain arrangement and fracturing already appearing at a shallower depth of 1912.7 m. The MSfc lithofacies, representing debris-flow lobes, has the poorest compaction resistance, generally exhibiting long to concavo-convex contacts at 2384.1 m, where primary pores are essentially eliminated (Figure 13).

4.4.2. Characteristics of Cementation

The reservoirs develop three types of cementation: carbonate, clay mineral, and weak siliceous cementation, among which carbonate cementation is dominant (Figure 14):
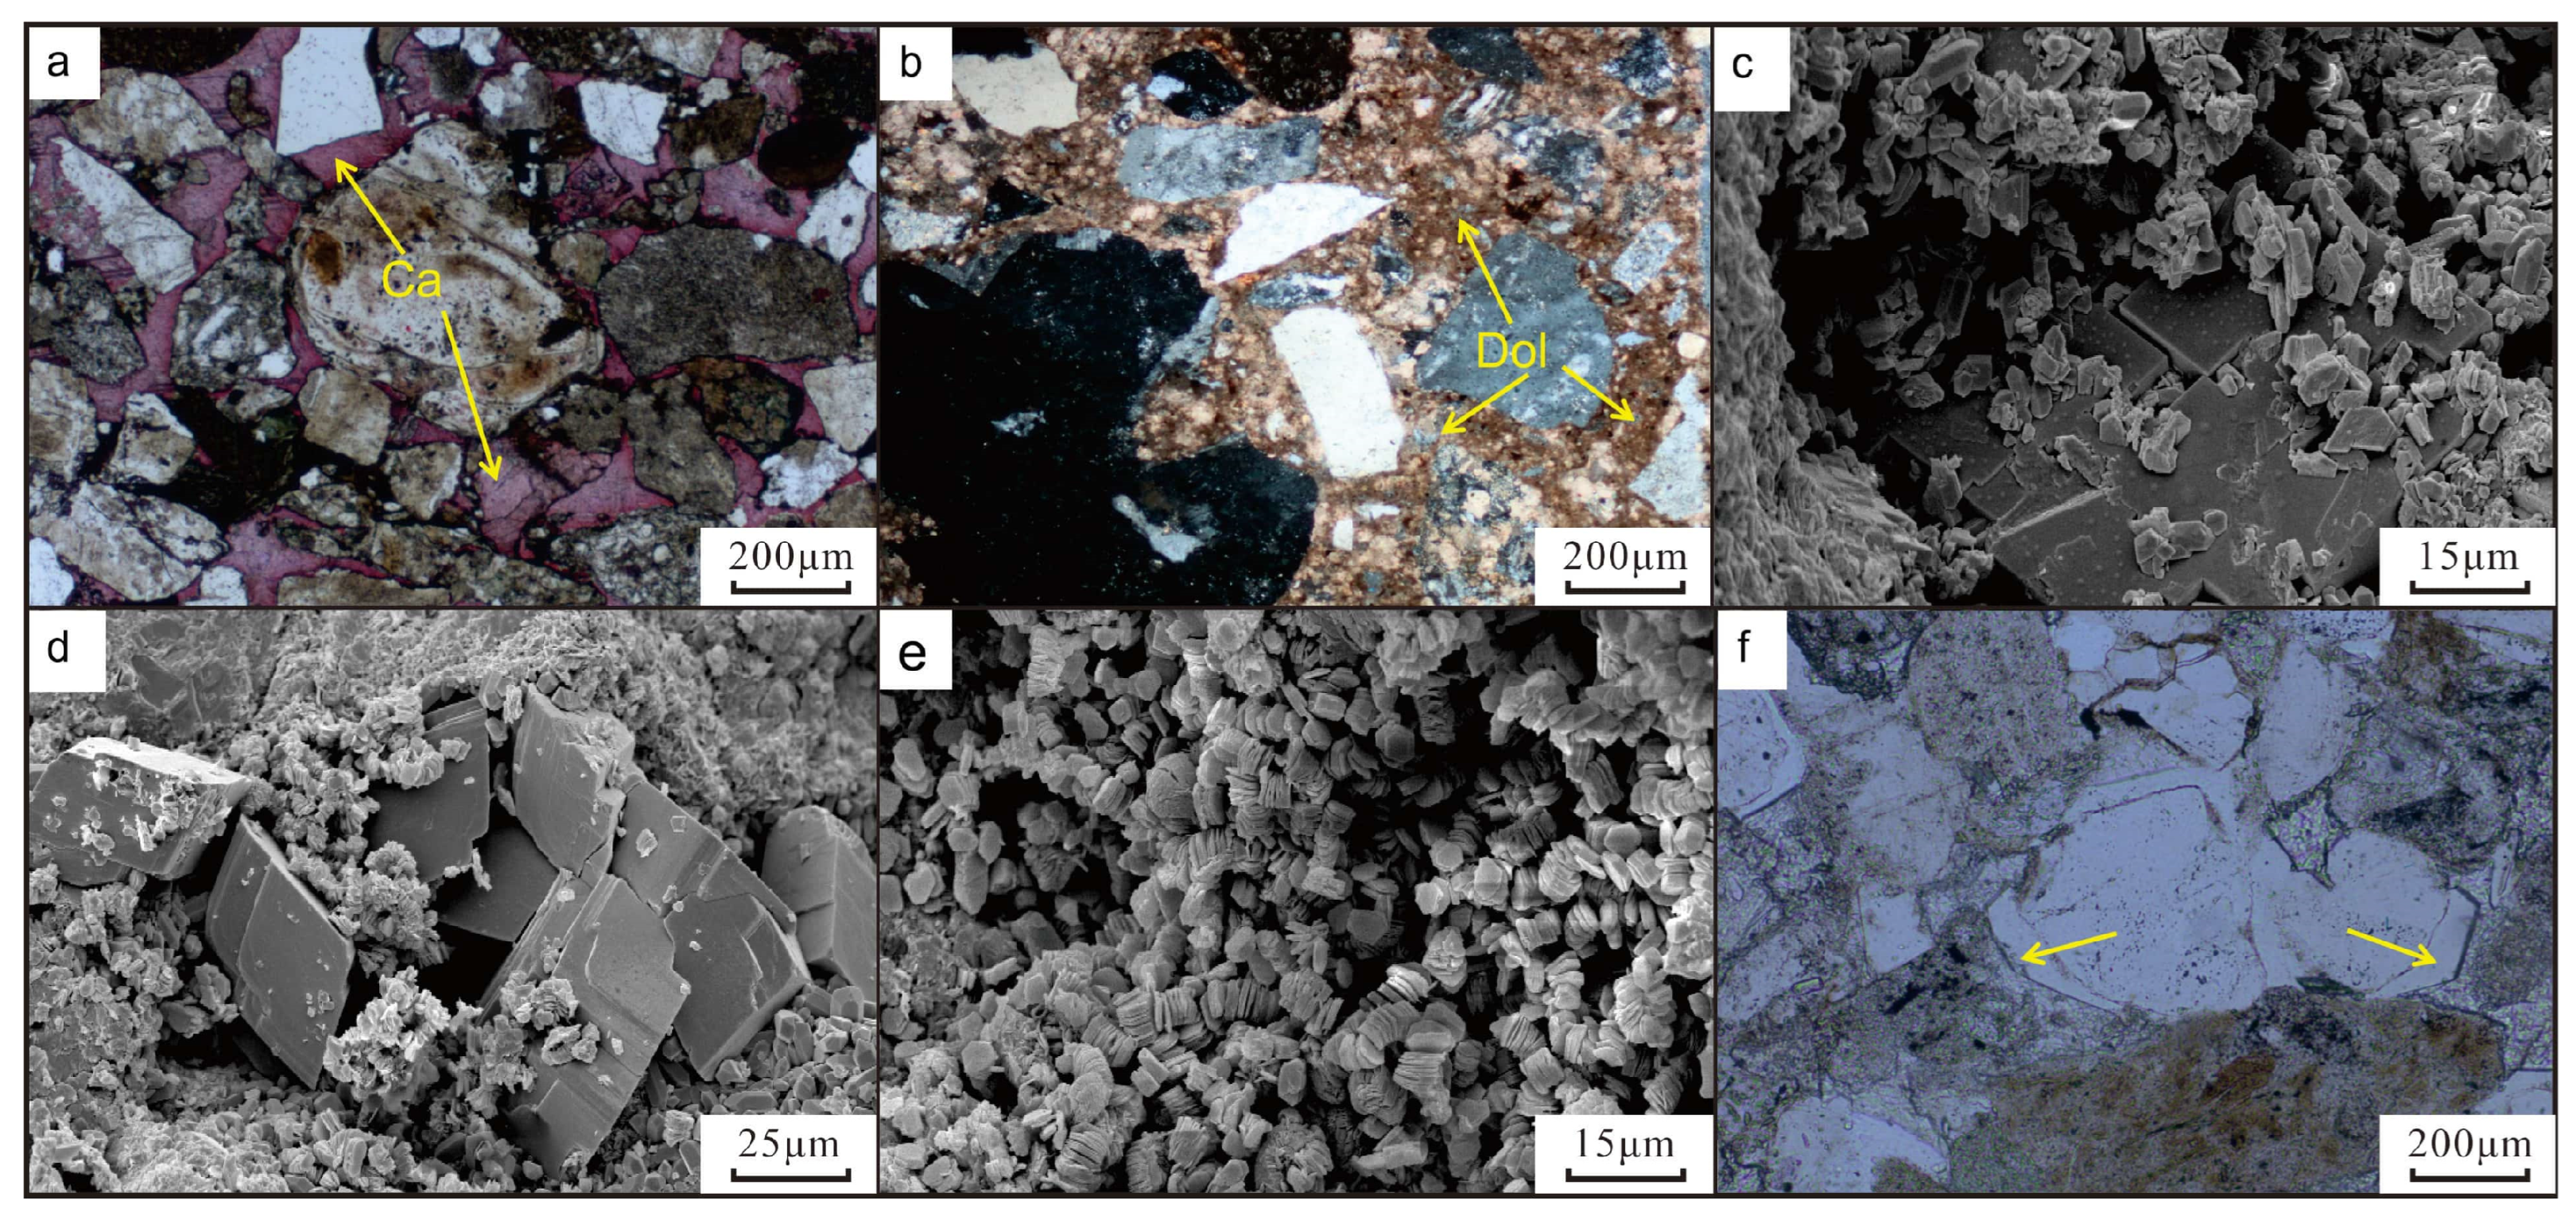
(1) Carbonate cementation: It mainly occurs in the early diagenetic stage, dominated by calcite and dolomite. Both primarily occur as basal cementation or large-area poikilotopic development, where detrital grains float within the cements. The cements are distributed relatively evenly and coordinate conformably with sedimentary structures such as bedding. Characteristics of synchronous deposition with detrital grains can be observed (Figure 14a,b), and typical late-stage diagenetic cements like ferroan calcite or ferroan dolomite are not observed. Carbonate cements often co-occur with other minerals, commonly with microcrystalline quartz and kaolinite attached to the surface of carbonate cements (Figure 14c,d). The quartz and kaolinite have fine crystal forms and poor crystallization, indicating an early formation period. It is inferred that they were carried from terrigenous detritus during the rapid deposition of slump-type gravity flows. This also indirectly suggests that the slump-type gravity-flow reservoirs mainly experienced early carbonate cementation accompanying deposition.
(2) Clay mineral cementation: Whole-rock XRD analysis (Table 4) shows that the absolute content of authigenic clay minerals in the reservoirs is relatively low. The vast majority of clay minerals are of primary origin, mainly carried from terrigenous detritus during the depositional period, and exist abundantly in lithologies with high argillaceous content. Compared to primary clay minerals, authigenic clay minerals exist more in the form of cements within the intercrystalline and intergranular pores of the reservoir. In the relative composition of clay minerals, kaolinite dominates (generally > 40%), mainly filling the pores in the form of vermicular aggregates (Figure 14e), and often co-occurs with carbonate minerals. This is followed by the illite/smectite (I/S) mixed layer and illite. The overall degree of clay cementation is much weaker than that of carbonate cementation.
(3) Siliceous cementation: It is extremely rare, with almost no development. Only localized quartz overgrowths (Figure 14f) or small amounts of microcrystalline quartz adhering to the surface of carbonate minerals to fill pores are observed in a few thin sections and SEM fields of view.

4.4.3. Characteristics of Dissolution

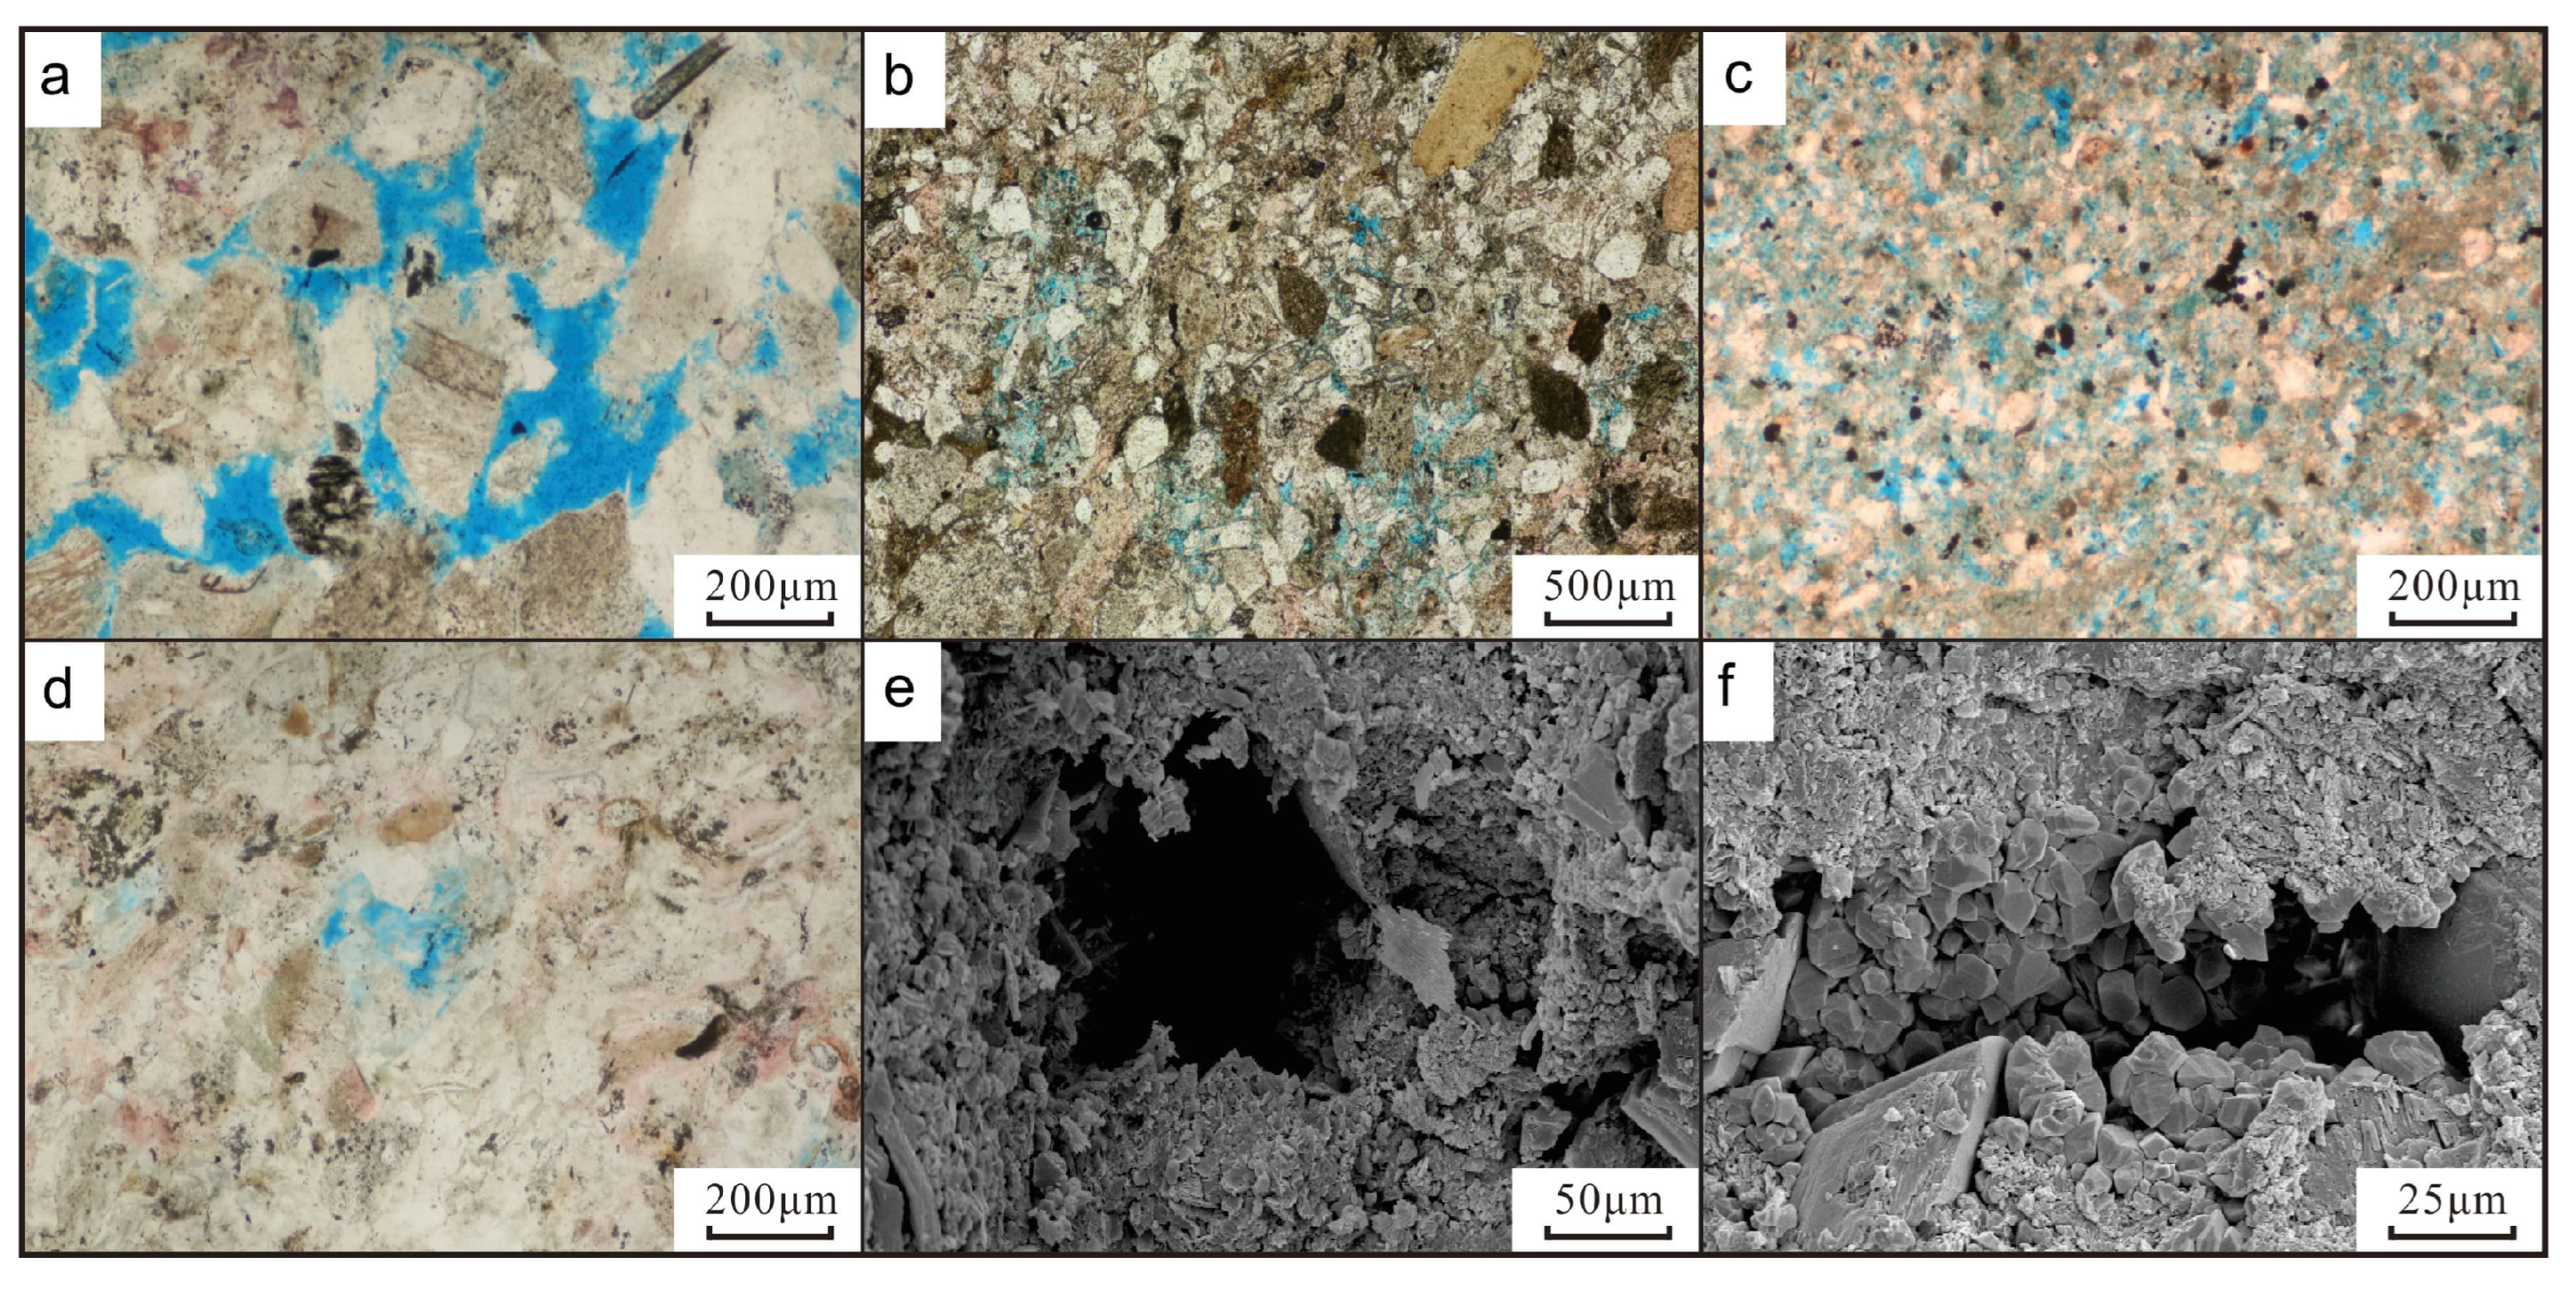
The overall degree of dissolution within these deposits is relatively weak, primarily dominated by locally developed intergranular and intragranular dissolution pores. Its development degree is also significantly controlled by the fabric of the dominant lithofacies (Figure 15):
In the Scm and Sfc lithofacies developed in debris-flow channels, benefiting from the relatively clean grain framework and unblocked primary pore networks, dissolution fluids can effectively invade and primarily act on the margins of feldspar and lithic fragments. This forms uneven dissolution spots, objectively playing a role in enlarging primary pores.
In the MSdb lithofacies, which constitutes the main body of the slumps, influenced by differential compaction caused by the sand–mud mixed fabric, dissolution exhibits extremely strong heterogeneity. It is mainly concentrated in the sandy parts with low argillaceous content and weak compaction, where locally formed secondary dissolution macropores can reach up to 140 μm in diameter.
(3) In the MSfc lithofacies representing debris-flow lobes, due to the high argillaceous matrix content, extremely poor grain sorting, and extremely tight early compaction, the seepage activity of acidic fluids is severely restricted, leading to extremely weak dissolution modification. Only a small amount of isolated intergranular micropores and intragranular honeycomb dissolution pores within feldspar are developed in this lithofacies, and the interior of the dissolution pores is often accompanied by fillings of authigenic kaolinite and microcrystalline quartz.

5. Discussion

5.1. Innate Control of Sedimentary Flow Transformations on Initial Reservoir Quality

The flow transformations of deep-water gravity flows during downslope transport (i.e., sliding—slumping—debris flow) not only determine the spatial distribution of lithofacies but also fundamentally shape the petrophysical fabric characteristics of the sediments, thereby laying the innate material foundation for initial reservoir quality.
In the early stage of mass transport (slide mass, Scb lithofacies), the sediments had not yet undergone long-distance transport and strong mixing, and their physical structure was largely inherited from the excellent attributes of strong hydrodynamics and efficient winnowing of fine-grained components in the delta front environment (delta front). When the fluid evolves into a high-density sandy debris flow (Scm and Sfc lithofacies, mainly developed in debris-flow channels), benefiting from the “freezing” rapid accumulation mechanism of the mass, the sand bodies effectively avoid the deep incorporation of fine-grained suspended materials and maintain medium-to-good grain sorting. Quantitative restoration results based on Sneider’s chart [43] (Table 5) indicate that the sandstones in and debris-flow channels are coarser-grained and well-sorted, with their original porosity ranking the highest in the entire area (30.15%–32.59%). This highly pure and structurally mature grain framework innately determines, right from the depositional stage, that it is highly prone to developing a Type I macropore network with excellent connectivity. The pore properties of slide masses are secondary, owing to partial mixing with fine-grained argillaceous components during the sliding process, which results in relatively poorer sorting and lower porosity.
Conversely, with further rheological transformations, especially during the strong plastic deformation stage in slump masses (MSdb lithofacies) and the viscous transport process in muddy debris flows (MSfc lithofacies, commonly found at the margins of lobes), abundant argillaceous matrix is incorporated and fills the spaces between framework grains. This fluid mixing process leads to an overall fining of the sediment grain size and a sharp deterioration in sorting. Restricted by this inferior initial fabric, the original porosity of slump mass drops to 28.69%–29.89%, while that of debris-flow lobes is even lower, at 23.95%–27.26%. The innately high argillaceous content directly blocks fluid pathways, dooming these sediments to form only Type II or Type III pore structures with severely restricted seepage capacities.
As can be seen from the foregoing analysis of the flow transformation processes of deep-water gravity flows and the sedimentary fabric and reservoir properties of different lithofacies, the initial quality of slump-type gravity-flow reservoirs is not controlled merely by a single textural parameter, but governed by the comprehensive superimposed effect of grain size and sorting regulated by flow transformations. Under conditions of comparable grain size, the differentiation in sorting caused by fluid phase transitions exerts a decisive control on the formation of the initial pore-throat network of the reservoirs.

5.2. Differential Diagenesis Dominated by Lithofacies Fabric

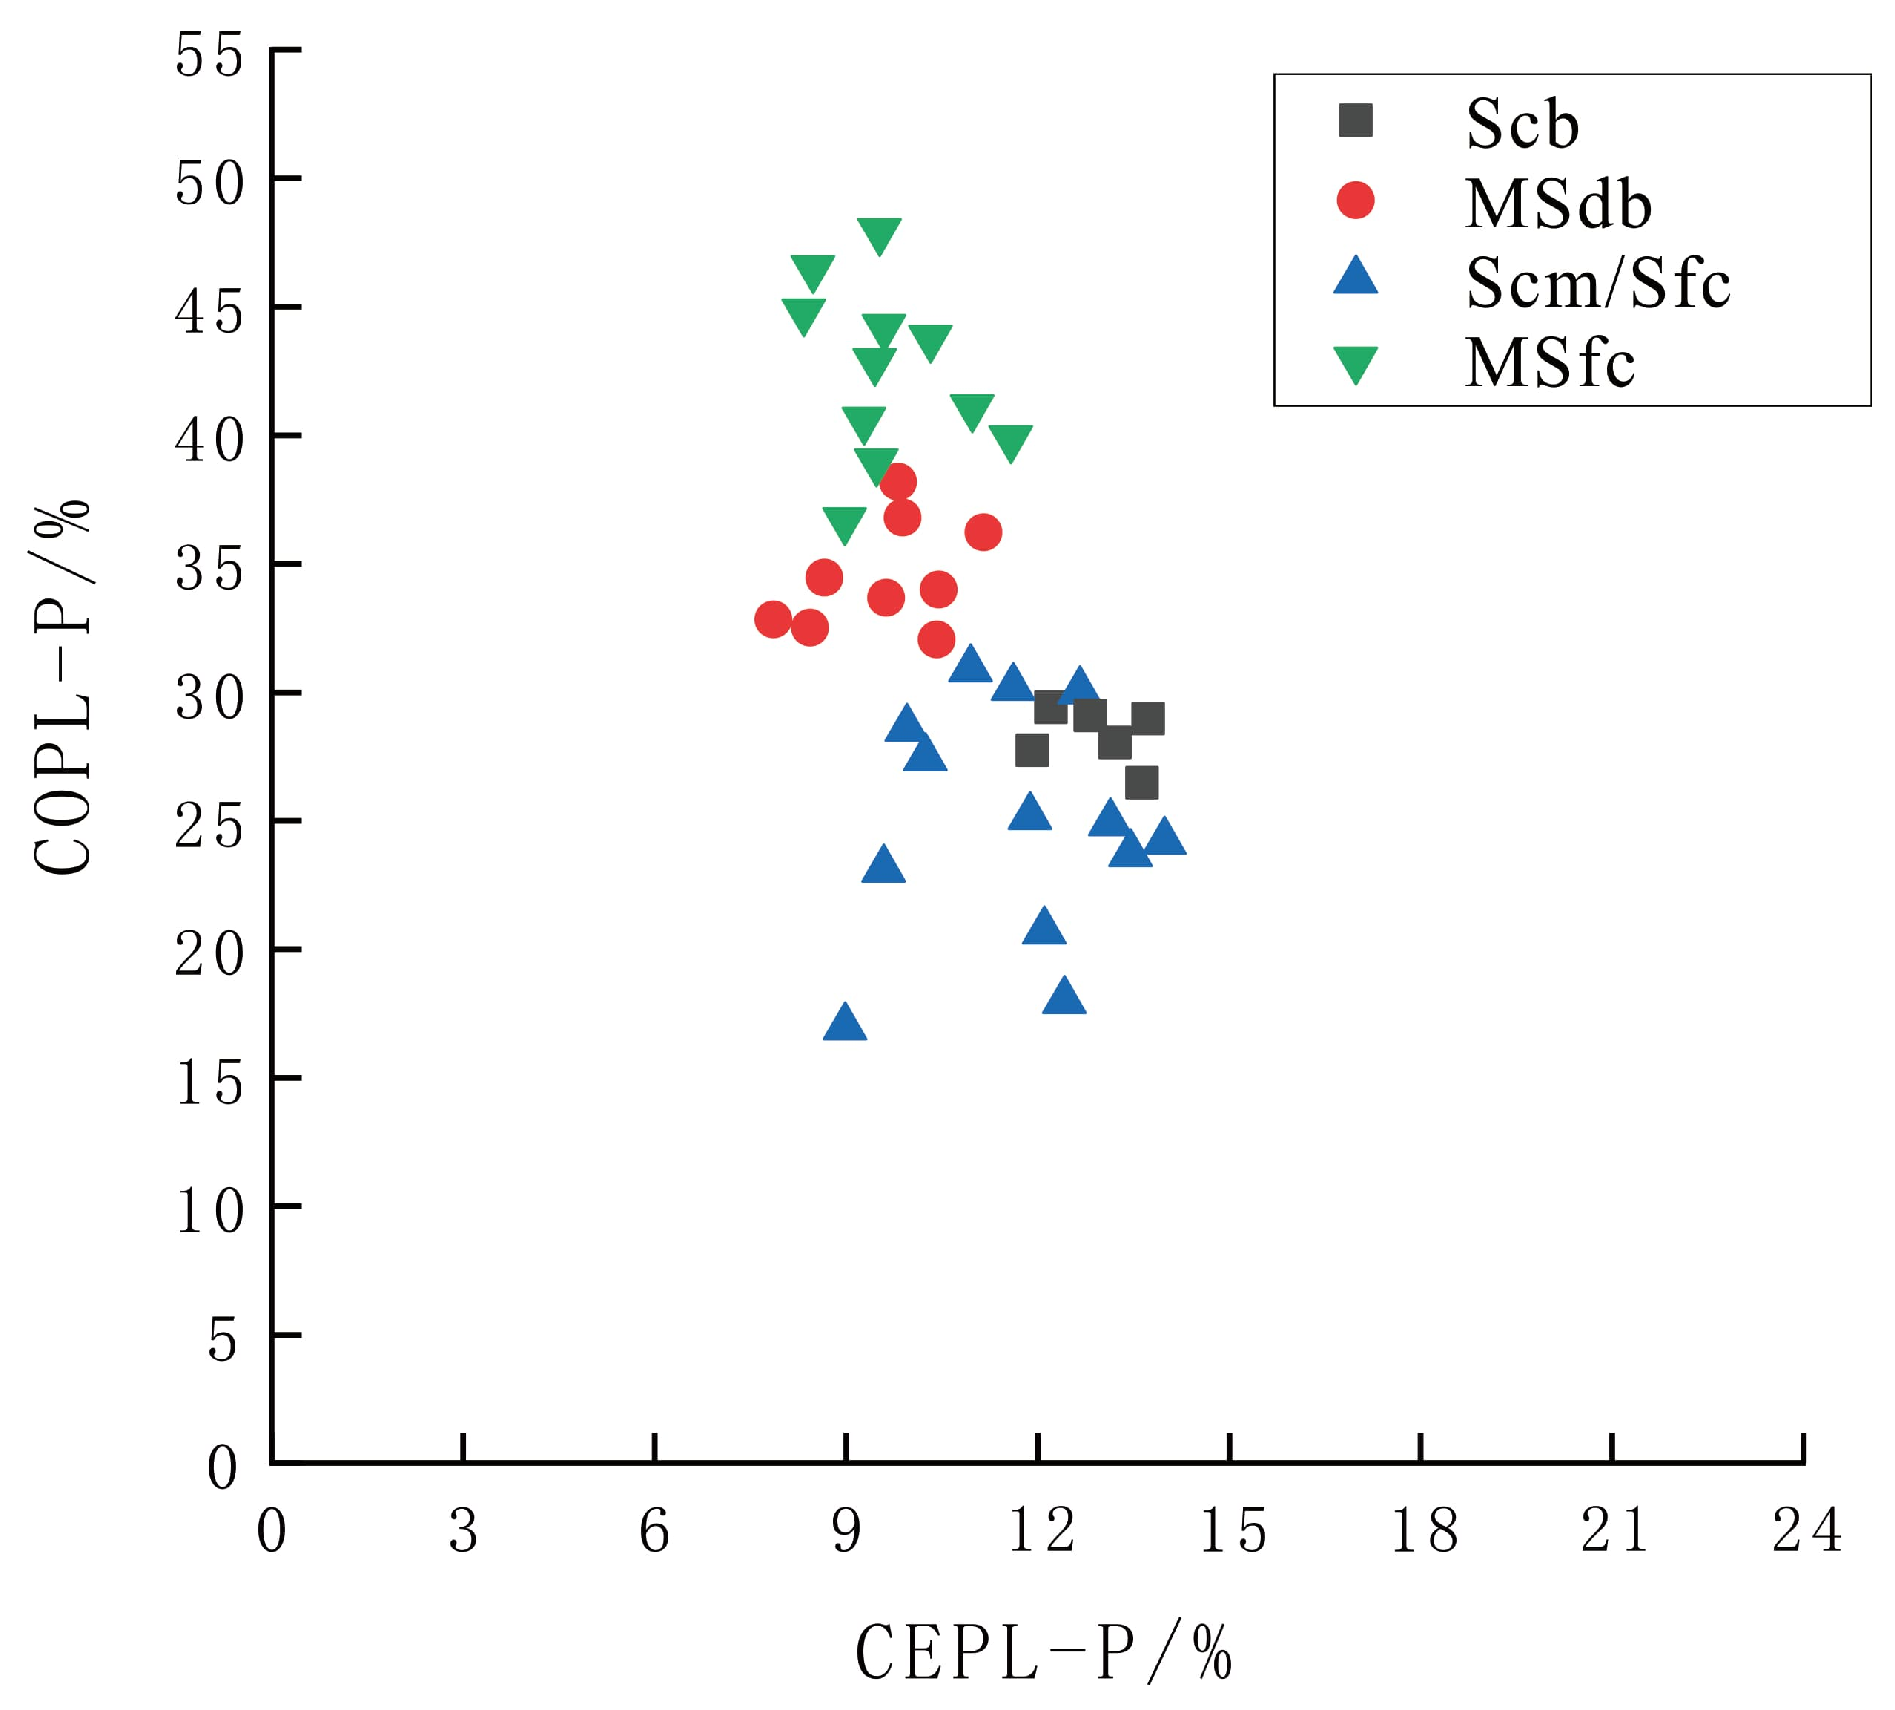
The initial pore network of the reservoirs underwent significant differential modification during the subsequent burial diagenesis. Quantitative restoration based on Lundegard’s porosity evolution formula [44] indicates that the diagenetic porosity reduction within these slump-type gravity-flow deposits is primarily dominated by compaction (average porosity reduction rate of 31.6%), followed by cementation (average porosity reduction rate of 12.3%), while the porosity-increasing effect of dissolution is relatively limited (average porosity increase of only 3.4%) (Table 6, Figure 16). Therefore, the mechanical stability of the framework during the burial compaction process is the key determining the final porosity retention rate.
The mechanical stability of the framework is essentially controlled by the initial fabric of different lithofacies. For the clean massive sandstone (Scm) with high structural maturity, its extremely low argillaceous content and good grain sorting jointly construct a robust “grain-supported framework” [45,46]. This rigid framework can effectively disperse the overburden pressure during compaction, allowing high-quality lithofacies like Scm to still retain abundant point contacts and primary pores during the medium-deep burial stage below 2200 m (Figure 14). On the contrary, the deformed bedded muddy sandstone (MSdb) and muddy sandstone with floating gravels (MSfc), due to their rich argillaceous matrix and extremely poor sorting, lack effective rigid support between grains. Under continuous compactional stress, the water-rich argillaceous matrix acts as a lubricant, triggering strong grain sliding, rearrangement, and even plastic rheology, which leads to the rapid collapse of the rock framework and the severe squeezing and massive obliteration of the primary pore-throat network [47].
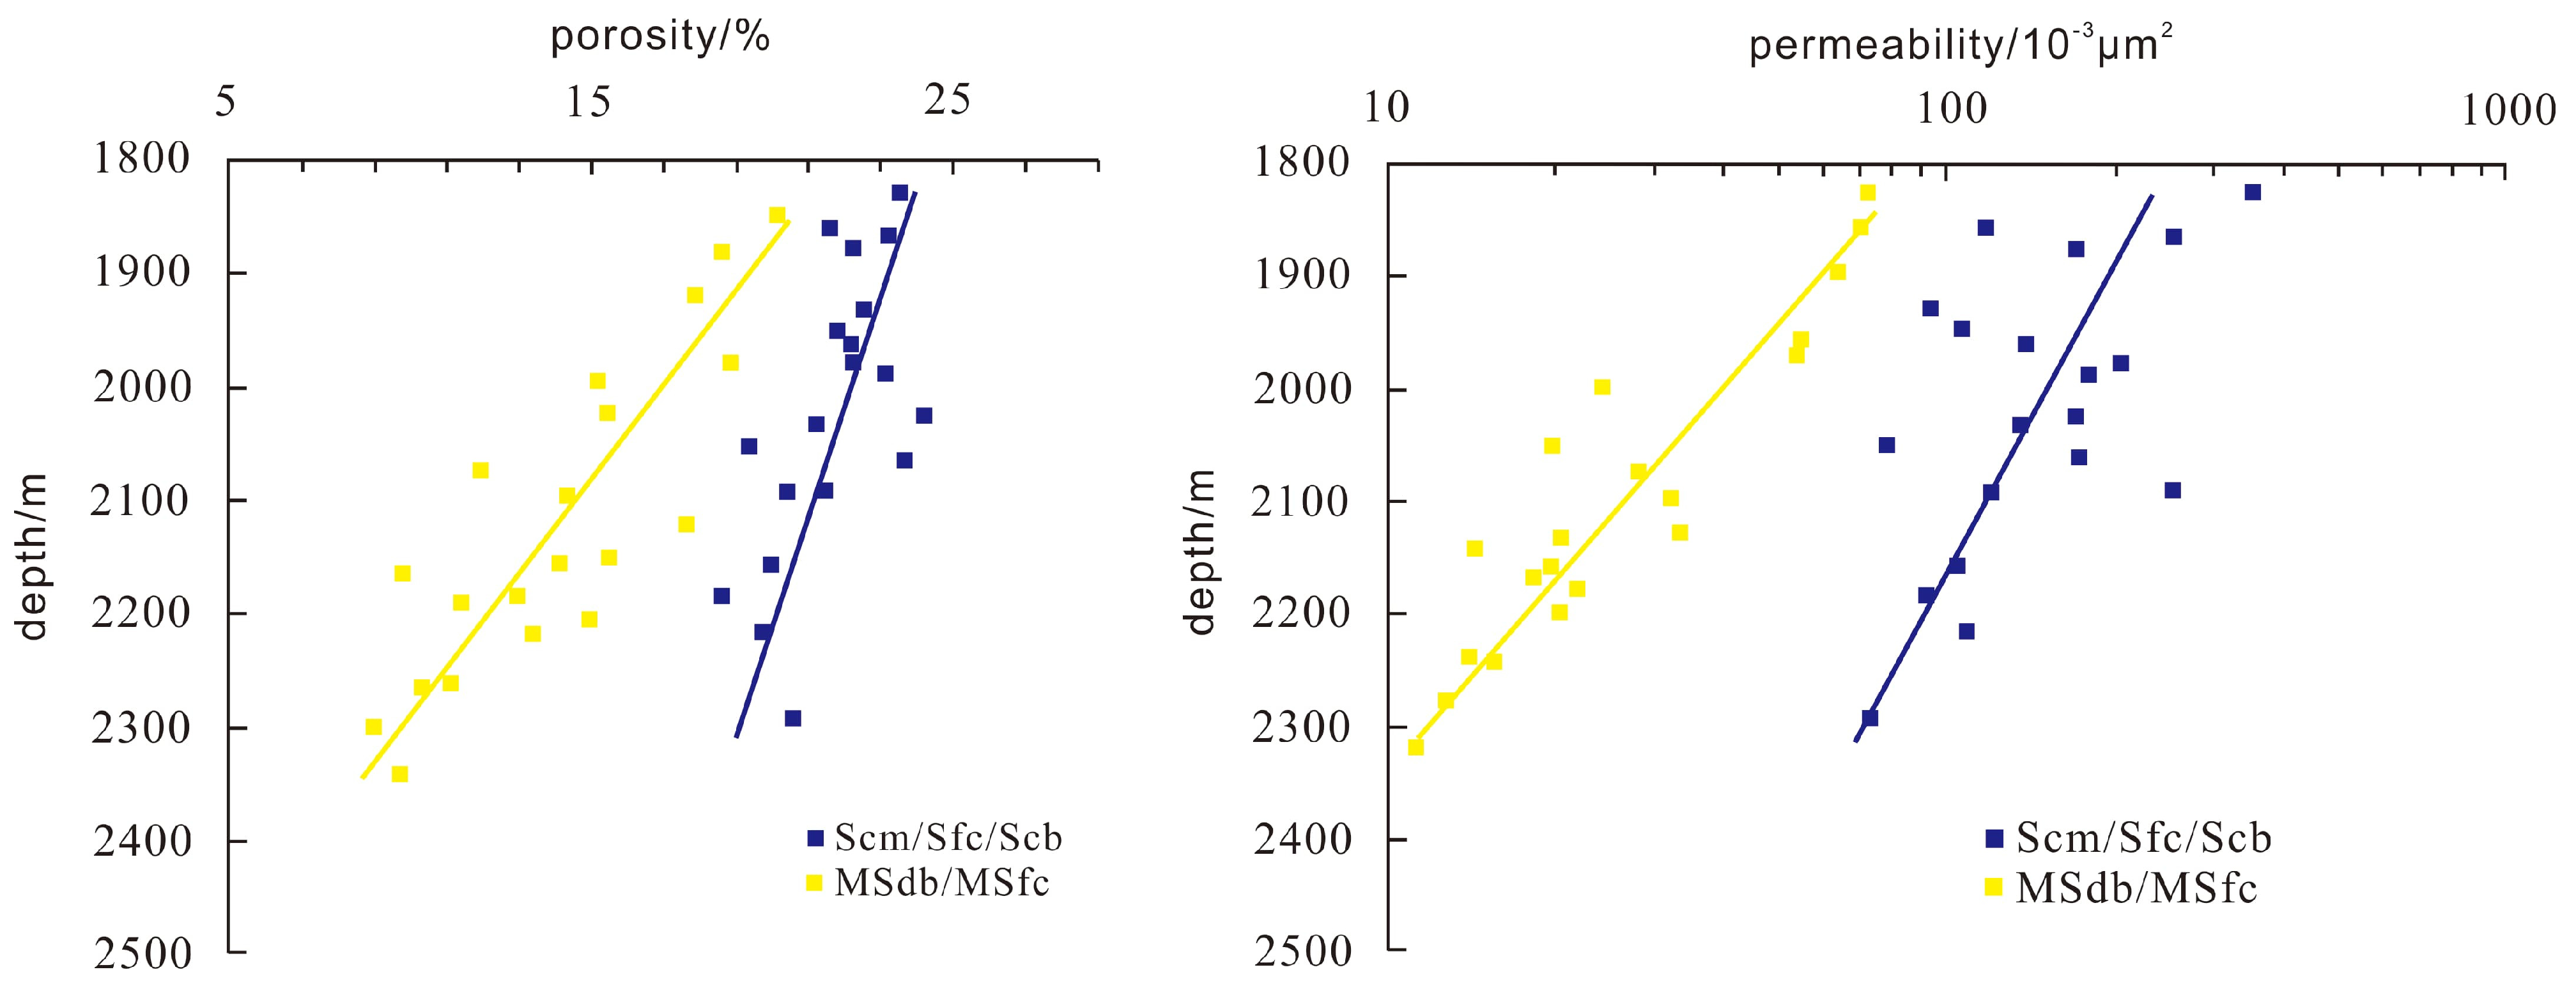
This difference in microscopic mechanical stability is directly mapped onto the dynamic evolution curves of physical properties of different lithofacies with burial depth. Statistical data show that with increasing burial depth, high-quality lithofacies represented by Scm, relying on their strong, rigid framework, exhibit a relatively slow attenuation rate of porosity and permeability, with a gentle overall downward trend. In contrast, mud-rich, inferior lithofacies like MSdb and MSfc show a sharp decline in poro-perm parameters with increasing burial depth due to their easily collapsible framework under compaction (Figure 17). A detailed comparison of samples within the same burial depth interval (depth difference < 150 m) further confirms: although burial depth constitutes the macroscopic background of diagenetic modification, under the same temperature and pressure environment, the lithofacies (detrital composition, sorting, and matrix content) is the fundamental internal cause leading to the drastic differentiation in compaction resistance and thereby widening the gap in the present-day physical properties of the reservoirs (Figure 18).
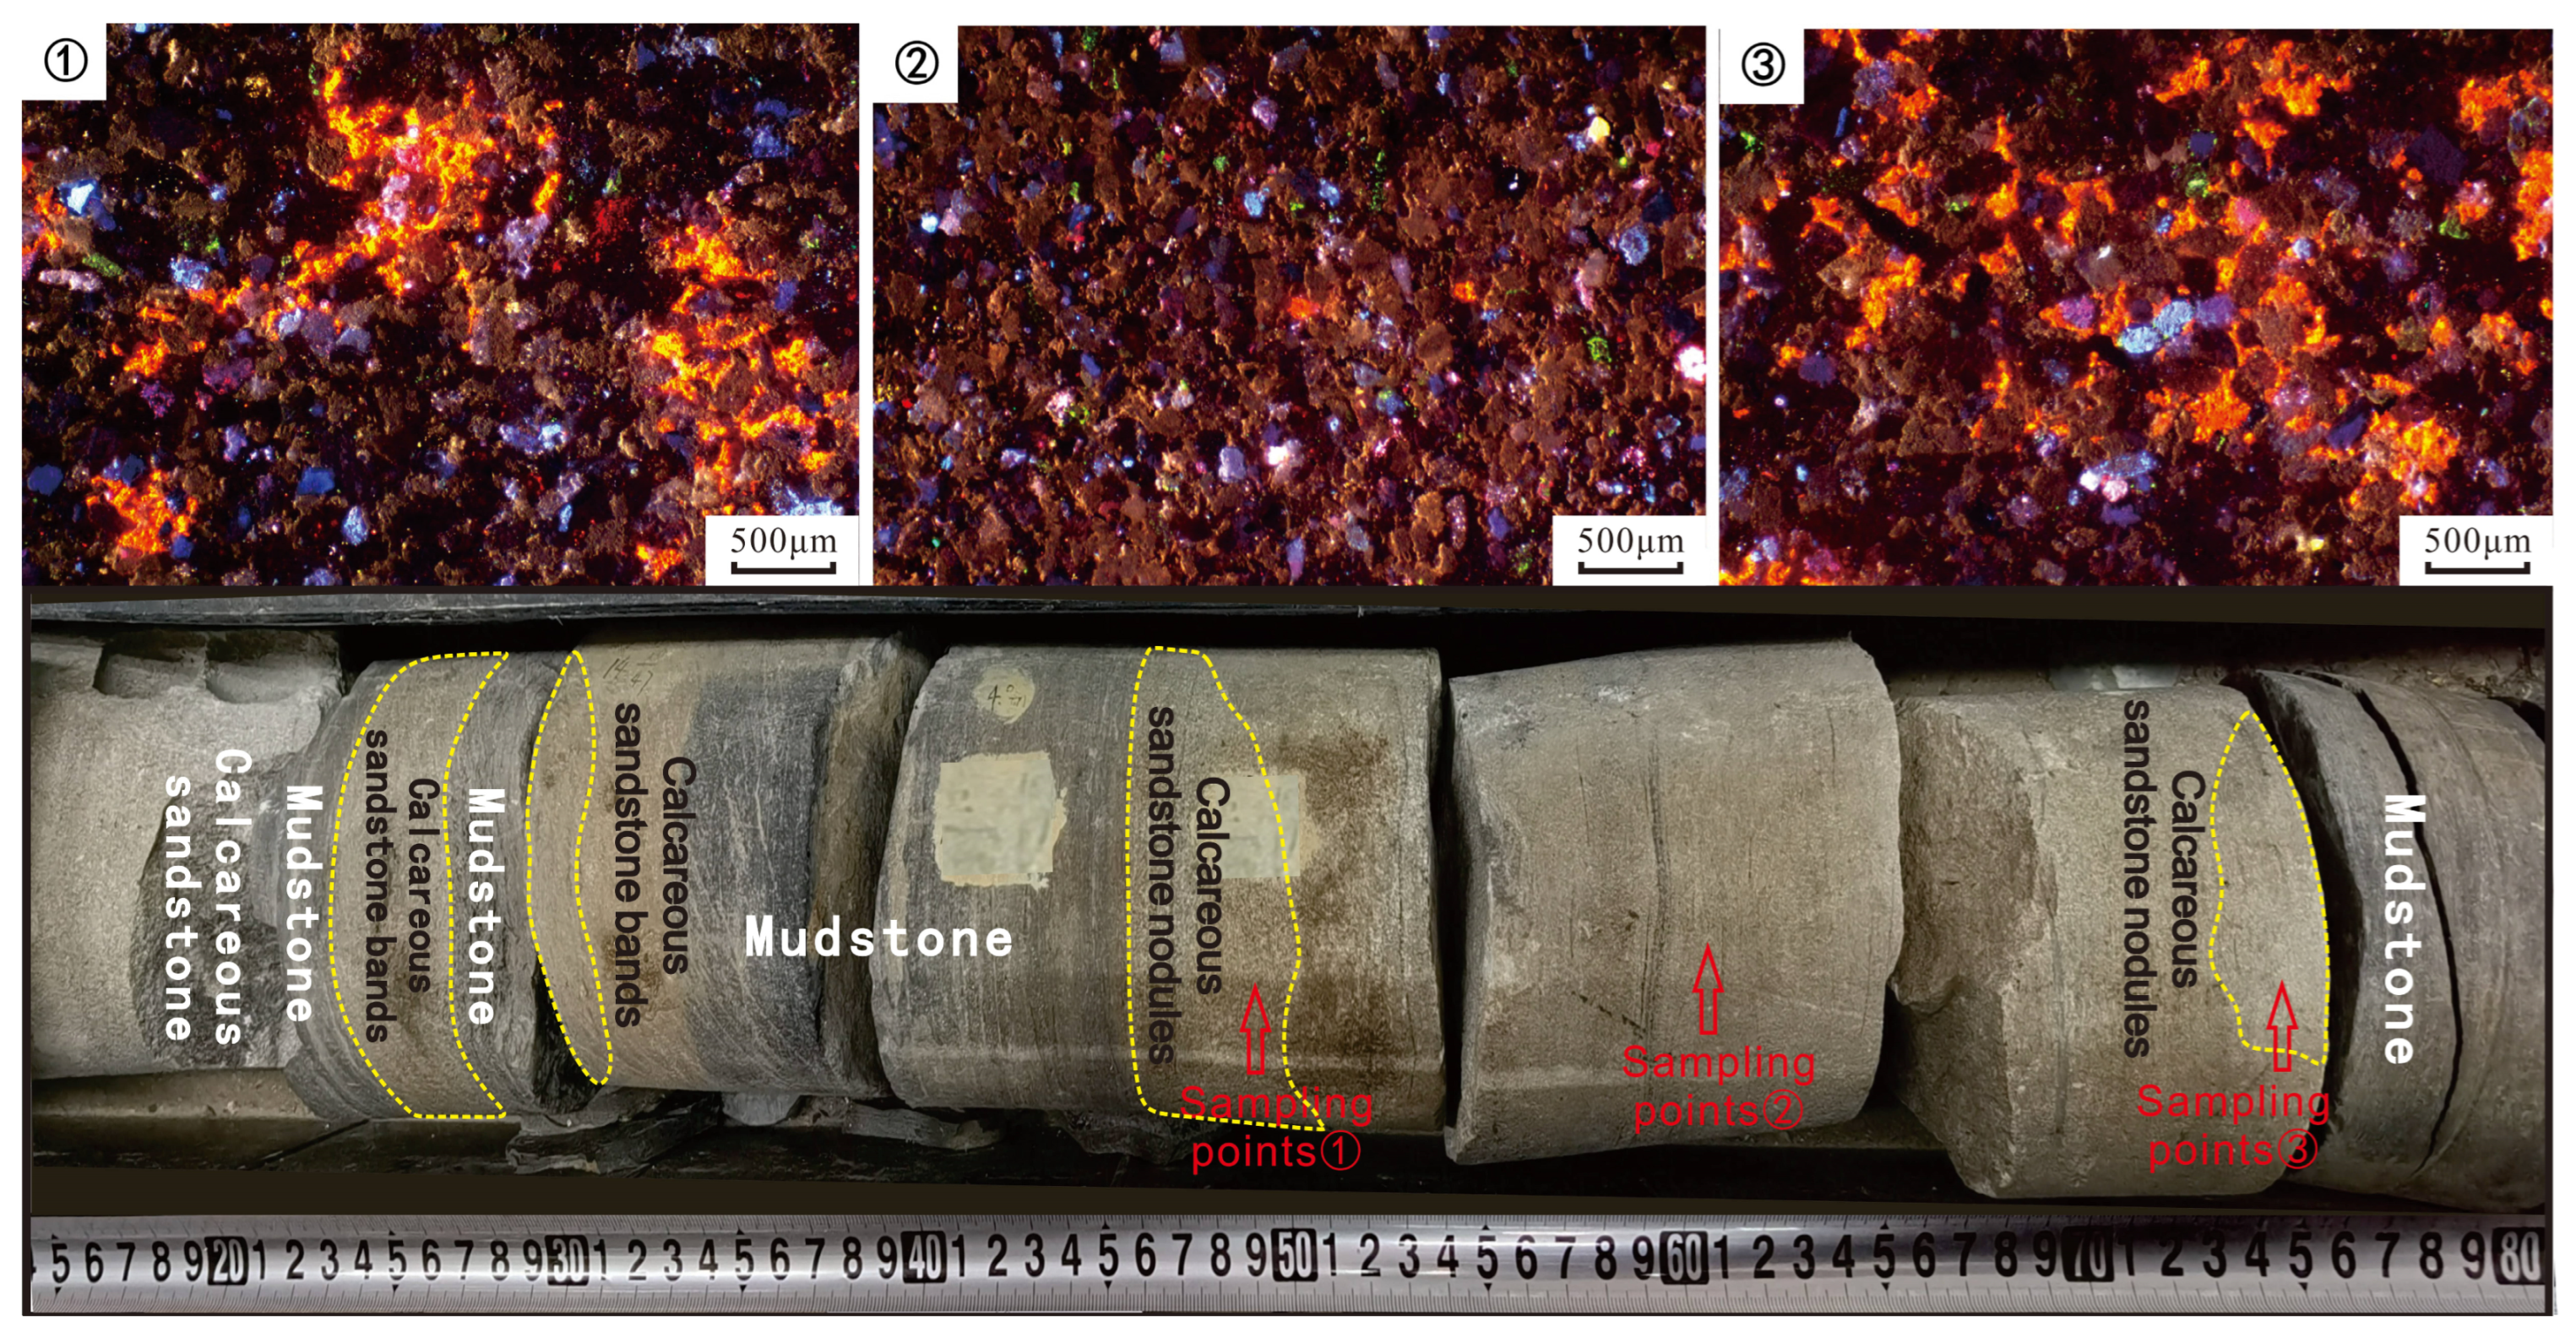
Furthermore, the macroscopic stacking morphology (single-layer thickness) of the lithofacies exerts a significant controlling effect on the porosity reduction by early carbonate cementation. Because early carbonate cementing fluids are mostly active at the sand–mud contact interfaces, their cementation intensity often drops sharply as the distance from the interface increases [48]. Taking an approximately 0.3 m thick single-layer sand body in Well X1 as an example, core observation, cathodoluminescence (CL), and poro-perm tests comprehensively confirmed this interface effect: the sandstone adjacent to the top and bottom mudstone interfaces developed dense basal calcite cementation (showing large-area bright orange-red under CL) with extremely poor physical properties; whereas the central part of the sand body was almost unaffected by cementation, with poro-perm parameters far superior to the marginal zones (Figure 19).
This typical phenomenon fully verifies that for the debris-flow channel microfacies (Scm, Sfc) with massive single-layer thickness, due to the lack of frequent argillaceous intercalations and fluid alternating interfaces internally, this natural “thickness shielding effect” allows the central part of the thick sand bodies to successfully escape strong cementation modification [49], further ensuring the patency and superior seepage capacity of the pore-throats in their core areas. It is precisely the coupling of this favorable lithofacies fabric (high-strength framework resisting compaction) and macroscopic morphology (massive sand body preventing cementation) that enables the debris-flow channel sand bodies to still retain Type I high-quality pore structures under deep burial conditions, becoming high-quality sweet spot targets [50].

5.3. Reservoir Development Models

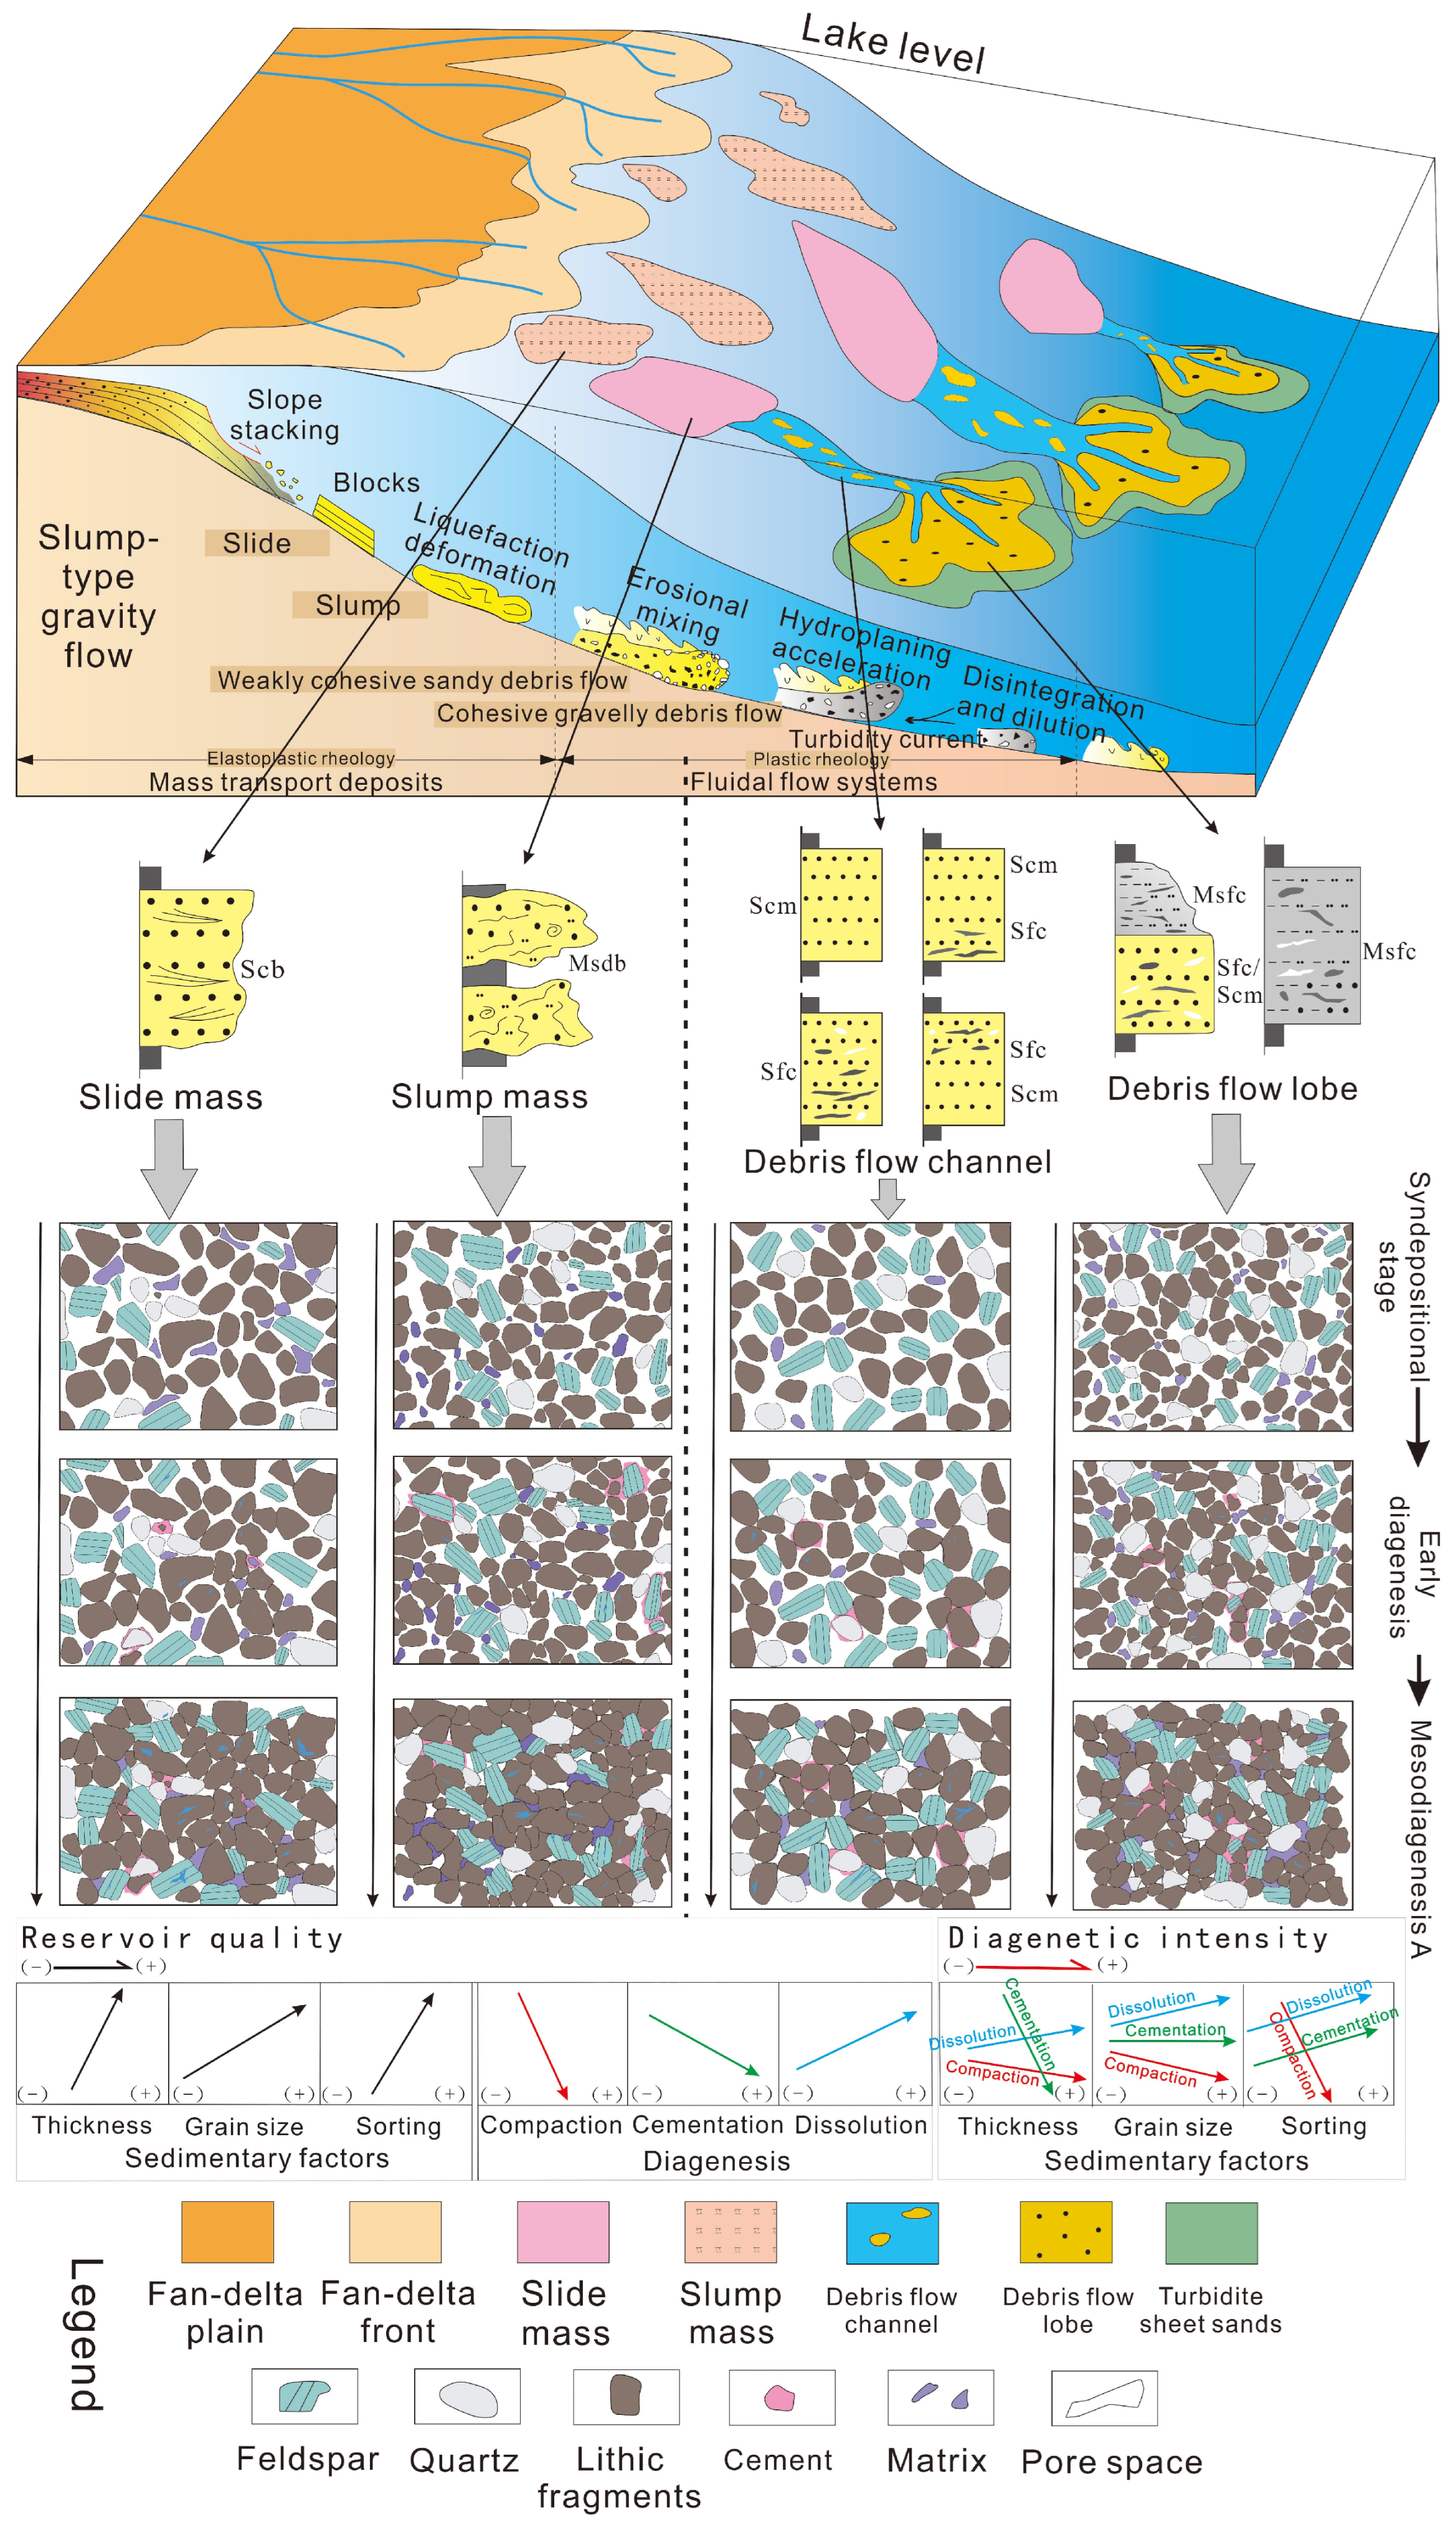
The development of slump-type gravity-flow reservoirs is controlled by a “process-response” mechanism: the fluid rheological state determines the initial rock fabric, and the fabric differences further regulate the diagenetic trajectory. Accordingly, a multidimensional coupled reservoir development model of “fluid-fabric-diagenesis” is constructed (Figure 20; the depositional framework illustrated in this model is original to this study, though the conceptual basis for slump-type gravity flow processes was informed and adapted from the work of Liu [51]):
(1) “High-energy freezing—rigid pore preservation” high-quality reservoir model: Typically represented by the debris-flow channel microfacies (dominant lithofacies Scm, Sfc) and slide mass microfacies (dominant lithofacies Scb). The “freezing” rapid unloading of high-energy fluids or rigid sliding avoids mud incorporation, forming a clean grain-supported framework. This rigid framework has extremely strong compaction resistance, and its superimposition with the “thickness shielding effect” of massive sand bodies inhibits early carbonate cementation, making it easy for later dissolution fluids to expand volume along unobstructed pore-throats. Under the coupling of “superior initial fabric + constructive/weakly destructive diagenesis,” it evolves into a Type I high-quality pore structure with low displacement pressure and high connectivity, constituting the exploration sweet spot with the best physical properties in the area.
(2) “Shear mixing—plastic pore reduction” low-porosity and low-permeability reservoir model: This pathway is represented by the slump mass microfacies (dominant lithofacies MSdb). Gravity slumping accompanied by strong shear crumpling leads to the incorporation of massive mud, forming a sand–mud mixed fabric. The water-rich argillaceous matrix undergoes strong plastic rheology under compaction, squeezing primary intergranular pores; meanwhile, the sand-mud interbeds exacerbate strong localized carbonate cementation at the interfaces. Primary pores largely disappear, evolving into a Type II pore structure dominated by medium-to-small pore-throats with significantly restricted seepage capacity. This frequently occurs in low-porosity and low-permeability transitional reservoirs.
(3) “Viscous suspension—compaction densification” tight reservoir model: Represented by the debris-flow lobe microfacies (dominant lithofacies MSfc). The fluid evolves to its terminal stage, forming a poorly sorted matrix-supported structure. The effective space is innately filled by fine-grained matrix, which rapidly densifies after compaction, evolving into a Type III pore structure with extremely high displacement pressure. Although its conventional seepage capacity is extremely poor, the localized preservation of isolated micropores and honeycomb dissolution pores internally, combined with the macroscopic advantage of the lobe’s fan-shaped contiguous distribution, makes it a highly potential widespread tight hydrocarbon exploration target.

6. Conclusions

(1) The slump-type gravity-flow reservoirs of the Jiufotang Formation in the Naiman Sag are mainly composed of feldspathic lithic sandstones and lithic sandstones, characterized by low compositional maturity and significant textural differentiation. The reservoirs generally exhibit medium-low porosity and medium-low permeability characteristics. The porosity is primarily distributed between 10% and 25%, and the permeability mainly ranges from 10 to 500 × 10−3 μm2. The reservoir space is dominated by residual primary intergranular pores. The microscopic pore-throat networks are strictly controlled by lithofacies, which can be divided into three types of pore structures: rigid lithofacies (Scm, Sfc, and Scb) develop Type I pore-throat networks with extremely low displacement pressure and good connectivity; the MSdb lithofacies develops Type II pore structures with moderate seepage capacity; whereas the mud-rich MSfc lithofacies develops Type III micro-fine pore-throat networks characterized by an extremely high pore-throat ratio.
(2) The present-day reservoir quality is controlled by the high spatiotemporal coupling between deposition and burial diagenesis. Differences in mineral sorting and argillaceous matrix content, caused by syndepositional fluid phase transitions, formulated the initial physical framework and original porosity of the reservoir. During burial diagenesis, mechanical compaction is the absolute dominant factor driving reservoir densification. Under the same temperature and pressure conditions, the fabric characteristics of the dominant lithofacies determine the mechanical stability of the rock framework. Factors such as the “grain-supported rigid framework” possessed by the dominant lithofacies and the “thickness shielding effect” of vertically superimposed massive sand bodies effectively resist the dual destructive diagenetic effects of compaction and early carbonate cementation. In contrast, due to the plastic rheology and deformation of the argillaceous matrix, mud-rich lithofacies collapse rapidly and are thus more prone to densification.
(3) The rheological state of the syndepositional fluid determines the initial sedimentary fabric, which subsequently influences the later diagenetic trajectory. The development of deep-water reservoirs follows a “process-response” mechanism based on the multidimensional coupling of “fluid-fabric-diagenesis”:
Debris-flow channels and slide masses are controlled by the “high-energy freezing—rigid pore preservation” model, forming anomalously high-porosity zones with optimal petrophysical properties;
Slump masses are controlled by the “shear mixing—plastic pore reduction” model, evolving into low-porosity and low-permeability transitional facies;
Debris-flow lobes follow a “viscous suspension—compaction densification” model, indicating widespread tight sandstone distributions.

Author Contributions

Methodology, X.Y.; experiment, Z.L., Z.Z., and H.C.; writing—original draft preparation, X.Y.; writing—review and editing, Y.Z., H.Y., and X.Y.; visualization, Q.Z., Z.L., and Z.Z. All authors have read and agreed to the published version of the manuscript.

Funding

This work was financially supported by the Natural Science Foundation of Heilongjiang Province (Grant JQ2024D003) and the National Natural Science Foundation of China [12304480].

Data Availability Statement

The original contributions presented in the study are included in the article; further inquiries can be directed to the corresponding author.

Conflicts of Interest

Qiang Zheng was employed by the National Key Laboratory for Multi-Resources Collaborative Green Production of Continental Shale Oil, Daqing 163712, China. The remaining authors declare that the research was conducted in the absence of any commercial or financial relationships that could be construed as a potential conflict of interest.

References

  1. Pu, X.G.; Zhao, X.Z.; Wang, J.H.; Zhang, W.; Han, G.M.; Han, X.; Liu, X.L. Reservoirs properties of slump-type sub-lacustrine fans and their main control factors in first member of Paleogene Shahejie Formation in Binhai area, Bohai Bay Basin, China. Pet. Explor. Dev. 2020, 47, 913–924. [Google Scholar] [CrossRef]
  2. Chen, B.Y.; Zhang, Y.F.; Hu, X.; Wang, S.Y.; Liu, P.; Wang, J.H.; Liu, S.L. Sedimentary types, characteristics and models of deep-water gravity flow in steep slope zone of continental rift lake basin: A case study of the upper sub-member of Member 4 of Shahejie Formation in Shengtuo area, Dongying Sag. Acta Sedimentol. Sin. 2021, 39, 164–178. [Google Scholar]
  3. He, Z.; Yang, M.; Wang, L.; Yin, L.; Zhang, P.; Zhou, K.; Turner, P.; Chen, Z.; Shao, L.; Lu, J. Reservoir properties of lacustrine deep-water gravity flow deposits in the Late Triassic-Early Jurassic Anyao Formation, Paleo-Ordos Basin, China. Minerals 2025, 15, 888. [Google Scholar] [CrossRef]
  4. Yuan, Q.; Jiang, Y.; Liu, Z.; Wei, X.; Gu, Y. Lacustrine gravity-flow deposits and their impact on shale pore structure in freshwater lake basins: A case study of Jurassic Dongyuemiao Member, Sichuan Basin, SW China. Minerals 2025, 15, 473. [Google Scholar] [CrossRef]
  5. Shanmugam, G. The slump problem in the turbidite paradigm. Earth Sci. Rev. 2021, 221, 103774. [Google Scholar]
  6. Lowe, D.R. Sediment gravity flows: II. Depositional models with special reference to the deposits of high-density turbidity currents. J. Sediment. Petrol. 1982, 52, 279–297. [Google Scholar]
  7. Zhang, Q.Q.; Cao, Y.C.; Liu, K.Y.; Wang, Y.Z.; Yang, T.; Li, X.Y.; Wang, J.; Wang, S.J. Distribution characteristics of slump-type gravity flow deposits and the influence of delta on them in Dongying Sag. Earth Sci. 2017, 42, 2025–2039. [Google Scholar]
  8. Porębski, S.J.; Steel, R.J. Shelf-margin deltas: Their stratigraphic significance and relation to deepwater sands. Earth Sci. Rev. 2003, 62, 283–326. [Google Scholar] [CrossRef]
  9. Mulder, T.; Alexander, J. The physical character of subaqueous sedimentary density flows and their deposits. Sedimentology 2001, 48, 269–299. [Google Scholar] [CrossRef]
  10. Shanmugam, G. New perspectives on deep-water sandstones: Implications. Pet. Explor. Dev. 2013, 40, 316–324. [Google Scholar] [CrossRef]
  11. Zou, C.N.; Zhao, Z.Z.; Yang, H.; Li, X.B.; Zhu, R.K.; Yuan, X.J.; Hou, L.H. Genetic mechanism and distribution of sandy debris flows in terrestrial lacustrine basin. Acta Sedimentol. Sin. 2012, 30, 308–317. [Google Scholar]
  12. Cao, Y.C.; Wang, J.; Liu, H.M.; Wang, Y.Z.; Liu, K.Y.; Yang, T.; Zhang, S.M. Sedimentary characteristics and models of deep-water gravity flow deposits in the Eocene Shahejie Formation, Dongying Depression, Bohai Bay Basin. Pet. Explor. Dev. 2014, 41, 161–171. [Google Scholar]
  13. Qiao, D.; Duan, X.; Shi, Z. Early Triassic (Griesbachian) deposits of high-energy events at the northwestern upper Yangtze region, China. Minerals 2023, 13, 1222. [Google Scholar] [CrossRef]
  14. Dutton, S.P.; Loucks, R.G.; Day-Stirrat, R.J. Impact of regional compaction and cementation on reservoir quality of deepwater sandstones. AAPG Bull. 2012, 96, 1945–1974. [Google Scholar]
  15. Cao, Y.C.; Yuan, G.H.; Yang, T.; Li, X.Y.; Wang, Y.Z.; Liu, H.M.; Wang, J. Diagenetic evolution and its effect on reservoir physical properties of deep-water turbidites in the middle sub-member of Es3 in Dawangbei Sag, Bohai Bay Basin. Acta Pet. Sin. 2013, 34, 683–691. [Google Scholar]
  16. Cope, T.; Luo, P.; Zhang, X.; Zhang, X.; Song, J.; Zhou, G.; Shultz, M.R. Structural controls on facies distribution in a small half-graben basin: Luanping basin, northeast China. Basin Res. 2010, 22, 33–44. [Google Scholar] [CrossRef]
  17. Su, J.; Zhu, W.; Chen, J.; Min, B.; Zheng, B. Wide rift model in Bohai Bay Basin: Insight into the destruction of the North China Craton. Int. Geol. Rev. 2014, 56, 537–554. [Google Scholar] [CrossRef]
  18. Liang, J.; Wang, H.; Bai, Y.; Ji, X.; Duo, X. Cenozoic tectonic evolution of the Bohai Bay Basin and its coupling relationship with Pacific Plate subduction. J. Asian Earth Sci. 2016, 127, 257–266. [Google Scholar] [CrossRef]
  19. Xu, X.; Shao, L.; Fu, Y.; Wang, D.; Cai, H.; Qin, J.; Hou, H.; Zhao, J. Sequence palaeogeography, lacustrine basin evolution, and coal accumulation in the Lower Cretaceous Fuxin continental faulted basin, China. Geol. J. 2020, 55, 1195–1215. [Google Scholar] [CrossRef]
  20. Han, J.; Zhang, H.; Zhu, Z.; Song, J. Controlling of tectonic stress field evolution for coal and gas outburst in Fuxin basin. J. China Coal Soc. 2007, 32, 934–938. [Google Scholar]
  21. Zhao, X.Q.; Chen, J.F.; Guo, W.; Zhang, C.; Li, M.; Zhang, X.L. Geochemical characteristics of aromatic hydrocarbons in crude oils and source rocks from Nai 1 Block, Naiman Sag, Kailu Basin. Geochimica 2013, 42, 262–273. [Google Scholar]
  22. Zhao, X.Q.; Chen, J.F.; Zhang, C.; Guo, W.; Li, M.; Zhang, X.L. Geochemical characteristics and oil-source correlation of crude oils from Nai 1 Block, Naiman Sag, Kailu Basin. J. China Univ. Pet. (Ed. Nat. Sci.) 2012, 36, 44–53. [Google Scholar]
  23. Li, Y.; Lin, S.; Wang, S.; Wang, Y.; Xie, S. Depositional cycles in a rift lacustrine basin linked with tectonics, climate, and source rocks and reservoirs development: Lower Cretaceous in Naiman sag, Songliao Basin, Inner Mongolia, Northeast China. Mar. Pet. Geol. 2023, 155, 106348. [Google Scholar] [CrossRef]
  24. Song, L.; Ruan, Y.; Sun, Y.; Xie, F.; Li, J.; Yuan, Y. Dynamic background on formation, evolution, and later reformation of the Late Paleozoic–Early Mesozoic Basin in Songliao and its significance for hydrocarbon exploration. Front. Earth Sci. 2023, 11, 1132820. [Google Scholar] [CrossRef]
  25. Tao, S.; Yuan, X.; Hou, L.; Zhu, R.; Yang, F.; Li, C.; Wang, L.; Zhang, G.; Li, X.; Wang, Y.; et al. Play types, geologic characteristics and exploration domains of lithological reservoirs in China. Pet. Explor. Dev. 2016, 43, 941–953. [Google Scholar] [CrossRef]
  26. Shao, K.; Shao, L.; Ma, D.; Wang, D.; Wang, S.; Gao, D. A study of sequence stratigraphy of the Early Cretaceous coal-bearing series in the southeastern Songliao Basin, NE China. Int. J. Coal Sci. Technol. 2020, 7, 263–272. [Google Scholar] [CrossRef]
  27. Wang, H.; Jiang, S.; Huang, C.; Jiang, H.; Gan, H. Differences in sedimentary filling and its controlling factors in rift lacustrine basins, East China: A case study from Qikou and Nanpu sags. Front. Earth Sci. 2011, 5, 82–96. [Google Scholar] [CrossRef]
  28. Tong, X.; Hu, J.; Xi, D.; Zhu, M.; Song, J.; Peng, P. Depositional environment of the Late Santonian lacustrine source rocks in the Songliao Basin (NE China): Implications from organic geochemical analyses. Org. Geochem. 2018, 124, 215–227. [Google Scholar] [CrossRef]
  29. Zhao, W.; Wang, H.; Yuan, X.; Wang, Z.; Zhu, G. Petroleum systems of Chinese nonmarine basins. Basin Res. 2010, 22, 4–16. [Google Scholar] [CrossRef]
  30. Chen, G.P.; Li, J.; Wu, H.B.; Peng, W.; Li, J.S.; Xie, M.X.; Zhang, B.; Shi, X.Q. Sedimentary characteristics, identification mark and formation mechanism of the slumping deep water gravity flow in fault lacustrine basin: A case study on the consecutive coring well of Ming D2 in Dongmingsag, Hailaer Basin. Acta Pet. Sin. 2018, 39, 1119–1129. [Google Scholar]
  31. Cao, Y.C.; Zhang, Q.Q.; Wang, Y.Z.; Wang, J.; Xi, K.L.; Liu, S.Y. Delta front gravity flow deposits in the middle submember of the third member of the Shahejie Formation in the Dongying depression: Lithofacies and lithofacies association types and their distribution. Sediment. Geol. Tethyan Geol. 2017, 37, 9–17. [Google Scholar]
  32. Cao, Y.; Jin, J.; Liu, H.; Yang, T.; Liu, K.; Wang, Y.; Wang, J.; Liang, C. Deep-water gravity flow deposits in a lacustrine rift basin and their oil and gas geological significance in eastern China. Pet. Explor. Dev. 2021, 48, 286–298. [Google Scholar] [CrossRef]
  33. Cao, Y.C.; Wang, S.J.; Wang, Y.Z.; Yang, T.; Zhang, S.M.; Zhang, H.N. Sedimentary characteristics and depositional model of slumping deep-water gravity flow deposits: A case study from the middle Member 3 of Paleogene Shahejie Formation in Linnan subsag, Bohai Bay Basin. J. Palaeogeogr. 2017, 19, 419–432. [Google Scholar]
  34. Yang, Y.; Peng, J.; Chen, Z.; Zhou, X.; Zeng, Y.; Wang, Y.; Wang, X. Depositional Models of Deep-Water Gravity-Flow in Lacustrine Basin and Its Petroleum Geological Significance—A Case Study of Chang 6 Oil Group in Heshui Area, Ordos Basin, China. Front. Earth Sci. 2022, 9, 786403. [Google Scholar] [CrossRef]
  35. Nan, F.; Lin, L.; Chen, Z.; Yu, Y.; Mu, S.; Guo, X. Development characteristics of deepwater gravity flows and tight sandstone reservoir characteristics in Chang 6 in the Huaqing area, Ordos Basin, China. Geol. J. 2023, 58, 150–169. [Google Scholar] [CrossRef]
  36. Taylor, T.R.; Giles, M.R.; Harlow, L.A.; Diggs, T.N.; Birgenheier, L.P.; Eslinger, E.V.; Sarg, J.F. Sandstone diagenesis and reservoir quality prediction: Models, myths, and reality. AAPG Bull. 2010, 94, 1093–1132. [Google Scholar] [CrossRef]
  37. Postma, G. Classification for sediment gravity-flow deposits based on flow conditions during sedimentation. Geology 1986, 14, 291–294. [Google Scholar] [CrossRef]
  38. Moscardelli, L.; Wood, L. New classification system for mass transport complexes in deepwater settings. Basin Res. 2008, 20, 73–98. [Google Scholar] [CrossRef]
  39. Owen, G. Deformation processes in unconsolidated sands. Geol. Soc. Lond. Spec. Publ. 1987, 29, 11–24. [Google Scholar] [CrossRef]
  40. Baas, J.H.; Best, J.L.; Peakall, J. Depositional processes, bedform development and hybrid bed formation in rapidly decelerating cohesive (mud-sand) sediment gravity flows. Sedimentology 2011, 58, 1953–1987. [Google Scholar] [CrossRef]
  41. Marchand, A.M.; Smalley, P.C.; Osborne, H.L.; Hall, D.; Cheadle, B.A. Reservoir quality evaluation of deepwater turbidites and debrites. AAPG Bull. 2015, 99, 1635–1658. [Google Scholar] [CrossRef]
  42. Trask, P.D. Origin and Environment of Source Sediments of Petroleum; Gulf Publishing Company: Houston, TX, USA, 1932. [Google Scholar]
  43. Snelder, R.M. Reservoir Description of Sandstones; Springer: New York, NY, USA, 1990; pp. 1–3. [Google Scholar]
  44. Lundegard, P.D. Sandstone porosity loss: A “big picture” view of the importance of compaction. J. Sediment. Petrol. 1992, 62, 250–260. [Google Scholar] [CrossRef]
  45. Paxton, S.T.; SzOecs, J.O.; Peng, C.A.; Ajdukiewicz, J.M. Construction of an intergranular volume compaction curve for evaluating and predicting compaction and porosity loss in rigid-grain sandstone reservoirs. AAPG Bull. 2002, 86, 2047–2067. [Google Scholar] [CrossRef]
  46. Pittman, E.D.; Larese, R.E. Compaction of lithic sands: Experimental results and applications. AAPG Bull. 1991, 75, 1279–1299. [Google Scholar] [CrossRef]
  47. Houseknecht, D.W. Assessing the relative importance of compaction processes and cementation to reduction of porosity in sandstones. AAPG Bull. 1987, 71, 633–642. [Google Scholar] [CrossRef]
  48. Morad, S.; Ketzer, J.M.; De Ros, L.F. Spatial and temporal distribution of diagenetic alterations in siliciclastic rocks: Implications for mass transfer in sedimentary basins. Sedimentology 2000, 47, 95–120. [Google Scholar] [CrossRef]
  49. Cao, Y.C.; Yuan, G.H.; Li, X.Y.; Wang, Y.Z.; Liu, K.Y.; Yang, T.; Wang, J. Characteristics and origin of anomalously high porosity zones in deeply buried Paleogene sandstones in the Dongying Depression, Bohai Bay Basin, China. AAPG Bull. 2013, 97, 2265–2291. [Google Scholar]
  50. Mayall, M.; Jones, E.; Casey, M. Turbidite channel reservoirs—Key structural and stratigraphic controls on evolution, anatomy and the consequences for reservoir quality. Mar. Pet. Geol. 2006, 23, 977–1004. [Google Scholar]
  51. Liu, J. Sedimentary Processes and Models of Lacustrine Slump-Type and Flood-Induced Gravity Flows. Ph.D. Thesis, China University of Petroleum (Beijing), Beijing, China, 2019. [Google Scholar]
Figure 1. Composite map showing the geological setting of the study area. (a) Schematic regional map showing the location of the Songliao Basin; (b) Regional tectonic map showing the location of the Naiman Sag; (c) Structural contour map of the top Jiufotang Formation in the Naiman Sag; (d) Generalized stratigraphic column of the Naiman Sag.
Minerals 16 00569 g001
Figure 2. Comprehensive diagram showing the electrical responses and spatial distribution of sedimentary microfacies units (all columnar sections depict the cored interval of Well X1).
Minerals 16 00569 g002
Figure 3. Typical core photographs of slump-type gravity-flow deposits in the Jiufotang Formation, Naiman Sag. (a) Massive clean sandstone at 2197.3 m in Well X1; (b) massive clean sandstone at 2199.3 m in Well X1; (c) massive sandstone with mudstone rip-up clasts at 2200.6 m in Well X1; (d) cross-bedded fine-grained sandstone at 1922.2 m in Well X2; (e) deformed-bedded tuffaceous argillaceous sandstone at 1909.2 m in Well X1; (f) convolute-bedded argillaceous sandstone at 1905.6 m in Well X1; (g) argillaceous sandstone with sandy patches at 1931.7 m in Well X1; (h) argillaceous sandstone with mudstone rip-up clasts at 1933.4 m in Well X1; (i) argillaceous sandstone with floating fine gravels at 1935.8 m in Well X1.
Minerals 16 00569 g003
Figure 4. Ternary diagram showing detrital grain compositions of slump-type gravity-flow deposits in the Jiufotang Formation, Naiman Sag.
Minerals 16 00569 g004
Figure 5. Typical microscopic photographs of rock fragments in slump-type gravity-flow reservoirs of the Jiufotang Formation, Naiman Sag. (a) Intermediate volcanic rock fragments, Well X1, 2380.8 m; (b) intermediate-acidic volcanic rock fragments, Well X2, 2245.4 m; (c) intermediate-acidic volcanic rock fragments, Well X3, 2142.5 m.
Minerals 16 00569 g005
Figure 6. Microscopic characteristics of interstitial materials in gravity-flow reservoirs of the Jiufotang Formation, Naiman Sag. (a) Intergranular clay minerals and carbonates (red arrows), quartz overgrowth (yellow arrows), Well X1, 2048.8 m, cross-polarized light; (b) argillaceous matrix filling (red arrows), Well X3, 2125.2 m, plane-polarized light; (c) calcite basal cementation (red arrows), Well X3, 1787.2 m, plane-polarized light; (d) dolomite basal cementation (red arrows), Well X2, 1824.8 m, plane-polarized light.
Minerals 16 00569 g006
Figure 7. Sorting characteristics of different lithofacies in slump-type gravity-flow reservoirs of the Jiufotang Formation, Naiman Sag.
Minerals 16 00569 g007
Figure 8. Statistical diagram of physical property characteristics of slump-type gravity-flow reservoirs in the Jiufotang Formation, Naiman Sag.
Minerals 16 00569 g008
Figure 9. Pore and throat characteristics of gravity-flow reservoirs in the Jiufotang Formation, Naiman Sag. (a) Primary intergranular pores (red arrows) and secondary intragranular dissolution pores (yellow arrows), Well X1, 1931.2 m; (b) secondary intergranular dissolution pores (red arrows) and secondary intragranular dissolution pores (yellow arrows), Well X2, 1861.6 m; (c) contracted throat (red arrows) and sheet-like throat (yellow arrows), Well X2, 1852.7 m; (d) primary intercrystalline pores in kaolinite (red arrows), Well X3, 1809.1 m, scanning electron microscope (SEM).
Minerals 16 00569 g009
Figure 10. High-pressure mercury injection characteristics of pore-throats in slump-type gravity-flow reservoirs of the Jiufotang Formation, Naiman Sag. (a) Typical mercury injection curve; (b) Distribution frequency of pore throat radius.
Minerals 16 00569 g010
Figure 11. Micro-CT scanning characteristics of pore structures in slump-type gravity-flow reservoirs of the Jiufotang Formation, Naiman Sag. (a) Well X1, 1967.85 m, 176.8 × 10⁻³ μm2, Class I pore structure; (b) Well X1, 2134.76 m, 28.9 × 10⁻³ μm2, Class II pore structure; (c) Well X2, 1910.10 m, 18.5 × 10⁻³ μm2, Class III pore structure.
Minerals 16 00569 g011
Figure 12. Relationship between compaction characteristics and burial depth of gravity-flow reservoirs in the Jiufotang Formation, Naiman Sag.
Minerals 16 00569 g012
Figure 13. Compaction characteristics of slump-type gravity-flow reservoirs in the Jiufotang Formation, Naiman Sag, under polarized light microscope. (a) Scm lithofacies sample, point contact, Well X1, 2200.3 m, plane-polarized light; (b) Scb lithofacies sample, point to long contact, Well X1, 2351.6 m, plane-polarized light; (c) MSdb lithofacies sample, point to long contact, Well X1, 1912.7 m, plane-polarized light; (d) MSfc lithofacies sample, long to concavo-convex contact, Well X1, 2384.1 m, plane-polarized light.
Minerals 16 00569 g013
Figure 14. Cementation characteristics of slump-type gravity-flow reservoirs in the Jiufotang Formation, Naiman Sag. (a) Calcite basal cementation with calcite replacing rock fragments, Well X3, 1787.2 m, plane-polarized light; (b) dolomite basal cementation, Well X2, 1824.8 m, plane-polarized light; (c) carbonate mineral cementation with microcrystalline quartz on the surface, Well X1, 2351.4 m; (d) carbonate mineral cementation with kaolinite attached to the surface, Well X1, 2196.2 m; (e) intergranular vermicular kaolinite aggregates, Well X1, 1933.3 m; (f) quartz overgrowth, Well X3, 1846.2 m, plane-polarized light.
Minerals 16 00569 g014
Figure 15. Dissolution characteristics of slump-type gravity-flow reservoirs in the Jiufotang Formation, Naiman Sag. (a) Scm lithofacies sample, intergranular dissolution, Well X1, 2195.2 m, plane-polarized light; (b) MSdb lithofacies sample, locally developed dissolution pores, Well X1, 1911.6 m, plane-polarized light; (c) MSfc lithofacies sample, intergranular dissolution micropores, Well X1, 2379.8 m, plane-polarized light; (d) MSfc lithofacies sample, intragranular dissolution pores, Well X1, 2382.5 m, plane-polarized light; (e) dissolution pores, approximately 140 μm, Well X1, 1911.6 m, scanning electron microscope (SEM); (f) dissolution pores, approximately 60 μm, Well X1, 2379.8 m, scanning electron microscope (SEM).
Minerals 16 00569 g015
Figure 16. Porosity reduction effect of diagenesis in slump-type gravity-flow reservoirs of the Jiufotang Formation, Naiman Sag.
Minerals 16 00569 g016
Figure 17. Porosity and permeability variation with depth in slump-type gravity-flow reservoirs of the Jiufotang Formation, Naiman Sag.
Minerals 16 00569 g017
Figure 18. Differential compaction characteristics of different rock textures in slump-type gravity-flow reservoirs of the Jiufotang Formation, Naiman Sag. (a) Scm lithofacies sample, fine-grained sandstone, well-sorted and well-rounded grains, point to point-long contact, porosity 21.2%, Well X1, 2200.9 m, plane-polarized light; (b) Scm lithofacies sample, fine-grained sandstone, moderately to well-sorted and rounded grains, point to long contact, porosity 15.6%, Well X2, 2096.6 m, plane-polarized light; (c) MSdb lithofacies sample, pebbly argillaceous fine-grained sandstone, poorly sorted and rounded grains, point to long contact with some grains fractured, porosity 9.1%, Well X3, 2136.8 m, plane-polarized light; (d) MSfc lithofacies sample, argillaceous siltstone, intergranular pores filled, long contact, porosity 6.1%, Well X3, 2125.2 m, plane-polarized light.
Minerals 16 00569 g018
Figure 19. Cementation features at different positions within gravity-flow reservoirs of the Jiufotang Formation, Naiman Sag. ① Basal carbonate cementation, cathodoluminescence, Well X1, 2334.3 m; ② carbonate cements almost undeveloped, cathodoluminescence, Well X1, 2334.45 m; ③ basal carbonate cementation, cathodoluminescence, Well X1, 2334.6 m.
Minerals 16 00569 g019
Figure 20. Comprehensive model for the development and evolution of slump-type gravity-flow reservoirs in the Jiufotang Formation, Naiman Sag.
Minerals 16 00569 g020
Table 1. Lithofacies classification and depositional interpretation of slump-type gravity-flow deposits in the Jiufotang Formation, Naiman Sag.
Subfacies (1st Order)Microfacies Unit (2nd Order)GenesisRepresentative LithofaciesCore Diagnostic FeaturesSedimentary Characteristics
MTDSlide massSandy slide: initial transitional block transport along a slip surface; accompanied by mild shear and partial liquefaction prior to complete collapse.Cross-bedded f.g. sst. (Scb)F.g. sst.; recognizable cross-/parallel bedding modified by mild syn-sedimentary deformation and localized fluid-escape structures; abrupt top/base contacts.Coarsening-upward; modified mouth-bar architecture; lenticular/massive planar distribution.
MTDSlump massSandy slump: liquefaction & collapse of sandy sed. during transport; strong internal plastic deformation & rotationDeformed bedded muddy sst. (MSdb)Argillaceous f.g. sst. or muddy sst.; original bedding destroyed; deformed, convolute, crumpled bedding; mixed with deep-water mudstone; highly irregular interfacesNo primary rhythm; strong internal heterogeneity; sheet-/tabular-shaped; area up to several km2
SGDDebris-flow channelSandy debris flow: matrix-supported, high-density flow with laminar–transitional rheology; continuous transport/deposition along channelsMassive clean/floating-gravel sst. (Scm/Sfc)Thick single-stage sandbodies; multi-stage stacking; massive med.–f.g. sst.; mud rip-up clasts & floating gravels; sharp top/base contacts; low matrix mudHomogeneous, massive; no obvious bedding; meandering belts extending basinward; high-quality reservoirs
SGDDebris-flow lobeComposite deposits of sandy/muddy debris flows & turbidity currents: energy dissipation & unloading at channel termini; multiple flow types superimposedMuddy sst. with floating gravels (MSfc)Frequent sand–mud interbeds; thin single layers; massive muddy sst.; floating gravels, mud clasts, rip-up clasts; intercalated thin-bedded graded turbiditesMulti-stage stacking; fan-shaped, large-area contiguous bodies; strong lithological heterogeneity
Note: MTD: mass transport deposit; SGD: sediment gravity-flow deposit; sed.: sediment; f.g.: fine-grained; med.: medium; sst.: sandstone. This classification is process-based, integrating rheological characteristics and transport mechanisms.
Table 2. Physical property characteristics of slump-type gravity-flow reservoirs in the Jiufotang Formation, Naiman Sag.
TypeLithofacies Thickness-Weighted Average Porosity (%) Porosity Classification Thickness-Weighted Average Permeability (10−3 μm2) Permeability Classification
Slump-TypeScm21.5Medium Porosity135.6Medium Permeability
Sfc19.8Medium Porosity77.8Medium Permeability
Scb17.5Medium Porosity70.3Medium Permeability
MSdb12.2Low Porosity25.9Low Permeability
MSfc10.5Low Porosity18.5Low Permeability
Table 3. Mercury injection parameters of typical samples from slump-type gravity-flow reservoirs in the Jiufotang Formation, Naiman Sag.
TypeWell No.LithofaciesDepth (m)Porosity (%)Permeability (10−3 μm2)Displacement Pressure (MPa)Maximum Pore-Throat Radius (μm) Average Pore-Throat Radius (μm)Sorting CoefficientSample Type
Slump-TypeX1Scm1967.8520.8176.80.0620.696.220.44I
X2Sfc2183.4518.5162.80.06818.505.600.61I
X3Scb2098.4417.4158.90.0819.715.840.52I
X1Msdb2134.7612.428.90.5616.791.972.82II
X2MSfc1910.1010.818.55.8212.490.553.52III
Table 4. Clay mineral content of slump-type gravity-flow reservoirs in the Jiufotang Formation, Naiman Sag.
Well No.Depth (m)Sample LithofaciesRelative Clay Mineral Content (%)
Total Content (%)Kaolinite (%)Illite (%) Illite/Smectite Mixed Layer (%)Chlorite (%)Illite/Smectite Mixed Layer Ratio (S%)
X12195.6Scm8521830/48
X11912.3MSdb14451138655
X12379.1MSfc22451532834
X12308.4MSfc17441631940
X22114.5Sfc7531428547
X21916.3MSdb12481432652
X22021.8MSdb16471835/47
X32211.6Scb10501728543
X32219.3Scm6511330639
Table 5. Rock texture characteristics and primary porosity of different lithofacies in slump-type gravity-flow deposits of the Jiufotang Formation, Naiman Sag.
Well No.Depth (m) Sample LithofaciesGrain Size φ High-Value RangeSorting CoefficientPrimary Porosity (%)
X21952.3Scb0–31.632.35
X21955.10–41.731.15
X32102.61–31.530.62
X32105.31–41.630.29
X11908.5MSdb0–52.028.69
X11910.31–52.029.56
X11912.72–51.929.89
X12195.1Scm/Sfc0–31.432.86
X21990.50–31.731.49
X21993.31–31.432.12
X32143.51–31.730.79
X12197.21–31.730.59
X12200.11–41.431.19
X32140.91–41.630.65
X11931.4MSfc4–72.726.18
X12380.74–62.527.26
X22011.53–62.726.59
X32155.64–72.824.20
X32158.34–82.823.95
Table 6. Evaluation of diagenetic impacts on porosity in slump-type gravity-flow reservoirs of the Jiufotang Formation, Naiman Sag.
Well No. Depth
(m)
Sample LithofaciesLithologyOP/%IGV/%CEM/%COPL/%COPL-P/%CEPL/%CEPL-P/%CRPI/%
X21952.3ScbFine-grained Sandstone30.1523.793.348.3527.683.0610.163.59
X21955.1Fine-grained Sandstone30.8924.174.038.8628.683.6711.893.87
X32102.6Fine-grained Sandstone31.1223.744.339.6831.093.9112.563.90
X32105.3Fine-grained Sandstone30.2923.283.979.1330.153.6111.923.80
X11908.5MSdbArgillaceous Fine-grained Sandstone28.6921.323.229.3732.662.9110.163.12
X11910.3Argillaceous Fine-grained Sandstone29.5621.522.5010.2434.652.247.592.59
X11912.7Argillaceous Fine-grained Sandstone29.8921.452.7310.7535.962.448.152.95
X12195.1Scm/SfcMedium-grained Sandstone32.1226.803.517.2722.623.2510.132.50
X21990.5Medium-grained Sandstone31.6526.854.256.5720.753.9812.563.40
X21993.3Medium-grained Sandstone32.2628.143.515.7317.763.3110.254.20
X32143.5Scm/SfcMedium-grained Sandstone32.5928.614.455.5717.094.2012.893.56
X12197.2Fine-grained Sandstone30.5923.384.169.4130.763.7712.323.67
X12200.1Fine-grained Sandstone30.2923.813.378.5128.093.0910.193.82
X32140.9Fine-grained Sandstone30.7923.903.169.0529.392.889.343.79
X11931.4MSfcSiltstone26.1817.693.3710.3139.393.0311.562.12
X12380.7Siltstone27.2618.093.1211.1941.062.7710.162.35
X22011.5Siltstone26.5917.323.8611.2142.153.4312.891.92
X32155.6Argillaceous Siltstone24.2015.483.0110.3142.622.7011.161.60
X32158.3Argillaceous Siltstone23.9514.052.4711.5248.092.189.121.80
Note: OP = Original porosity; IGV = Intergranular volume; CEM = Cement content; COPL = Compactional porosity loss; COPL-P = Percentage of porosity loss due to compaction; CEPL = Cementational porosity loss; CEPL-P = Percentage of porosity loss due to cementation; CRPI = Porosity increase due to dissolution.
Disclaimer/Publisher’s Note: The statements, opinions and data contained in all publications are solely those of the individual author(s) and contributor(s) and not of MDPI and/or the editor(s). MDPI and/or the editor(s) disclaim responsibility for any injury to people or property resulting from any ideas, methods, instructions or products referred to in the content.