Figure 1.
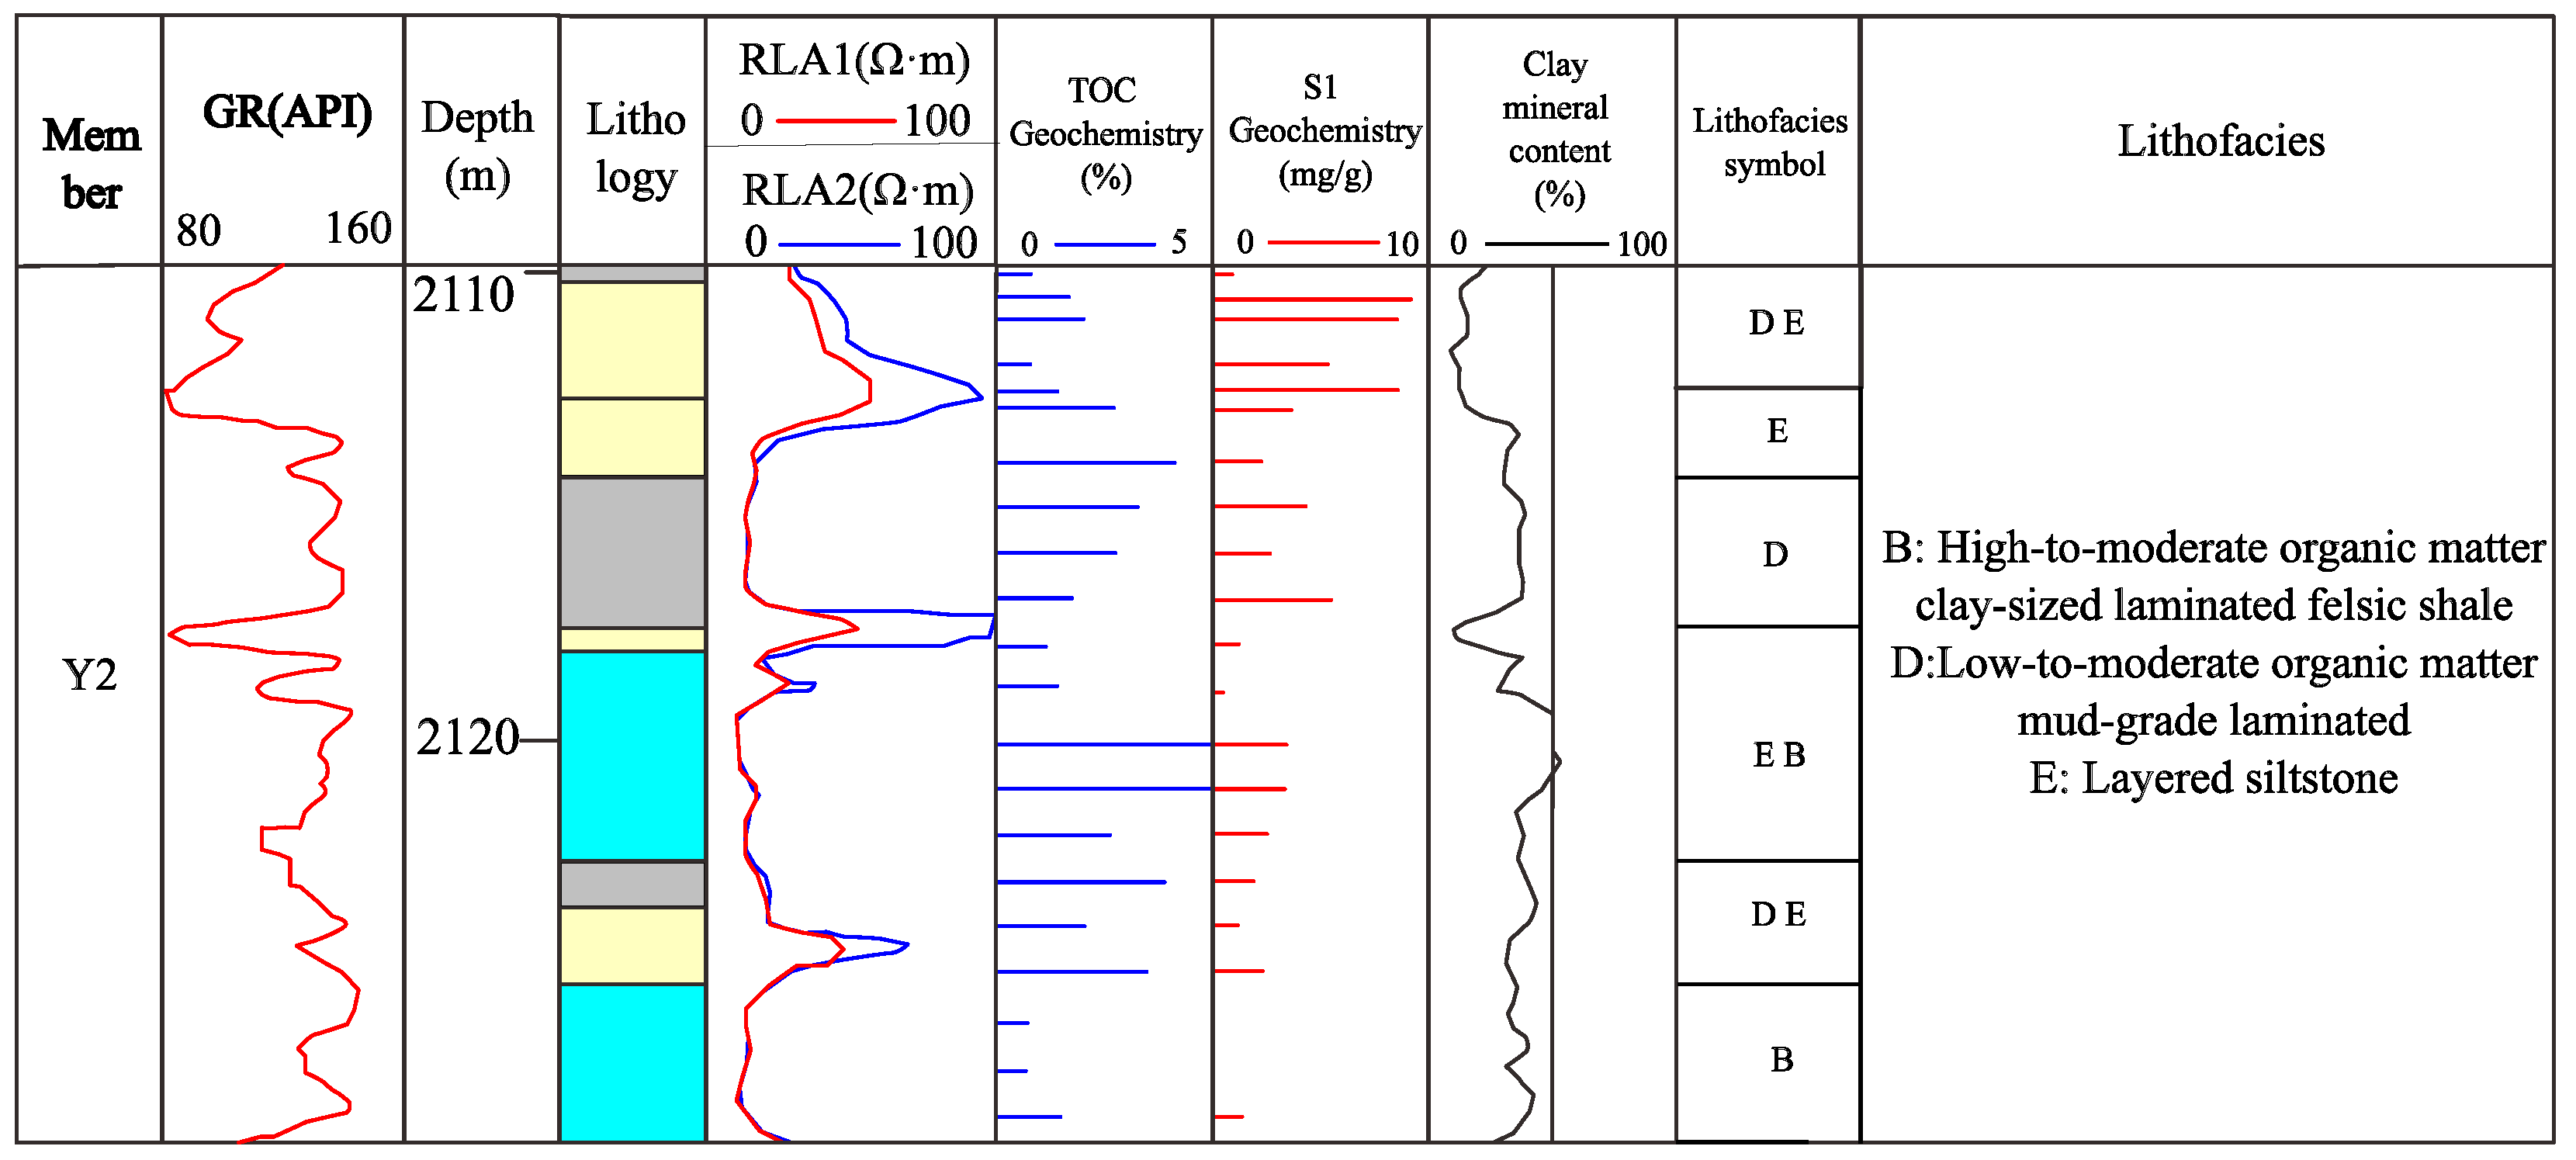
Composite stratigraphic column of the Qingshankou Formation. Color legend for lithological column: orange = sandstone-type lithology (arenaceous sedimentary rocks); other color assignments are detailed in the figure’s legend.
Figure 1.
Composite stratigraphic column of the Qingshankou Formation. Color legend for lithological column: orange = sandstone-type lithology (arenaceous sedimentary rocks); other color assignments are detailed in the figure’s legend.
Figure 2.
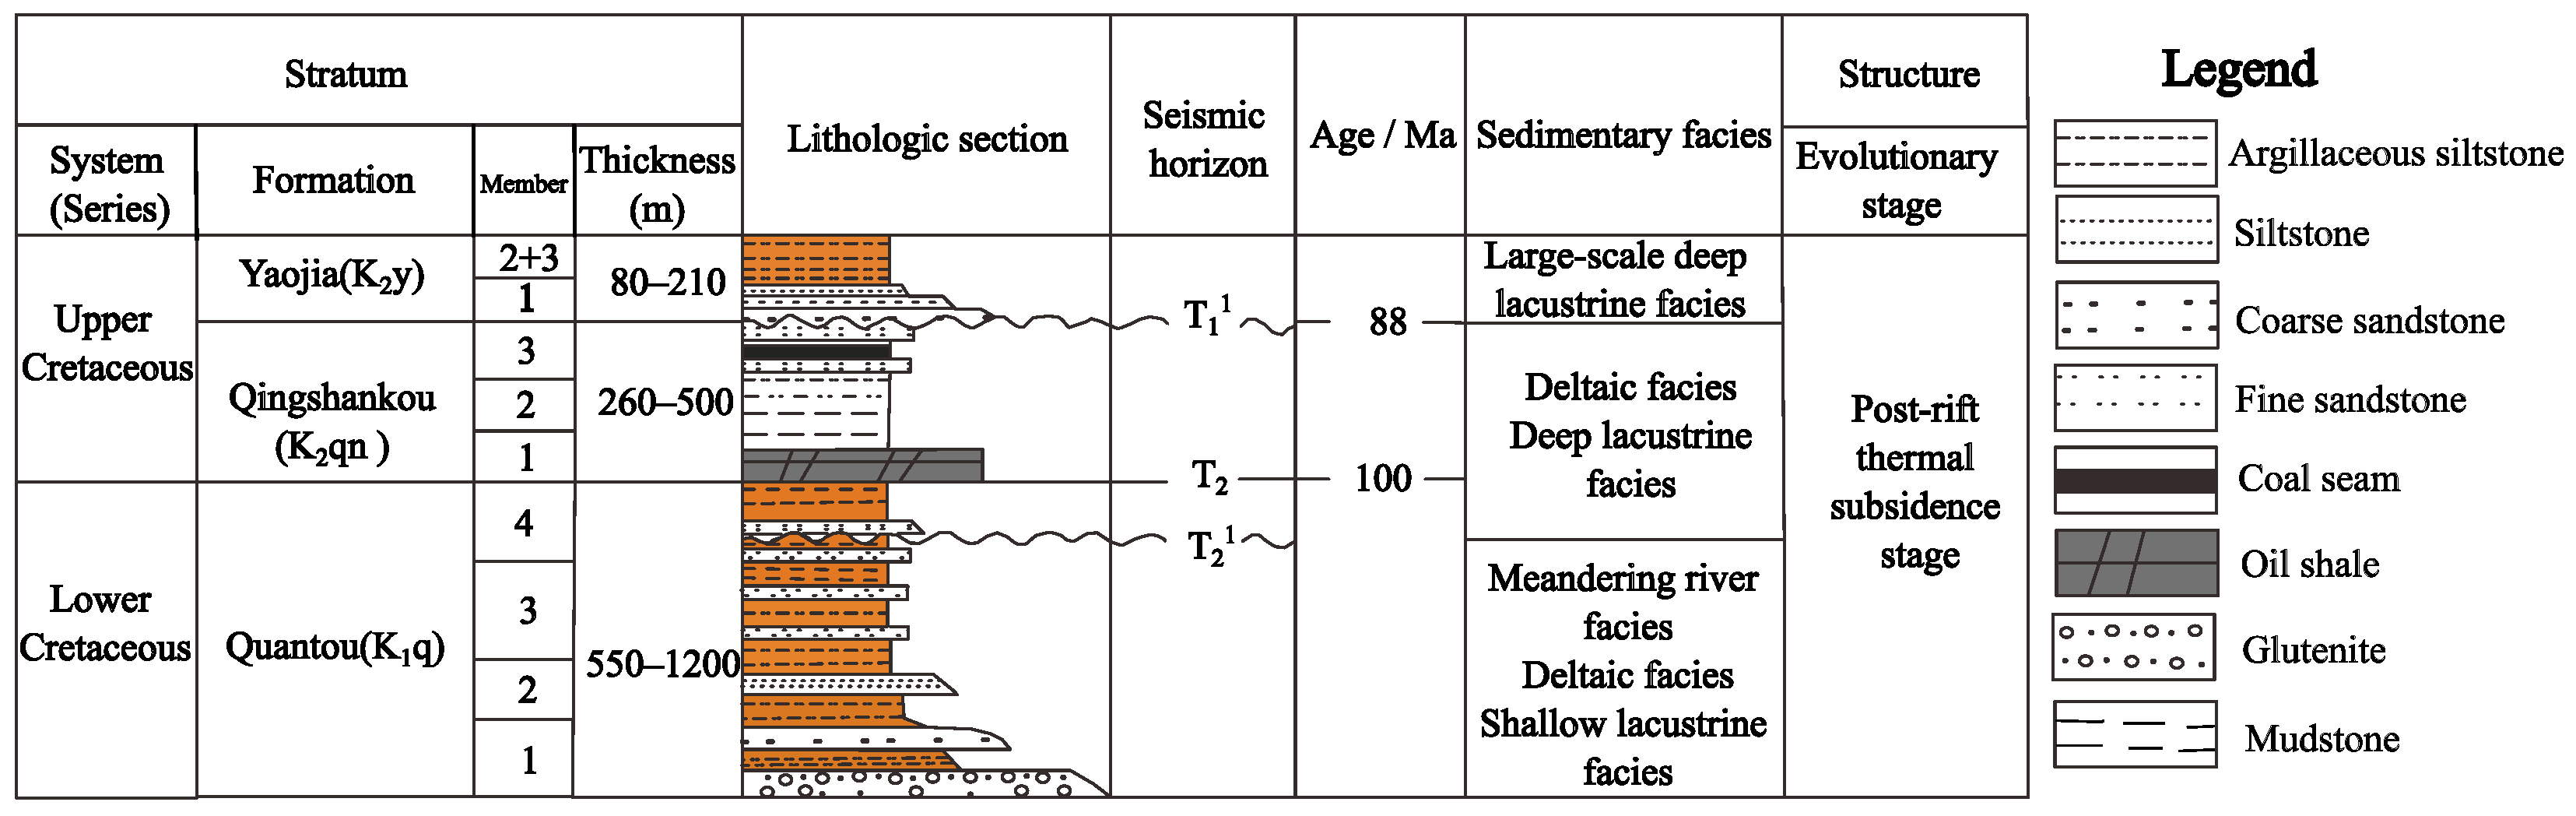
Location and well distribution map of the study area in the southern Songliao Basin. The eight cored wells used in this study (T1, B8, C8, C34, B8G P1-2, B28, B38, and G5-1) are highlighted.
Figure 2.
Location and well distribution map of the study area in the southern Songliao Basin. The eight cored wells used in this study (T1, B8, C8, C34, B8G P1-2, B28, B38, and G5-1) are highlighted.
Figure 3.
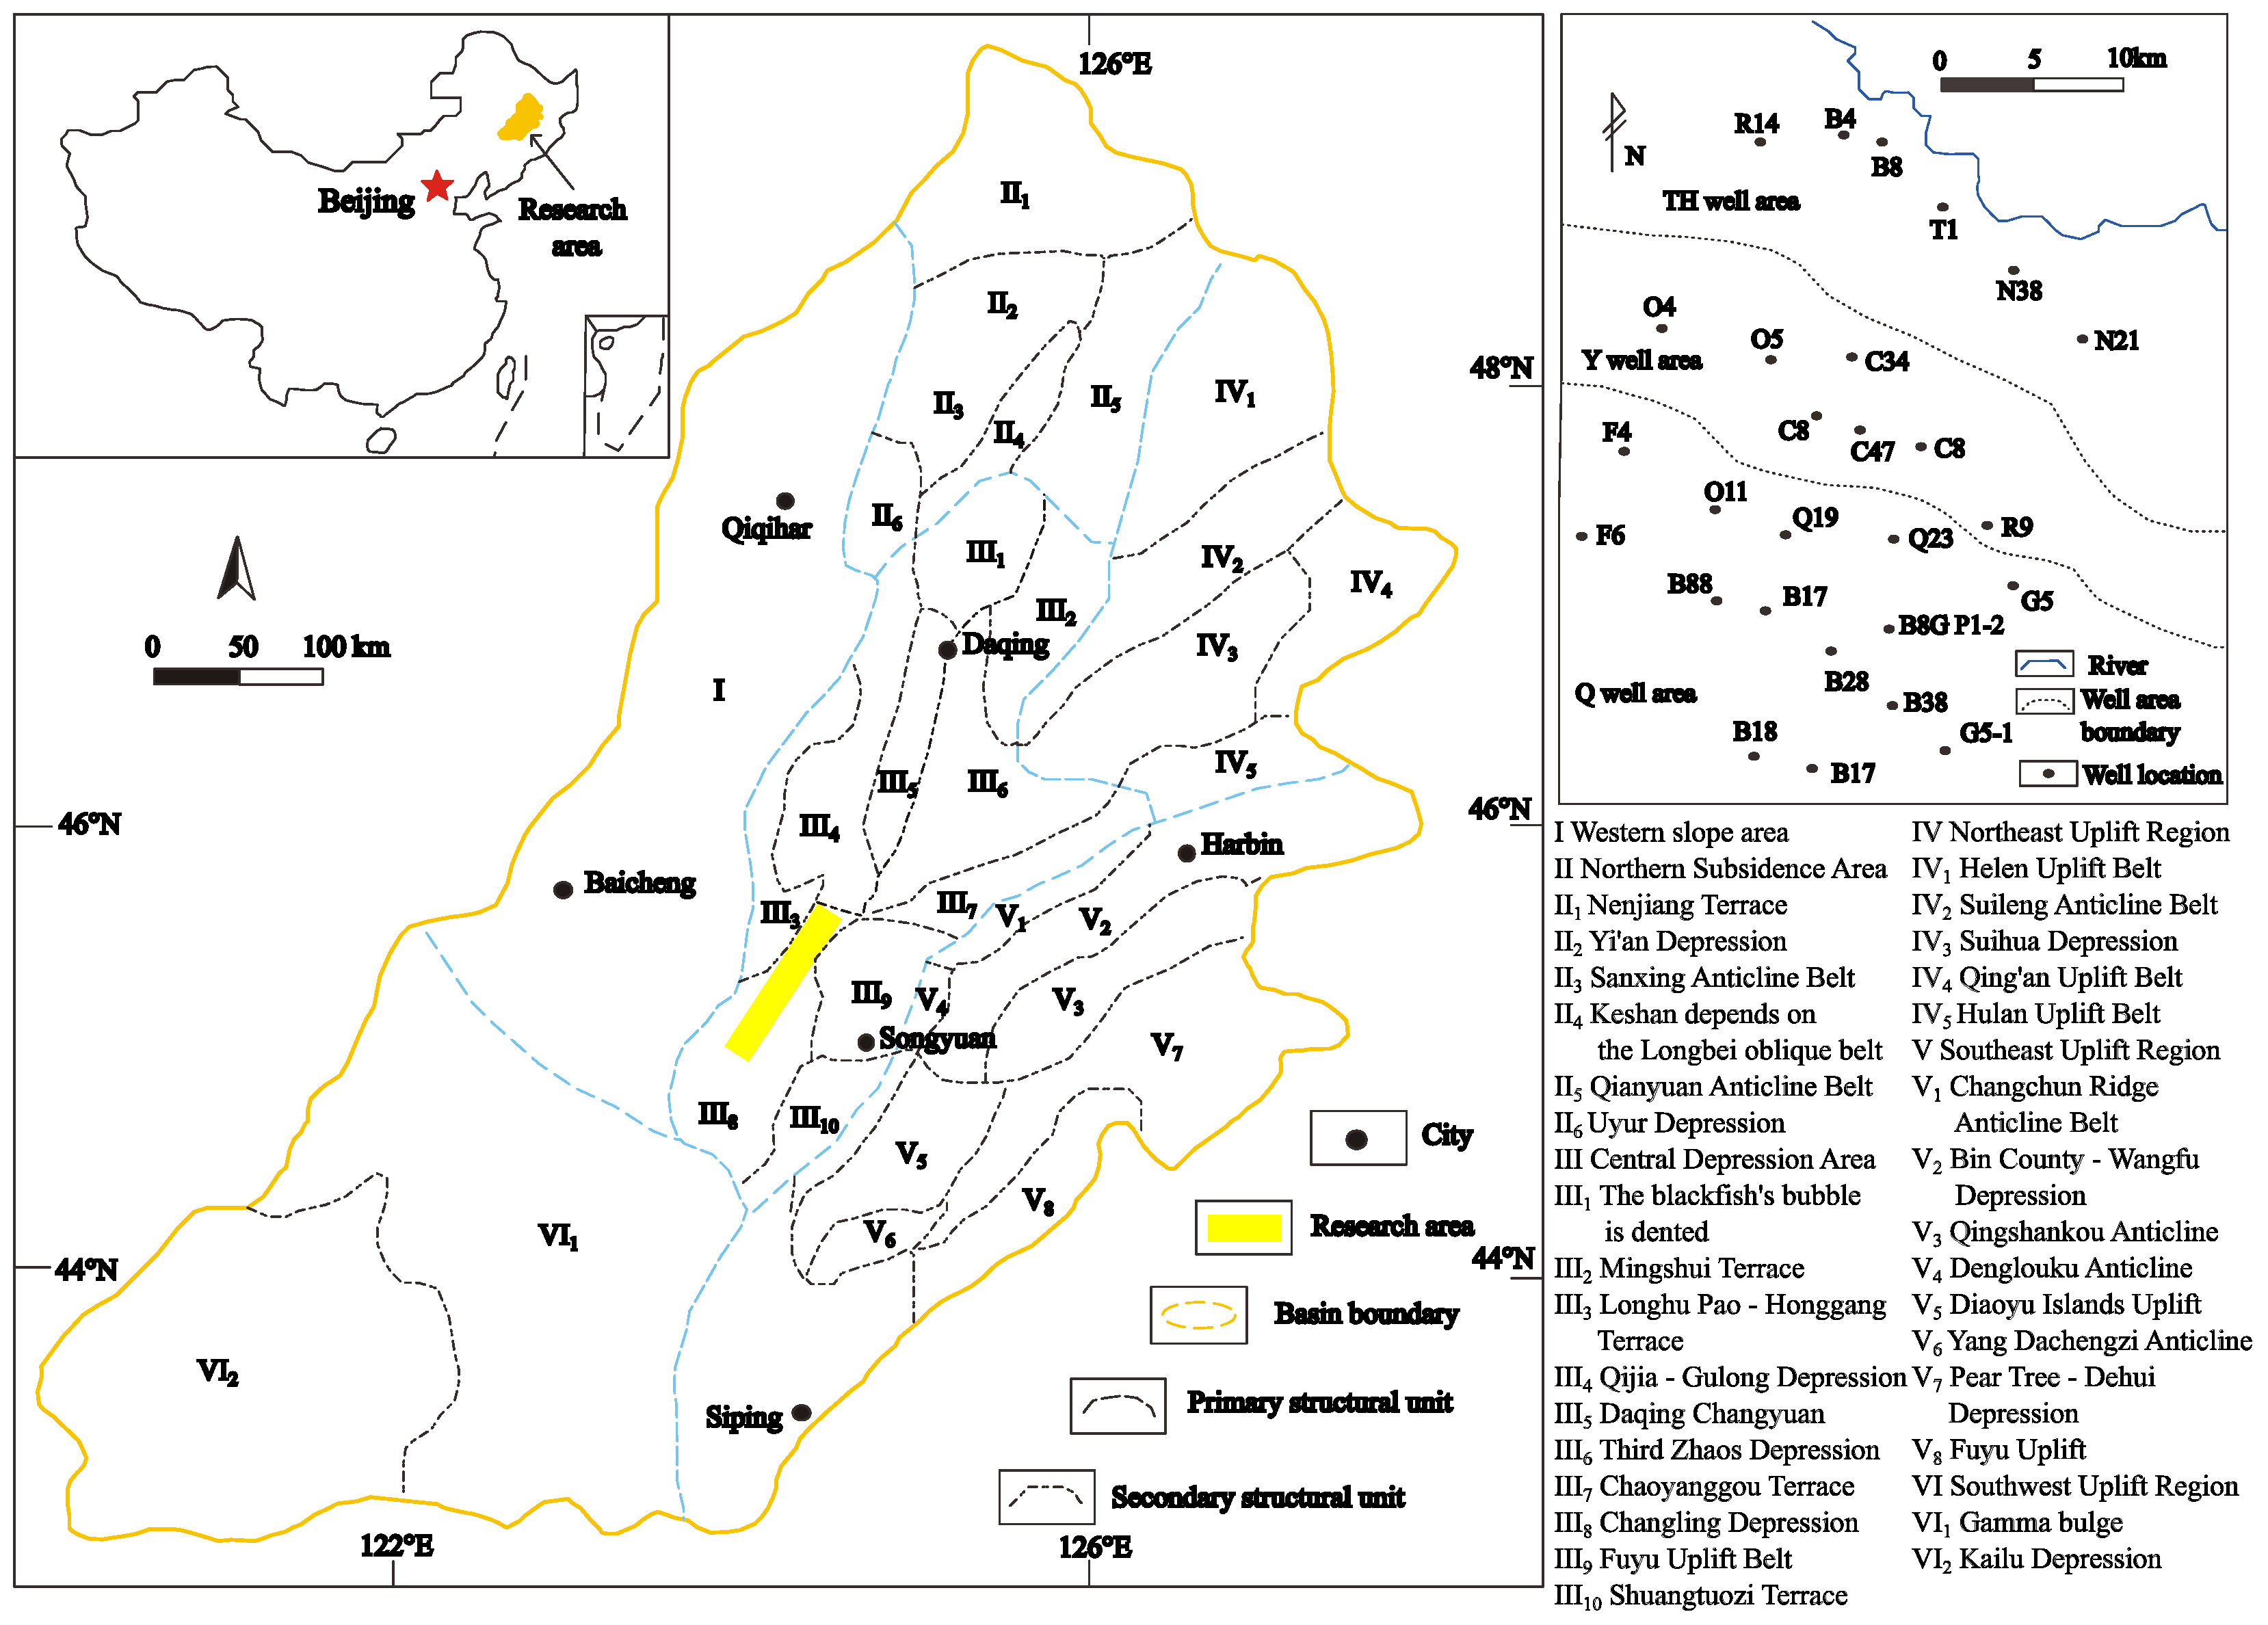
Lithofacies classification scheme. (a) Lithology classification (mud-silt-carbonate ternary). (b) Sedimentary structure classification (laminated-layered-blocky ternary). (c) Mineral composition classification (clay-felsic-carbonate ternary). (d) TOC organic matter abundance classification. Note: the “carbonate” end member in panel (c) denotes the carbonate mineral content (a mineralogical parameter); it is not a rock-type name. The “carbonate” end member in panel (a) denotes the carbonate rock end of the lithology ternary. All four panels represent independent classification dimensions; the full name of each lithofacies integrates all four dimensions simultaneously.
Figure 3.
Lithofacies classification scheme. (a) Lithology classification (mud-silt-carbonate ternary). (b) Sedimentary structure classification (laminated-layered-blocky ternary). (c) Mineral composition classification (clay-felsic-carbonate ternary). (d) TOC organic matter abundance classification. Note: the “carbonate” end member in panel (c) denotes the carbonate mineral content (a mineralogical parameter); it is not a rock-type name. The “carbonate” end member in panel (a) denotes the carbonate rock end of the lithology ternary. All four panels represent independent classification dimensions; the full name of each lithofacies integrates all four dimensions simultaneously.
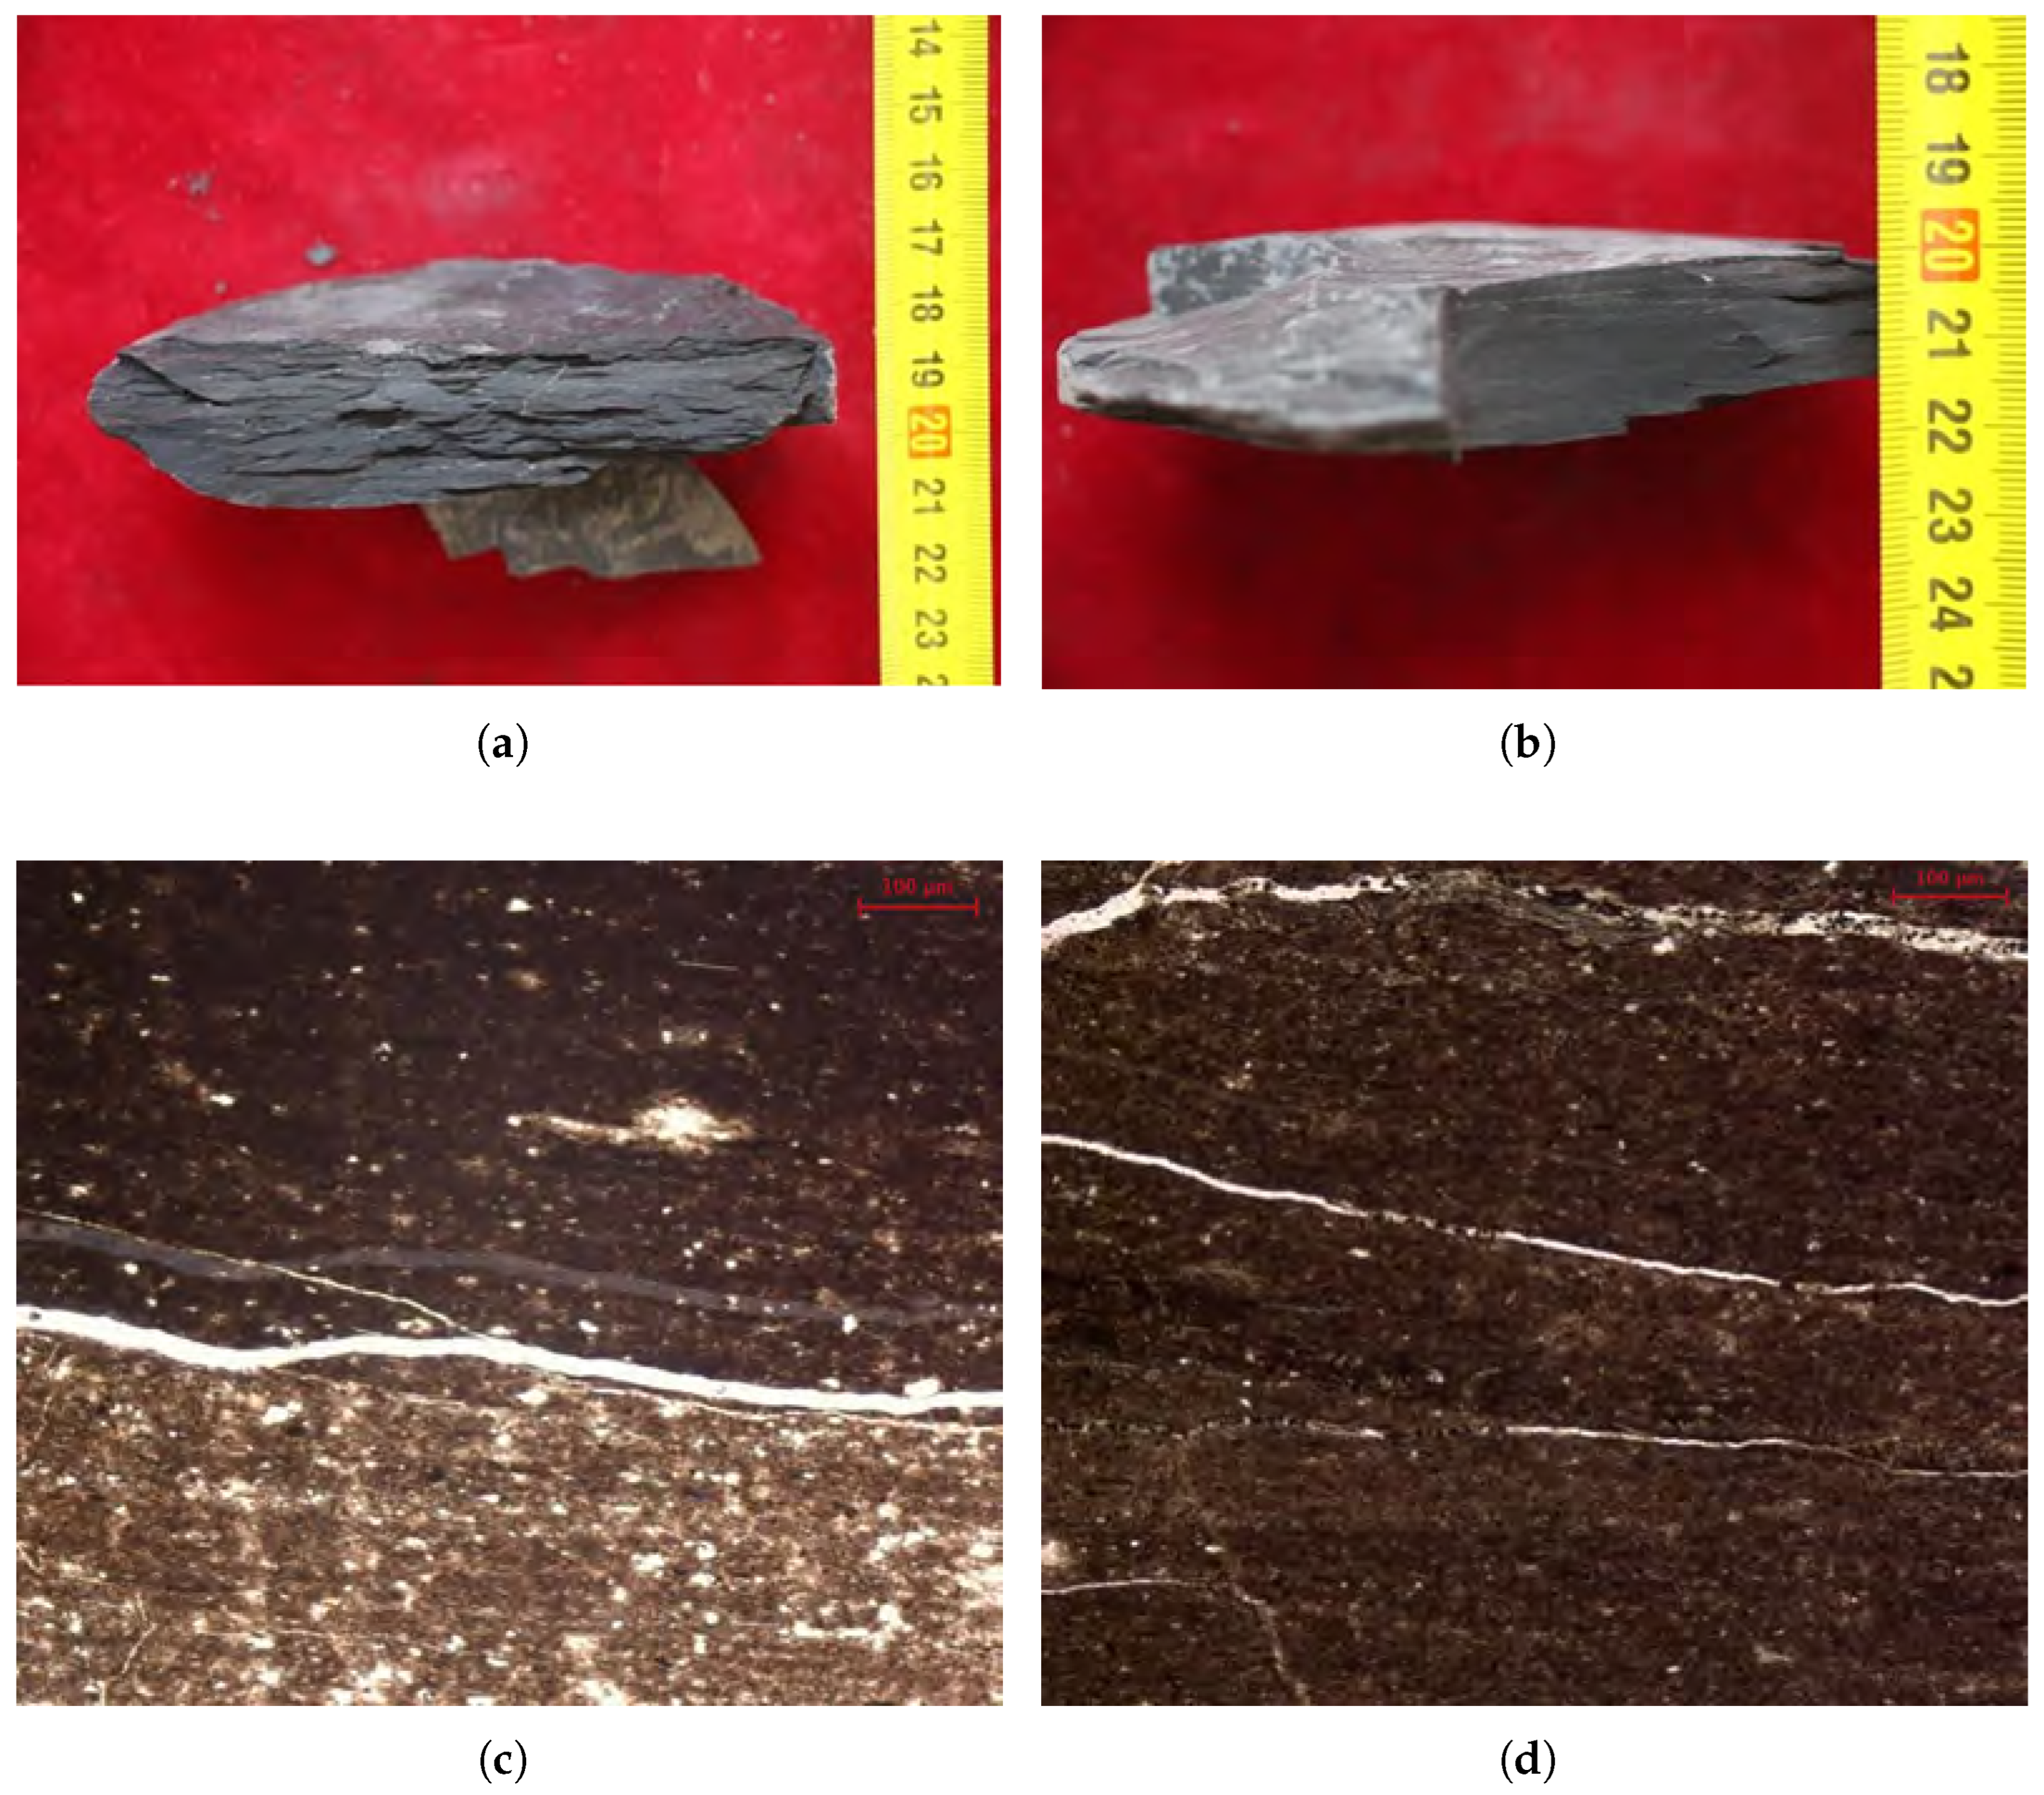
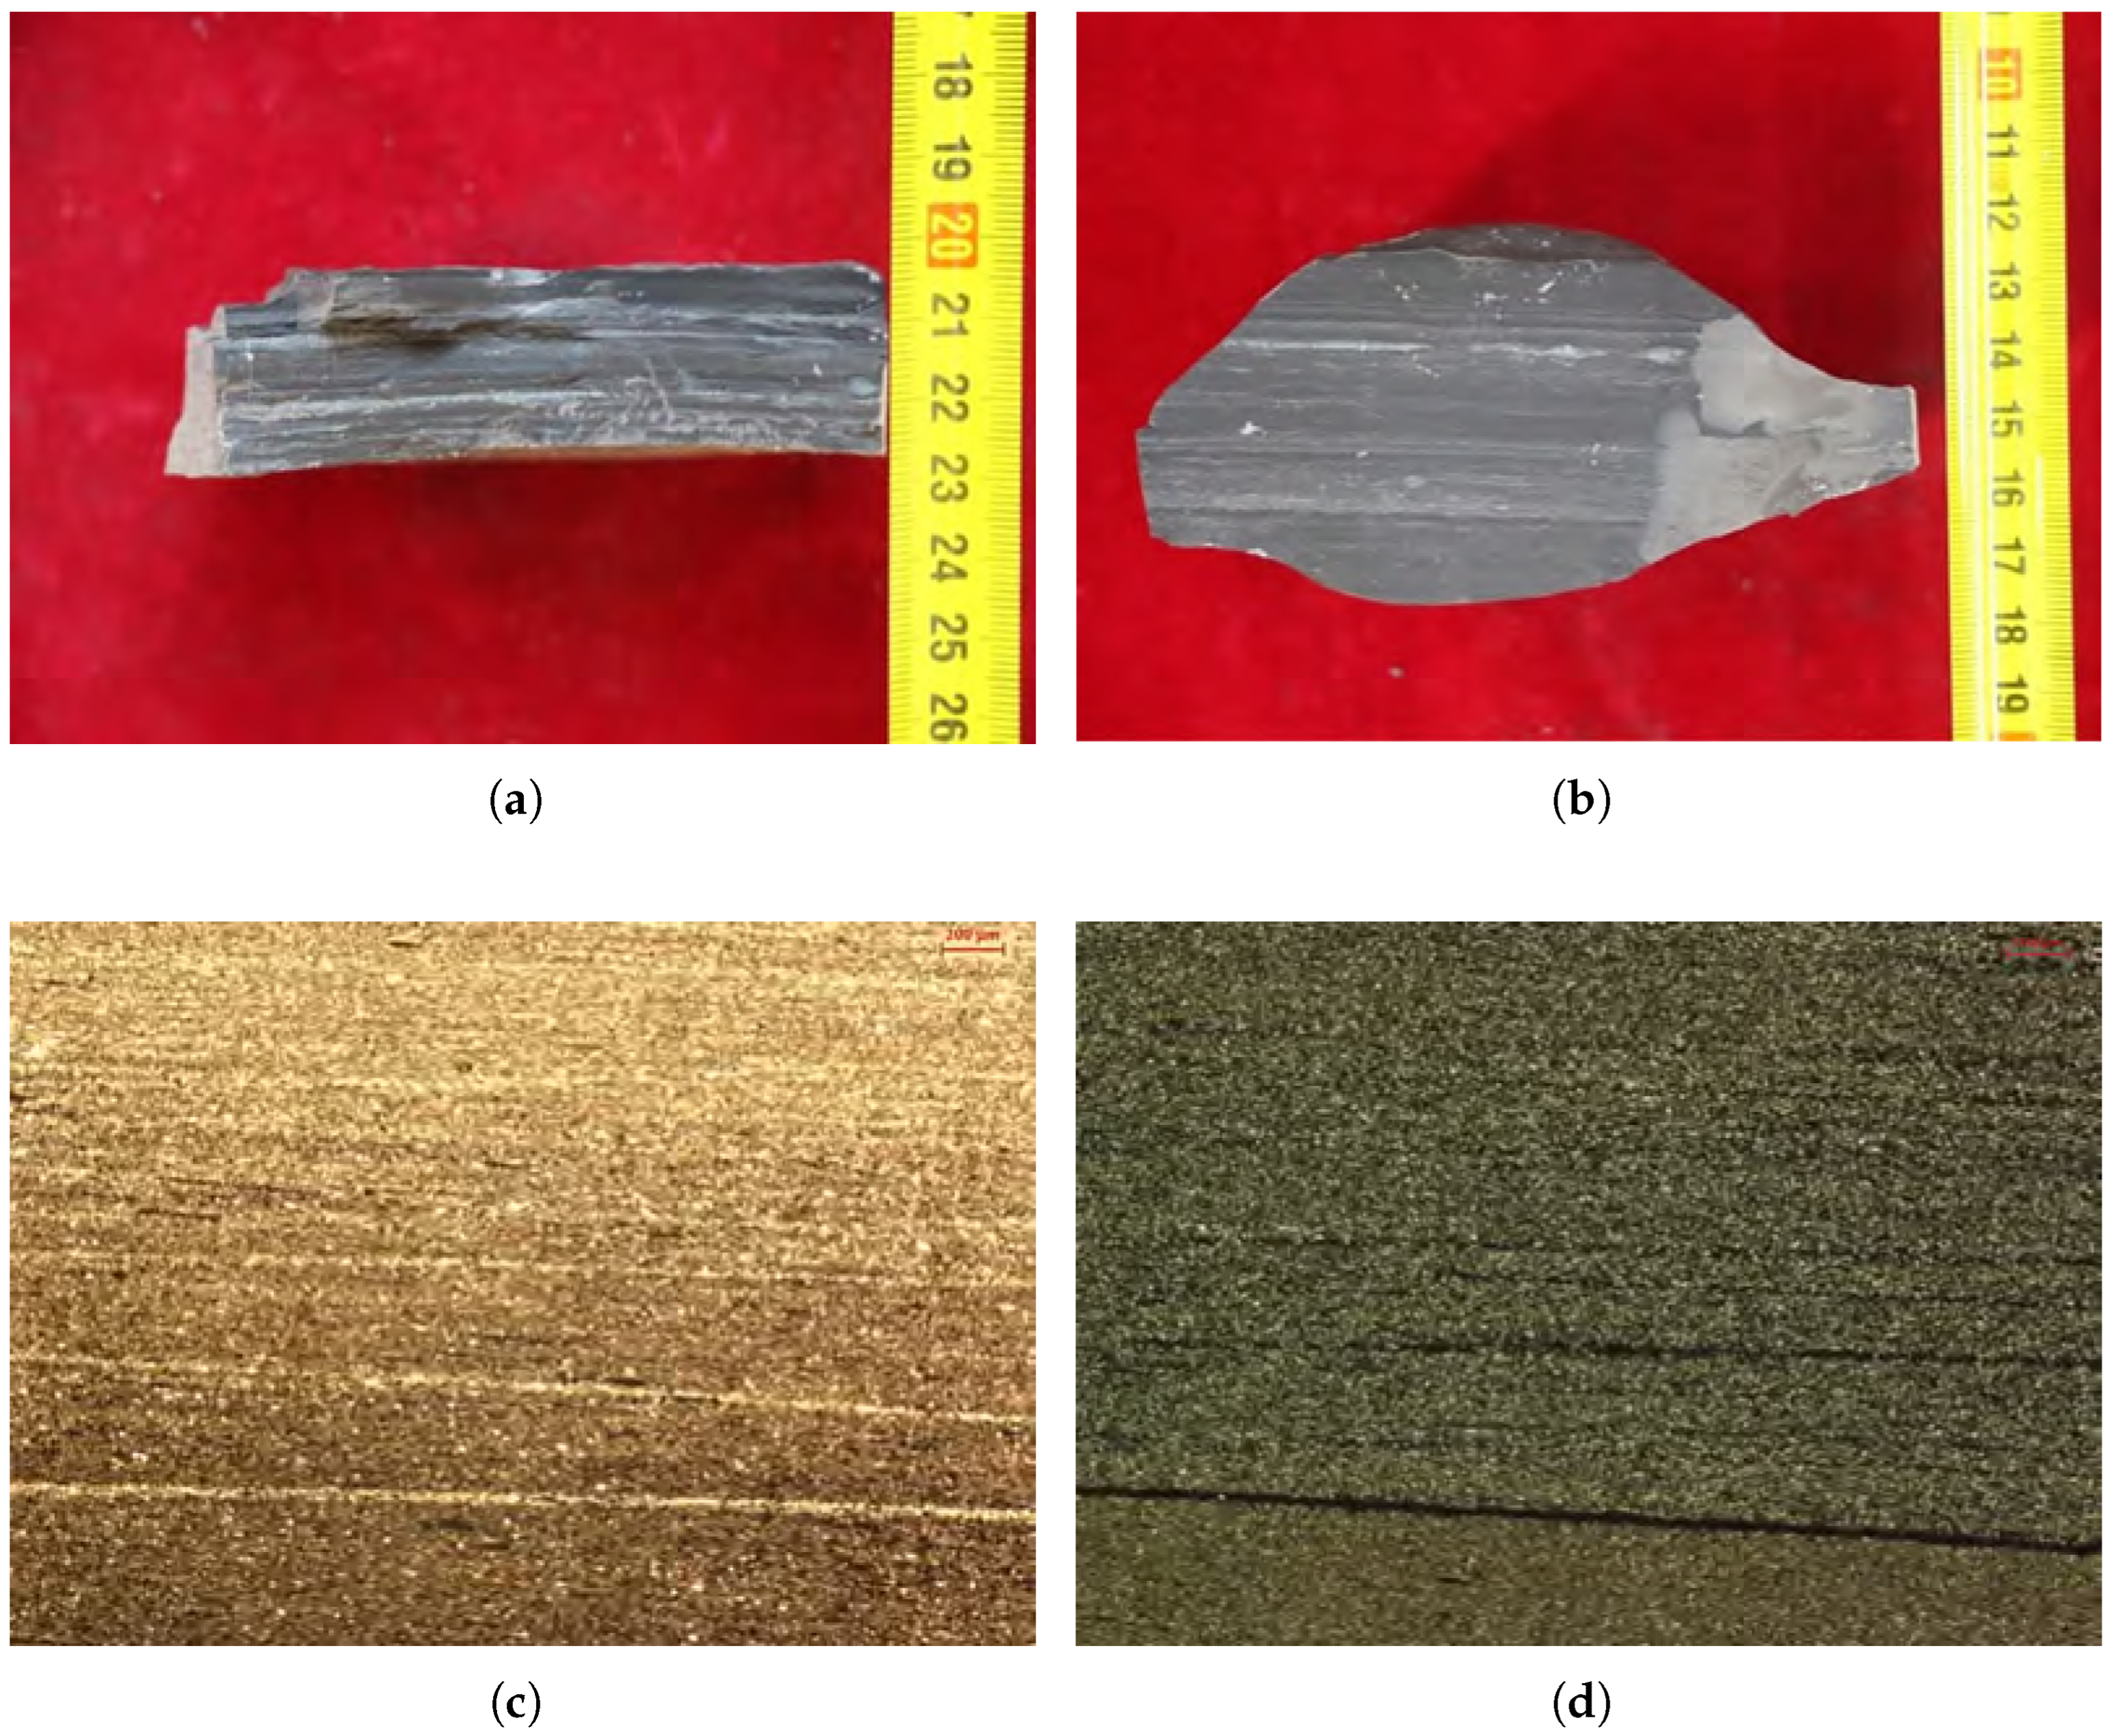
Figure 4.
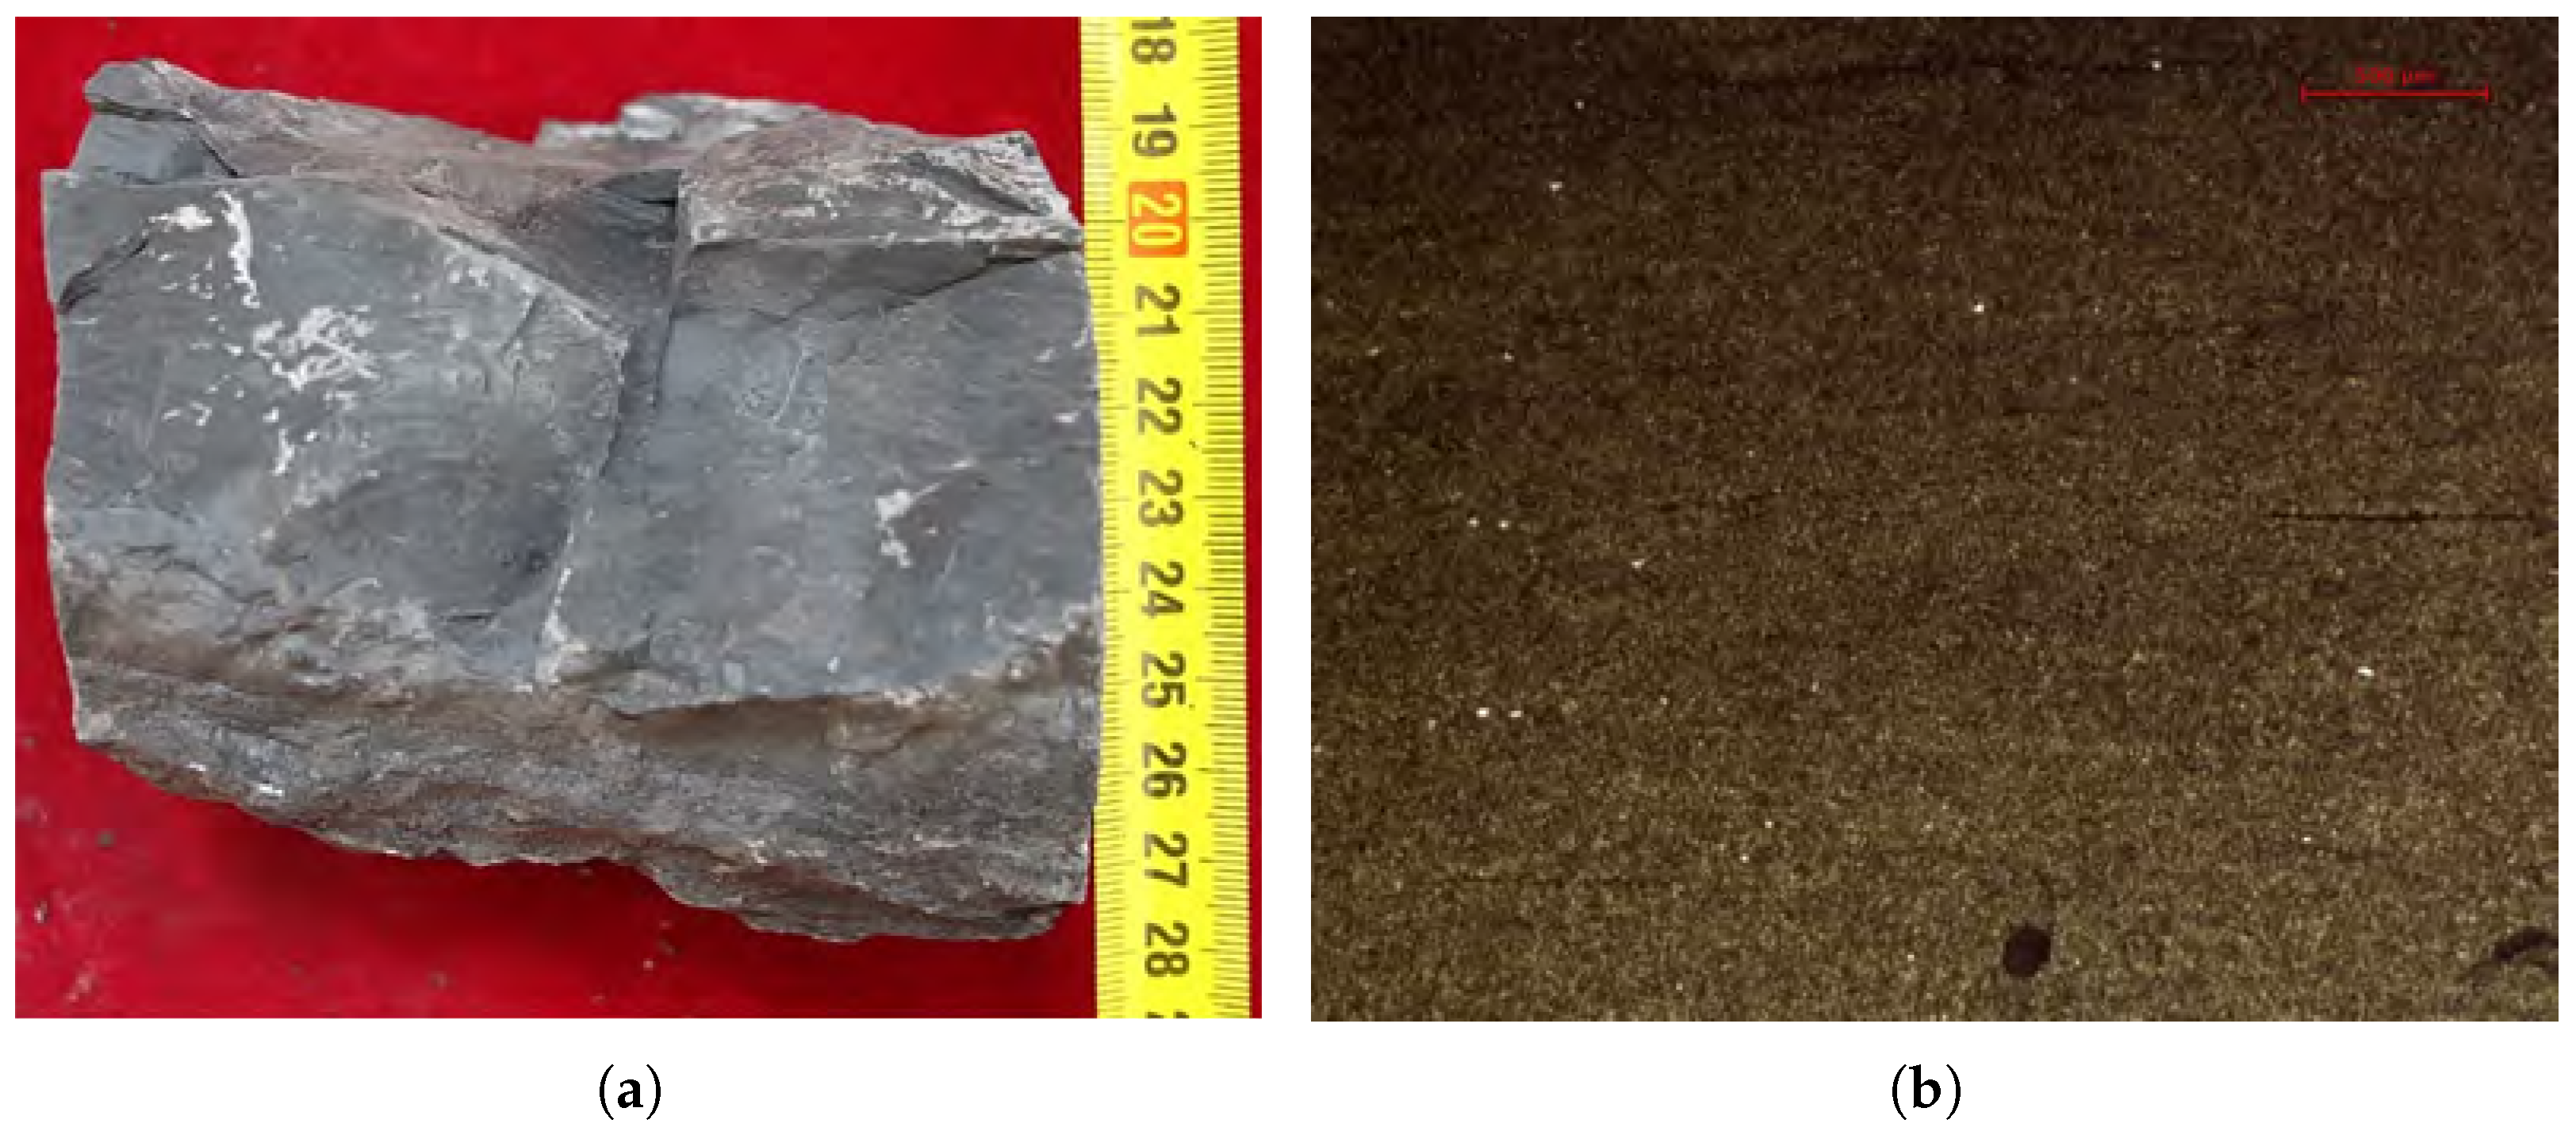
Core and photomicrograph characteristics of LF-A (high organic matter clay-rich mudstone-grade laminated shale). (a) Well T1, 2302.0 m, TOC = 3.03%, dark-gray-to-black shale. (b) Well C8, 2337.34 m, TOC = 3.84%, dark-gray-to-black shale; (c) Well T1, 2354.65 m, TOC = 4.41%, alternating organic matter-poor and organic matter-rich clay-grade laminae with bedding-parallel fractures. (d) Well T1, 2269.6 m, TOC = 3.98%, organic matter-rich clay-grade laminae with bedding-parallel fractures.
Figure 4.
Core and photomicrograph characteristics of LF-A (high organic matter clay-rich mudstone-grade laminated shale). (a) Well T1, 2302.0 m, TOC = 3.03%, dark-gray-to-black shale. (b) Well C8, 2337.34 m, TOC = 3.84%, dark-gray-to-black shale; (c) Well T1, 2354.65 m, TOC = 4.41%, alternating organic matter-poor and organic matter-rich clay-grade laminae with bedding-parallel fractures. (d) Well T1, 2269.6 m, TOC = 3.98%, organic matter-rich clay-grade laminae with bedding-parallel fractures.
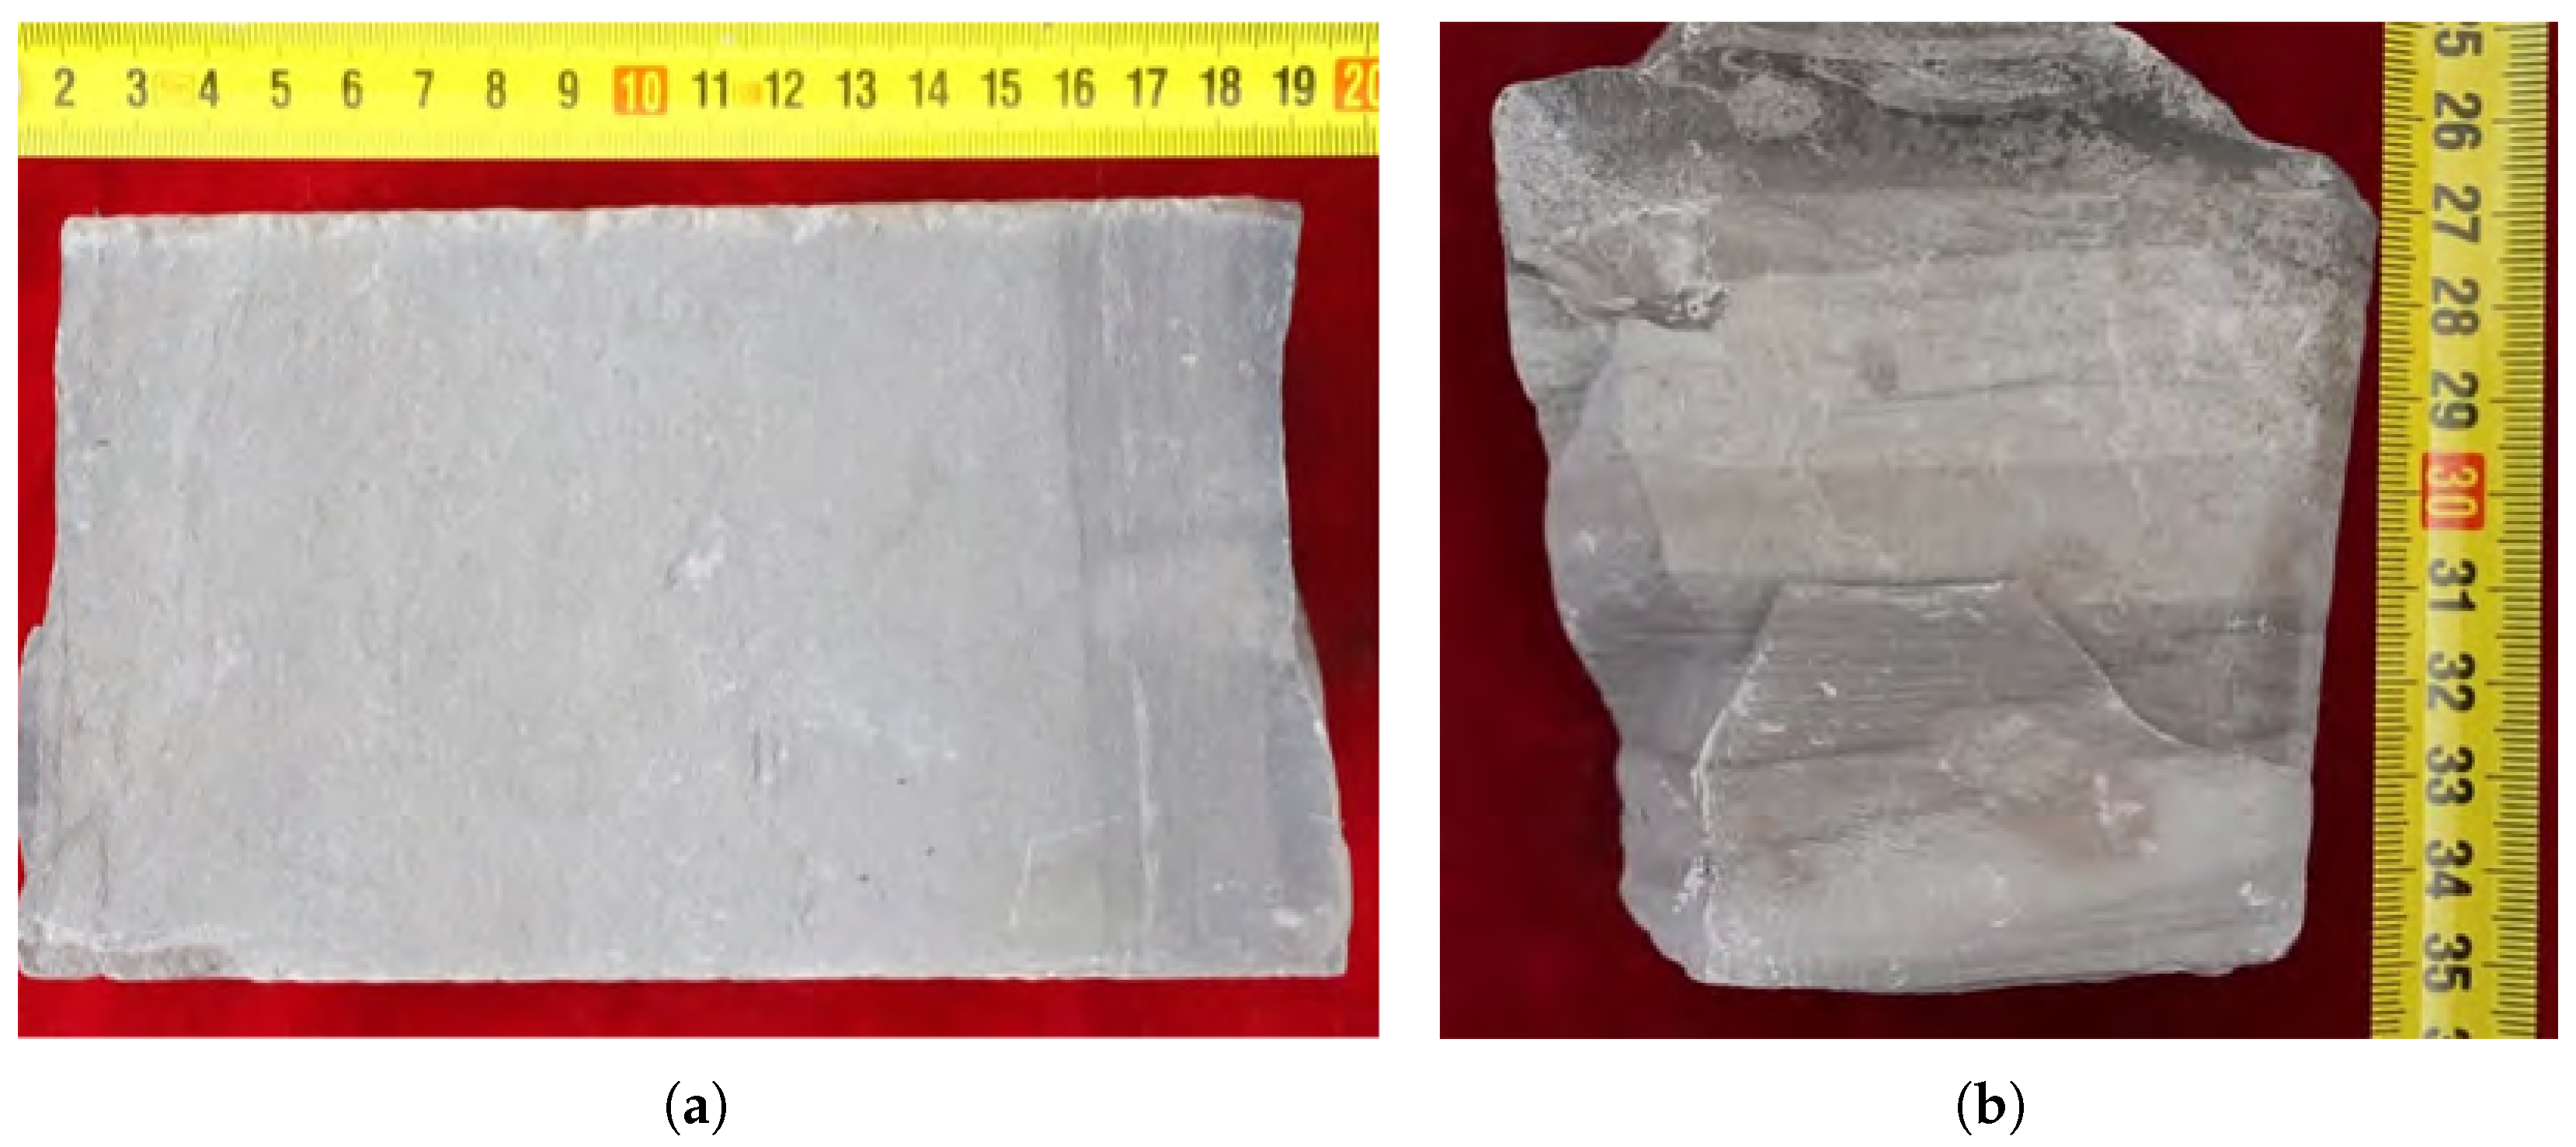
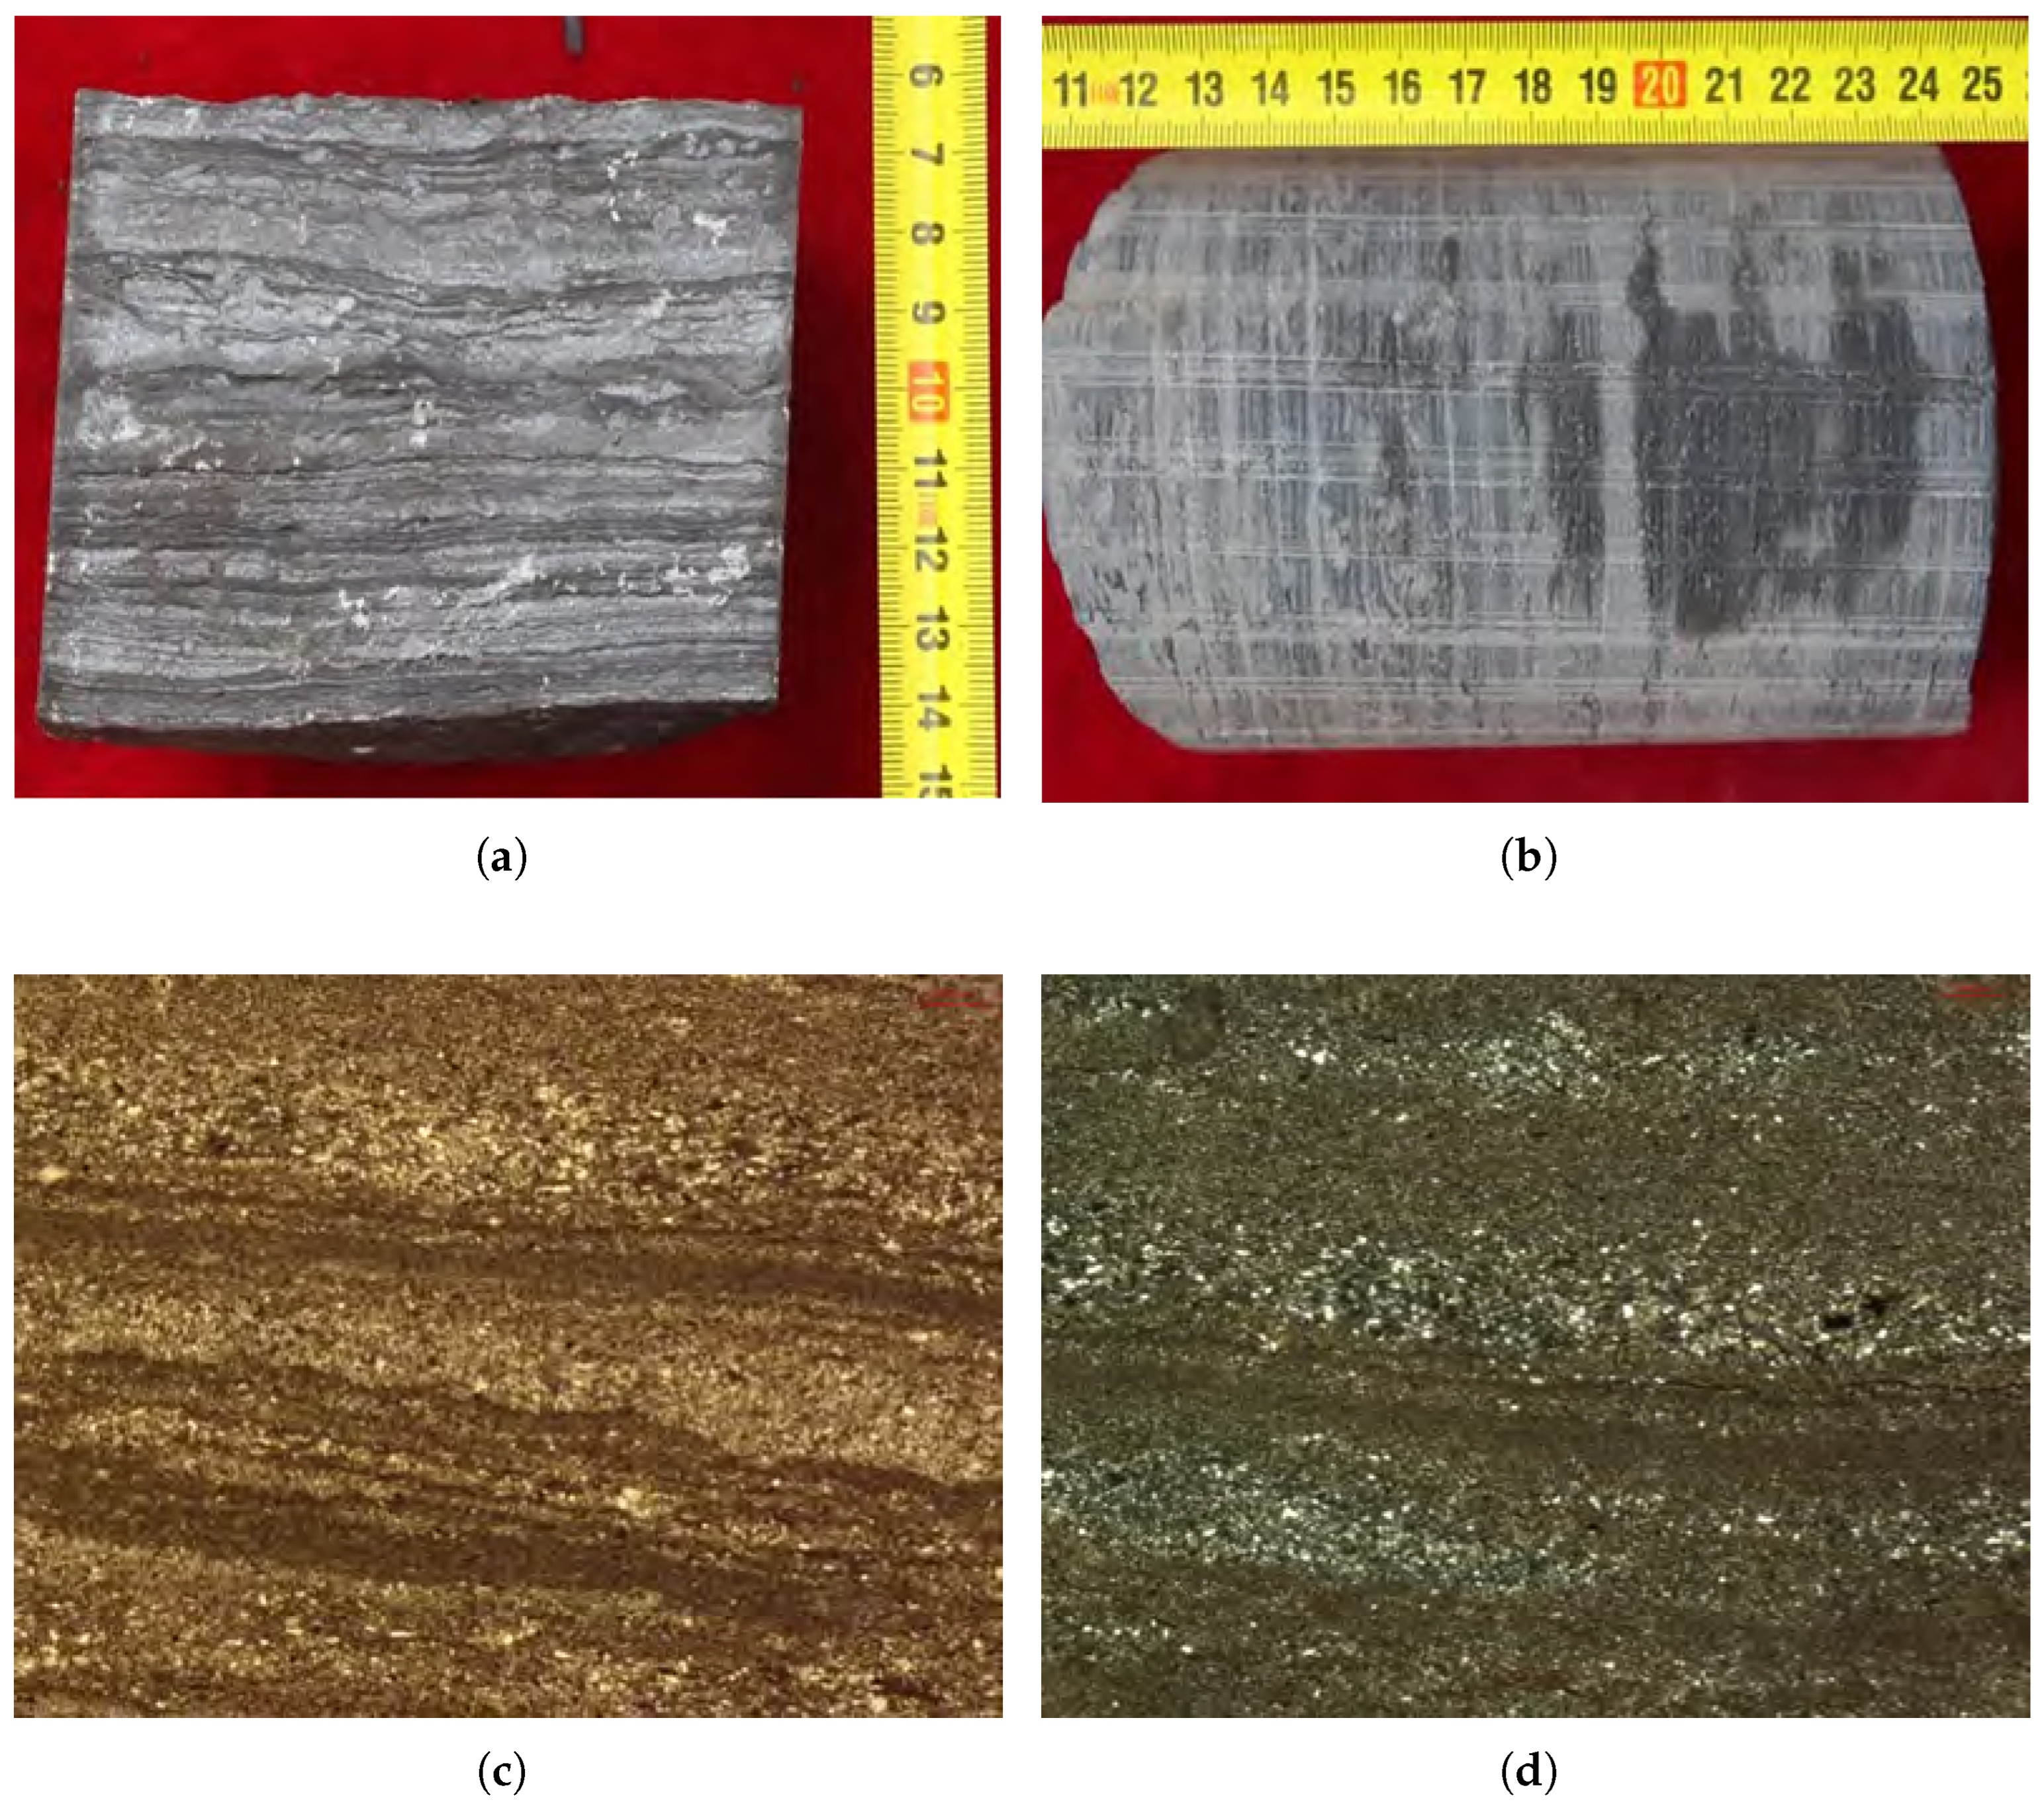
Figure 5.
Core and photomicrograph characteristics of LF-B (high-to-moderate organic matter felsic mudstone-grade laminated shale). (a) Well C8, 2370.65 m, TOC = 1.20%, dark-gray-to-black shale with minor silt-grade laminae. (b) Well P1-2, 2236.71 m, TOC = 2.40%, deep gray shale with minor silt-grade laminae. (c) Well P1-2, 2240.85 m, TOC = 2.29%, plane-polarized light. (d) Well P1-2, 2240.85 m, TOC = 2.29%, cross-polarized light.
Figure 5.
Core and photomicrograph characteristics of LF-B (high-to-moderate organic matter felsic mudstone-grade laminated shale). (a) Well C8, 2370.65 m, TOC = 1.20%, dark-gray-to-black shale with minor silt-grade laminae. (b) Well P1-2, 2236.71 m, TOC = 2.40%, deep gray shale with minor silt-grade laminae. (c) Well P1-2, 2240.85 m, TOC = 2.29%, plane-polarized light. (d) Well P1-2, 2240.85 m, TOC = 2.29%, cross-polarized light.
Figure 6.
Core and photomicrograph characteristics of LF-C (low-to-moderate organic matter felsic silt-bearing laminated shale). (a) Well P1-2, 2252.99 m, TOC = 0.74%, silt-bearing laminated shale with ball-and-pillow structures. (b) Well C8, 2382.88 m, TOC = 1.79%, silt-bearing laminated shale with ball-and-pillow and fluid escape structures. (c) Well P1-2, 2235.59 m, TOC = 1.27%, plane-polarized light. (d) Well P1-2, 2235.59 m, TOC = 1.27%, cross-polarized light.
Figure 6.
Core and photomicrograph characteristics of LF-C (low-to-moderate organic matter felsic silt-bearing laminated shale). (a) Well P1-2, 2252.99 m, TOC = 0.74%, silt-bearing laminated shale with ball-and-pillow structures. (b) Well C8, 2382.88 m, TOC = 1.79%, silt-bearing laminated shale with ball-and-pillow and fluid escape structures. (c) Well P1-2, 2235.59 m, TOC = 1.27%, plane-polarized light. (d) Well P1-2, 2235.59 m, TOC = 1.27%, cross-polarized light.
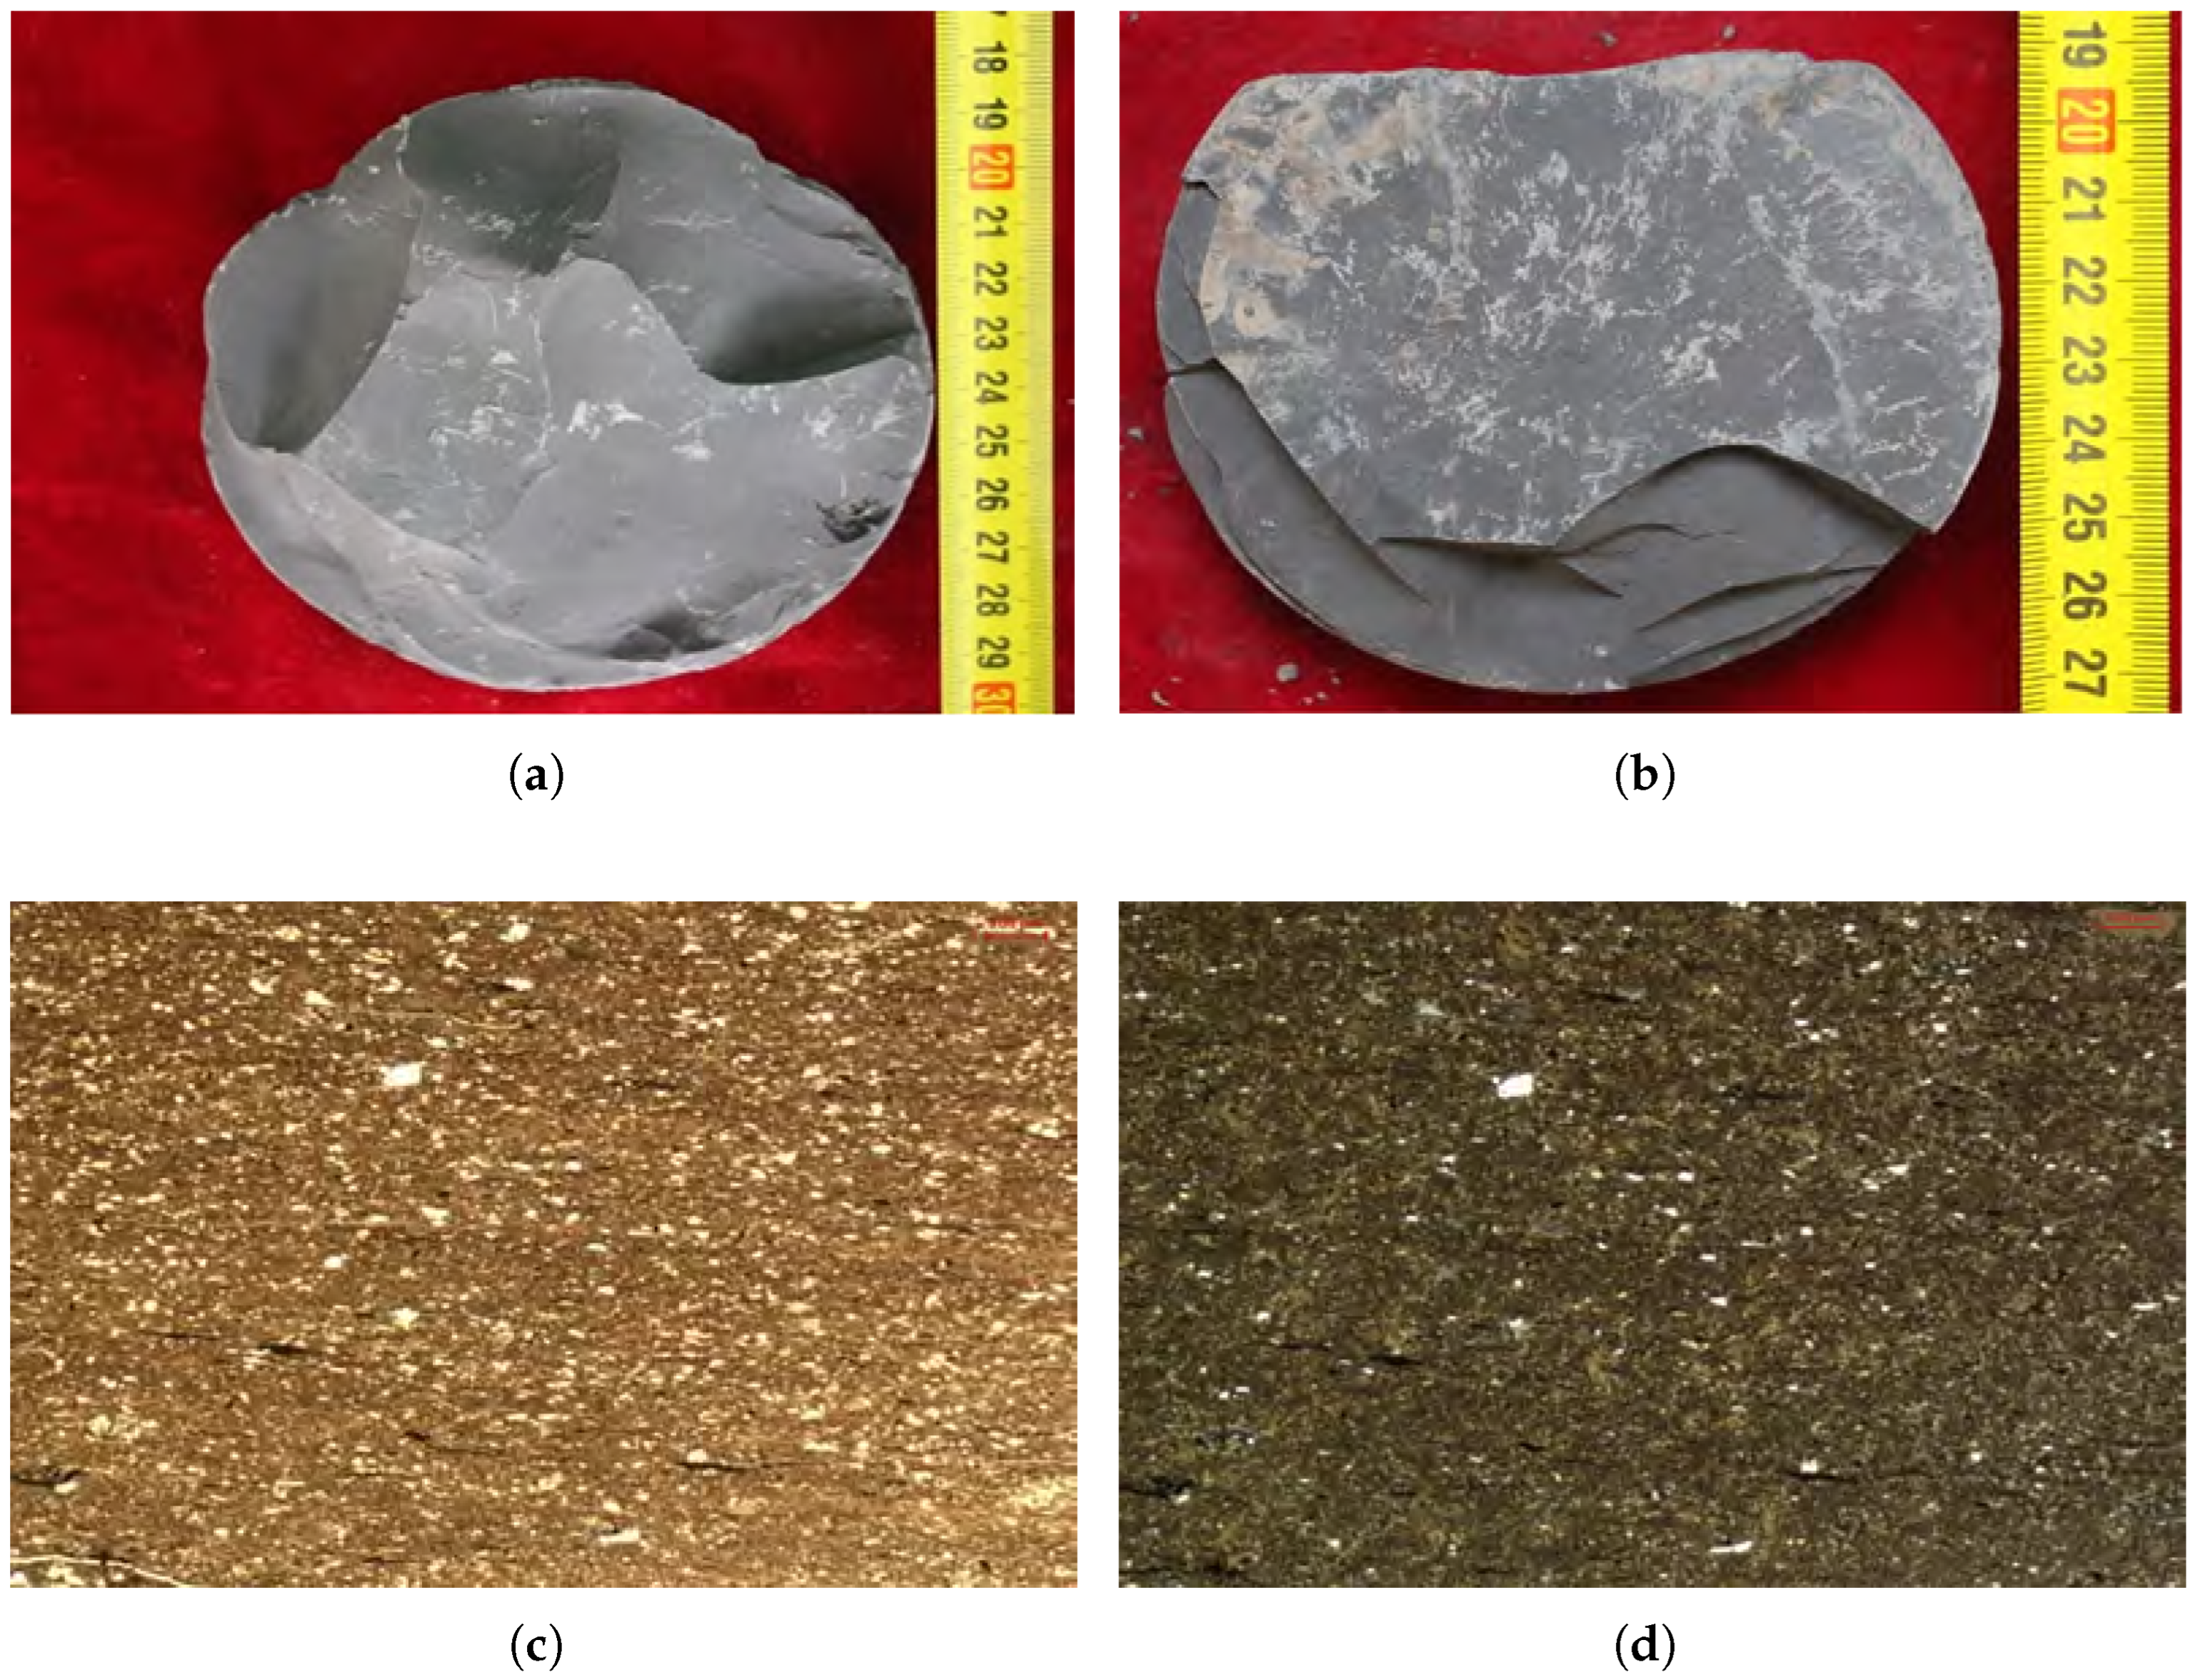
Figure 7.
Core and photomicrograph characteristics of LF-D (low-to-moderate organic matter massive felsic mudstone). (a) Well P1-2, 2050.0 m, TOC = 0.8%, gray mudstone with massive structure. (b) Well C8, 2326.41 m, TOC = 1.8%, deep gray mudstone with massive structure. (c) Well P1-2, 2223.45 m, TOC = 1.78%, plane-polarized light. (d) Well P1-2, 2223.45 m, TOC = 1.78%, cross-polarized light.
Figure 7.
Core and photomicrograph characteristics of LF-D (low-to-moderate organic matter massive felsic mudstone). (a) Well P1-2, 2050.0 m, TOC = 0.8%, gray mudstone with massive structure. (b) Well C8, 2326.41 m, TOC = 1.8%, deep gray mudstone with massive structure. (c) Well P1-2, 2223.45 m, TOC = 1.78%, plane-polarized light. (d) Well P1-2, 2223.45 m, TOC = 1.78%, cross-polarized light.
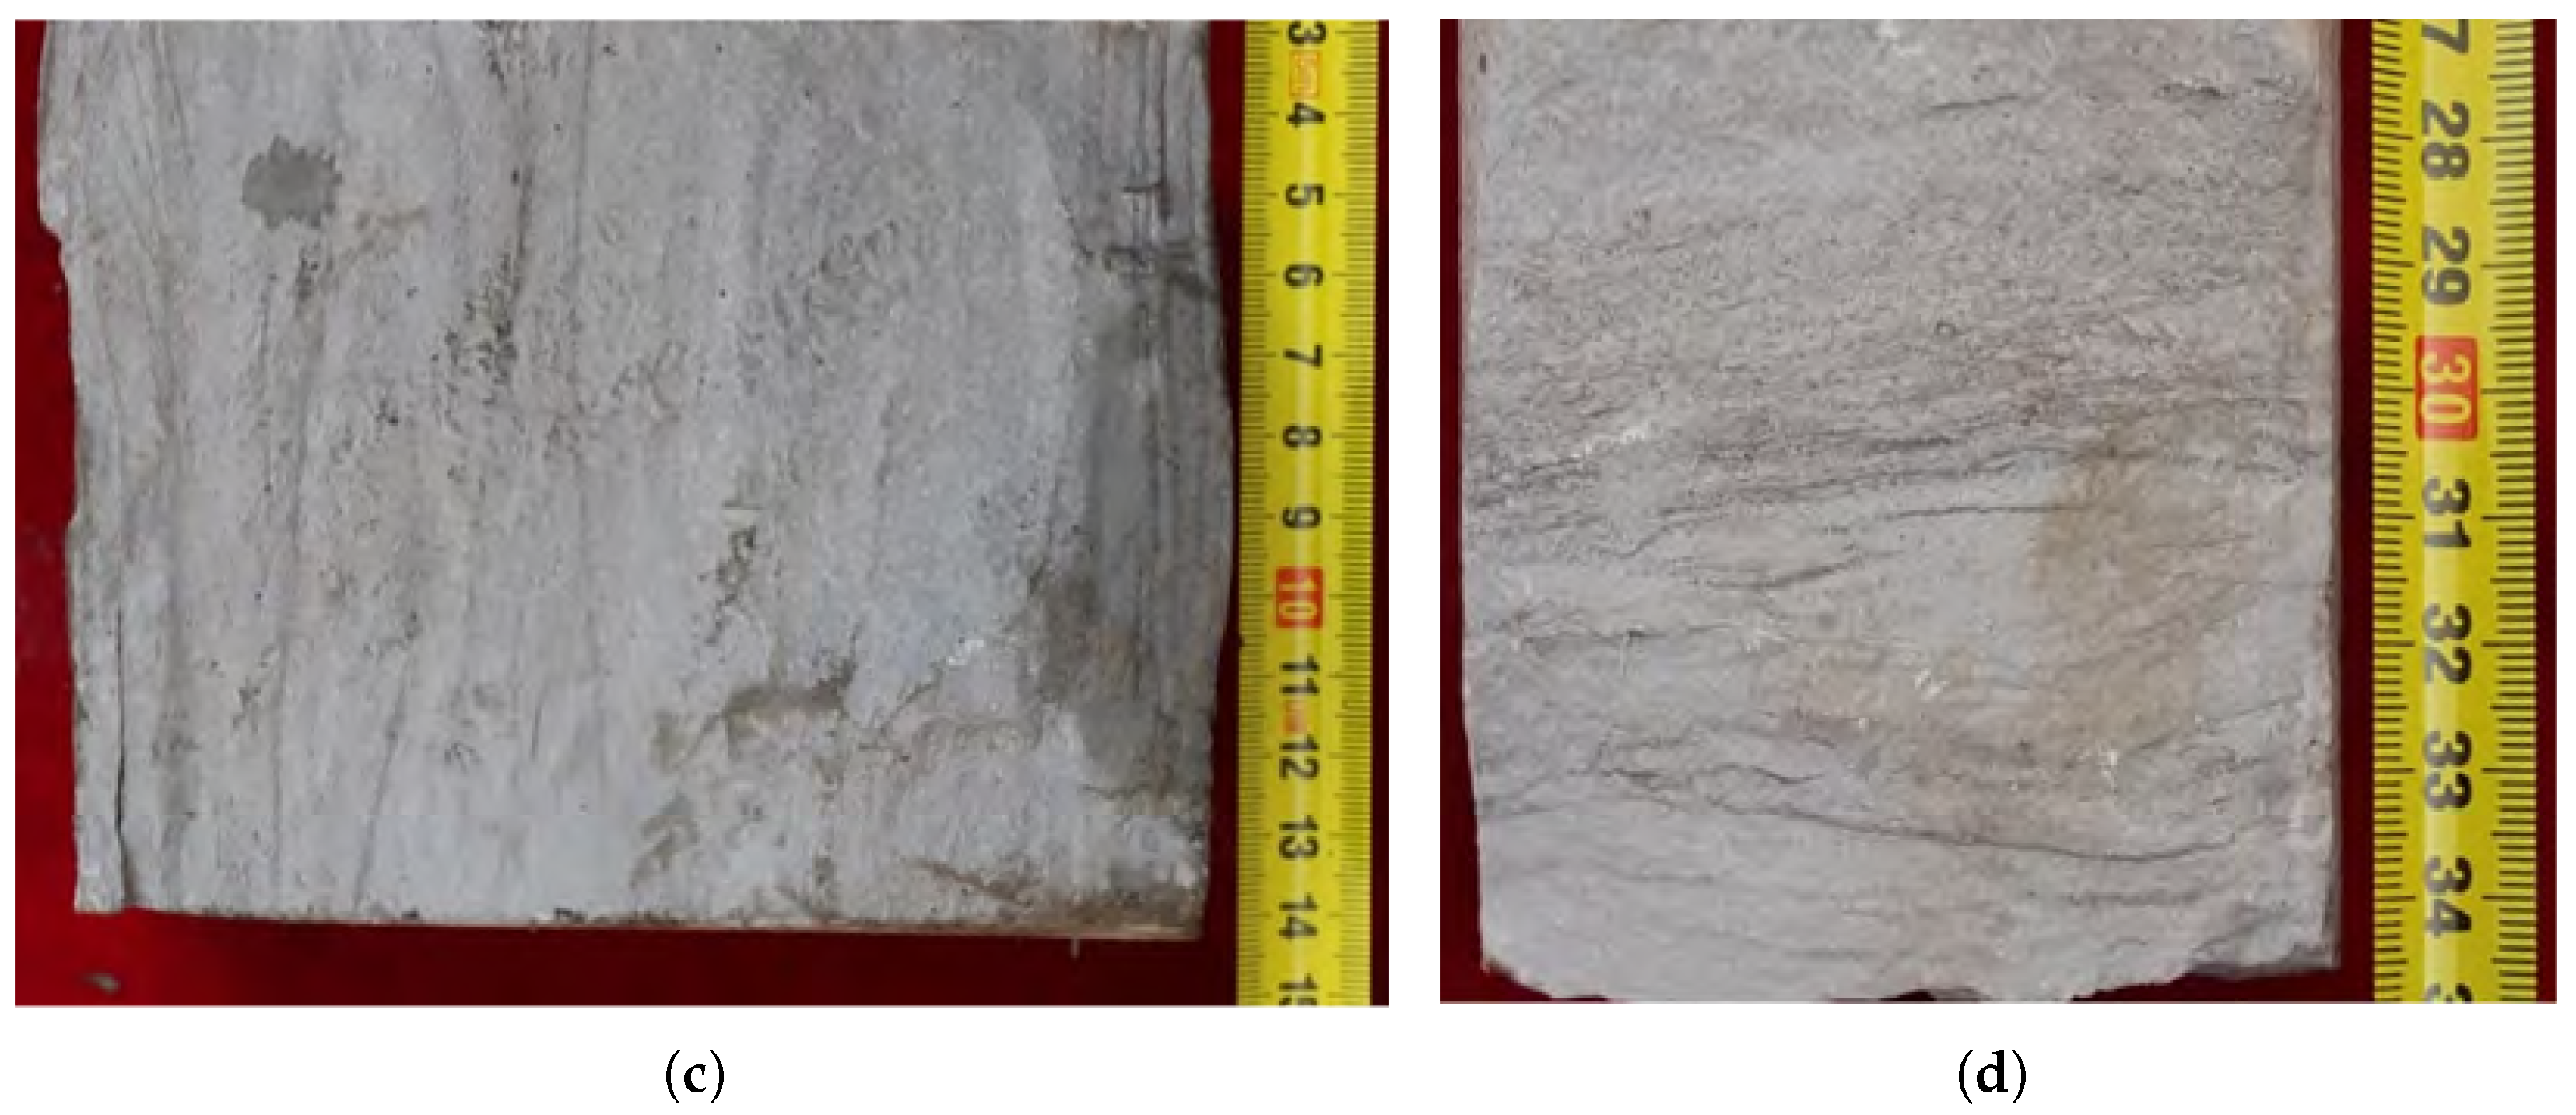
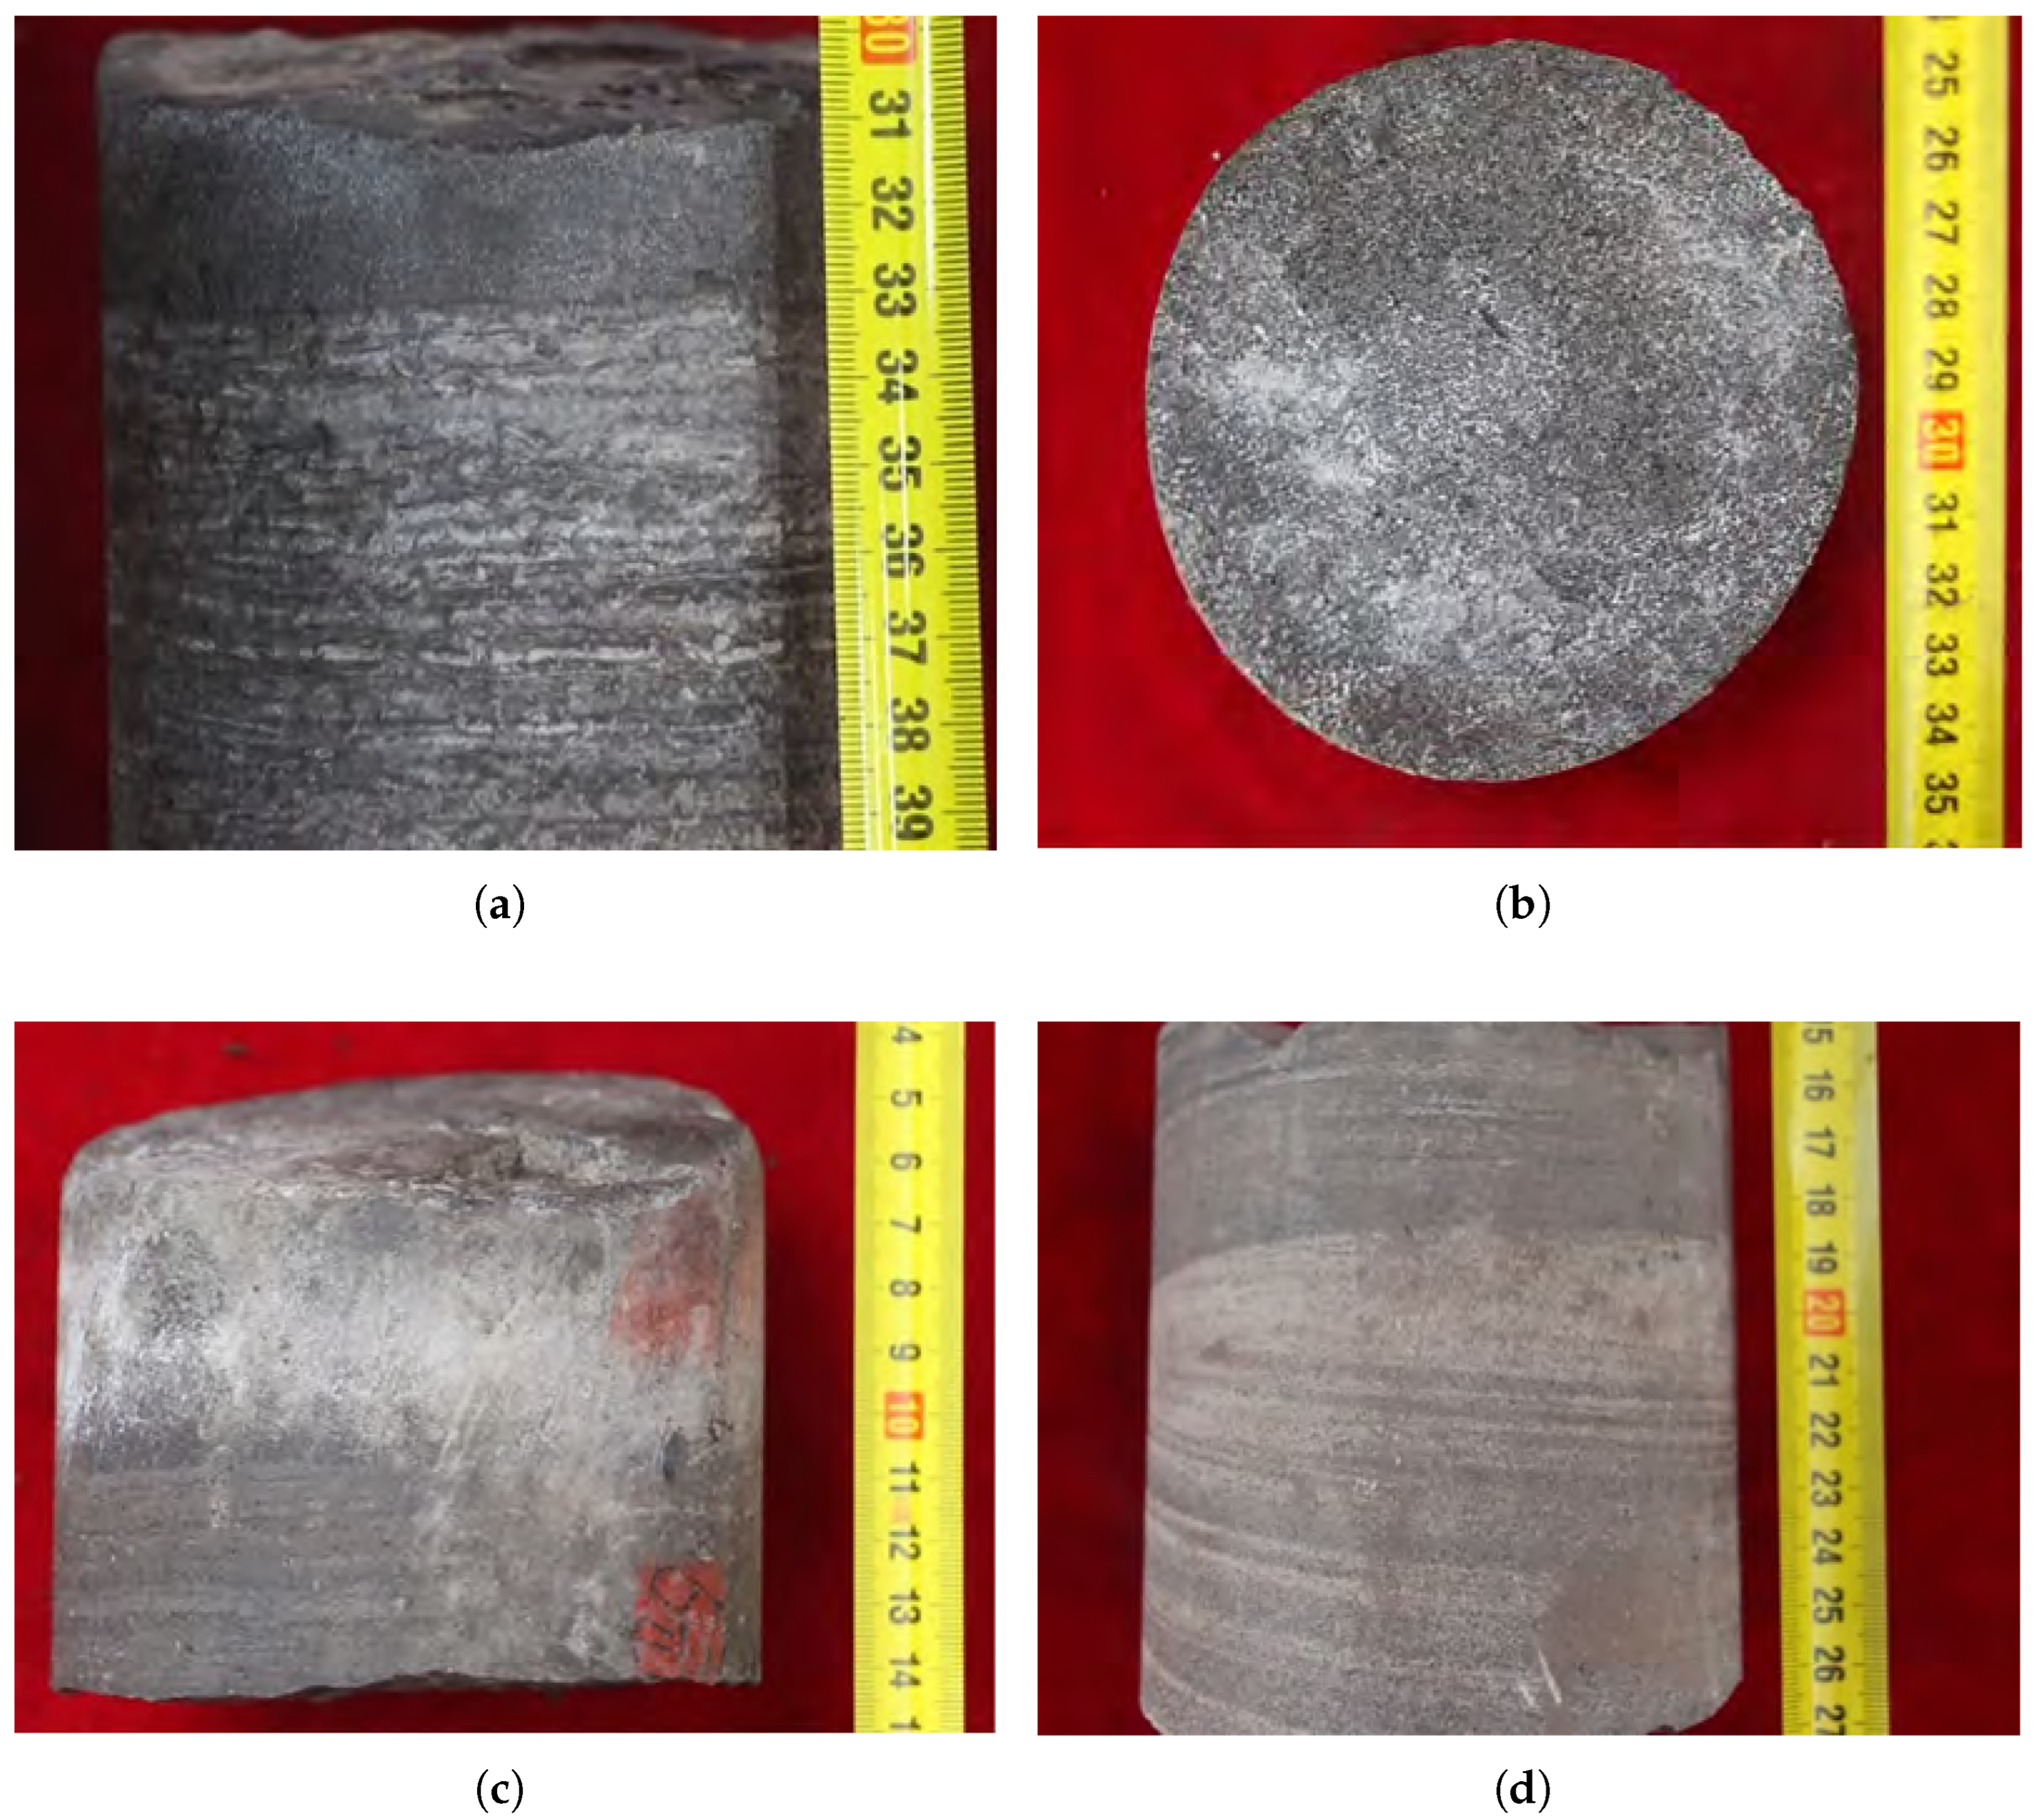
Figure 8.
Core characteristics of LF-E (layered siltstone) and LF-F (layered fine sandstone). (a) Well B88, 2544.4 m, layered siltstone with inverse grading. (b) Well B8G, 2249.92 m, layered siltstone with climbing ripple lamination and oil staining. (c) Well B8G, 2234.15 m, layered fine sandstone with climbing ripple lamination and trough cross-bedding. (d) Well B8G, 2061.89 m, fine sandstone with trough cross-bedding.
Figure 8.
Core characteristics of LF-E (layered siltstone) and LF-F (layered fine sandstone). (a) Well B88, 2544.4 m, layered siltstone with inverse grading. (b) Well B8G, 2249.92 m, layered siltstone with climbing ripple lamination and oil staining. (c) Well B8G, 2234.15 m, layered fine sandstone with climbing ripple lamination and trough cross-bedding. (d) Well B8G, 2061.89 m, fine sandstone with trough cross-bedding.
Figure 9.
Core characteristics of LF-G (layered ostracod-bearing limestone). (a) Well B8G, 2079.41 m, ostracod-bearing limestone with argillaceous laminae. (b) Well B28, 2459.3 m, ostracod-bearing limestone with complete ostracod valves. (c) Well B8G, 2253.99 m, ostracod-bearing limestone with an erosional surface at the base. (d) Well B88, 2254.74 m, ostracod-bearing limestone interbedded within sandstone.
Figure 9.
Core characteristics of LF-G (layered ostracod-bearing limestone). (a) Well B8G, 2079.41 m, ostracod-bearing limestone with argillaceous laminae. (b) Well B28, 2459.3 m, ostracod-bearing limestone with complete ostracod valves. (c) Well B8G, 2253.99 m, ostracod-bearing limestone with an erosional surface at the base. (d) Well B88, 2254.74 m, ostracod-bearing limestone interbedded within sandstone.
Figure 10.
Core and photomicrograph characteristics of LF-H (layered dolostone). (a) Well T1, 2284.5 m, layered dolostone with massive structure. (b) Well T1, 2284.5 m, cross-polarized light.
Figure 10.
Core and photomicrograph characteristics of LF-H (layered dolostone). (a) Well T1, 2284.5 m, layered dolostone with massive structure. (b) Well T1, 2284.5 m, cross-polarized light.
Figure 11.
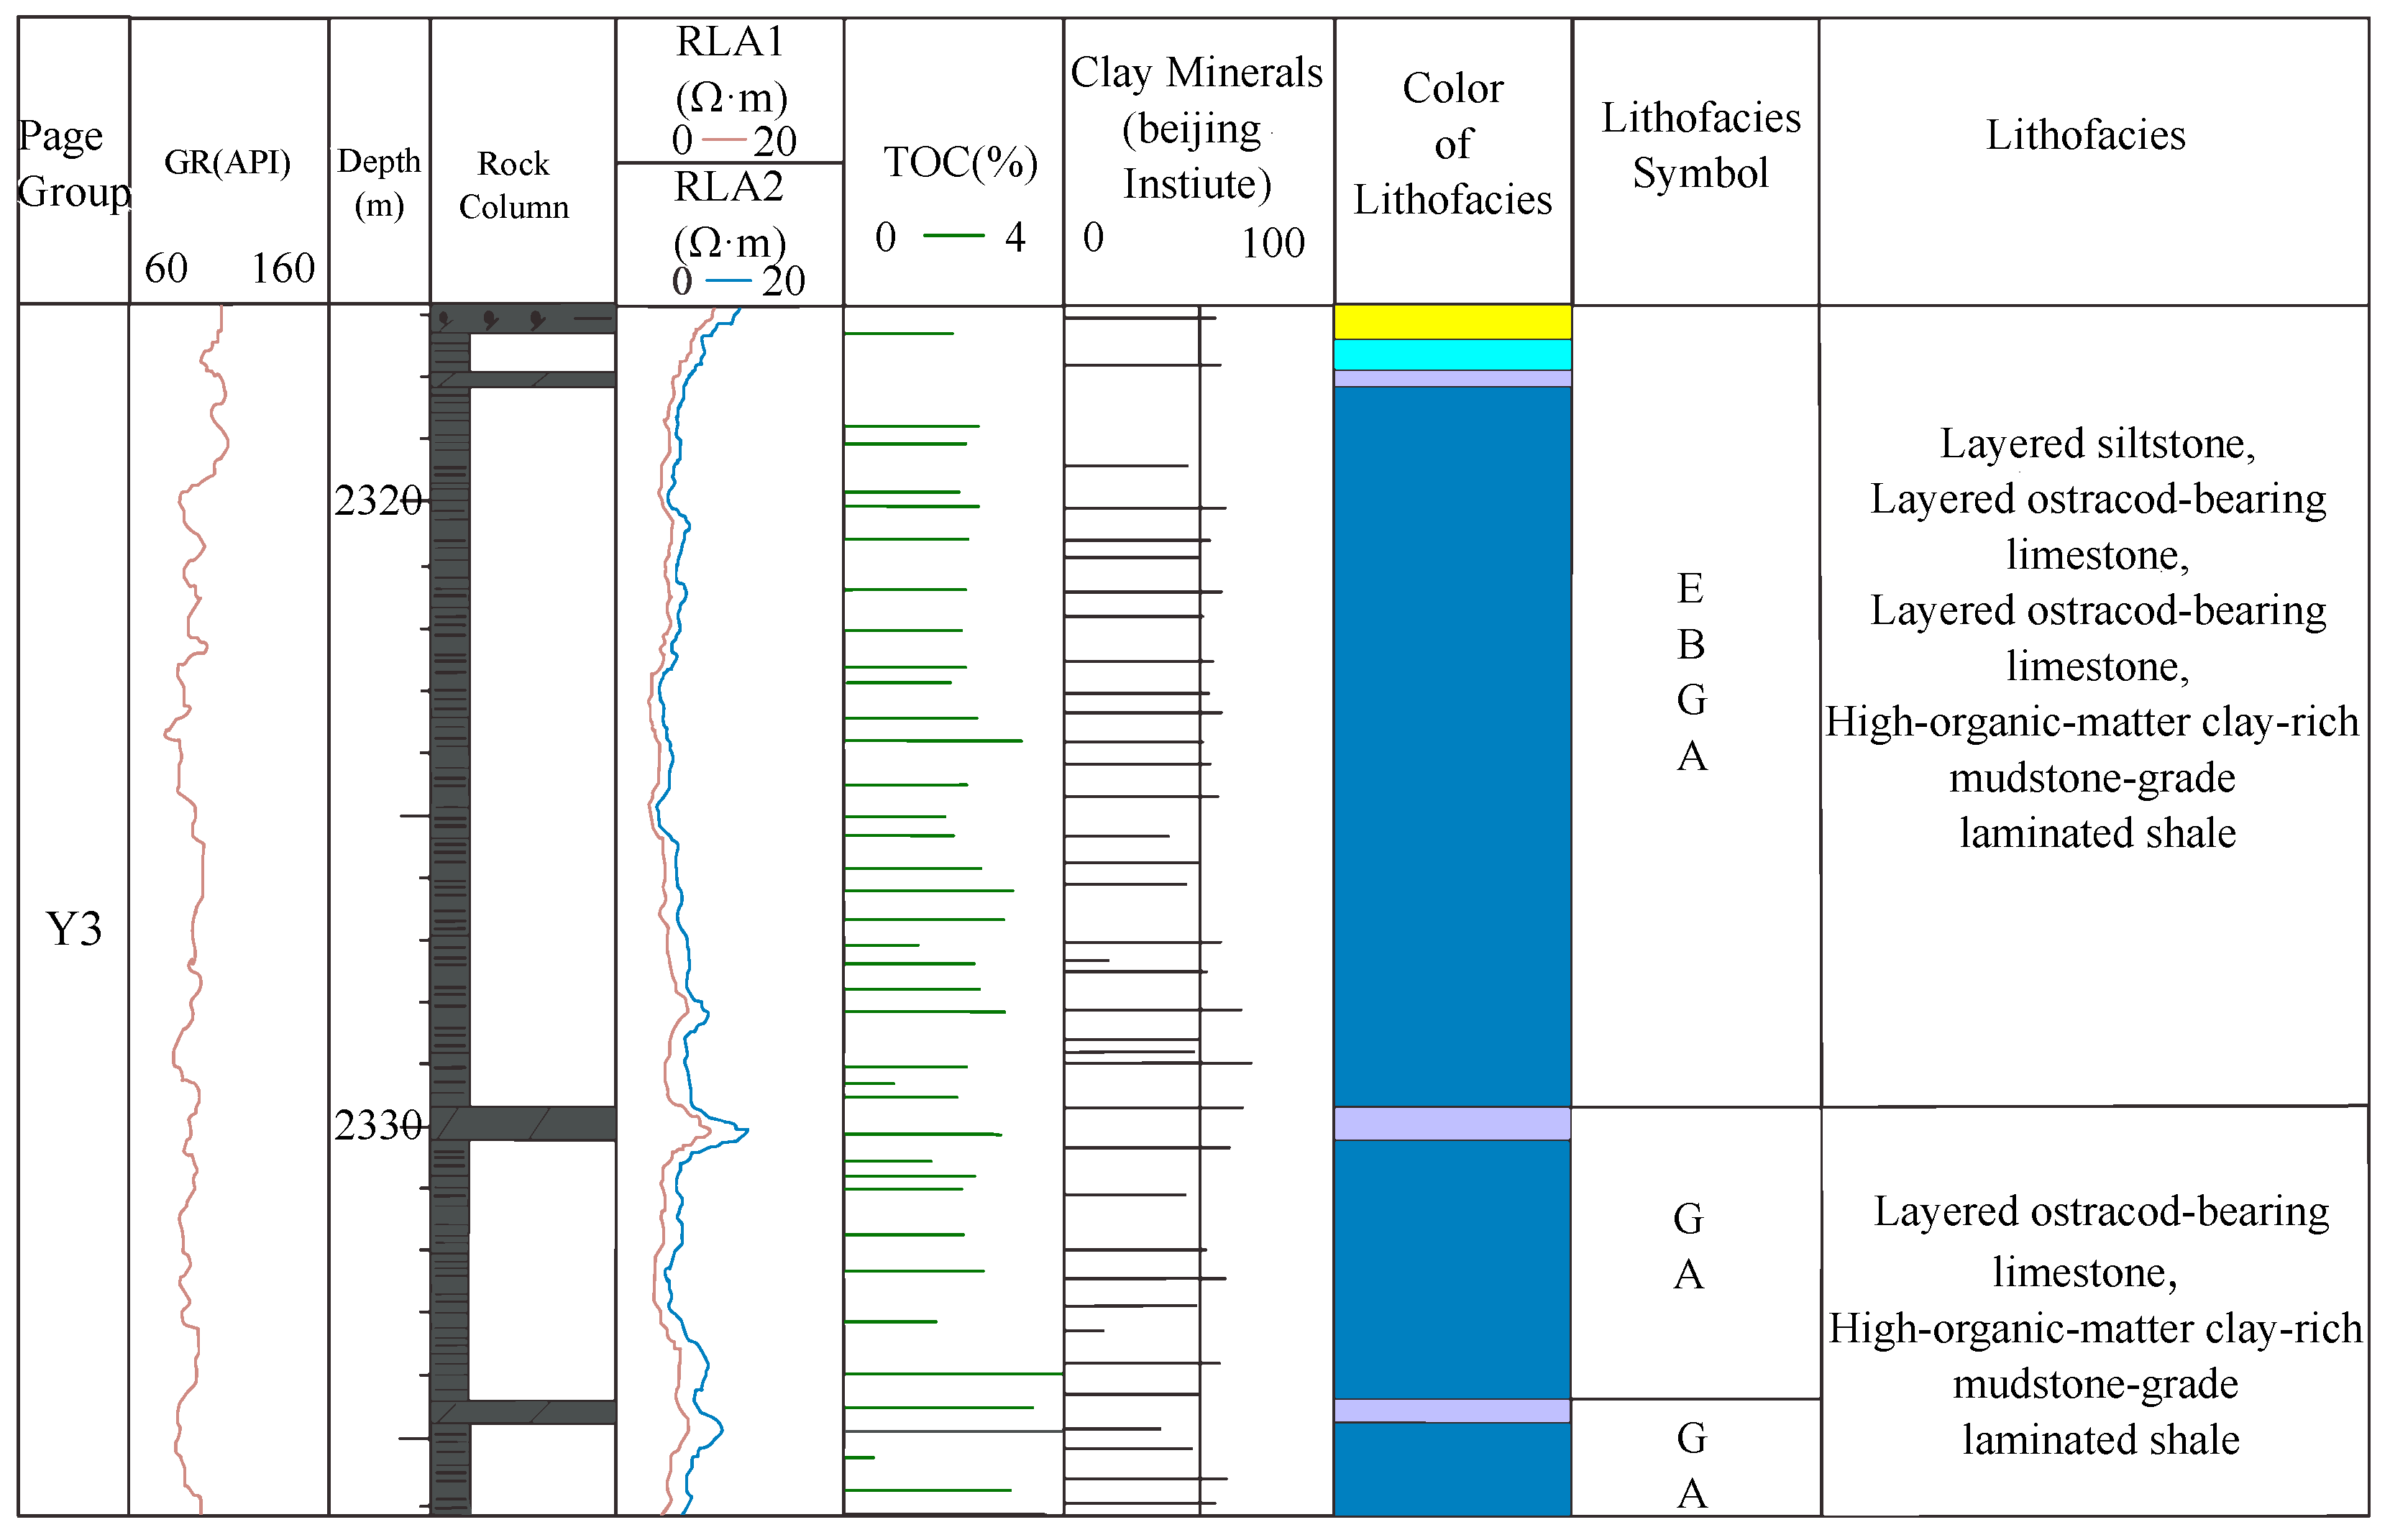
Vertical lithofacies distribution in the TH block (well T1): Y3 subunit. Color legend: yellow = LF-E (layered siltstone); light blue = LF-B (high-to-moderate organic matter felsic mudstone-grade laminated shale); purple = LF-G (layered ostracod-bearing limestone); blue = LF-A (high organic matter clay-rich mudstone-grade laminated shale). Letters in the figure: A = High-organic-matter clay-rich mudstone-grade laminated shale; B = High-to-moderate-organic-matter felsic mudstone-grade laminated shale; E = Layered siltstone; G = Layered ostracod-bearing limestone.
Figure 11.
Vertical lithofacies distribution in the TH block (well T1): Y3 subunit. Color legend: yellow = LF-E (layered siltstone); light blue = LF-B (high-to-moderate organic matter felsic mudstone-grade laminated shale); purple = LF-G (layered ostracod-bearing limestone); blue = LF-A (high organic matter clay-rich mudstone-grade laminated shale). Letters in the figure: A = High-organic-matter clay-rich mudstone-grade laminated shale; B = High-to-moderate-organic-matter felsic mudstone-grade laminated shale; E = Layered siltstone; G = Layered ostracod-bearing limestone.
Figure 12.
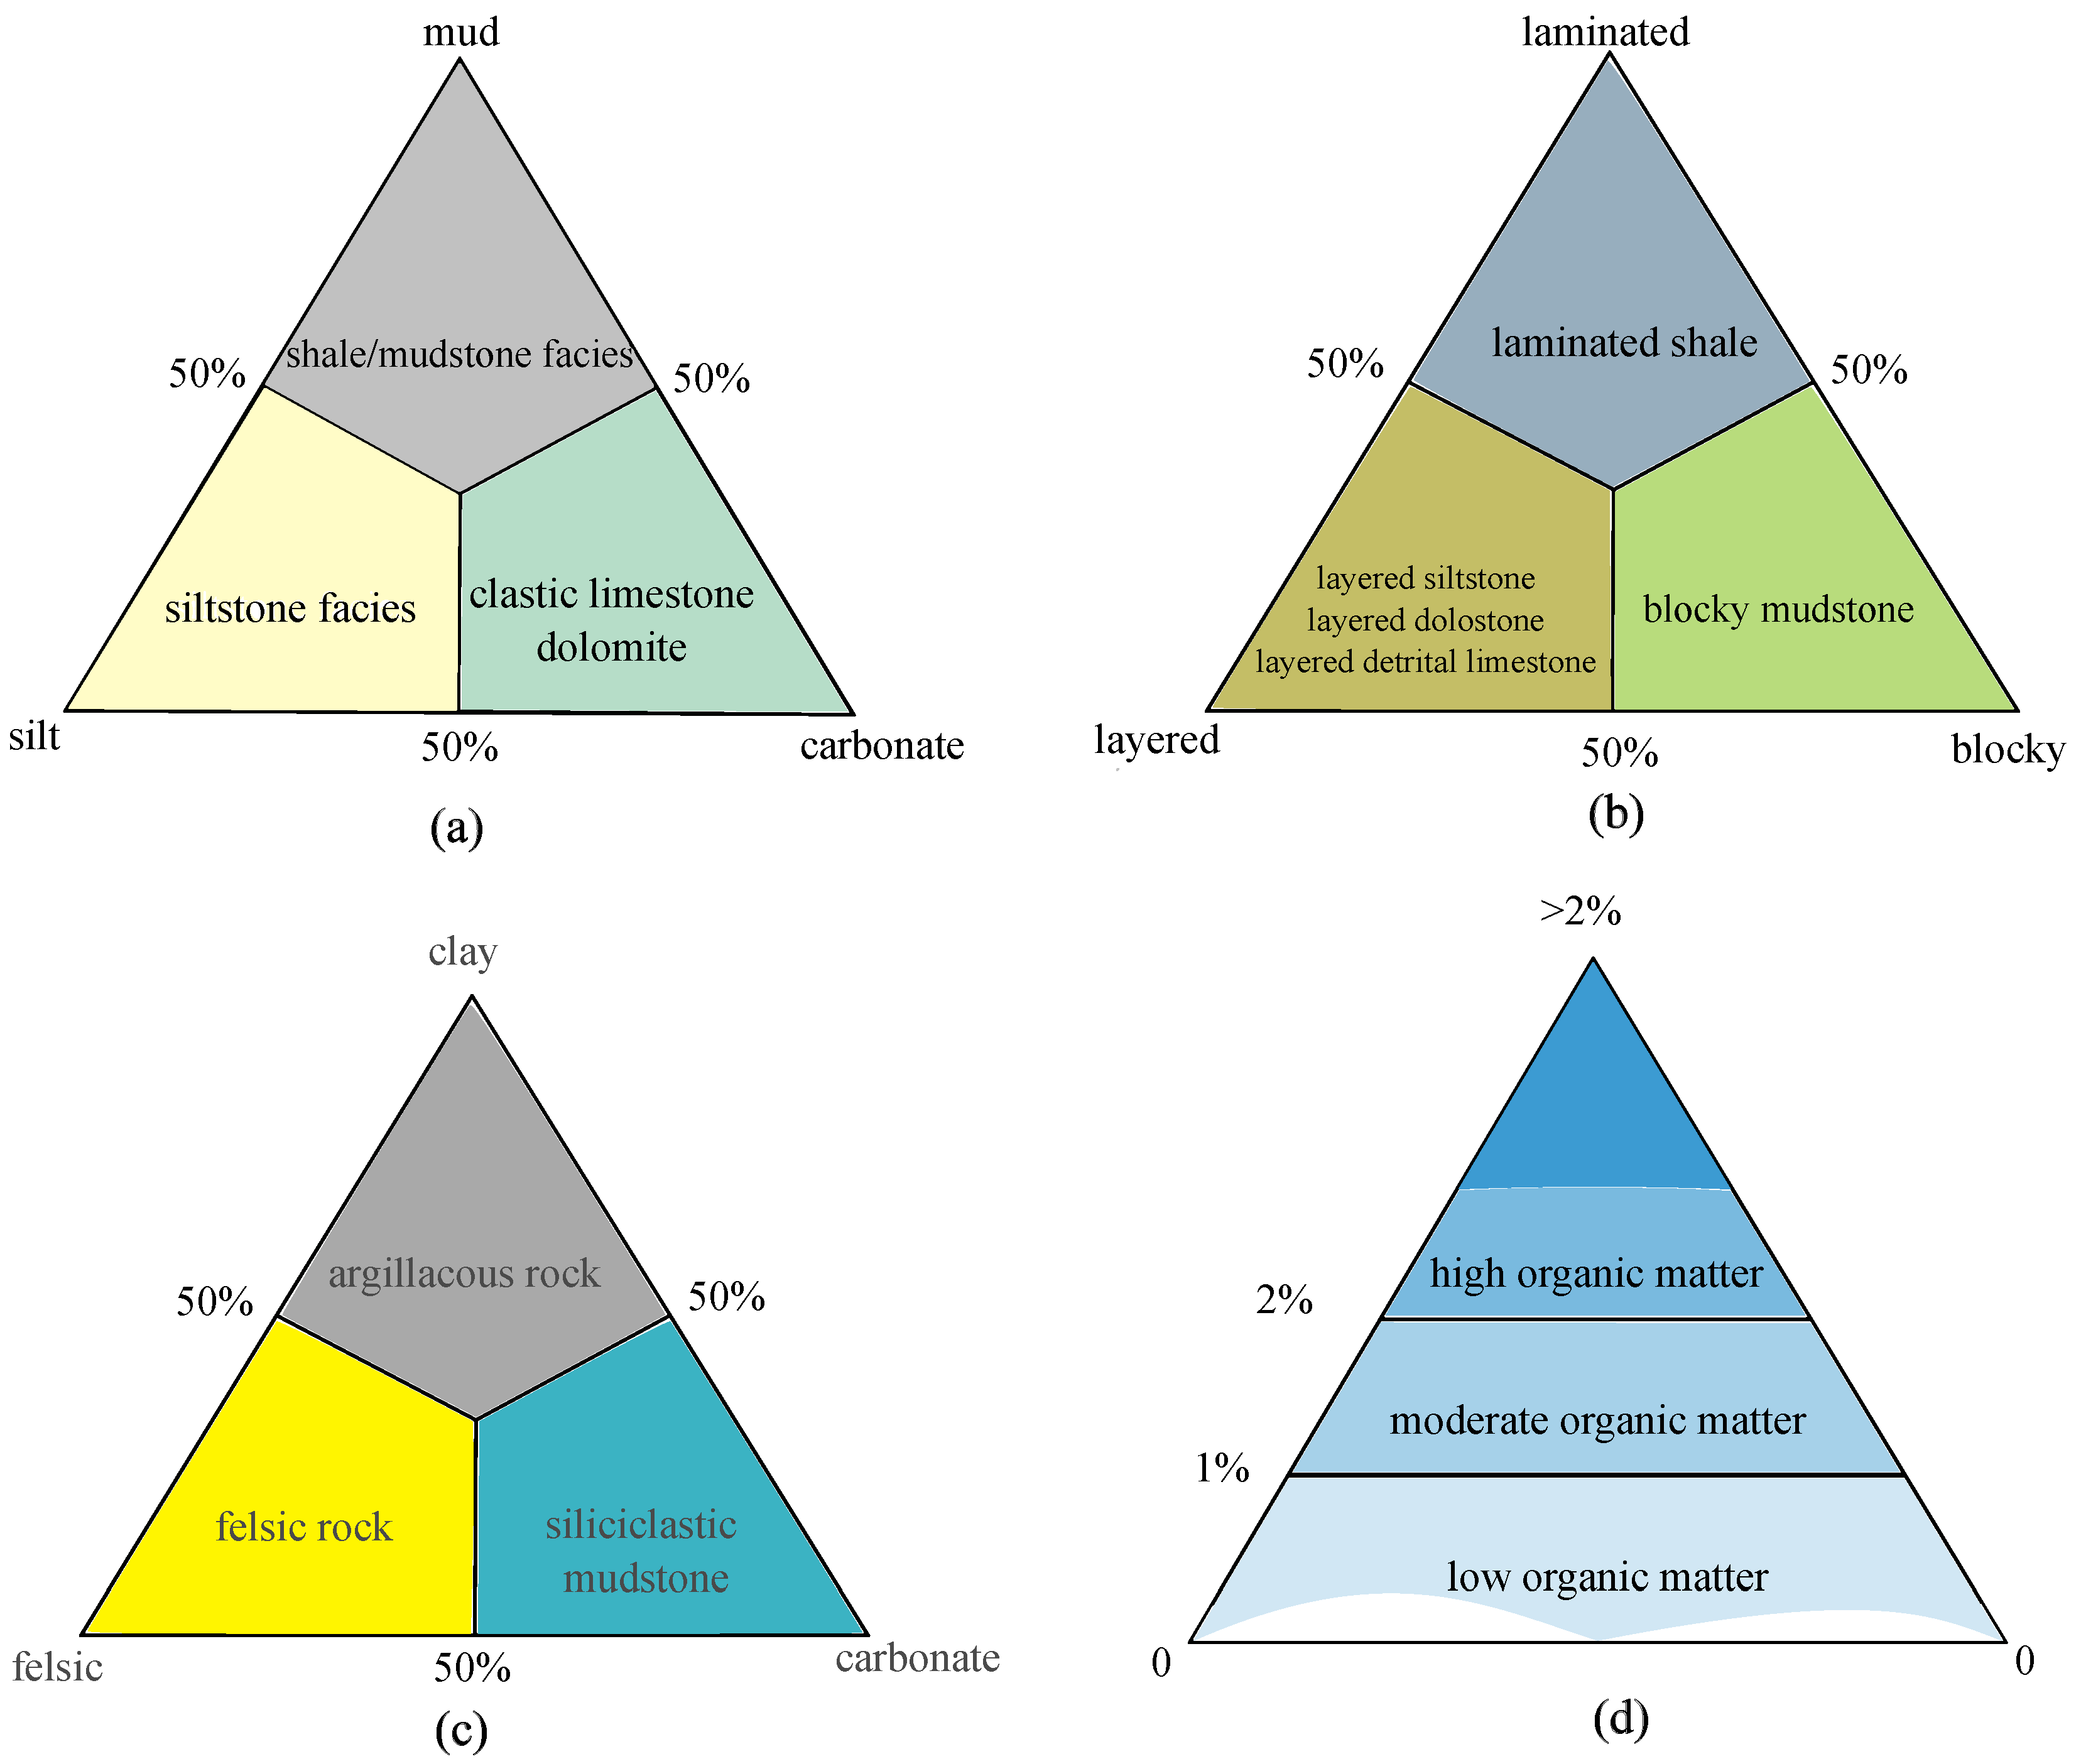
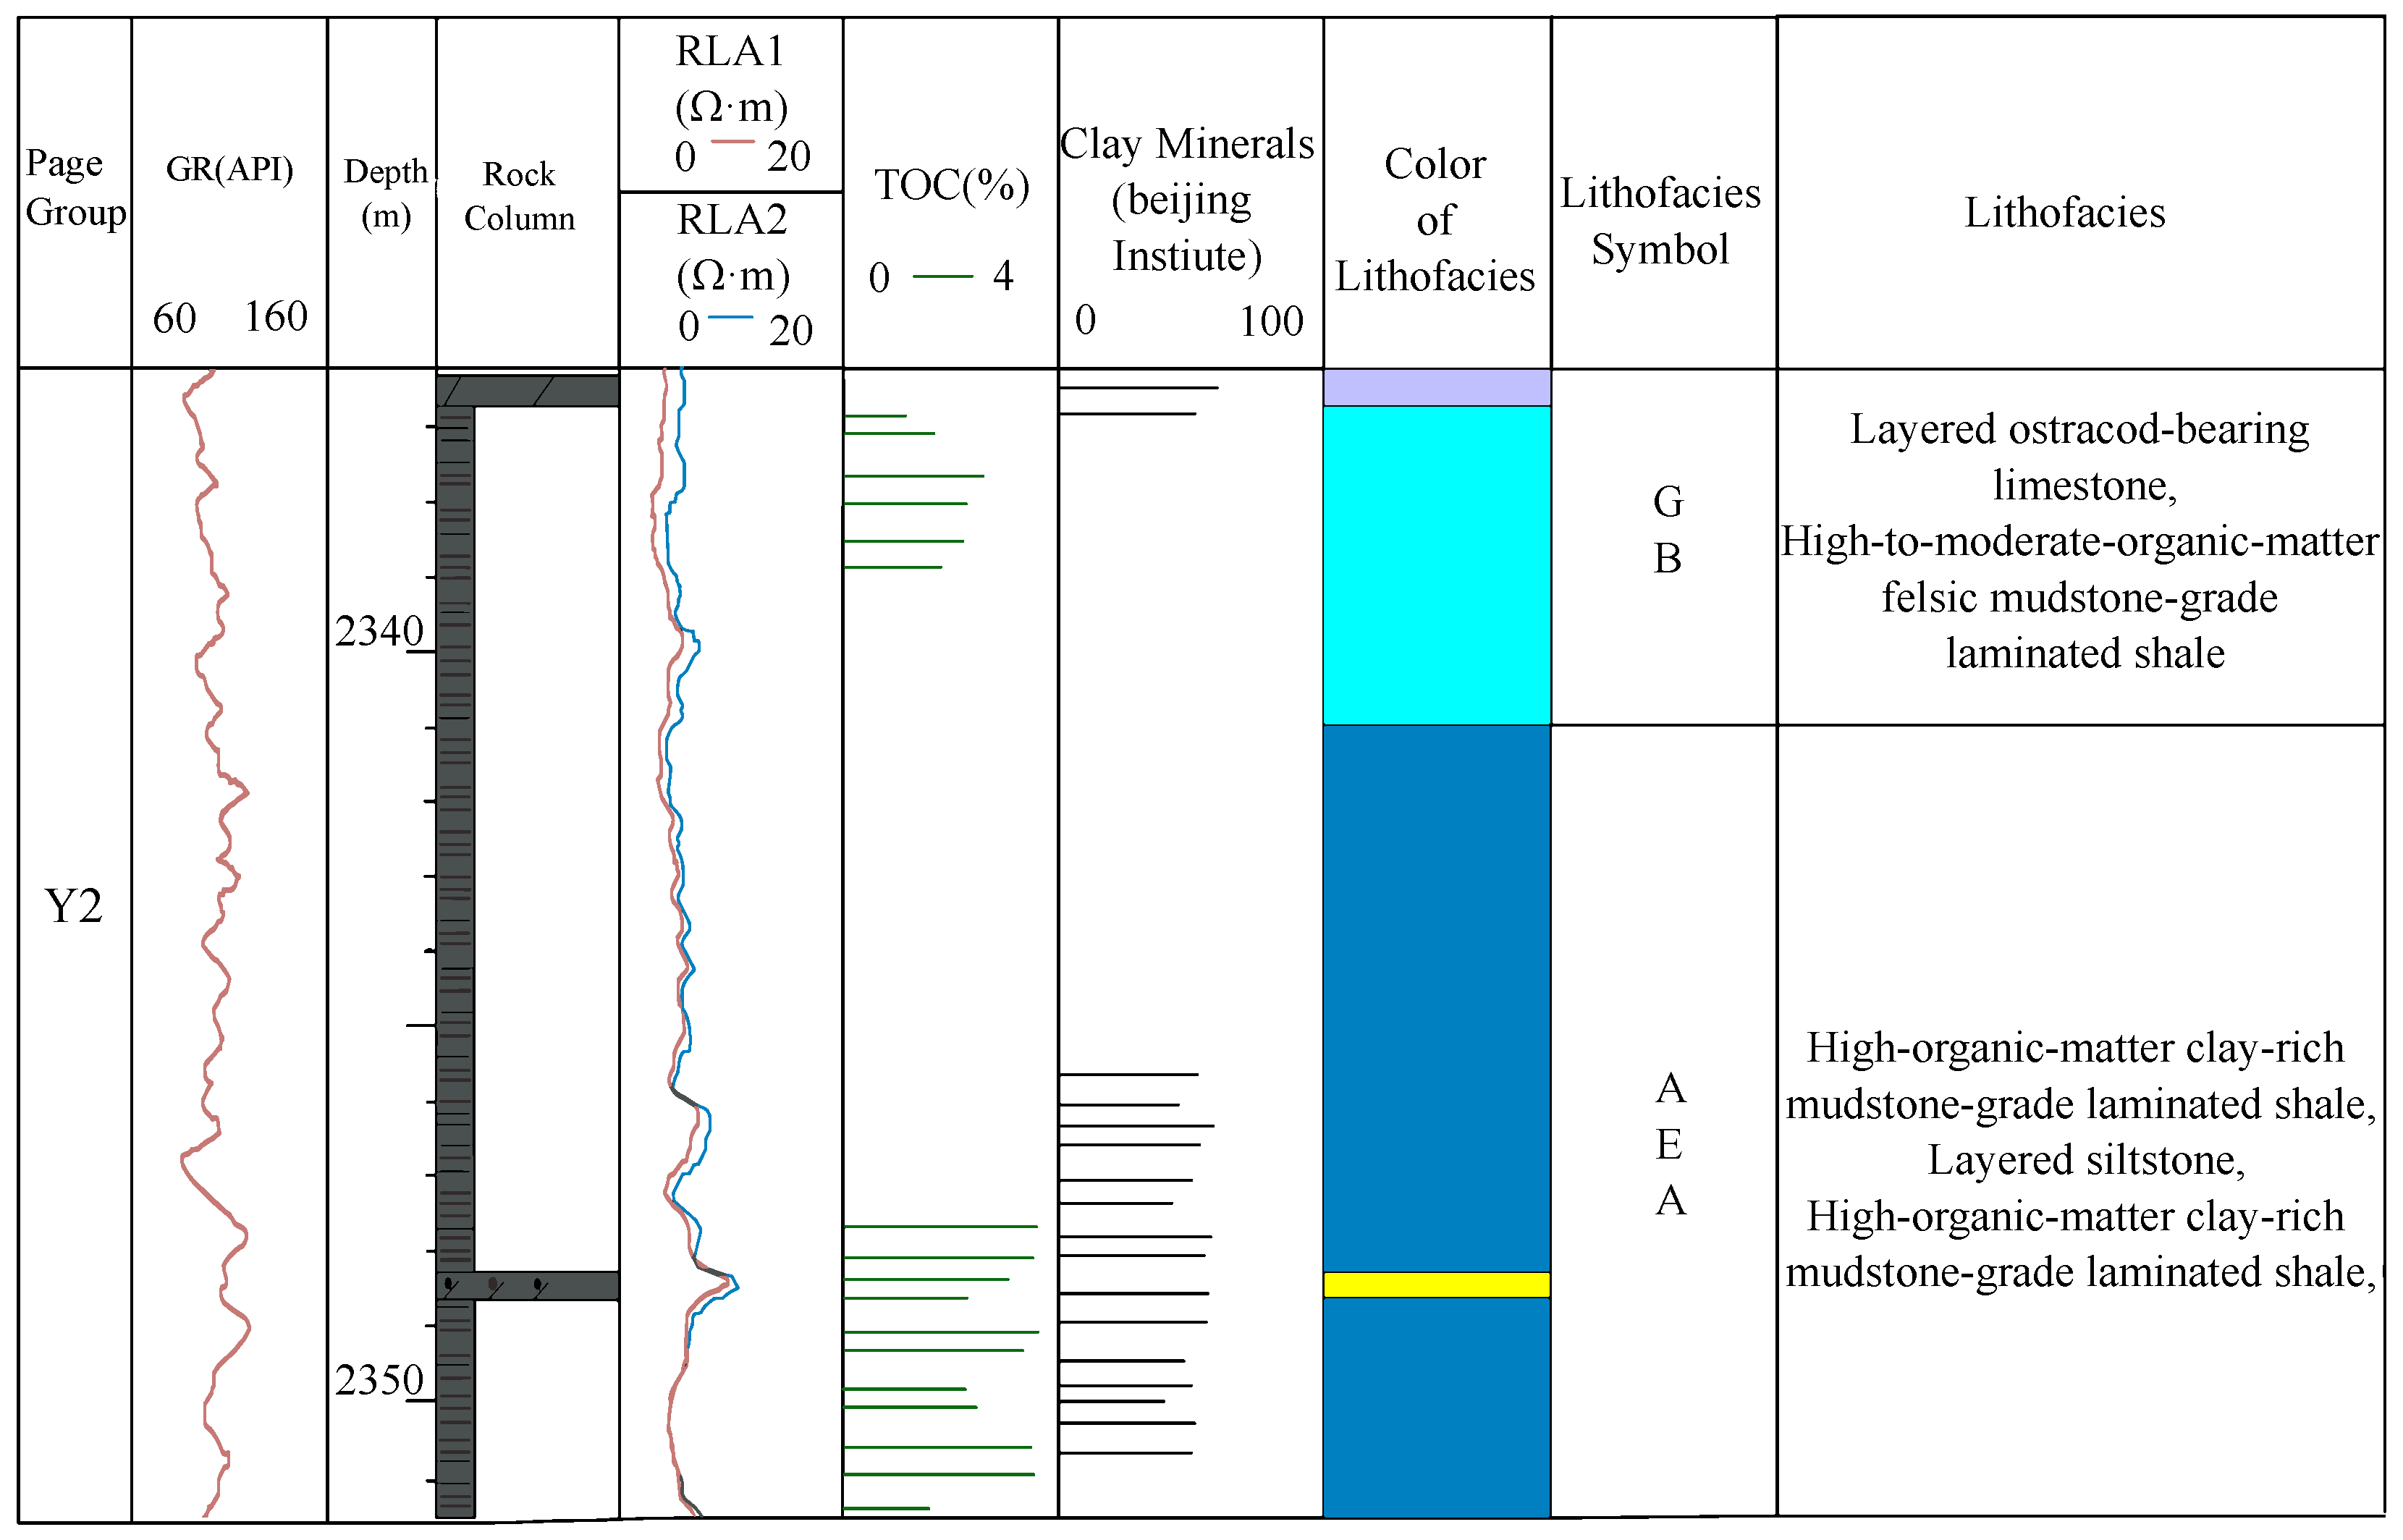
Vertical lithofacies distribution in the TH block (well T1): Y2 subunit. Color legend: yellow = LF-E (layered siltstone); light blue = LF-B (high-to-moderate organic matter felsic mudstone-grade laminated shale); purple = LF-G (layered ostracod-bearing limestone); blue = LF-A (high organic matter clay-rich mudstone-grade laminated shale). Letters in the figure: A = High-organic-matter clay-rich mudstone-grade laminated shale; B = High-to-moderate-organic-matter felsic mudstone-grade laminated shale; E = Layered siltstone; G = Layered ostracod-bearing limestone.
Figure 12.
Vertical lithofacies distribution in the TH block (well T1): Y2 subunit. Color legend: yellow = LF-E (layered siltstone); light blue = LF-B (high-to-moderate organic matter felsic mudstone-grade laminated shale); purple = LF-G (layered ostracod-bearing limestone); blue = LF-A (high organic matter clay-rich mudstone-grade laminated shale). Letters in the figure: A = High-organic-matter clay-rich mudstone-grade laminated shale; B = High-to-moderate-organic-matter felsic mudstone-grade laminated shale; E = Layered siltstone; G = Layered ostracod-bearing limestone.
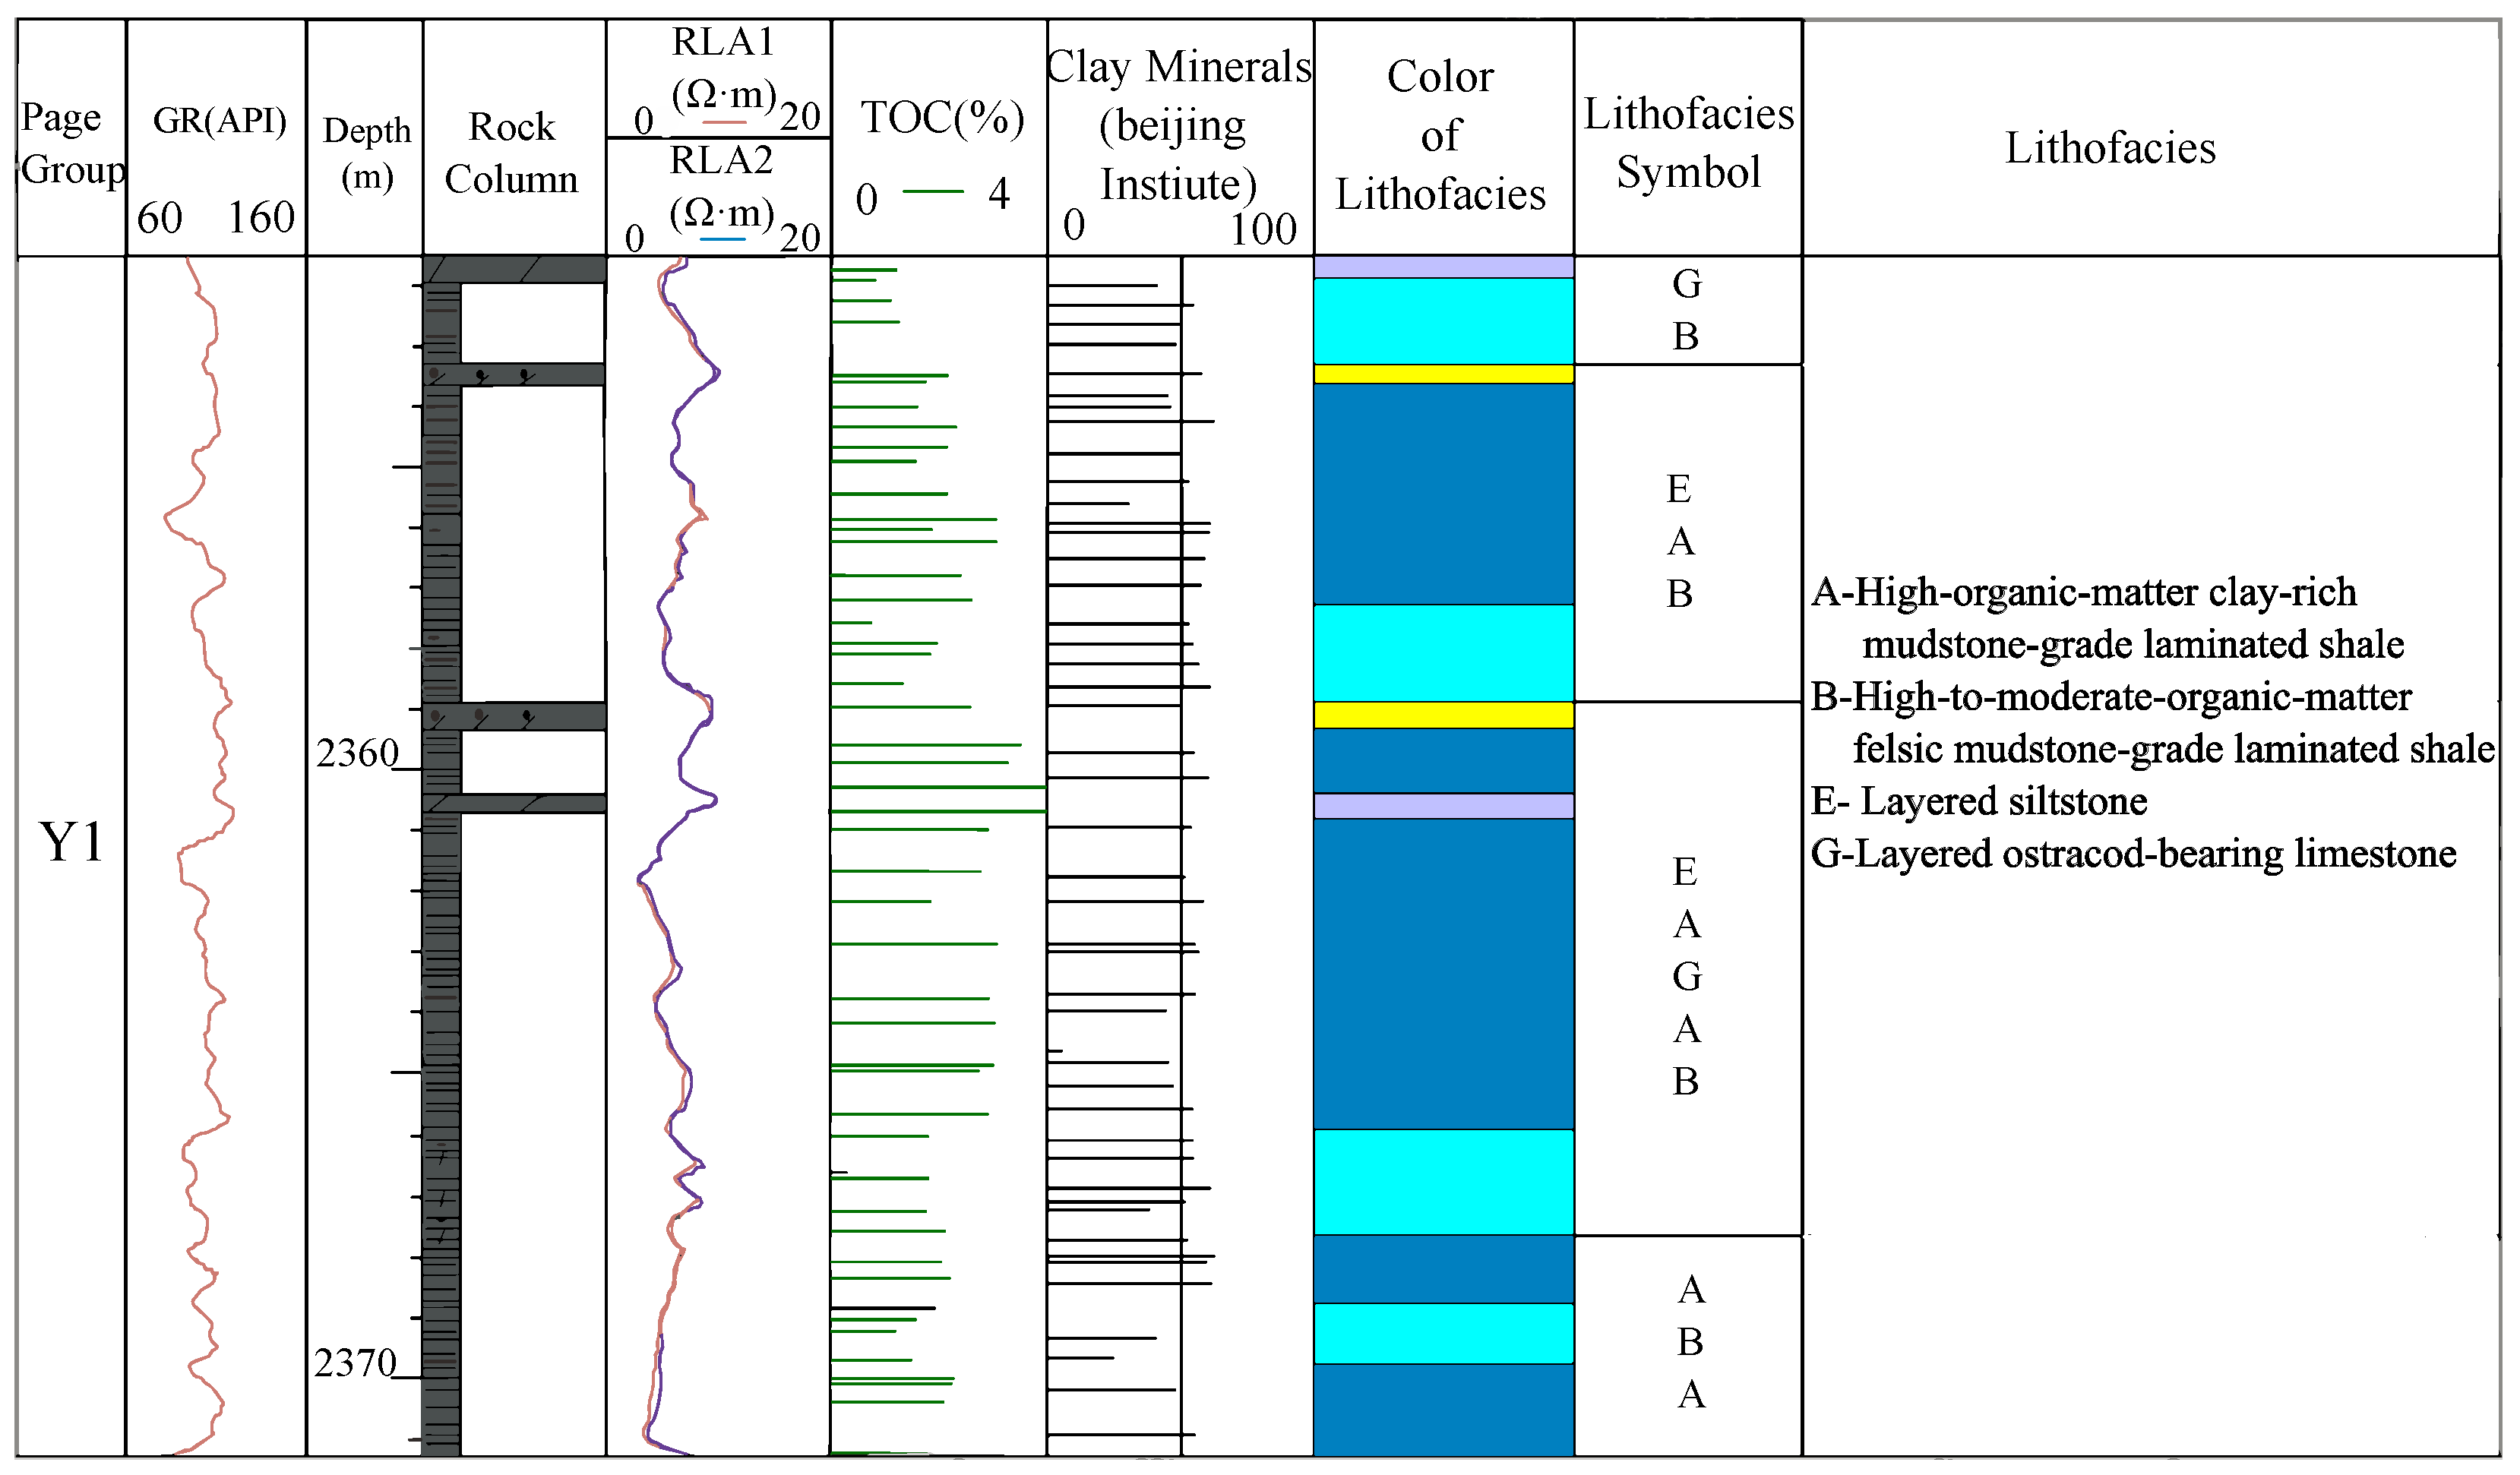
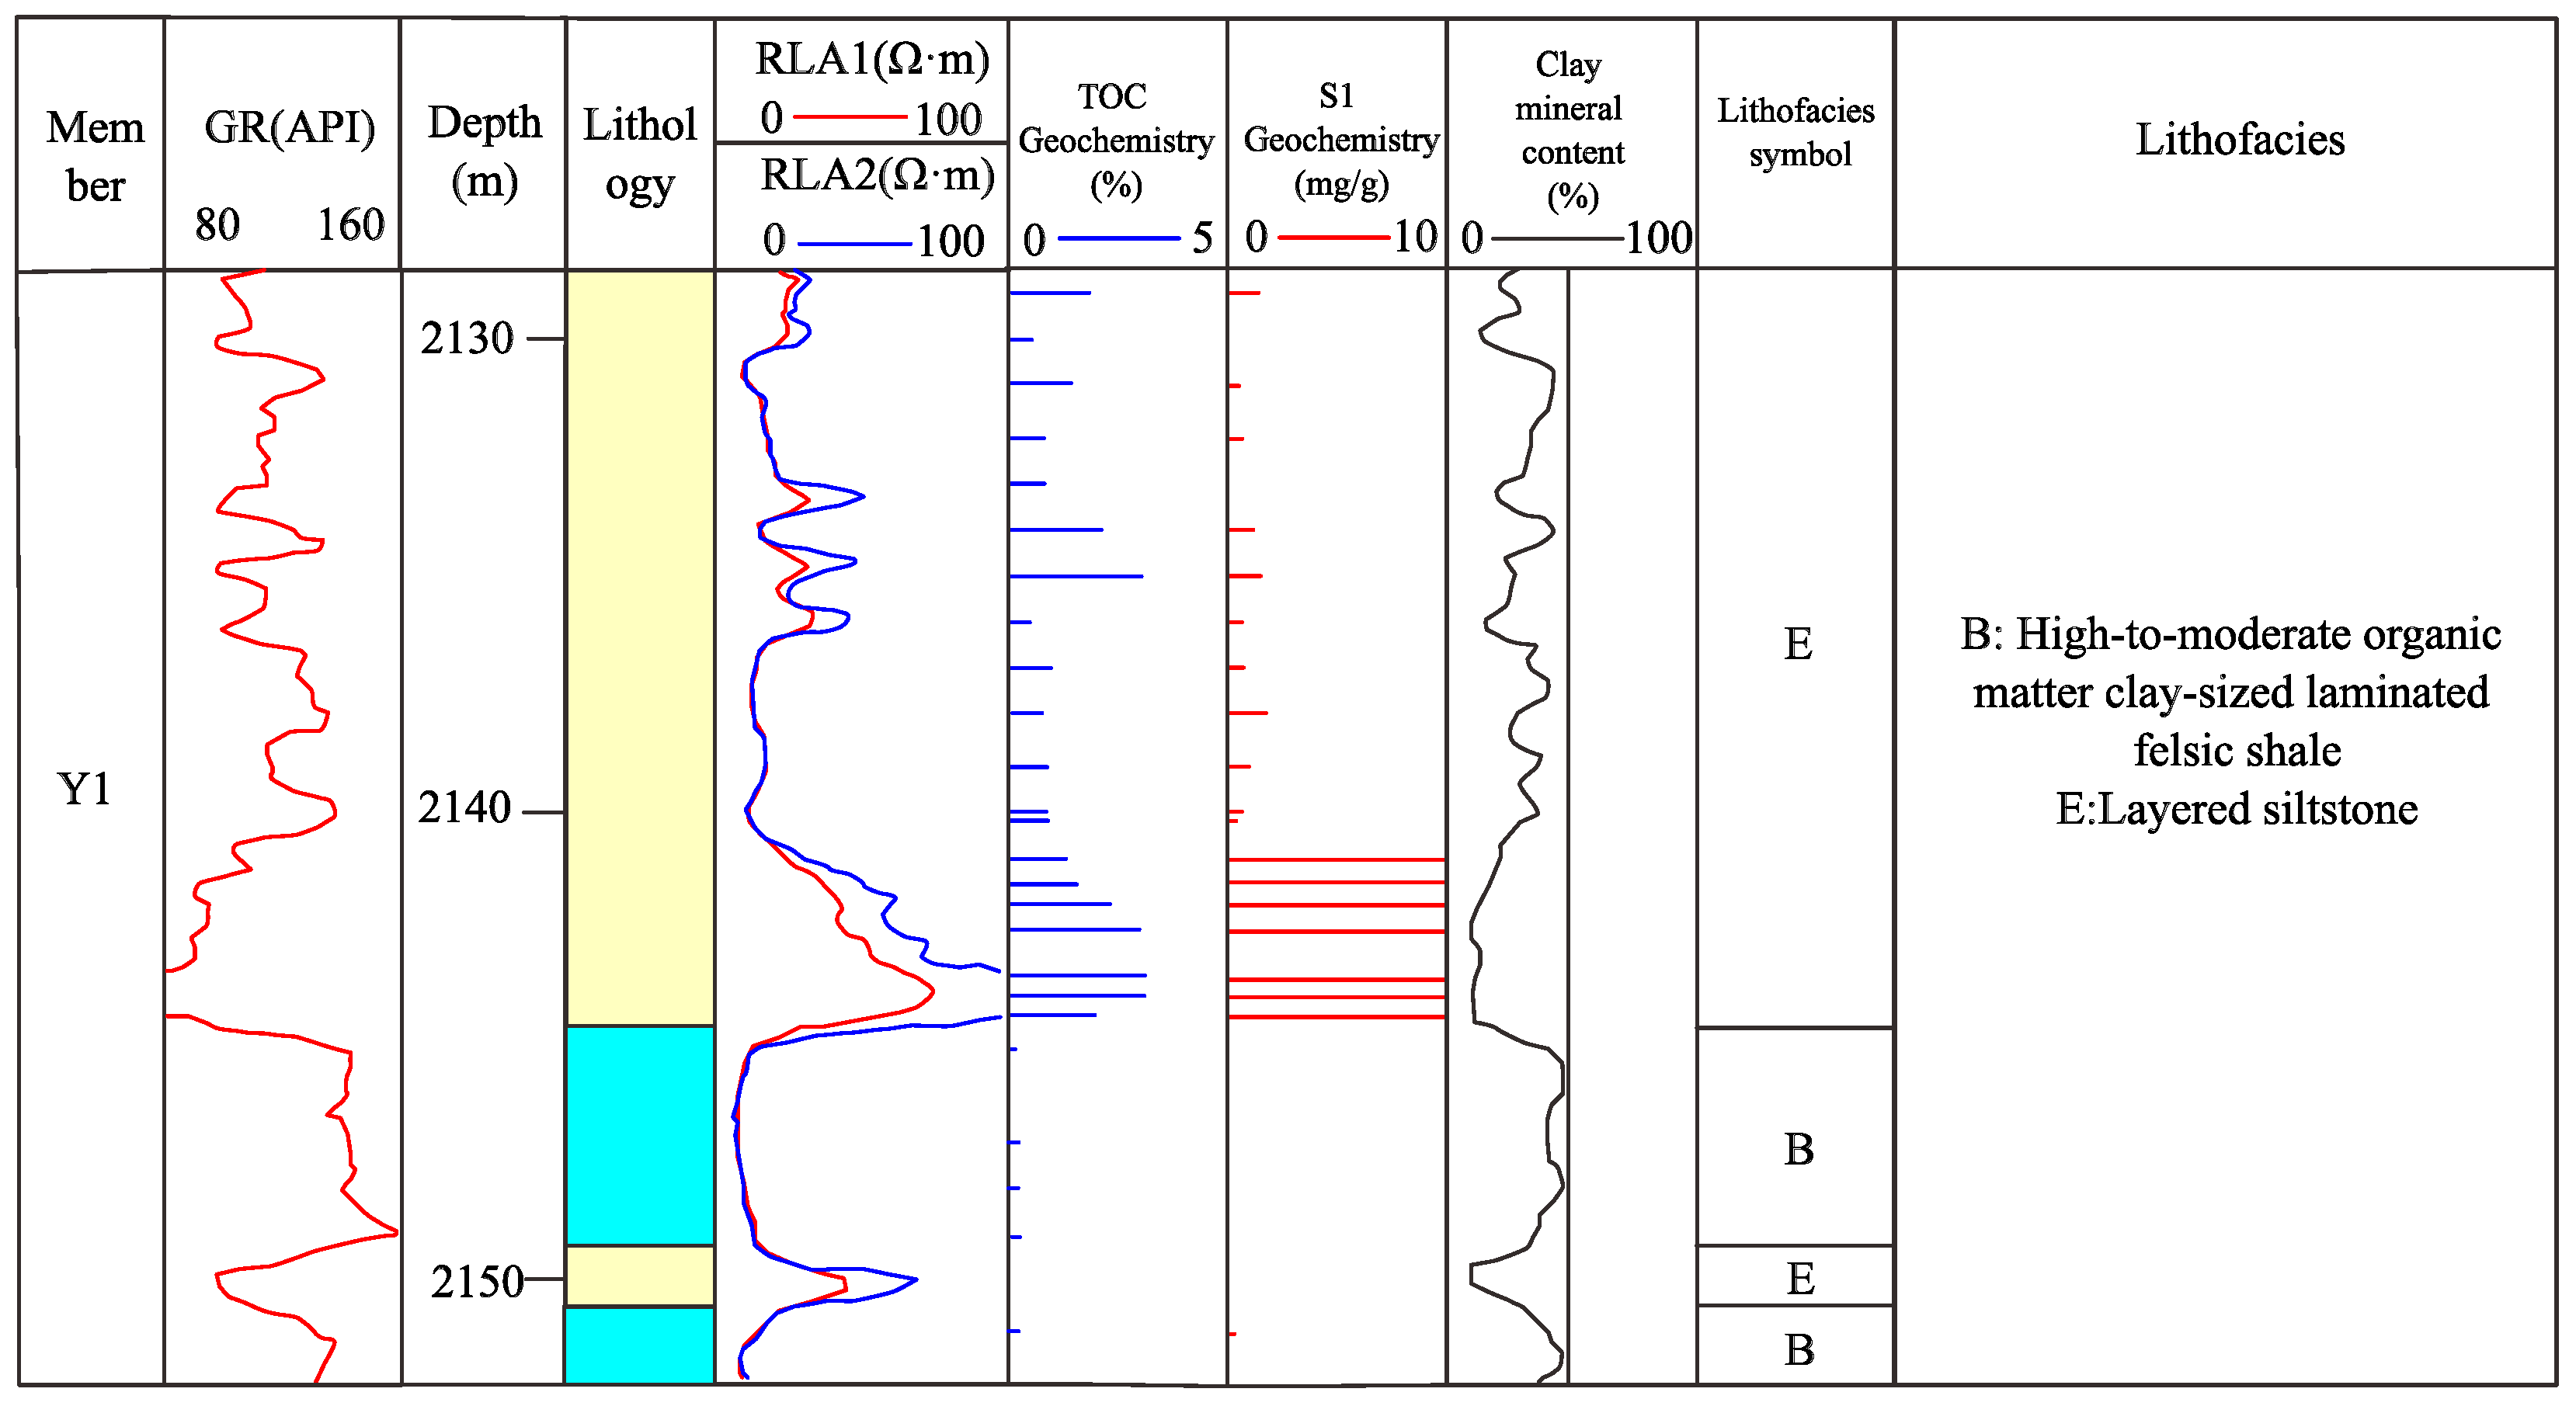
Figure 13.
Vertical lithofacies distribution in the TH block (well T1): Y1 subunit. Color legend: yellow = LF-E (layered siltstone); light blue = LF-B (high-to-moderate organic matter felsic mudstone-grade laminated shale); purple = LF-G (layered ostracod-bearing limestone); blue = LF-A (high organic matter clay-rich mudstone-grade laminated shale). Letters in the figure: A = High-organic-matter clay-rich mudstone-grade laminated shale; B = High-to-moderate-organic-matter felsic mudstone-grade laminated shale; E = Layered siltstone; G = Layered ostracod-bearing limestone.
Figure 13.
Vertical lithofacies distribution in the TH block (well T1): Y1 subunit. Color legend: yellow = LF-E (layered siltstone); light blue = LF-B (high-to-moderate organic matter felsic mudstone-grade laminated shale); purple = LF-G (layered ostracod-bearing limestone); blue = LF-A (high organic matter clay-rich mudstone-grade laminated shale). Letters in the figure: A = High-organic-matter clay-rich mudstone-grade laminated shale; B = High-to-moderate-organic-matter felsic mudstone-grade laminated shale; E = Layered siltstone; G = Layered ostracod-bearing limestone.
Figure 14.
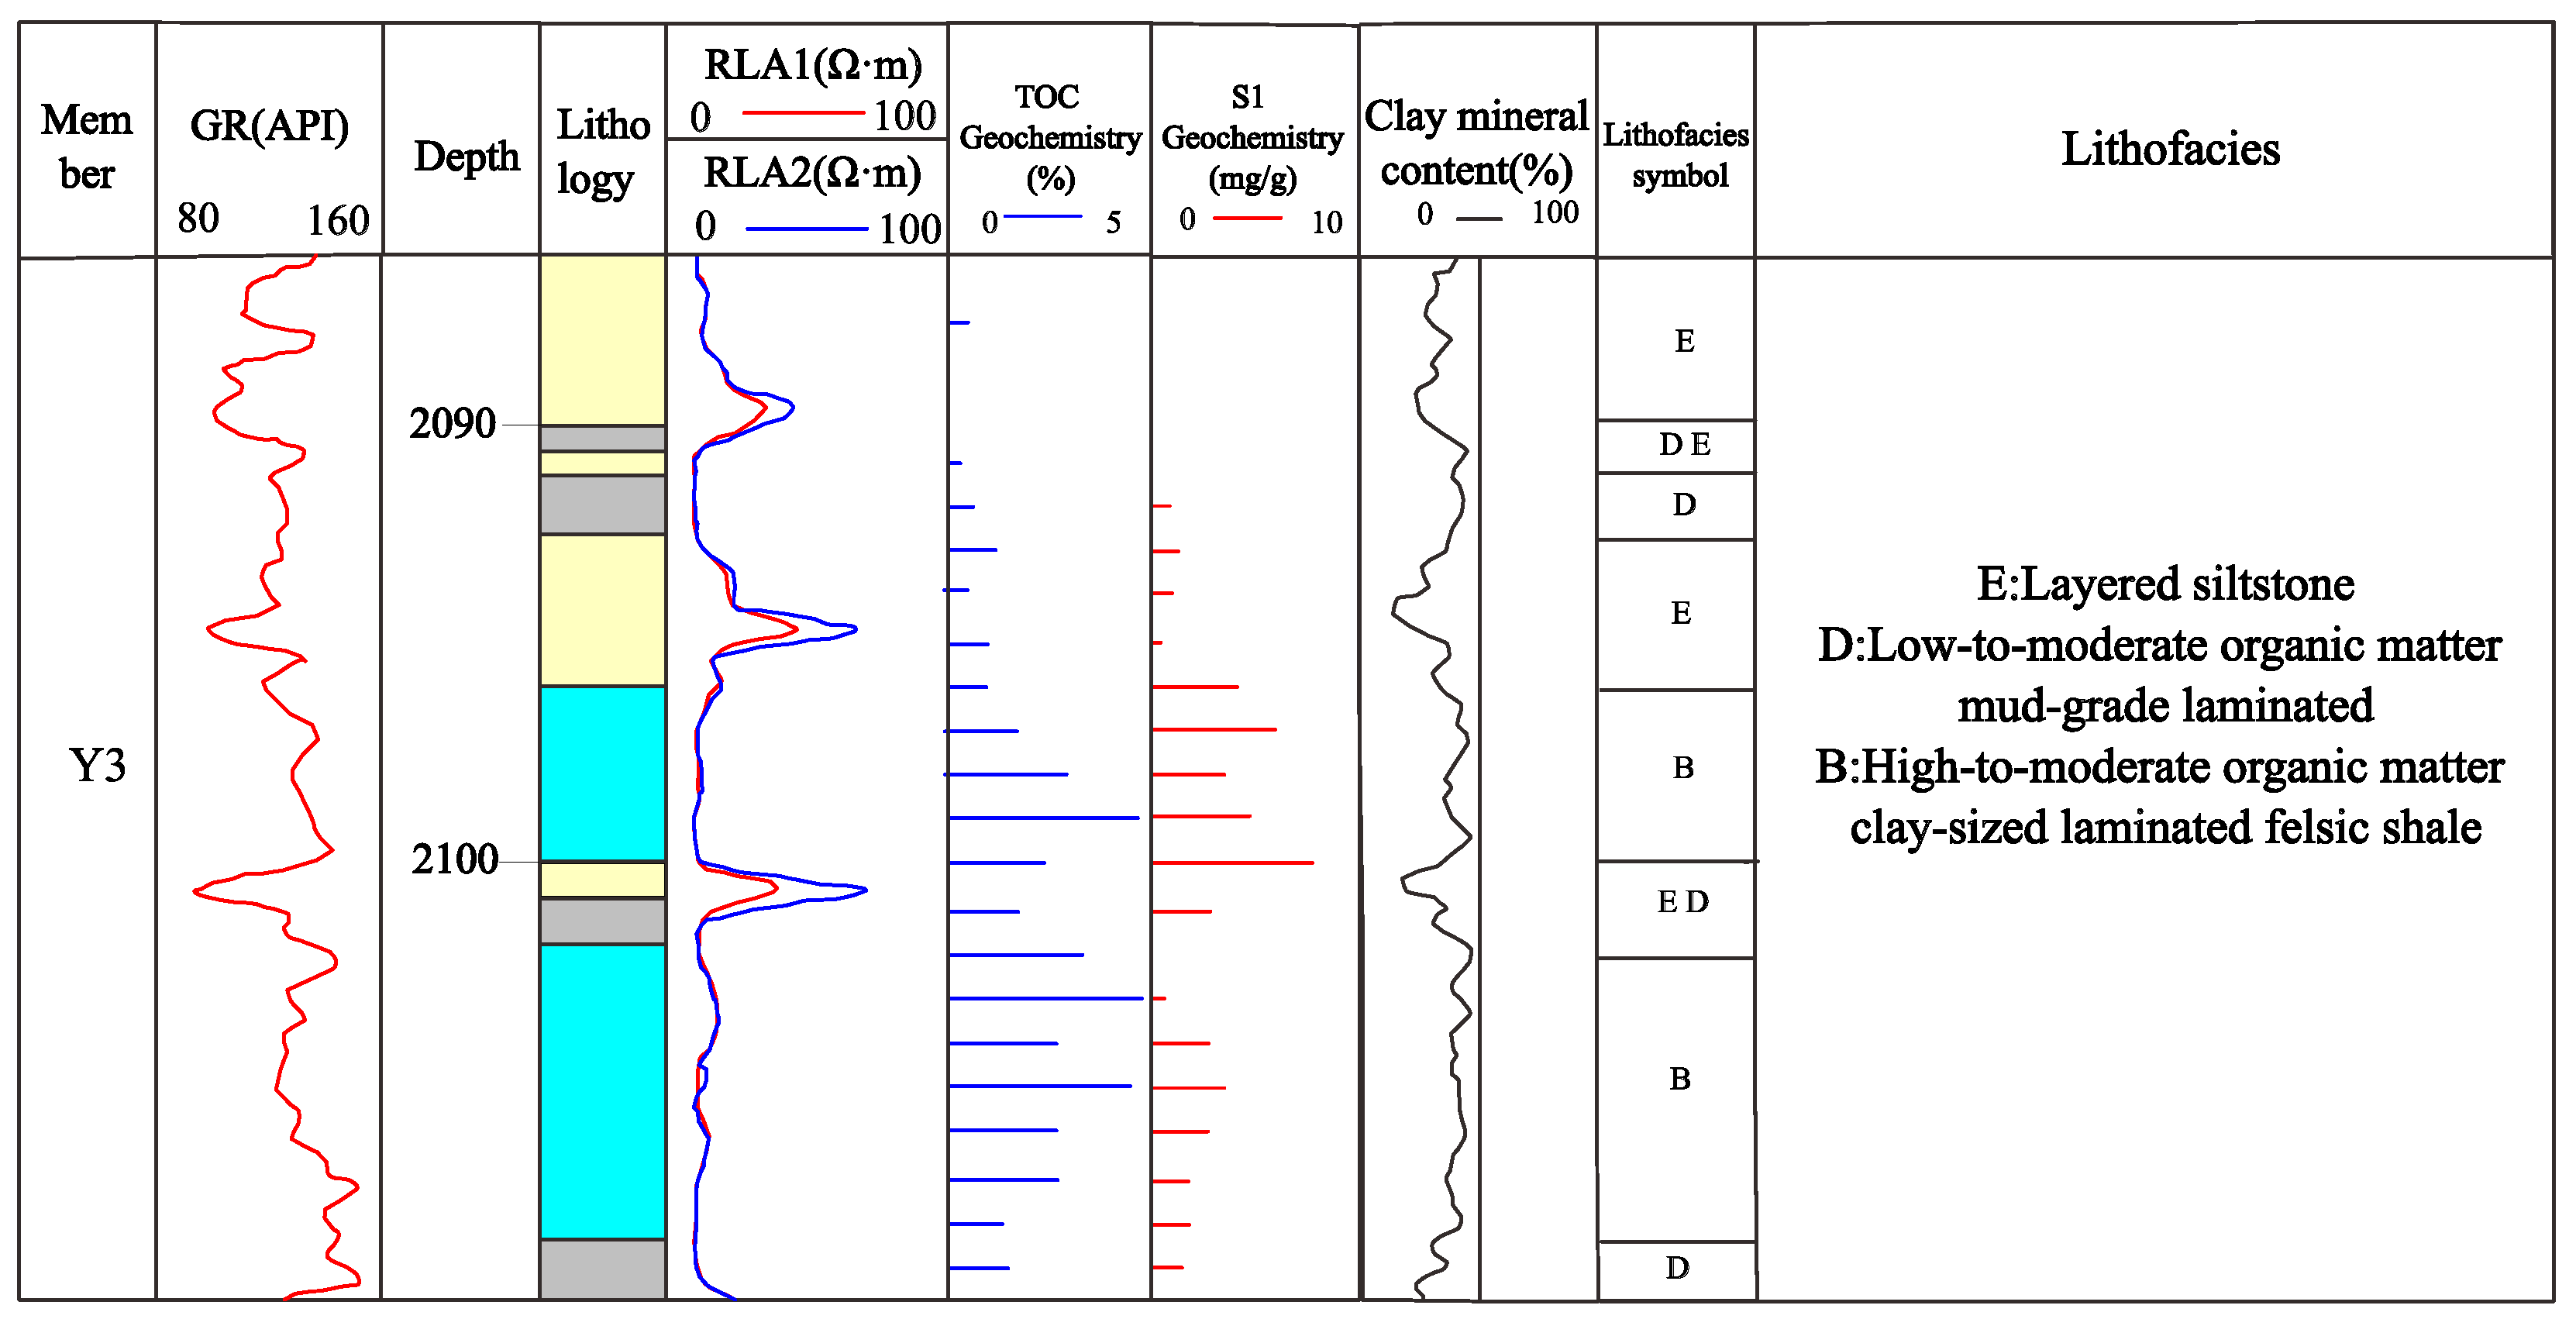
Vertical lithofacies distribution in the Q block (well B28): Y3 subunit. Color legend: yellow = LF-E (layered siltstone); light blue = LF-B (high-to-moderate organic matter felsic mudstone-grade laminated shale); gray = LF-E (layered siltstone).
Figure 14.
Vertical lithofacies distribution in the Q block (well B28): Y3 subunit. Color legend: yellow = LF-E (layered siltstone); light blue = LF-B (high-to-moderate organic matter felsic mudstone-grade laminated shale); gray = LF-E (layered siltstone).
Figure 15.
Vertical lithofacies distribution in the Q block (well B28): Y1 subunit. Color legend: yellow = LF-E (layered siltstone); light blue = LF-B (high-to-moderate organic matter felsic mudstone-grade laminated shale).
Figure 15.
Vertical lithofacies distribution in the Q block (well B28): Y1 subunit. Color legend: yellow = LF-E (layered siltstone); light blue = LF-B (high-to-moderate organic matter felsic mudstone-grade laminated shale).
Figure 16.
Vertical lithofacies distribution in the Q block (well B28): Y2 subunit. Color legend: yellow = LF-E (layered siltstone); light blue = LF-B (high-to-moderate organic matter felsic mudstone-grade laminated shale); gray = LF-E (layered siltstone).
Figure 16.
Vertical lithofacies distribution in the Q block (well B28): Y2 subunit. Color legend: yellow = LF-E (layered siltstone); light blue = LF-B (high-to-moderate organic matter felsic mudstone-grade laminated shale); gray = LF-E (layered siltstone).
Table 1.
Summary of cored wells, sample counts, and facies coverage. TOC (n): measured samples from sweet spot intervals; ✓: participated in analysis; XRD and major- or trace-element counts summarized at well block level.
Table 1.
Summary of cored wells, sample counts, and facies coverage. TOC (n): measured samples from sweet spot intervals; ✓: participated in analysis; XRD and major- or trace-element counts summarized at well block level.
| Well | Block | Cored Interval (m) | TOC (n) | XRD | Maj. or Trace | Remarks |
|---|
| T1 | TH | 2284–2370 | 29 | ✓ | ✓ | Deep lake; LF-A/B/G/H |
| B8 | TH | — | w/T1 | — | — | Deep lake; LF-A dominant |
| C8 | Y | 2326–2400 | 29 | ✓ | ✓ | Semi-deep lake; LF-B/C |
| C34 | Y | — | w/C8 | — | — | Semi-deep lake |
| B8G P1-2 | Q | 2210–2260 | 46 (w/B28: 65) | ✓ | ✓ | Semi-deep lake– delta front; LF-B/C/E |
| B28 | Q | 2346–2469.7 | 19 (w/B8G P1-2: 65) | ✓ | ✓ | Delta front; LF-B/D/E |
| B38 | Q | ∼2010–2110 | w/B28 | ✓ | ✓ | Delta front |
| G5-1 | Q | ∼1708+ | — | — | — | Log only |
| Total | — | — | 123 | 47 | 29 | 908 m core; 75 log wells |
Table 2.
TOC statistics by lithofacies. Here,
n values for LF-A, LF-B, and LF-C represent samples from the corresponding well blocks participating in systematic statistics and differ from the representative sample counts listed in
Section 4.1.
Table 2.
TOC statistics by lithofacies. Here,
n values for LF-A, LF-B, and LF-C represent samples from the corresponding well blocks participating in systematic statistics and differ from the representative sample counts listed in
Section 4.1.
| Lithofacies | n | Mean (%) | SD (%) | Min. (%) | Max. (%) | TOC > 2% |
|---|
| LF-A (TH block, deep lake) | 20 | 3.18 | 0.85 | 2.32 | 5.12 | 100 |
| LF-B (Y + Q blocks, semi-deep lake) | 60 | 2.18 | 0.68 | 1.59 | 4.27 | 50 |
| LF-C | 20 | 1.32 | 0.38 | 0.74 | 1.99 | 0 |
| LF-D | 13 | <2 | — | — | — | 0 |
| LF-E through LF-H | 10 | <1 | — | — | — | 0 |
| Total | 123 | 1.82 | — | 0.49 | 5.12 | 47.2 |
Table 3.
TOC statistics by well block and reservoir subunit. Evaluation criteria: Class I, TOC > 2%; Class II, TOC = 1%–2%; Class III, TOC = 0.5%–1%; non-source rock, TOC < 0.5%.
Table 3.
TOC statistics by well block and reservoir subunit. Evaluation criteria: Class I, TOC > 2%; Class II, TOC = 1%–2%; Class III, TOC = 0.5%–1%; non-source rock, TOC < 0.5%.
| Subunit | Q Block (B28 + B8G P1-2) | Y Block (C8) | TH Block (T1) |
|---|
| Y3 | 1.63% (n = 21) | 2.20% (n = 12) | 2.83% (n = 14) |
| Y2 | 1.84% (n = 21) | 1.95% (n = 8) | 3.34% (n = 5) |
| Y1 | 1.42% (n = 23) | 2.09% (n = 9) | 2.31% (n = 10) |
| Y1–Y3 mean | 1.65% (n = 65) | 2.10% (n = 29) | 2.74% (n = 29) |
Table 4.
Maceral identification results for six representative samples. Lamalg. = lamalginite; Telalg. = telalginite; Liptodet. = liptodetrinite; Liptinite = total liptinite; Inert. = inertinite. All values expressed as percentages.
Table 4.
Maceral identification results for six representative samples. Lamalg. = lamalginite; Telalg. = telalginite; Liptodet. = liptodetrinite; Liptinite = total liptinite; Inert. = inertinite. All values expressed as percentages.
| Sample | Well (Facies) | Lamalg. | Telalg. | Liptodet. | Liptinite | Inert. |
|---|
| T1-47 | T1 (deep lake) | 3.50 | 17.50 | 75.40 | 96.50 | 3.50 |
| T1-53 | T1 (deep lake) | 22.00 | 22.00 | 44.00 | 92.00 | 8.00 |
| CY-11 | C8 (semi-deep lake) | 0.00 | 5.30 | 60.50 | 65.80 | 34.20 |
| CY-35 | C8 (semi-deep lake) | 8.80 | 8.80 | 73.50 | 91.20 | 8.80 |
| B28-24 | B28 (delta front) | 75.80 | 2.00 | 15.20 | 92.90 | 7.10 |
| B28-36 | B28 (delta front) | 79.80 | 2.80 | 9.20 | 91.70 | 8.30 |
Table 5.
Thermal maturity by well block.
Table 5.
Thermal maturity by well block.
| Block | Representative Well | Range (°C) | Mean (°C) |
|---|
| TH | T1 | 392–457 | 439.10 |
| Y | C8 | 429–456 | 445.46 |
| Q | B28 | 436–456 | 447.07 |
Table 6.
Quantitative paleobathymetric reconstruction results based on the stratigraphic dip and isopach method.
Table 6.
Quantitative paleobathymetric reconstruction results based on the stratigraphic dip and isopach method.
| Transect | | | (m) | (m) | Paleodepth (m) |
|---|
| N38–O11 | 0.43 | 0.44 | 4312.14 | 4471.90 | 159.76 |
| T1–B18 | 0.44 | 0.45 | 4504.63 | 4666.46 | 161.83 |
| F6–G5-1 | 0.30 | 0.31 | 2288.40 | 2410.00 | 121.61 |
| F4–G5 | 0.29 | 0.29 | 2096.71 | 2178.13 | 81.43 |
| O4–R9 | 0.32 | 0.33 | 2535.75 | 2612.04 | 76.29 |
| R14–N21 | 0.32 | 0.32 | 2570.29 | 2512.34 | 57.95 |
Table 7.
Log response characteristics measured in well B28. W. range and W. mean are range and mean values over the whole-well interval, respectively; OR range and OR mean are range and mean values over organic-rich mudstone-shale intervals, respectively; and is the coefficient of determination between each log parameter and the TOC.
Table 7.
Log response characteristics measured in well B28. W. range and W. mean are range and mean values over the whole-well interval, respectively; OR range and OR mean are range and mean values over organic-rich mudstone-shale intervals, respectively; and is the coefficient of determination between each log parameter and the TOC.
| Parameter | W. Range | W. Mean | OR Range | OR Mean | |
|---|
| GR (API) | 96.5–141.8 | 119.79 | 94.2–135.2 | 122.09 | 0.004 |
| RT (Ω·m) | 6.34–52.17 | 13.60 | 7.15–37.17 | 12.85 | 0.106 |
| AC (μs/m) | 199.8–293.7 | 258.50 | 248.2–294.97 | 279.49 | 0.382 |
| DEN (g/cm3) | 2.04–2.75 | 2.561 | 2.29–2.75 | 2.583 | 0.070 |
Table 8.
Model validation summary for log-based lithofacies identification.
Table 8.
Model validation summary for log-based lithofacies identification.
| Well | Role | Dominant Lithofacies | TOC /R | Rel. Error | Identification Accuracy |
|---|
| B28 | Calibration | LF-B/D/E (delta front–semi-deep lake) | = 0.86 | 28.9% | 98.0% |
| C8 | Validation | LF-B dominant; LF-A and LF-C present | R = 0.85 | 32.5% | 64.6% |
| P1-2 | Validation | LF-B, LF-C, and LF-E co-developed | R = 0.85 | 30.8% | 75.4% (LF-E in deep-water intervals ≈100%) |
| T1 | Validation | LF-A dominant (deep lake) | R = 0.82 | 35.2% | 93.0% |
| B38 | Validation | LF-B/D/E (delta front) | R = 0.87 | 27.6% | 94.0% |



 ,
,