Article

Quantitative Lithofacies Characterization and Log-Based Identification of Organic-Rich Shales from the First Member of the Upper Cretaceous Qingshankou Formation in the Southern Songliao Basin of Northeast China

1
Engineering College, Tibet University, Lhasa 850000, China
2
School of Physical Science and Technology, Northwestern Polytechnical University, Xi’an 710072, China
3
Honggang Oil Production Plant, Jilin Oilfield Company, China National Petroleum Corporation, Da’an 131300, China
*
Author to whom correspondence should be addressed.
Minerals 2026, 16(5), 555; https://doi.org/10.3390/min16050555
Submission received: 8 April 2026 / Revised: 16 May 2026 / Accepted: 18 May 2026 / Published: 21 May 2026
(This article belongs to the Section Mineral Exploration Methods and Applications)

Abstract

Lithofacies characterization of organic-rich shales constitutes the essential foundation for sweet spot evaluation in lacustrine shale oil systems. This study targets the first member of the Upper Cretaceous Qingshankou Formation (K2qn1) in the southern Songliao Basin. Based on systematic core description of 908 m of core from eight cored wells, combined with 123 total organic carbon (TOC) measurements, 47 whole-rock X-ray diffraction (XRD) analyses, 29 major- and trace-element analyses, and six maceral identification datasets (≥500 organic particles counted per sample), together with conventional well log data from 75 wells (measured vitrinite reflectance R o = 0.34%–1.38%, mean = 0.94%), we establish an integrated lithofacies classification scheme incorporating the TOC as a classification parameter and develop a log-based lithofacies identification workflow. Eight lithofacies are recognized within K2qn1 across the study area, of which three are organic-rich. The high-TOC clay-rich mudstone-grade laminated shale deposited in a deep lake setting (LF-A; mean TOC = 3.18%, clay minerals ≥50%, formed under saline and strongly anoxic-euxinic conditions; mean paleosalinity = 8.06‰, V/(V + Ni) = 0.75–0.97) and the high-to-moderate-TOC felsic mudstone-grade laminated shale deposited in a semi-deep lake setting (LF-B; mean TOC = 2.18%, felsic minerals ≥50%, formed under brackish-to-saline anoxic conditions; mean paleosalinity = 5.10‰, V/(V + Ni) = 0.70–0.84) constitute the dominant organic-rich lithofacies. From Y1 to Y3, the cumulative thickness of organic-rich lithofacies expands from approximately 10 m to approximately 25 m. Areally, the mean TOC increases systematically from 1.65% in the southern delta-front zone to 2.74% in the northern deep lake center, reflecting an enrichment pattern governed primarily by paleoproductivity and modulated jointly by preservation conditions and terrigenous dilution. The log-based identification workflow, established by integrating a modified ΔlogR method with multiple linear regression, achieves a TOC prediction coefficient of determination of R 2 = 0.86 in the calibration well and lithofacies identification accuracies ranging from 64.6% to 94.0% in validation wells, with the highest performance observed in the delta-front facies zone. These results provide quantitative constraints for the genetic interpretation and log-based identification of organic-rich lacustrine shales.

1. Introduction

Shale oil represents one of the most strategically significant unconventional hydrocarbon resource types in current exploration and development [1,2,3]. A critical determinant of its commercial viability is whether organic-rich shale intervals of superior quality can be identified within large-scale, low-abundance source-reservoir integrated systems. Lithofacies integrate information on depositional environments, organic matter occurrence, and reservoir properties [4,5] and thus serve as the fundamental evaluation unit in shale oil geological assessment. Nevertheless, existing lithofacies studies are hampered by two persistent limitations. First, classification schemes are inconsistent and lack unified nomenclature standards; some schemes rely exclusively on the inorganic mineral composition [5,6] without incorporating the TOC, the parameter most directly indicative of shale oil’s generation potential [7]. Second, lithofacies descriptions are commonly confined to individual wells or local areas, lacking basin-scale lateral correlation and quantitative comparison, which limits the practical applicability of lithofacies methods to industrial-scale sweet spot prediction [8].
The first member of the Upper Cretaceous Qingshankou Formation (K2qn1) in the Songliao Basin is a key target interval for lacustrine shale oil exploration in China [9,10,11]. Deposited during the maximum lake transgression of the depression stage, this member is characterized by stratigraphic stability, high organic matter abundance, and moderate thermal maturity, making it an ideal natural laboratory for the study of organic-rich lacustrine shales [12,13]. Substantial lithofacies research has been conducted on this interval; however, the number of lithofacies types identified by different researchers ranges from 5 to 11, with considerable divergence in nomenclature [9,14,15]. Research attention has also been concentrated predominantly on the Gulong Sag in the northern basin, while systematic comparative studies in the southern central depression remain limited. More critically, the quantitative relationship between lithofacies and organic matter enrichment has long remained at a qualitative descriptive level, which directly constrains the practical utility of lithofacies methods in sweet-spot prediction.
In recent years, successive exploration breakthroughs in the Gulong and Changling sags have propelled lithofacies research on K2qn1 into a new phase. Liu et al. [9] subdivided the interval into nine lithofacies in the Gulong Sag and identified clay-rich laminated shale as an interval of significant exploration importance; Cai et al. [14] systematically compared lithofacies assemblages and source rock quality in the Qijia-Gulong Sag; Liu et al. [15] examined the controls of depositional environment on lithofacies assemblages; and Zhao et al. [10], Hou et al. [16] introduced machine learning and multiple regression approaches to advance log-based lithofacies prediction in lacustrine shales. However, these schemes predominantly emphasize inorganic mineral composition or sedimentary structures as classification parameters, with limited integration of the TOC [9,12,14]. Furthermore, the geographic focus remains largely on the northern basin, leaving systematic characterization of the southern central depression largely unaddressed.
Motivated by the limitations outlined above, this study focuses on K2qn1 in the southern central depression of the Songliao Basin. This area spans a complete depositional transect from the delta front through the semi-deep lake to the deep lake, encompassing a full range of lithofacies types and a wide spectrum of organic matter abundance, making it an ideal target for elucidating the coupling relationship between lithofacies and organic matter enrichment. The study is based on the systematic core description of 908 m of core from eight cored wells, supplemented by 123 TOC measurements, 47 whole-rock XRD analyses, 29 major- and trace-element analyses, and six maceral identification datasets, integrated with conventional well log data from 75 wells. Three objectives are pursued: (1) to establish an integrated lithofacies classification scheme that incorporates the TOC alongside depositional genetic attributes as co-equal naming parameters; (2) to quantitatively characterize differences among the major lithofacies in terms of organic matter abundance, provenance, and preservation conditions; and (3) to develop a log-based lithofacies identification workflow applicable to conventional well logs, thereby providing an operational geological basis and technical support for sweet spot evaluation of shale oil in the southern K2qn1.

2. Geological Setting

The Songliao Basin is a large Mesozoic–Cenozoic continental petroliferous basin located in northeastern China. Its tectonic evolution encompasses five stages—pre-rift, syn-rift fault depression, thermal subsidence sag, structural inversion, and weak extensional relaxation—resulting in a characteristic “lower faulted, upper sagging” binary architecture with a total Cretaceous thickness of approximately 7000 m [17]. The basin is subdivided into six first-order tectonic units—the central depression, the southeastern uplift, the northeastern uplift, the northern plunge zone, the western slope zone, and the southwestern uplift—together comprising 38 second-order structural units [17,18]. During the Late Jurassic to early Early Cretaceous periods, intense extensional rifting driven by the closure of the Mongol–Okhotsk Ocean and subduction of the Pacific Plate generated multiple fault-bounded lacustrine sub-basins. From the late Early Cretaceous period onward, regional thermal subsidence became dominant; the basin entered its sag stage, and the lake expanded to its maximum areal extent, establishing the tectonic and paleogeographic framework for stable deposition of the Qingshankou Formation [13,18].
The Qingshankou Formation belongs to the sag tectonic sequence, and it was deposited during the first maximum lacustrine transgression in the Songliao Basin under warm, humid climatic conditions [11,13,18]. The depositional age of this formation is broadly coeval with Cretaceous oceanic anoxic events (OAEs), and the organic-rich mudstone-shale intervals within the basin are comparable to time-equivalent OAEs deposits [13,19]. This global backdrop of the greenhouse climate, eutrophic water bodies, and intensified anoxia provides the dynamic context for the paleoenvironmental discussion presented in Section 5.4 of this study [12,13,19].
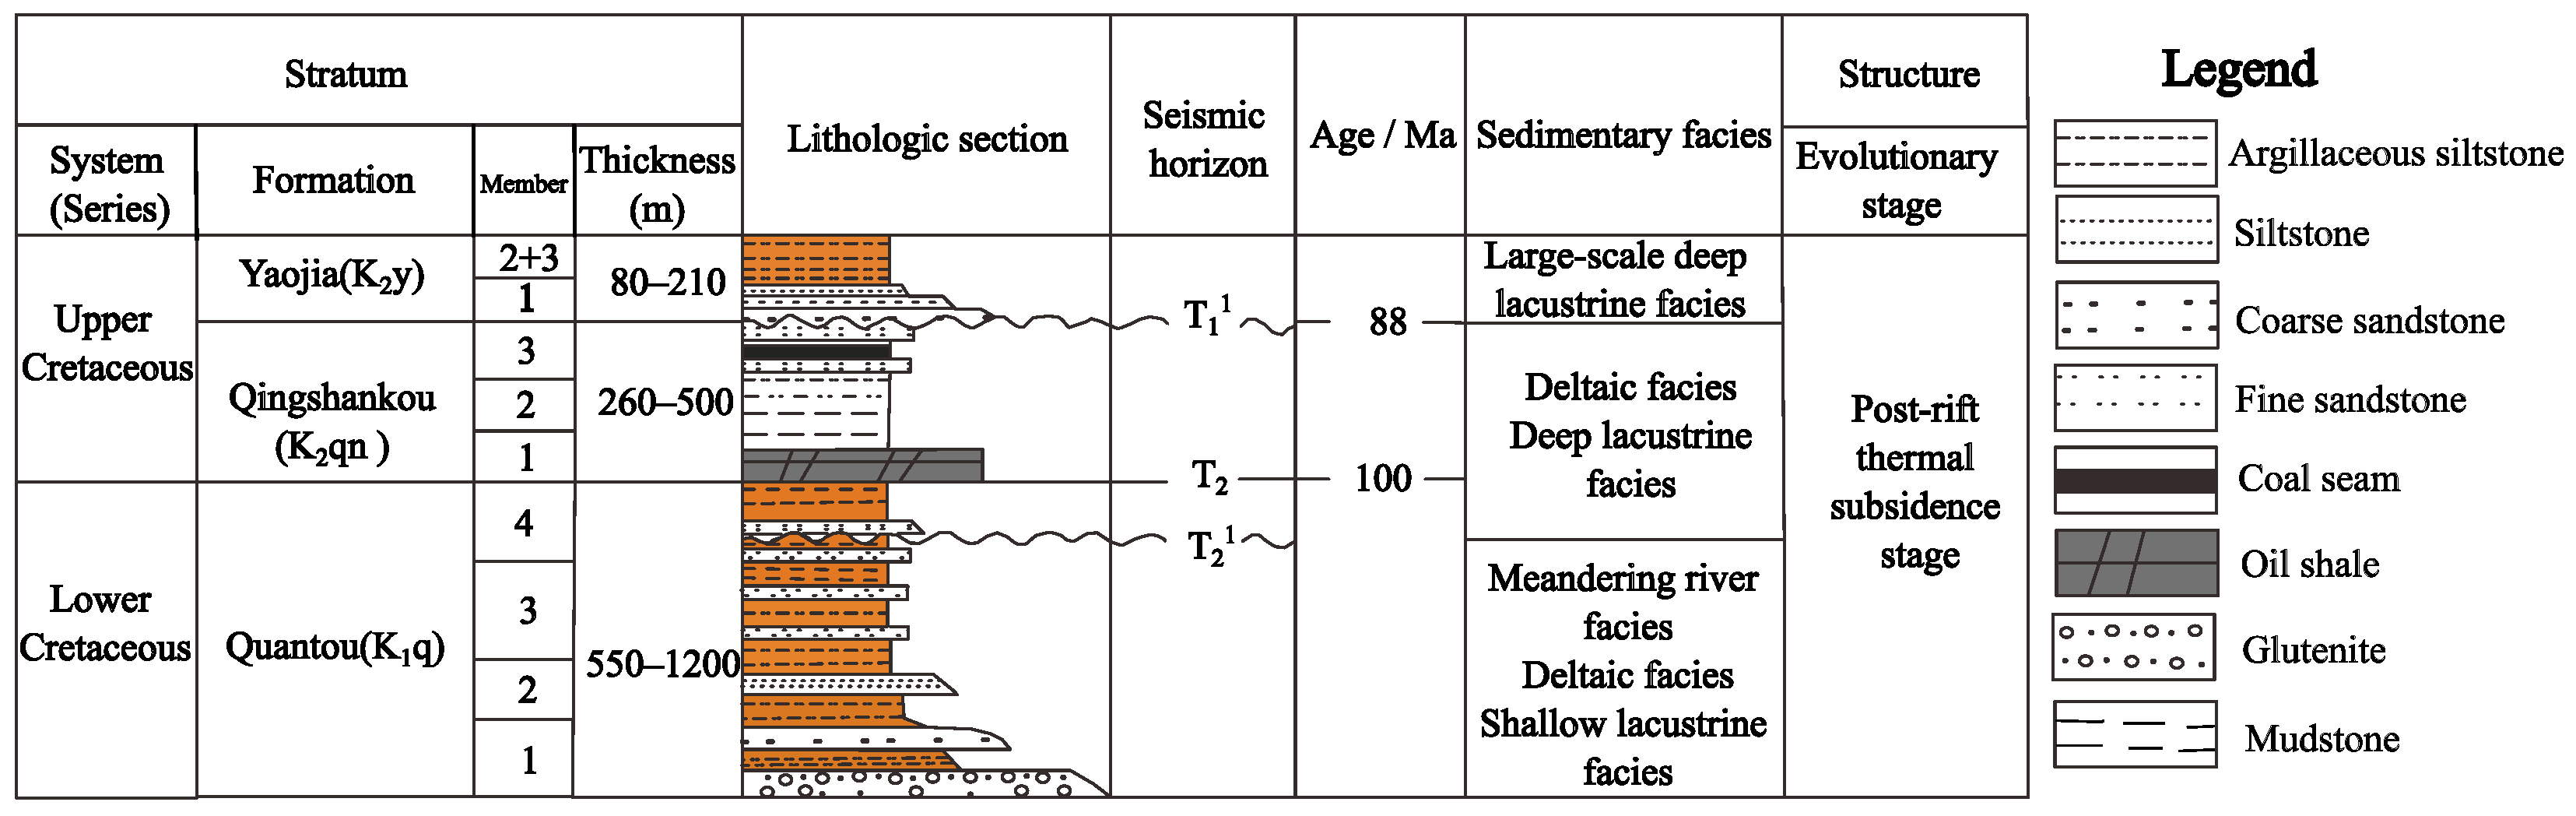
The study interval, K2qn1, is dominated by dark-gray-to-black mudstones interbedded with gray siltstones, minor gray ostracod-bearing limestone, fine sandstone, and ostracod-bearing mudstone [9,14]. The underlying Quantou Formation (K1q) is characterized by purple-to-brown mudstones and grayish-white feldspathic lithic fine sandstones. The lower part of the overlying Yaojia Formation (K2y) consists predominantly of purplish-red-to-gray-green mudstones, grading upward into silty mudstones and muddy siltstones in the second and third members (Figure 1) [18]. Based on well log and core criteria, K2qn1 is further subdivided upward into three reservoir units—Y1, Y2, and Y3—with thicknesses ranging from 50 to 150 m, controlled primarily by paleotopography and the contemporaneous depositional setting. Geochemical analyses indicate that the organic matter is predominantly Type I–II kerogen [10,12,15], with TOC values generally ranging from 0.5% to 5.0% and a measured vitrinite reflectance R o between 0.34% and 1.38% (mean 0.94%), placing the interval within the low-mature to mature oil window and confirming favorable conditions for shale oil generation and accumulation [10,20].
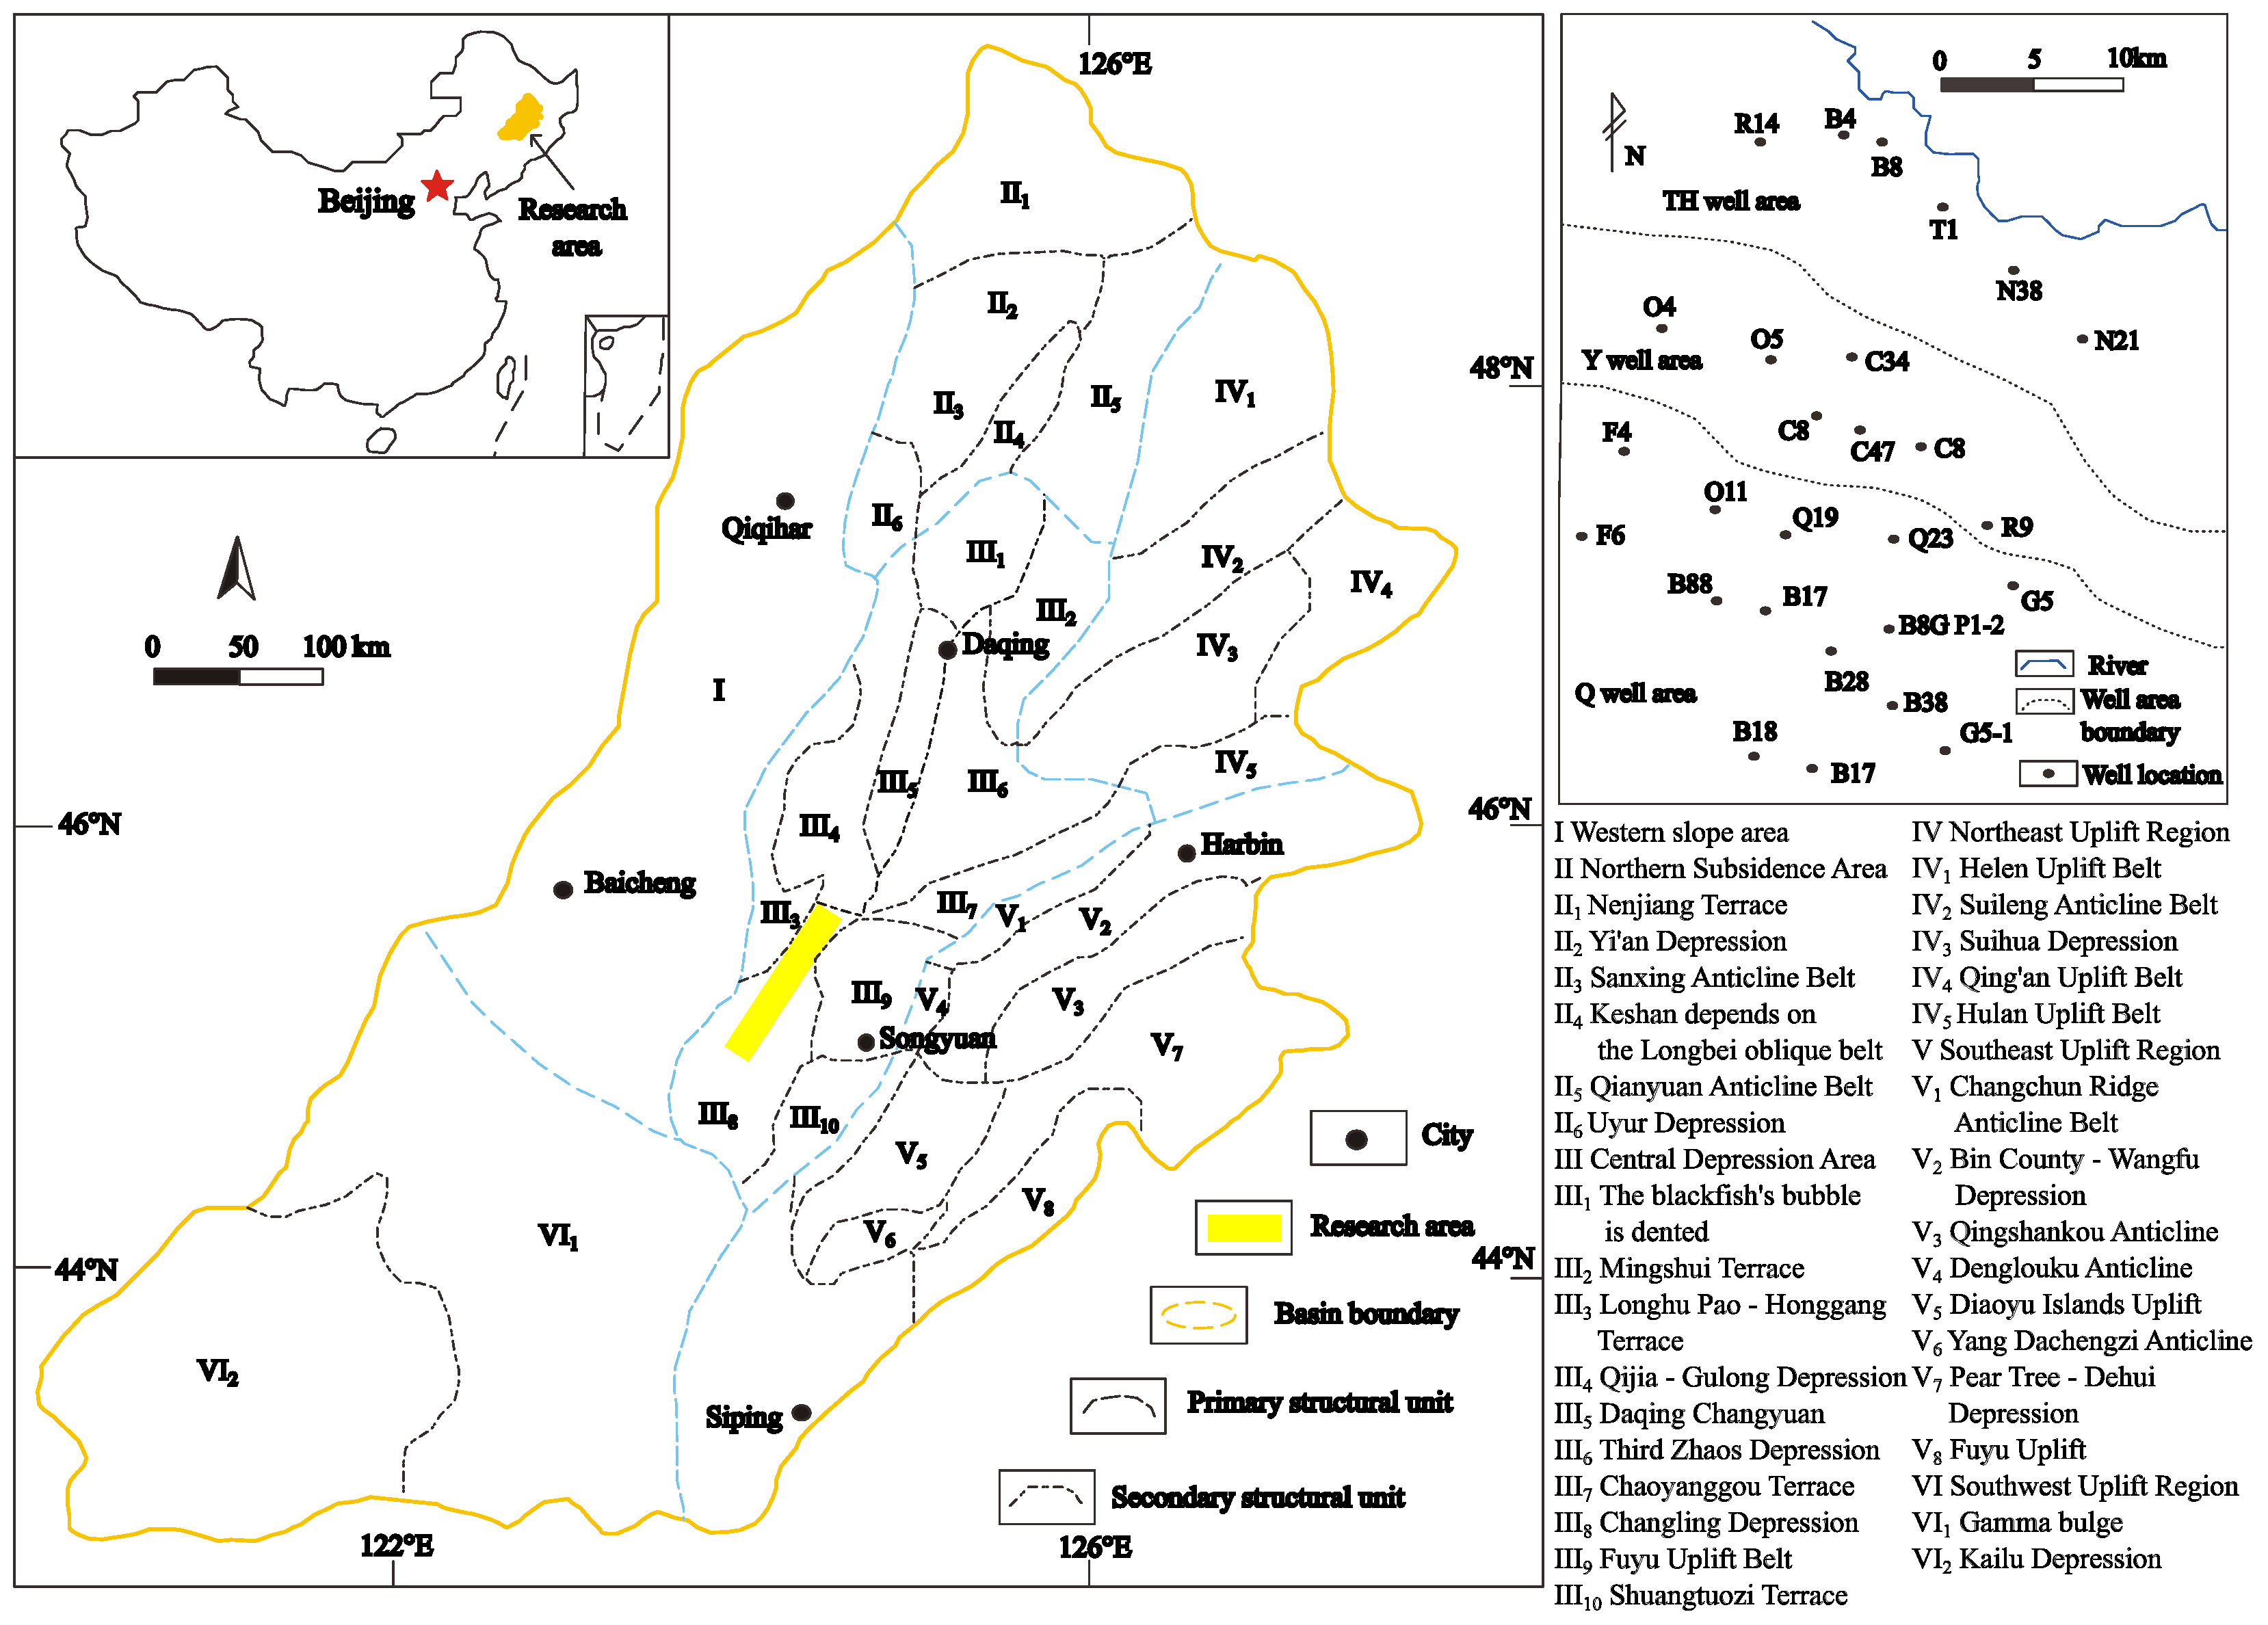
The study area is located in the central depression of the southern Songliao Basin, covering approximately 5000 km2 (Figure 2). The depositional environment exhibits distinct north-south facies zonation: the southern Q well block is characterized by delta-front deposits consisting of interbedded fine-to-coarse-grained sandstones and mudstone-shale; northward into the Y well block, the setting transitions to semi-deep lake conditions with progressively thicker mudstone-shale successions; the northernmost TH well block is dominated by deep lake dark mudstone-shale, representing the most favorable environment for organic matter enrichment. This nearshore-to-basin-center facies differentiation provides a natural transect for investigating the spatial distribution of lithofacies and their controls on organic matter accumulation.

3. Materials and Methods

3.1. Sample Collection

A total of 12 cored wells with a cumulative core length of 908 m were systematically drilled in the study area, yielding 3229 analytical records across four categories of laboratory tests, which constitute the primary dataset of this study. From these, eight cored wells (T1, B8, C8, C34, B8G P1-2, B28, B38, and G5-1) were selected for systematic core description following a three-tier protocol encompassing macroscopic, mesoscopic, and microscopic observations, with a total described core length of 908 m spanning four well blocks: the TH block (deep lake), the Y block (semi-deep lake), the QA block (semi-deep lake to delta-front transition), and the Q block (delta front). Within the Y1–Y3 sweet spot intervals of K2qn1, 123 TOC measurements, 47 whole-rock XRD analyses, 29 major- and trace-element analyses, and six maceral identification datasets (with ≥500 organic particles counted per sample) were obtained and integrated with conventional well log data from 75 wells, including gamma ray (GR), resistivity (RT/RXO), density (DEN), acoustic transit time (AC), compensated neutron log (CNL), and caliper (CAL) data. Measured vitrinite reflectance R o values from the 75 wells ranged from 0.34% to 1.38% (mean 0.94%), indicating that the interval was uniformly within the low-mature to mature thermal evolution stage and that inter-well comparability was reliable. The cored intervals, sample counts, and facies coverage for each well are summarized in Table 1.

3.2. Analytical Methods

TOC analysis. The TOC was determined following the Chinese standard GB/T 19145-2003 [21] using a LECO CS-230 or CS-844 carbon–sulfur analyzer (LECO Corporation, St. Joseph, MI, USA). Prior to analysis, carbonate minerals were removed by immersion in 5% hydrochloric acid; the samples were subsequently rinsed with deionized water to neutrality and oven-dried. Analytical precision was better than ±5%.
Rock-Eval pyrolysis. Pyrolysis was performed following GB/T 18602-2012 [22] using a Rock-Eval 6 instrument (Vinci Technologies, Nanterre, France), yielding the parameters S 1 , S 2 , T max , HI, and OSI.
Whole-rock X-ray diffraction (XRD). Analyses were conducted on a Bruker D8 Advance diffractometer (Bruker AXS GmbH, Karlsruhe, Germany) with Cu-Kα radiation at 40 kV and 40 mA, scanning from 5° to 70° (2 θ ) with a step size of 0.02° following SY/T 5163-2018 [23]. Clay mineral relative abundances were determined separately from oriented mounts measured in three states: air-dried, ethylene-glycol-saturated, and heated.
Major- and trace-element analysis. Major elements were determined by X-ray fluorescence spectrometry (XRF), and trace elements were measured by inductively coupled plasma mass spectrometry (ICP-MS; Agilent 7900, Agilent Technologies, Santa Clara, CA, USA) after high-pressure closed-vessel digestion in HF + HNO3. Analytical precision was better than ±2% for the major elements and ±5% for the trace elements.
Maceral identification. Polished whole-rock sections were prepared and examined under an oil immersion objective (50×) using a combined reflected light and fluorescence microscope following the ICCP System 1994/2017 international classification [24,25,26] and SY/T 5125-2014 [27], with a minimum of 500 organic particles counted per sample [20,28]. Vitrinite random reflectance ( V R r ) was measured following ISO 7404-5:2009 [29] and ASTM D7708-14 [30], with a minimum of 50 valid readings per sample [20].
Well log data. Conventional well log curves from 75 wells were provided by the Jilin Oilfield Company. All curves were environmentally corrected and inter-well normalized prior to use, with the baseline established from the stable mudstone interval at the top of K2qn1. Log curves from the eight cored wells were used for model calibration, while the remaining 67 wells were used for blind test validation and areal prediction.

3.3. Lithofacies Classification Scheme

Conventional mudstone and shale classifications tend to emphasize mineral composition or sedimentary structures while inadequately characterizing organic matter abundance, limiting their direct applicability to shale oil sweet spot evaluation. To address this, we propose an integrated lithofacies classification scheme incorporating four parameters: the TOC, sedimentary structures, mineral composition, and lithology [9,14].
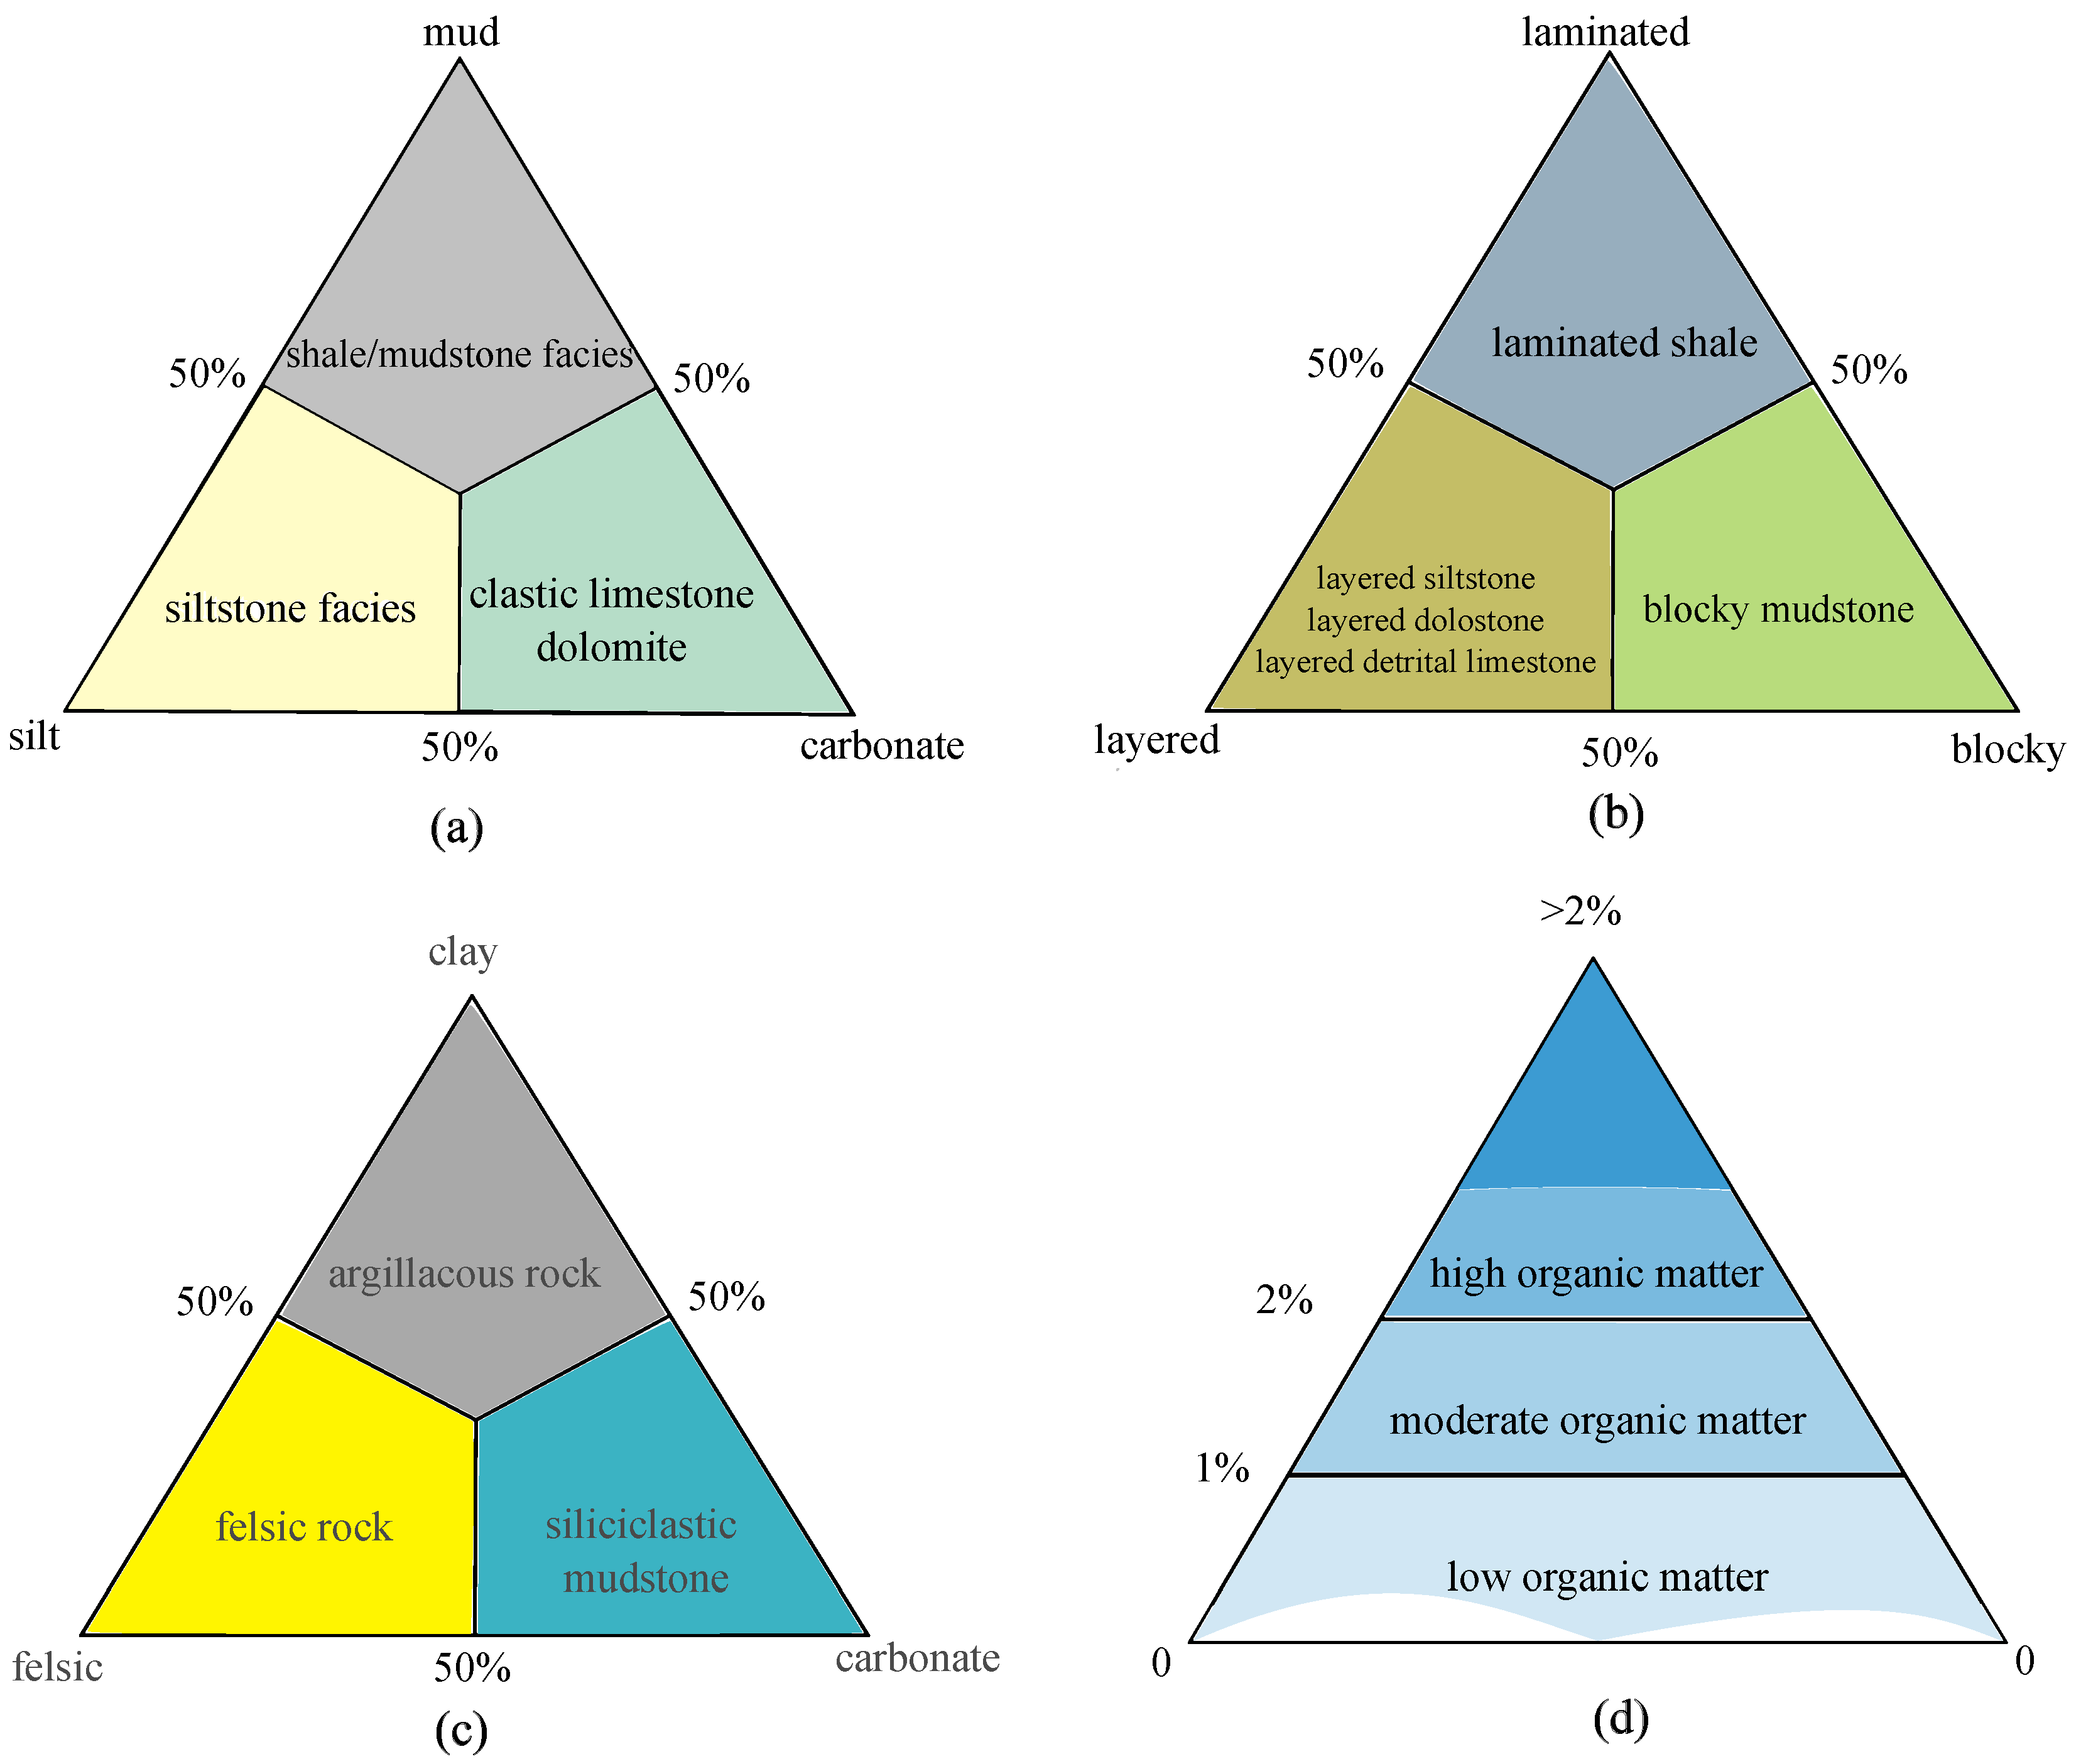
Organic matter abundance is represented by the TOC. Based on continental source-rock evaluation standards and the measured data distribution in the study area [9,14], a TOC ≥ 2% was defined as high organic matter, 1–2% was defined as moderate organic matter, and <1% was defined as low organic matter. Sedimentary structures were distinguished using a single-layer thickness threshold of 1 cm. Layers thinner than 1 cm exhibiting distinct compositional or grain size contrasts were classified as laminated; layers thicker than 1 cm were classified as layered; and intervals lacking discernible internal stratification were termed massive [4,6]. The mineral composition was assessed using a clay-felsic-carbonate ternary diagram, with a 50% threshold defining the dominant mineral type. Lithology follows conventional sedimentary rock nomenclature, primarily distinguishing shale, mudstone, siltstone, and carbonate rock. A dual-track nomenclature system was adopted, consisting of a short code (LF-A through LF-H) paired with a descriptive full name; the full name was given at first mention only, and the short code was used consistently thereafter. Eight lithofacies types were defined, and the complete classification scheme is illustrated in Figure 3 and summarized in Table 2.
It should be noted that the present scheme is intended as a targeted supplement to the fine-grained sedimentary rock nomenclature of Lazar et al. [4] for the specific application context of lacustrine shale oil sweet spot evaluation, rather than a replacement of that framework. The principal departures are incorporation of the TOC as a co-equal naming parameter and the retention of non-mudstone interbeds (LF-E through LF-H) as distinct lithofacies; in all other respects, the scheme adheres to the principles established by Lazar et al. [4].
It is important to clarify the logical independence between the classification parameters and the predictive application. In this scheme, the TOC serves as an objective measure of organic matter abundance in lithofacies nomenclature; however, the primary criteria for lithofacies identification remain the depositional genetic attributes: lamination style, mineral composition, grain size assemblage, and sedimentary structures. The predictive significance of lithofacies for TOC distribution discussed in Section 5.2 reflects the capacity of depositional facies assemblages to indicate organic matter enrichment and does not constitute circular reasoning by validating TOC with TOC. In the log-based application (Section 5.5), lithofacies are first identified independently from GR, AC, DEN, and V s h log parameters, and the TOC is subsequently extrapolated to uncored intervals using the lithofacies–TOC statistical relationship; the predicted TOC and the TOC used in classification therefore derive from independent data streams.

3.4. Log-Based Lithofacies Identification Method

Well log data offer the advantages of vertical continuity and broad spatial coverage, making them an effective means of achieving basin-wide lithofacies prediction. Accordingly, this study establishes a three-step workflow proceeding from TOC prediction to mineral composition estimation and, ultimately, to integrated lithofacies identification.
TOC prediction.
The TOC was predicted using the modified ΔlogR method [31,32], which exploits the differential well log responses of organic matter to resistivity and the acoustic transit time [31,33]. The overlay coefficient K was calibrated to establish the quantitative relationship between the log parameters and TOC:
Δ logR = log R R min + K ( Δ t Δ t min )
TOC = 2.8058 × Δ logR + 0.183
where R min and Δ t min are the stable baseline values taken from the non-interbedded mudstone interval of K2qn1 in each well.
Clay mineral content estimation. Clay mineral content ( V s h ) was estimated by multiple linear regression incorporating four log responses, namely the gamma ray, resistivity, density, and acoustic transit time [33]:
V s h = 9.69 + 0.13 × GR 0.20 × RT + 3.75 × DEN + 0.09 × AC
Compared with the conventional single-parameter gamma ray method, this multi-parameter approach effectively suppresses the anomalously elevated GR response in uranium-enriched organic-rich intervals, yielding a marked improvement in identification accuracy.
Parameter calibration and applicability. The overlay coefficient K of the modified ΔlogR method was calibrated independently for each cored well over the K2qn1 interval, excluding sandstone-mudstone. interbedded sections The coefficients of the multiple regression equation were derived via joint regression over 123 depth points from four cored wells (T1, C8, B28, and B8G P1-2) and applicable exclusively to the K2qn1 shale interval in the study area; recalibration is required if the method is extended to the underlying Quantou Formation (K1q) or the overlying Yaojia Formation (K2y). In calibration well B28, TOC prediction yielded R 2 = 0.86 with a mean relative error of 28.9%; in validation wells C8 and B8G P1-2, the lithofacies identification accuracies were 64.6% and 75.4%, respectively (see the model validation summary in Section 5.5).
The key log parameters measured in well B28 were as follows: the GR ranged from 96.5 to 141.8 API (mean = 119.79 API); RT ranged from 6.34 to 52.17 Ω·m (mean = 13.60 Ω·m); AC ranged from 199.8 to 293.7 μs/m (mean = 258.5 μs/m); and DEN ranged from 2.04 to 2.75 g/cm3 (mean = 2.561 g/cm3). Relative to ordinary mudstone intervals, organic-rich mudstone-shale intervals exhibited slightly elevated GR levels (122.09 API), markedly elevated AC (279.49 μs/m), and slightly reduced DEN (2.583 g/cm3). The correlation between the TOC and AC was the highest ( R 2 = 0.382 ), followed by RT and DEN ( R 2 = 0.106 and 0.070, respectively), with virtually no correlation with GR ( R 2 = 0.004 ). This correlation spectrum provides the rationale for using AC as the dominant parameter in the lithofacies discrimination criteria presented in subsequent sections.

4. Results

4.1. Identification of Major Lithofacies Types

Through systematic observation of 908 m of core from eight cored wells, integrated with comprehensive laboratory analyses of 123 samples, eight lithofacies types were recognized within K2qn1 across the study area (Figure 4, Figure 5, Figure 6, Figure 7, Figure 8, Figure 9 and Figure 10; Table 2). Each lithofacies was defined by distinct combinations of sedimentary structures, mineral composition, grain size assemblage, and TOC, yielding three organic-rich lithofacies (LF-A, LF-B, and LF-C) and five low organic matter lithofacies (LF-D–LF-H).
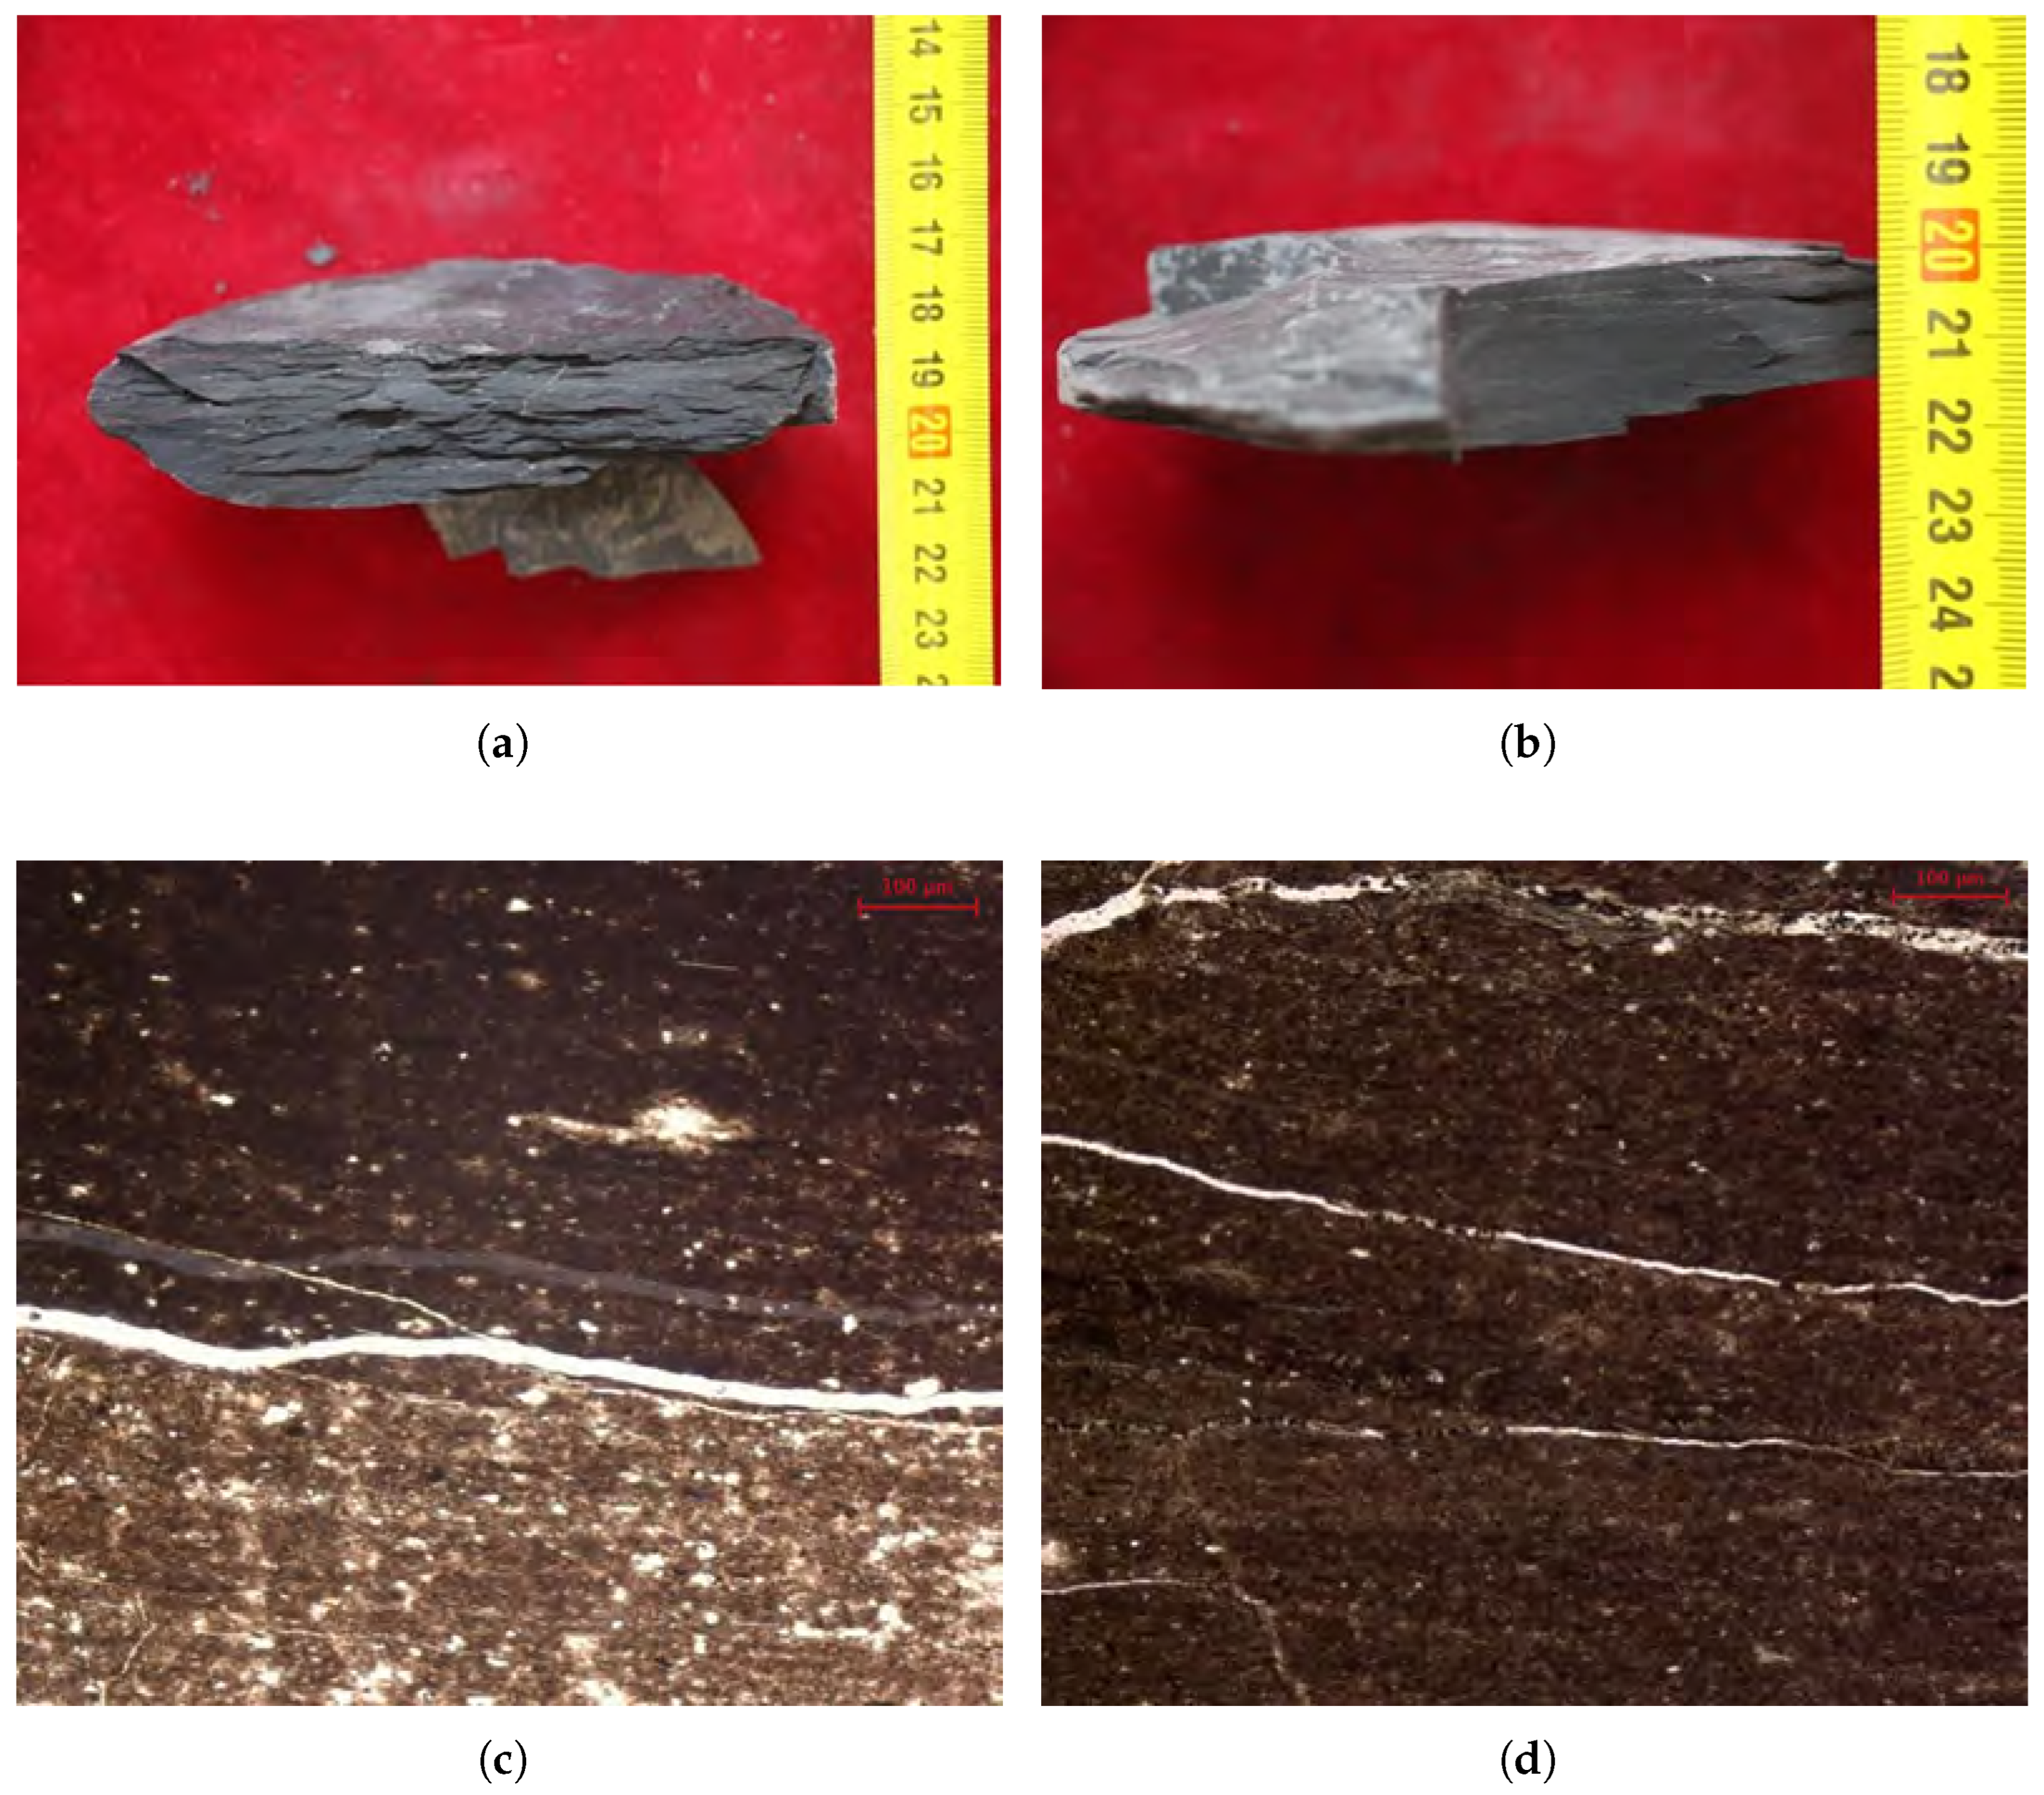
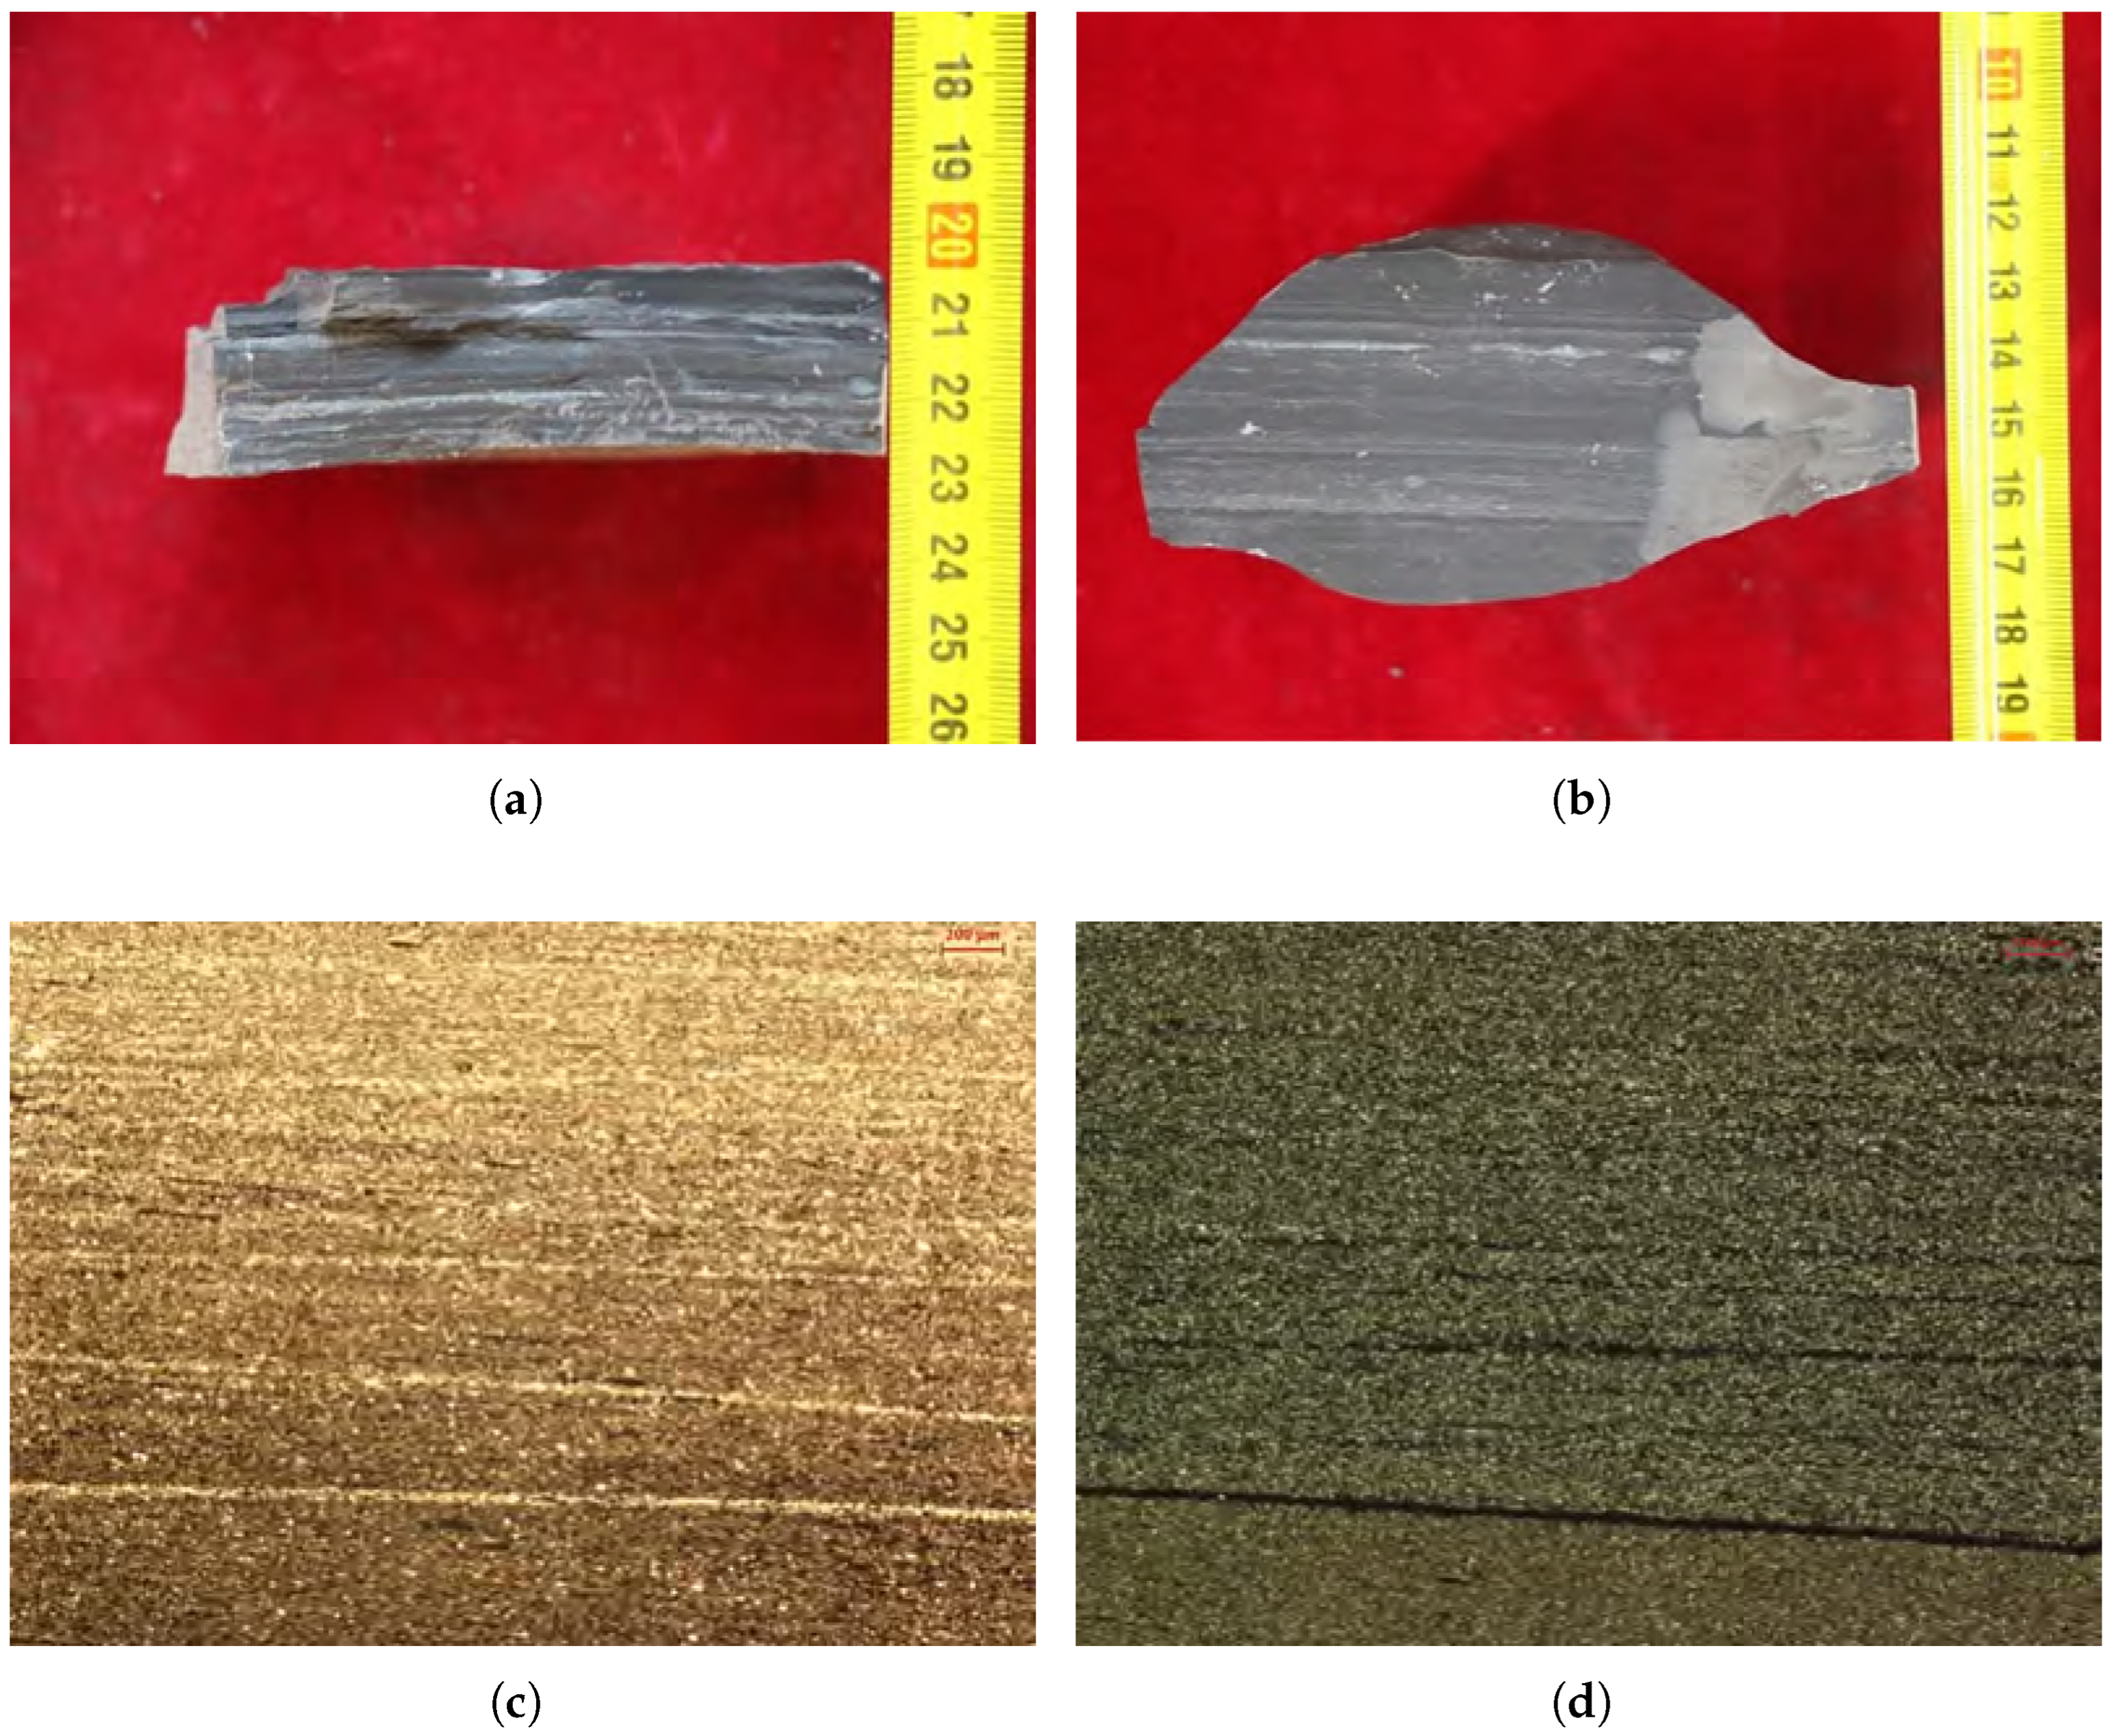
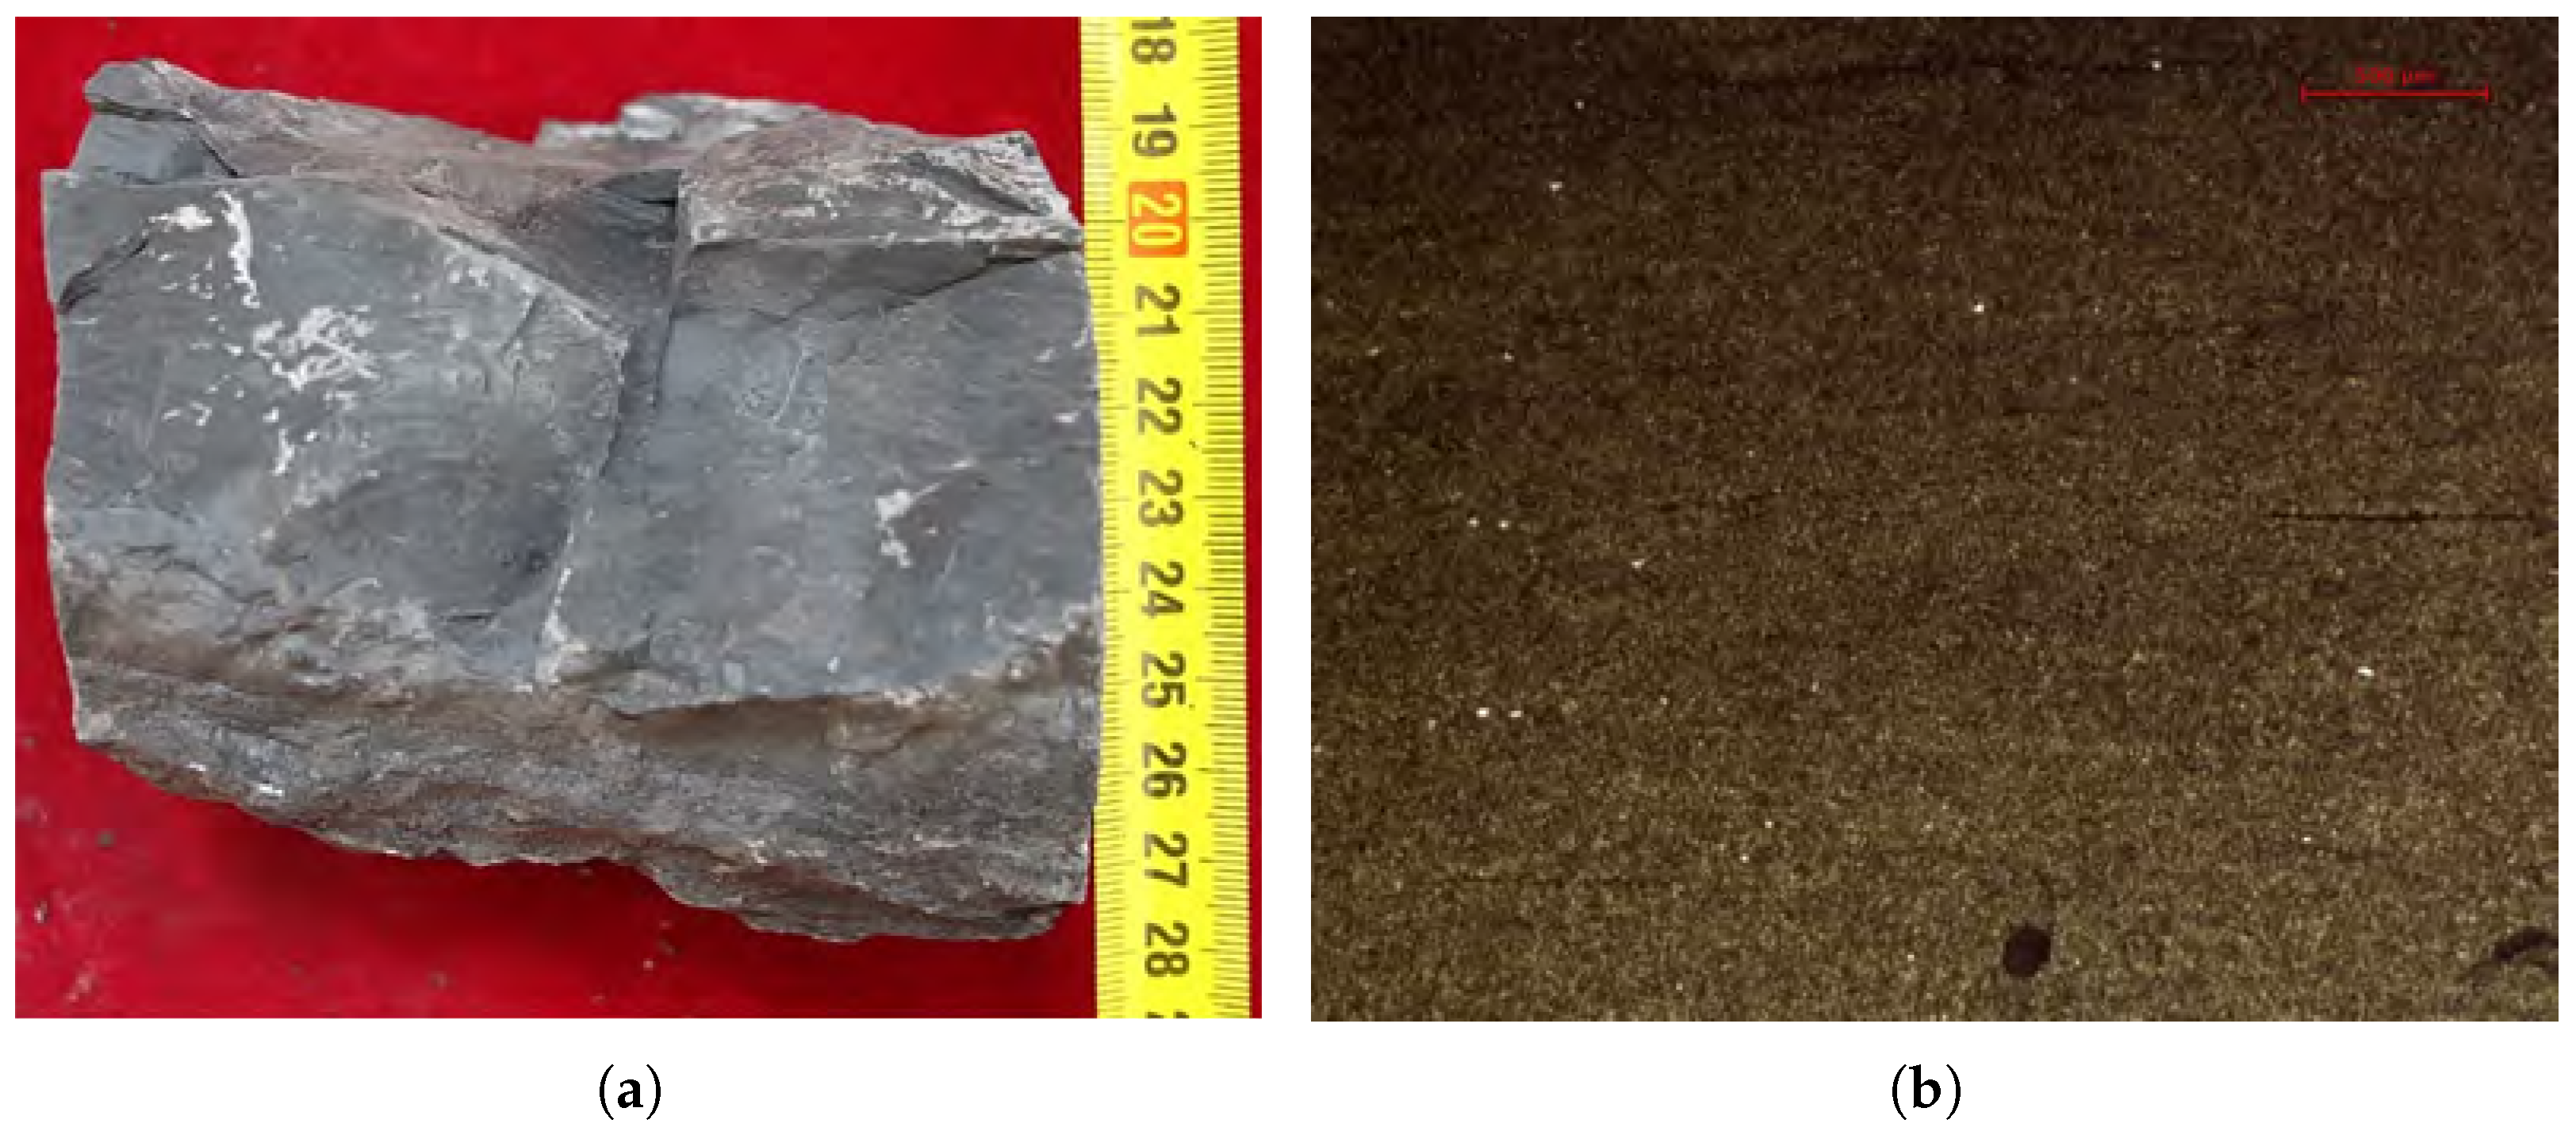
LF-A: High-organic-matter clay-rich mudstone-grade laminated shale. LF-A occurred predominantly in the deep lake well blocks of T1, B8, and C8. The cores were dark gray to black with planar, continuous laminae composed predominantly of mud-grade clay laminae alternating between organic matter-poor and organic matter-rich clay layers. Silt-grade laminae accounted for less than 10%, and individual laminae were thinner than 1 mm. Owing to relatively high thermal maturity (mean R o = 0.94% across the study area, locally reaching 1.31% at the deep lake center of well T1), the color contrast between the organic matter-poor and organic matter-rich clay laminae was subdued after hydrocarbon expulsion, giving the core an overall dark appearance. Clay minerals constituted ≥50% (illite 35%–45%, illite–smectite mixed layer 10%–15%); felsic minerals constituted 30%–45%; carbonate minerals constituted <10%; and the brittleness index ranged from 35% to 50%. The TOC ranged from 2.32% to 5.12% (n = 20 from deep lake well blocks; mean = 3.18% ± 0.85%), with all samples exceeding TOC = 2%; S 1 = 1.59–5.23 mg/g (mean = 2.82 mg/g), and HI = 300–650 mg/g·TOC. In terms of maceral composition, liptinite exceeded 90%, comprising lamalginite (mean = 35%) and telalginite (mean = 20%), with the remainder principally being liptodetrinite; inertinite and vitrinite together accounted for less than 10%. Representative samples included well T1 at 2302.0 m (TOC = 3.03%), 2354.65 m (TOC = 4.41%), and 2269.6 m (TOC = 3.98%) and well C8 at 2337.34 m (TOC = 3.84%).
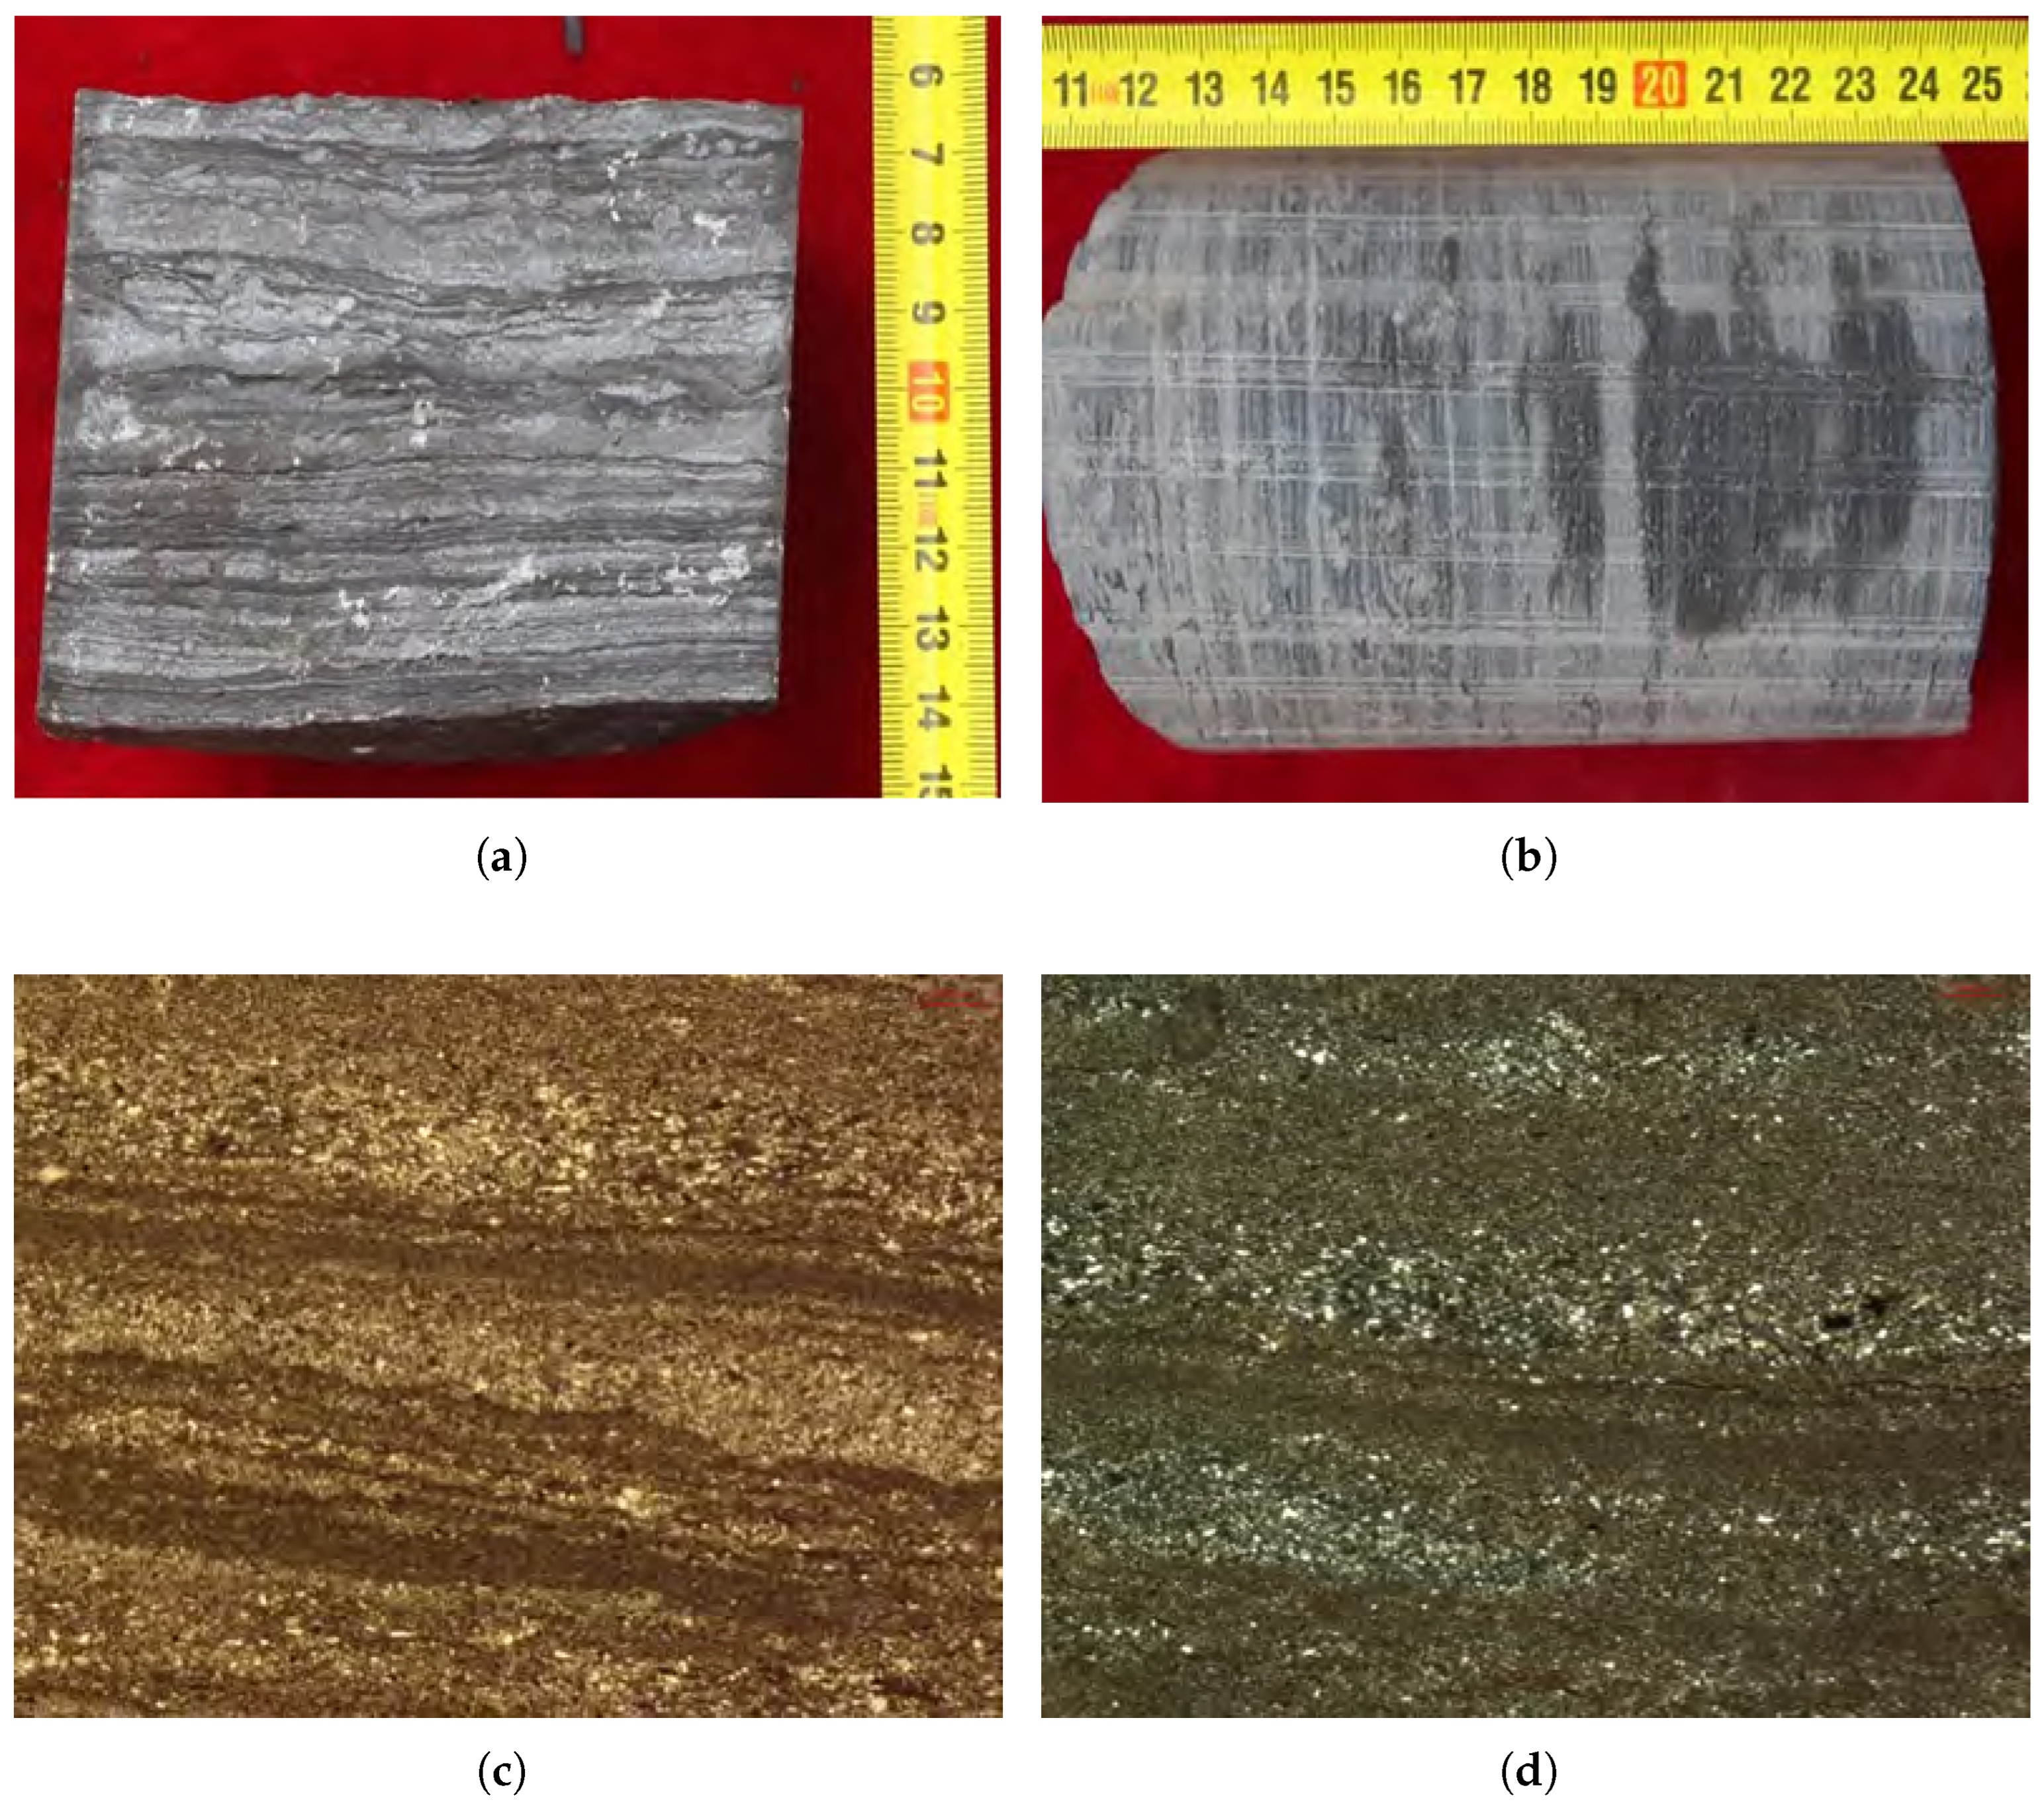
LF-B: High-to-moderate organic matter felsic mudstone-grade laminated shale. LF-B developed mainly in the C8, B8G P1-2, and B28 well blocks. Cores were deep gray to dark gray to black with planar to slightly wavy and continuous to locally discontinuous laminae. Mud-grade laminae dominated, silt-grade laminae accounted for ≤10%, individual laminae were 1–2 mm thick, and bright–dark lamina contacts were sharp. Felsic minerals constituted ≥50% (quartz 25%–35%, feldspar 20%–30%); clay minerals constituted 25%–45%; carbonate minerals constituted <10%; and the brittleness index ranged from 50% to 70%. The TOC ranged from 1.59% to 4.27% (n = 60 from semi-deep lake well blocks; mean = 2.18% ± 0.68%); S 1 = 0.94–3.68 mg/g (mean = 1.52 mg/g), and HI = 250–550 mg/g·TOC. Liptinite accounted for 65%–90% of macerals, comprising principally liptodetrinite (mean = 45%) and lamalginite (mean = 30%); terrestrially derived inertinite and vitrinite together totaled 8%–10%, slightly higher than in LF-A. Representative samples included well C8 at 2370.65 m (TOC = 1.20%), and well P1-2 at 2236.71 m (TOC = 2.40%) and 2240.85 m (TOC = 2.29%).
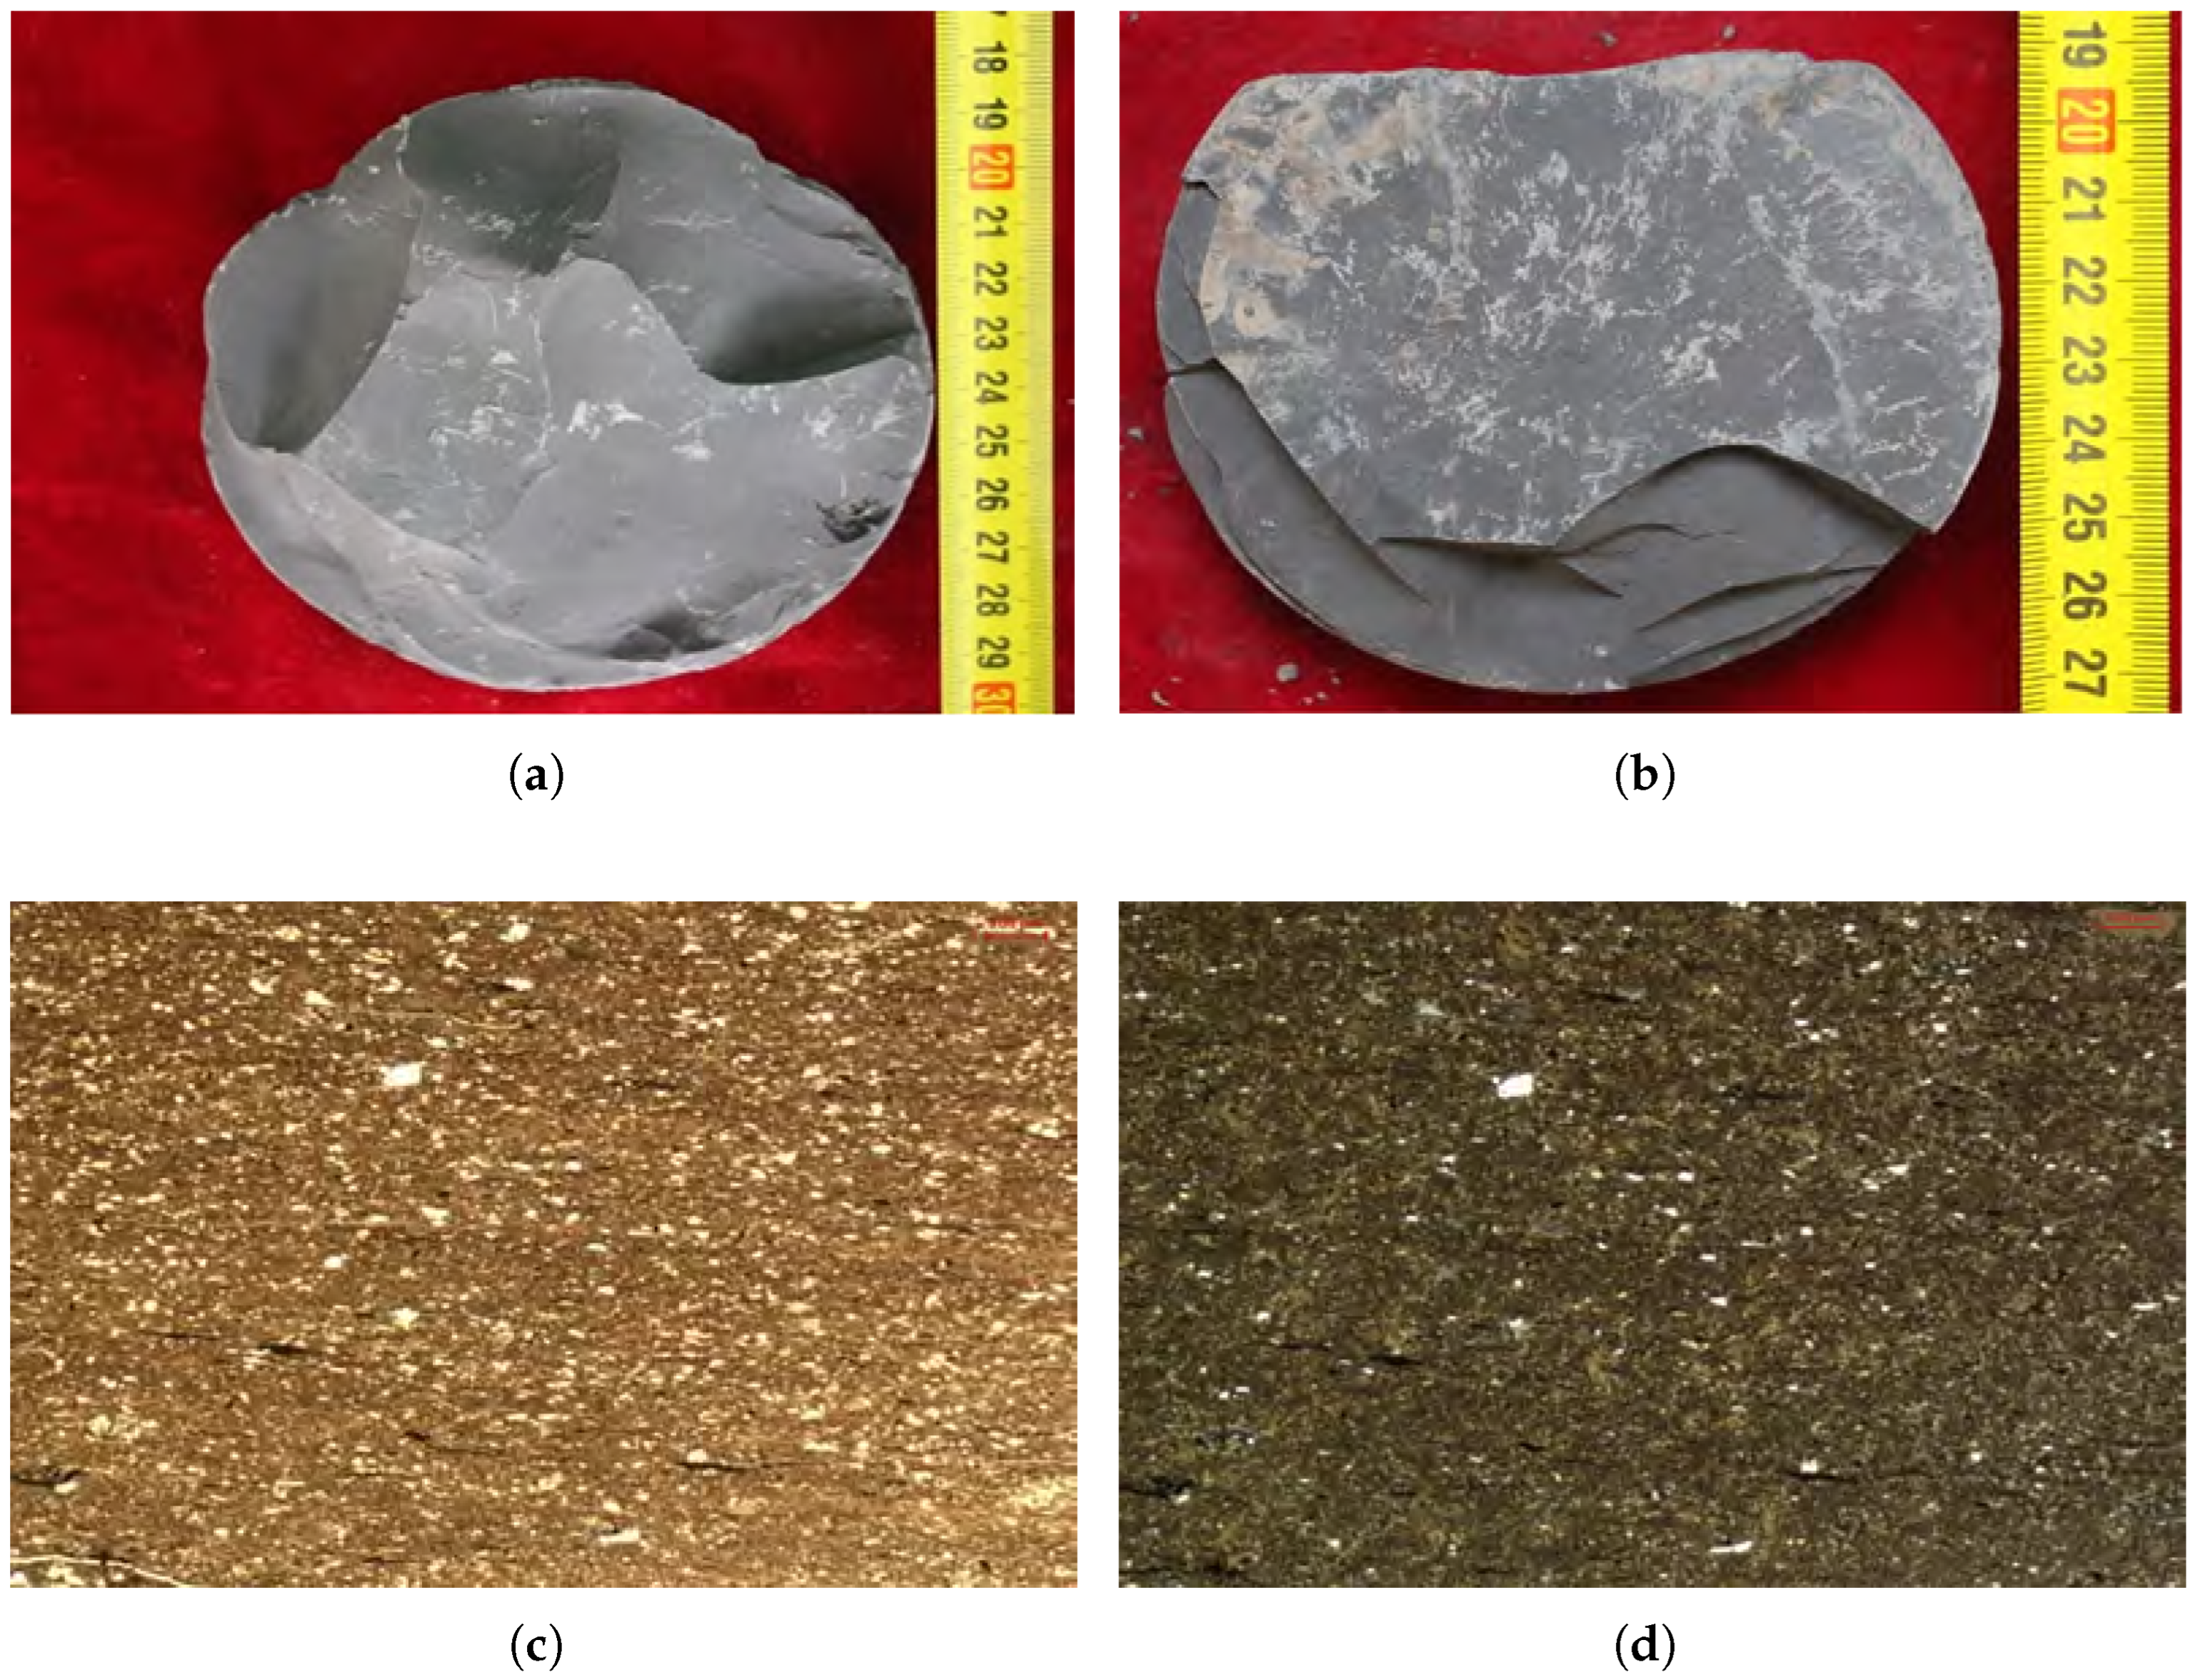
LF-C: Low-to-moderate organic matter felsic silt-bearing laminated shale. LF-C occurred locally in the C8 and B8G P1-2 well blocks. The cores were deep gray to gray with wavy and continuous to discontinuous laminae. Silt-grade laminae accounted for 10%–50%, individual laminae were predominantly > 1 mm thick, the bright–dark lamina contacts were sharp, and soft-sediment deformation structures or hydrothermal veins were common. Felsic minerals constituted ≥50%. The TOC ranged from 0.74% to 1.99% (n = 20; mean = 1.32% ± 0.38%). Representative samples included well P1-2 at 2252.99 m (TOC = 0.74%), well C8 at 2382.88 m (TOC = 1.79%), and well P1-2 at 2235.59 m (TOC = 1.27%).
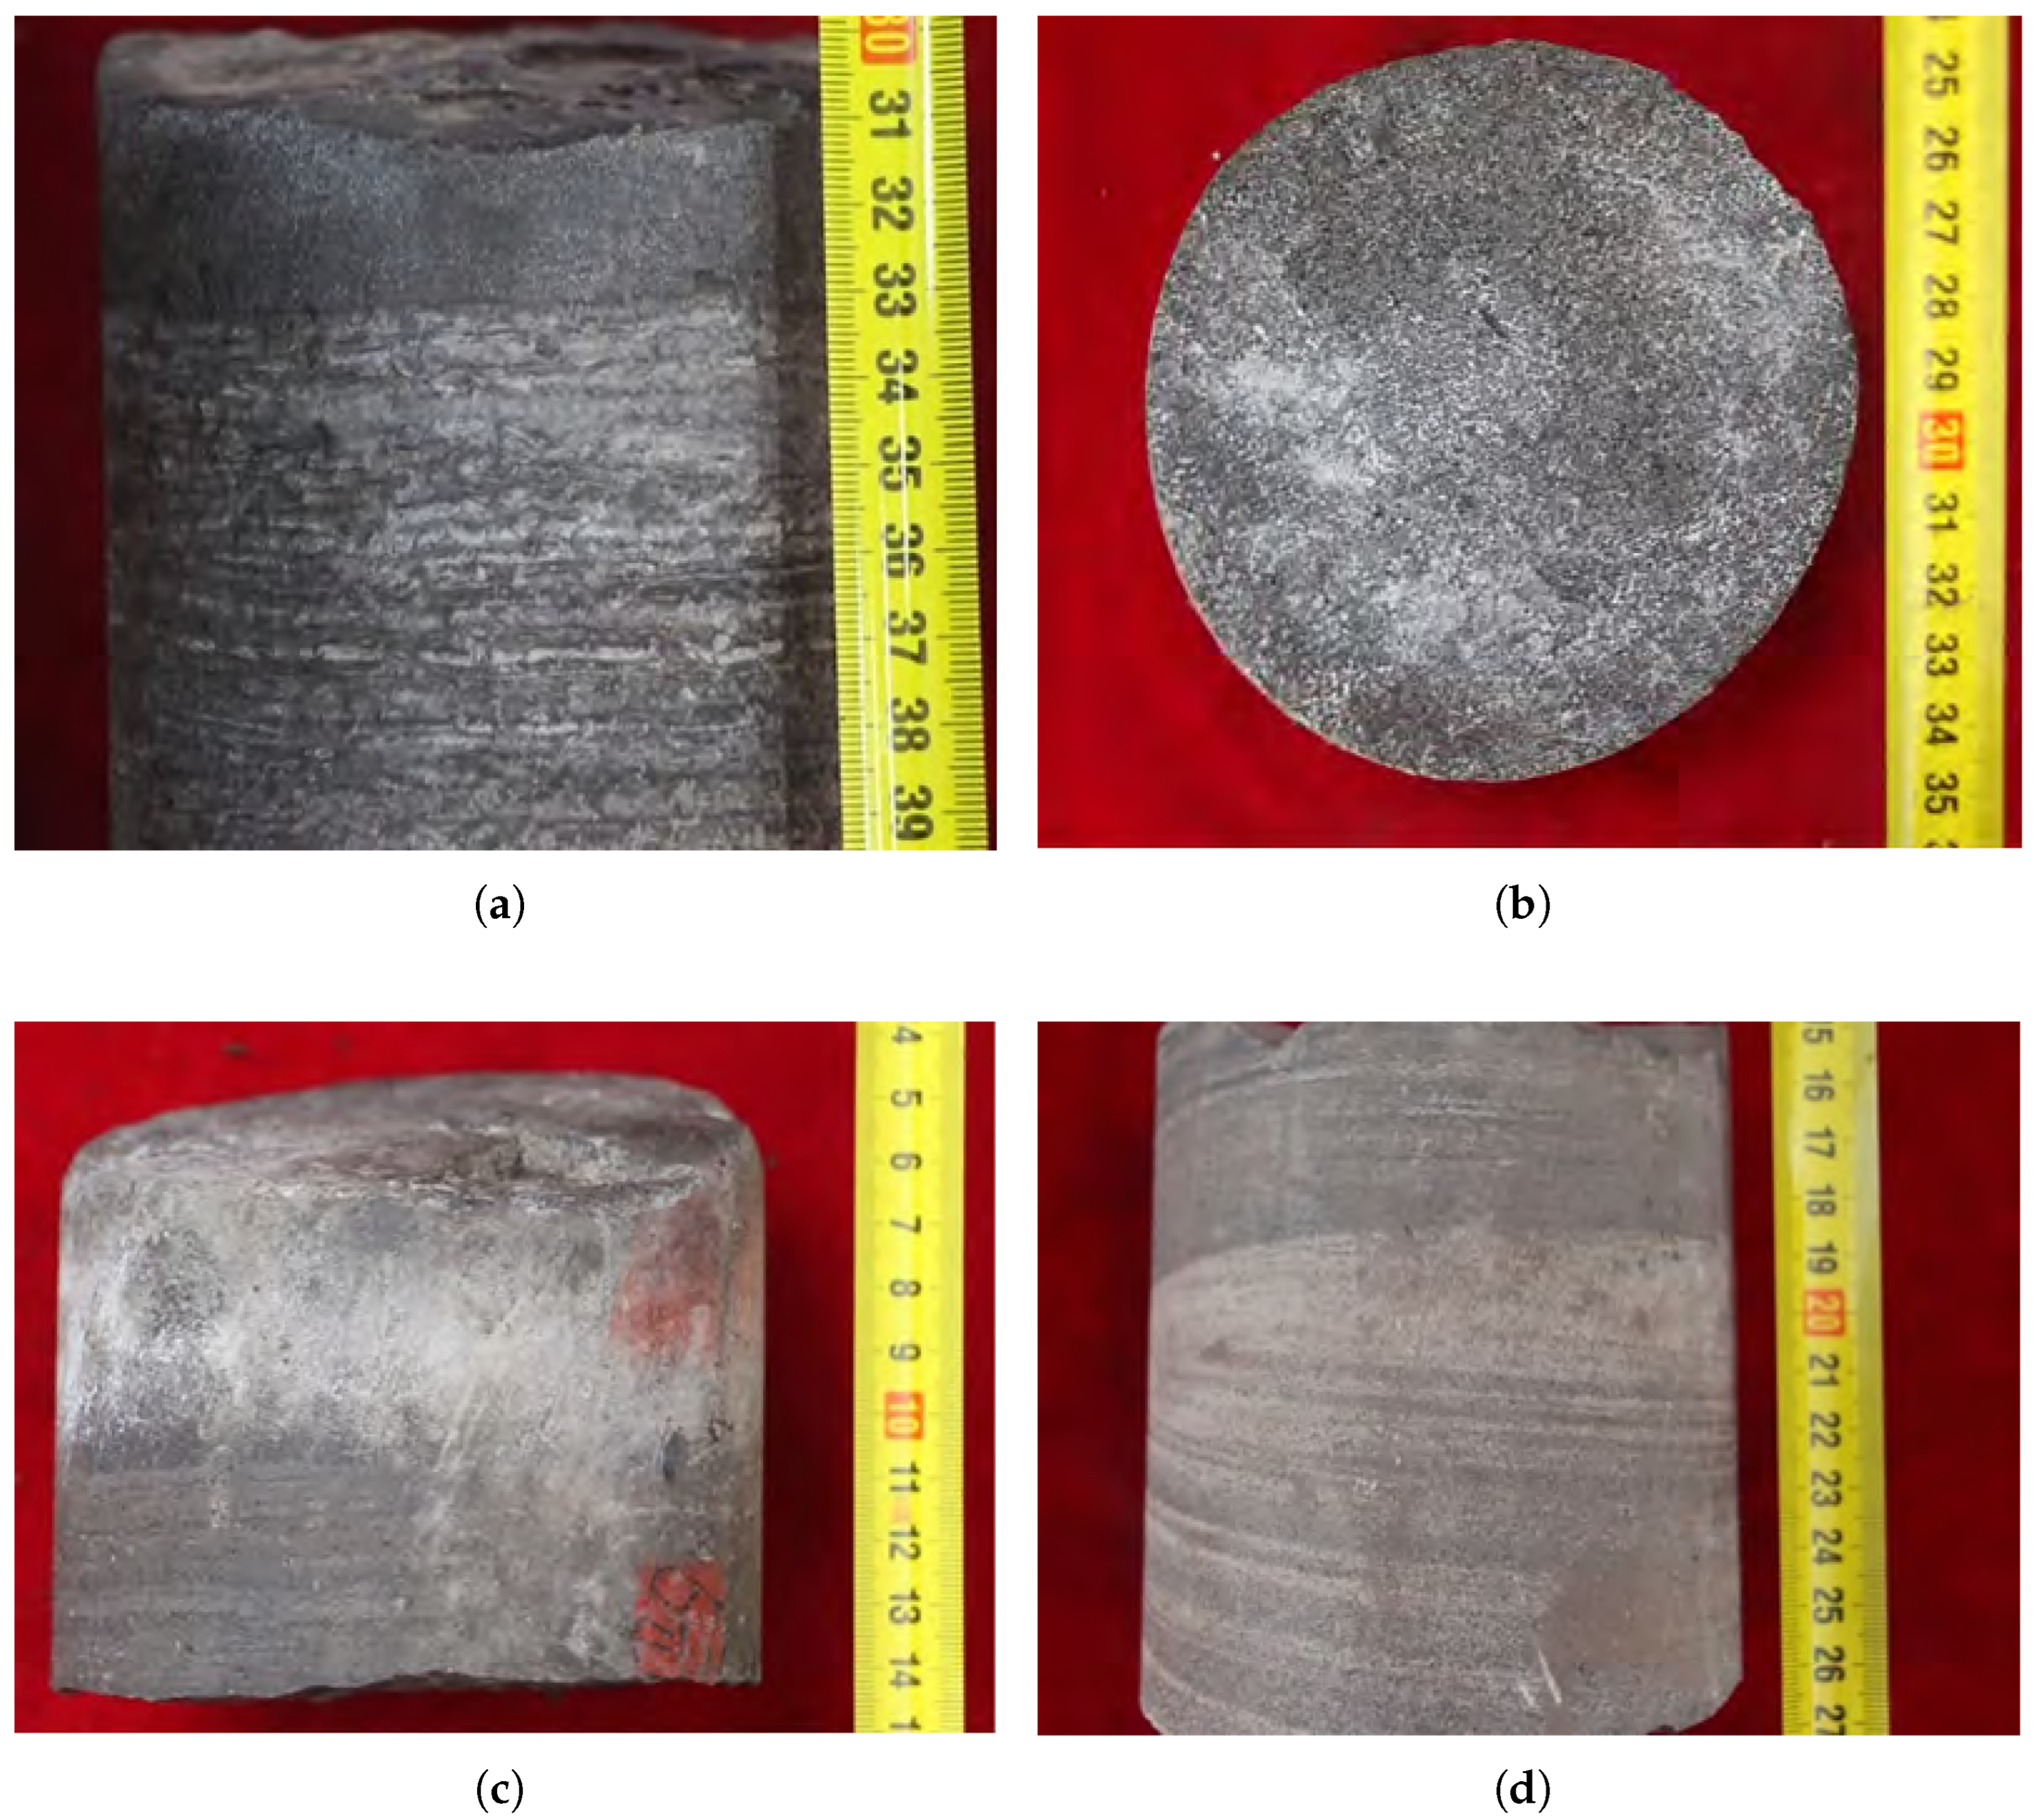
LF-D: Low-to-moderate organic matter massive felsic mudstone. LF-D occurred locally in the B38, B28, and B8G P1-2 well blocks. The cores were gray to deep gray. Felsic minerals constituted ≥50%; body fossils are present; individual bed thickness varied considerably; and bioturbation and massive structures were well developed, with a TOC < 2%. Representative samples included well P1-2 at 2050.0 m (TOC = 0.8%), well C8 at 2326.41 m (TOC = 1.8%), and well P1-2 at 2223.45 m (TOC = 1.78%).
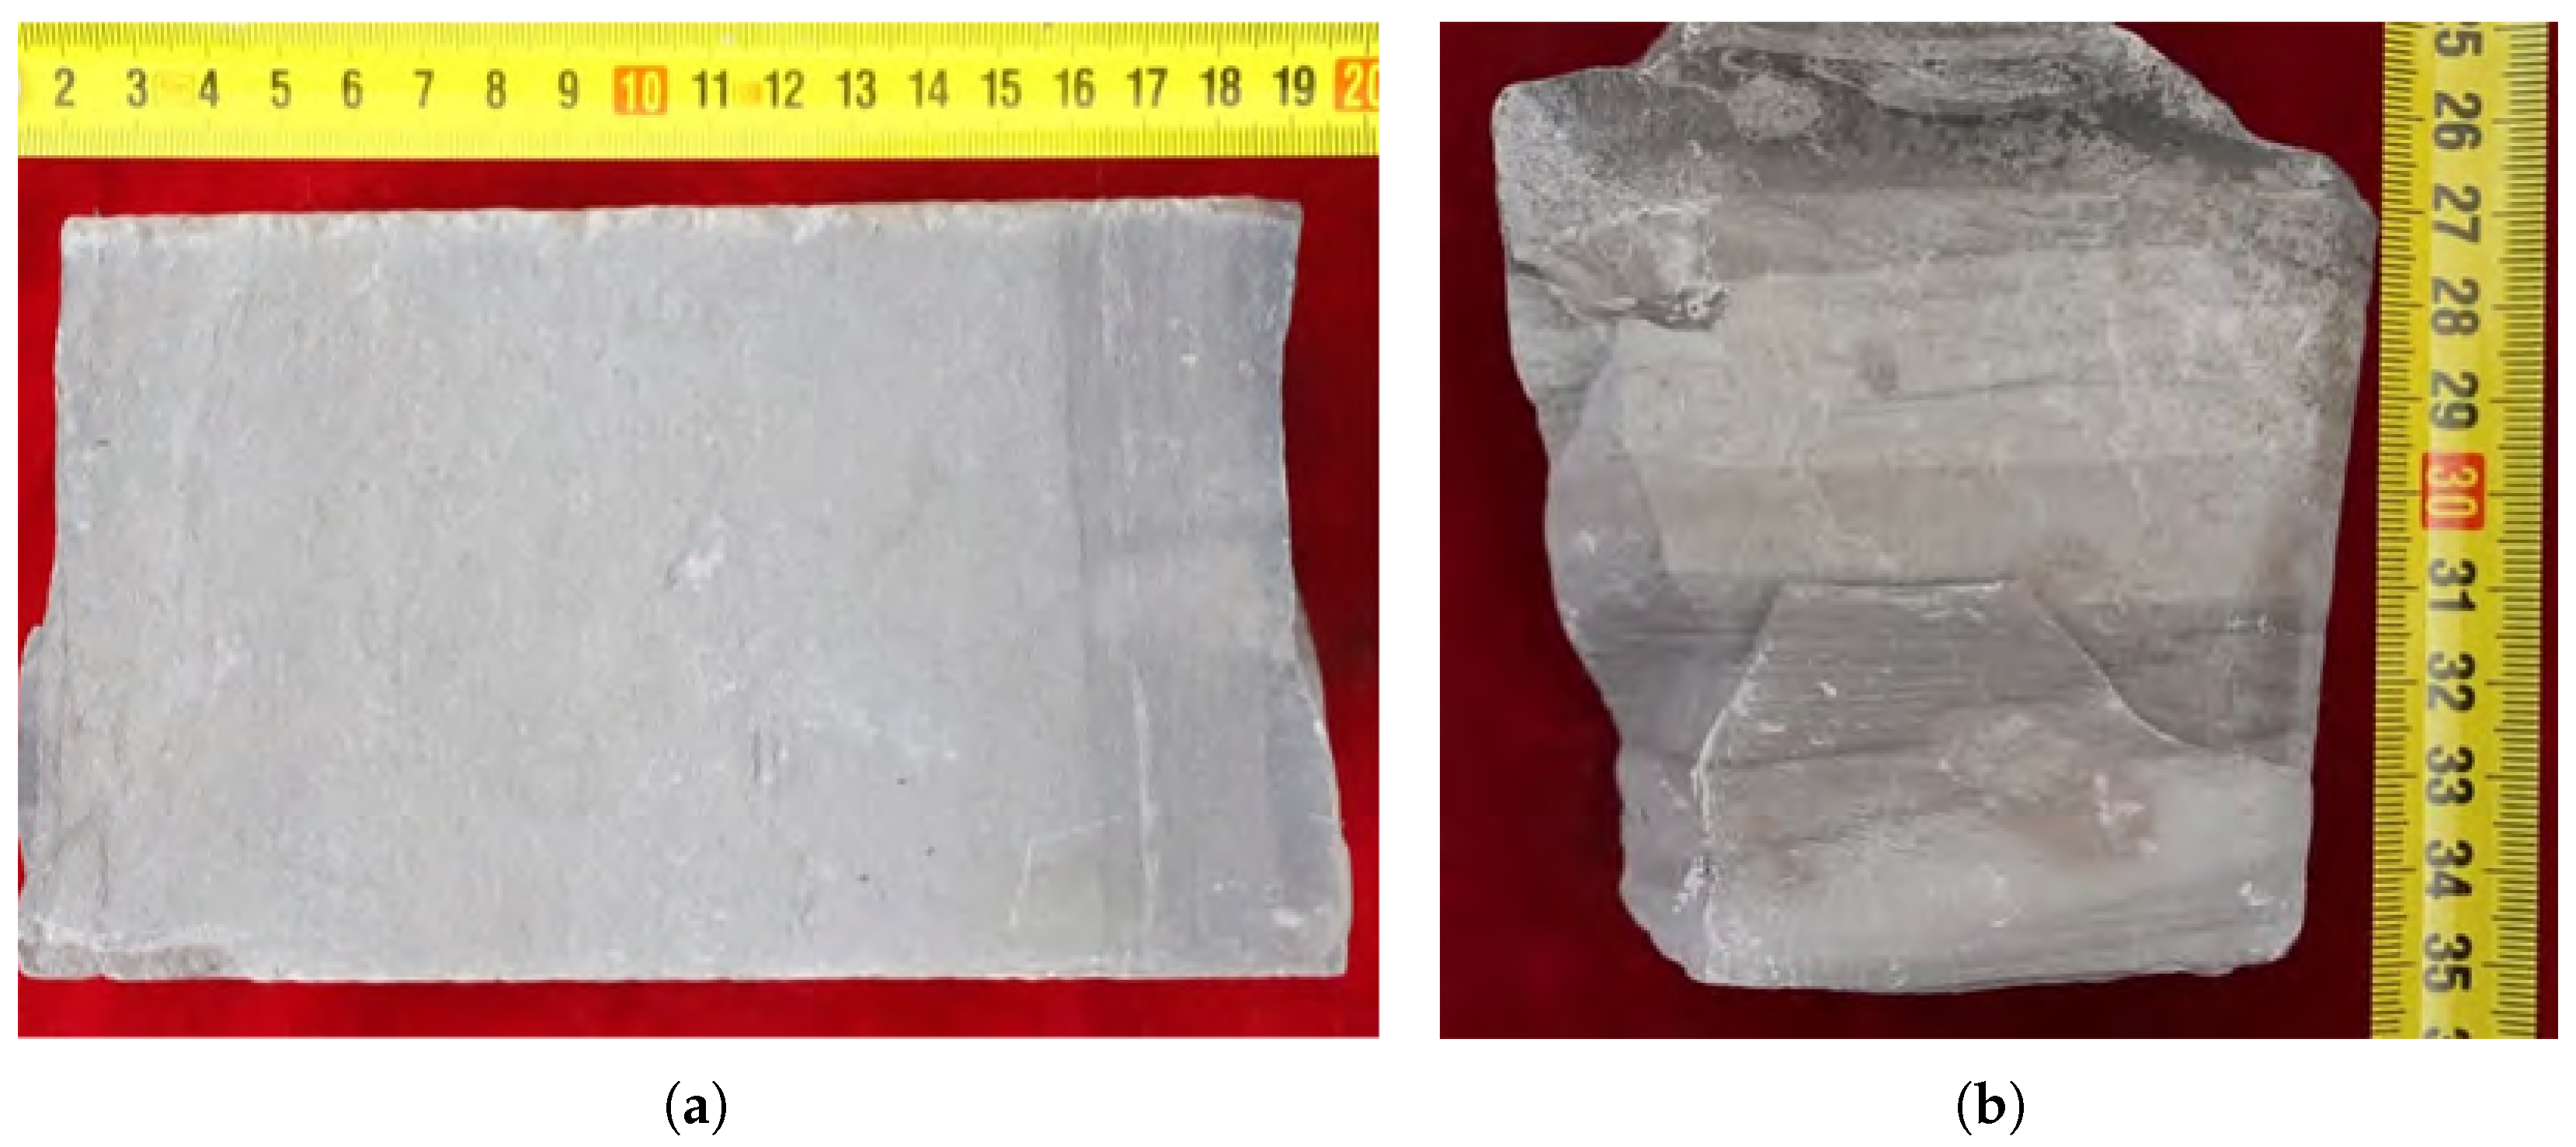
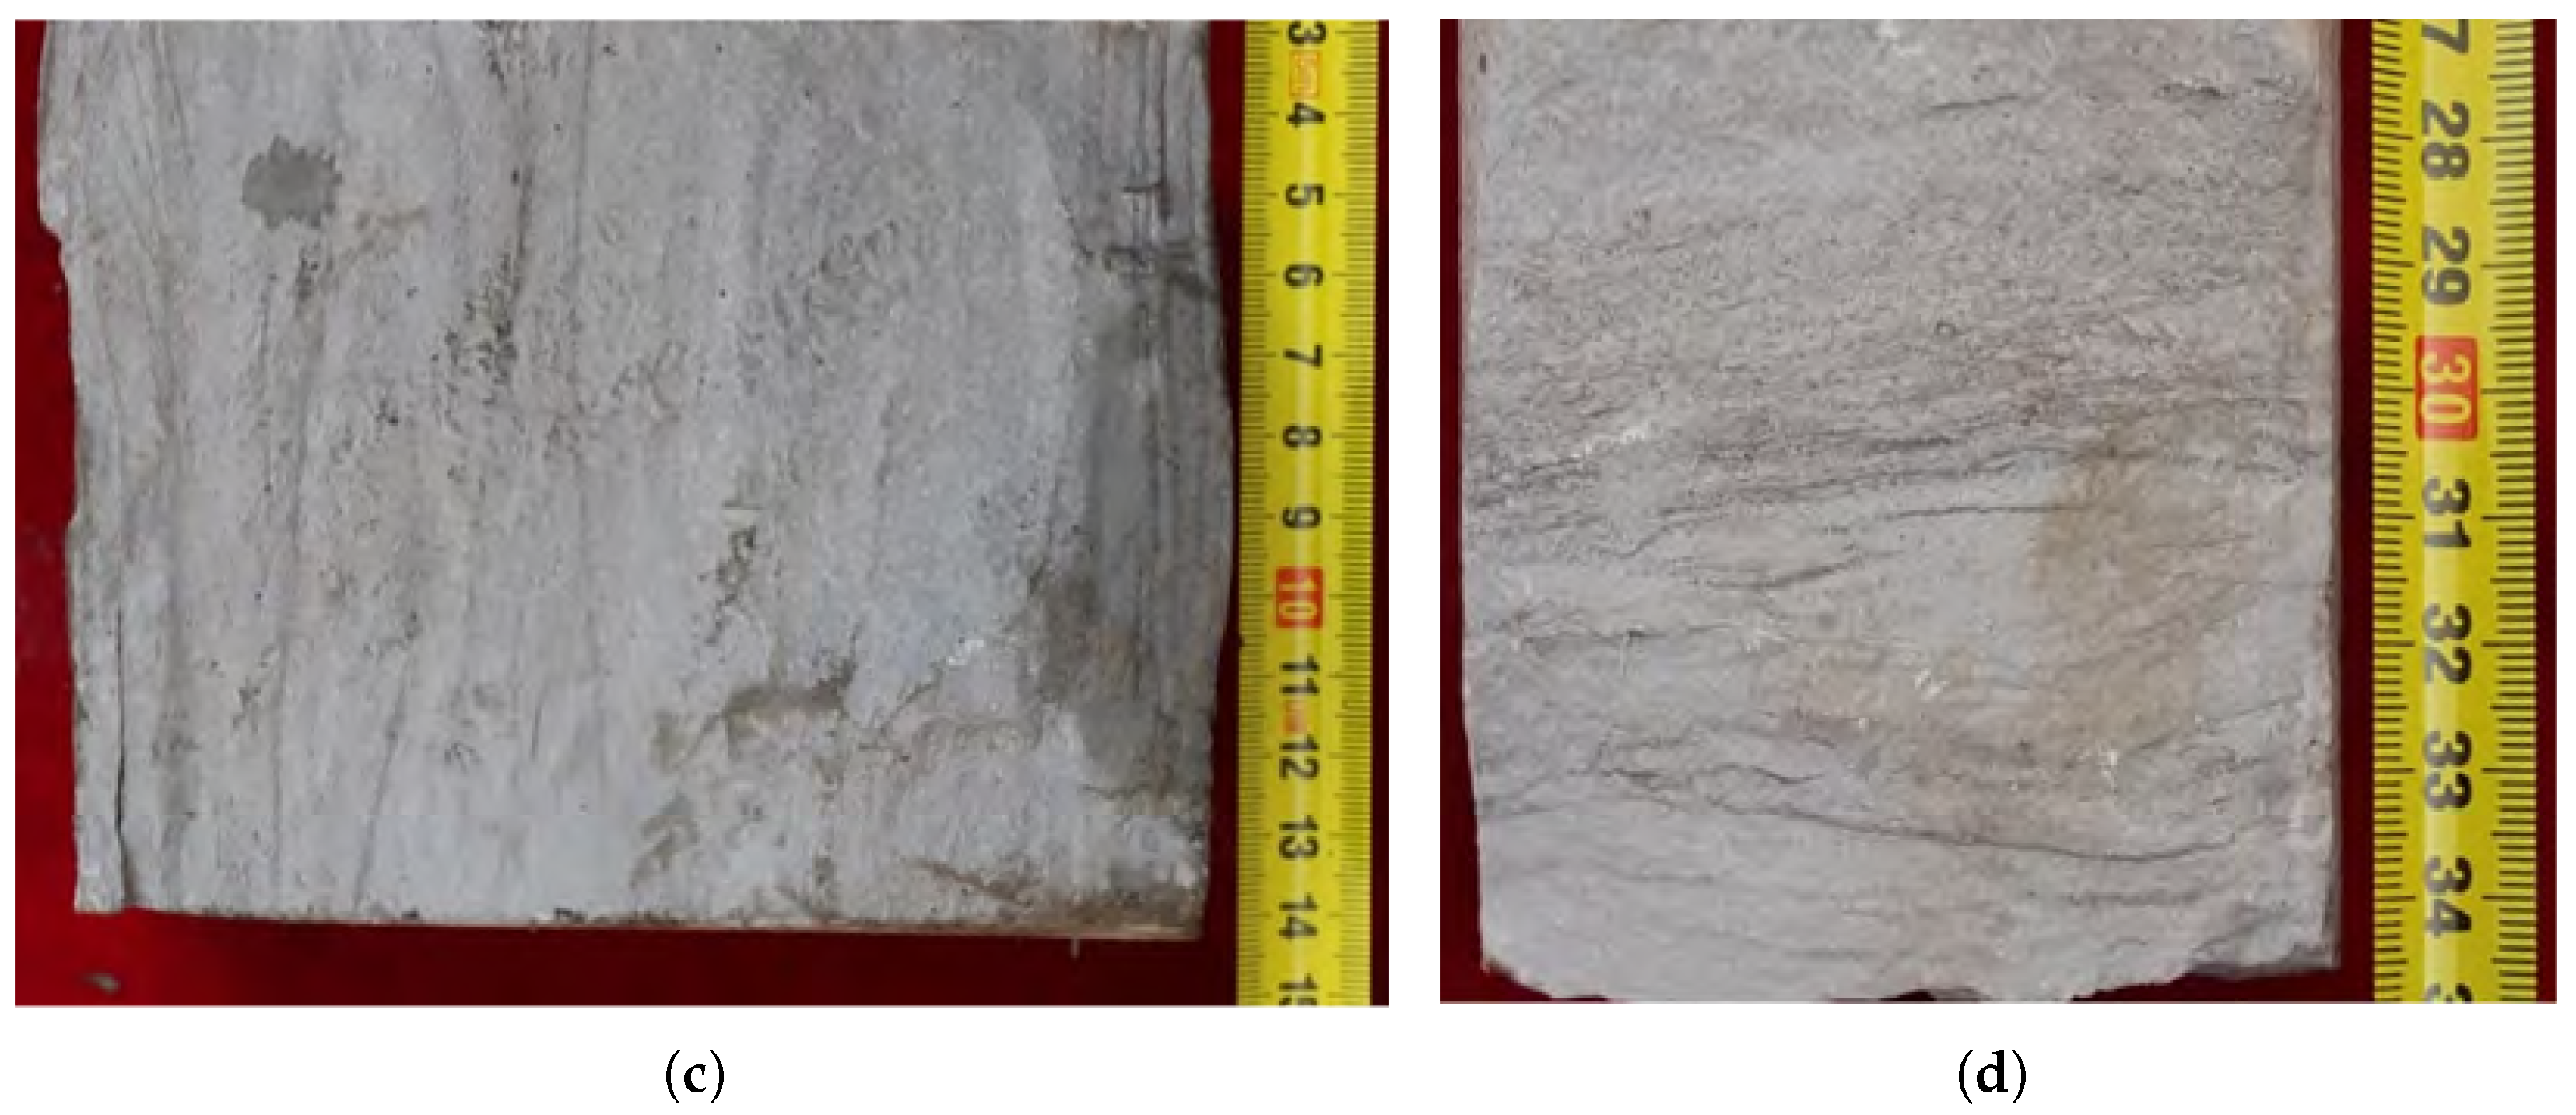
LF-E: Layered siltstone. LF-E developed mainly in the delta-front well blocks of B88, B28, and B8G. The cores were light gray to grayish white with individual bed thicknesses predominantly >20 cm. Felsic minerals dominated, with minor ostracod-bearing fossil material locally present. Sedimentary structures included convolute lamination, ripple lamination, climbing ripple lamination, trough cross-bedding, bidirectional cross-bedding, and ball-and-pillow and fluid escape structures. Oil staining, oil spots, or fluorescence are locally observed, with a TOC < 1%. Representative samples included well B88 at 2544.4 m (inverse grading), well B8G at 2249.92 m (climbing ripple lamination), and well B8G at 2234.15 m (climbing ripple lamination with trough cross-bedding).
LF-F: Layered fine sandstone. LF-F was closely associated with LF-E and exhibited a similar assemblage of sedimentary structures, differing primarily in grain size, with fine sand-grade grains exceeding 50%. Bidirectional cross-bedding, parallel lamination, and wavy lamination were well developed, with a TOC < 1%.
LF-G: Layered ostracod-bearing limestone. LF-G occurred locally in the C8, B28, and B8G P1-2 well blocks, predominantly as thin interbeds (<20 cm per layer) within dark mudstone-shale or light-colored sandstone. The ostracod content was ≥50% with minor argillaceous material; ostracods occurred as complete valves or fragments. Massive bedding, graded bedding, convolute lamination, and ball-and-pillow and fluid-escape structures were developed, with erosional surfaces commonly observed at the base, with a TOC < 1%.
LF-H: Layered dolostone. LF-H occurred locally as thin interbeds within dark shale, observed primarily in well T1 in this study. The cores were grayish white to gray and dominated by microcrystalline dolomite with minor argillaceous material. Individual beds were mostly <20 cm thick and displayed massive structures with sharp lower contacts. A slow effervescence reaction with dilute hydrochloric acid was characteristic, with a TOC < 1%. The representative sample was well T1 at 2284.5 m.

4.2. Quantitative TOC Statistics and Maceral Composition by Lithofacies

Building on the lithofacies identification presented above, this section quantitatively characterizes the lithofacies–organic matter enrichment relationship from three perspectives—the overall TOC distribution, inter-block and inter-subunit variations, and maceral composition—thereby providing the data foundation for the subsequent mechanistic discussion and log-based prediction modeling.
As shown in Table 2, the lithofacies type exerted first-order control on the TOC distribution. The mean TOC decreased systematically from LF-A (3.18%, deep lake setting) through LF-B (2.18%, semi-deep lake setting) and to LF-C (1.32%, silt-bearing laminated setting); all LF-A samples exceeded TOC = 2%, and approximately half of the LF-B samples exceeded this threshold. The five low organic matter lithofacies from LF-D to LF-H consistently yielded a TOC < 1%. Across the 123 measured samples from the study area, the overall mean TOC was 1.82% with a maximum of 5.12%; the samples with TOCs > 2% accounted for 47.2% (58/123) of the dataset, placing the interval as a whole within the high-quality source rock category.
Table 3 reveals systematic variations in both the areal and vertical dimensions. Areally, the mean TOC for Y1–Y3 combined increased from 1.65% in the southern Q block to 2.74% in the northern TH block, reflecting progressive attenuation of terrigenous dilution and intensification of organic matter enrichment along the transect from the delta-front to the deep lake center. Vertically, the general trend of Y3 > Y2 > Y1 was consistent with the well-established concept that organic matter enrichment peaks during the maximum flooding interval of a transgressive systems tract. Applying the evaluation criteria noted in the table, the TH and Y blocks as a whole satisfied hte Class I mudstone-shale standards, while the Q block satisfied Class II standards.
The maceral identification results (Table 4) show that the total liptinite was ≥65% in all six samples, consistent with Type I–II kerogen dominated by algal and aquatic organic matter. Terrestrially derived inertinite and vitrinite were generally low (mostly <10%), with the exception of sample CY-11 from well C8, where inertinite reached an anomalously high 34.20%, attributable to lateral influence from a deltaic provenance. Systematic differences in algal assemblages were evident across depositional settings; the well T1 samples (deep lake; T1-47, T1-53) were dominated by telalginite with subordinate lamalginite; the well C8 samples (semi-deep lake; CY-11, CY-35) showed an overall lower algal content with liptodetrinite bieng dominant; and the well B28 samples (delta front; B28-24, B28-36) were overwhelmingly dominated by lamalginite (75.80%–79.80%). Statistically, the combined abundance of algal macerals (lamalginite + telalginite) and liptodetrinite was strongly positively correlated with the TOC ( R 2 = 0.88 ), confirming that liptinite was the principal hydrocarbon-generating precursor in the study area.
The measured R o values from the 75 wells ranged from 0.34% to 1.38% (mean = 0.94%). Within this range, the T1 well interval at 2286–2370 m yielded a mean R o of 1.31%, and the B28 well interval at 2346–2469.7 m yielded 1.15%, reflecting a systematic increase in thermal maturity toward the central depression. Shale oil was preferentially enriched in the 2000–2500-m depth range (corresponding to R o = 0.8%–1.1%). The thermal maturity values across all well blocks were tightly clustered and mutually comparable (Table 5), providing a consistent baseline for the integrated lithofacies–organic matter enrichment study.

4.3. Vertical Distribution of Lithofacies

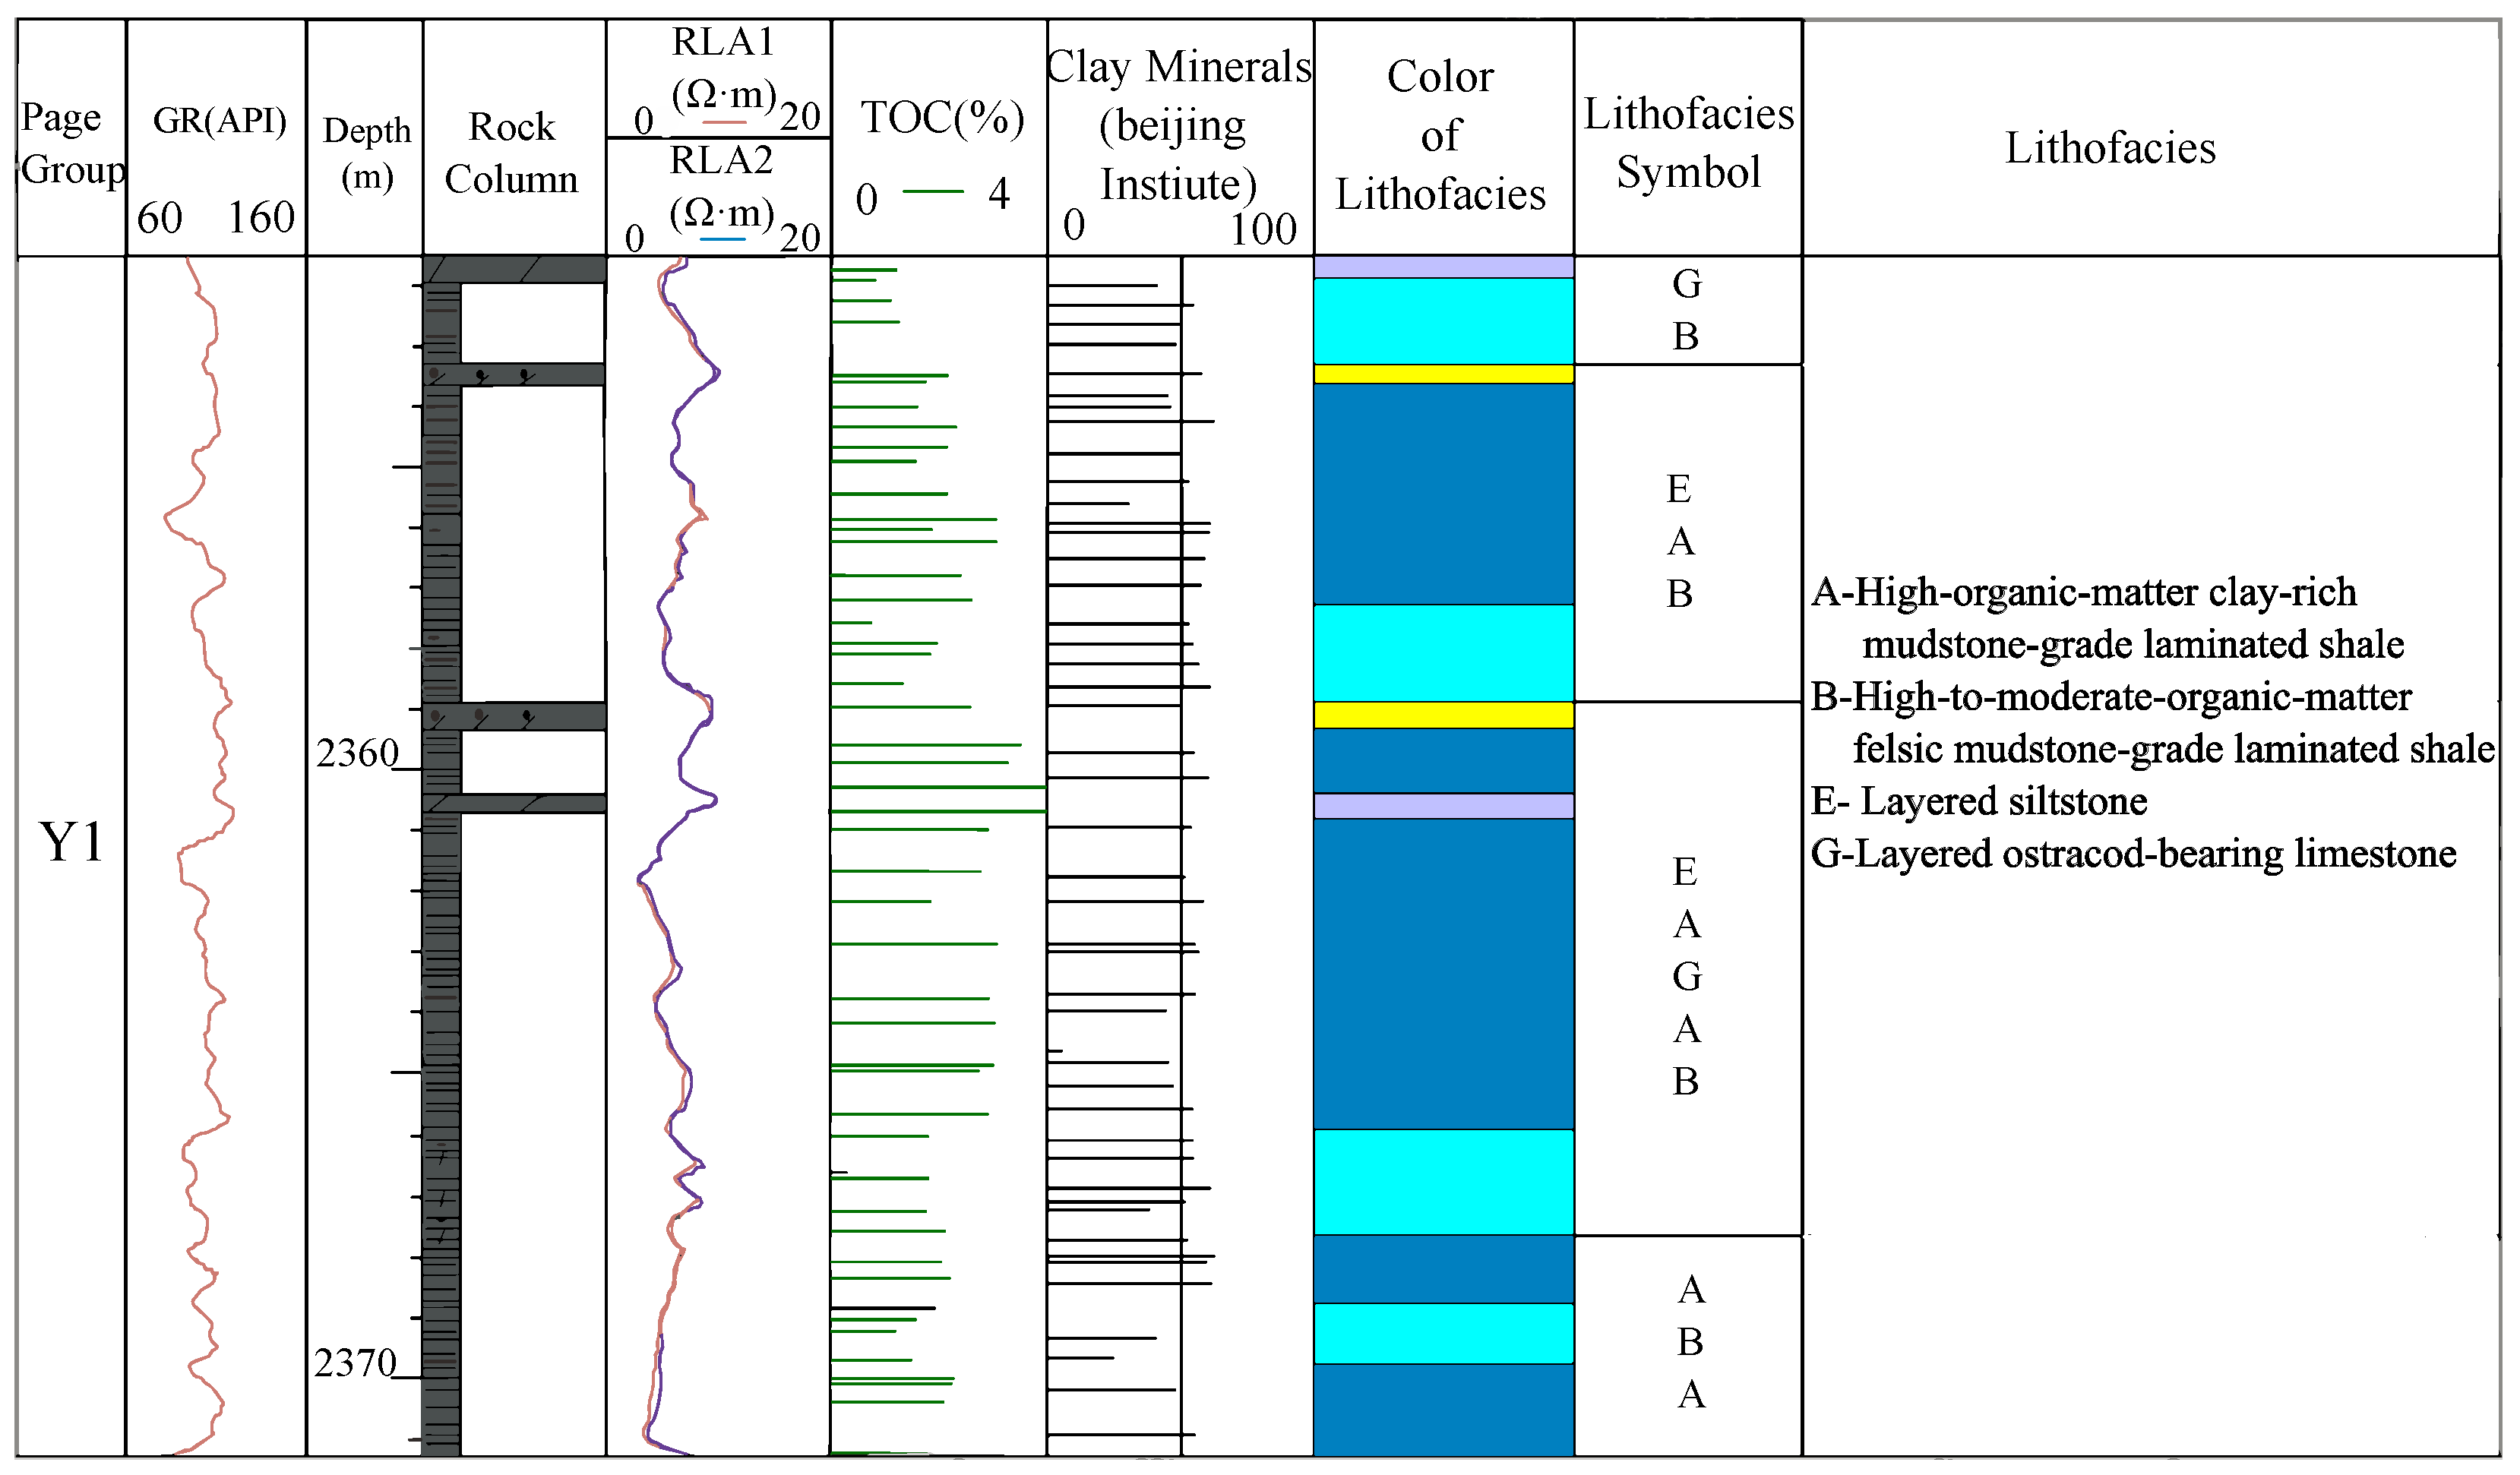
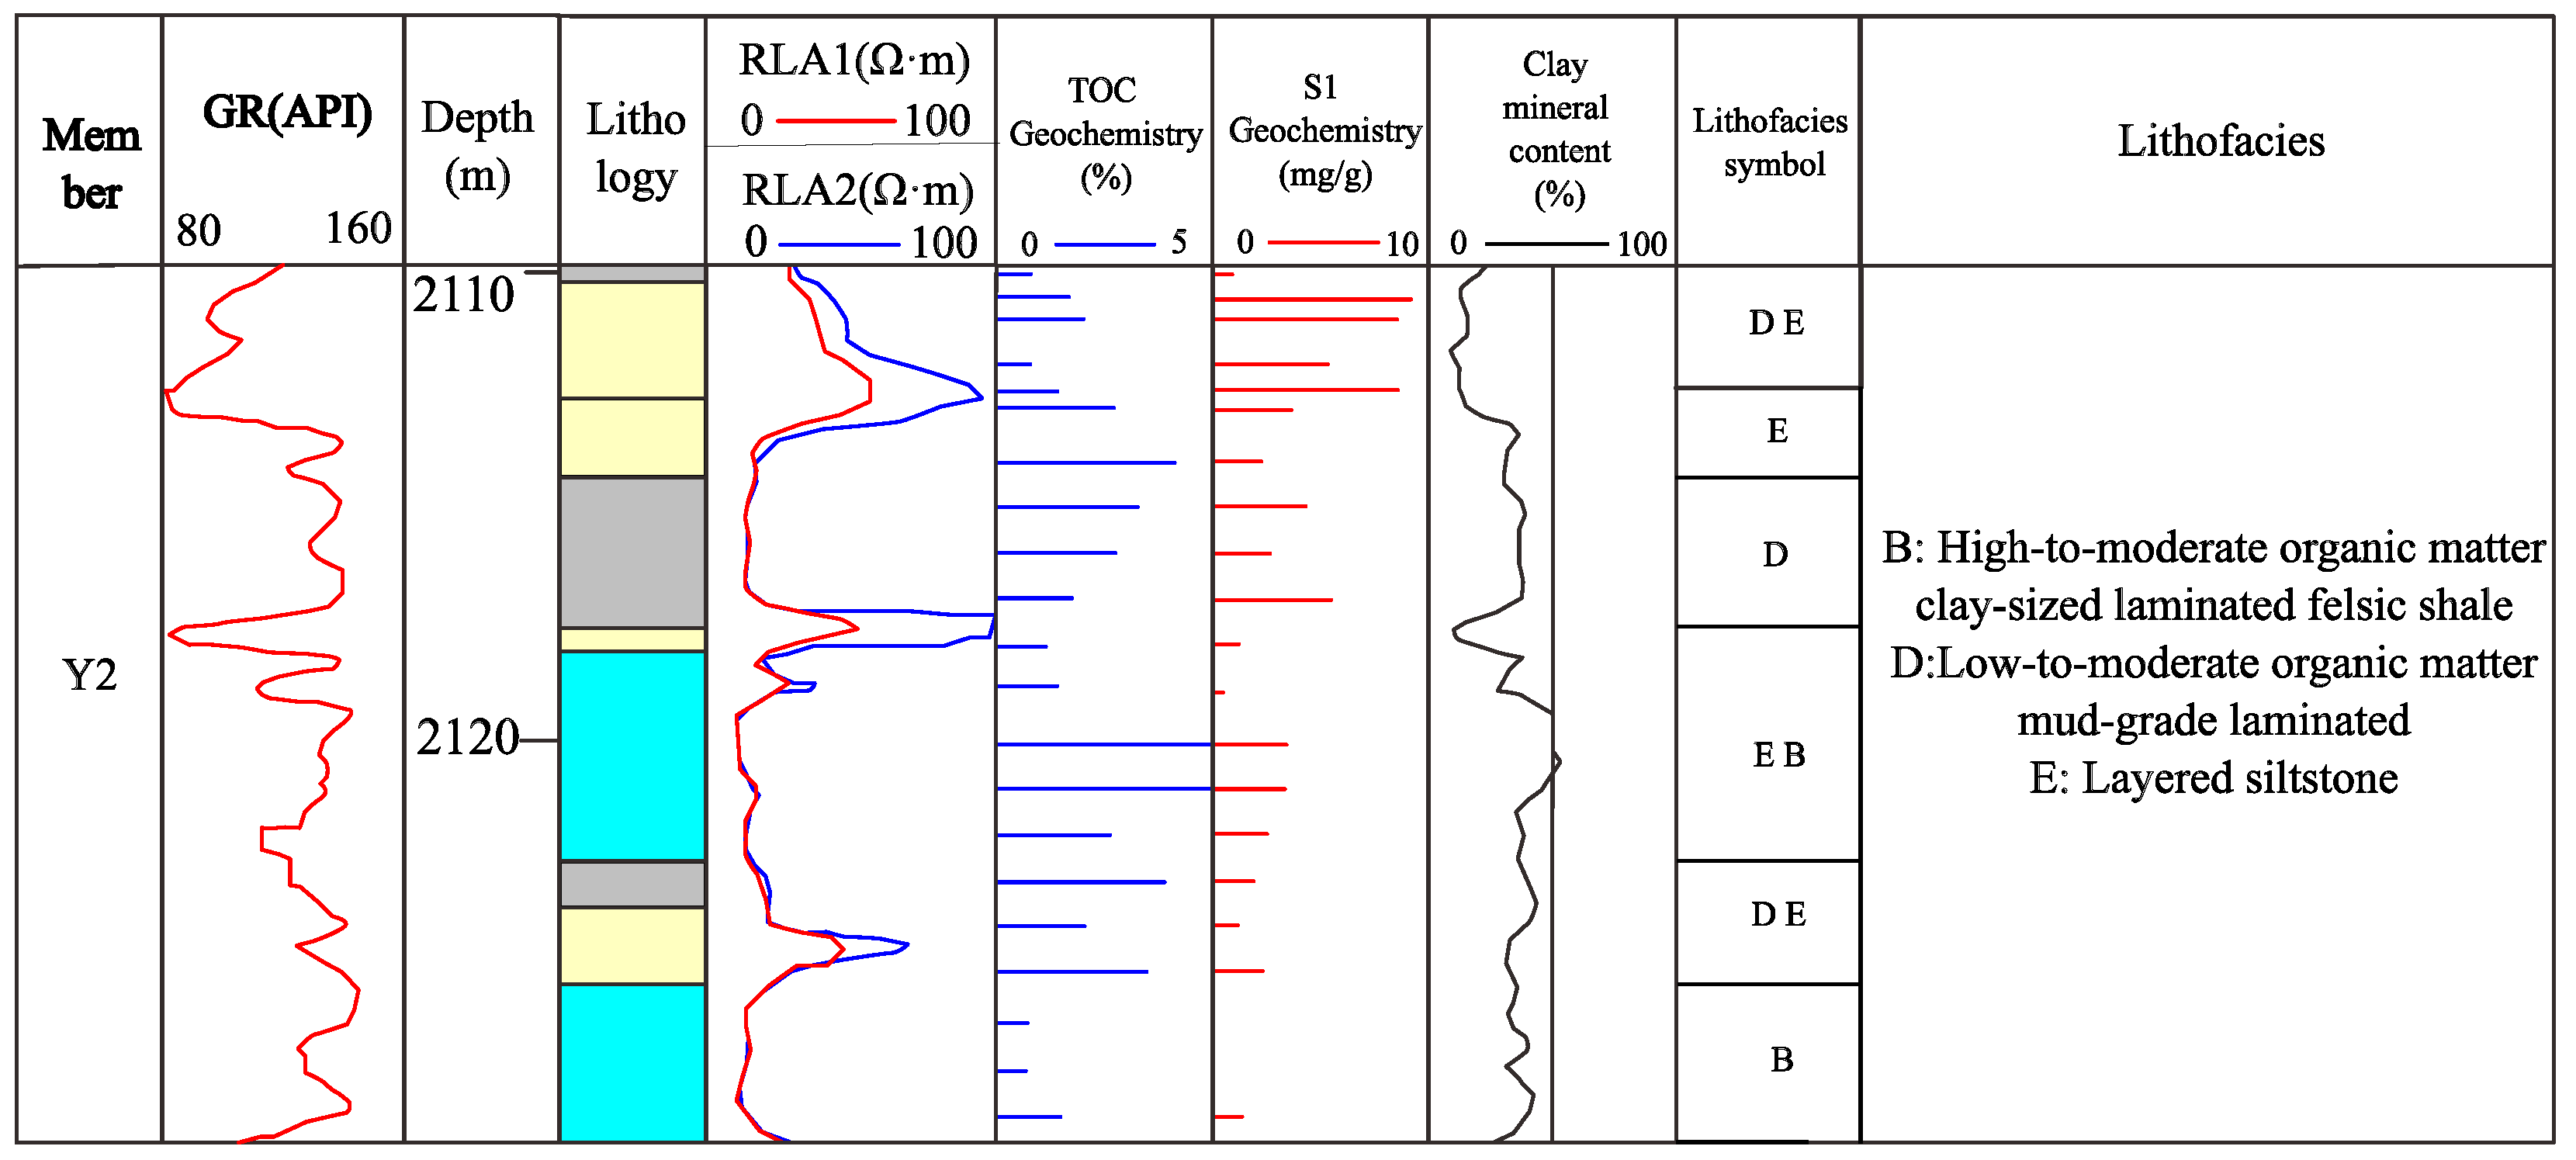
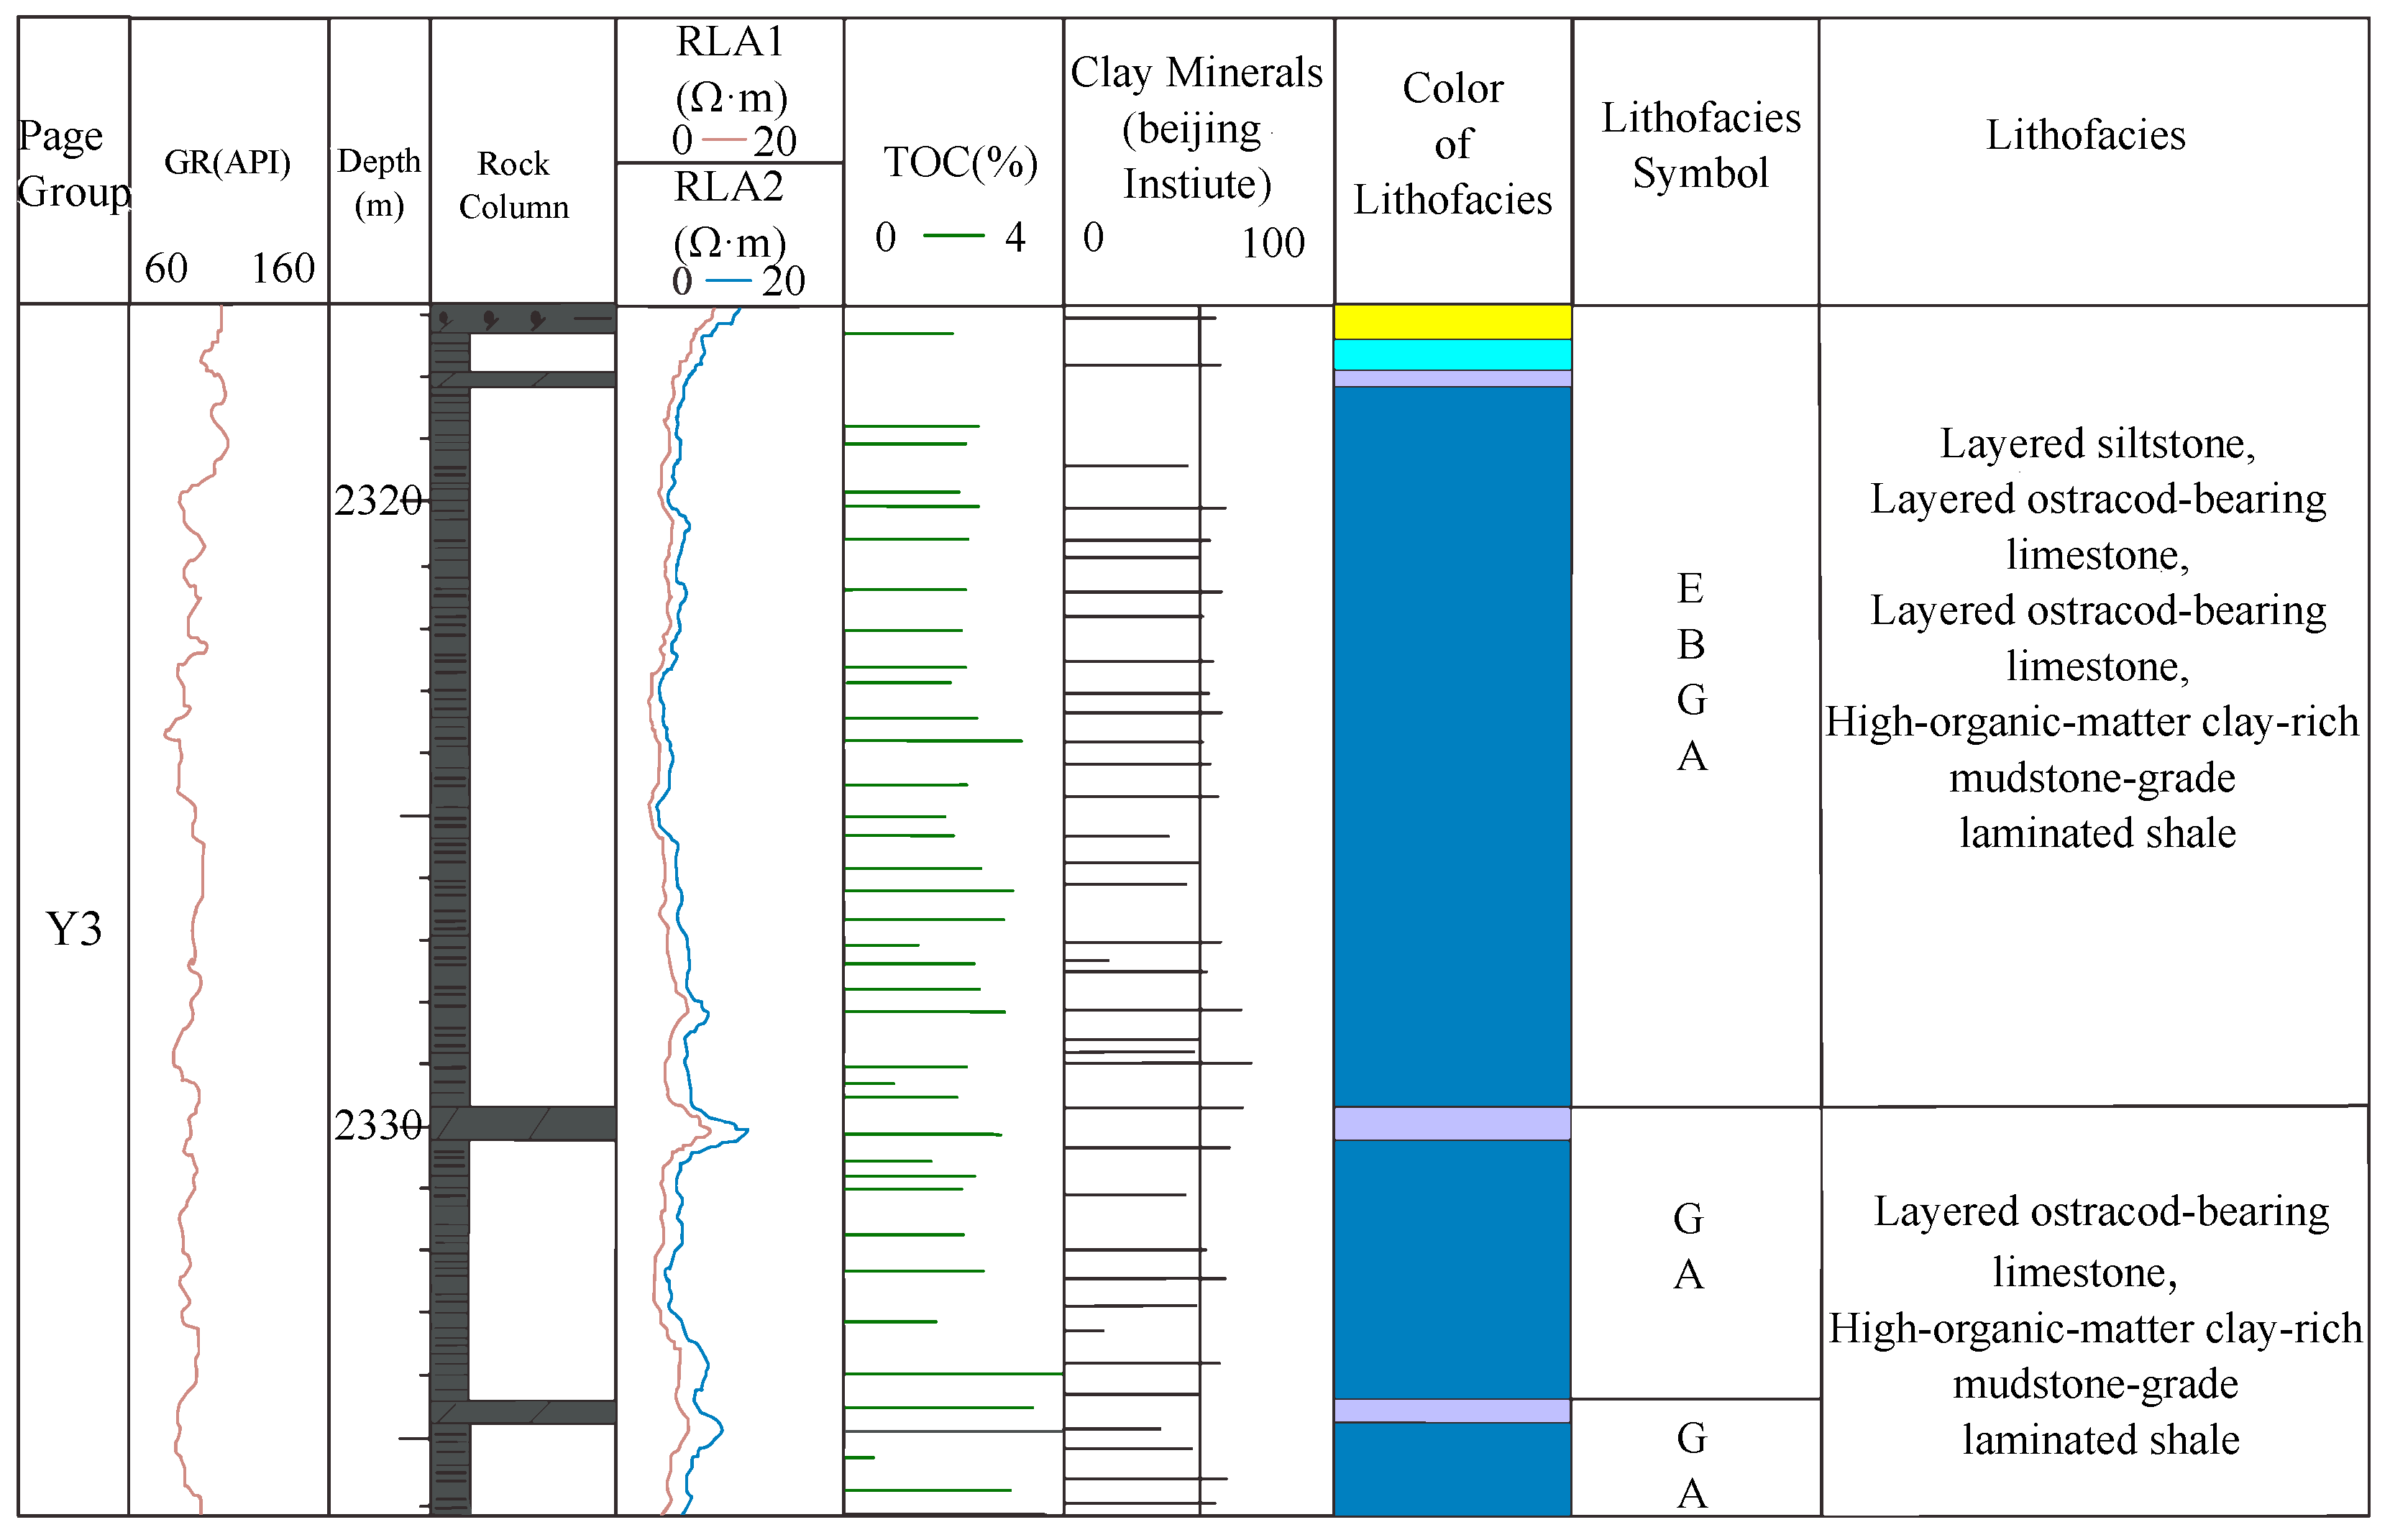
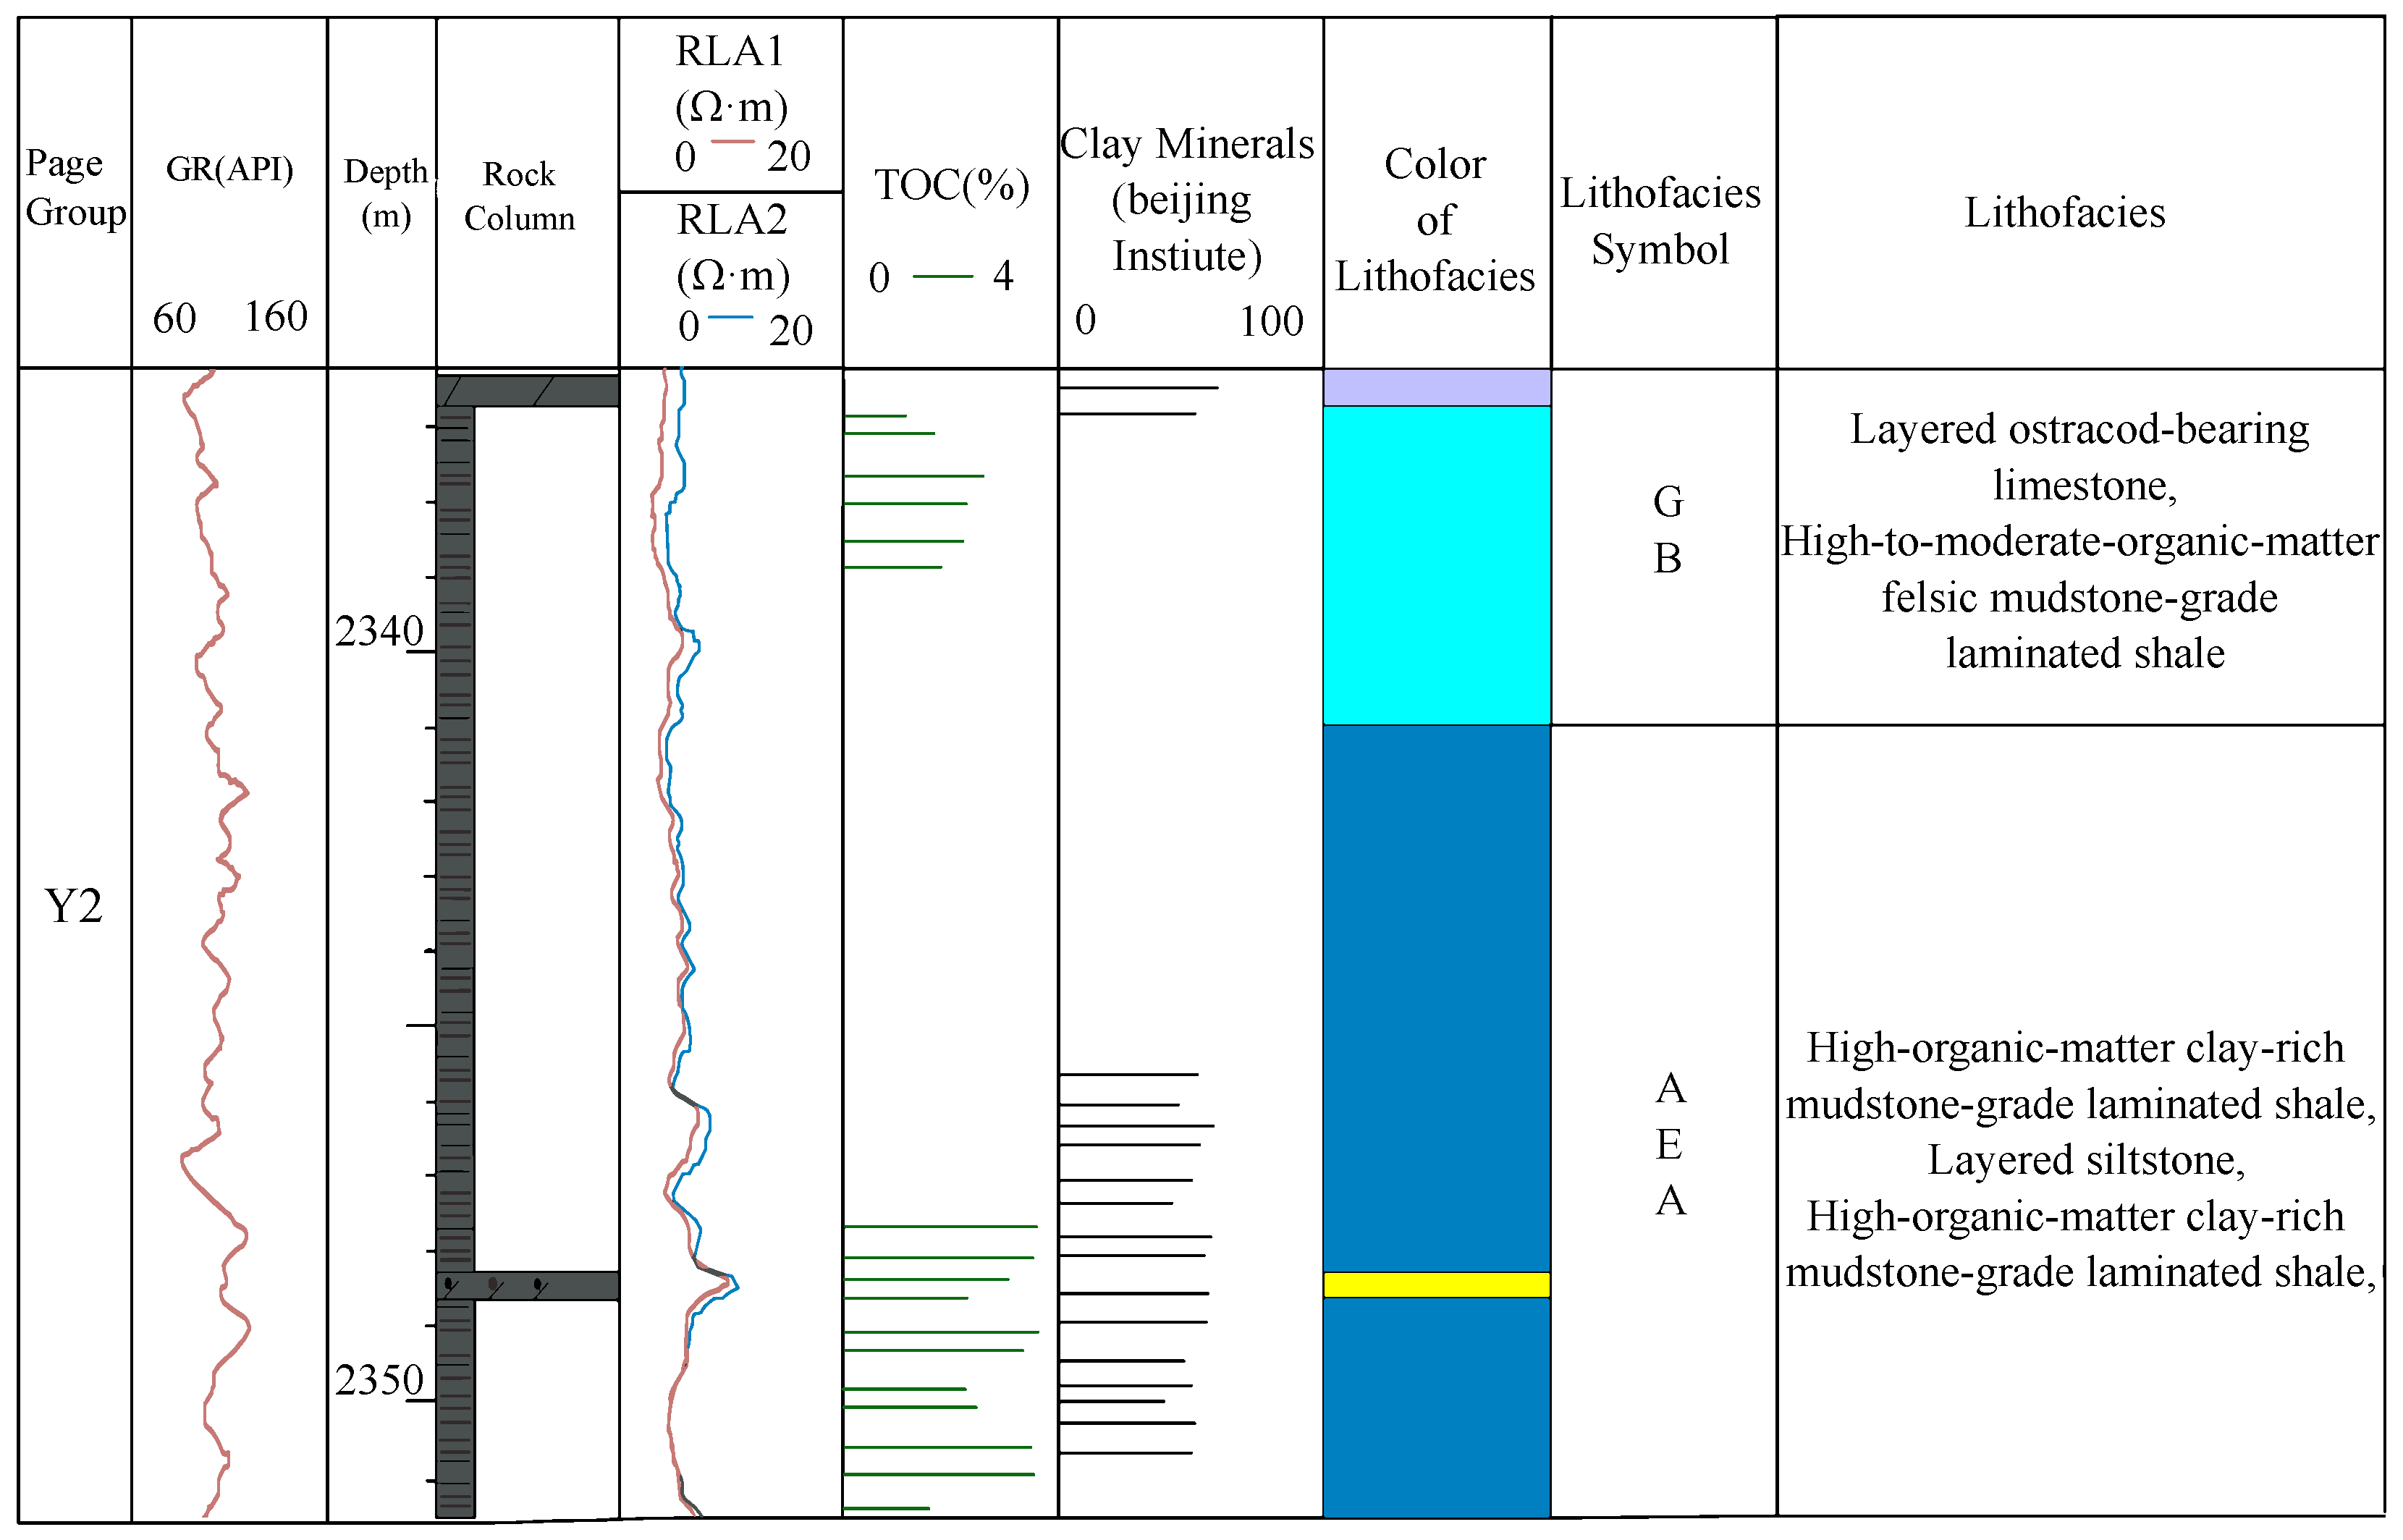
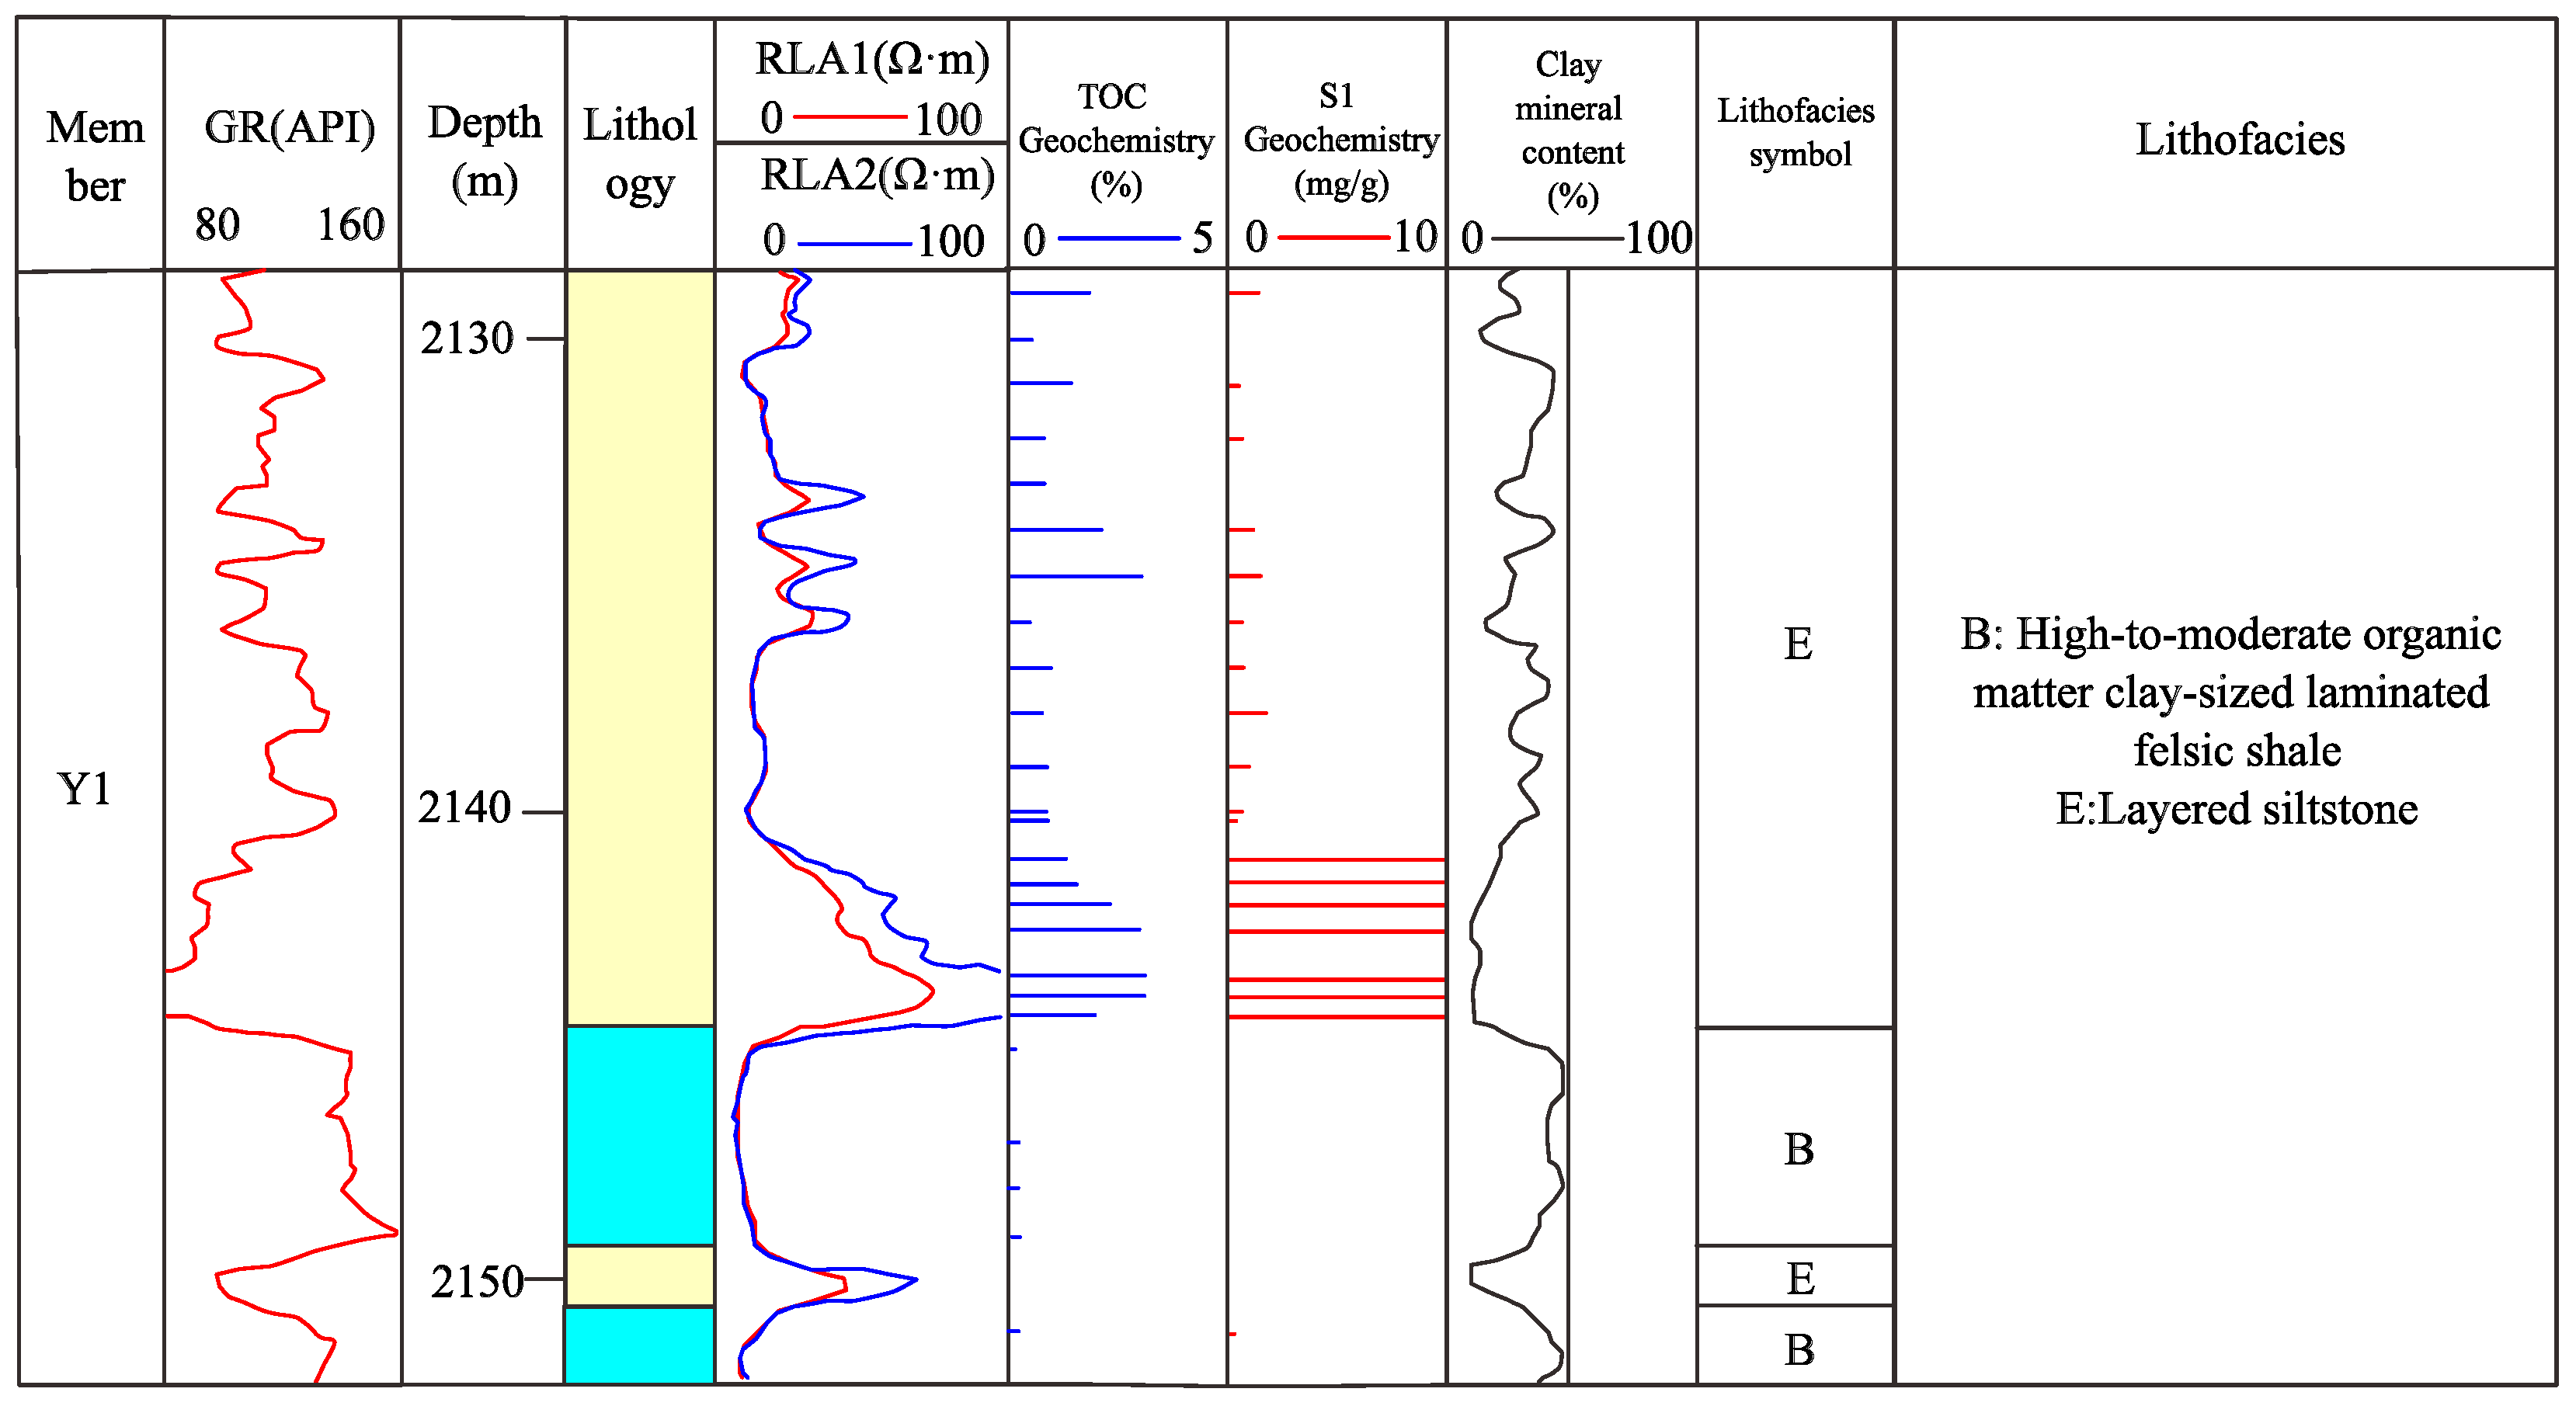
The vertical distribution of lithofacies exhibited pronounced systematic variations closely coupled with the sequence stratigraphic framework. Well T1 in the TH block provided a complete vertical evolutionary sequence of lithofacies across the Y1, Y2, and Y3 subunits of K2qn1 (Figure 11, Figure 12 and Figure 13).
The Y1 subunit (2359.6–2367.6 m) was characterized by interbedded LF-A and LF-B, with LF-A thicknesses of 0–2 m and LF-B of 8–12 m. The mean TOC was 2.31%, and the oil saturation was relatively low. The dominance of felsic shale and frequent clastic input in this subunit reflects an unstable deep lake environment during the early transgressive stage.
In the Y2 subunit (2338.6–2357.2 m), the thickness of LF-A increased to 5–8 m and LF-B to 10–15 m, with a marked rise in the proportion of LF-A. The mean TOC increased to 3.34%, accompanied by improved oil saturation. Continuous lake deepening and a reduced clastic supply enhanced the conditions for organic matter enrichment.
The Y3 subunit (2327.5–2335.3 m) was dominated by LF-A, with thicknesses of 10–15 m, while LF-B decreased to 5–8 m. The mean TOC was 2.83%. This subunit represents the maximum extent of the deep lake environment, in which clay mineral suspension settling predominated and the felsic input reached its minimum. From Y1 to Y3, the cumulative thickness of organic-rich lithofacies expanded from approximately 10 m to approximately 25 m, an increase of approximately 1.5 times within the transgressive systems tract. The markedly greater thickness and mean TOC of organic-rich lithofacies in Y2 and Y3 relative to Y1 clearly demonstrate the first-order control of lithofacies assemblage on organic matter enrichment.
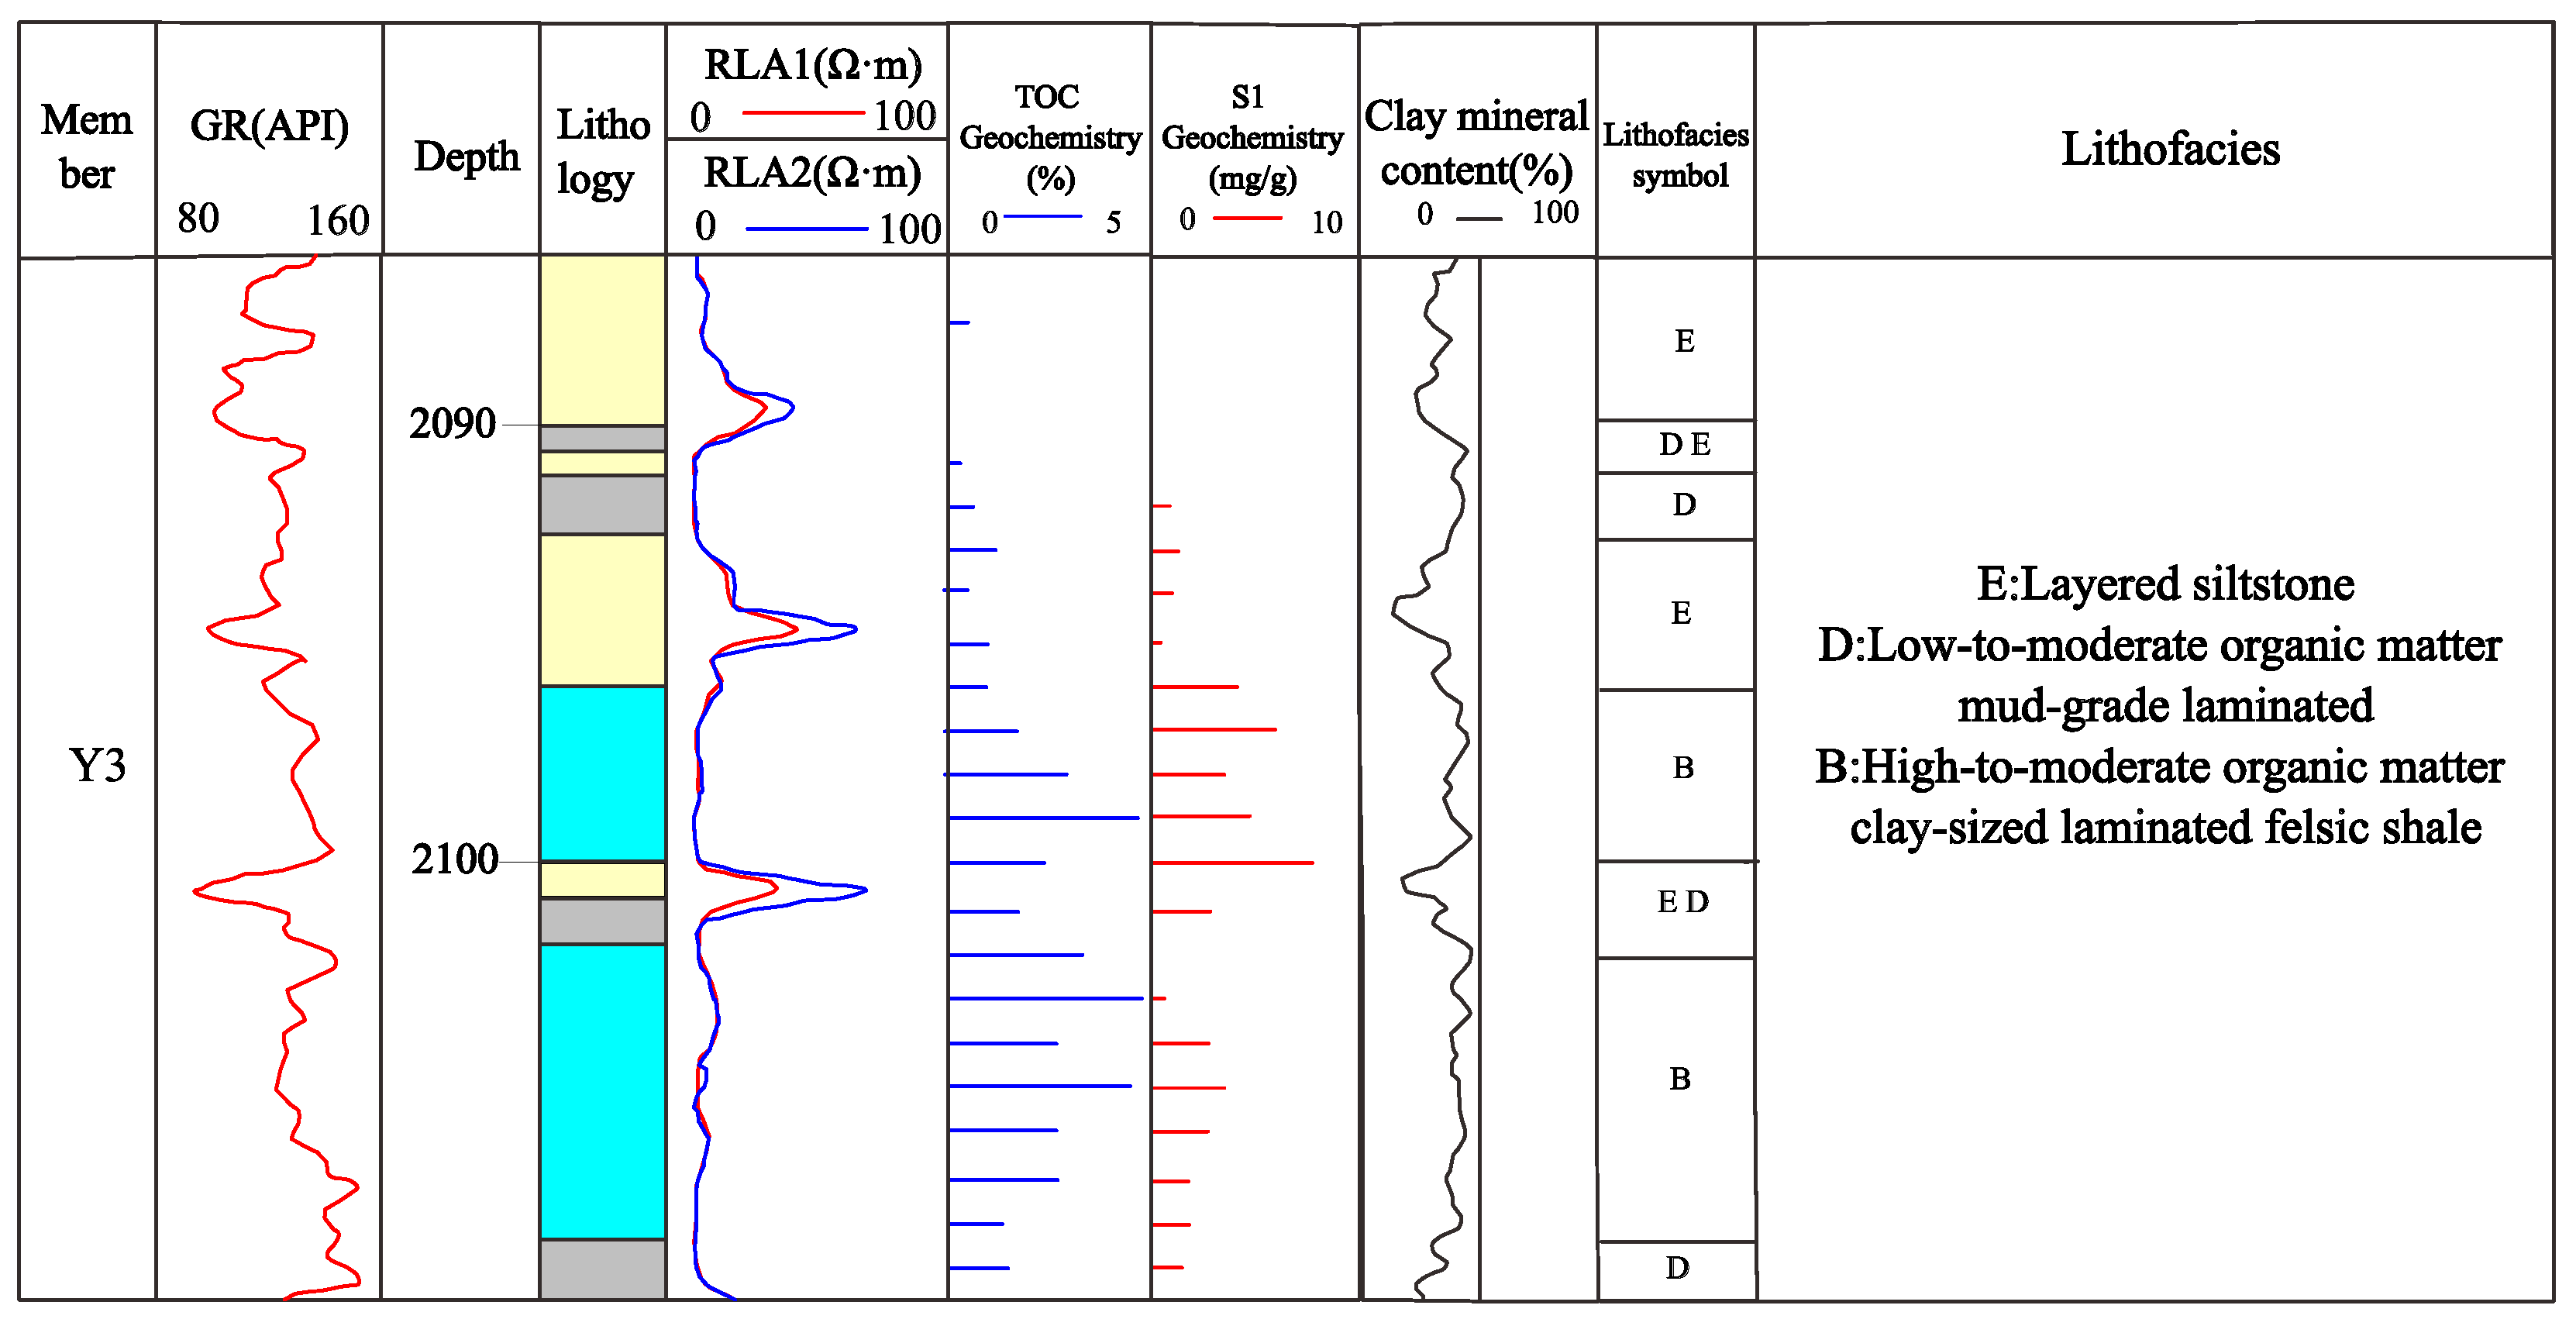
In marked contrast, well B28 in the Q block displayed a distinctly different vertical lithofacies distribution (Figure 14 and Figure 15). Subunits Y1 through Y3 were dominated by LF-B, with localized interbeds of LF-E and LF-D; LF-A appeared only sporadically at the top of Y3. The mean TOC across Y1–Y3 was merely 1.65%, substantially lower than in the TH block. Situated at the delta-front to semi-deep lake transition, this well experienced a sustained clastic supply and unstable low-energy bottom water conditions, both of which suppressed organic matter enrichment. The inter-well contrast demonstrates that the lithofacies type and its vertical assemblage constitute effective proxies for predicting the degree of organic matter enrichment.
The vertical lithofacies distributions of well B28 for the Y1 and Y2 subunits (Figure 15 and Figure 16, respectively) will be further discussed in Section 5.3 in the context of the three-factor analysis of paleoproductivity, preservation conditions, and terrigenous dilution.

5. Discussion

5.1. Comparison with Previous Lithofacies Classification Schemes

The deep lake to semi-deep lake lithofacies assemblage identified in the southern Songliao Basin broadly corresponds to the scheme proposed by Liu et al. [9] for the Gulong Sag, but regional differences are pronounced; the thickness of LF-A in the study area (5–10 m) was markedly less than in the Gulong Sag (>15 m), reflecting the comparatively smaller areal extent of the maximum flooding surface in the southern depression [9,15]. Compared with the study by Du et al. (2023) in the Changling Sag, the paleosalinity reconstructed for the study area (>8‰) was substantially higher than the values reported for the Changling Sag (4–6‰), a difference potentially attributable to the stronger basin confinement and more pronounced evaporative concentration in the southern depression [11,12,34].
Regarding the classification parameters, Cai et al. [14] and Liu et al. [15] relied primarily on mineral ternary diagrams, whereas this study incorporated the TOC directly into the lithofacies naming system, enabling a more immediate link to shale oil sweet spot evaluation [4,9]. Recent studies by Hou et al. [16] and Zhao et al. [10] emphasized machine learning approaches; by contrast, this study adopted a dual-track nomenclature combining depositional genetic attributes with organic matter abundance, coupled with regression and discriminant criteria, thereby preserving geological interpretability and facilitating back-tracing [4,6].
It should be noted that the TOC ranges of LF-A and LF-B partially overlapped (LF-A minimum = 2.32%, LF-B maximum = 4.27%); however, the two lithofacies were clearly distinguishable by mineral composition (clay-rich vs. felsic) and lamination style (planar and continuous vs. slightly wavy to discontinuous). The gradational TOC transition reflects the inherent continuum between deep lake and semi-deep lake depositional environments rather than any inconsistency in the classification criteria.

5.2. Predictive Significance of Lithofacies for TOC Distribution

The mean TOC decreased systematically from LF-A (3.18%) through LF-B (2.18%) to LF-C (1.32%), with LF-D–LF-H consistently below 1% (Table 2). This systematic variation is governed by depositional genetic attributes—lamination style, mineral composition, and grain size assemblage—rather than by the TOC itself [4,6]. This implies that lithofacies can be identified a priori on the basis of mineral composition and lamination characteristics alone, without invoking the TOC as a classification parameter. The TOC can then be extrapolated to uncored intervals through the established lithofacies–TOC statistical relationship [31,32], which constitutes the logical foundation of the log-based identification workflow described in Section 5.5 and is consistent with the statement of logical independence in Section 3.3.
The predictive significance of lithofacies for the TOC was further manifested in the multi-layered coupling among the log response, lithofacies, and TOC; the organic-rich lithofacies LF-A and LF-B shared a characteristic log signature of elevated AC, relatively reduced DEN, and moderately elevated GR levels (Table 2), forming recognizable threshold contrasts with LF-C–LF-H. This coupling renders lithofacies not merely a passive “container” of organic matter enrichment but a critical link connecting core observation, well log interpretation, and sweet spot evaluation.

5.3. Three-Factor Control: Paleoproductivity, Preservation Conditions, and Terrigenous Dilution

The K2qn1 interval in the study area recorded a classic transgressive systems tract evolutionary sequence from Y1 to Y3, and the cumulative thickness of organic-rich lithofacies expanded from approximately 10 m to approximately 25 m, while the mean TOC increased from 1.42%–2.31% in Y1 to 1.63%–2.83% in Y3. This differentiated enrichment pattern along the transgressive sequence is governed by the superimposed effects of three factors: paleoproductivity, preservation conditions, and terrigenous dilution.
During Y1 (early transgression), tectonic subsidence combined with semi-arid-to-semi-humid climatic conditions maintained a freshwater-to-brackish delta outer-front to semi-deep lake setting in the Q block. Abundant terrigenous clastic input disrupted bottom-water anoxia, resulting in relatively low TOCs (mean of 1.42%–2.31%). The Y and TH blocks, less affected by the clastic supply and characterized by greater water depths, achieved TOC values of 2.09%–2.31%.
During Y2 (mid-transgression), the outer delta-front retreated, paleosalinity transitioned from freshwater-brackish to brackish-saline, and redox conditions intensified. Lake productivity reached moderate-to-high levels, and salinity stratification further strengthened bottom-water anoxia. The TOC across the study area was systematically higher than in Y1 (mean of 1.84%–3.34%) [8,35,36,37].
During Y3 (maximum flooding), semi-deep lake to deep lake facies were extensively developed. The synergistic effects of peak algal productivity, strongly anoxic saline bottom waters, and minimum terrigenous dilution drove the cumulative organic-rich lithofacies thickness to its maximum (approximately 25 m) and the TOC to its highest values across the study area (mean of 1.63%–2.83%) [6,9,38].
These observations indicate that paleoproductivity—as reflected by algal proliferation—was the primary control on organic matter enrichment in the study area; paleoenvironmental conditions (paleosalinity and redox state) were the key modulating factors responsible for inter-block and inter-subunit enrichment differentiation; and terrigenous dilution exerted a pronounced suppressive effect on organic matter enrichment in the Q block during Y1, but it diminished substantially during the maximum flooding stage of Y3.

5.4. Multi-Proxy Cross-Validation of Paleoenvironmental Conditions

To improve the reliability of paleoenvironmental reconstruction, this study employed a multi-proxy cross-validation approach rather than relying on any single geochemical ratio. Paleosalinity was assessed primarily from the boron content using the Adams formula [39,40], with B/Ga and Sr/Cu ratios used for cross- validation [34]; the Sr/Ba ratio was not used in isolation, given its well-documented susceptibility to provenance, grain size, and diagenetic overprinting in lacustrine settings, which can generate false signals [34]. Paleoredox conditions were evaluated by cross-referencing three proxies—V/(V + Ni) [41], Th/U [42,43], and U/Th—using the discrimination thresholds of Tribovillard et al. [44] and Algeo and Tribovillard [45], where V/(V + Ni) > 0.84 indicates strongly anoxic to euxinic conditions, 0.60–0.84 indicates anoxic conditions, and <0.60 indicates oxic conditions. while Th/U < 2 indicates anoxic conditions, 2–7 indicates weakly oxic conditions, and >7 indicates oxic conditions. Paleoproductivity was assessed from the Ba/Al and Cu/Al [38], supplemented by Cu-EF and Ni-EF for organic matter flux estimation [44,45]. Paleoclimate was reconstructed jointly from Th/U, Sr/Cu, the Chemical Index of Alteration (CIA) [46], and Mg/Sr. The interpretations derived from these geochemical proxies were mutually cross-validated against sedimentary structures observed in the core, maceral assemblages (particularly the algal content), and the spatial distribution of lithofacies [6,44], thereby minimizing the potential bias inherent in single-proxy inference.
In well T1 (deep lake center), the paleosalinity across Y1–Y3 ranged from 5.66 to 13.67‰ (mean = 8.06‰), V/(V + Ni) = 0.75–0.97, and Th/U < 2 throughout, indicating a stable saline and strongly anoxic-to-euxinic depositional environment. Vertically, the paleosalinity and V/(V + Ni) increased synchronously from Y1 to Y3 while Th/U decreased, demonstrating that the water column salinity and reducing intensity strengthened progressively with lacustrine transgression.
In well B28 (delta front), the paleosalinity across Y1–Y3 ranged from 2.24 to 8.59‰ (mean = 5.10‰), V/(V + Ni) = 0.70–0.84, and Th/U = 1.16–4.13, reflecting a brackish-to-saline dysoxic-to-anoxic environment. The greater openness of the water body and higher degree of terrigenous mixing in this well block contrast markedly with conditions at the deep lake center.
Paleoclimate reconstruction indicated warm and humid conditions during Y1 deposition, followed by rising temperatures and increased precipitation at the base of Y2, in addition to alternating warm-humid to semi-arid conditions through the upper Y2 and Y3 intervals. This evolutionary trajectory is consistent with the global Cretaceous OAE backdrop of greenhouse climate, eutrophic water bodies, and intensified anoxia [13,18,19], indicating that the deposition of organic-rich mudstone-shale in K2qn1 was jointly controlled by global climate-oceanic events and regional lacustrine tectonic- paleogeographic conditions.
Paleobathymetric reconstruction based on the stratigraphic dip and isopach method [47] (Table 6) indicated a mean water depth exceeding 100 m across the study area during K2qn1 deposition, with a maximum of approximately 162 m along the T1–B18 transect. These results confirm that the TH block occupied the deep lake depocenter, in good agreement with the spatial distribution of lithofacies and the vertical trends of redox proxies documented above.

5.5. Log-Based Lithofacies Identification: Accuracy and Error Analysis

The key log parameters measured in well B28 are summarized in Table 7. Relative to the whole-well averages, the organic-rich mudstone-shale intervals were characterized by slightly elevated GR (122.09 API vs. a mean of 119.79 API), markedly elevated AC (279.49 μs/m vs. a mean of 258.5 μs/m), and slightly reduced DEN levels (2.583 g/cm3 vs. a mean of 2.561 g/cm3). Among the four log parameters, the TOC showed the strongest correlation with AC ( R 2 = 0.382 ), moderate correlations with RT and DEN ( R 2 = 0.106 and 0.070, respectively), and virtually no correlation with GR ( R 2 = 0.004 ), providing the rationale for selecting AC as the dominant discriminating parameter in the lithofacies identification criteria.
The log-based lithofacies identification results (Table 8) show that TOC prediction in calibration well B28 yielded R 2 = 0.86 with a mean relative error of 28.9%; the lithofacies identification accuracies in validation wells C8 and B8G P1-2 were 64.6% and 75.4%, respectively, with near-100% accuracy for LF-E in the deeper-water intervals of well B8G P1-2.
Identification errors arose primarily in transitional intervals between adjacent lithofacies. (1) When the measured TOC of an interval was slightly below 1% while the model-predicted TOC was slightly above 1%, misclassification between LF-C and LF-B tends to occur. (2) When the measured clay content of an interval was slightly above 50% while the model-predicted value fell slightly below 50%, misclassification between LF-A and LF-B tended to occur. Intervals dominated by LF-E yielded near-perfect prediction– observation agreement, whereas errors concentrated in mudstone-shale intervals, consistent with the continuously transitional log signatures among the three organic-rich lithofacies LF-A, LF-B, and LF-C (Table 7).
These results demonstrate that the log-based identification workflow integrating the modified ΔlogR method, multiple linear regression, and lithofacies discrimination criteria achieved high transferability in the delta-front facies zones and in intervals characterized by strong lithological contrasts. However, fine-scale discrimination among LF-A, LF-B, and LF-C in the deep lake to semi-deep lake mudstone-shale intervals remained limited by the resolving power of conventional log parameters. Future work will explore the incorporation of more sensitive log measurements, including elemental capture spectroscopy (ECS) and nuclear magnetic resonance (NMR) T 2 spectra, as well as integration with machine learning methods, to further improve basin-scale lithofacies prediction capabilities.

6. Conclusions

This study investigated the organic-rich shales of K2qn1 in the southern Songliao Basin through systematic core description of 908 m of core from eight cored wells, integrated with 123 TOC measurements, 47 whole-rock XRD analyses, 29 major- and trace-element analyses, six maceral identification datasets, and conventional well log data from 75 wells. An integrated lithofacies classification scheme incorporating organic matter abundance was established, the coupling relationships among lithofacies, mineral composition, organic matter abundance, and preservation conditions were systematically characterized, and a log-based lithofacies identification workflow was developed. The principal conclusions are as follows.
(1) Eight lithofacies were recognized within K2qn1 across the study area: three organic-rich lithofacies (LF-A, LF-B, and LF-C) and five low organic matter lithofacies (LF-D through LF-H). The lithofacies type exerted first-order control on TOC distribution.
Among the three organic-rich lithofacies, the high-TOC clay-rich mudstone-grade laminated shale deposited in a deep lake setting (LF-A) and the high-to-moderate TOC felsic mudstone-grade laminated shale deposited in a semi-deep lake setting (LF-B) constituted the dominant organic-rich lithofacies. LF-A developed predominantly in the deep lake center of the TH block; the cores were dark gray to black with planar, continuous laminae; clay minerals constituted ≥50%; the TOC ranged from 2.32% to 5.12% (mean of 3.18% ± 0.85%) with all samples exceeding TOC = 2%; liptinite exceeded 90%; and the lithofacies formed under saline and strongly anoxic-to-euxinic conditions (mean paleosalinity = 8.06‰, maximum 13.67‰; V/(V + Ni) = 0.75–0.97). LF-B was widely developed in the semi-deep lake to delta-front transition zone of the Y and Q blocks; felsic minerals constituted ≥50%; laminae were planar to slightly wavy; the TOC ranged from 1.59% to 4.27% (mean of 2.18% ± 0.68%); and the lithofacies formed under brackish-to-saline anoxic conditions (mean paleosalinity = 5.10‰; V/(V + Ni) = 0.70–0.84). LF-C, the low-to-moderate organic matter felsic silt-bearing laminated shale, occurred locally in intervals of stronger clastic supply, with a mean TOC of 1.32%. The contrasting depositional environments, mineral compositions, and preservation conditions of the two dominant organic-rich lithofacies determined their respective rankings in shale oil sweet spot evaluation.
(2) Organic matter enrichment in the study area was governed by the superimposed effects of three factors—paleoproductivity, preservation conditions, and terrigenous dilution—of which paleoproductivity was the primary control.
Liptinite constituted the principal hydrocarbon-generating precursor; the combined abundance of algal macerals (lamalginite and telalginite) and liptodetrinite was strongly positively correlated with the TOC ( R 2 = 0.88 ). Paleoenvironmental conditions (paleosalinity and redox state) were the key modulating factors responsible for inter-block and inter-subunit enrichment differentiation. Terrigenous dilution exerted a pronounced suppressive effect on organic matter enrichment in the Q block during Y1 but diminished substantially during the maximum flooding stage.
Vertically, K2qn1 recorded a classic transgressive systems tract evolutionary sequence from Y1 to Y3; the cumulative thickness of organic-rich lithofacies expanded from approximately 10 m to approximately 25 m (an increase of approximately 1.5 times), and the mean TOC in well T1 of the TH block increased from 2.31% in Y1 to a peak of 3.34% in Y2 and remains elevated at 2.83% in Y3, consistent with synchronous evolution of algal productivity around the maximum flooding surface. Areally, the mean TOC increased systematically from 1.65% in the southern Q block to 2.74% in the northern TH block, reflecting the progressive attenuation of terrigenous dilution and intensification of organic matter enrichment along the delta-front to deep lake center transect. This evolutionary trajectory was jointly controlled by the global Cretaceous OAE backdrop of greenhouse climate, eutrophic water bodies, and intensified anoxia and by regional lacustrine tectonic–paleogeographic conditions.
(3) A three-step log-based lithofacies identification workflow was established, comprising modified ΔlogR TOC prediction, multiple linear regression clay mineral estimation, and integrated lithofacies discrimination, with differentiated applicability across depositional facies zones.
In calibration well B28, TOC prediction achieved R 2 = 0.86 with a mean relative error of 28.9% and a lithofacies identification accuracy of 98.0%. In validation wells T1 and B38, where lithological contrasts were pronounced, identification accuracies reached 93.0% and 94.0%, respectively. In validation wells C8 and B8G P1-2, which were dominated by organic-rich mudstone-shale, the accuracies were 64.6% and 75.4%, respectively, with near-100% accuracy for LF-E sandstone intervals in the deeper-water section of well B8G P1-2. Identification errors were concentrated in transitional intervals among LF-A, LF-B, and LF-C, consistent with the continuously transitional log signatures among these three organic-rich lithofacies and reflecting the inherent limitations of conventional log parameters in resolving deep lake to semi-deep lake mudstone-shale facies. Overall, the workflow demonstrates high transferability in delta-front facies zones and in intervals of strong lithological contrast; future improvements in deep lake to semi-deep lake settings will focus on incorporating elemental capture spectroscopy (ECS) and NMR T 2 spectra, as well as on exploring integration with machine learning methods to further enhance basin-scale lithofacies identification capability.
In summary, by incorporating the TOC into the lithofacies classification parameters and establishing a dual-track nomenclature system combining depositional genetic attributes with organic matter abundance, this study quantitatively characterized the development of organic-rich lithofacies, elucidated the organic matter enrichment mechanism, and established log-based identification criteria for K2qn1 in the southern Songliao Basin, providing a quantitative geological basis for the genetic interpretation of organic-rich lacustrine shales.

Author Contributions

Conceptualization, H.C. and G.X.; methodology, H.C. and X.T.; software, H.C. and X.T.; validation, H.C., G.X., X.T. and J.X.; formal analysis, H.C. and X.T.; investigation, H.C., X.T., Y.Z. (Yangxue Zhang) and H.B.; resources, Y.Z. (Yangxue Zhang) and H.B.; data curation, H.C. and X.T.; writing—original draft preparation, H.C.; writing—review and editing, H.C., G.X., X.T., Y.Z. (Yating Zhang) and Y.X.; visualization, H.C., X.T. and J.X.; supervision, G.X.; project administration, G.X.; funding acquisition, G.X. All authors have read and agreed to the published version of the manuscript.

Funding

This research was funded by the China National Petroleum Corporation (CNPC) Scientific Research Project “Research on Key Technologies for Geological Characteristics and Resource Evaluation of Unconventional Oil and Gas” and the sub-project “Research on Key Technologies for Quantitative Identification of Lithofacies and Sweet Spot Evaluation of Organic-rich Shales in Songliao Basin” (Grant No. 2024JLQY01) undertaken by the Jilin Oilfield Company.

Data Availability Statement

The core, well log, and geochemical data used in this study are owned by the Jilin Oilfield Company of the China National Petroleum Corporation (CNPC). Because the data involve production operations and exploration deployment information pertaining to active blocks, they cannot be made directly available through public databases, in accordance with the company’s data management regulations. Peer researchers with a legitimate scientific purpose may submit a data access request by contacting the corresponding author (Guomiao Xu, xuguomiao@utibet.edu.cn) or the first author (Haonan Chen, 19904389365@163.com) by email; the author team will forward the request to the relevant department of the Jilin Oilfield Company for internal review, and the requested data may be provided to the applicant upon approval and after the necessary data use agreement has been signed.

Acknowledgments

The authors would like to thank the China National Petroleum Corporation (CNPC) for its support of this study. We are also grateful to the Jilin Oilfield Company of the CNPC for providing the essential cores and well log data used in this research.

Conflicts of Interest

Yangxue Zhang and Hui Ban were employed by the Honggang Oil Production Plant of the Jilin Oilfield Company under the China National Petroleum Corporation (CNPC) (Da’an 131300, China). The remaining authors declare that the research was conducted in the absence of any commercial or financial relationships that could be construed as a potential conflict of interest. The funding sponsors had no role in the design of the study; in the collection, analyses, or interpretation of data; in the writing of the manuscript; or in the decision to publish the results.

Abbreviations

ACAcoustic transit time
CALCaliper
CIAChemical Index of Alteration
CNLCompensated neutron log
CNPCChina National Petroleum Corporation
DENDensity log
ECSElemental capture spectroscopy
GRGamma ray
HIHydrogen index
ICP-MSInductively coupled plasma mass spectrometry
K2qn1First member of the Qingshankou Formation
LFLithofacies
NMRNuclear magnetic resonance
OAEOceanic anoxic event
OSIOil saturation index
R o Vitrinite reflectance
RTResistivity
S 1 , S 2 Free hydrocarbons and generated hydrocarbons (Rock-Eval parameters)
T max Maximum pyrolysis temperature
TOCTotal organic carbon
V s h Clay mineral volume fraction
V R r Vitrinite random reflectance
XRDX-ray diffraction
XRFX-ray fluorescence

References

  1. Loucks, R.G.; Reed, R.M.; Ruppel, S.C.; Hammes, U. Spectrum of pore types and networks in mudrocks and a descriptive classification for matrix-related mudrock pores. AAPG Bull. 2012, 96, 1071–1098. [Google Scholar] [CrossRef]
  2. Curtis, J.B. Fractured shale-gas systems. AAPG Bull. 2002, 86, 1921–1938. [Google Scholar] [CrossRef]
  3. Jarvie, D.M.; Hill, R.J.; Ruble, T.E.; Pollastro, R.M. Unconventional shale-gas systems: The Mississippian Barnett Shale of north-central Texas as one model for thermogenic shale-gas assessment. AAPG Bull. 2007, 91, 475–499. [Google Scholar] [CrossRef]
  4. Lazar, O.R.; Bohacs, K.M.; Macquaker, J.H.S.; Schieber, J.; Demko, T.M. Capturing key attributes of fine-grained sedimentary rocks in outcrops, cores, and thin sections: Nomenclature and description guidelines. J. Sediment. Res. 2015, 85, 230–246. [Google Scholar] [CrossRef]
  5. Macquaker, J.H.S.; Adams, A.E. Maximizing information from fine-grained sedimentary rocks: An inclusive nomenclature for mudstones. J. Sediment. Res. 2003, 73, 735–744. [Google Scholar] [CrossRef]
  6. Tyson, R.V. Sedimentation rate, dilution, preservation and total organic carbon: Some results of a modelling study. Org. Geochem. 2001, 32, 333–339. [Google Scholar] [CrossRef]
  7. Jiang, F.; Pang, X.; Bai, J.; Zhou, X.; Li, J.; Guo, Y. Comprehensive assessment of source rocks in the Bohai Sea area, eastern China. AAPG Bull. 2016, 100, 969–1002. [Google Scholar] [CrossRef]
  8. Liu, C.; Wang, Z.; Guo, Z.; Hong, W.; Dun, C.; Zhang, X.; Li, B.; Wu, L. Enrichment and distribution of shale oil in the Cretaceous Qingshankou Formation, Songliao Basin, Northeast China. Mar. Pet. Geol. 2017, 86, 751–770. [Google Scholar] [CrossRef]
  9. Liu, B.; Wang, H.; Fu, X.; Bai, Y.; Bai, L.; Jia, M.; He, B. Lithofacies and depositional setting of a highly prospective lacustrine shale oil succession from the Upper Cretaceous Qingshankou Formation in the Gulong sag, northern Songliao Basin, northeast China. AAPG Bull. 2019, 103, 405–432. [Google Scholar] [CrossRef]
  10. Zhao, Z.; Littke, R.; Zieger, L.; Hou, D.; Froidl, F. Depositional environment, thermal maturity and shale oil potential of the Cretaceous Qingshankou Formation in the eastern Changling Sag, Songliao Basin, China: An integrated organic and inorganic geochemistry approach. Int. J. Coal Geol. 2020, 232, 103621. [Google Scholar] [CrossRef]
  11. Jia, J.; Liu, Z.; Bechtel, A.; Strobl, S.A.I.; Sun, P. Tectonic and climate control of oil shale deposition in the Upper Cretaceous Qingshankou Formation (Songliao Basin, NE China). Int. J. Earth Sci. 2013, 102, 1717–1734. [Google Scholar] [CrossRef]
  12. Bechtel, A.; Jia, J.; Strobl, S.A.I.; Sachsenhofer, R.F.; Liu, Z.; Gratzer, R.; Püttmann, W. Palaeoenvironmental conditions during deposition of the Upper Cretaceous oil shale sequences in the Songliao Basin (NE China): Implications from geochemical analysis. Org. Geochem. 2012, 46, 76–95. [Google Scholar] [CrossRef]
  13. Wang, C.; Scott, R.W.; Wan, X.; Graham, S.A.; Huang, Y.; Wang, P.; Wu, H.; Dean, W.E.; Zhang, L. Late Cretaceous climate changes recorded in Eastern Asian lacustrine deposits and North American Epieric sea strata. Earth-Sci. Rev. 2013, 126, 275–299. [Google Scholar] [CrossRef]
  14. Cai, Y.; Zhu, R.; Luo, Z.; Wu, S.; Zhang, T.; Liu, C.; Zhang, J.; Wang, Y.; Meng, S.; Wang, H.; et al. Lithofacies and source rock quality of organic-rich shales in the Cretaceous Qingshankou Formation, Songliao Basin, NE China. Minerals 2022, 12, 465. [Google Scholar] [CrossRef]
  15. Liu, B.; Shi, J.; Fu, X.; Lyu, Y.; Sun, X.; Gong, L.; Bai, Y. Petrological characteristics and shale oil enrichment of lacustrine fine-grained sedimentary system: A case study of organic-rich shale in first member of Cretaceous Qingshankou Formation in Gulong Sag, Songliao Basin, NE China. Pet. Explor. Dev. 2018, 45, 884–894. [Google Scholar] [CrossRef]
  16. Hou, M.; Xiao, Y.; Lei, Z.; Yang, Z.; Lou, Y.; Liu, Y. Machine learning algorithms for lithofacies classification of the Gulong Shale from the Songliao Basin, China. Energies 2023, 16, 2581. [Google Scholar] [CrossRef]
  17. Feng, Z.Q.; Jia, C.Z.; Xie, X.N.; Zhang, S.; Feng, Z.H.; Cross, T.A. Tectonostratigraphic units and stratigraphic sequences of the nonmarine Songliao Basin, northeast China. Basin Res. 2010, 22, 79–95. [Google Scholar] [CrossRef]
  18. Wang, C.; Feng, Z.; Zhang, L.; Huang, Y.; Cao, K.; Wang, P.; Zhao, B. Cretaceous paleogeography and paleoclimate and the setting of SK1 borehole sites in Songliao Basin, northeast China. Palaeogeogr. Palaeoclimatol. Palaeoecol. 2013, 385, 17–30. [Google Scholar] [CrossRef]
  19. Schlanger, S.O.; Jenkyns, H.C. Cretaceous oceanic anoxic events: Causes and consequences. Geol. Mijnb. 1976, 55, 179–184. [Google Scholar]
  20. Hackley, P.C.; Cardott, B.J. Application of organic petrography in North American shale petroleum systems: A review. Int. J. Coal Geol. 2016, 163, 8–51. [Google Scholar] [CrossRef]
  21. GB/T 19145-2003; Determination of Total Organic Carbon in Sedimentary Rock. Standards Press of China: Beijing, China, 2003.
  22. GB/T 18602-2012; Rock Pyrolysis Analysis. Standards Press of China: Beijing, China, 2012.
  23. SY/T 5163-2018; Analysis Method for Clay Minerals and Ordinary Non-Clay Minerals in Sedimentary Rocks by X-Ray Diffraction. Petroleum Industry Press: Beijing, China, 2018.
  24. Pickel, W.; Kus, J.; Flores, D.; Kalaitzidis, S.; Christanis, K.; Cardott, B.J.; Misz-Kennan, M.; Rodrigues, S.; Hentschel, A.; Hamor-Vido, M.; et al. Classification of liptinite—ICCP System 1994. Int. J. Coal Geol. 2017, 169, 40–61. [Google Scholar] [CrossRef]
  25. International Committee for Coal and Organic Petrology (ICCP). The new vitrinite classification (ICCP System 1994). Fuel 1998, 77, 349–358. [Google Scholar] [CrossRef]
  26. Sýkorová, I.; Pickel, W.; Christanis, K.; Wolf, M.; Taylor, G.H.; Flores, D. Classification of huminite—ICCP System 1994. Int. J. Coal Geol. 2005, 62, 85–106. [Google Scholar] [CrossRef]
  27. SY/T 5125-2014; Method of Identification Microscopically the Macerals of Kerogen and Indivision the Kerogen Type by Transmitted-Light and Fluorescence. Petroleum Industry Press: Beijing, China, 2014.
  28. Suárez-Ruiz, I.; Flores, D.; Mendonça Filho, J.G.; Hackley, P.C. Review and update of the applications of organic petrology: Part 1, geological applications. Int. J. Coal Geol. 2012, 99, 54–112. [Google Scholar] [CrossRef]
  29. ISO 7404-5:2009; Methods for the Petrographic Analysis of Coals—Part 5: Method of Determining Microscopically the Reflectance of Vitrinite. International Organization for Standardization: Geneva, Switzerland, 2009.
  30. ASTM D7708-14; Standard Test Method for Microscopical Determination of the Reflectance of Vitrinite Dispersed in Sedimentary Rocks. ASTM International: West Conshohocken, PA, USA, 2014.
  31. Passey, Q.R.; Creaney, S.; Kulla, J.B.; Moretti, F.J.; Stroud, J.D. A practical model for organic richness from porosity and resistivity logs. AAPG Bull. 1990, 74, 1777–1794. [Google Scholar] [CrossRef]
  32. Passey, Q.R.; Bohacs, K.M.; Esch, W.L.; Klimentidis, R.; Sinha, S. From oil-prone source rock to gas-producing shale reservoir—Geologic and petrophysical characterization of unconventional shale-gas reservoirs. In SPE International Oil and Gas Conference and Exhibition in China; Paper SPE-131350-MS; SPE: Richardson, TX, USA, 2010. [Google Scholar] [CrossRef]
  33. Schmoker, J.W. Determination of organic content of Appalachian Devonian shales from formation-density logs. AAPG Bull. 1979, 63, 1504–1509. [Google Scholar] [CrossRef]
  34. Wei, W.; Algeo, T.J. Elemental proxies for paleosalinity analysis of ancient shales and mudrocks. Geochim. Cosmochim. Acta 2020, 287, 341–366. [Google Scholar] [CrossRef]
  35. Ma, Y.; Feng, J. Depositional environment variations and organic matter accumulation of the first member of the Qingshankou Formation in the southern Songliao Basin, China. Front. Earth Sci. 2023, 11, 1249787. [Google Scholar] [CrossRef]
  36. Algeo, T.J.; Maynard, J.B. Trace-element behavior and redox facies in core shales of Upper Pennsylvanian Kansas-type cyclothems. Chem. Geol. 2004, 206, 289–318. [Google Scholar] [CrossRef]
  37. Sweere, T.; van den Boorn, S.; Dickson, A.J.; Reichart, G.J. Definition of new trace-metal proxies for the controls on organic matter enrichment in marine sediments based on Mn, Co, Mo and Cd concentrations. Chem. Geol. 2016, 441, 235–245. [Google Scholar] [CrossRef]
  38. Algeo, T.J.; Lyons, T.W. Mo–total organic carbon covariation in modern anoxic marine environments: Implications for analysis of paleoredox and paleohydrographic conditions. Paleoceanography 2006, 21, PA1016. [Google Scholar] [CrossRef]
  39. Adams, T.D.; Haynes, J.R.; Walker, C.T. Boron in Holocene illites of the Dovey Estuary, Wales, and its relationship to palaeosalinity in cyclothems. Sedimentology 1965, 4, 189–195. [Google Scholar] [CrossRef]
  40. Couch, E.L. Calculation of paleosalinities from boron and clay mineral data. AAPG Bull. 1971, 55, 1829–1837. [Google Scholar] [CrossRef]
  41. Hatch, J.R.; Leventhal, J.S. Relationship between inferred redox potential of the depositional environment and geochemistry of the Upper Pennsylvanian (Missourian) Stark Shale Member of the Dennis Limestone, Wabaunsee County, Kansas, U.S.A. Chem. Geol. 1992, 99, 65–82. [Google Scholar] [CrossRef]
  42. Wignall, P.B.; Twitchett, R.J. Oceanic anoxia and the end Permian mass extinction. Science 1996, 272, 1155–1158. [Google Scholar] [CrossRef]
  43. Jones, B.; Manning, D.A.C. Comparison of geochemical indices used for the interpretation of palaeoredox conditions in ancient mudstones. Chem. Geol. 1994, 111, 111–129. [Google Scholar] [CrossRef]
  44. Tribovillard, N.; Algeo, T.J.; Lyons, T.; Riboulleau, A. Trace metals as paleoredox and paleoproductivity proxies: An update. Chem. Geol. 2006, 232, 12–32. [Google Scholar] [CrossRef]
  45. Algeo, T.J.; Tribovillard, N. Environmental analysis of paleoceanographic systems based on molybdenum–uranium covariation. Chem. Geol. 2009, 268, 211–225. [Google Scholar] [CrossRef]
  46. Nesbitt, H.W.; Young, G.M. Early Proterozoic climates and plate motions inferred from major element chemistry of lutites. Nature 1982, 299, 715–717. [Google Scholar] [CrossRef]
  47. Liu, Q.; Zhu, X.; Zhu, H.; Liu, K.; Tan, M.; Chen, H.; Yang, S. Three-Dimensional Forward Stratigraphic Modelling of the Gravel-to Mud-Rich Fan-Delta in the Slope System of Zhanhua Sag, Bohai Bay Basin, China. Mar. Pet. Geol. 2017, 79, 18–30. [Google Scholar] [CrossRef]
Figure 1. Composite stratigraphic column of the Qingshankou Formation. Color legend for lithological column: orange = sandstone-type lithology (arenaceous sedimentary rocks); other color assignments are detailed in the figure’s legend.
Minerals 16 00555 g001
Figure 2. Location and well distribution map of the study area in the southern Songliao Basin. The eight cored wells used in this study (T1, B8, C8, C34, B8G P1-2, B28, B38, and G5-1) are highlighted.
Minerals 16 00555 g002
Figure 3. Lithofacies classification scheme. (a) Lithology classification (mud-silt-carbonate ternary). (b) Sedimentary structure classification (laminated-layered-blocky ternary). (c) Mineral composition classification (clay-felsic-carbonate ternary). (d) TOC organic matter abundance classification. Note: the “carbonate” end member in panel (c) denotes the carbonate mineral content (a mineralogical parameter); it is not a rock-type name. The “carbonate” end member in panel (a) denotes the carbonate rock end of the lithology ternary. All four panels represent independent classification dimensions; the full name of each lithofacies integrates all four dimensions simultaneously.
Minerals 16 00555 g003
Figure 4. Core and photomicrograph characteristics of LF-A (high organic matter clay-rich mudstone-grade laminated shale). (a) Well T1, 2302.0 m, TOC = 3.03%, dark-gray-to-black shale. (b) Well C8, 2337.34 m, TOC = 3.84%, dark-gray-to-black shale; (c) Well T1, 2354.65 m, TOC = 4.41%, alternating organic matter-poor and organic matter-rich clay-grade laminae with bedding-parallel fractures. (d) Well T1, 2269.6 m, TOC = 3.98%, organic matter-rich clay-grade laminae with bedding-parallel fractures.
Minerals 16 00555 g004
Figure 5. Core and photomicrograph characteristics of LF-B (high-to-moderate organic matter felsic mudstone-grade laminated shale). (a) Well C8, 2370.65 m, TOC = 1.20%, dark-gray-to-black shale with minor silt-grade laminae. (b) Well P1-2, 2236.71 m, TOC = 2.40%, deep gray shale with minor silt-grade laminae. (c) Well P1-2, 2240.85 m, TOC = 2.29%, plane-polarized light. (d) Well P1-2, 2240.85 m, TOC = 2.29%, cross-polarized light.
Minerals 16 00555 g005
Figure 6. Core and photomicrograph characteristics of LF-C (low-to-moderate organic matter felsic silt-bearing laminated shale). (a) Well P1-2, 2252.99 m, TOC = 0.74%, silt-bearing laminated shale with ball-and-pillow structures. (b) Well C8, 2382.88 m, TOC = 1.79%, silt-bearing laminated shale with ball-and-pillow and fluid escape structures. (c) Well P1-2, 2235.59 m, TOC = 1.27%, plane-polarized light. (d) Well P1-2, 2235.59 m, TOC = 1.27%, cross-polarized light.
Minerals 16 00555 g006
Figure 7. Core and photomicrograph characteristics of LF-D (low-to-moderate organic matter massive felsic mudstone). (a) Well P1-2, 2050.0 m, TOC = 0.8%, gray mudstone with massive structure. (b) Well C8, 2326.41 m, TOC = 1.8%, deep gray mudstone with massive structure. (c) Well P1-2, 2223.45 m, TOC = 1.78%, plane-polarized light. (d) Well P1-2, 2223.45 m, TOC = 1.78%, cross-polarized light.
Minerals 16 00555 g007
Figure 8. Core characteristics of LF-E (layered siltstone) and LF-F (layered fine sandstone). (a) Well B88, 2544.4 m, layered siltstone with inverse grading. (b) Well B8G, 2249.92 m, layered siltstone with climbing ripple lamination and oil staining. (c) Well B8G, 2234.15 m, layered fine sandstone with climbing ripple lamination and trough cross-bedding. (d) Well B8G, 2061.89 m, fine sandstone with trough cross-bedding.
Minerals 16 00555 g008aMinerals 16 00555 g008b
Figure 9. Core characteristics of LF-G (layered ostracod-bearing limestone). (a) Well B8G, 2079.41 m, ostracod-bearing limestone with argillaceous laminae. (b) Well B28, 2459.3 m, ostracod-bearing limestone with complete ostracod valves. (c) Well B8G, 2253.99 m, ostracod-bearing limestone with an erosional surface at the base. (d) Well B88, 2254.74 m, ostracod-bearing limestone interbedded within sandstone.
Minerals 16 00555 g009
Figure 10. Core and photomicrograph characteristics of LF-H (layered dolostone). (a) Well T1, 2284.5 m, layered dolostone with massive structure. (b) Well T1, 2284.5 m, cross-polarized light.
Minerals 16 00555 g010
Figure 11. Vertical lithofacies distribution in the TH block (well T1): Y3 subunit. Color legend: yellow = LF-E (layered siltstone); light blue = LF-B (high-to-moderate organic matter felsic mudstone-grade laminated shale); purple = LF-G (layered ostracod-bearing limestone); blue = LF-A (high organic matter clay-rich mudstone-grade laminated shale). Letters in the figure: A = High-organic-matter clay-rich mudstone-grade laminated shale; B = High-to-moderate-organic-matter felsic mudstone-grade laminated shale; E = Layered siltstone; G = Layered ostracod-bearing limestone.
Minerals 16 00555 g011
Figure 12. Vertical lithofacies distribution in the TH block (well T1): Y2 subunit. Color legend: yellow = LF-E (layered siltstone); light blue = LF-B (high-to-moderate organic matter felsic mudstone-grade laminated shale); purple = LF-G (layered ostracod-bearing limestone); blue = LF-A (high organic matter clay-rich mudstone-grade laminated shale). Letters in the figure: A = High-organic-matter clay-rich mudstone-grade laminated shale; B = High-to-moderate-organic-matter felsic mudstone-grade laminated shale; E = Layered siltstone; G = Layered ostracod-bearing limestone.
Minerals 16 00555 g012
Figure 13. Vertical lithofacies distribution in the TH block (well T1): Y1 subunit. Color legend: yellow = LF-E (layered siltstone); light blue = LF-B (high-to-moderate organic matter felsic mudstone-grade laminated shale); purple = LF-G (layered ostracod-bearing limestone); blue = LF-A (high organic matter clay-rich mudstone-grade laminated shale). Letters in the figure: A = High-organic-matter clay-rich mudstone-grade laminated shale; B = High-to-moderate-organic-matter felsic mudstone-grade laminated shale; E = Layered siltstone; G = Layered ostracod-bearing limestone.
Minerals 16 00555 g013
Figure 14. Vertical lithofacies distribution in the Q block (well B28): Y3 subunit. Color legend: yellow = LF-E (layered siltstone); light blue = LF-B (high-to-moderate organic matter felsic mudstone-grade laminated shale); gray = LF-E (layered siltstone).
Minerals 16 00555 g014
Figure 15. Vertical lithofacies distribution in the Q block (well B28): Y1 subunit. Color legend: yellow = LF-E (layered siltstone); light blue = LF-B (high-to-moderate organic matter felsic mudstone-grade laminated shale).
Minerals 16 00555 g015
Figure 16. Vertical lithofacies distribution in the Q block (well B28): Y2 subunit. Color legend: yellow = LF-E (layered siltstone); light blue = LF-B (high-to-moderate organic matter felsic mudstone-grade laminated shale); gray = LF-E (layered siltstone).
Minerals 16 00555 g016
Table 1. Summary of cored wells, sample counts, and facies coverage. TOC (n): measured samples from sweet spot intervals; ✓: participated in analysis; XRD and major- or trace-element counts summarized at well block level.
WellBlockCored Interval (m)TOC (n)XRDMaj. or TraceRemarks
T1TH2284–237029Deep lake; LF-A/B/G/H
B8THw/T1Deep lake; LF-A dominant
C8Y2326–240029Semi-deep lake; LF-B/C
C34Yw/C8Semi-deep lake
B8G P1-2Q2210–226046 (w/B28: 65)Semi-deep lake– delta front; LF-B/C/E
B28Q2346–2469.719 (w/B8G P1-2: 65)Delta front; LF-B/D/E
B38Q∼2010–2110w/B28Delta front
G5-1Q∼1708+Log only
Total1234729908 m core; 75 log wells
Table 2. TOC statistics by lithofacies. Here, n values for LF-A, LF-B, and LF-C represent samples from the corresponding well blocks participating in systematic statistics and differ from the representative sample counts listed in Section 4.1.
LithofaciesnMean (%)SD (%)Min. (%)Max. (%)TOC > 2%
LF-A (TH block, deep lake)203.180.852.325.12100
LF-B (Y + Q blocks, semi-deep lake)602.180.681.594.2750
LF-C201.320.380.741.990
LF-D13<20
LF-E through LF-H10<10
Total1231.820.495.1247.2
Table 3. TOC statistics by well block and reservoir subunit. Evaluation criteria: Class I, TOC > 2%; Class II, TOC = 1%–2%; Class III, TOC = 0.5%–1%; non-source rock, TOC < 0.5%.
SubunitQ Block (B28 + B8G P1-2)Y Block (C8)TH Block (T1)
Y31.63% (n = 21)2.20% (n = 12)2.83% (n = 14)
Y21.84% (n = 21)1.95% (n = 8)3.34% (n = 5)
Y11.42% (n = 23)2.09% (n = 9)2.31% (n = 10)
Y1–Y3 mean1.65% (n = 65)2.10% (n = 29)2.74% (n = 29)
Table 4. Maceral identification results for six representative samples. Lamalg. = lamalginite; Telalg. = telalginite; Liptodet. = liptodetrinite; Liptinite = total liptinite; Inert. = inertinite. All values expressed as percentages.
SampleWell (Facies)Lamalg.Telalg.Liptodet.LiptiniteInert.
T1-47T1 (deep lake)3.5017.5075.4096.503.50
T1-53T1 (deep lake)22.0022.0044.0092.008.00
CY-11C8 (semi-deep lake)0.005.3060.5065.8034.20
CY-35C8 (semi-deep lake)8.808.8073.5091.208.80
B28-24B28 (delta front)75.802.0015.2092.907.10
B28-36B28 (delta front)79.802.809.2091.708.30
Table 5. Thermal maturity by well block.
BlockRepresentative Well T max Range (°C) T max Mean (°C)
THT1392–457439.10
YC8429–456445.46
QB28436–456447.07
Table 6. Quantitative paleobathymetric reconstruction results based on the stratigraphic dip and isopach method.
Transect k 1 k 2 h 1 (m) h 2 (m)Paleodepth (m)
N38–O110.430.444312.144471.90159.76
T1–B180.440.454504.634666.46161.83
F6–G5-10.300.312288.402410.00121.61
F4–G50.290.292096.712178.1381.43
O4–R90.320.332535.752612.0476.29
R14–N210.320.322570.292512.3457.95
Note: k 1 and k 2 are the syndepositional stratigraphic dip angles (°) at the two ends of the transect; h 1 and h 2 are the paleodepth components (m) at the respective ends reconstructed from the dip angle and isopach method; and paleodepth = ( h 1 + h 2 ) × mean dip angle correction factor. Detailed calculation procedure follows Liu et al. [47].
Table 7. Log response characteristics measured in well B28. W. range and W. mean are range and mean values over the whole-well interval, respectively; OR range and OR mean are range and mean values over organic-rich mudstone-shale intervals, respectively; and R 2 is the coefficient of determination between each log parameter and the TOC.
ParameterW. RangeW. MeanOR RangeOR Mean R 2
GR (API)96.5–141.8119.7994.2–135.2122.090.004
RT (Ω·m)6.34–52.1713.607.15–37.1712.850.106
AC (μs/m)199.8–293.7258.50248.2–294.97279.490.382
DEN (g/cm3)2.04–2.752.5612.29–2.752.5830.070
Table 8. Model validation summary for log-based lithofacies identification.
WellRoleDominant LithofaciesTOC R 2 /RRel. ErrorIdentification Accuracy
B28CalibrationLF-B/D/E (delta front–semi-deep lake) R 2 = 0.8628.9%98.0%
C8ValidationLF-B dominant; LF-A and LF-C presentR = 0.8532.5%64.6%
P1-2ValidationLF-B, LF-C, and LF-E co-developedR = 0.8530.8%75.4% (LF-E in deep-water intervals ≈100%)
T1ValidationLF-A dominant (deep lake)R = 0.8235.2%93.0%
B38ValidationLF-B/D/E (delta front)R = 0.8727.6%94.0%
Disclaimer/Publisher’s Note: The statements, opinions and data contained in all publications are solely those of the individual author(s) and contributor(s) and not of MDPI and/or the editor(s). MDPI and/or the editor(s) disclaim responsibility for any injury to people or property resulting from any ideas, methods, instructions or products referred to in the content.