1. Introduction
Sandstone-hosted uranium deposits represent one of the most important uranium resource types worldwide and play a critical role in global nuclear fuel supply. Among them, interlayer oxidation zone-type deposits represent a dominant metallogenic style, characterized by large tonnage and favorable in situ leaching conditions [
1,
2,
3,
4,
5]. These deposits are widely distributed worldwide, including in the Chu-Sarysu Basin in Kazakhstan [
6], the San Juan Basin in the USA [
7], and several basins in China. Since the 1990s, guided by the interlayer oxidation zone metallogenic model, numerous sandstone-hosted uranium deposits have been identified in sedimentary basins in China, including the Ordos [
5,
8,
9], Erlian [
1], Yili [
4], and Songliao [
10,
11] Basins. These studies have significantly improved our understanding of sedimentary environments, tectonic controls, and the architecture of oxidation zones [
12,
13].
The Mengqiguer deposit, located on the southern margin of the Yili Basin, is a typical interlayer oxidation zone-type sandstone-hosted uranium deposit in northwest China, with the lower member of the Jurassic Xishanyao Formation as its primary ore-hosting horizon [
14,
15]. Previous studies have made important progress in delineating the spatial distribution of orebodies, identifying the macroscopic characteristics of interlayer oxidation zones, and establishing a preliminary metallogenic model [
16,
17,
18,
19]. Nevertheless, several key scientific gaps that limit the understanding of uranium metallogenic mechanisms remain poorly constrained. One of the most critical gaps is that the mineralogical and geochemical responses to continuous redox evolution within sandstone systems have not been systematically constrained.
In this study, we present a comprehensive geochemical investigation of the interlayer oxidation zone in the Mengqiguer deposit. By integrating petrographic observations with systematic analyses of redox-sensitive elements, uranium minerals, and clay minerals, we (1) characterize the geochemical features of each alteration zone and (2) elucidate the migration and enrichment behavior of uranium and associated elements during redox evolution. The results provide new insights into uranium mineralization in interlayer oxidation systems and offer both theoretical and practical guidance for peripheral exploration in sandstone-hosted uranium provinces along the southern Yili Basin.
2. Geological Setting
2.1. Regional Geology
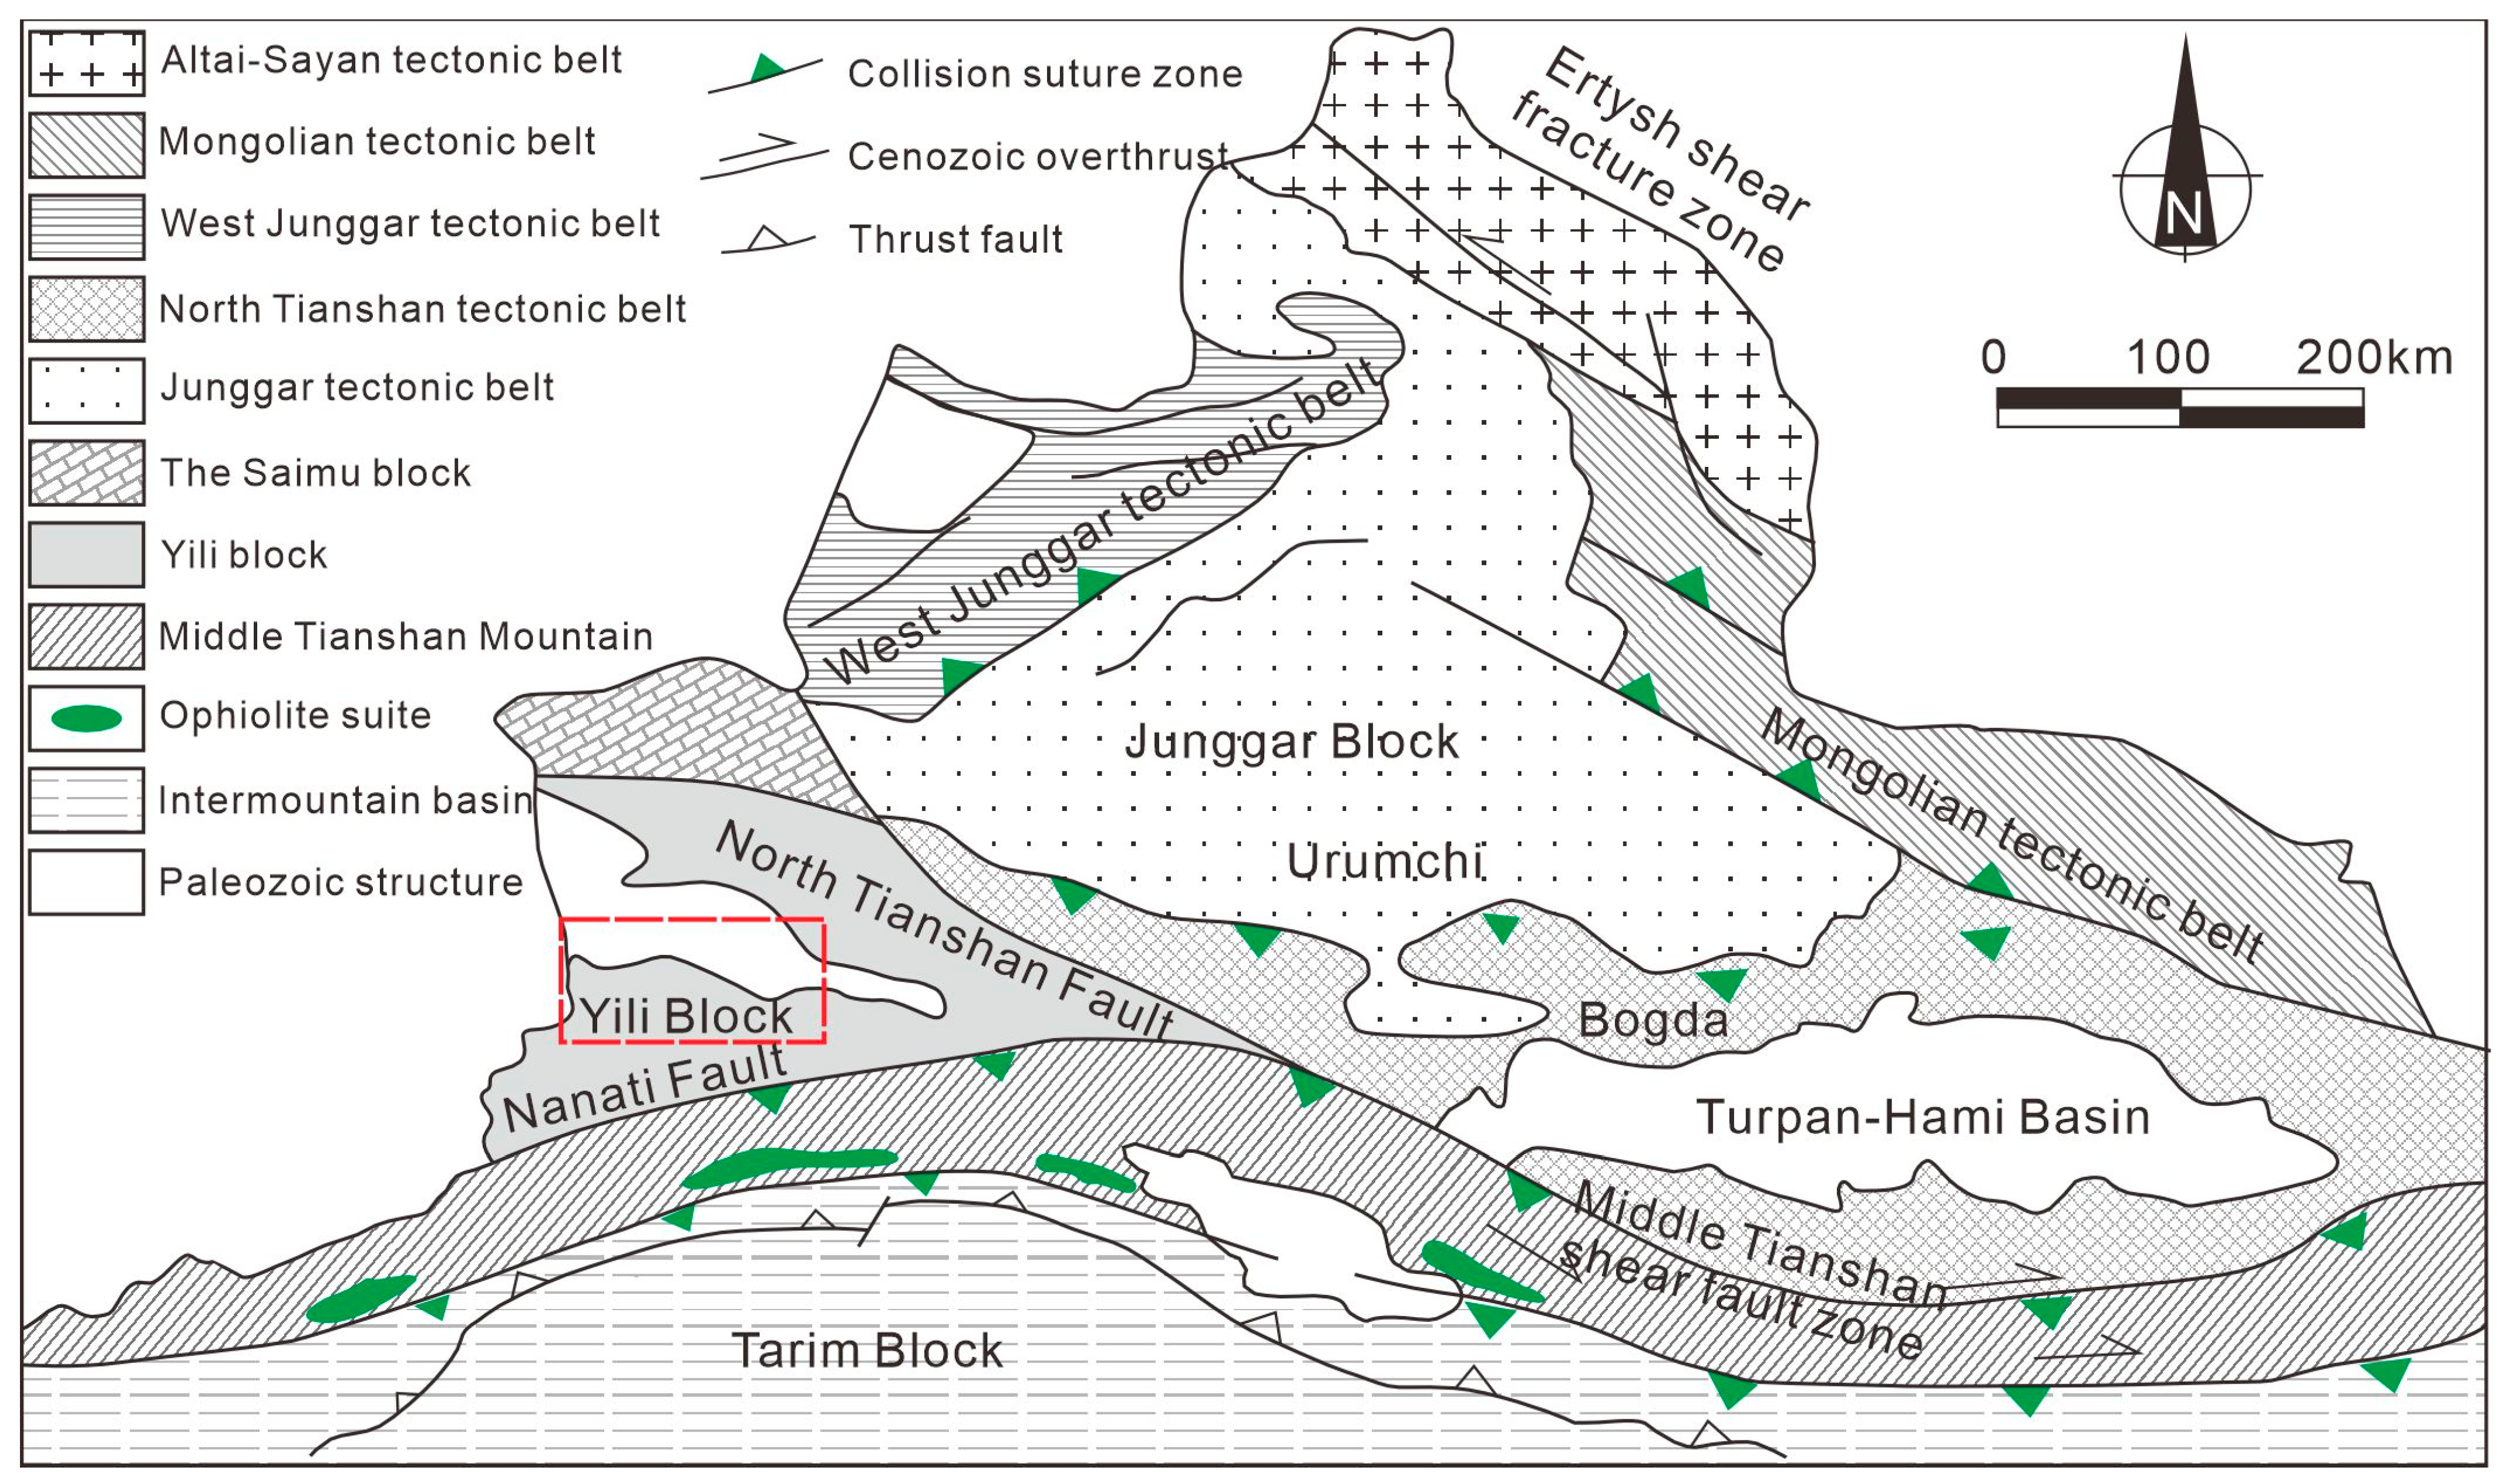
The Yili Basin (
Figure 1), situated along the Yili River in northwestern Xinjiang Province, covers an area of approximately 16,000 km
2 and extends westward into Kazakhstan. This basin is bounded by the Chabuchaer Mountain to the south and the Keguqin Mountain to the north [
14,
16]. Tectonically, the Yili Basin is located in the western Tianshan Orogenic Belt and forms part of the Yili–Kazakhstan Plate [
14,
15]. The basin is a Mesozoic–Cenozoic intermountain basin derived from a Paleozoic inter-arc rift trough. The basement rocks of the Yili Basin are dominated by Late Paleozoic intermediate to felsic volcanic rocks and volcaniclastic rocks, with minor Proterozoic granitoids. These basement rocks exhibit high U contents, and are considered the primary source of uranium mineralization in the basin [
14,
15]. The cover sequences of the Yili Basin are mainly composed of the Upper Triassic Xiaoquangou Group, the Middle to Lower Jurassic Shuixigou Group, and Cretaceous–Cenozoic red beds. The Xiaoquangou Group is characterized by thick argillaceous strata with local occurrences of sandstone and shale [
20], and the Shuixigou Group consists of conglomerate, sandstone, shale, and coal, whereas the Cretaceous–Cenozoic red beds mainly contain red-colored conglomerate and sandstone.
2.2. Deposit Geology
The Mengqiguer deposit is located in Sunzaiqi Nuruo Township, Chaobucha’er Xibe Autonomous County, Xinjiang. Geologically, it is located in the central southern part of the Yili Basin [
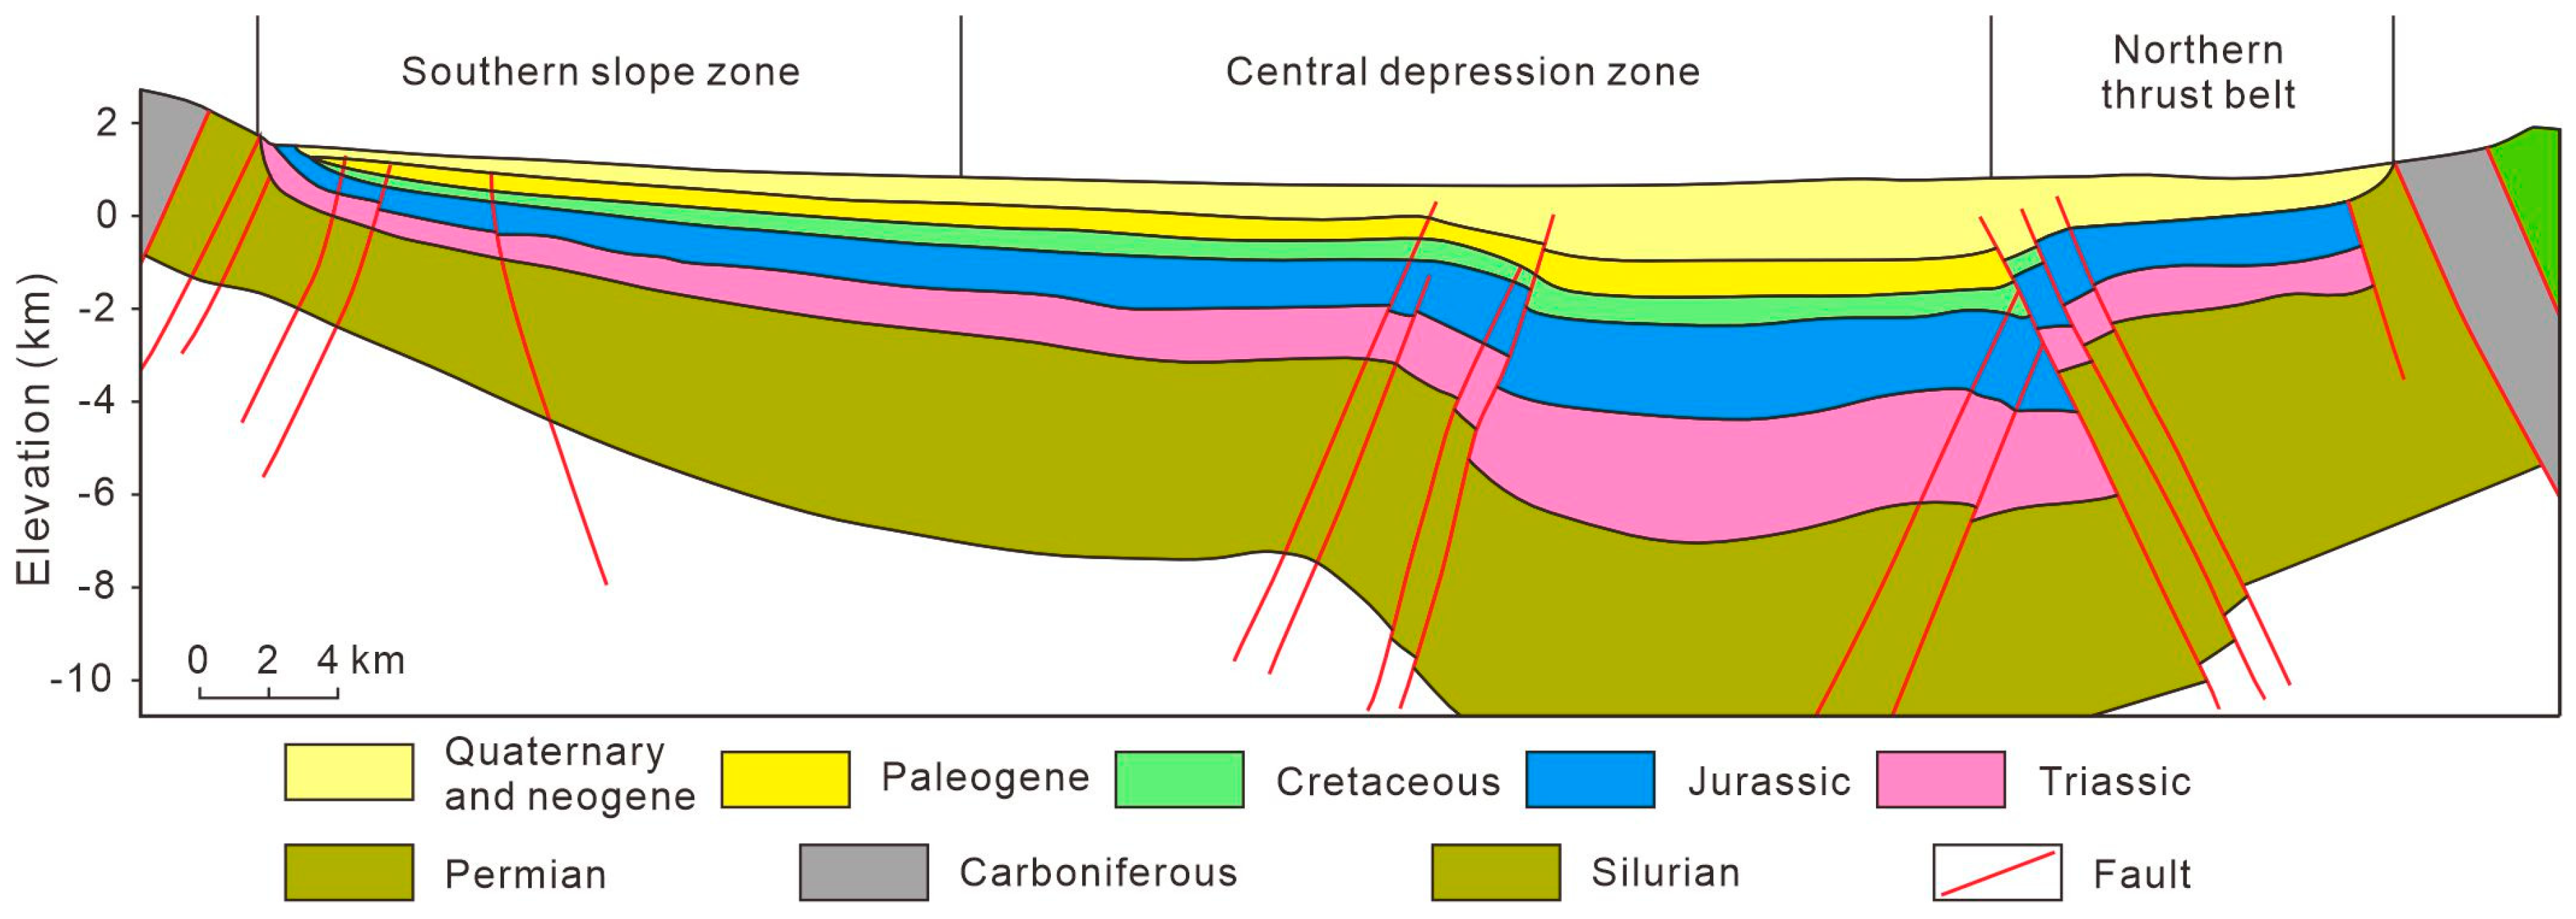
14], specifically within the transition zone that separates an active slope belt to the east from a more stable tectonic region to the west (
Figure 2). This deposit occurs on the southeastern flank of the Zagistan anticline (
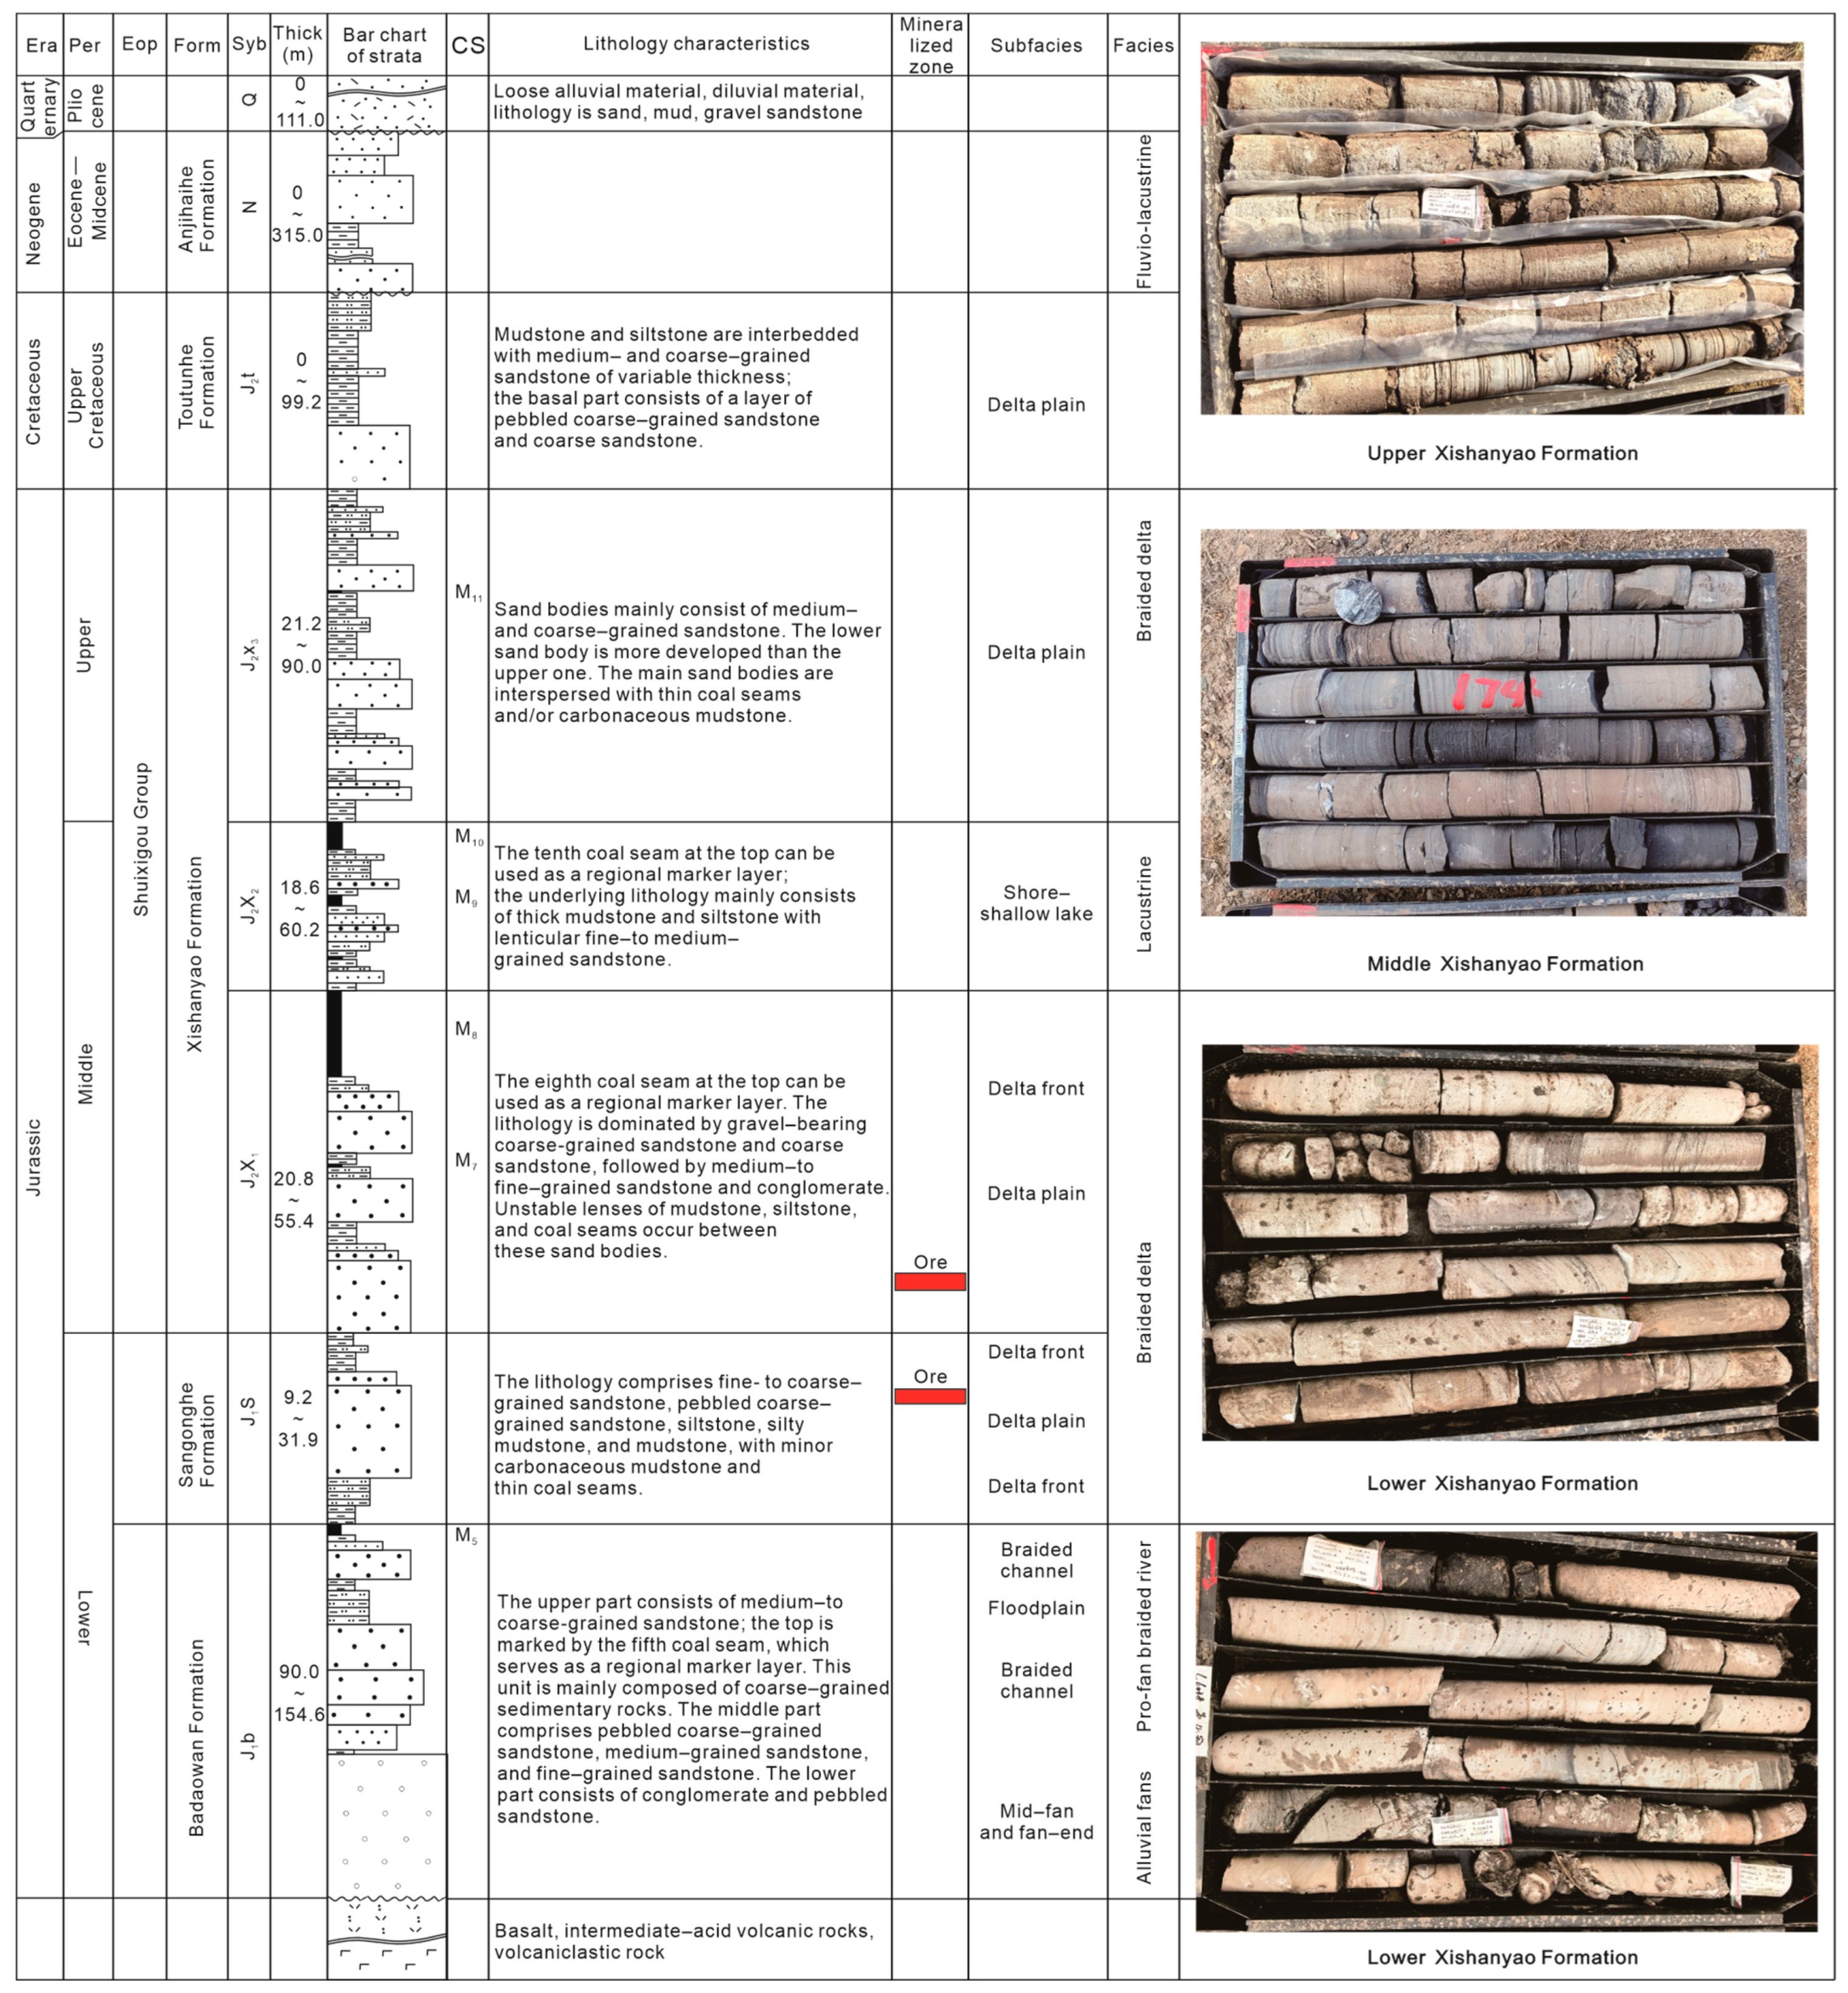
Figure 3), where strata dip at 6° to 8° with local variations of 45° to 48°. Uranium mineralization in the deposit primarily occurs within the Jurassic Shuixigou Group. This group is characterized by gray-colored, coal-bearing sedimentary rocks that formed under humid climatic conditions. From base to top, the Shuixigou Group can be further divided into three formations: the Badaowan, Sangonghe and Xishanyao Formations. The Sangonghe Formation represents a fan delta system [
21]. Its lower part consists of mudstone and siltstone, grading upward into coarse-grained sandstone and sandy conglomerate (
Figure 4). The Xishanyao Formation represents a fan delta plain–meandering river deposit [
22]. Its lower part is dominated by gray coarse-grained sandstone, its middle part consists of mudstone with interbedded coal seams, and the upper part is composed of gray coarse-grained sandstone and gravel-bearing coarse-grained sandstone (
Figure 4). These coal-bearing strata provide a material basis for the pre-enrichment of organic matter in the sand bodies, which is critical for the formation of reduction barriers during subsequent mineralization [
18].
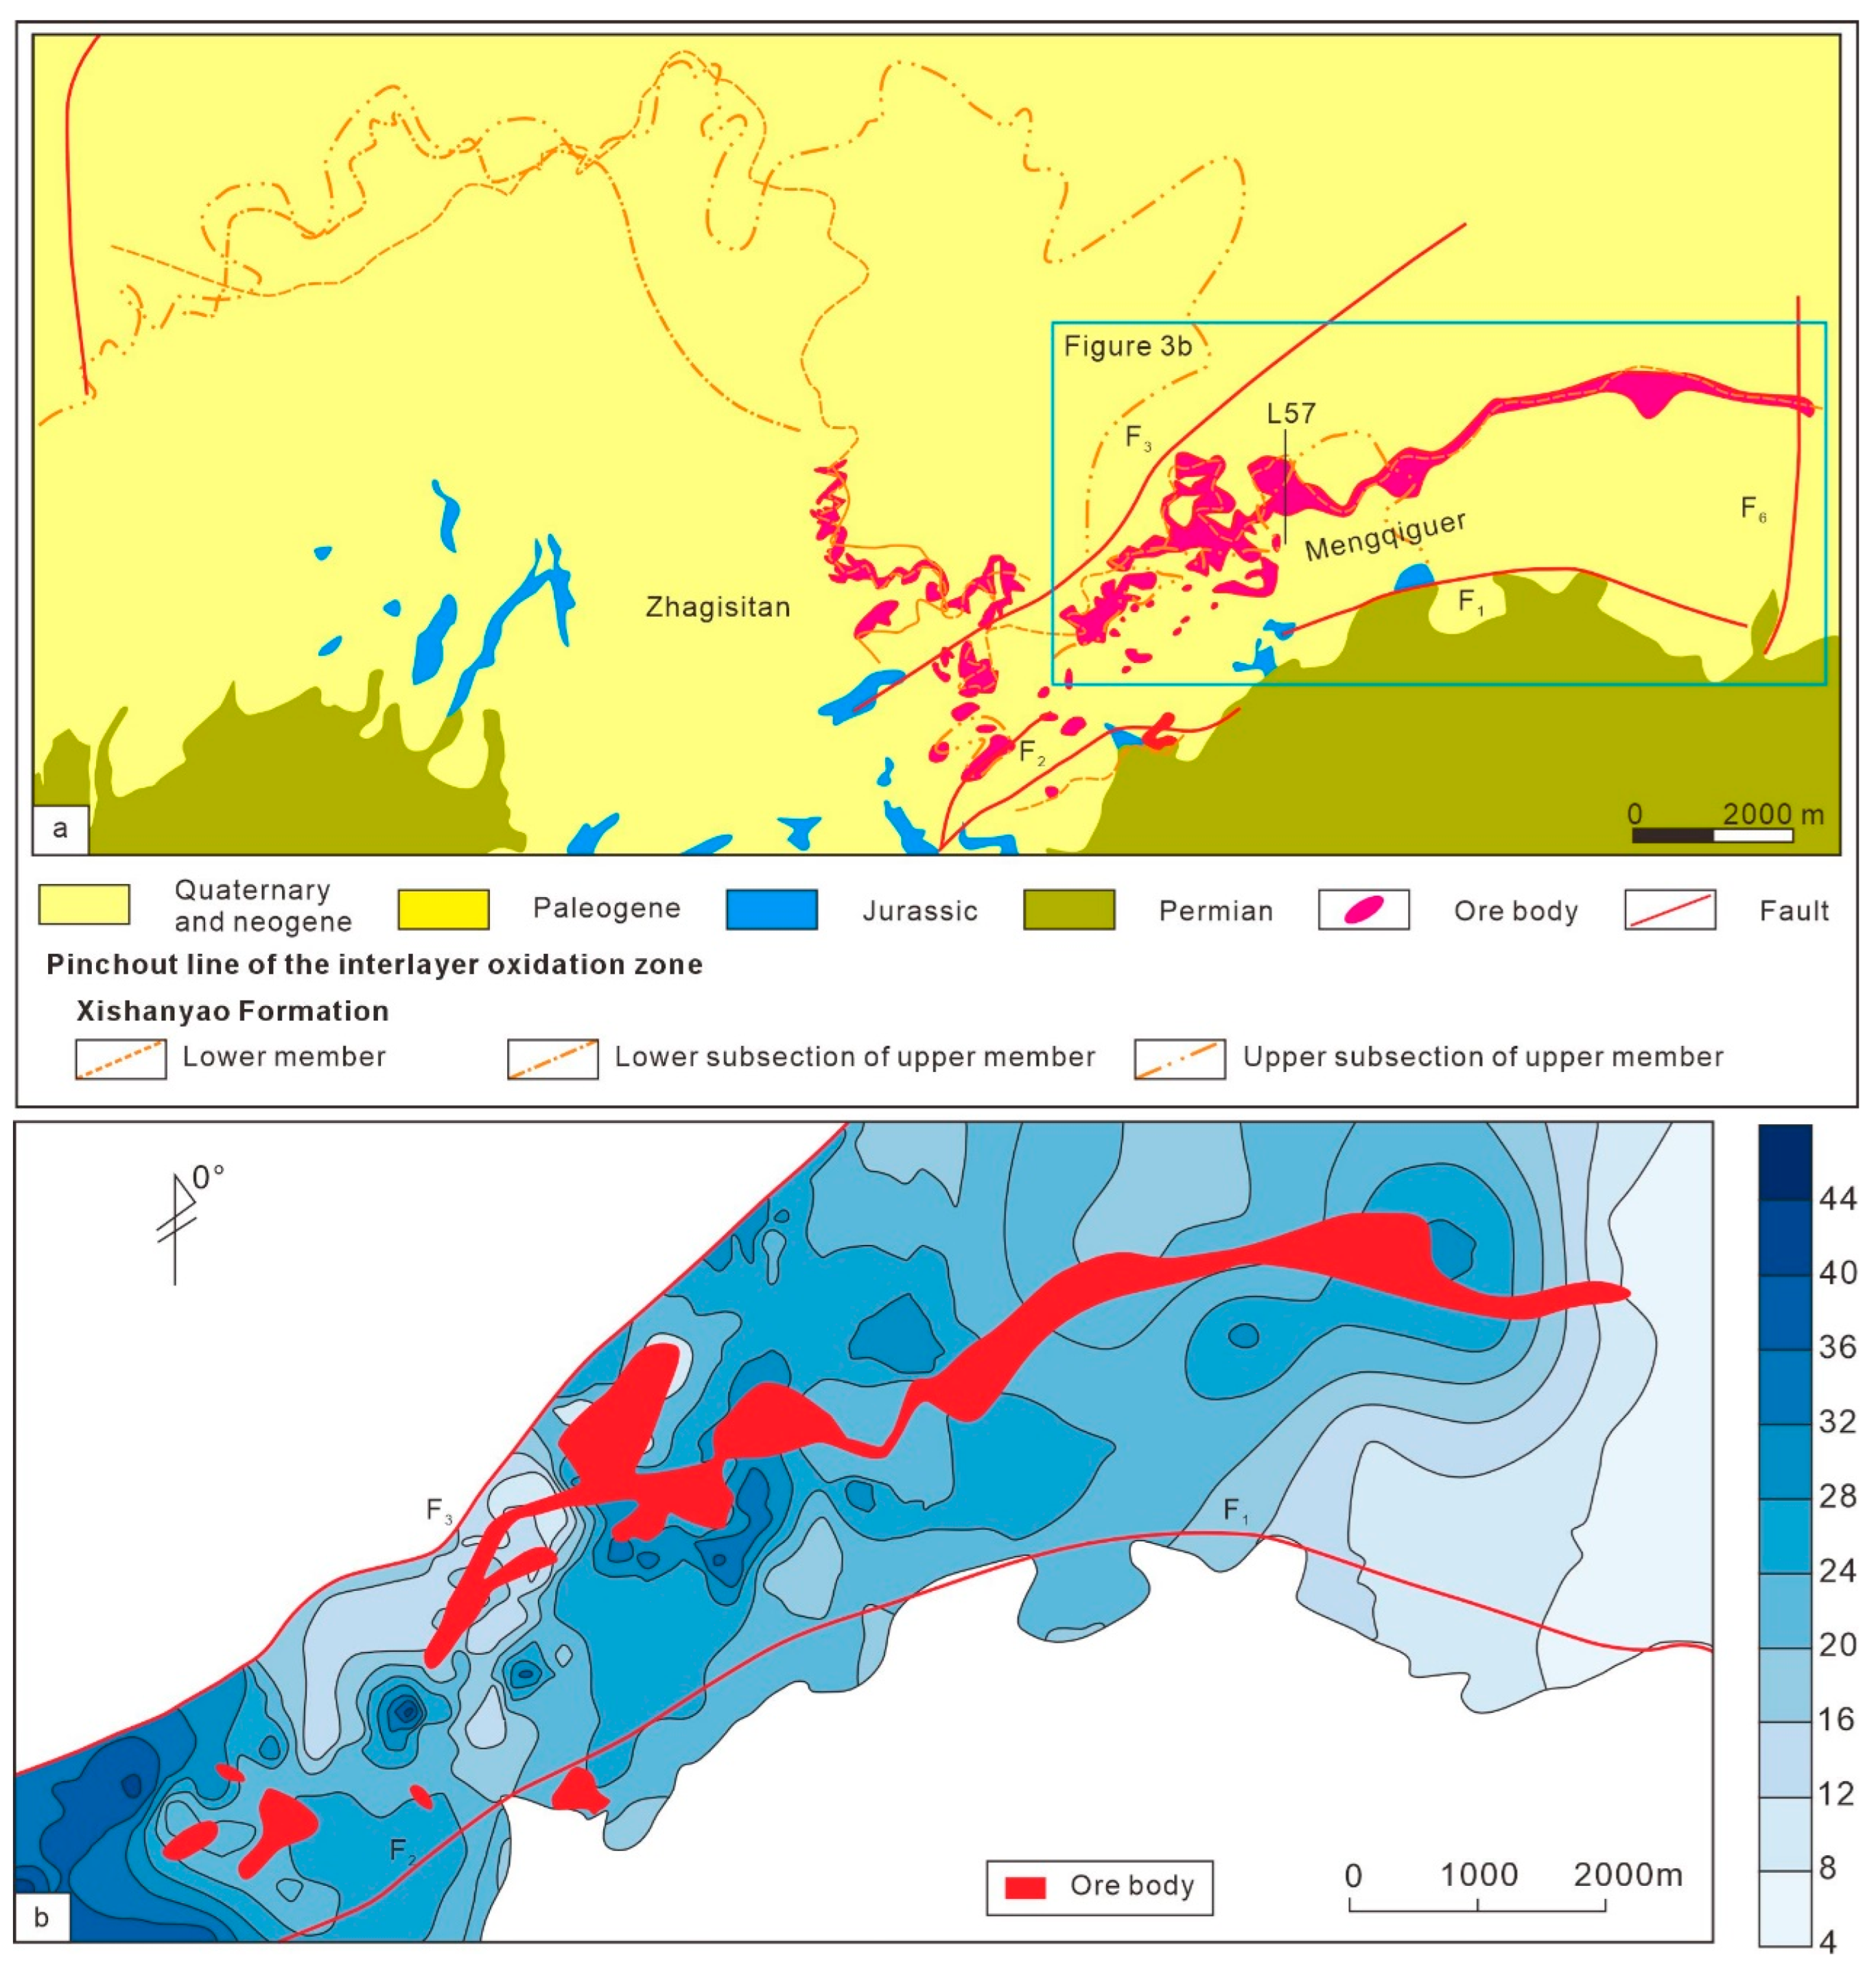
The Mengqiguer deposit is characterized by well-developed folds and faults. The main fault structures include F1, F2, and F3 (
Figure 3a,b). The EW- to NE-trending F1 is the main part of the basinal boundary-controlling fault, separating the Chabuchaer Mountain in the south from the Yili Basin in the north. The NE-trending F2 is a secondary fault of F1. F3 is a sinistral strike-slip thrust fault that separates the Mengqiguer deposit in the southeast from the Zajisitan deposit in the northwest (
Figure 3a,b). These faults exert strong control on groundwater flow dynamics and the development of interlayer oxidation zones in the Menqiguer area. They act as conduits for oxygen-containing groundwater, thereby influencing the scale and morphology of interlayer oxidation zones.
In the Mengqiguer deposit, interlayer oxidation zones developed within Middle–Lower Jurassic loose sandstones, and are controlled by structures, lithofacies-lithology, groundwater hydrodynamic systems, and the distribution of reductants. Field investigations indicated that four interlayer oxidation zones can be identified in the deposit, including the interlayer oxidation zones developing within the Sangonghe Formation and the lower Xishanyao Formations (
Figure 4). The lower Xishanyao Formation hosts the largest and most extensive uranium mineralization zone, and therefore was selected for study in this manuscript. The oxidation zone in the lower Xishanyao Formation extends throughout the deposit, about 23 km in length and 200–8000 m in width. In the Zhagisitan section (
Figure 3b), the sandstone bodies of the lower Xishanyao Formation have an average thickness of about 20.6 m, and the interlayer oxidation zones gradually develop along the sandstone bodies from southwest to northeast. The oxidation zone extends approximately 3 km in length, with a width ranging from 800 to 3800 m and a thickness of about 0.3 to 21 m. Its burial depth ranges from 70 to 450 m, showing an overall trend of shallower depths in the south and west, and deeper depths in the north and east. In the Mengqiguer section (
Figure 3b), the sandstone bodies of the lower Xishanyao Formation have an average thickness of 22.3 m, where the interlayer oxidation zones are most extensively developed. The oxidation zone as a whole extends from southwest to northeast, with a length of about 13 km, a width of 200 to 2600 m, and a thickness of 0.4 to 32 m. Its burial depth ranges from approximately 100 to 1100 m, gradually increasing toward the northeast.
2.3. Uranium Mineralization
Uranium mineralization in the lower Xishanyao Formation is strictly controlled by the interlayer oxidation zone. Uranium orebodies are usually developed around the S-shaped interlayer oxidation zone pinchout line (
Figure 3a). Consequently, the shapes of the orebodies are complex. Based on differences in orebody scale and morphology, the orebodies within the lower Xishanyao Formation of the Mengqiguer deposit are divided into three sectors: the western, central, and eastern sectors. From west to east, orebody scales increase and continuity improves, with the central sector exhibiting the largest scale and the best continuity.
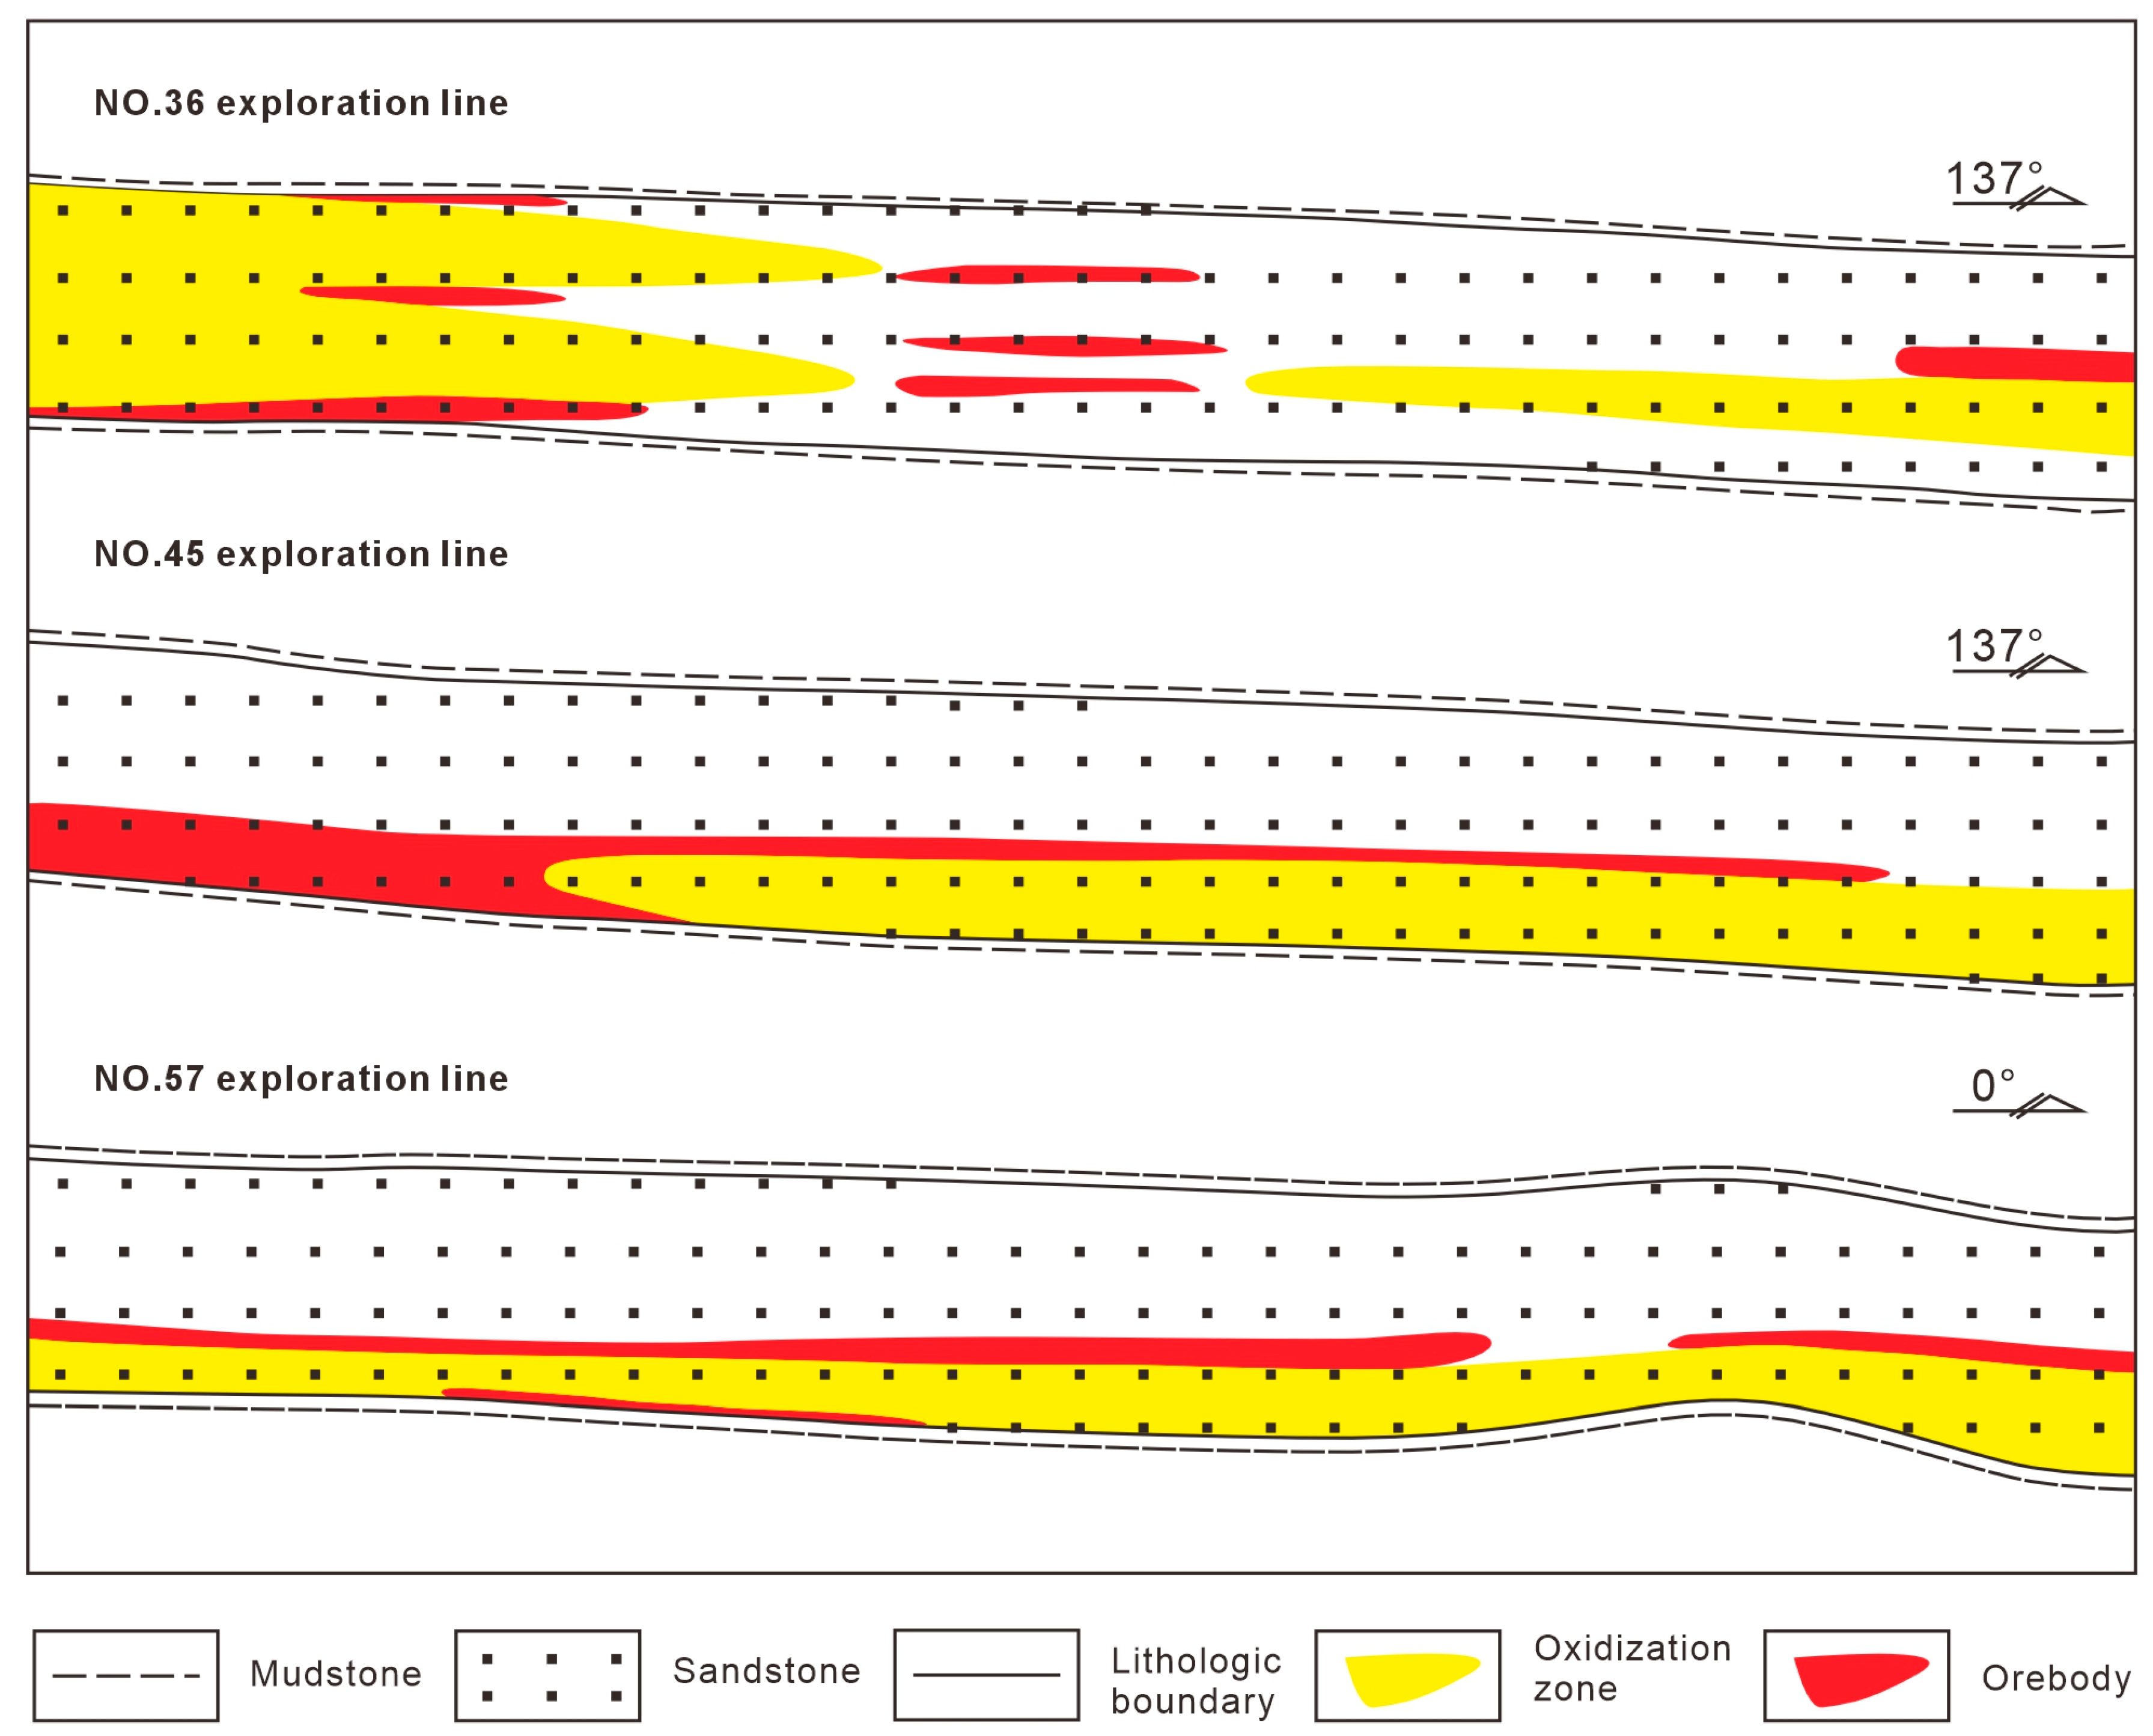
In the western sector, orebodies were influenced by the late-stage modification associated with an NE-trending hydrodynamic system, resulting in poor overall continuity of the ore zone (
Figure 3a). In cross-section (
Figure 5), the orebodies appear as short, plate-like or lenticular shapes, characterized by narrow widths. The central sector comprises two ore zones: the southern and the northern. The southern ore zone is distributed in isolated patches and is dominated by limb orebodies that are primarily tabular and stratoid in shape (
Figure 3). The northern ore zone is the main ore zone, and occurs as irregular strips with a complex Z-shaped morphology. In cross-section (
Figure 5), the orebodies mostly occur in roll-front shapes characterized by “short heads and long wings”. The eastern-sector orebodies are solely developed in irregular strips extending toward the northeast (
Figure 3). These consist primarily of tabular orebodies with relatively good continuity. In cross-section (
Figure 5), they manifest as short tabular, long tabular, and short roll-front shapes. The orebodies in this sector are characterized by relatively large widths, significant average thicknesses, and high average grades.
3. Sampling and Analytical Methods
Samples were primarily collected from drill cores in the Mengqiguer deposit. Sandstone samples from the strong oxidizing and moderate–weak oxidizing zones, transition zone (ore zone) and primary unaltered zone were collected based on color, lithology and gamma-ray testing using an HD-200 gamma radiometer.
Whole-rock major elements and redox-sensitive elements (U, Th, C, S, Fe
2+ and Fe
3+) in samples from the lower member of the Xishanyao Formation in the Mengqiguer deposit were analyzed at the No. 216 Research Institute of Nuclear Industry. Major elements were analyzed using a wavelength-dispersive X-ray fluorescence spectrometer (Axios mAX), with a relative error below 5%. Details of the analytical methods for major elements follow GB/T 14506.28-2010 [
23], a national recommended standard for chemical composition analysis of silicate rocks. Redox-sensitive elements were analyzed using a NexION350X ICP-MS and an HCS-801S analyzer (PerkinElmer, Waltham, MA, USA). For the details of the analytical method, refer to GB/T 14506.30-2010 (U and Th; [
24]), GB/T 19145-2022 (C; [
25]), GB/T 14506.13-2010 (S; [
26]), GB/T 14506.14-2010 (Fe
2+; [
27]), and GB/T 14506.28-2010 (Fe
3+; [
23]).
Quantitative mineralogical characterization was performed using a PANalytical X’PRO MPD (40 kV, 40 mA, Cu-Kα radiation) following standard SY/6201-1996 protocols. For bulk mineral quantification, randomly oriented powder aggregates were scanned with phase abundances determined via the Rietveld refinement method. To identify clay species, the <2 μm fraction was isolated through centrifugal sedimentation after the removal of organic matter and carbonates. These samples were prepared as oriented aggregates using the “pipette-on-slide” method to enhance basal reflections and scanned from 3° to 30°.
SEM-based petrographic and mineralogical analyses were conducted at the State Key Laboratory of Nuclear Resources and Environment at East China University of Technology. Samples were examined using both an optical microscope and a FEI-Nova Nano-SEM 450 scanning electron microscope (SEM, FEI Czech s.r.o., Brno, Czech Republic). Major, trace and rare earth element analyses of uranium minerals were conducted by electron microprobe analysis (EMPA), and the results are expressed in weight percent oxides. A JEOL JXA 8100 electron microprobe analyzer was used (JEOL Ltd., Tokyo, Japan). Analytical conditions were a 15 kV accelerating voltage and a 20 nA beam current with 2 μm beam diameter. The following standards were used: SiO2-garnet, CaO-dolomite, FeO-hematite, Al2O3-biotite, MnO-rhodonite, P2O5-apatite, TiO2-Ti, UO2 and ThO2-U-Th-Pb oxide, PbO-galena, La2O3-monazite, Ce2O3-monazite, Pr2O3-Pr, Nd2O3-Nd, Sm2O3-Sm, Eu2O3-Eu, Gd2O3-Gd, Tb2O3-Tb, Dy2O3-Dy, Ho2O3-Ho, Er2O3-Er, Tm2O3-Tm, Yb2O3-Yb, Lu2O3-Lu, Y2O3-Y, and Zr2O3-zircon.
4. Results
4.1. Rock Zoning
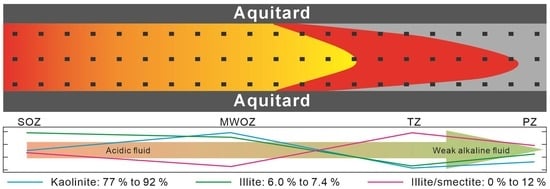
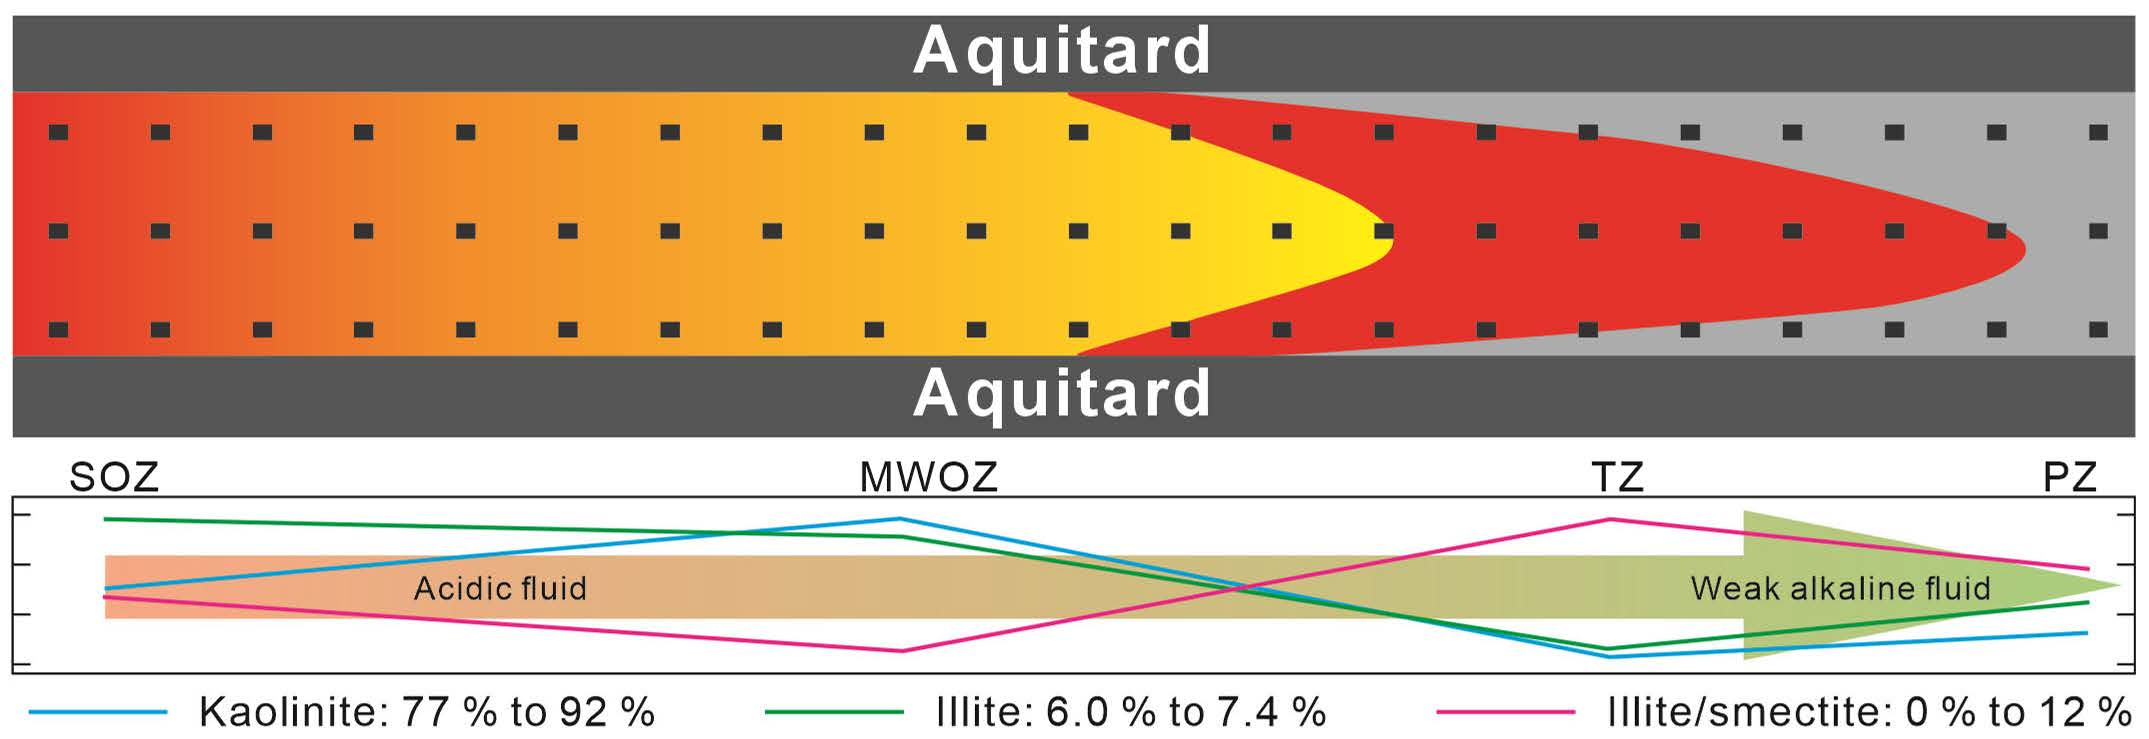
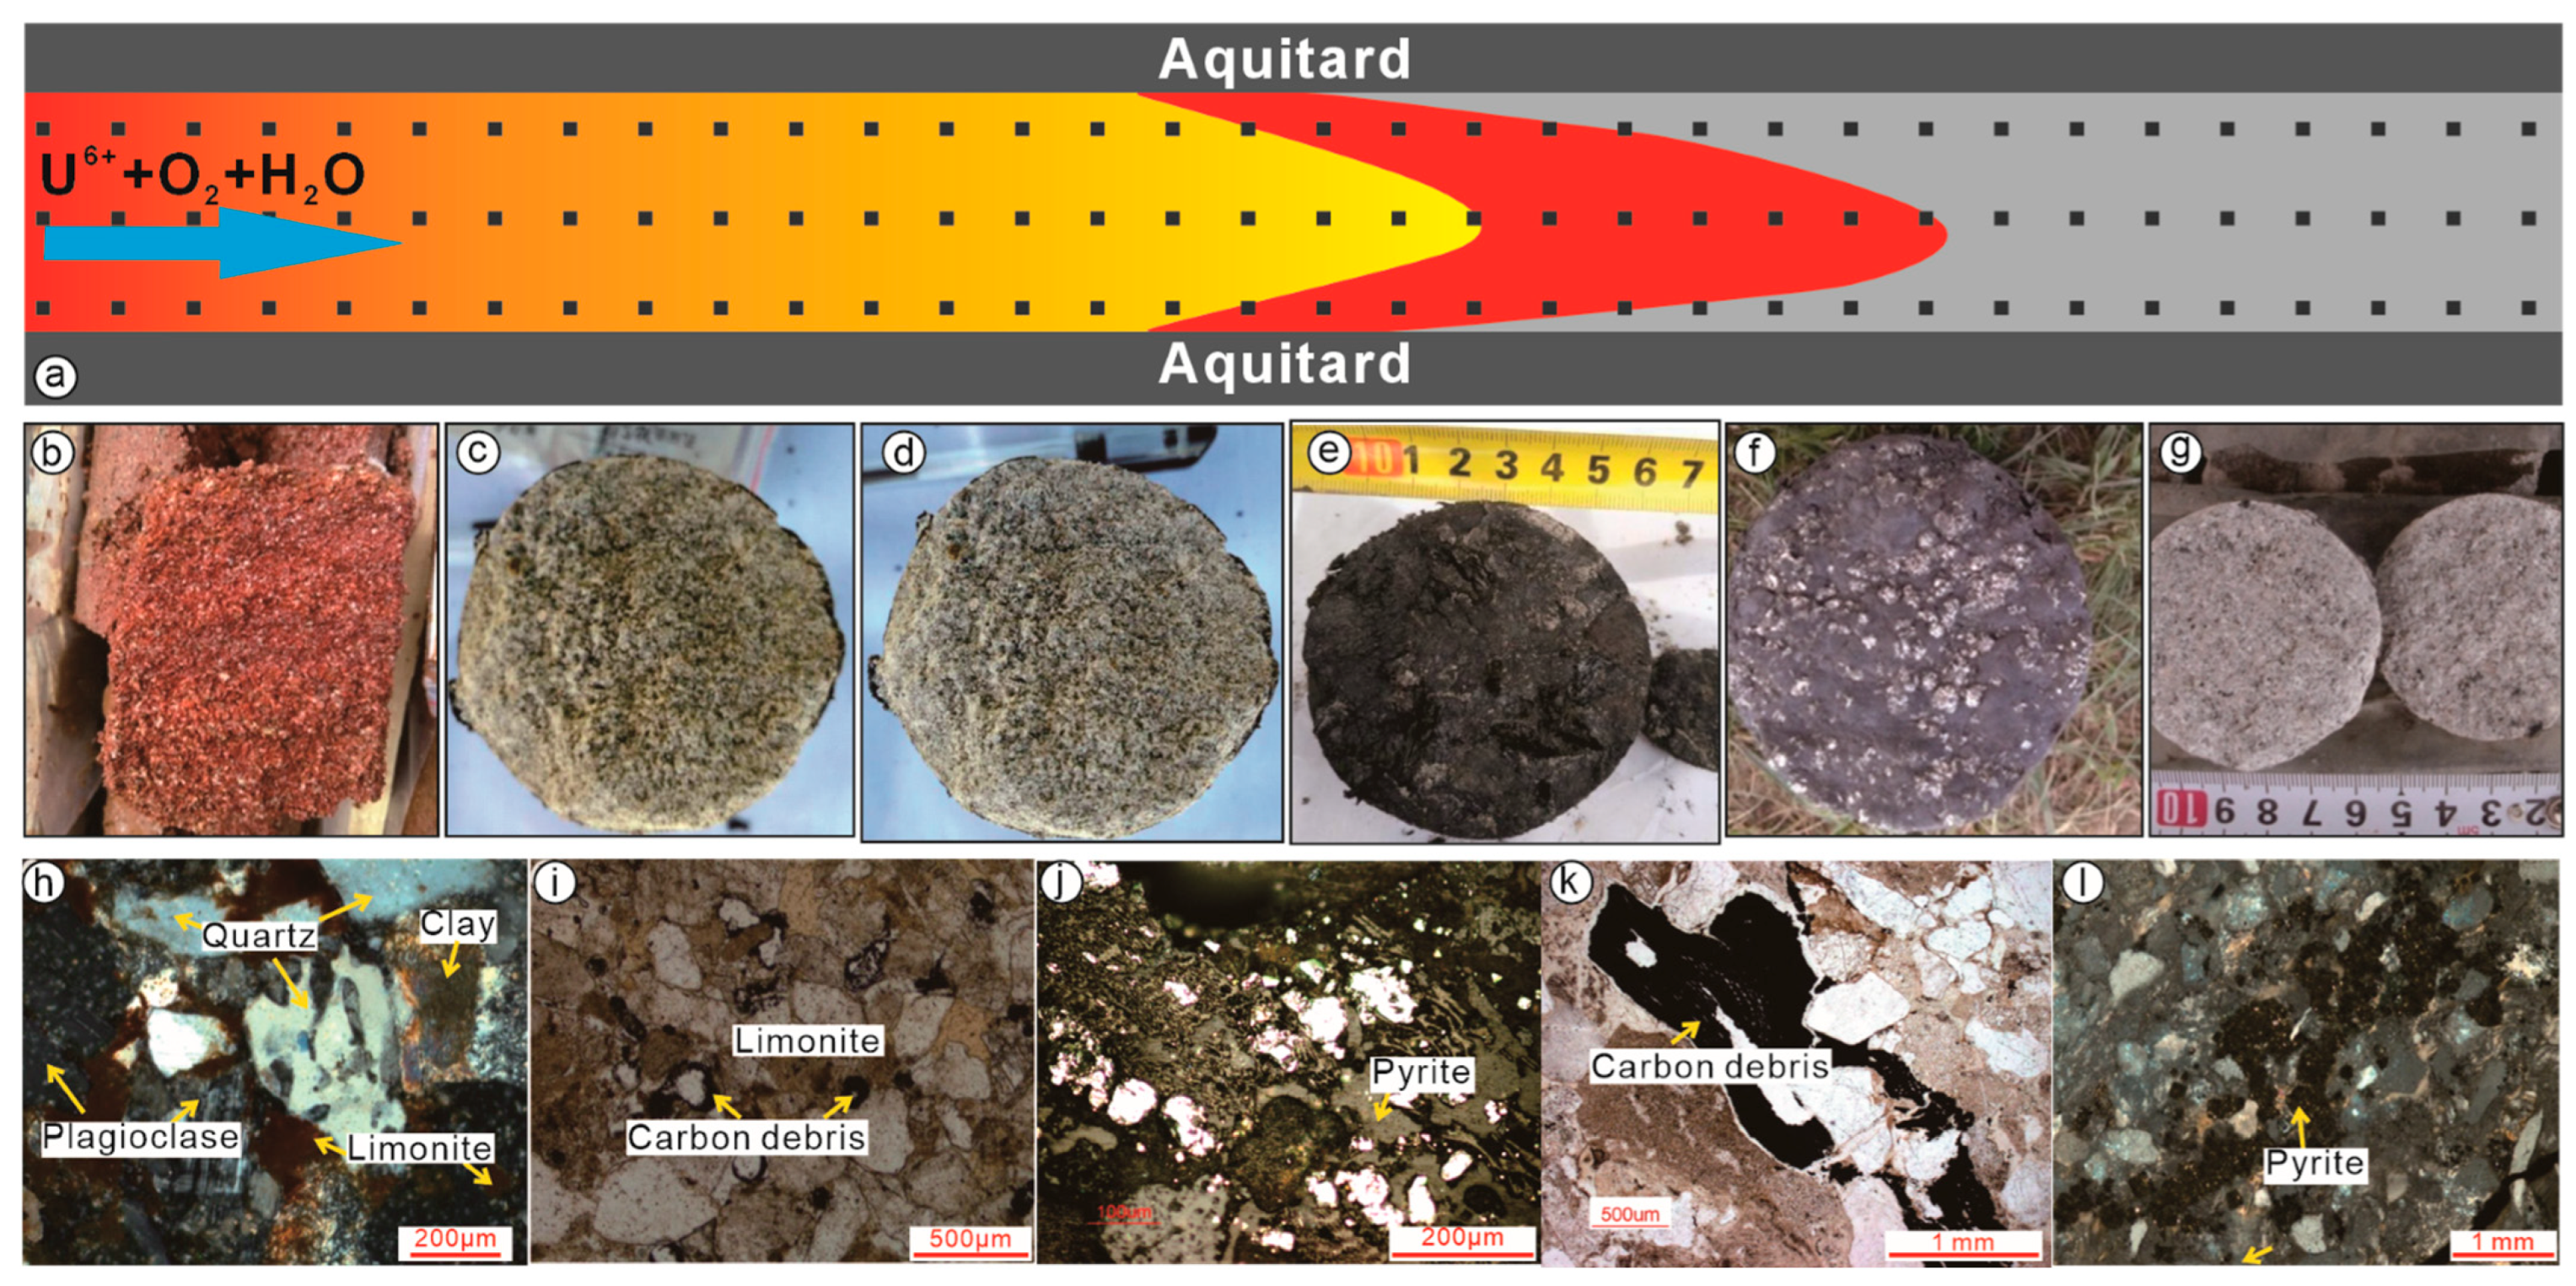
Based on lithological characteristics, mineral assemblages, and geochemical indicators, the interlayer oxidation zone of the Xishanyao Formation can be subdivided into four zones (
Figure 6a): the strong oxidation zone (
Figure 6b), the moderate–weak oxidation zone (
Figure 6c,d), the transition zone (
Figure 6e,f), and the unaltered zone (
Figure 6g).
Rocks in the strong oxidation zone are predominantly yellow, red, and yellowish-brown in color (
Figure 6b). Ferrous iron minerals are extensively oxidized to limonite (
Figure 6h), goethite and other iron minerals. Hematite commonly occurs as disseminations within clay minerals. Organic matter, including carbonaceous fragments, is largely absent. Quartz grains exhibit corrosion characteristics, and primary massive siderite is observed to have been oxidized into hematite (or goethite) aggregates.
Rocks in the moderate–weak oxidation zone are mainly light yellow to yellowish-white (
Figure 6c,d). Most low-valence iron minerals are oxidized to goethite and limonite (
Figure 6i). Organic matter is largely oxidized in this zone, leaving only minor charred plant residues (
Figure 6i). Quartz grains exhibit both corrosion and secondary overgrowth.
Rocks in the transition zone are mainly gray to black (
Figure 6e,f). This zone corresponds to the uranium mineralized zone. High-grade ores appear gray-black to black due to increased carbonaceous fragments (
Figure 6k). In drill cores, incomplete exposure of gray-white bleaching zones along the strike is observed, with rocks exhibiting strong kaolinization. Pyrite and goethite coexist, with pyrite being dominant and exhibiting diverse morphologies (
Figure 6j). Detrital pyrite typically shows euhedral forms, while authigenic pyrite occurs as nodules or strawberry-like aggregates. Pyrite also occurs as pore-filling cement. Ore-stage fine-grained hematite veinlets can also be found. Carbonized plant fragments and organic matter are highly enriched in this zone (
Figure 6k). This zone hosts roll-front ore fronts and associated element enrichment.
Rocks within the unaltered zone are gray to light gray (
Figure 6g). Feldspars show weak kaolinization overall. Quartz grains are clean, with minor corrosion in some cases. Iron minerals occur mainly in low-valence forms, dominated by pyrite with some siderite (
Figure 6l). In the unaltered zone, ribbon-like and massive-shaped carbonaceous debris are common.
4.2. Clay Minerals
Detrital components constitute up to ~90% of the sandstone, including 69% to 80% mineral grains and 10% to 20% lithic fragments. Mineral grains are dominated by quartz (35% to 60%), with potassium feldspar (11% to 20%) being the secondary component (
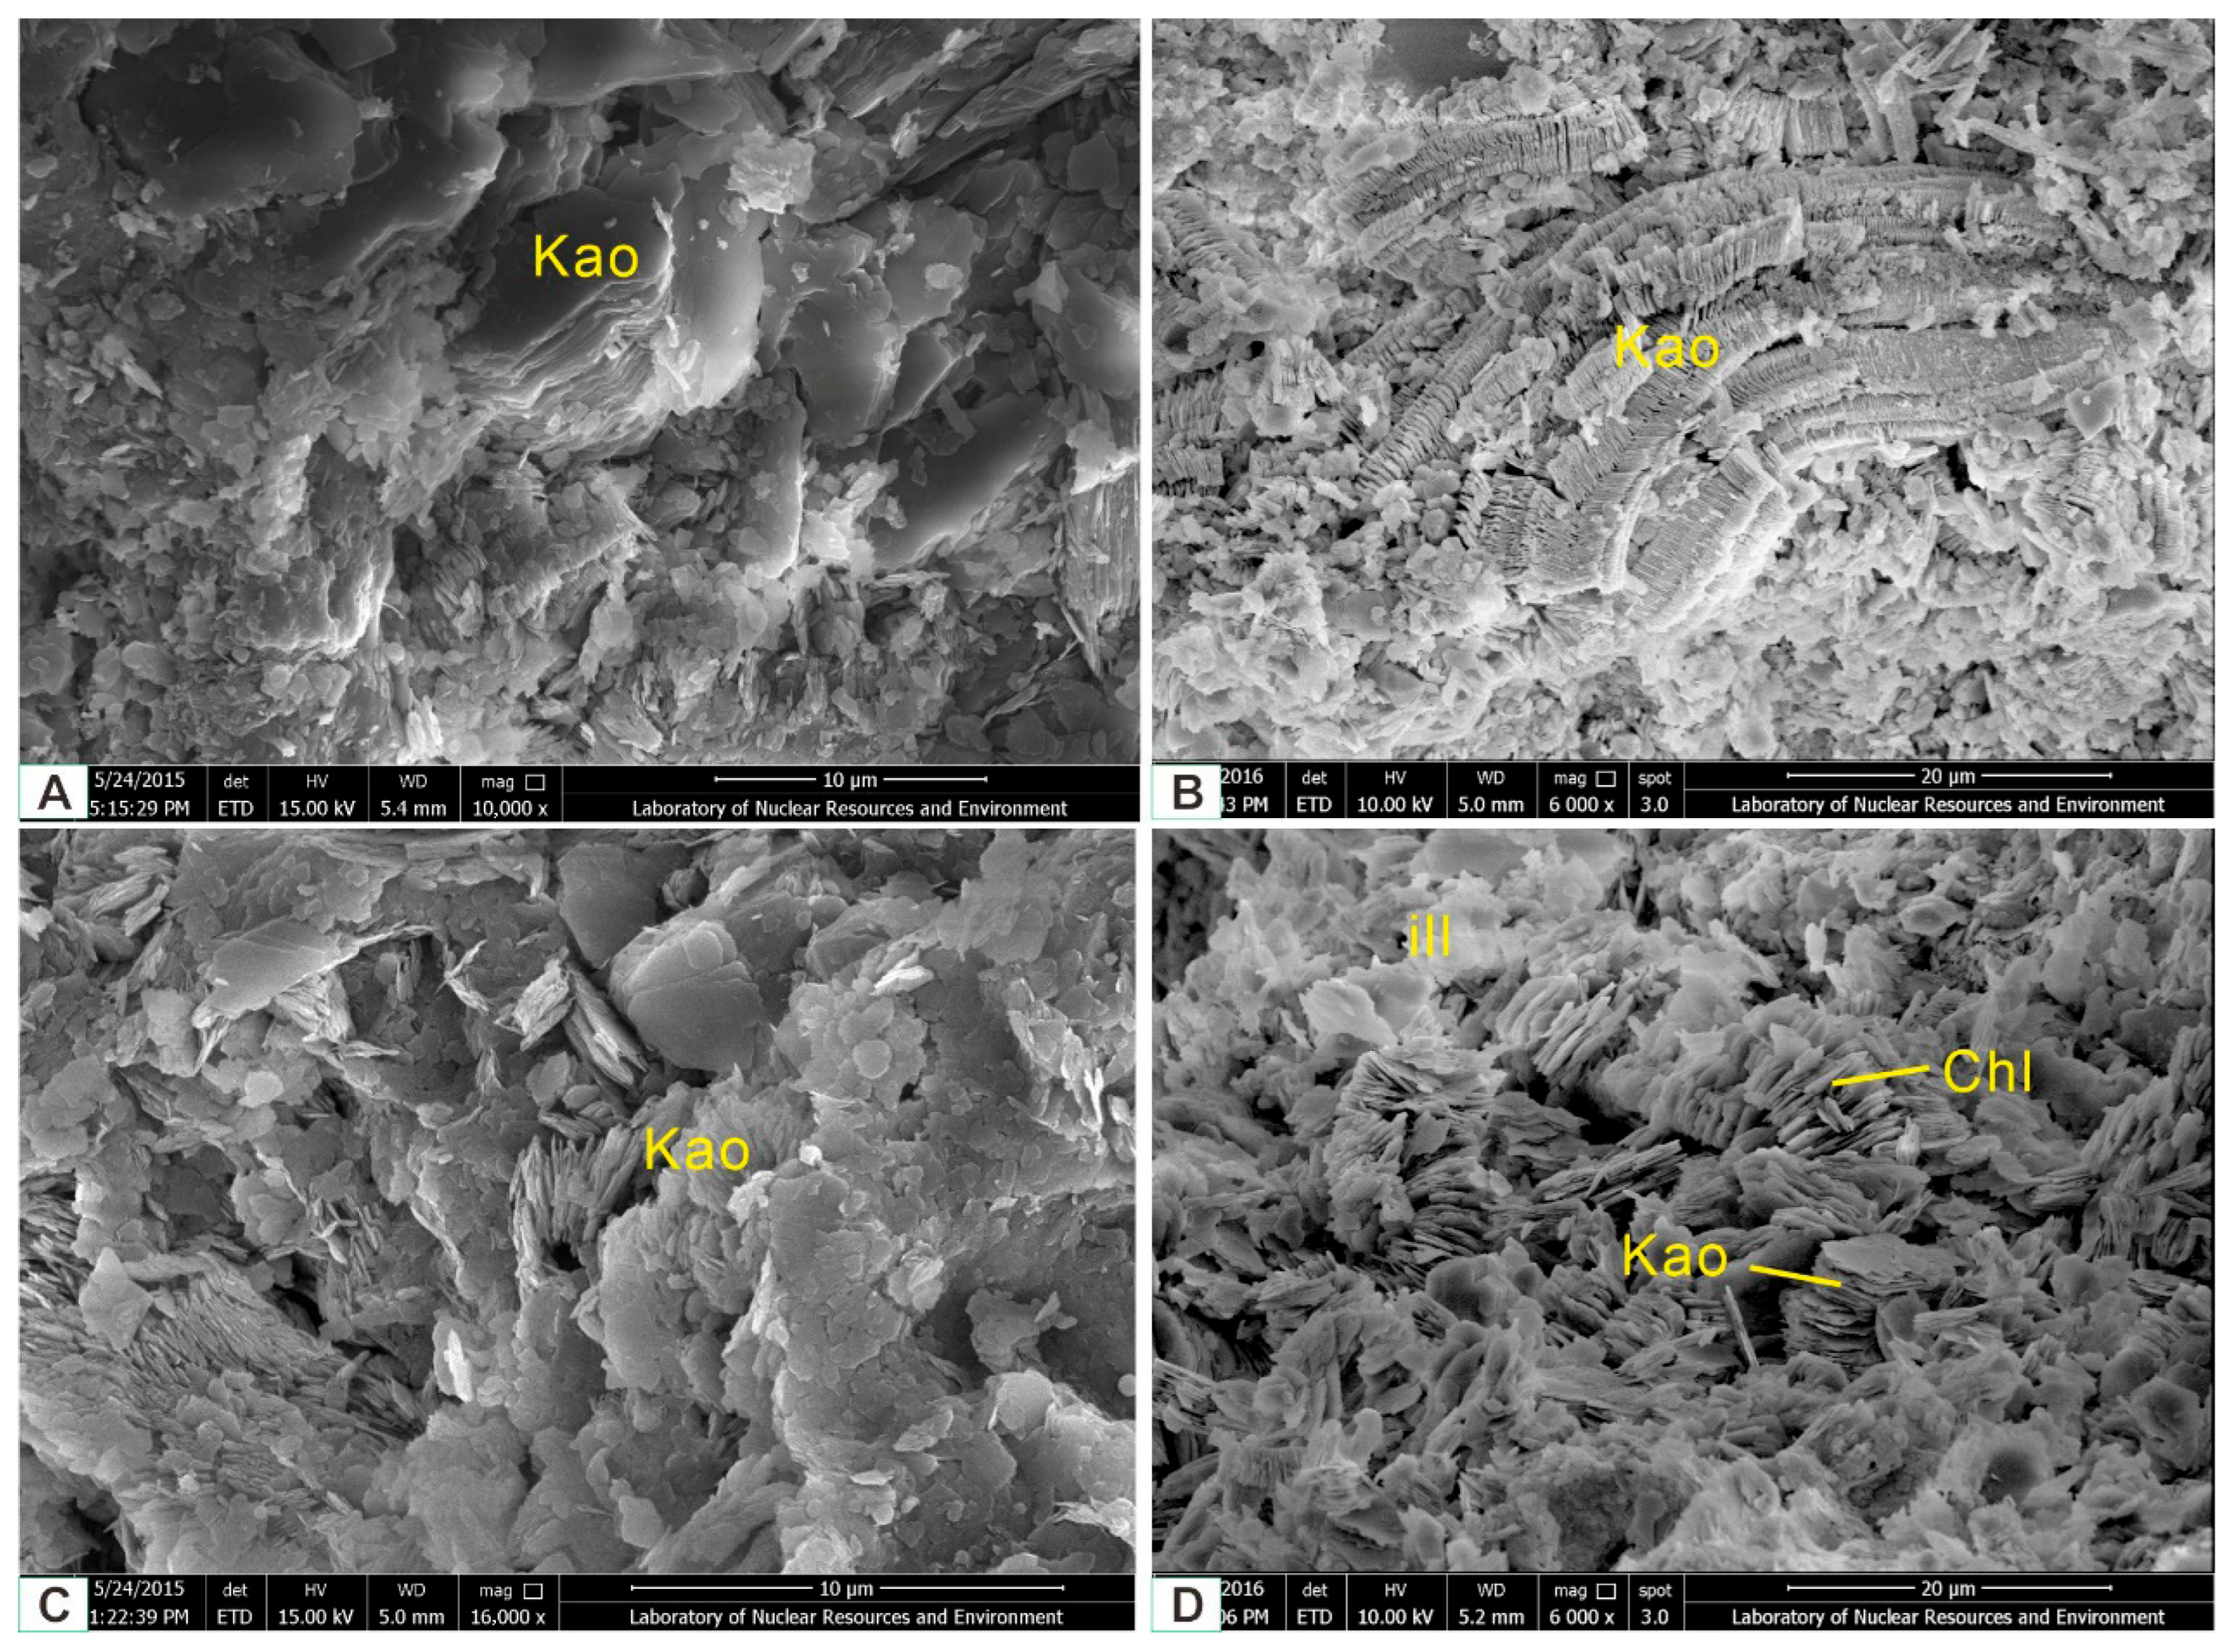
Figure 6h–l). These debris grains are poorly rounded and display irregular shapes. Interstitial material consists of over 90% matrix and less than 10% cement. The matrix mainly comprises clay minerals, and the cement mostly contains carbonate with minor iron and siliceous minerals. X-ray diffraction analysis shows that the clay minerals in the Mengqiguer deposit are composed of kaolinite, illite, an illite–smectite mixed layer, smectite, and chlorite. Kaolinite occurs in platy (
Figure 7A), vermicular (
Figure 7B), and booklet-like forms (
Figure 7C). It mainly fills intergranular pores, with minor occurrences on grain surfaces, such as K-feldspar. Illite mostly occurs as sharp flakes and hair-like fibers (
Figure 7C), attached to booklet-like kaolinite, or as platy forms on the surface of grains. Chlorite mainly occurs as fine platy and acicular crystals (
Figure 7D), coexisting with kaolinite.
The relative content of clay minerals from the Xishanyao Formations is listed in
Table 1. Kaolinite and illite are the dominant clay minerals in the Mengqiguer deposit. Kaolinite contents are highest in oxidation zones (85.1% and 91.3%, respectively), and lower in the transition and unaltered zones (78.7% and 80.0%, respectively). Illite shows a similar distribution pattern to kaolinite. In contrast, the variation in the relative content of illite–smectite (I/S) mixed-layer clays shows an inverse trend. I/S mixed-layer clay contents in the oxidation zones (strong oxidation: 4.59%; and moderate–weak oxidation: 0.80%) are significantly lower than those in the transition (11.8%) and unaltered (7.95%) zones.
4.3. Whole-Rock Major Elements
A total of 110 samples from the lower member of the Xishanyao Formation in the Mengqiguer deposit were analyzed. These samples include 28 samples from the strongly oxidized zone, 29 from the moderate–weak oxidation zone, 27 from the transition zone, and 26 from the unaltered zone, and the results are presented in
Table 2.
Whole-rock major element compositions show systematic variations across the redox gradient. SiO2 is the dominant oxide in all samples, with higher median values in the oxidized zones (85.68 to 86.47 wt.%) than in the transition and unaltered zones (~84.44 wt.%). In contrast, Al2O3 reaches a maximum median value in the transition zone (10.51 wt.%), indicating enrichment at the redox boundary. Total iron (Fe2O3t) and FeO decrease from the unaltered zone toward the oxidized zones, whereas the Fe2O3/FeO ratio increases markedly, reaching maximum values in the strongly oxidized zone. Na2O contents remain consistently low (0.10–0.18 wt.%) across all zones. K2O shows elevated values in the transition zone (median 2.29 wt.%), while the K/Na ratios are higher in the oxidized zones. The Al2O3/TiO2 ratio also peaks in the transition zone. CaO exhibits significant variability in the oxidized zones, whereas MgO, MnO, and P2O5 show limited variation. Overall, major elements and geochemical ratios define a clear redox-controlled trend from the oxidized zone to the unaltered zone.
4.4. Uranium Minerals
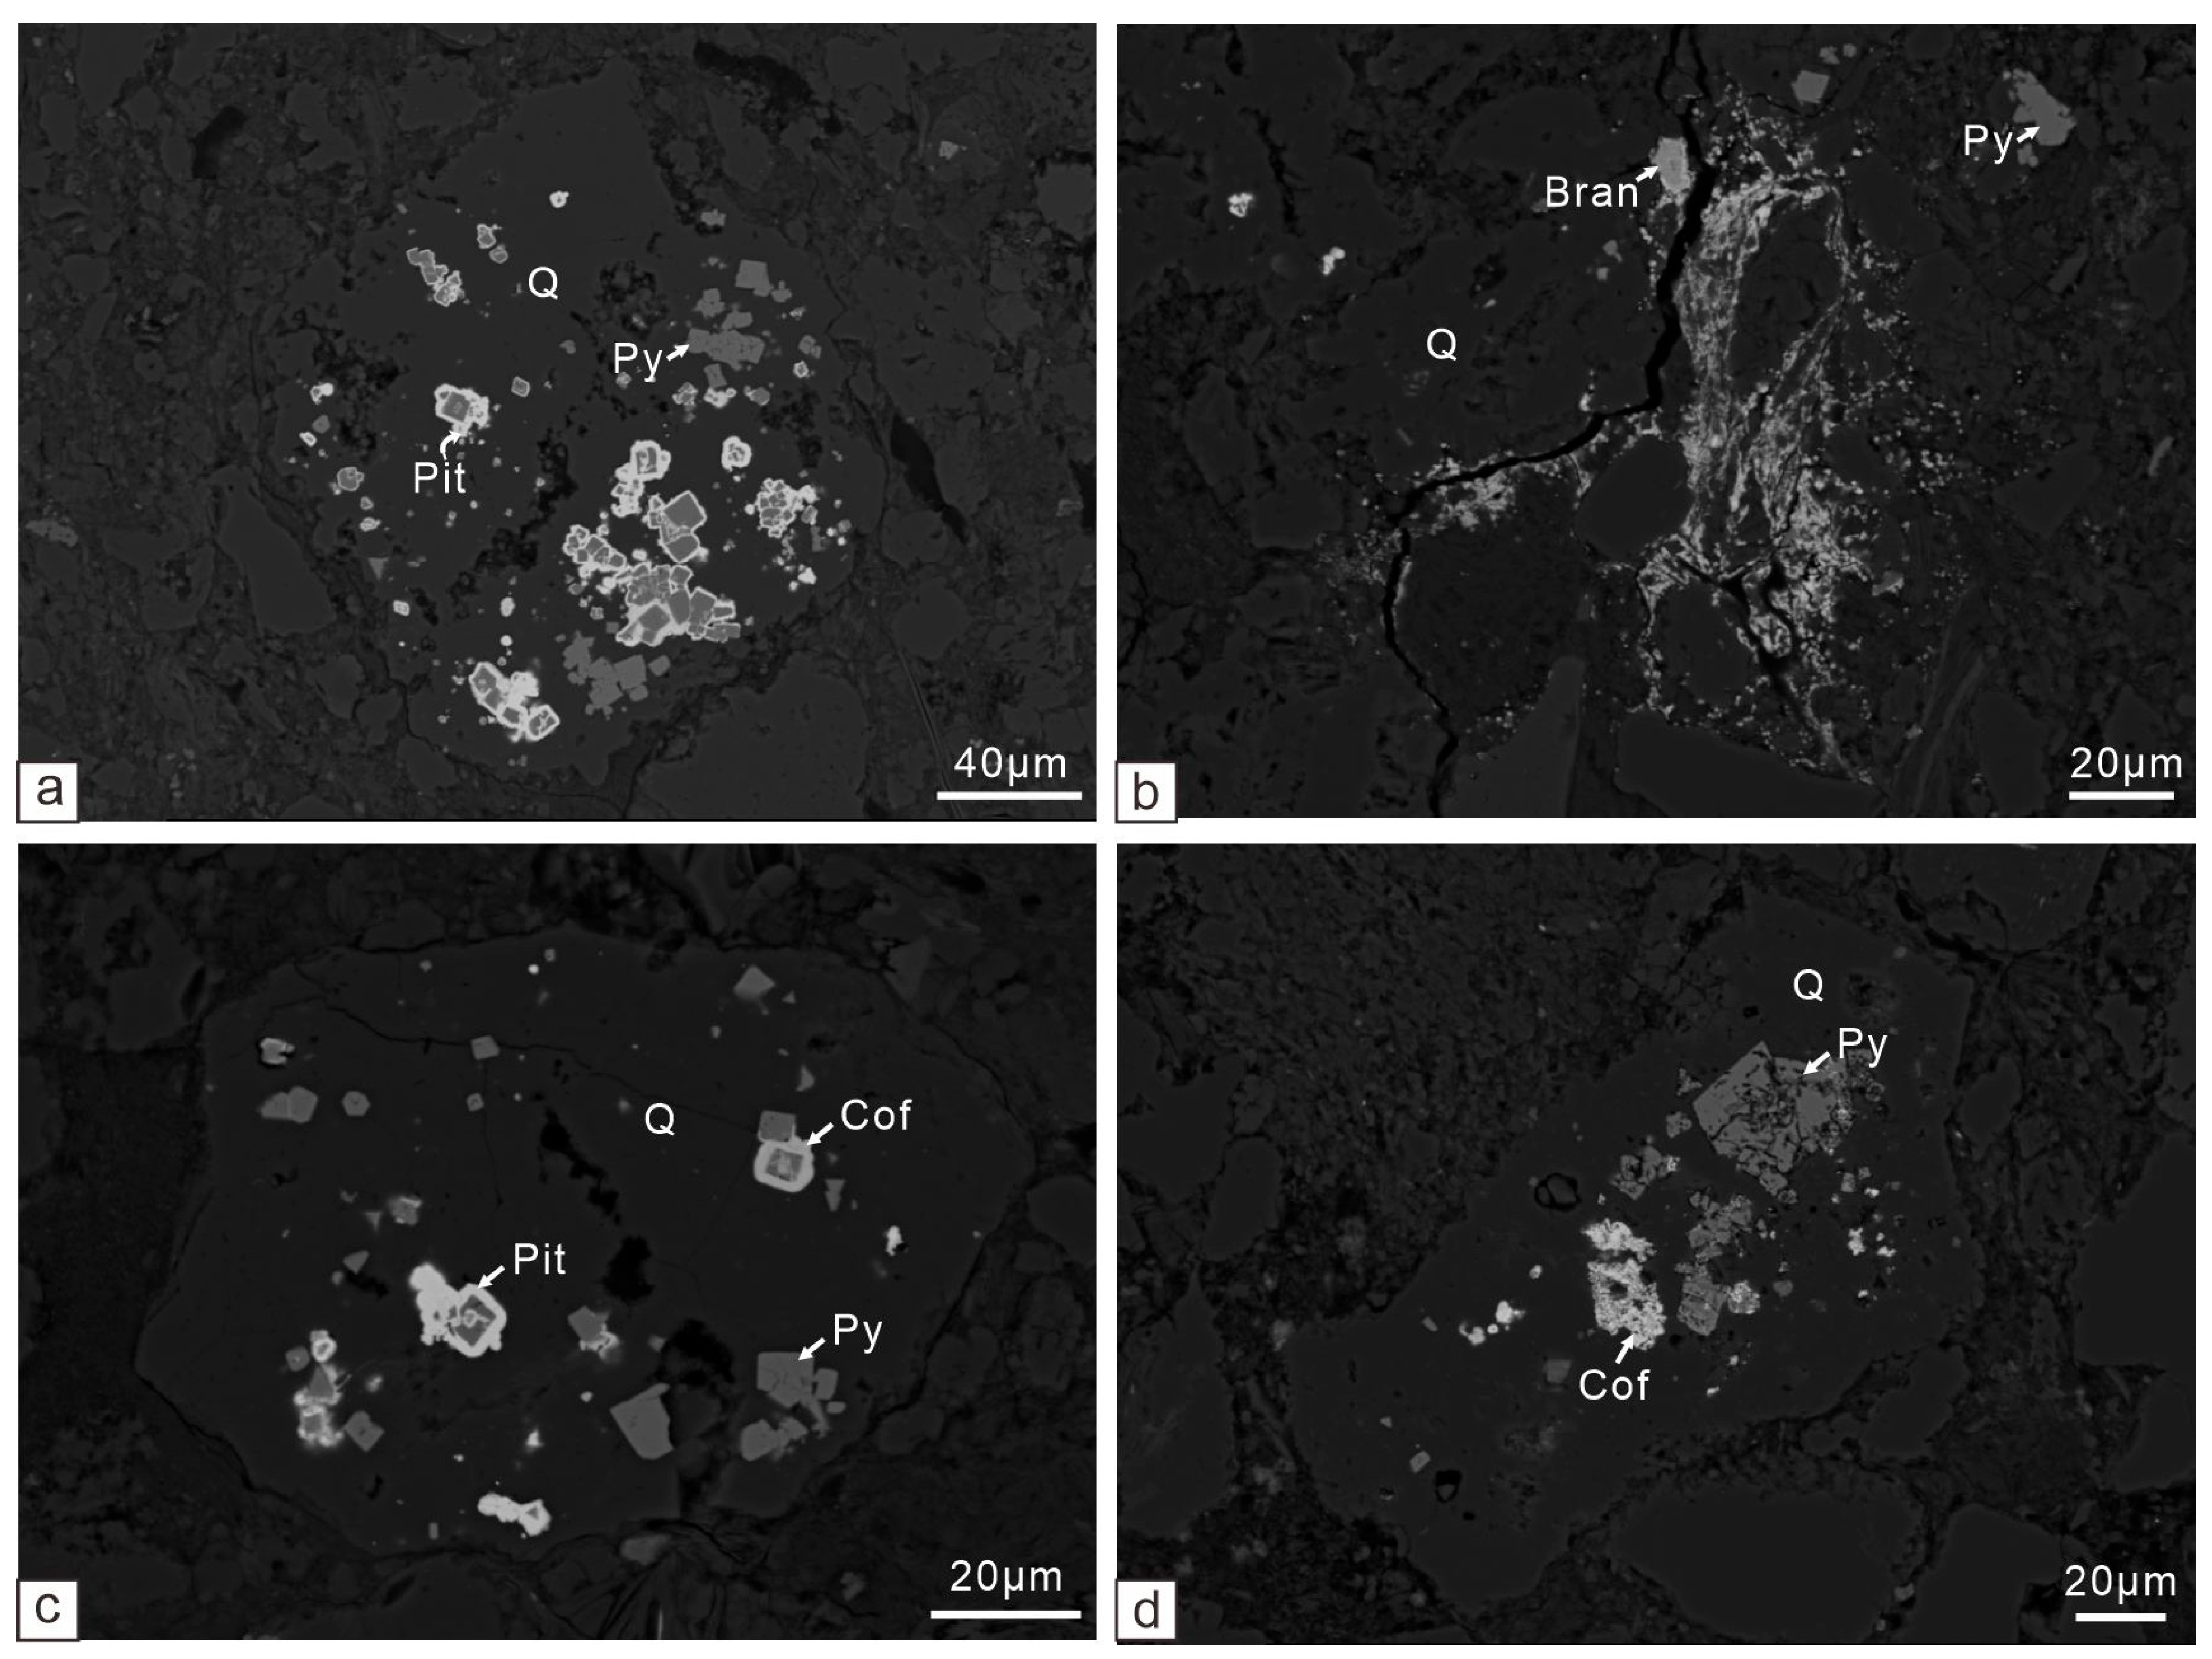
In the Mengqiguer deposit, uranium minerals are dominated by uraninite, coffinite and brannerite with minor carnotite and troegerite. These tetravalent uranium minerals are dominantly disseminated in the interstitial spaces of the sandstone, microfractures within detrital grains, and cell cavities of carbonaceous debris, often occurring in microfractures within or surrounding pyrite (
Figure 8a–d). The chemical compositions of uranium minerals from the Mengqiguer deposit are reported in
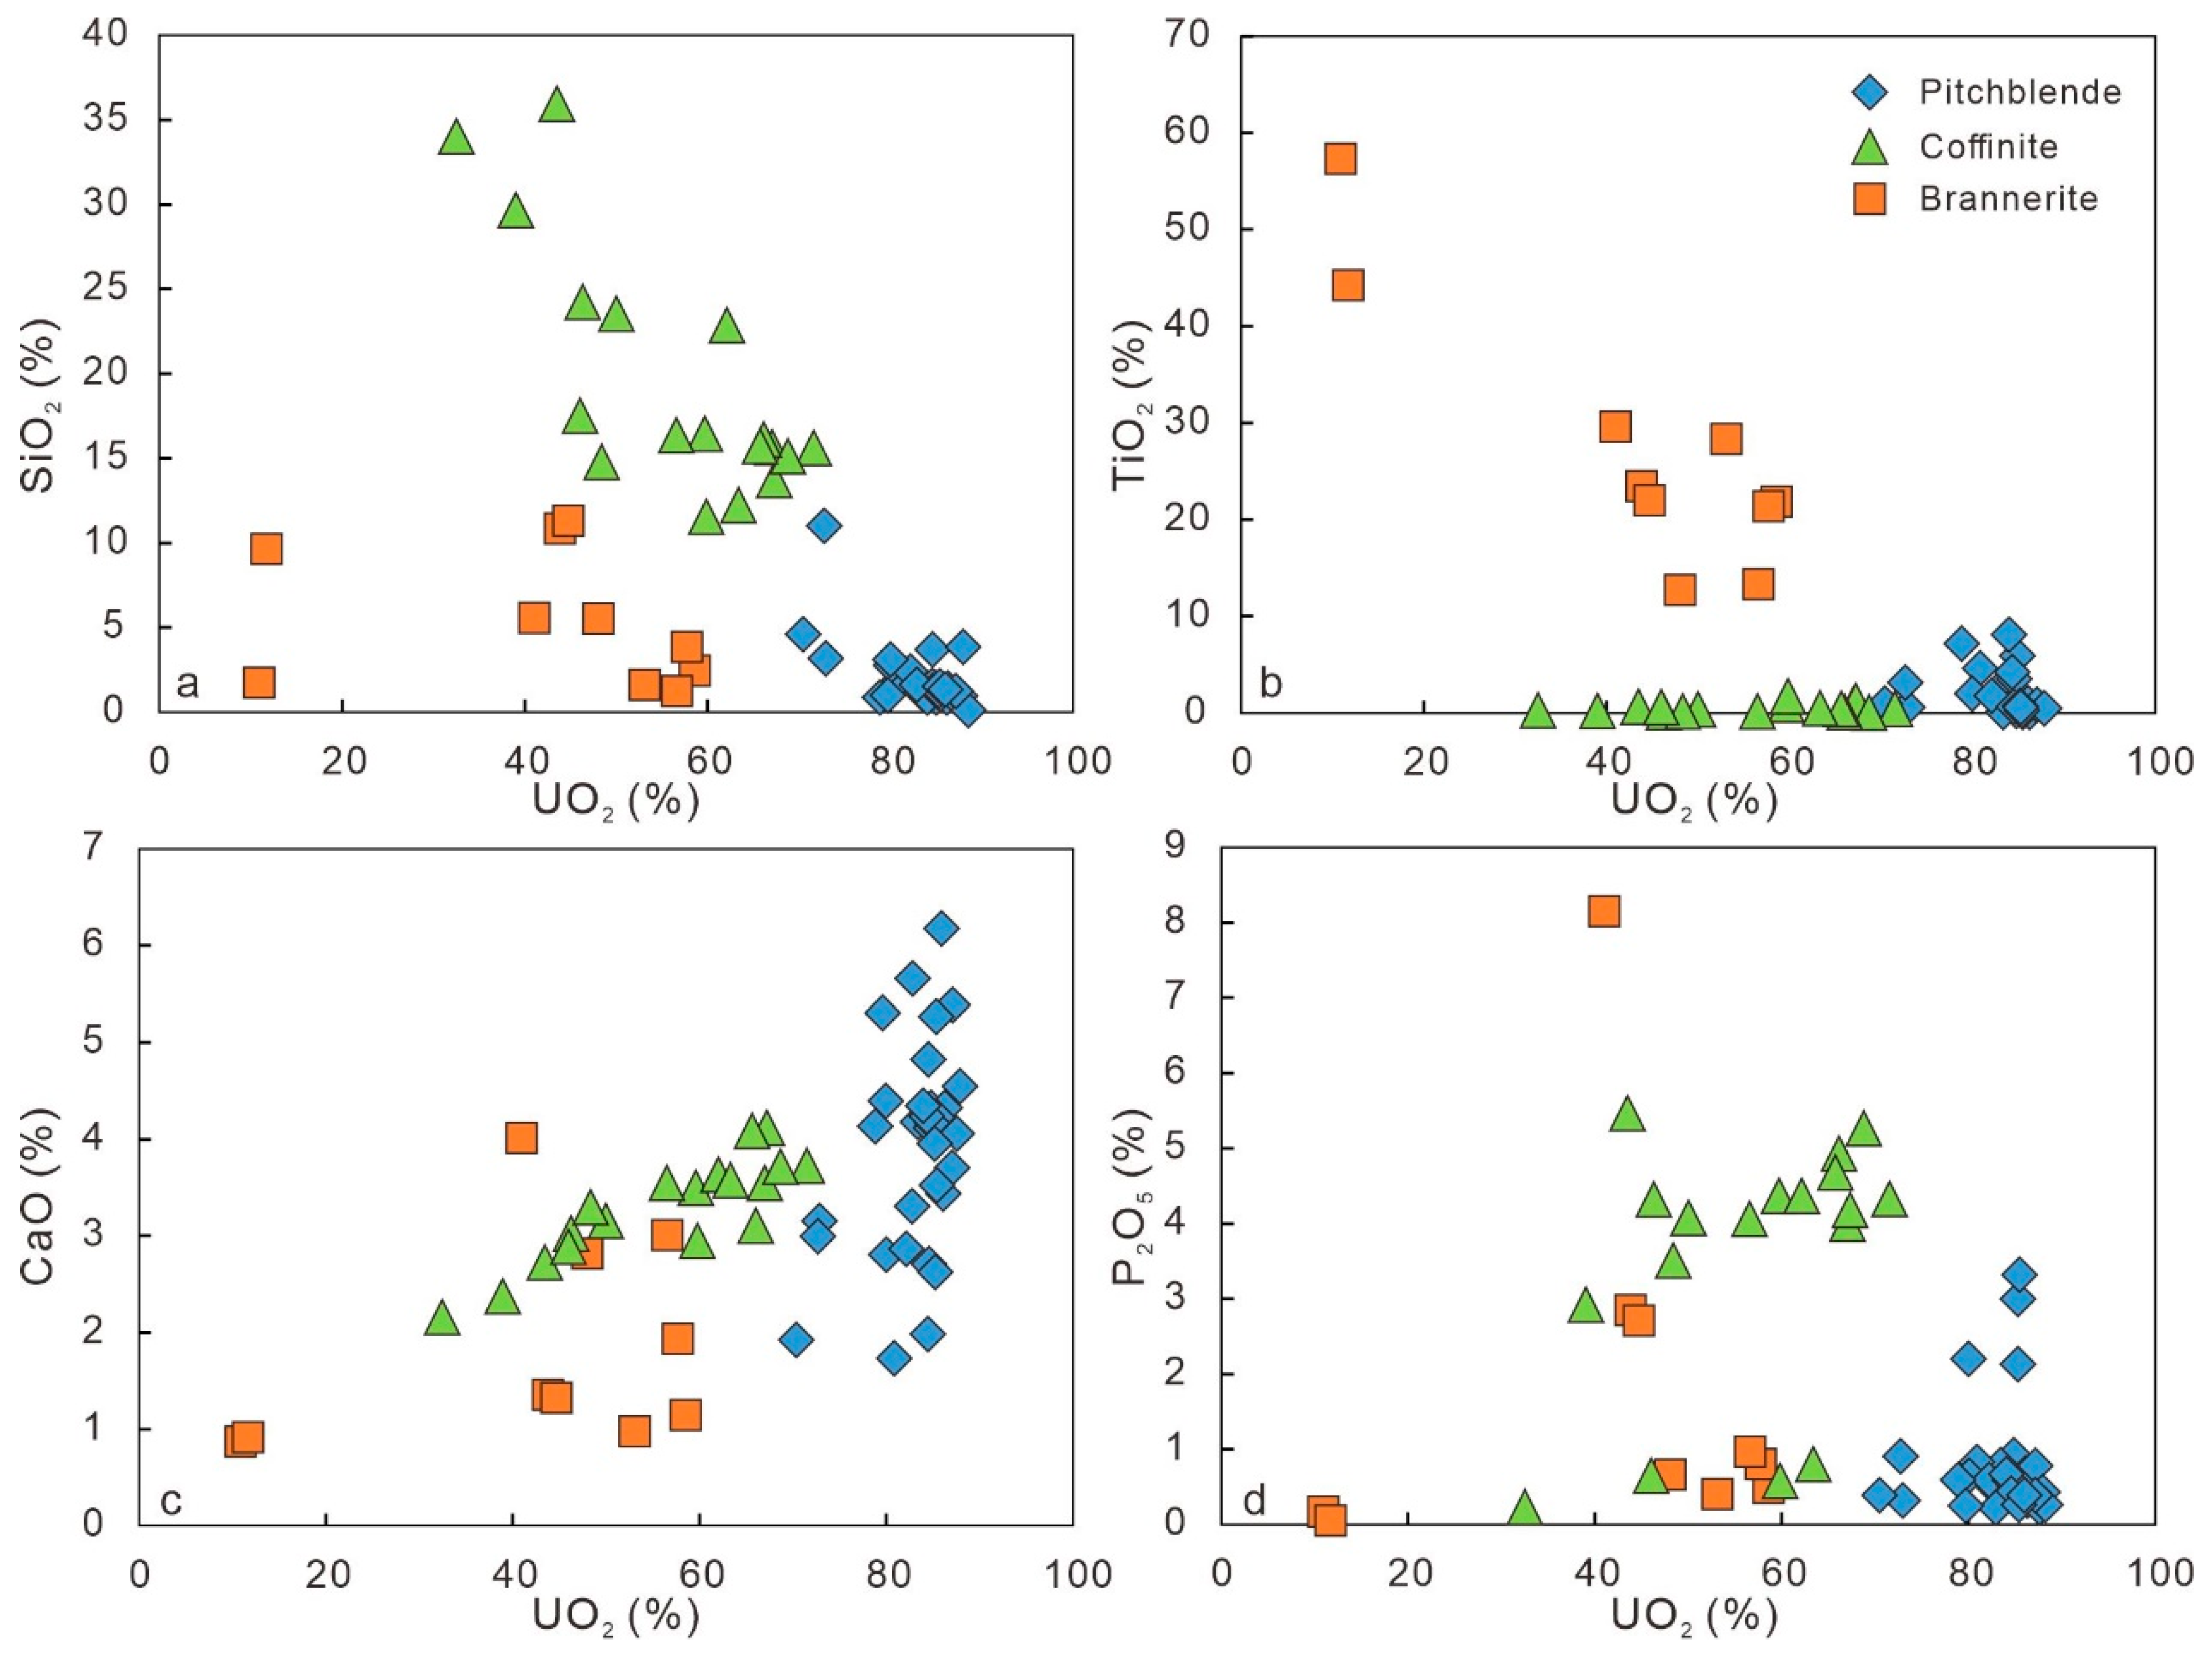
Table 3 and plotted in
Figure 9. A total of 33 uraninites, 18 coffinites and 10 brannerites were obtained by electron probe microanalysis. Total oxide contents from these analyses range from 75.82% to 99.97%. Some analyses exhibiting low total contents probably result from the presence of U
6+ in the structure of these uranium minerals and from the alteration and development of pores, as well as from the presence of elements that were not analyzed [
28,
29,
30,
31].
The three mineral species show distinct compositional characteristics. Uraninite (n = 33) is characterized by high UO2 content, ranging from 70.47% to 88.51% (median 86.30%), with minor PbO (median 0.16%) and relatively low contents of substitution elements such as SiO2 (median 1.24), TiO2 (median 0.95%), and Fe2O3 (median 1.03%). CaO is the main minor constituent, with a median of 4.12%. ThO2 is generally below the limit of detection, with only two outliers at 3.22% and 2.79%. In contrast, coffinite (n = 18) is defined by high silicon content, with SiO2 ranging from 12.21% to 35.92% (median 19.94%). The UO2 content is notably lower than in uraninite, ranging from 32.54% to 71.59% (median 56.13%). Minor oxides are generally low, including TiO2 (median 0.44%) and Fe2O3 (median 0.61%), while P2O5 (median 3.66%) is prominent. ThO2 is typically present in most analyses. Brannerite (n = 10) exhibits the lowest UO2 concentration (median 42.66%) and is distinguished by its dominant titanium content. TiO2 is a major component, ranging from 12.72% to 57.34% (median 27.43%). Other notable components include Fe2O3 (median 4.79%) and SiO2 (median 5.35%). Similar to coffinite, ThO2 is commonly detected.
4.5. Oxidizing–Reducing-Sensitive Elements
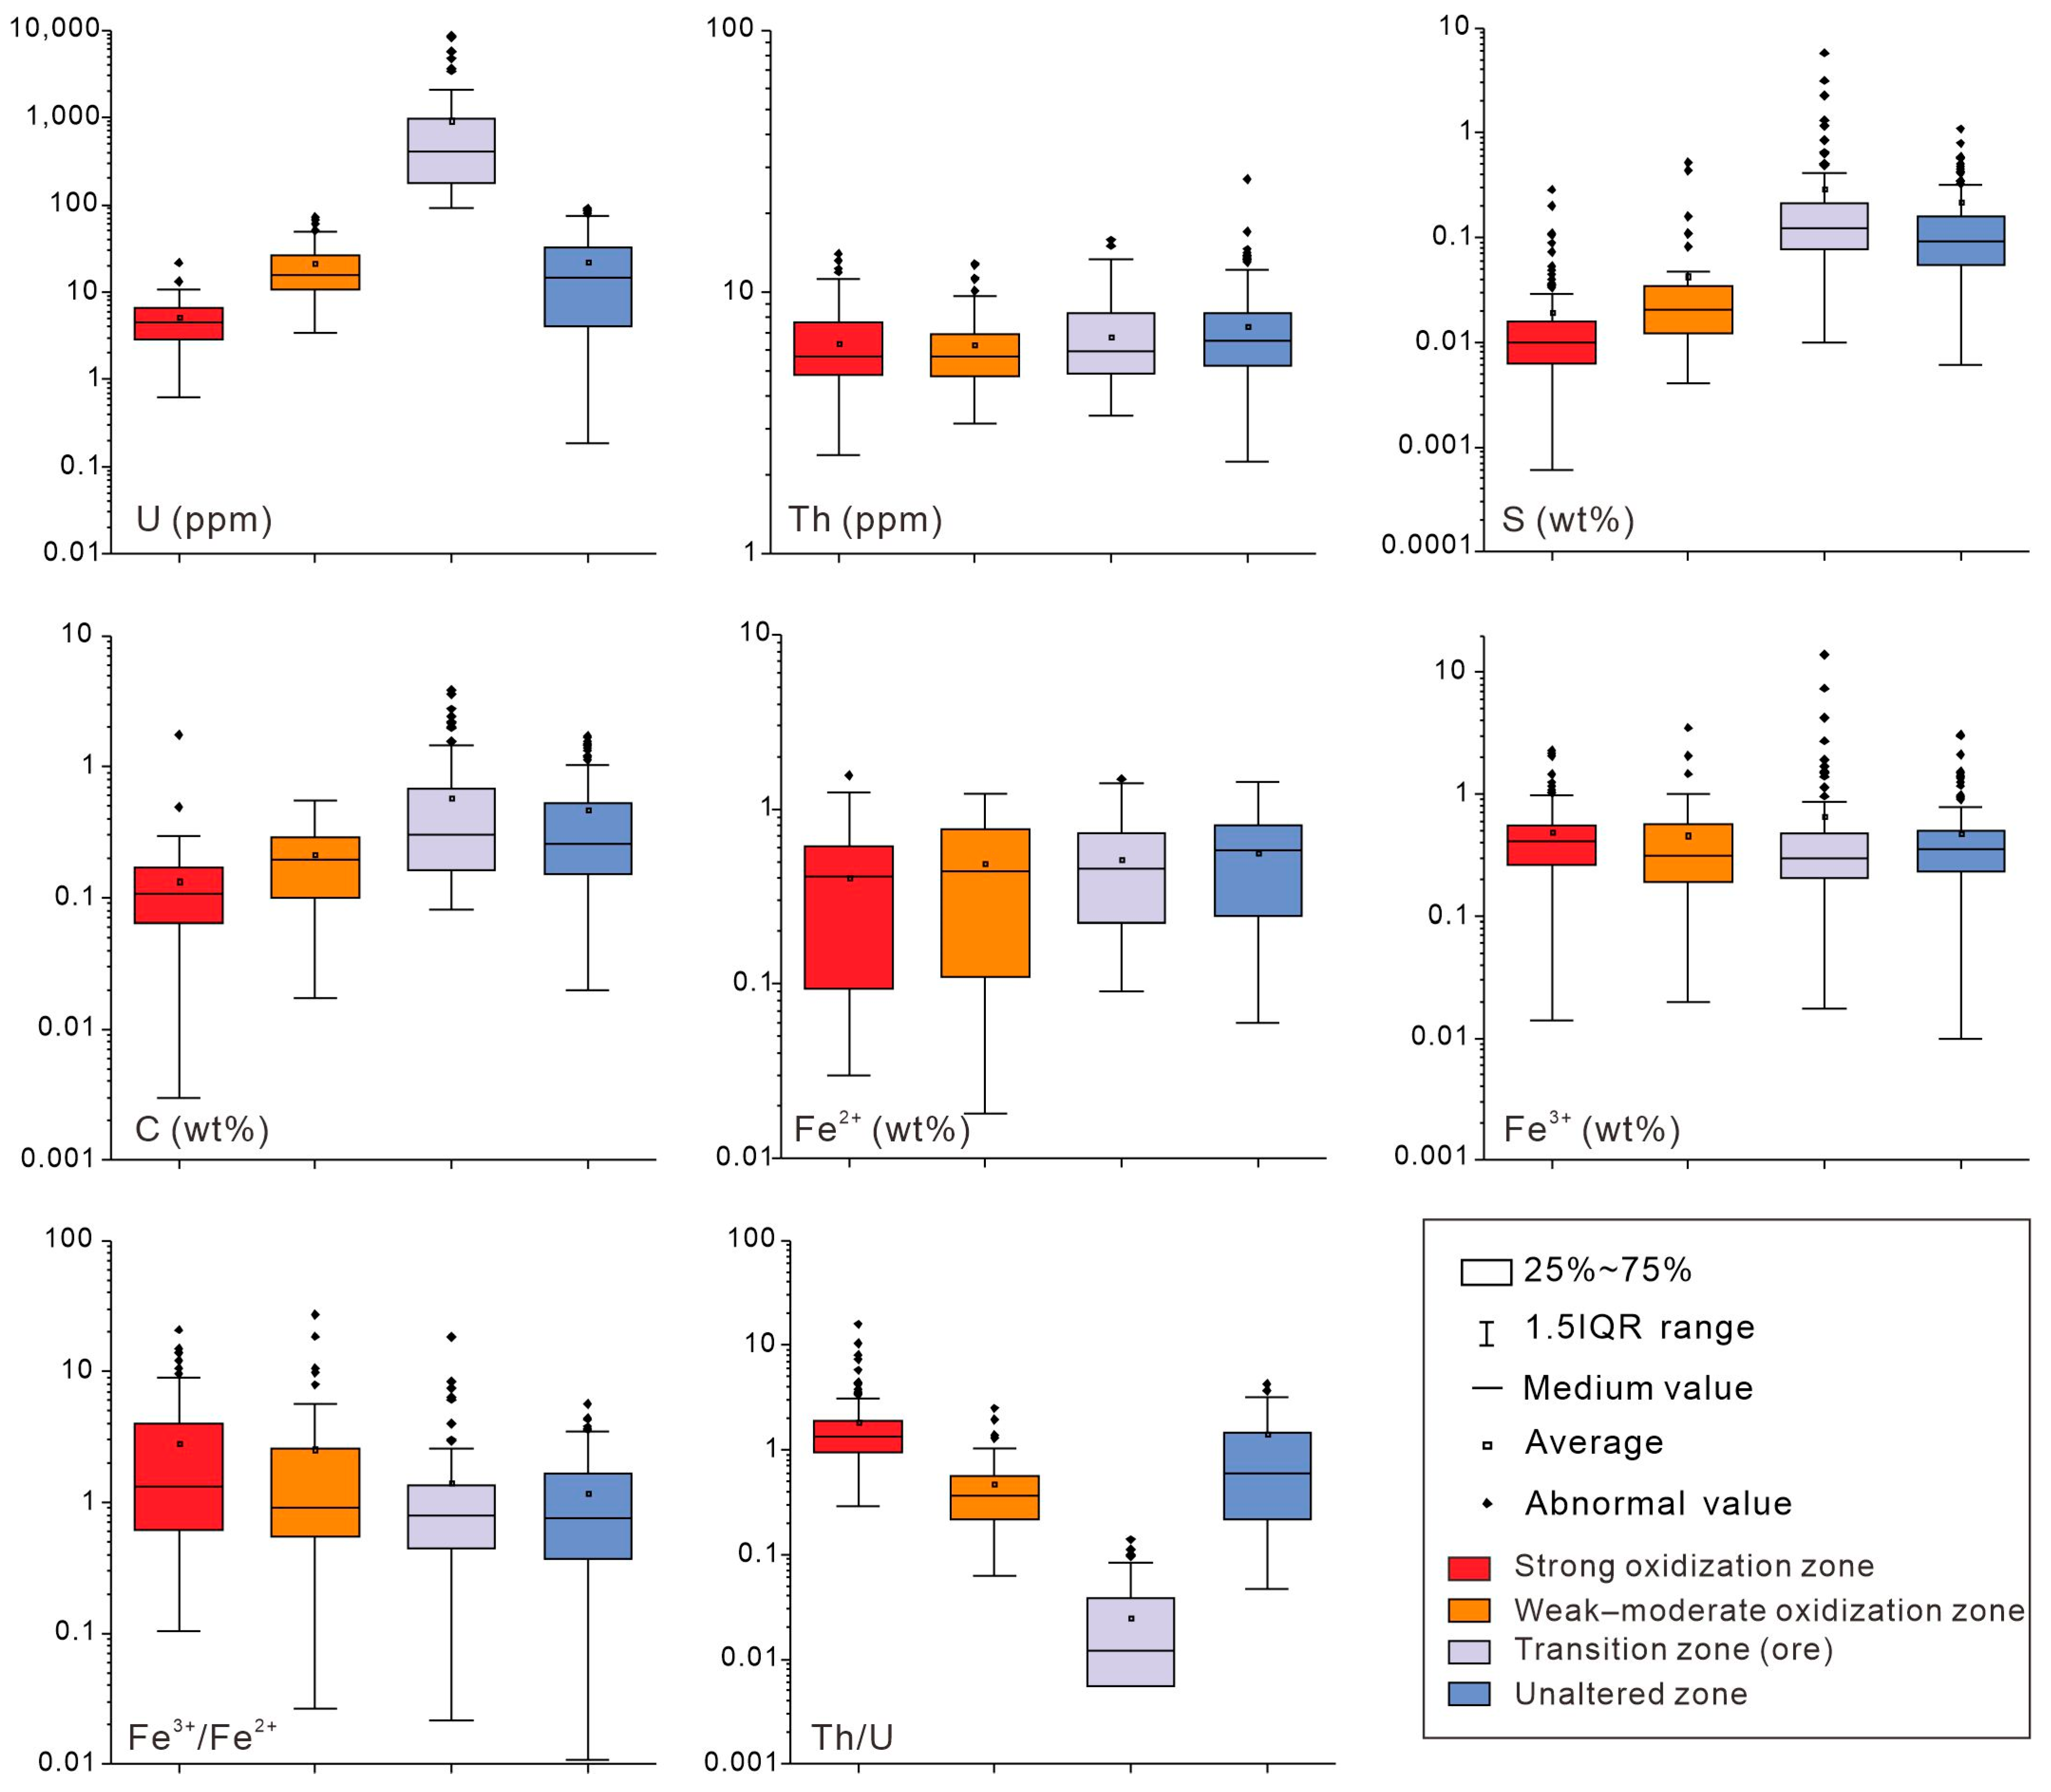
The concentrations of redox-sensitive elements across different zones of the interlayer oxidation system are summarized in
Figure 10 and listed in
Table 4. The results show systematic variations in U, S, organic carbon, Fe
2+, and Fe
3+ across the redox gradient. With increasing oxidation intensity, U, S and organic carbon decrease significantly, while the Fe
3+/Fe
2+ ratio increases.
In the primary unaltered sandstones, U ranges from 0.18 ppm to 90.7 ppm (median value of 15.0 ppm), S from 0.09% to 3.84% (median of 0.09%), and organic carbon from 0.02% to 4.93% (median of 0.26). The Fe3+/Fe2+ ratio is between 0.01 and 5.67 (median of 0.75). In the strongly oxidized zone, U (0.62 ppm to 21.7 ppm, median of 4.43 ppm), S (0.001% to 0.29%, median of 0.01%), and organic carbon (0.003% to 1.74%, median of 0.12%) reach their lowest values due to intense oxidative alteration. In the moderately–weakly oxidized zone, these elements increase relative to the strongly oxidized zone, with U ranging from 3.40 to 71.4 ppm (median 21.1 ppm), S from 0.001% to 0.52% (median of 0.05%), and organic carbon of 0.02% to 0.55% (median of 0.21). In the redox transition zone (ore zone), U (92.2 ppm to 9596 ppm, median of 423 ppm), S (0.01% to 3.84%, median of 0.09%), and organic carbon (0.08% to 3.82%, median of 0.30%) reach their highest concentrations. In contrast, the Fe3+/Fe2+ ratios of sandstones in the transition and unaltered zones are significantly lower than those in the oxidation zones. The median Fe3+/Fe2+ ratios are 0.80 and 0.75 in the transition and unaltered zones, respectively, compared to 2.63 and 1.31 in the strong oxidation and moderate–weak oxidation zones.
5. Discussion
5.1. Genetic Type of Kaolinite
Kaolinite is the dominant clay mineral in the Xishanyao Formation. Previous studies have demonstrated that the morphological characteristics of kaolinite can reflect its genetic type, formation environment, tectonic setting and fluid characteristics [
31,
32,
33,
34,
35,
36]. Specifically, diagenetic kaolinite formed during basin subsidence typically occurs in booklet, vermicular (worm-like), or pseudo-hexagonal plate forms within rock pores [
37,
38,
39].
In the unaltered sandstones, kaolinite grains occur in platy-like (
Figure 7A), booklet-like (
Figure 7B), and vermicular morphologies (
Figure 7C), indicating formation during relatively stable burial diagenesis rather than late-stage supergene alteration [
36]. Kaolinite is a characteristic product of water–fluid interaction in sandstone, and its formation is a pH-controlled reaction under acid environments. Such acidic fluids include CO
2-rich meteoric water and hydrocarbon-bearing fluids derived from the thermal evolution of source rocks [
40,
41]. H-O isotopic compositions indicate that fluids responsible for kaolinite formation in the unaltered rocks were dominated by meteoric water [
16,
18], with only minor contributions from organic fluids. Isotopic geochemical characteristics of minerals coexisting with kaolinite can also be used to constrain the genetic interpretation of kaolinite [
40]. In the Mengqiguer sandstones, the diagenetic authigenic mineral assemblage is relatively simple, and consists mainly of clay minerals, with minor calcite and dolomite cements. C and O isotope compositions of these calcite and dolomite cements are consistent with decarboxylation of sedimentary organic matter [
18]. This provides additional evidence for involvement of organic acid fluids during diagenetic kaolinite formation.
In summary, kaolinite in the unaltered sandstone formed through the combined action of meteoric and organic fluids. These fluids were enriched in organic acid, providing favorable conditions for alkali-feldspar dissolution. Within this acidic fluid environment, alkali-feldspar dissolution released alkali metal ions (e.g., K+, Na+, and Ca2+), as well as a portion of SiO2. Residual components formed kaolinite, whereas the released SiO2 precipitated as authigenic quartz. Furthermore, associated illite, smectite and/or chlorite are also commonly observed in the Mengqiguer deposit. These minerals form from feldspar breakdown, which supplies the Al, K, Na, and Ca required for clay mineral formation. Meanwhile, alteration and decomposition of detrital biotite by these acidic fluids releases abundant Fe2+ and Mg2+, facilitating chlorite formation.
Some irregular kaolinite grains in the oxidation zone are interpreted as supergene-genetic kaolinite. Kaolinite contents are significantly higher in the strong (relative content of 85.1%, n = 11) and moderate–weak oxidation (relative content of 91.3%, n = 5) zones than in the transition (78.7%, n = 9) and unaltered zones (80.0%, n = 41). This indicates that additional acidic fluid input contributed to kaolinite enrichment in the oxidation zones. The abundant fine-grained, irregular kaolinite in the oxidation zone, coupled with its scarcity in transition and unaltered zones, indicates enrichment by ore-stage supergene acidic fluids. These acidic ore-forming fluids may also comprise meteoric water and organic hydrocarbon fluids, as indicated by C-H-O isotope data [
17,
42] and fluid inclusion characteristics [
43] of ore-stage minerals. Ore-stage kaolinite grains exhibit δD
V-SMOW values ranging from −119‰ to −48.3‰, and the δ
18O of the corresponding fluids ranges from −12.1‰ to −4.6‰; δ
13C values for ore-stage calcite range from 17.6‰ to 24.9‰ [
17]. In the oxidation zone (from strong to moderate–weak), early oxygen-rich acidic fluids migrated through ore-bearing horizons and continuously interacted with alkali feldspars in the host rocks. Feldspar hydrolysis released K
+, Na
+, and SiO
2, leading to the formation of kaolinite-group minerals, mainly kaolinite and dickite. This process consumed H
+, leading to progressive pH increase and kaolinite enrichment in the oxidation zone. With continued fluid evolution and a decreasing water–rock ratio, K
+ became relatively enriched, further increasing pH. In the transition and reduction zones, phyllosilicate assemblages shifted from 1:1 kaolinite to 2:1 smectite and illite/smectite (I/S) mixed layers, accompanied by a marked increase in smectite and I/S contents.
5.2. Evolution of Ore-Forming Fluids
Previous studies indicate that uranium mineralization in the Mengqiguer sandstone-type deposit is a typical interlayer oxidation zone-related uranium deposit [
16,
17,
18], and that the initial ore-forming fluids were acidic and resulted from mixing between meteoric water and organic fluid [
19,
43]. During progressive mineralization, the fluid pH evolved toward more alkaline conditions [
44,
45,
46], reflecting continuous fluid–rock interaction and chemical buffering. This evolution is well recorded by systematic variations in mineralogical and whole-rock geochemistry. As discussed above, higher kaolinite abundances in the oxidation zones relative to the transition and unaltered zones indicate dominance of acidic fluids during early mineralization. The formation of kaolinite is attributed to the acidic hydrolysis of feldspars derived from CO
2-rich meteoric water and organic acid-bearing fluids [
17,
40], accompanied by the leaching of mobile cations (e.g., Na
+ and Ca
2+) and residual enrichment of SiO
2. These processes reflect intense fluid–rock interaction under oxidizing and acidic conditions.
With continued fluid migration, feldspar hydrolysis progressively consumes H
+, leading to a gradual increase in pH. This evolution is accompanied by a shift from a kaolinite-dominated assemblage with minor illite and illite/smectite (I/S) mixed-layer minerals in the oxidation zones to assemblages enriched in illite and illite/smectite (I/S) mixed-layer minerals in the transition and unaltered zones. Enrichment of I/S mixed-layer minerals indicates that the fluid system evolved toward weakly alkaline conditions [
47,
48,
49], consistent with typical diagenetic environments in deeper reservoir settings.
In parallel, redox conditions also evolved during fluid migration. Increasing Fe2O3/FeO ratios toward the oxidation zones reflect elevated Eh conditions, under which uranium is transported as soluble U6+ species. As oxidizing, U-bearing fluids migrated into the transition zone, they encountered reducing environments enriched in organic matter, Fe2+, and sulfides. This resulted in a sharp decrease in Eh, triggering the reduction of U6+ to immobile U4+ and the precipitation of uranium minerals.
Overall, the interlayer oxidation system in the Mengqiguer deposit represents a dynamic geochemical reactor, in which oxidizing meteoric fluids interact with reducing sedimentary components. Progressive evolution from acidic-oxidizing to weakly alkaline-reducing conditions ultimately controls uranium transport, reduction, and precipitation within the redox transition zone.
5.3. Uranium Source
The Mengqiguer deposit is one of the high-grade uranium deposits in the Yili Basin; a sufficient uranium supply is critical to the formation of this high-grade deposit. During the Early–Middle Jurassic, extension tectonics in the Yili Basin, combined with a warm, semi-humid to humid paleoclimate, facilitated abundant organic matter production within the Xishanyao Formation. Consequently, these organic-rich sandstones promoted syngenetic uranium enrichment during deposition and early diagenesis. Therefore, we propose that the Xishanyao Formation sandstones represent the primary uranium source for mineralization. Uranium contents in the primary unaltered sandstones range from 0.18 ppm to 90.7 ppm (median 15.0 ppm), whereas those in the strongly oxidized zone are between 0.62 ppm and 21.7 ppm (median 4.43 ppm). This suggests that about 10.57 ppm of uranium was leached by the oxidizing mineralizing fluids.
The primary unaltered rocks in the lower member of the Xishanyao Formation have Al
2O
3/TiO
2 ranging from 10.2 to 56.0 (average 35.4), indicating derivation from an intermediate-acid and acid source rock [
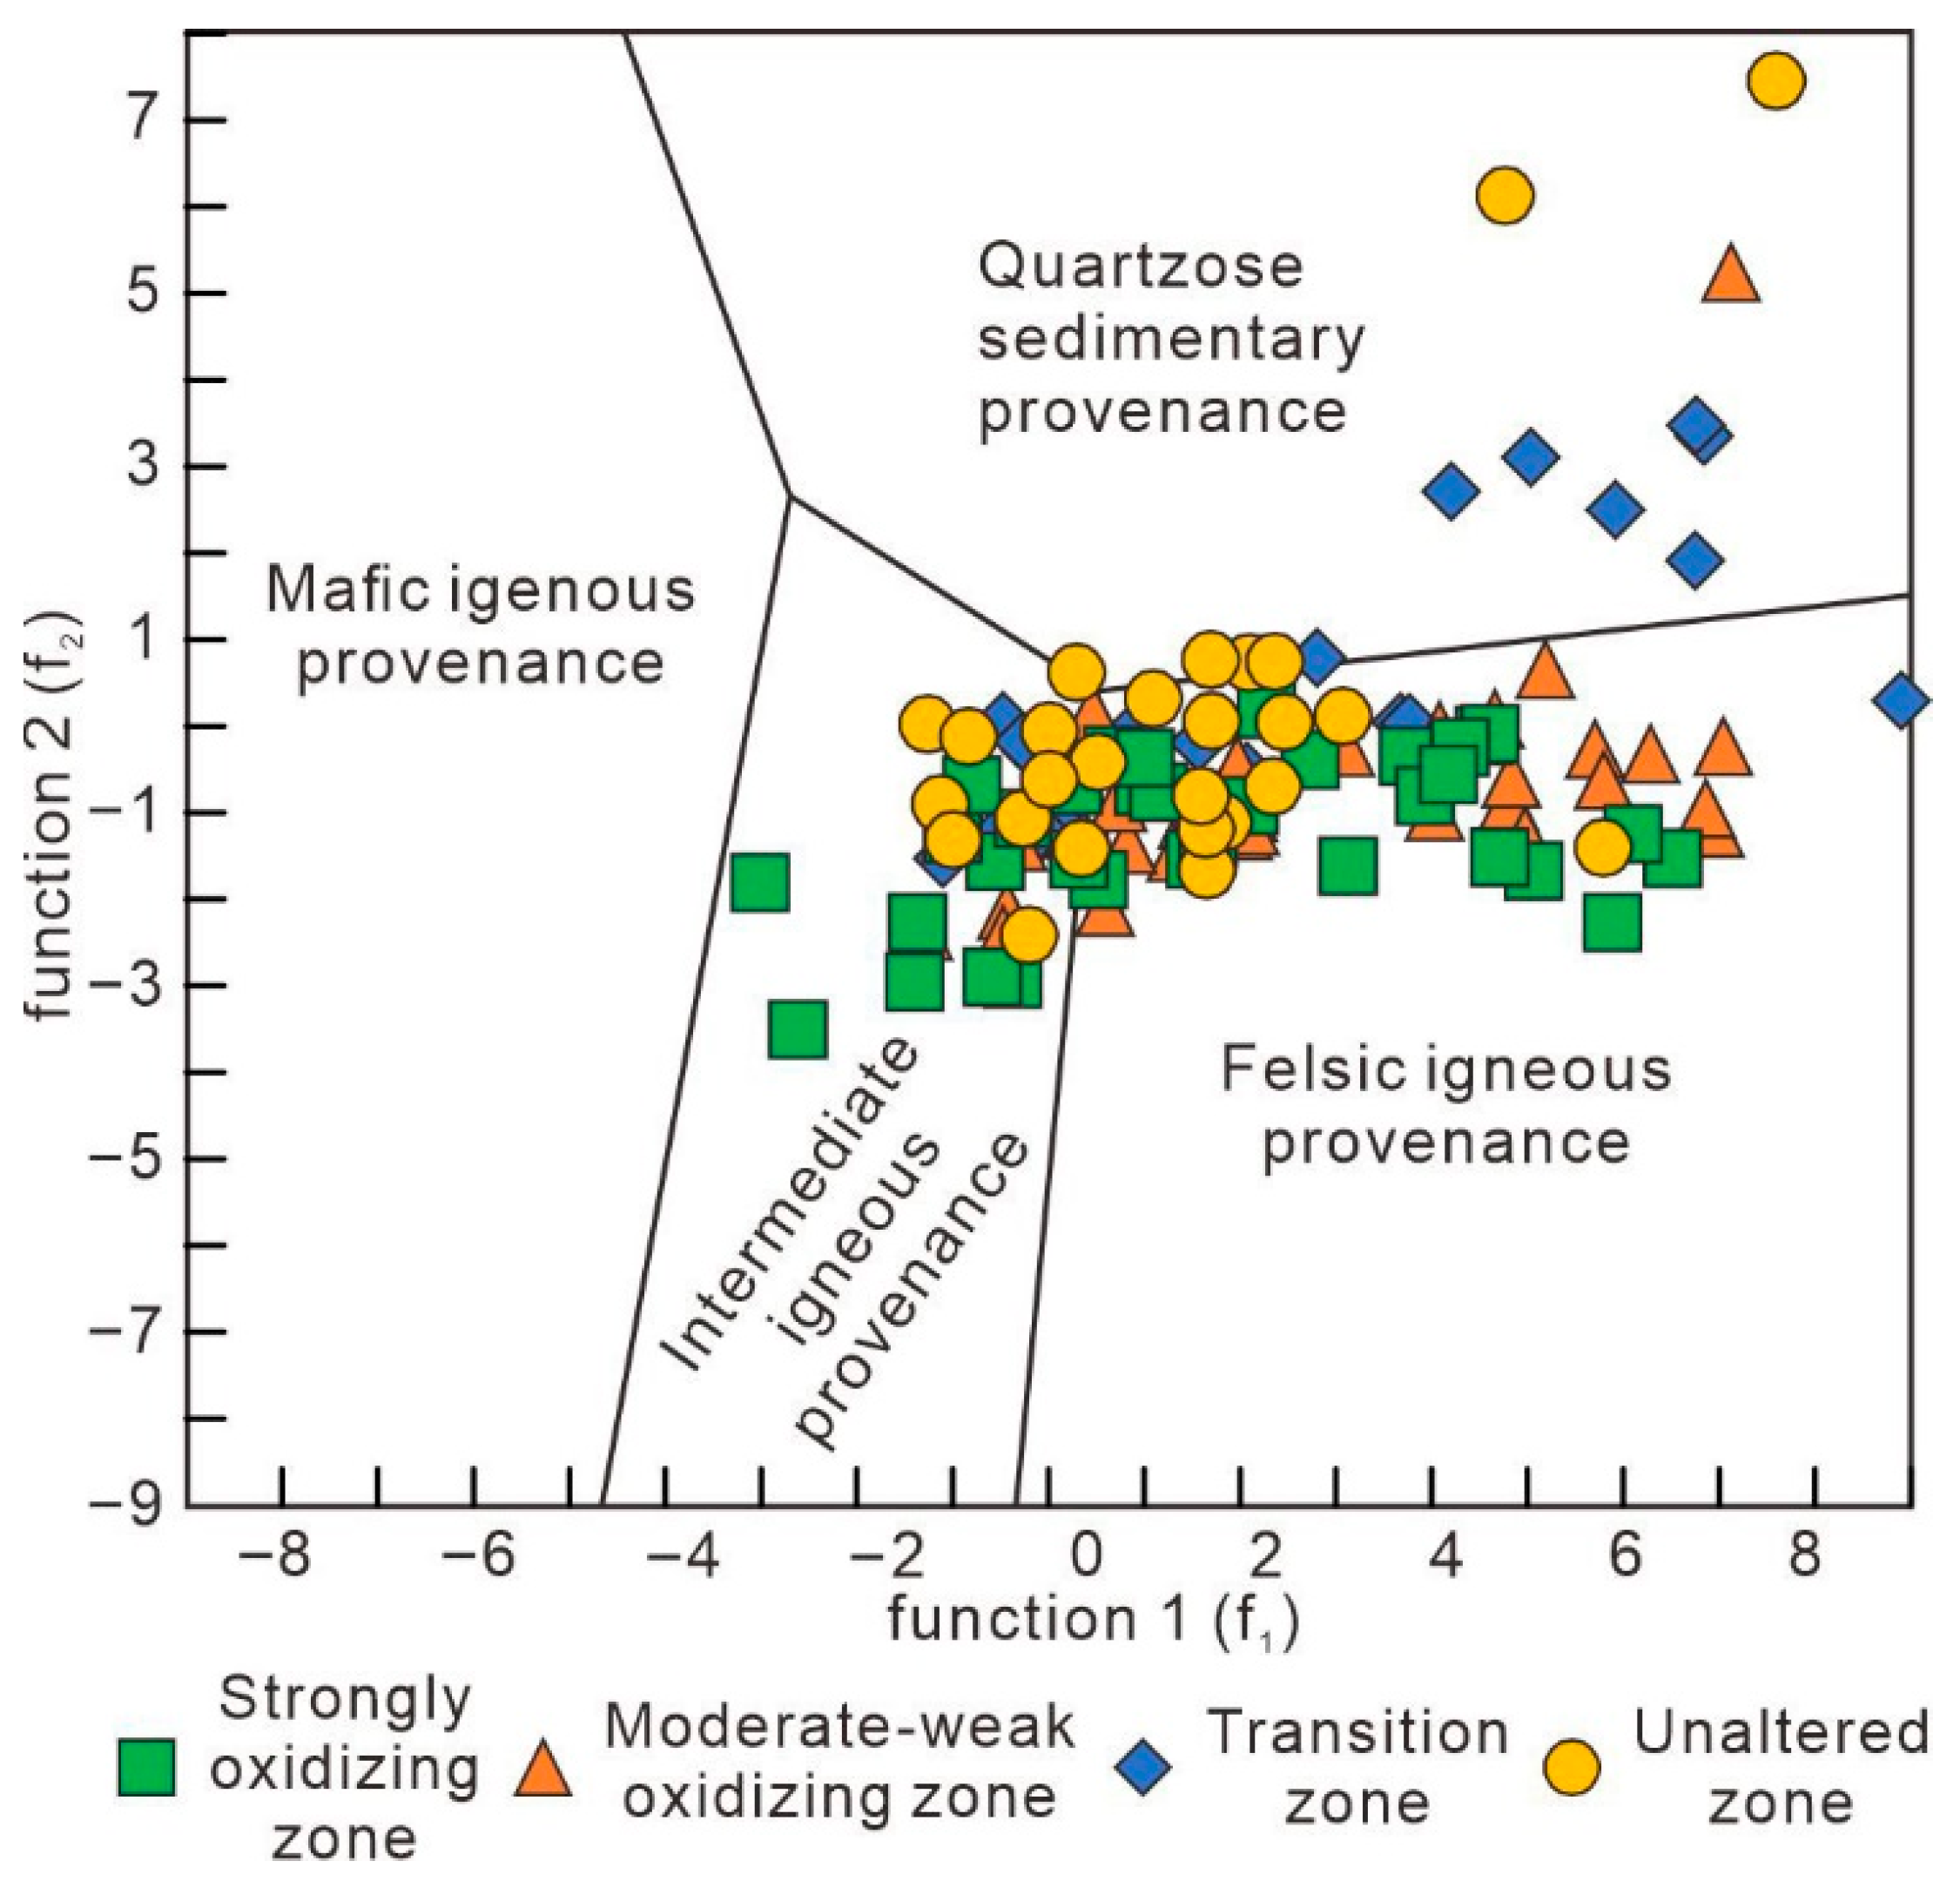
50]. These samples also fall in the area of intermediate-acid and acid rocks (
Figure 11). Detrital zircon ages of the Xishanyao Formation display three major peaks at 300 to 350 Ma, 350 to 400 Ma, and 400 to 450 Ma [
51], corresponding to Paleozoic arc magmatism related to subduction of the South and North Tianshan oceanic basins beneath the Yili Block. Granites, intermediate-acidic rocks, and volcaniclastic rocks are exposed along the northern margin of the Nalati Mountains and the southern margins of the Keguqin and Borohoro Mountains. These granitoids and felsic volcanic rocks not only supplied detritus to the Xishanyao Formation, but also, due to their high U contents, represent an important uranium source for the Mengqiguer deposits.
5.4. Metallogenic Model
The formation and evolution of the Mengqiguer deposit represent a dynamic process controlled by a sedimentary environment, tectonic evolution, and the interactions between organic and inorganic fluids. During the Jurassic, the Yili Basin developed in an extensional tectonic setting under warm, humid to semi-humid paleoclimatic conditions [
53,
54]. Large volumes of terrestrial detrital sediments derived from the surrounding orogenic belts were transported into the basin, forming the coal-bearing lithologies of the Xishanyao Formation. This depositional environment favored the accumulation of abundant organic matter, providing both reducing materials and a potential uranium source for mineralization. With continued basin subsidence, progressive burial and thermal maturation of organic matter within the Xishanyao Formation released large volumes of organic acid fluids. These acidic fluids promoted intense feldspar hydrolysis, leading to the formation of vermicular and book-like kaolinite [
17,
18]. This alteration significantly enhanced the porosity and permeability of the sandstones by dissolving feldspar and generating secondary pores.
During the Cenozoic, neotectonic uplift along the southern margin of the Yili Basin exposed the ore-bearing strata at the basin margins [
14,
15]. Oxygenated meteoric waters infiltrated the basin through interlayer aquifers, forming large-scale interlayer oxidation zones. These oxidizing fluids leached uranium from the host rocks and transported it as soluble uranyl complexes [
17,
19,
43]. As the fluids migrated through the host sandstones, they induced widespread epigenetic alteration, forming characteristic mineral assemblages such as micritic kaolinite, chloritized biotite, and carbonate cement [
16,
17]. When oxidizing uranium-bearing fluids encountered reducing environments in the sandstones, uranium precipitated. These reducing environments were created by abundant organic matter, coal-bed methane, and reducing fluids released from deeper coal-bearing strata through fault systems [
14,
15,
19,
42,
43]. In addition, microbial processes likely enhanced the reducing capacity of the system. Sulfate-reducing bacteria may have reduced sulfate to hydrogen sulfide, further strengthening the reducing environment. Under these conditions, soluble uranyl complexes were rapidly reduced to insoluble U
4+ species, resulting in precipitation of uranium minerals such as uraninite and coffinite.
Overall, the Mengqiguer uranium deposit represents a metallogenic system characterized by the association of organic matter, pyrite, and uranium minerals. This model highlights the control of supergene circulation driven by tectonic uplift on uranium migration, while emphasizing the contribution of reducing fluids from deep coal-bearing strata to overall ore-hosting capacity. Through organic–inorganic fluid interactions, uranium was extensively enriched within the redox transition zone, forming the high-grade uranium deposit observed today with its unique mineralogical and isotopic signatures.
5.5. Comparative Analysis with Global Roll-Front Uranium Deposits
The Mengqiguer uranium deposit is a typical interlayer oxidation zone-type (roll-front) sandstone-hosted uranium deposit. It hosts the key diagnostic characteristics of global roll-front deposits, while also exhibiting basin-specific characteristics that refine the metallogenic model.
Comparison with representative roll-front deposits worldwide (the Great Divide Basin in Wyoming, USA [
55,
56]; the Inkai and Tortkuduk deposits in the Chu-Sarysu Basin, Kazakhstan [
57]; and the Nalinggou [
5] and Bayinqinggeli [
9,
58] deposits in the Ordos Basin, China) reveals strong consistencies in the first-order metallogenic framework. These deposits occur in permeable fluvial–deltaic sandstones bounded by mudstone aquitards within intermontane or foreland basins adjacent to U-rich felsic uplifts. They also show the classic redox zonation from oxidation to transition (ore) zone to unaltered zone, with uranium mineralization controlled by the roll-front pinchout lines. Geochemically, uranium, organic carbon, and sulfide sulfur are enriched in the transition zone, while the Fe
3+/Fe
2+ ratio increases with oxidation, reflecting U
6+ migration in oxidized fluids and U
4+ precipitation in reduced environments.
The Mengqiguer deposit also displays some distinctive characteristics of representative roll-front deposits worldwide. This deposit records a well-documented dual genetic model of kaolinite that formed during burial diagenesis and ore-stage fluid–rock interaction stages, respectively, which is rarely reported in other roll-front deposits. The Mengqiguer deposit is hosted in Jurassic coal-bearing sequences, with abundant syn-sedimentary organic matter and coal-derived hydrocarbon fluids providing a long-term and strong reduction barrier [
19,
43], which is more prominent than those in the Wyoming [
56] and Chu-Sarysu deposits [
57] with relatively low organic matter contents. Furthermore, the interlayer oxidation and uranium mineralization in the Mengqiguer deposit were directly activated and driven by Cenozoic neotectonic uplift of the Yili Basin, which is different from the long-term stable subsidence-controlled mineralization in the Chu-Sarysu Basin [
56] and the paleo-interlayer oxidation mineralization in the Nalinggou deposit of Ordos Basin [
5].
6. Conclusions
This study presents integrated petrographic, mineralogical, and geochemical analyses of samples from the interlayer oxidation zone in the lower member of the Xishanyao Formation, Mengqiguer deposit, southern Yili Basin. The system can be subdivided into four zones: strong oxidation, moderate–weak oxidation, transition, and primary unaltered zones, each characterized by distinct mineralogical and geochemical features. Uranium orebodies are strictly controlled by the redox transition zone, where U, S, and organic carbon are enriched. Clay minerals are dominated by kaolinite and illite, with higher relative contents in oxidation zones, while illite–smectite mixed-layer minerals display an inverse distribution. Kaolinite in the deposit exhibits a dual origin: (1) diagenetic book-like and vermicular kaolinite formed by feldspar alteration under acidic conditions during the diagenesis of the Xishanyao Formation, and (2) supergene irregular fine-grained kaolinite related to water–rock interaction involving ore-forming acidic fluids. This assemblage records the evolution of ore-forming fluids from acidic conditions in the oxidation zone to weakly alkaline conditions in the transition zones. Uranium minerals, mainly uraninite and coffinite, are closely associated with pyrite, indicating that pyrite is a key reducing agent for uranium precipitation. Uranium was primarily sourced from the hosted uraniferous sandstones. Uranium mineralization in the deposit reflects a dynamic metallogenic process controlled by sedimentary facies, Cenozoic tectonic uplift, organic–inorganic fluid interactions, and redox reactions. Through comparative analysis with global roll-front uranium deposits, we confirm that the Mengqiguer deposit is a typical interlayer oxidation zone-type sandstone-hosted uranium deposit, which conforms to the general metallogenic model and would provide refined constraints for global exploration. These results provide important constraints on the metallogenic mechanisms of sandstone-hosted uranium deposits and offer practical guidance for both regional and global uranium exploration.
Author Contributions
Conceptualization, G.W.; formal analysis, G.W. and H.-J.Z.; investigation, G.W., H.-J.Z. and H.-H.Z.; sampling, G.W., H.-J.Z. and H.-H.Z.; experiment, H.-J.Z. and H.-H.Z.; writing—original draft, G.W.; writing—review, Y.-Q.J.; funding, H.-J.Z. All authors have read and agreed to the published version of the manuscript.
Funding
This work was supported by the Uranium Ore Geology Exploration Project (201608) of the China Nuclear Industry Geological Bureau and Research Project (201647-2) of No. 216 Research Institute of Nuclear Industry.
Data Availability Statement
The original contributions presented in this study are included in the article. Further inquiries can be directed to the corresponding author.
Conflicts of Interest
Author Gui Wang, Hu-Jun Zhang, Hao-Hao Zhang were employed by the company No. 216 Research Institute of Nuclear Industry. The remaining author declare that the research was conducted in the absence of any commercial or financial relationships that could be construed as a potential conflict of interest.
References
- Bonnetti, C.; Cuney, M.; Malartre, F.; Michels, R.; Liu, X.; Peng, Y. The Nuheting deposit, Erlian Basin, NE China: Synsedimentary to diagenetic uranium mineralization. Ore Geol. Rev. 2015, 69, 118–139. [Google Scholar] [CrossRef]
- Bonnetti, C.; Cuney, M.; Michels, R.; Truche, L.; Malartre, F.; Liu, X.; Yang, J. The Multiple Roles of Sulfate-Reducing Bacteria and Fe-Ti Oxides in the Genesis of the Bayinwula Roll Front-Type Uranium Deposit, Erlian Basin, NE China*. Econ. Geol. 2015, 110, 1059–1081. [Google Scholar] [CrossRef]
- Bonnetti, C.; Malartre, F.; Huault, V.; Cuney, M.; Bourlange, S.; Liu, X.; Peng, Y. Sedimentology, stratigraphy and palynological occurrences of the late Cretaceous Erlian Formation, Erlian Basin, Inner Mongolia, People’s Republic of China. Cretac. Res. 2014, 48, 177–192. [Google Scholar] [CrossRef]
- Dai, S.; Yang, J.; Ward, C.R.; Hower, J.C.; Liu, H.; Garrison, T.M.; French, D.; O’Keefe, J.M.K. Geochemical and mineralogical evidence for a coal-hosted uranium deposit in the Yili Basin, Xinjiang, northwestern China. Ore Geol. Rev. 2015, 70, 1–30. [Google Scholar] [CrossRef]
- Ding, B.; Liu, H.; Xu, D.; Qiu, L.; Zhang, Z. Genetic model of tabular orebody in Nalinggou uranium deposit, Ordos Basin: Constraint from clay minerals studies. Ore Geol. Rev. 2024, 165, 105844. [Google Scholar] [CrossRef]
- Wu, Y.; Lei, Z.; Li, Q.; Tao, S.; Xiao, Y.; Wang, X.; Zhang, N. Helium Accumulation and Uranium Deposit in the Chu-Sarysu Basin–A Symbiotic Process. In Proceedings of the International Field Exploration and Development Conference 2023; Springer: Singapore, 2023; pp. 558–573. [Google Scholar]
- Miller, L.J. Uranium ore controls of the Happy Jack deposit, White Canyon, San Juan County Utah. Econ. Geol. 1955, 50, 156–169. [Google Scholar] [CrossRef][Green Version]
- Zhang, F.; Jiao, Y.; Wu, L.; Rong, H. Roles of dispersed organic matters in sandstone-type uranium mineralization: A review of geological and geochemical processes. Ore Geol. Rev. 2021, 139, 104485. [Google Scholar] [CrossRef]
- Hu, X.; Ling, M.; Xu, J.; Gong, Q.; Yang, X.; Li, H.; Lu, C.; Li, Z.; Wang, L.; Ren, Z.; et al. Petrological, mineralogical, carbonate C-O and sulfide S isotope study of the Bayinqinggeli sandstone-hosted uranium deposit in the northern Ordos Basin. Ore Geol. Rev. 2024, 174, 106334. [Google Scholar] [CrossRef]
- Hu, X.; Yang, X.; Ling, M.; Xu, J.; Du, G.; Li, Q.; Cao, M.; Wu, Z. Mineralogical and geochemical studies on the Qianjiadian deposit, Songliao Basin, NE China: Insights into multiple metallogenic processes in the sandstone-type uranium deposit. Ore Geol. Rev. 2024, 168, 106050. [Google Scholar] [CrossRef]
- Jiang, W.; Qin, M.; Wang, W.; Huang, S. Genesis of gray sandstone within the red beds in HLJ-DL uranium deposit, southwest Songliao Basin and its relationship with uranium mineralization. Ore Geol. Rev. 2024, 168, 106035. [Google Scholar] [CrossRef]
- Cheng, Y.; Petrov, V.; Jin, R.; Miao, P. Neotectonic controls on large-scale uranium mineralization in the Meso-Cenozioc basins, Northern China. Ore Geol. Rev. 2025, 176, 106393. [Google Scholar] [CrossRef]
- Cheng, Y.; Wang, S.; Jin, R.; Li, J.; Ao, C.; Teng, X. Global Miocene tectonics and regional sandstone-style uranium mineralization. Ore Geol. Rev. 2019, 106, 238–250. [Google Scholar] [CrossRef]
- Wang, G.; Chen, Z.; Wang, G.; Lu, K.; Zhang, Z.; Kang, Y.; Jiang, H.; Ren, M.; Han, F.; Zhou, Z. Up-welling leakage-recharge genetic model of the Mengqiguer sandstone-type uranium deposit, southern Yili Basin, NW China. Ore Geol. Rev. 2021, 138, 104369. [Google Scholar] [CrossRef]
- Zhao, K.; Zhou, Y.; Chen, K.; Bao, Z.; Zhang, Y.; An, F.; Wu, B.; Li, G.; Yuan, H. Compositions of in-situ trace elements, S and Pb isotopes of pyrite in Mengqiguer deposit, Yili basin, NW China:implications for uranium mineralization processes of sandstone − type uranium deposit. Ore Geol. Rev. 2025, 179, 106503. [Google Scholar] [CrossRef]
- Song, H.; Ni, S.; Hou, M.; Zhang, C.; Shi, Z.; Wang, G.; Yang, B.; Hu, Y.; Chen, Y. The Characteristics of Clay minerals in sandstone-type uranium deposit in the Yili Basin, NW China and its relationship with uranium mineralization. Acta Geol. Sin. 2016, 90, 3352–3366. [Google Scholar]
- Ding, B.; Liu, H.; Li, P.; Jiang, H.; Zhang, H.; Zhang, B. The genetic mechanism of kaolinite in ore-bearing sandstone in the Mengqiguer uranium deposit, Yili, and its relation with uranium mineralization. Acta Geol. Sin. 2019, 93, 2020–2036. [Google Scholar]
- Ding, B.; Liu, H.; Zhang, B.; Li, P.; Jiang, H.; Zhang, H.; Xie, X.; Guo, C. Mineralogical and isotopes evidence for origin of pyrite: Implication for formation mechanism of pyrite and its relationship with uranium mineralization in Mengqigu’er uranium deposit, Yili Basin. Miner. Depos. 2019, 38, 1379–1391. [Google Scholar]
- Ding, B.; Liu, H.; Li, P.; Zhang, H.; Zhang, B.; Pan, C.; Zhang, X. The feature of diagenetic alteration of ore-bearing sandstone in Mengqiguer uranium deposit, YiLI basin, and the effect of diagenetic and mineralization of its organic-Inorganic fluid. Geol. Rev. 2018, 64, 149–164. [Google Scholar]
- Zhang, H. Study on the Genesis of Large-rich Orebody in the Eastern Segment of Mengqiguer Uranium Deposit. Uranium Geol. 2023, 39, 498–506. [Google Scholar]
- Chen, F.; Nie, F.; Zhang, C.; Zhang, Z. Sedimentary facies of the Lower Jurassic Sangonghe Formation and its relationship with uranium mineralization in Mengqiguer area of Yili Basin, Xinjiang. J. Palaeogeogr. 2016, 18, 833–842. [Google Scholar]
- Ni, S.; Song, J.; Cai, Y.; Zhang, X.; Li, Z.; Qiu, Y.; Zhang, H.; Jiang, H. Sedimentary Characteristics and Evolution of the Middle Jurassic Xishanyao Formation in the Langka area, Southern Margin of the Yili Basin. ACTA Sedimentol. Sin. 2021, 39, 434–445. [Google Scholar]
- GB/T 14506.28-2010; Methods for Chemical Analysis of Silicate Rocks—Part 28: Determination of 16 Major and Minor Elements Content. China Standards Press: Beijing, China, 2010.
- GB/T 14506.30-2010; Methods for Chemical Analysis of Silicate Rocks—Part 30: Determination of 44 Elements. China Standards Press: Beijing, China, 2010.
- GB/T 19145-2022; Determination for Total Organic Carbon in Sedimentary Rock. China Standards Press: Beijing, China, 2022.
- GB/T 14506.13-2010; Methods for Chemical Analysis of Silicate Rocks—Part 13: Determination of Sulfur Content. China Standards Press: Beijing, China, 2010.
- GB/T 14506.14-2010; Methods for Chemical Analysis of Silicate Rocks—Part 14: Determination of Ferrous Oxide Content. China Standards Press: Beijing, China, 2010.
- Martz, P.; Mercadier, J.; Perret, J.; Villeneuve, J.; Deloule, E.; Cathelineau, M.; Quirt, D.; Doney, A.; Ledru, P. Post-crystallization alteration of natural uraninites: Implications for dating, tracing, and nuclear forensics. Geochim. Cosmochim. Acta 2019, 249, 138–159. [Google Scholar] [CrossRef]
- Huang, H.; Wang, K.-X.; Cuney, M.; Pan, J.-Y.; Bonnetti, C.; Liu, X.-D.; Zhong, F.-J. Mesozoic magmatic and hydrothermal uranium mineralization in the Huayangchuan carbonatite-hosted U-Nb-polymetallic deposit, North Qinling Orogen (Central China): Evidence from uraninite chemical and isotopic compositions. Ore Geol. Rev. 2022, 146, 104958. [Google Scholar] [CrossRef]
- Wang, K.-X.; Zhu, K.-H.; Dai, J.-W.; Yang, J.-J.; Liu, X.-D.; Cuney, M.; Yu, C.-D.; Wu, J. Genesis of the Haidewula volcanic rock-hosted uranium deposit in the East Kunlun Orogen, northwestern China. J. Asian Earth Sci. 2024, 266, 106124. [Google Scholar] [CrossRef]
- Papoulis, D.; Tsolis-Katagas, P.; Katagas, C. Progressive stages in the formation of kaolin minerals of different morphologies in the weathering of plagioclase. Clays Clay Miner. 2004, 52, 275–286. [Google Scholar] [CrossRef]
- Landais, P. Advances in geochemical research for the underground disposal of high-level, long-lived radioactive waste in a clay formation. J. Geochem. Explor. 2006, 88, 32–36. [Google Scholar] [CrossRef]
- Li, T.; Huang, X.; Wang, Q.; Yang, G. Adsorption of metal ions at kaolinite surfaces: Ion-specific effects, and impacts of charge source and hydroxide formation. Appl. Clay Sci. 2020, 194, 105706. [Google Scholar] [CrossRef]
- Golubeva, O.Y.; Alikina, Y.A.; Kalashnikova, T.A. Influence of hydrothermal synthesis conditions on the morphology and sorption properties of porous aluminosilicates with kaolinite and halloysite structures. Appl. Clay Sci. 2020, 199, 105879. [Google Scholar] [CrossRef]
- Gezahegn, G.; Getaneh, W. Economic geology and genesis of kaolin resources in the East African Rift system: The case of Alemtena kaolin deposit, Ethiopia. Appl. Earth Sci. 2020, 129, 191–204. [Google Scholar] [CrossRef]
- Osborne, M.; Haszeldine, R.; Fallick, A. Variation in kaolinite morphology with growth temperature in isotopically mixed pore-fluids, Brent Group, UK North Sea. Clay Miner. 1994, 29, 591–608. [Google Scholar] [CrossRef]
- Mansa, R.; Piegang, G.B.N.; Detellier, C. Kaolinite aggregation in book-like structures from non-aqueous media. Clays Clay Miner. 2017, 65, 193–205. [Google Scholar] [CrossRef]
- Jeong, G.Y. Vermicular kaolinite epitactic on primary phyllosilicates in the weathering profiles of anorthosite. Clays Clay Miner. 1998, 46, 509–520. [Google Scholar] [CrossRef]
- Arslan, M.; Kadir, S.; Abdioğlu, E.; Kolayli, H. Origin and formation of kaolin minerals in saprolite of Tertiary alkaline volcanic rocks, Eastern Pontides, NE Turkey. Clay Miner. 2006, 41, 597–617. [Google Scholar] [CrossRef]
- Zhang, X.; Lu, X.; Liu, Q.; Zhang, L.; Li, J.; Ma, Y.; Zhang, L. Characteristics and genetic mechanism of authigenic kaolinite in the sandstones of the Shahejie formation in the Dongying depression. J. Nanjing Univ. (Nat. Sci.) 2013, 49, 331–343. [Google Scholar]
- Worden, R.H.; Morad, S. Clay Mineral Cements in Sandstones; Elsevier: Oxford, UK, 2003. [Google Scholar]
- Song, H.; Ni, S.; Chi, G.; Zhang, C.; Hou, M.; Liu, H.; Wang, G.; Yan, W. Systematic variations of H-O-C isotopes in different alteration zones of sandstone-hosted uranium deposits in the southern margin of the Yili Basin (Xinjiang, China): A review and implications for the ore-forming mechanisms. Ore Geol. Rev. 2019, 107, 615–628. [Google Scholar] [CrossRef]
- Xiu, X.; Liu, H.; Zhang, Y.; Suo, S. A study of ore-forming fluid in Mengqiguer uranium deposit, Xinjiang. Miner. Depos. 2015, 34, 488–496. [Google Scholar]
- Chi, G.; Haid, T.; Quirt, D.; Fayek, M.; Blamey, N.; Chu, H. Petrography, fluid inclusion analysis, and geochronology of the End uranium deposit, Kiggavik, Nunavut, Canada. Miner. Depos. 2016, 52, 211–232. [Google Scholar] [CrossRef]
- Mercadier, J.; Richard, A.; Cathelineau, M. Boron- and magnesium-rich marine brines at the origin of giant unconformity-related uranium deposits: δ11B evidence from Mg-tourmalines. Geology 2012, 40, 231–234. [Google Scholar] [CrossRef]
- Richard, A.; Rozsypal, C.; Mercadier, J.; Banks, D.A.; Cuney, M.; Boiron, M.-C.; Cathelineau, M. Giant uranium deposits formed from exceptionally uranium-rich acidic brines. Nat. Geosci. 2012, 5, 142–146. [Google Scholar] [CrossRef]
- Wilson, M.; Shaldybin, M.; Wilson, L. Clay mineralogy and unconventional hydrocarbon shale reservoirs in the USA. I. Occurrence and interpretation of mixed-layer R3 ordered illite/smectite. Earth-Sci. Rev. 2016, 158, 31–50. [Google Scholar] [CrossRef]
- Hong, H.; Cheng, F.; Yin, K.; Churchman, G.J.; Wang, C. Three-component mixed-layer illite/smectite/kaolinite (I/S/K) minerals in hydromorphic soils, south China. Am. Mineral. 2015, 100, 1883–1891. [Google Scholar] [CrossRef]
- Mills, M.M.; Sanchez, A.C.; Boisvert, L.; Payne, C.B.; Ho, T.A.; Wang, Y. Understanding smectite to illite transformation at elevated (>100 C) temperature: Effects of liquid/solid ratio, interlayer cation, solution chemistry and reaction time. Chem. Geol. 2023, 615, 121214. [Google Scholar] [CrossRef]
- Hayashi, K.-I.; Fujisawa, H.; Holland, H.D.; Ohmoto, H. Geochemistry of ∼1.9 Ga sedimentary rocks from northeastern Labrador, Canada. Geochim. Cosmochim. Acta 1997, 61, 4115–4137. [Google Scholar] [CrossRef]
- Huang, G.; Xue, W.; Pan, J.; Song, T.; Huang, G.; Zhang, C.; Bai, X.; Zhang, T.; Hong, B. Provenance and Tectonic Setting of Sandstones in the Mengqiguer Sandstone-type Uranium Deposit, Yili Basin: Evidence from Zircon U-Pb Chronology. Geotecton. Metallog. 2018, 42, 1108–1120. [Google Scholar]
- Roser, B.P.; Korsch, R.J. Provenance signatures of sandstone-mudstone suites determined using discriminant function analysis of major-element data. Chem. Geol. 1988, 67, 119–139. [Google Scholar] [CrossRef]
- Chao, H.; Hou, M.; Jiang, W.; Cao, H.; Chang, X.; Luo, W.; Ogg, J.G. Paleoclimatic and redox condition changes during early-middle jurassic in the Yili Basin, Northwest China. Minerals 2021, 11, 675. [Google Scholar] [CrossRef]
- Xiang, D.; Mao, Q.; Zhang, Z.; Liu, S.; Chew, D.; Wu, L.; Wang, N.; Guo, C.; Yang, H.; Xiao, W. Two-stage Jurassic tectono-geomorphological evolution of the Yili-Central Tianshan: Insights into its role in shaping the Mesozoic-Cenozoic Landscape. Palaeogeogr. Palaeoclimatol. Palaeoecol. 2026, 686, 113541. [Google Scholar] [CrossRef]
- Abzalov, M.Z. Geochemical exploration for buried sandstone-hosted uranium mineralization using mobile U and Pb isotopes: Case study of the REB deposit, Great Divide Basin, Wyoming. Geochem. Explor. Environ. Anal. 2021, 21, geochem2021-043. [Google Scholar] [CrossRef]
- Abzalov, M.Z.; Paulson, O. Sandstone hosted uranium deposits of the Great Divide Basin, Wyoming, USA. Appl. Earth Sci. 2013, 121, 76–83. [Google Scholar] [CrossRef]
- Dillinger, A.; Chanvry, E.; Bolat, Y.; Fustic, M. Architecture and history of uranium-bearing Palaeocene–Eocene strata deposited on the eastern margin of the Peri-Tethys (Chu-Sarysu Basin, south Kazakhstan). Sediment. Geol. 2024, 468, 106677. [Google Scholar] [CrossRef]
- Liu, Y.; Zhao, J.-H.; Jiao, Y.-Q.; Liu, Z.-R.; Zhou, M.-F. Constraints of in-situ S-isotopic compositions of pyrite on the genesis of the Bayinqinggeli sandstone-hosted uranium deposit, Ordos Basin, Northern China. Ore Geol. Rev. 2023, 161, 105608. [Google Scholar] [CrossRef]
Figure 1.
A sketch map showing the regional tectonic location of the Yili Basin.
Figure 1.
A sketch map showing the regional tectonic location of the Yili Basin.
Figure 2.
North–south cross-sectional view of the Yining Depression.
Figure 2.
North–south cross-sectional view of the Yining Depression.
Figure 3.
(a) A sketch geological map of the Mengqiguer deposit showing the main stratigraphic units and distribution of uranium deposits. (b) A thickness contour map of the sand body and a distribution map of uranium mineralization in the lower member of Xishanyao Formation.
Figure 3.
(a) A sketch geological map of the Mengqiguer deposit showing the main stratigraphic units and distribution of uranium deposits. (b) A thickness contour map of the sand body and a distribution map of uranium mineralization in the lower member of Xishanyao Formation.
Figure 4.
A litho-stratigraphic section showing the uranium mineralization intervals in the lower member of the Xishanyao Formation in the Mengqiguer deposit.
Figure 4.
A litho-stratigraphic section showing the uranium mineralization intervals in the lower member of the Xishanyao Formation in the Mengqiguer deposit.
Figure 5.
Cross-section of a typical sandstone-hosted uranium mineralization in different exploration lines, Mengqiguer deposit.
Figure 5.
Cross-section of a typical sandstone-hosted uranium mineralization in different exploration lines, Mengqiguer deposit.
Figure 6.
(a) A schematic diagram of typical interlayer oxidation zones in the Mengqiguer deposit; (b–g) typical core samples from the Mengqiguer deposit; (h–l) photomicrographs of sandstone samples from different zones in the Mengqiguer deposit.
Figure 6.
(a) A schematic diagram of typical interlayer oxidation zones in the Mengqiguer deposit; (b–g) typical core samples from the Mengqiguer deposit; (h–l) photomicrographs of sandstone samples from different zones in the Mengqiguer deposit.
Figure 7.
Scanning electron microscope images of different morphologies of kaolinite in the Mengqiguer deposit. (A) Platy, (B) vermicular, (C) booklet-like and (D) booklet-like associated with illite and chlorite. Kao: kaolinite; Chl: chlorite; ill: illite.
Figure 7.
Scanning electron microscope images of different morphologies of kaolinite in the Mengqiguer deposit. (A) Platy, (B) vermicular, (C) booklet-like and (D) booklet-like associated with illite and chlorite. Kao: kaolinite; Chl: chlorite; ill: illite.
Figure 8.
SEM diagrams of different uranium minerals associated with pyrite. (a) Euhedral-subhedral pyrite (Py) and pitchblende (Pit) inclusions hosted in quartz (Q) grains; (b) Brannerite (Bran) and pyrite (Py) filled in the micro-fractures of quartz (Q); (c) Pitchblende (Pit), coffinite (Cof) and pyrite (Py) inclusions distributed within a single quartz (Q) grain; (d) Intergrown pyrite (Py) and coffinite (Cof) hosted in quartz (Q) grain.
Figure 8.
SEM diagrams of different uranium minerals associated with pyrite. (a) Euhedral-subhedral pyrite (Py) and pitchblende (Pit) inclusions hosted in quartz (Q) grains; (b) Brannerite (Bran) and pyrite (Py) filled in the micro-fractures of quartz (Q); (c) Pitchblende (Pit), coffinite (Cof) and pyrite (Py) inclusions distributed within a single quartz (Q) grain; (d) Intergrown pyrite (Py) and coffinite (Cof) hosted in quartz (Q) grain.
Figure 9.
Binary diagrams of uranium mineral compositions in the Mengqiguer deposit. UO2 versus (a) SiO2 (%), (b) TiO2 (%), (c) CaO (%), and (d) P2O5 (%).
Figure 9.
Binary diagrams of uranium mineral compositions in the Mengqiguer deposit. UO2 versus (a) SiO2 (%), (b) TiO2 (%), (c) CaO (%), and (d) P2O5 (%).
Figure 10.
Box plots of redox-sensitive elements and their relation ratios.
Figure 10.
Box plots of redox-sensitive elements and their relation ratios.
Figure 11.
Discriminant function diagrams for samples from the lower member of the Xishanyao Formation, in the Mengqiguer deposit [
52]. Function 1 = 30.638 × TiO
2/Al
2O
3 − 12.541 × Fe
2O
3/Al
2O
3 + 7.329 × MgO/Al
2O
3 + 12.032 × Na
2O/Al
2O
3 + 35.402 × K
2O/Al
2O
3 − 6.382; Function 2 = 36.5 × TiO
2/Al
2O
3 − 10.879 × Fe
2O
3/Al
2O
3 + 30.875 × MgO/Al
2O
3 − 5.404 × Na
2O/Al
2O
3 + 11.112 × K
2O/Al
2O
3 − 3.89.
Figure 11.
Discriminant function diagrams for samples from the lower member of the Xishanyao Formation, in the Mengqiguer deposit [
52]. Function 1 = 30.638 × TiO
2/Al
2O
3 − 12.541 × Fe
2O
3/Al
2O
3 + 7.329 × MgO/Al
2O
3 + 12.032 × Na
2O/Al
2O
3 + 35.402 × K
2O/Al
2O
3 − 6.382; Function 2 = 36.5 × TiO
2/Al
2O
3 − 10.879 × Fe
2O
3/Al
2O
3 + 30.875 × MgO/Al
2O
3 − 5.404 × Na
2O/Al
2O
3 + 11.112 × K
2O/Al
2O
3 − 3.89.
Table 1.
Relative contents of clay minerals and mineral contents of samples from the lower member of the Xishanyao Formations in the Mengqiguer deposit.
Table 1.
Relative contents of clay minerals and mineral contents of samples from the lower member of the Xishanyao Formations in the Mengqiguer deposit.
| Zonation | Relative Contents of Clay Minerals | Whole-Rock XRD Results (vol.%) |
|---|
| Kaolinite | Chlorite | Illite | Illite–Smectite | Total Clay
Minerals | Quartz | K-Feldspar | Plagioclase | Calcite | Dolomite |
|---|
Strong oxidation
zone n = 11 | 85.1 | 4.99 | 7.36 | 4.59 | 8.02 | 75.5 | 4.33 | 0.13 | 11.89 | 0.34 |
Moderate–weak
oxidation zone n = 5 | 91.3 | 0.64 | 7.28 | 0.80 | 12.9 | 68.8 | 5.46 | 0.11 | 14.63 | 1.03 |
Transition
zone n = 9 | 78.7 | 3.44 | 6.11 | 11.78 | 10.78 | 84 | 1.78 | | 1.50 | 2.33 |
| Primarily unaltered zone n = 41 | 80.1 | 5.19 | 6.42 | 7.95 | 12.79 | 77.4 | 5.52 | 4.75 | 4.71 | 2.17 |
Table 2.
Whole-rock major elemental compositions (wt.%) of samples from the lower member of the Xishanyao Formation.
Table 2.
Whole-rock major elemental compositions (wt.%) of samples from the lower member of the Xishanyao Formation.
| Sample | SiO2 | TiO2 | Al2O3 | Fe2O3t | FeO | Fe2O3 | MnO | MgO | CaO | Na2O | K2O | P2O5 | Al2O3/TiO2 | K2O/Na2O | K2O/Al2O3 | Fe2O3/FeO |
|---|
| Strong oxidation zone, n = 28 | | | | | | | | | | |
| max | 90.64 | 0.76 | 14.14 | 2.56 | 1.25 | 1.71 | 0.10 | 0.60 | 6.79 | 1.28 | 2.65 | 0.04 | 57.67 | 58.77 | 0.33 | 24.43 |
| min | 75.29 | 0.09 | 4.74 | 0.32 | 0.04 | 0.01 | 0.01 | 0.10 | 0.02 | 0.03 | 1.08 | 0.00 | 12.60 | 1.34 | 0.11 | 0.02 |
| median | 85.68 | 0.21 | 7.64 | 1.21 | 0.72 | 0.29 | 0.01 | 0.21 | 0.47 | 0.10 | 1.69 | 0.02 | 37.05 | 17.59 | 0.22 | 0.75 |
| Moderate–weak oxidation zone, n = 28 | | | | | | | | | | | |
| max | 92.44 | 0.80 | 12.72 | 2.61 | 1.30 | 1.24 | 0.07 | 0.54 | 4.38 | 1.04 | 3.23 | 0.19 | 56.02 | 42.54 | 0.36 | 20.50 |
| min | 77.53 | 0.10 | 4.15 | 0.31 | 0.03 | 0.05 | 0.00 | 0.11 | 0.04 | 0.04 | 1.07 | 0.00 | 5.59 | 1.98 | 0.18 | 0.05 |
| median | 86.47 | 0.17 | 6.51 | 1.00 | 0.65 | 0.30 | 0.01 | 0.19 | 0.17 | 0.18 | 1.96 | 0.02 | 38.98 | 8.27 | 0.27 | 0.51 |
| Transition zone, n = 27 | | | | | | | | | | | |
| max | 88.56 | 0.66 | 16.08 | 2.58 | 1.09 | 1.76 | 0.04 | 1.38 | 3.25 | 0.41 | 3.77 | 0.06 | 75.50 | 27.26 | 0.49 | 2.91 |
| min | 72.13 | 0.06 | 4.53 | 0.30 | 0.11 | 0.03 | 0.00 | 0.17 | 0.14 | 0.08 | 1.47 | 0.02 | 15.73 | 5.63 | 0.15 | 0.05 |
| median | 82.03 | 0.25 | 10.51 | 0.89 | 0.45 | 0.25 | 0.02 | 0.33 | 0.69 | 0.13 | 2.29 | 0.03 | 39.53 | 16.65 | 0.18 | 0.47 |
| Primarily unaltered zone, n = 26 | | | | | | | | | | | |
| max | 90.27 | 0.61 | 12.78 | 2.86 | 1.98 | 1.06 | 0.05 | 0.70 | 2.06 | 1.17 | 2.96 | 0.16 | 56.04 | 38.13 | 0.34 | 4.23 |
| min | 75.44 | 0.10 | 4.98 | 0.40 | 0.10 | 0.11 | 0.01 | 0.12 | 0.10 | 0.05 | 1.16 | 0.01 | 10.16 | 1.92 | 0.15 | 0.15 |
| median | 84.44 | 0.26 | 8.48 | 1.37 | 0.93 | 0.39 | 0.02 | 0.32 | 0.41 | 0.10 | 1.89 | 0.03 | 34.02 | 17.45 | 0.23 | 0.42 |
Table 3.
EMPA major elemental compositions (wt.%) of uranium minerals in the lower member of the Xishanyao Formation, Mengqiguer deposit.
Table 3.
EMPA major elemental compositions (wt.%) of uranium minerals in the lower member of the Xishanyao Formation, Mengqiguer deposit.
| Sample | SiO2 | TiO2 | CaO | Fe2O3 | UO2 | Total | Formula |
|---|
| Ur-1 | 0.95 | 0.21 | 4.32 | 0.11 | 84.87 | 93.09 | (U0.84Ca0.21Ti0.08Si0.042Fe0.004)O2 |
| Ur-2 | 1.09 | 0.09 | 4.17 | 0.14 | 83.44 | 91.60 | (U0.84Ca0.20Ti0.03Si0.049Fe0.005)O2 |
| Ur-3 | 1.36 | 0.10 | 4.32 | 1.79 | 86.31 | 97.01 | (U0.80Ca0.19Ti0.01Si0.057Fe0.056)O2 |
| Ur-4 | 1.39 | | 4.11 | 2.69 | 84.89 | 96.22 | (U0.79Ca0.18Si0.058Fe0.084)O2 |
| Ur-5 | 1.63 | 2.32 | 3.3 | 1.6 | 82.84 | 94.30 | (U0.75Ca0.14Ti0.071Si0.067Fe0.049)O2 |
| Ur-6 | 3.15 | 0.58 | 3.15 | 1.58 | 72.95 | 86.04 | (U0.73Ca0.15Ti0.019Si0.14Fe0.053)O2 |
| Ur-7 | 1.53 | 0.91 | 1.98 | 0.6 | 84.54 | 92.14 | (U0.84Ca0.095Ti0.031Si0.068Fe0.02)O2 |
| Ur-8 | 4.56 | 0.98 | 1.92 | 0.72 | 70.47 | 85.82 | (U0.7Ca0.092Ti0.033Si0.203Fe0.024)O2 |
| Ur-9 | 1.84 | 4.63 | 1.73 | 1.05 | 80.91 | 92.79 | (U0.73Ca0.075Ti0.14Si0.074Fe0.032)O2 |
| Ur-10 | 1.21 | 3.52 | 2.7 | 1.25 | 84.63 | 95.29 | (U0.76Ca0.12Ti0.107Si0.049Fe0.038)O2 |
| Ur-11 | 2.74 | 1.98 | 2.8 | 1.62 | 80.06 | 91.97 | (U0.73Ca0.123Ti0.061Si0.112Fe0.05)O2 |
| Ur-12 | 2.36 | 1.79 | 2.86 | 1.45 | 82.2 | 92.70 | (U0.75Ca0.13Ti0.055Si0.097Fe0.045)O2 |
| Ur-13 | 0.84 | 1.03 | 3.43 | 1.19 | 86.16 | 94.36 | (U0.82Ca0.16Ti0.033Si0.036Fe0.038)O2 |
| Ur-14 | 0.85 | 0.86 | 3.7 | 1 | 87.15 | 95.47 | (U0.83Ca0.17Ti0.028Si0.036Fe0.032)O2 |
| Ur-15 | 0.94 | | 4.05 | 1.72 | 87.64 | 96.37 | (U0.83Ca0.18Si0.04Fe0.055)O2 |
| Ur-16 | 1.2 | 0.09 | 4.22 | 2.05 | 85.55 | 95.32 | (U0.80Ca0.19Ti0.003Si0.051Fe0.065)O2 |
| Ur-17 | 0.83 | 5.95 | 4.16 | 0.32 | 85 | 98.62 | (U0.71Ca0.17Ti0.17Si0.031Fe0.009)O2 |
| Ur-18 | 1.02 | 4.25 | 4.23 | 0.26 | 84.41 | 96.68 | (U0.74Ca0.18Ti0.13Si0.04Fe0.008)O2 |
| Ur-19 | 0.85 | 7.16 | 4.13 | 0.25 | 78.89 | 93.55 | (U0.67Ca0.17Ti0.206Si0.033Fe0.007)O2 |
| Ur-20 | 0.83 | 8.08 | 4.34 | 0.31 | 84.05 | 99.97 | (U0.67Ca0.17Ti0.22Si0.03Fe0.008)O2 |
| Ur-21 | 3.68 | 0.63 | 4.82 | 0.13 | 84.6 | 96.60 | (U0.73Ca0.201Ti0.018Si0.144Fe0.004)O2 |
| Ur-22 | 3.84 | 0.49 | 4.54 | 0.22 | 87.96 | 99.58 | (U0.74Ca0.19Ti0.014Si0.15Fe0.006)O2 |
| Ur-23 | 0.09 | | | 0.07 | 88.51 | 96.84 | (U0.99Si0.15Fe0.003)O2 |
| Ur-24 | | | | 0.07 | 88.25 | 96.78 | (U0.99Fe0.003)O2 |
| Ur-25 | 1.08 | 0.76 | 3.95 | 0.31 | 85.29 | 96.69 | (U0.83Ca0.19Ti0.025Si0.047Fe0.01)O2 |
| Ur-26 | 1.05 | 0.25 | 3.52 | 0.38 | 85.47 | 95.71 | (U0.85Ca0.17Ti0.008Si0.047Fe0.013)O2 |
| Ur-27 | 1.24 | 0.59 | 2.62 | 0.61 | 85.32 | 94.30 | (U0.85Ca0.13Ti0.02Si0.055Fe0.02)O2 |
| Ur-28 | 1.21 | | 5.38 | 1.09 | 87.16 | 97.84 | (U0.80Ca0.24Si0.05Fe0.034)O2 |
| Ur-29 | 3.08 | | 4.39 | 1.78 | 80.01 | 98.17 | (U0.73Ca0.20Si0.127Fe0.055)O2 |
| Ur-30 | 10.97 | 3.16 | 2.99 | 1.38 | 72.74 | 98.76 | (U0.51Ca0.1Ti0.074Si0.344Fe0.033)O2 |
| Ur-31 | 1.59 | | 5.65 | 2.54 | 82.92 | 99.71 | (U0.75Ca0.25Si0.065Fe0.078)O2 |
| Ur-32 | 0.97 | | 5.3 | 4.46 | 79.71 | 96.62 | (U0.74Ca0.24Si0.04Fe0.14)O2 |
| Ur-33 | 1.49 | | 5.26 | 0.77 | 85.42 | 96.58 | (U0.80Ca0.24Si0.063Fe0.024)O2 |
| Ur-34 | 1.3 | | 6.17 | 1.1 | 86 | 97.99 | (U0.79Ca0.27Si0.053Fe0.034)O2 |
| BRAN-1 | 1.72 | 57.34 | 0.87 | 8.35 | 10.95 | 82.44 | (U0.14Ca0.05)0.19(Ti2.47Fe0.36Si0.10)2.93O6 |
| BRAN-2 | 9.6 | 44.23 | 0.91 | 7.59 | 11.74 | 82.65 | (U0.16Ca0.06)0.22(Ti1.97Fe0.34Si0.57)2.88O6 |
| BRAN-3 | 2.42 | 21.87 | 1.14 | 5.99 | 58.62 | 97.13 | (U1.09Ca0.1)1.19(Ti1.38Fe0.38Si0.20)1.96O6 |
| BRAN-4 | 1.59 | 28.37 | 0.97 | 5.54 | 53.14 | 96.09 | (U0.92Ca0.08)1.00(Ti1.67Fe0.33Si0.12)2.12O6 |
| BRAN-5 | 3.83 | 21.39 | 1.93 | 6.09 | 57.75 | 97.71 | (U1.04Ca0.17)1.21(Ti1.30Fe0.37Si0.31)1.98O6 |
| BRAN-6 | 5.54 | 29.58 | 4.01 | 1.3 | 41.04 | 94.22 | (U0.69Ca0.32)1.01(Ti1.68Fe0.074Si0.42)2.17O6 |
| BRAN-7 | 1.2 | 13.33 | 3 | 1.25 | 56.66 | 79.21 | (U1.45Ca0.37)1.82(Ti1.15Fe0.11Si0.138)1.40O6 |
| BRAN-8 | 5.51 | 12.72 | 2.81 | 0.55 | 48.07 | 75.82 | (U1.16Ca0.33)1.49(Ti1.04Fe0.045Si0.60)1.69O6 |
| BRAN-9 | 10.82 | 23.47 | 1.35 | 5.87 | 43.87 | 94.45 | (U0.69Ca0.10)0.79(Ti1.25Fe0.31Si0.77)2.33O6 |
| BRAN-10 | 11.28 | 21.99 | 1.32 | 5.41 | 44.77 | 93.82 | (U0.72Ca0.10)0.82(Ti1.20Fe0.29Si0.81)2.3O6 |
| Cof-1 | 15.61 | 0.87 | 3.54 | 0.53 | 67.04 | 96.52 | (U0.89Ti0.039Ca0.23Fe0.024)Si0.935O4 |
| Cof-2 | 16.42 | 0.84 | 3.49 | 0.93 | 59.71 | 90.51 | (U0.81Ti0.039Ca0.23Fe0.043)Si1.003O4 |
| Cof-3 | 23.51 | 0.37 | 3.15 | 0.12 | 50.03 | 86.77 | (U0.61Ti0.015Ca0.18Fe0.005)Si1.28O4 |
| Cof-4 | 29.66 | 0.21 | 2.37 | 0.11 | 39.03 | 81.05 | (U0.44Ti0.008Ca0.13Fe0.004)Si1.49O4 |
| Cof-5 | 22.83 | | 3.63 | 0.82 | 62.13 | 99.28 | (U0.71Ca0.20Fe0.032)Si1.17O4 |
| Cof-6 | 35.92 | 0.65 | 2.72 | 1.28 | 43.53 | 98.55 | (U0.40Ti0.02Ca0.12Fe0.04)Si1.49O4 |
| Cof-7 | 24.19 | 0.11 | 3.02 | 0.91 | 46.33 | 90.79 | (U0.56Ti0.005Ca0.18Fe0.037)Si1.32O4 |
| Cof-8 | 14.75 | 0.17 | 3.29 | 0.48 | 48.39 | 78.76 | (U0.78Ti0.009Ca0.26Fe0.026)Si1.066O4 |
| Cof-9 | 13.68 | 1.22 | 4.11 | 0.13 | 67.31 | 95.19 | (U0.94Ti0.058Ca0.28Fe0.006)Si0.86O4 |
| Cof-10 | 15.57 | 0.42 | 3.72 | | 71.59 | 99.30 | (U0.94Ti0.019Ca0.24)Si0.92O4 |
Table 4.
Redox-sensitive elemental contents and related ratios of samples from the lower member of the Xishanyao Formation, Mengqiguer deposit.
Table 4.
Redox-sensitive elemental contents and related ratios of samples from the lower member of the Xishanyao Formation, Mengqiguer deposit.
| Sample | U (ppm) | Th (ppm) | S (wt.%) | C (wt.%) | Fe2+ (wt.%) | Fe3+ (wt.%) | Fe3+/Fe2+ | Th/U |
|---|
| Strong oxidation zone, n = 126 | | | | |
| max | 21.68 | 14.00 | 0.29 | 1.74 | 1.55 | 2.30 | 20.80 | 15.81 |
| min | 0.62 | 2.38 | 0.00 | 0.00 | 0.03 | 0.01 | 0.10 | 0.29 |
| median | 4.43 | 5.65 | 0.01 | 0.12 | 0.41 | 0.42 | 1.31 | 1.33 |
| Moderate–weak oxidation zone, n = 61 | | | | |
| max | 71.43 | 12.82 | 0.52 | 0.55 | 1.22 | 3.51 | 27.06 | 2.49 |
| min | 3.40 | 3.14 | 0.00 | 0.02 | 0.02 | 0.03 | 0.05 | 0.06 |
| median | 21.43 | 6.30 | 0.05 | 0.21 | 0.48 | 0.47 | 2.63 | 0.47 |
| Transition zone, n = 100 | | | | |
| max | 8595.50 | 15.75 | 5.75 | 3.82 | 1.48 | 13.97 | 18.38 | 0.14 |
| min | 92.18 | 3.35 | 0.02 | 0.08 | 0.09 | 0.02 | 0.02 | 0.00 |
| median | 412.71 | 5.94 | 0.12 | 0.30 | 0.45 | 0.30 | 0.80 | 0.01 |
| Primarily unaltered zone, n = 138 | | | | |
| max | 90.74 | 26.90 | 3.84 | 4.93 | 1.43 | 3.11 | 5.67 | 40.23 |
| min | 0.18 | 2.24 | 0.01 | 0.02 | 0.06 | 0.01 | 0.01 | 0.05 |
| median | 14.71 | 6.50 | 0.09 | 0.26 | 0.58 | 0.35 | 0.75 | 0.60 |
| Disclaimer/Publisher’s Note: The statements, opinions and data contained in all publications are solely those of the individual author(s) and contributor(s) and not of MDPI and/or the editor(s). MDPI and/or the editor(s) disclaim responsibility for any injury to people or property resulting from any ideas, methods, instructions or products referred to in the content. |