Article

Flocculation–Sedimentation of Coal Slurry Water with Calcium Chloride and Polyacrylamide: Experiments and Particle Aggregation Sensitivity Analysis

School of Materials Science and Engineering, Anhui University of Science and Technology, Huainan 232001, China
*
Author to whom correspondence should be addressed.
Minerals 2026, 16(10), 1009; https://doi.org/10.3390/min16101009
Submission received: 24 July 2026 / Revised: 25 September 2026 / Accepted: 28 September 2026 / Published: 30 September 2026
(This article belongs to the Section Mineral Processing and Extractive Metallurgy)

Abstract

To address the problems of fine particle size, high ash content, strong suspension stability, and poor settling performance of coal slurry water in coal preparation plants, enhanced flocculation–sedimentation experiments using combined CaCl2 and polyacrylamide were conducted, and a particle-scale numerical sensitivity model was employed to investigate microscopic aggregation behavior under different conditions. The coal slurry water was first characterized in terms of water quality, mineral composition, and particle size distribution. Single-factor tests with CaCl2, nonionic polyacrylamide (PAM), and anionic polyacrylamide (APAM), followed by combined CaCl2 + PAM and CaCl2 + APAM tests, were then performed. The results showed that the appropriate dosages of CaCl2, PAM, and APAM in the single-factor tests were 1.4 g/L, 4 mg/L, and 0.6–1.0 mg/L, respectively. Among the combined systems, CaCl2 + APAM exhibited superior overall settling performance. At 1.2 g/L CaCl2 and 0.8 mg/L APAM, the settling rate reached 805 mm/min and the supernatant turbidity decreased to 41.7 NTU. In the numerical model, the particle composition was reconstructed according to the measured particle size distribution, with the 1–5 μm ultrafine fraction retained to improve consistency between the model and the actual coal slurry particle size characteristics. Sensitivity analysis showed that, when the effective particle adhesion parameter increased from 0.2 to 0.8, the mean floc size at 60 s increased from 10.655 to 13.065 μm, the aggregation rate increased from 0.00356 to 0.01034 s−1, and the apparent fractal dimension increased from 1.065 to 1.184, indicating that enhanced effective particle adhesion significantly promotes the formation of stable aggregates. In addition, as the CaCl2 dosage increased from 0.6 to 2.4 g/L, the corresponding ionic-strength increment increased from 16.219 to 64.877 mmol/L, accompanied by stronger electrostatic screening and increasing trends in the simulated mean floc size and aggregation rate. These results indicate that CaCl2-induced electrical double-layer screening and polyacrylamide-promoted effective particle adhesion jointly influence the aggregation of coal slurry particles, while the CaCl2 + APAM system provides favorable solid–liquid separation performance. The findings provide a reference for optimizing combined reagent addition and improving sedimentation treatment of coal slurry water in coal preparation plants.

1. Introduction

Large quantities of tailings slurry, coal slurry water, and fine solid wastes are generated during coal and mineral processing, and their efficient treatment is directly related to water recycling in mineral processing and coal preparation as well as the stable operation of production systems. Previous studies have shown that flocculation–sedimentation is an important technique for treating fine tailings slurry and coal slurry water. By optimizing the type and dosage of flocculants as well as process conditions, particle settling performance and solid–liquid separation efficiency can be effectively improved [1,2]. For coal slurry water in coal preparation plants, systematic studies have been conducted on water quality characteristics, factors affecting flocculation, and the treatment of difficult-to-settle coal slime, demonstrating that slurry composition, reagent regime, and operating conditions all exert significant effects on sedimentation performance [3,4,5]. On this basis, intelligent reagent dosing and automatic control of thickening processes have gradually been applied to coal slurry water treatment in coal preparation plants. By dynamically adjusting reagent dosage according to water quality and operating conditions, the stability of the treatment process and reagent utilization efficiency can be further improved [6,7,8]. Meanwhile, studies on improving clean coal recovery and deashing coal gasification fine slag have also demonstrated that improving the separation and recovery of fine coal particles can aid coal-resource utilization [9,10]. However, for coal slurry water characterized by high ash content, a high proportion of ultrafine particles, and poor settling behavior, a single reagent often cannot simultaneously achieve rapid sedimentation and low supernatant turbidity. Therefore, it is necessary to further investigate the combined effects of inorganic coagulants and polymeric flocculants and to determine their appropriate dosage conditions.
Particle-scale numerical simulation provides a complementary approach for investigating flocculation kinetics. Previous studies have shown that Ca2+ can significantly affect the surface electrical properties and aggregation behavior of coal and clay mineral particles, whereas the long-chain structure of anionic polyacrylamide (APAM) facilitates interparticle bridging and floc formation. However, complex synergistic relationships exist among CaCl2 concentration, polymer type, and the dosages of nonionic polyacrylamide (PAM) and APAM. Macroscopic indicators such as settling rate and supernatant turbidity alone are insufficient to further describe particle collision, adhesion, and the structural evolution of flocs [11,12]. Based on extended DLVO theory, Lin et al. reported that the aggregation behavior of coal and clay particles is jointly governed by electrostatic interactions and surface forces; Ca2+ can reduce electrostatic repulsion between particles, whereas APAM mainly promotes flocculation through a bridging mechanism [13]. Li et al. further demonstrated through in situ ζ-potential measurements that variations in Ca2+ concentration significantly alter the surface electrical properties and aggregation state of particles in clay-containing coal slurry [14]. Xu et al. examined the effects of polymer molecular weight and coagulant addition on coal slime flocculation and filtration [15]. Yan et al. also confirmed that Ca2+ can promote the sedimentation of illite particles, although its specific effect depends on particle surface properties and ion adsorption behavior [11]. Kroupa et al. simulated colloidal particle coagulation using the discrete element method (DEM) coupled with DLVO theory and showed that particle volume fraction, surface interactions, and shear conditions significantly affect coagulation kinetics [16]. In subsequent work, DEM was further employed to investigate the evolution of aggregate size and structure, demonstrating that aggregate scale and structure are highly sensitive to particle adhesion and shear conditions [17]. Yu et al. investigated the flocculation of cohesive particles using a direct numerical simulation–discrete element method (DNS–DEM) framework and characterized particle aggregation and structural evolution using parameters such as mean floc size and fractal dimension, providing a methodological basis for particle-scale investigation of flocculation kinetics [18].
Accordingly, coal slurry water from the Eighth Mine Coal Preparation Plant in Pingdingshan was selected as the research object. Water-quality characteristics, mineral composition, and particle-size distribution were first characterized. Single-factor and combined flocculation sedimentation experiments with CaCl2, PAM and APAM were then conducted using settling rate and supernatant turbidity as macroscopic performance indicators. In parallel, a particle aggregation sensitivity model informed by the EDEM discrete-element framework was developed to examine the relative effects of measured particle-size composition, CaCl2-induced electrical-double-layer screening, and effective particle adhesion on aggregate growth. Because ζ-potential, Ca2+ surface adsorption, and collision-attachment efficiency were not independently measured, the numerical analysis was used to interpret aggregation trends rather than to directly identify molecular-scale complexation structures. The numerical trends were finally discussed together with the sedimentation experiments to clarify the enhanced aggregation behavior observed in the combined reagent systems.

2. Materials and Methods

2.1. Coal Slurry Water and Characterization Methods

Tailings coal slurry water was obtained from the Eighth Mine Coal Preparation Plant in Pingdingshan. Water quality was measured for pH, turbidity, hardness, conductivity, and selected dissolved metals. The coal slurry solids were filtered and dried for ash-content determination, X-ray diffraction, Fourier-transform infrared spectroscopy, scanning electron microscopy, and laser particle-size analysis. The detection instruments are listed in Table 1.

2.2. Flocculation–Sedimentation Experiments

The experiment consisted of two parts: single-factor experiments and multi-factor interaction experiments. A 7.5 g dried coal-slime sample was dispersed in water to a final volume of 500 mL (15 g/L) for each sedimentation test. A coagulant (anhydrous CaCl2 in this study) and a flocculant (nonionic polyacrylamide with a molecular weight of 10 million, denoted PAM; and anionic polyacrylamide with the same molecular weight, denoted APAM) were added at different concentrations. The capped cylinder was inverted five times after reagent addition to distribute the reagents. The sedimentation rate (Δh/Δt during the initial linear settling stage of the solid–liquid interface) was recorded and calculated as:
V0 = Δh/Δt19
where V0 is the initial settling rate (mm/min), Δh is the change in clarified-layer height (mm), and Δt is the corresponding time interval (min). After sedimentation, the supernatant was collected for turbidity measurement (NTU) [19].
CaCl2 was added before the polymer flocculant in the combined-reagent experiments. Electrolyte screening and polymer-assisted adhesion are considered possible contributors to particle aggregation. Because ζ potential, Ca2+ adsorption, and polymer adsorption were not measured, the specific microscopic pathways cannot be established from the settling tests alone.

2.2.1. Single-Factor Experimental Design

In the single-factor experiments, the dosages of CaCl2, nonionic PAM (MW 10 million), and anionic APAM (MW 10 million) were varied to determine the appropriate concentration ranges. The coal slurry concentration was uniformly set at 15 g/L, and the tests were conducted in 500 mL graduated cylinders with stoppers.
Ten CaCl2 concentrations were tested: 0.6, 0.8, 1.0, 1.2, 1.4, 1.6, 1.8, 2.0, 2.2, and 2.4 g/L. A 7.5 g sample was dispersed in water and made up to 500 mL in a graduated cylinder. After addition of the designated CaCl2 dose, the cylinder was inverted five times. The clarified-layer height was recorded during settling to calculate the initial settling rate using Equation (1). At 15 min, supernatant was sampled 2–3 cm below the surface for turbidity measurement. Results are reported in Section 3.2.1.
The prepared 1.5% coal slurry was poured into a 500 mL graduated cylinder, which was stoppered and inverted five times to fully homogenize the suspension. A stock solution of 1 g/L was prepared and diluted into working solutions to achieve final cylinder concentrations of 1–14 mg/L. The PAM solution was added at the designated concentrations (1, 2, 4, … 14 mg/L) using a micropipette. The cylinder was stoppered and inverted five times to thoroughly mix the flocculant with the slurry. The cylinder was then placed vertically on a level test bench, and sedimentation was allowed to proceed for 15 min. The supernatant was sampled from 2–3 cm below the liquid surface, and its turbidity was measured. Results are reported in Section 3.2.2.
The prepared 1.5% coal slurry was placed in a 500 mL graduated cylinder and homogenized as above. The APAM stock solution (1 g/L) was diluted to achieve final cylinder concentrations of 0.2, 0.4, 0.6, 1, 2, 4, and 6 mg/L. The mixing, settling, and measurement procedures were identical to those described in the preceding PAM procedure. Results are reported in Section 3.2.3.

2.2.2. Combined-Reagent Experimental Design

APAM and PAM at concentrations showing favorable individual performance were each combined with CaCl2 at three concentration levels exhibiting good individual performance, to identify the optimal combination of coagulant and flocculant.
A 7.5 g coal sample was weighed, placed in a beaker, and approximately 300 mL of water was added. The mixture was stirred thoroughly with a glass rod to fully disperse the coal slime. The suspension was transferred to a 500 mL graduated cylinder, the beaker was rinsed, and the volume was adjusted to 500 mL to obtain a 15 g/L coal slurry. The cylinder was inverted five times to ensure uniform suspension of the particles and prevent stratification. CaCl2 solution was added at the designated concentrations (1.2, 1.4, and 1.6 g/L) using a micropipette, and the mixture was thoroughly homogenized and allowed to react statically for 1 min. PAM solution was then added at the designated concentrations (1.0, 2.0, and 4.0 mg/L) using a micropipette. The cylinder was stoppered and inverted five times to ensure thorough mixing and to allow the polymer chains to fully adsorb and bridge, forming large flocs. The cylinder was placed vertically on a level test bench, and a stopwatch was started immediately to record the settling height of the flocs over time. The initial sedimentation rate (mm/min) was calculated. After 15 min of quiescent sedimentation, the supernatant was sampled from 2–3 cm below the liquid surface, and the turbidity was measured (NTU). Results are reported in Section 3.3.1.
The sample preparation followed the CaCl2 + PAM combined-reagent procedure described above. CaCl2 was added at 1.2, 1.4, or 1.6 g/L and allowed to react for 1 min; APAM was then added at 0.4, 0.6, or 0.8 mg/L. The mixing, settling, and measurement procedures were the same as those used for the CaCl2 + PAM combinations. Results are reported in Section 3.3.2.

2.3. Particle Aggregation Model and Sensitivity Analysis

To analyze the aggregation behavior of coal slurry particles under different reagent conditions, a particle aggregation model based on the EDEM discrete-element method was established. Coal slurry flocculation involves multiscale processes including particle surface charge, polymer adsorption, ionic interactions, and particle collisions. Because the ζ potential at different CaCl2 concentrations, Ca2+ surface adsorption, and particle collision-attachment efficiency were not independently measured in this study, these microscopic parameters were not assigned arbitrary fixed values, and the numerical model was not used to predict absolute ζ-potential values, charge-neutralization points, or critical charge-reversal concentrations.
The model was mainly used to analyze the relative effects of particle size composition, CaCl2-induced changes in electrical double-layer screening, and effective particle adhesion on particle aggregation behavior. Numerical results were used to interpret trends in aggregation under different conditions and were compared with macroscopic flocculation sedimentation experiments, rather than being treated as direct proof of specific molecular-scale interactions.

2.3.1. Particle-Size Representation

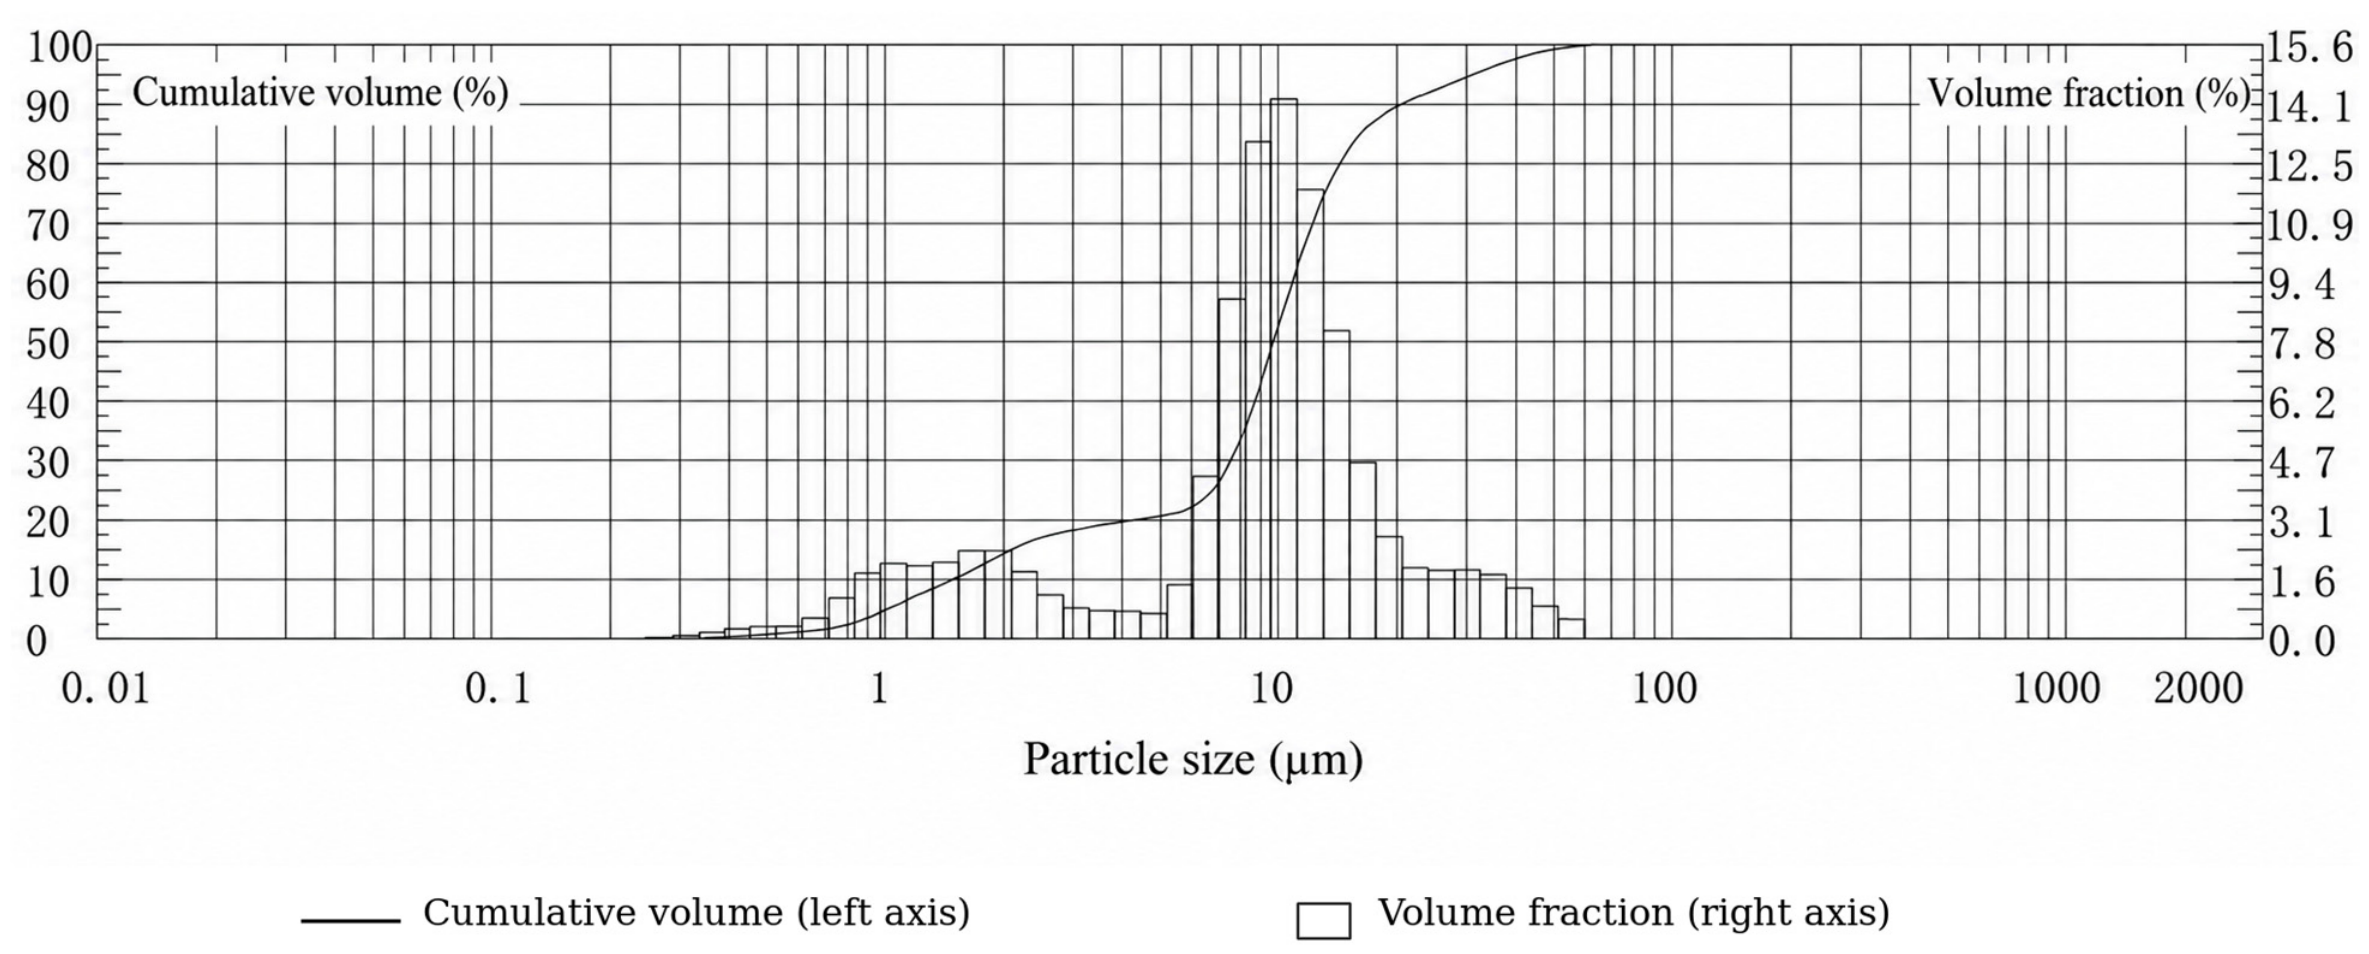
Laser particle size analysis showed that the coal slurry sample was generally fine and exhibited a bimodal particle size distribution. Most particles were concentrated around 10 μm, while a considerable fraction of ultrafine particles in the 1–5 μm range was also present. To improve consistency between the numerical model and the actual particle size composition, the measured laser particle size distribution was used as the basis for particle generation in EDEM, rather than adopting a simple uniform particle size range of 5–50 μm.
The continuous measured size distribution was first divided into several discrete size classes, and the volume-weighted mean diameter of each class was used as its representative particle size. The 1–5 μm ultrafine fraction was retained as an independent size class in the model to avoid neglecting its contribution to particle number, collision behavior, and floc formation.
Laser particle size analysis provides a volume-based distribution, whereas the EDEM model requires the particle number in each size class. Assuming identical particle density among size classes and recognizing that single-particle volume is proportional to the cube of particle diameter, the measured volume fraction of the ith size class was converted to the corresponding particle number as follows:
Ni = Ntotal · [(wi/di3)/Σj=1m(wj/dj3)]
where Ni is the number of simulated particles in the ith size class, Ntotal is the total number of simulated particles, wi is the measured volume fraction of the ith size class, di is its representative diameter, and m is the number of discrete size classes [20].
The measured volume fractions, representative diameters, and converted EDEM particle-number fractions are listed in Table 2.
The effect of total particle number was examined in simulations with 5000, 10,000, 15,000, and 20,000 particles. Mean floc size and aggregation-rate output at the end of each simulation were compared. The selection of 15,000 particles and the observed changes are reported in Section 3.4; a prespecified numerical-independence tolerance was not documented.

2.3.2. Ionic Strength and Electrostatic Screening

After addition to coal slurry water, CaCl2 dissociates into Ca2+ and Cl−, thereby increasing the ionic strength of the aqueous phase. The molar mass of CaCl2 is 110.98 g/mol. Therefore, the molar concentration of Ca2+ corresponding to the added CaCl2 is:
C(Ca2+) = C(CaCl2)/M(CaCl2)
where C(CaCl2) is the CaCl2 dosage in g/L and C(Ca2+) is the Ca2+ molar concentration in mol/L. For example, when the CaCl2 dosage is 1.2 g/L, C(Ca2+) = 1.2/110.98 ≈ 0.0108 mol/L, i.e., approximately 10.8 mmol/L [21].
The general expression for solution ionic strength is:
I = 1/2Σi cizi2
For the ionic-strength increment produced by the added CaCl2, because C(Cl−) = 2C(Ca2+), the following relation is obtained:
ΔI = 3C(Ca2+)
It should be emphasized that the actual coal slurry water contains Ca2+, Mg2+, and other dissolved ions in addition to the added CaCl2. Therefore, Equation (5) gives only the ionic-strength increment caused by the added CaCl2 rather than the absolute total ionic strength of the system. Because all ionic species in the coal slurry water were not completely quantified, the subsequent analysis uses ΔI to compare relative changes in electrostatic screening under different CaCl2 dosages [21].
According to electrical double-layer theory, the Debye parameter is related to the ionic strength of the solution as follows:
κ = [2e2NaIsi/(εε0kBT)]1/2
The corresponding Debye screening length is:
λD = κ−1
where e is the elementary charge, Na is Avogadro’s constant, ε is the relative dielectric constant, ε0 is the vacuum permittivity, kB is the Boltzmann constant, T is the absolute temperature, and Isi is the ionic strength in mol/m3. A concentration expressed in mol/L must be multiplied by 1000 before substitution into Equation (6). Because the background ionic strength was not fully measured, ΔI permits comparison of relative screening changes but does not establish an absolute Debye length for the slurry water.
As the CaCl2 dosage increases, the calculated ionic-strength increment increases. At a fixed but unmeasured background ionic strength, the corresponding screening length would decrease. Thus, the calculations are used to examine the direction of change in screening, rather than the absolute screening length of the coal slurry water.
Because ζ potential was not measured at different CaCl2 dosages, the absolute magnitude of interparticle electrostatic repulsion was not further calculated, and the model was not used to assign a ζ-potential zero point or charge-reversal concentration.

2.3.3. Normalized Electrostatic Screening Function

To describe the variation in electrostatic interaction range under different ionic-strength conditions while avoiding the introduction of uncalibrated surface-potential parameters, a normalized electrostatic screening function based on DLVO theory was adopted:
S(h,C) = exp[−κ(C)h]
where S is the normalized electrostatic screening factor, h is the particle surface-to-surface separation, and κ(C) is the Debye parameter at a given CaCl2 concentration.
Equation (8) describes the relative decay of electrostatic interaction with particle separation and ionic strength; it does not represent the absolute electrostatic force between particles [21]. Compared with the original model, this treatment does not require arbitrary specification of the initial ζ potential, a ζ-potential decay coefficient, a Ca2+ adsorption constant, or a critical surface coverage, thereby avoiding direct control of the simulation results by uncalibrated parameters.

2.3.4. Effective Adhesion Parameter

Whether coal slurry particles form stable flocs after collision depends not only on electrostatic interactions but also on polymer adsorption and bridging, particle surface properties, and local hydrodynamic conditions. Because the true collision-attachment efficiency of particles under different reagent systems was not measured directly, fixed adhesion probabilities were no longer assigned separately to the APAM-only, CaCl2 + PAM, and CaCl2 + APAM systems. Polymer bridging involves polymer distribution, adsorption onto particle surfaces, and subsequent floc growth; mixing affects both aggregate formation and breakage [22].
The probability that a particle collision results in a stable aggregate was defined as the effective particle adhesion parameter, Pagg:
0 ≤ Pagg ≤ 1
Pagg was used only to represent the response of particle aggregation as the effective adhesion condition changed from weak to strong and was not interpreted as a directly measured physical parameter of any specific reagent system [16,17,23].
Multiple effective adhesion levels were considered in the numerical analysis, for example Pagg = 0.2, 0.4, 0.6, and 0.8. These values cover conditions from relatively weak to relatively strong effective adhesion. Changes in mean floc size, aggregation rate, and fractal dimension were compared among the different parameter levels. This parameter sweep was used to evaluate the sensitivity of the numerical results to effective adhesion rather than to infer a unique “true” adhesion probability from the sedimentation tests.
Accordingly, the actual performance differences among the three reagent systems were determined primarily from the sedimentation experiments, whereas the numerical simulations were used to illustrate how changes in electrostatic screening and effective adhesion influence particle aggregation behavior.

2.3.5. Model Parameters and Evaluation Indicators

To improve the traceability of model parameters, the main inputs were classified according to experimental measurement, theoretical calculation, and sensitivity analysis, as summarized in Table 3. Particle density was not independently measured in the current model. Because the sample had a high ash content and complex mineral composition, 1400 kg/m3 was not treated as a definitive measured value; instead, particle density was regarded as a model-assumption parameter whose effect should be examined through sensitivity analysis.
In particular, ζ potential, Ca2+ surface coverage, and the critical charge-reversal parameter were no longer used as quantitative model inputs.

2.3.6. Evaluation Indicators for Particle Aggregation

The structural characteristics of the flocs formed by particle aggregation were described using the fractal dimension, Df. According to the mass-size relation:
N = kf(Rg/a)ᴰᶠ
where N is the number of primary particles constituting a floc, Rg is the radius of gyration of the floc, a is the characteristic radius of the primary particles, kf is the structural factor, and Df is the floc fractal dimension [17,18]. Floc size, shape, structure, and strength provide complementary descriptors, and the interpretation of structural measurements depends on the characterization method [24].
The particle aggregation rate was defined as the change in the number of stable flocs formed per unit time:
kagg = ΔNf/Δt
where Nf is the number of stable flocs formed and t is the simulation time. The mean floc size was also calculated, and the combined variation in mean floc size, Df, and kagg was used to evaluate the degree of particle aggregation under different parameter conditions [16,18,23].

2.3.7. Simulation Conditions and Particle-Number Independence Test

To prevent a single uncalibrated parameter value from determining the simulation conclusions, fixed-adhesion-probability systems corresponding directly to “APAM only”, “CaCl2 + PAM”, and “CaCl2 + APAM” were not established. Instead, parameter sensitivity analysis was used to investigate particle aggregation behavior.
The numerical conditions included two main aspects. First, different electrolyte conditions were set according to the CaCl2 concentrations used in the flocculation sedimentation experiments, and the corresponding ionic-strength increments were calculated using Equation (5) to represent changes in electrical double-layer screening. Second, different effective particle adhesion parameters were specified under each screening condition to cover a range from weak to strong adhesion. All simulations used the same particle size composition, particle density, liquid-phase properties, simulation domain, and statistical time to ensure comparability among cases.
Particle aggregation was mainly analyzed over 0–60 s, and the particle aggregation state, mean floc size, fractal dimension, and aggregation rate were recorded at different times.
To exclude a significant influence of the total number of simulated particles on the results, independence tests were conducted using 5000, 10,000, 15,000, and 20,000 particles. With the other model parameters held constant, the mean floc size and aggregation rate at the end of the simulation were used as evaluation indicators.

3. Results and Discussion

3.1. Characteristics of the Coal Slurry Water

The tailings coal slurry water from the Eighth Mine Coal Preparation Plant in Pingdingshan had a measured pH of 7.76 and a turbidity of 2599 NTU (Table 4). The measured concentrations of selected dissolved metals are reported in Table 5. The high initial turbidity provides the basis for evaluating reagent-assisted particle settling and supernatant clarification.
The coal slurry water was filtered and dried to obtain a coal powder sample. The ash content of the coal powder was determined to be 73.7% on average.
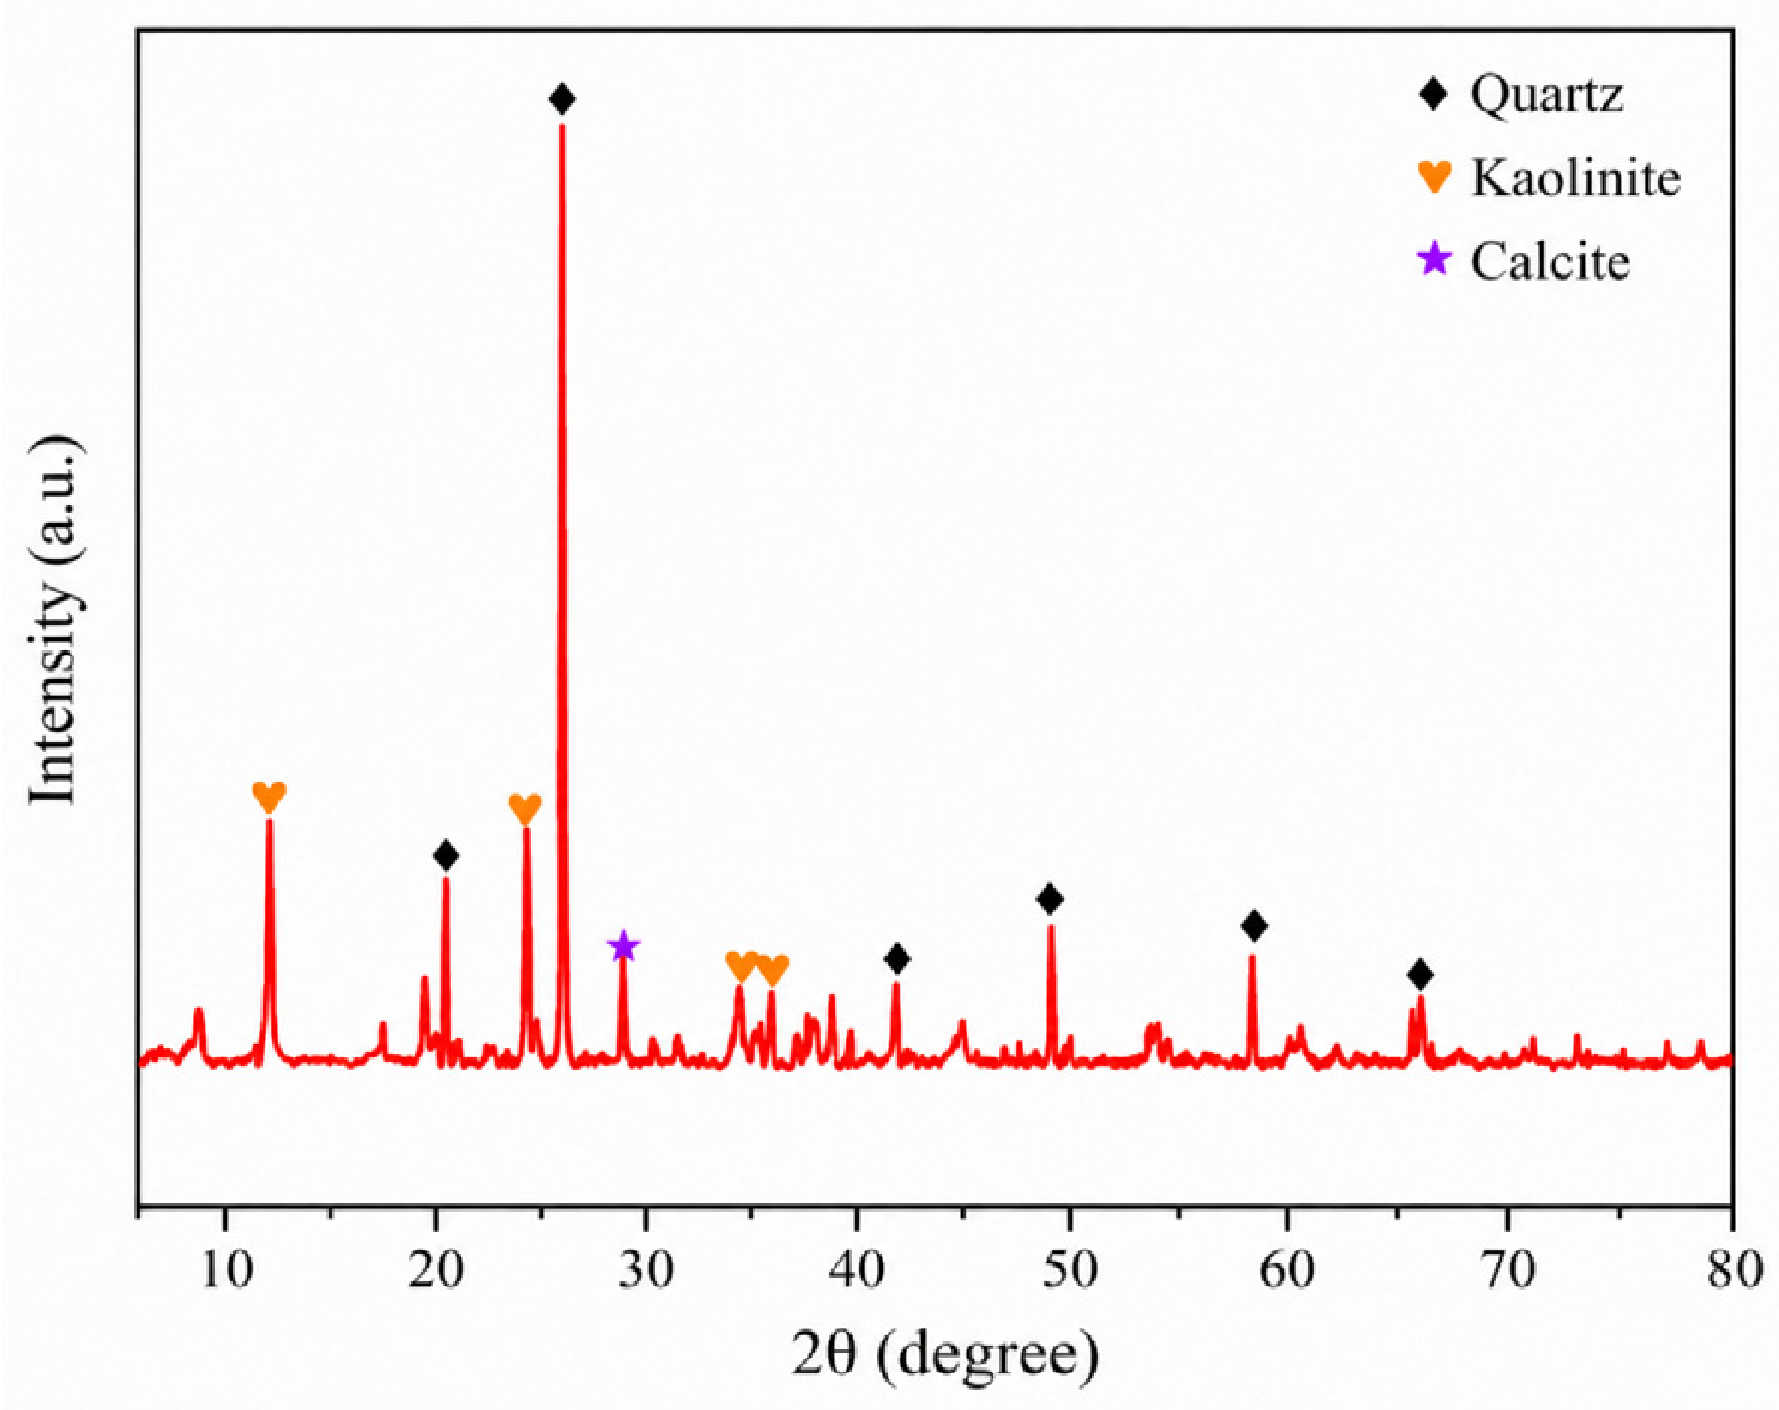
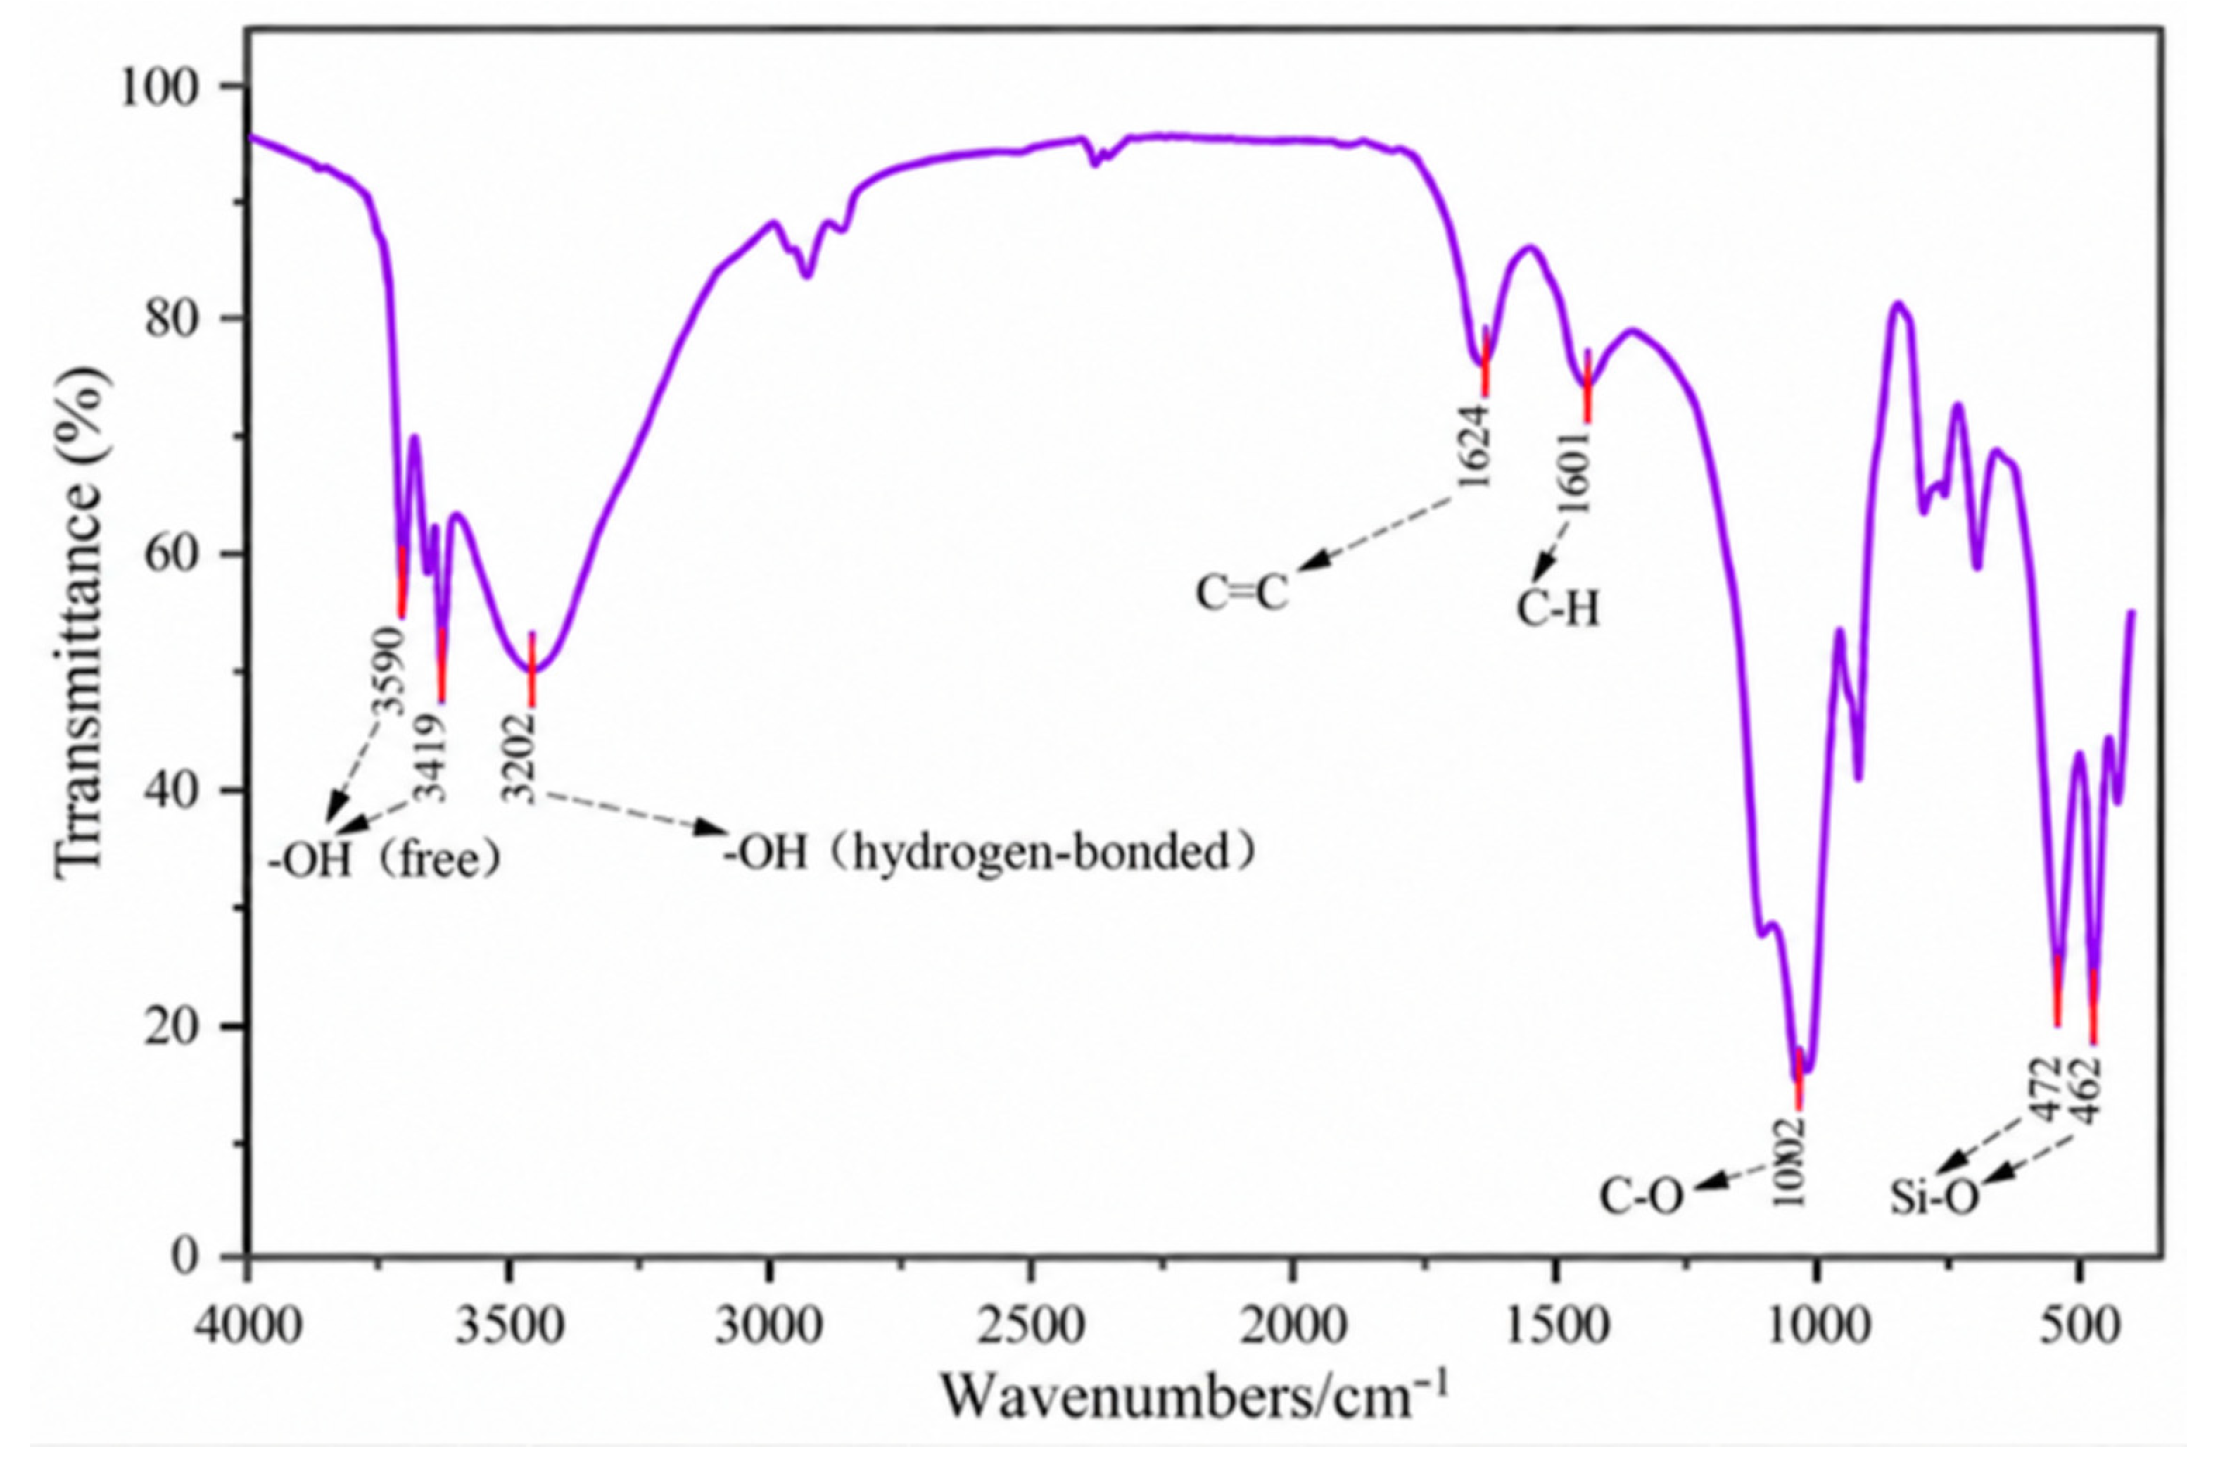
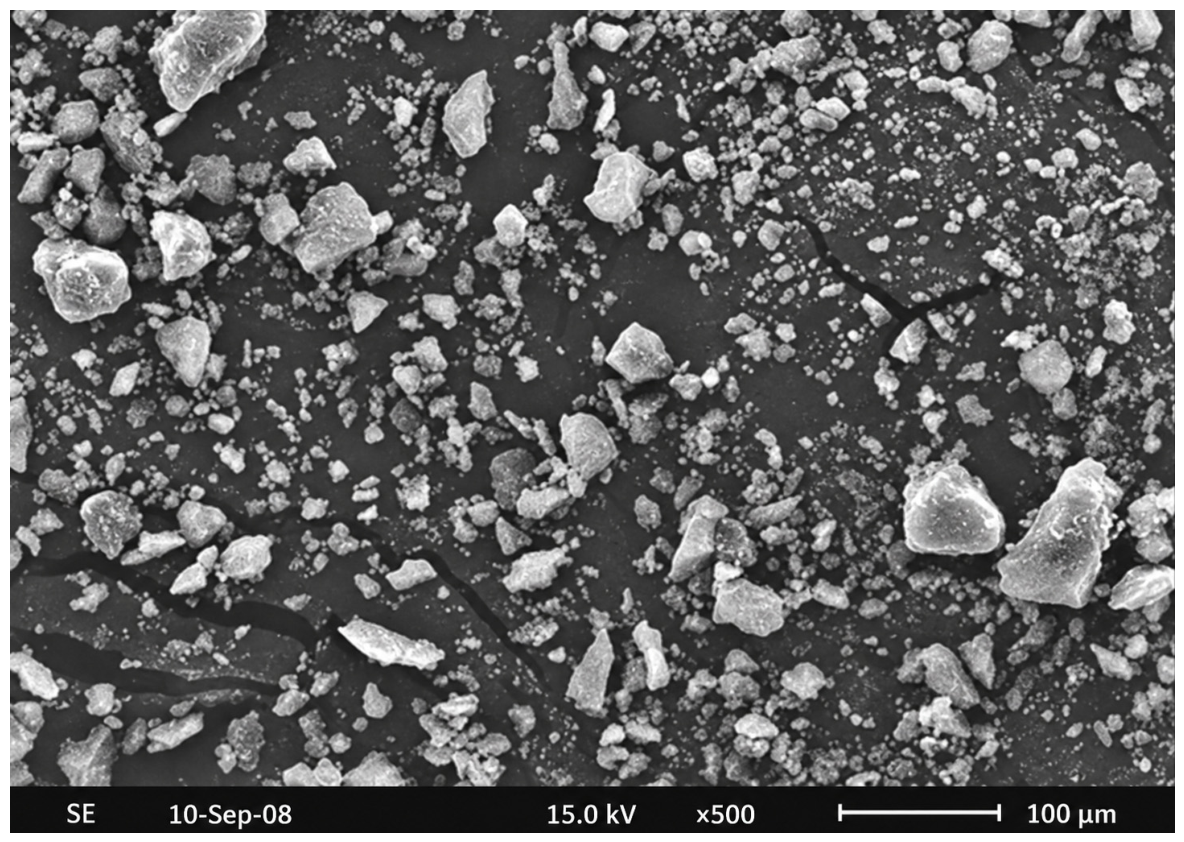
The coal powder sample was subjected to X-ray diffraction (XRD) (Bruker AXS GmbH, Karlsruhe, Germany), Fourier-transform infrared (FTIR) spectroscopy (Thermo Fisher Scientific, Madison, WI, USA), scanning electron microscopy (SEM) (JEOL Ltd., Tokyo, Japan), and laser particle size analysis. Figure 1 shows that the coal powder contains minerals such as quartz, kaolinite, and calcite. Figure 2 reveals the presence of common coal functional groups, including C–H and C–O. Figure 3 presents the morphology of the dried coal-slurry solids. Irregular fine particles and agglomerated particle clusters can be observed. The SEM image is used primarily for morphological observation, whereas quantitative particle-size information is obtained from laser particle-size analysis.
Figure 4 presents the volume-based particle-size distribution and cumulative volume distribution of the coal slurry sample. The principal peak occurs around 10 μm, with a finer-particle fraction also present.

3.2. Single-Reagent Flocculation–Sedimentation Results

3.2.1. Effect of CaCl2 Dosage

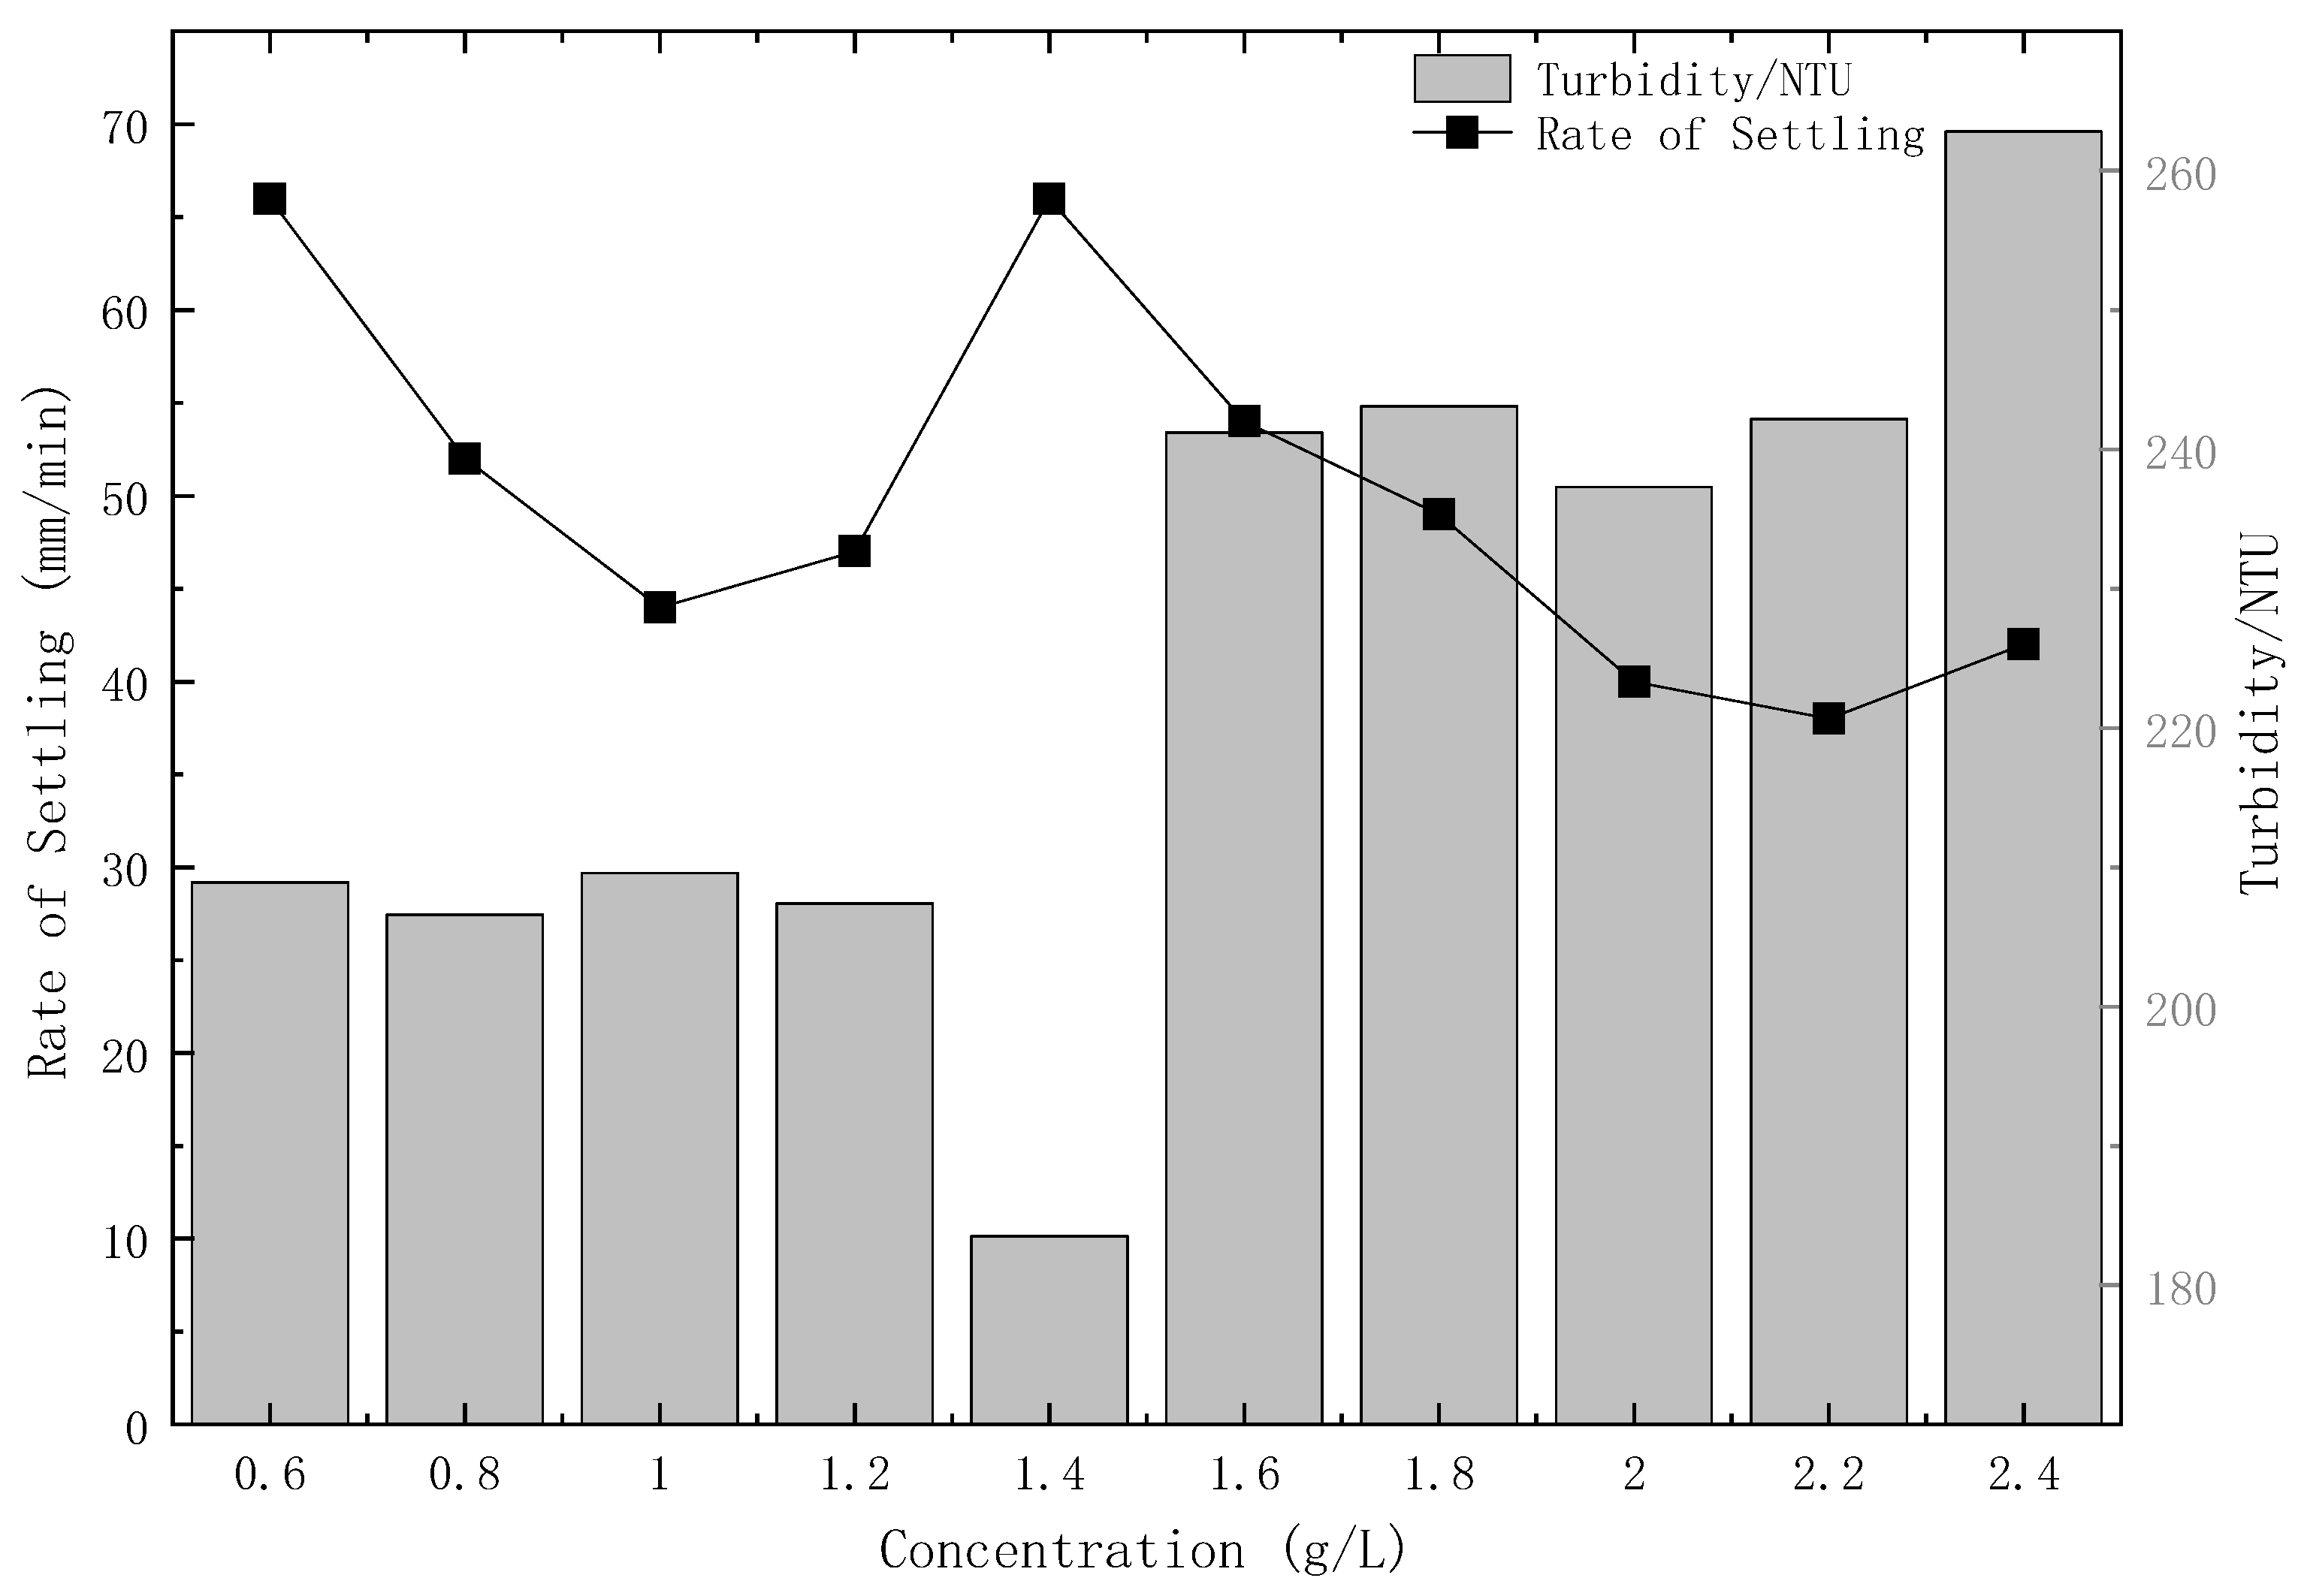
At a CaCl2 dosage of 1.4 g/L, the lowest measured supernatant turbidity was 183.5 NTU (Table 6; Figure 5). The initial settling rate at this dose was 66 mm/min, equal to the value measured at 0.6 g/L. Turbidity increased to 241.2 NTU at 1.6 g/L and 262.8 NTU at 2.4 g/L, although the values between these doses were not strictly monotonic. These results identify 1.4 g/L as the lowest-turbidity condition among the doses tested. The cause of the turbidity rebound cannot be identified from these measurements alone because ζ potential and Ca2+ surface adsorption were not measured. Doses of 1.2–1.6 g/L were selected for the combined-reagent experiments.

3.2.2. Effect of Nonionic PAM Dosage

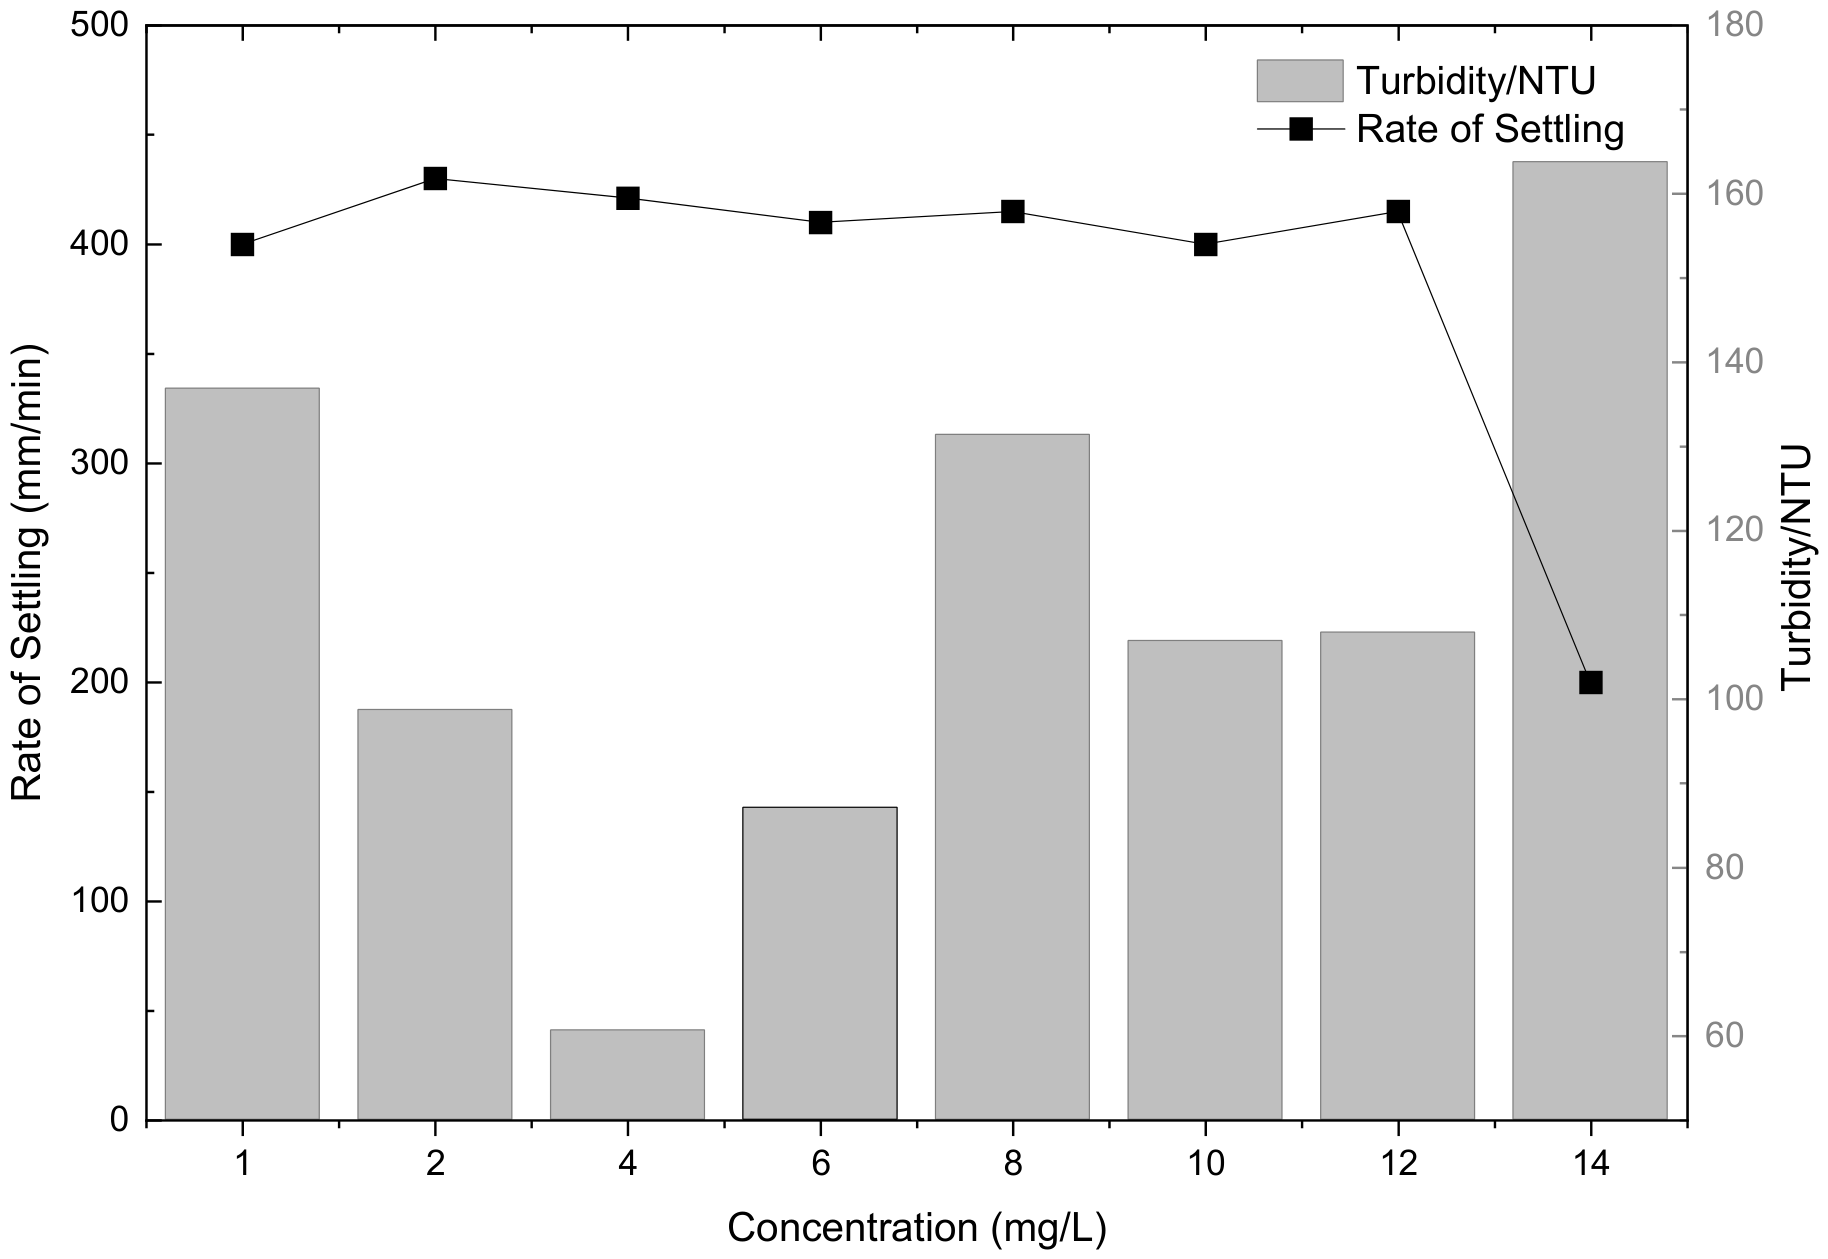
For nonionic PAM, supernatant turbidity decreased from 136.9 NTU at 1 mg/L to its measured minimum of 60.6 NTU at 4 mg/L (Table 7; Figure 6). The fastest initial settling rate in this series was 430 mm/min at 2 mg/L, compared with 421 mm/min at 4 mg/L. At higher doses, turbidity varied rather than increasing monotonically: it was 87.1 NTU at 6 mg/L, 131.4 NTU at 8 mg/L, and 163.8 NTU at 14 mg/L. Thus, 4 mg/L gave the clearest supernatant among the tested doses; possible effects of excess polymer on aggregation require direct adsorption or floc-structure measurements. Polymer adsorption and mixing kinetics provide a useful framework for interpreting dosage-dependent flocculation, but they do not establish the cause of the higher-dose response in the present sample [22].

3.2.3. Effect of Anionic APAM Dosage

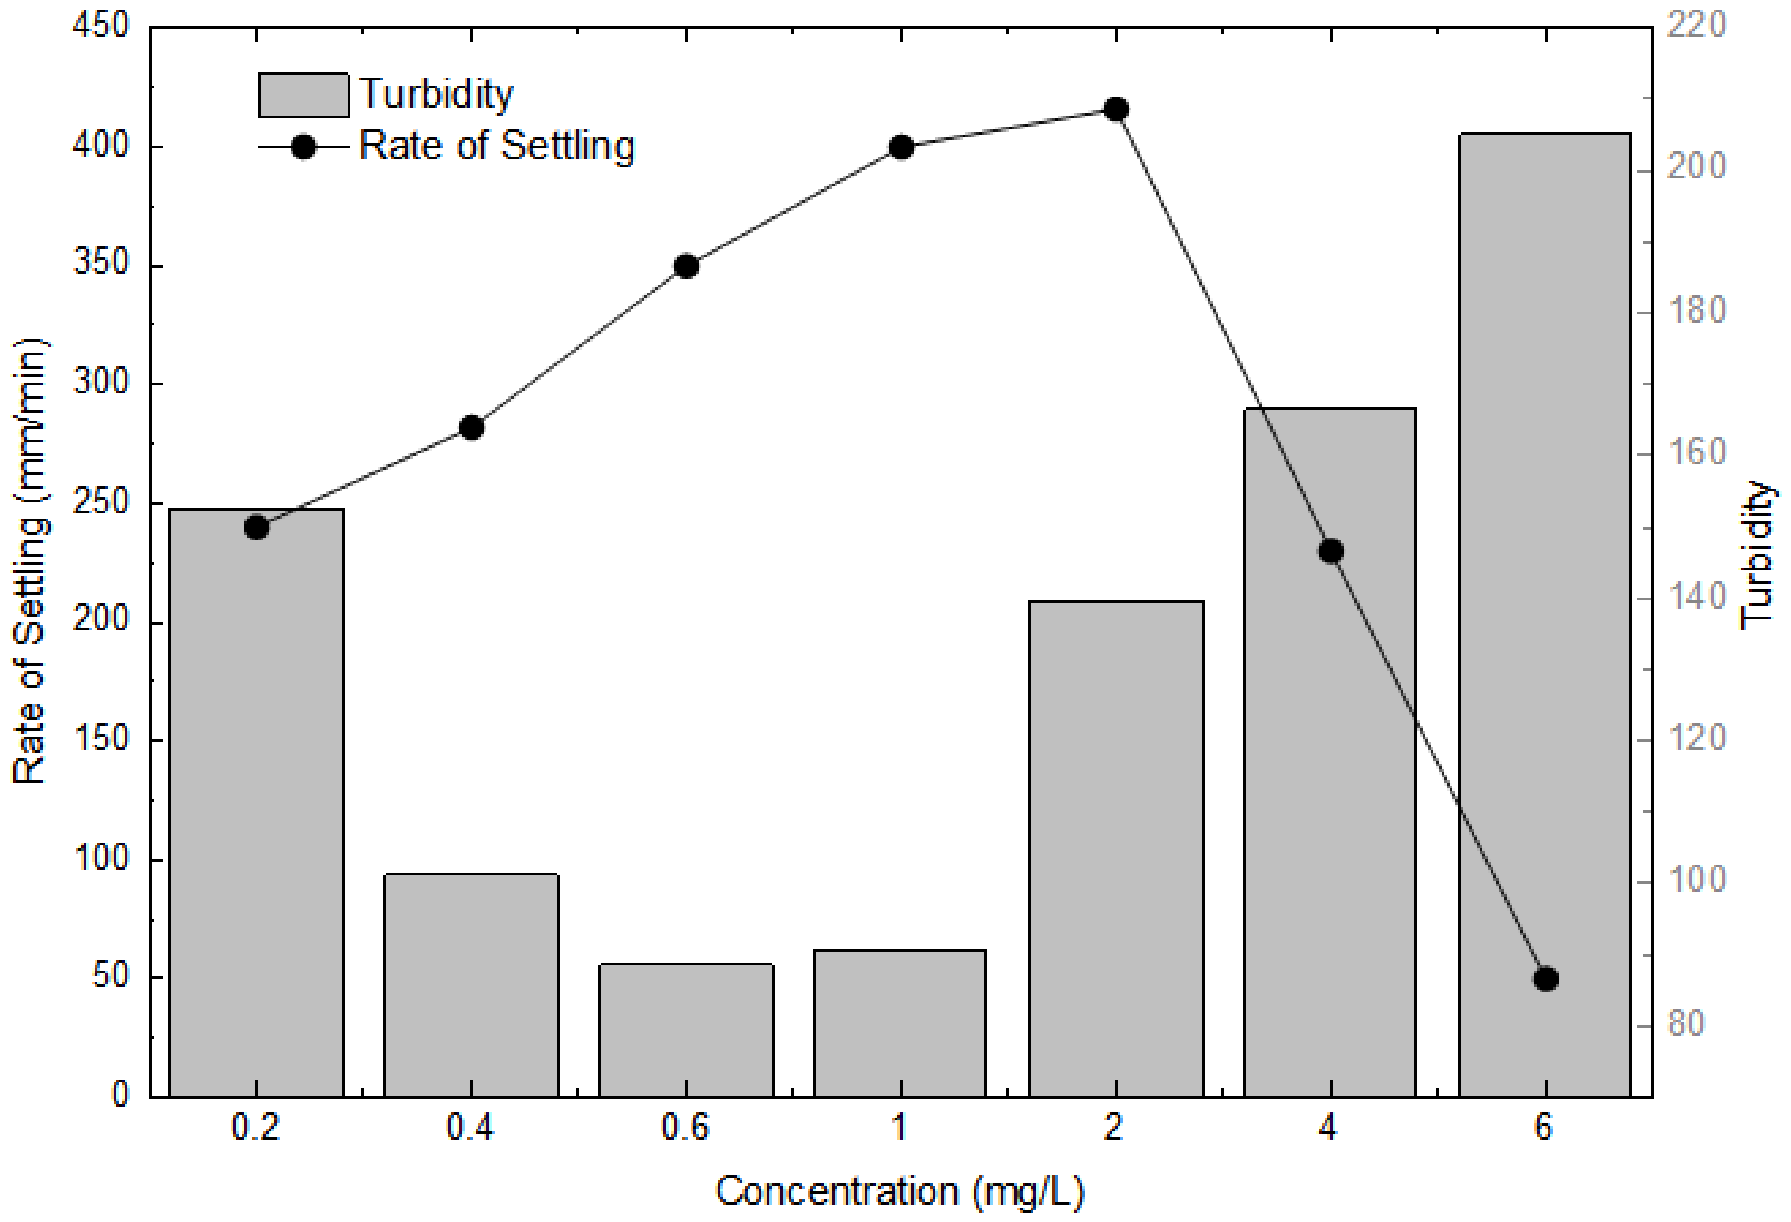
For APAM, the lowest measured turbidity was 88.7 NTU at 0.6 mg/L, while the highest initial settling rate was 416 mm/min at 2 mg/L (Table 8; Figure 7). Turbidity was 90.7 NTU at 1 mg/L and rose to 205.1 NTU at 6 mg/L. The 0.6–1.0 mg/L range therefore gave relatively clear supernatant among the tested doses. Adsorption, changes in particle charge, and floc breakup were not measured directly, so their individual contributions to the higher-dose response remain uncertain.

3.3. Combined-Reagent Flocculation–Sedimentation Results

3.3.1. CaCl2 and PAM

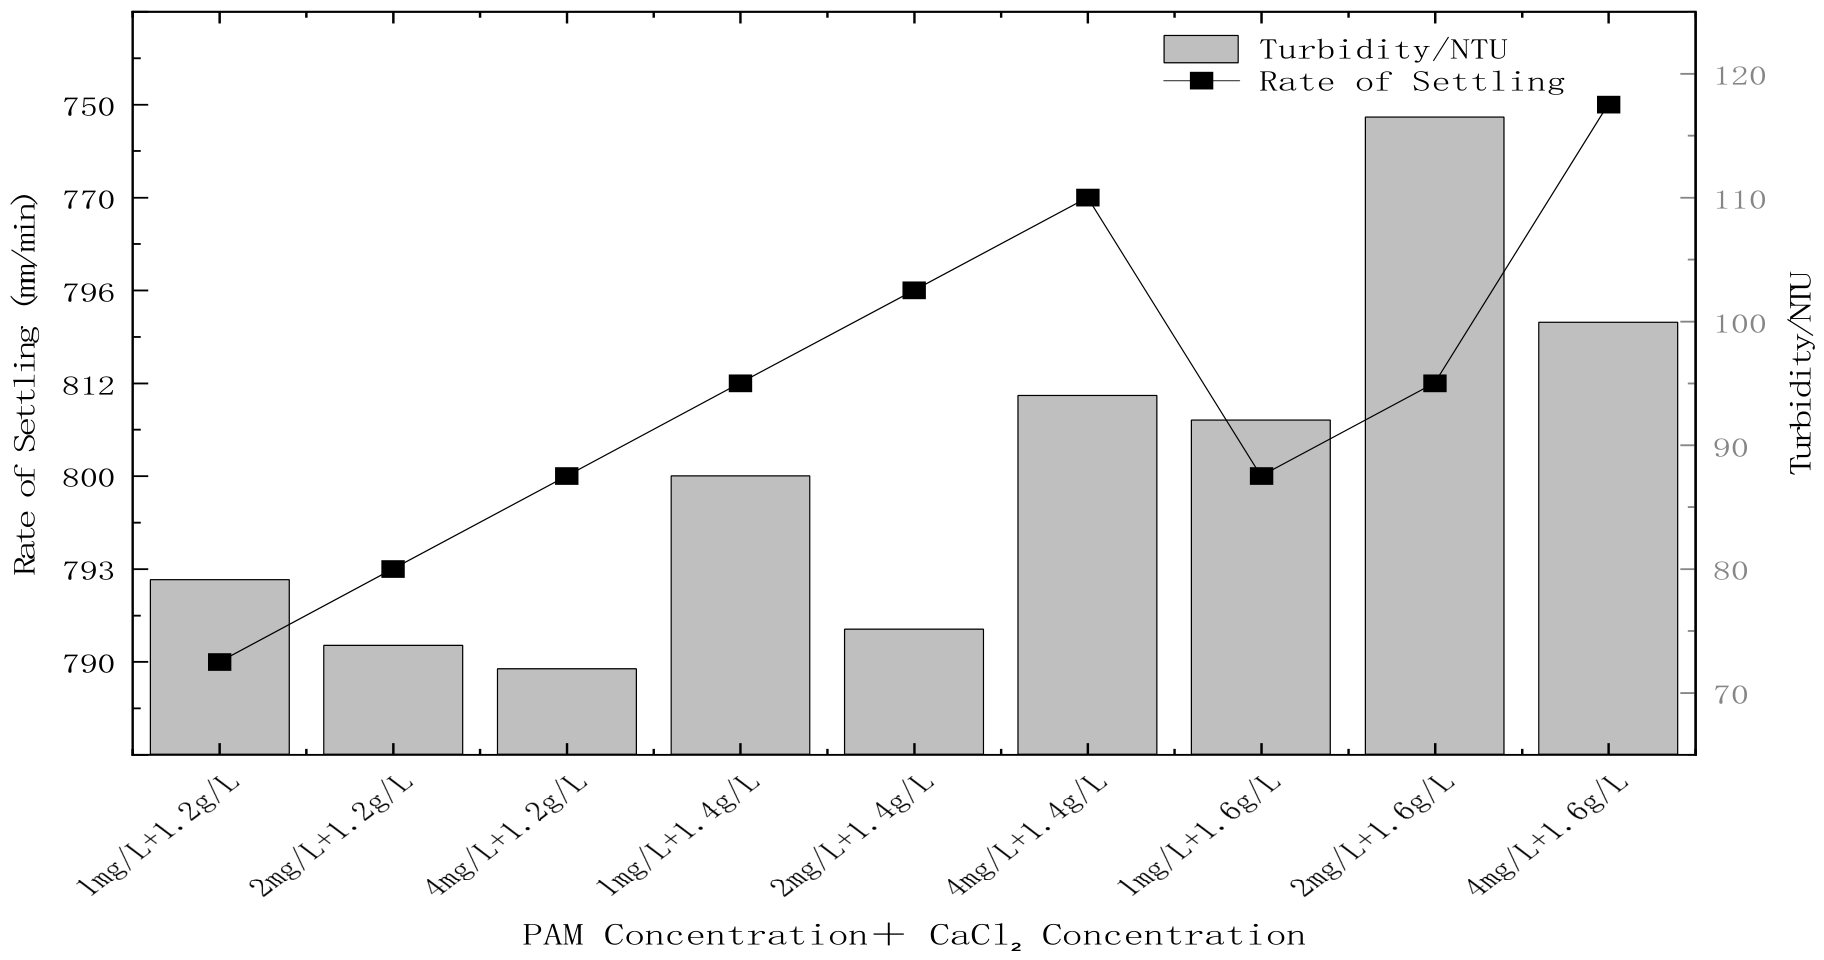
For CaCl2 + PAM, the lowest measured turbidity was 71.9 NTU at 1.2 g/L CaCl2 + 4 mg/L PAM, with an initial settling rate of 800 mm/min (Table 9; Figure 8). The highest recorded rate, 812 mm/min, occurred in two conditions: 1.4 g/L CaCl2 + 1 mg/L PAM and 1.6 g/L CaCl2 + 2 mg/L PAM. At 1.2 g/L CaCl2, turbidity decreased from 79.1 to 71.9 NTU as PAM increased from 1 to 4 mg/L. At 1.4 and 1.6 g/L CaCl2, the dose responses were not monotonic. These data separate the condition giving the clearest supernatant from those giving the fastest initial settling.

3.3.2. CaCl2 and APAM

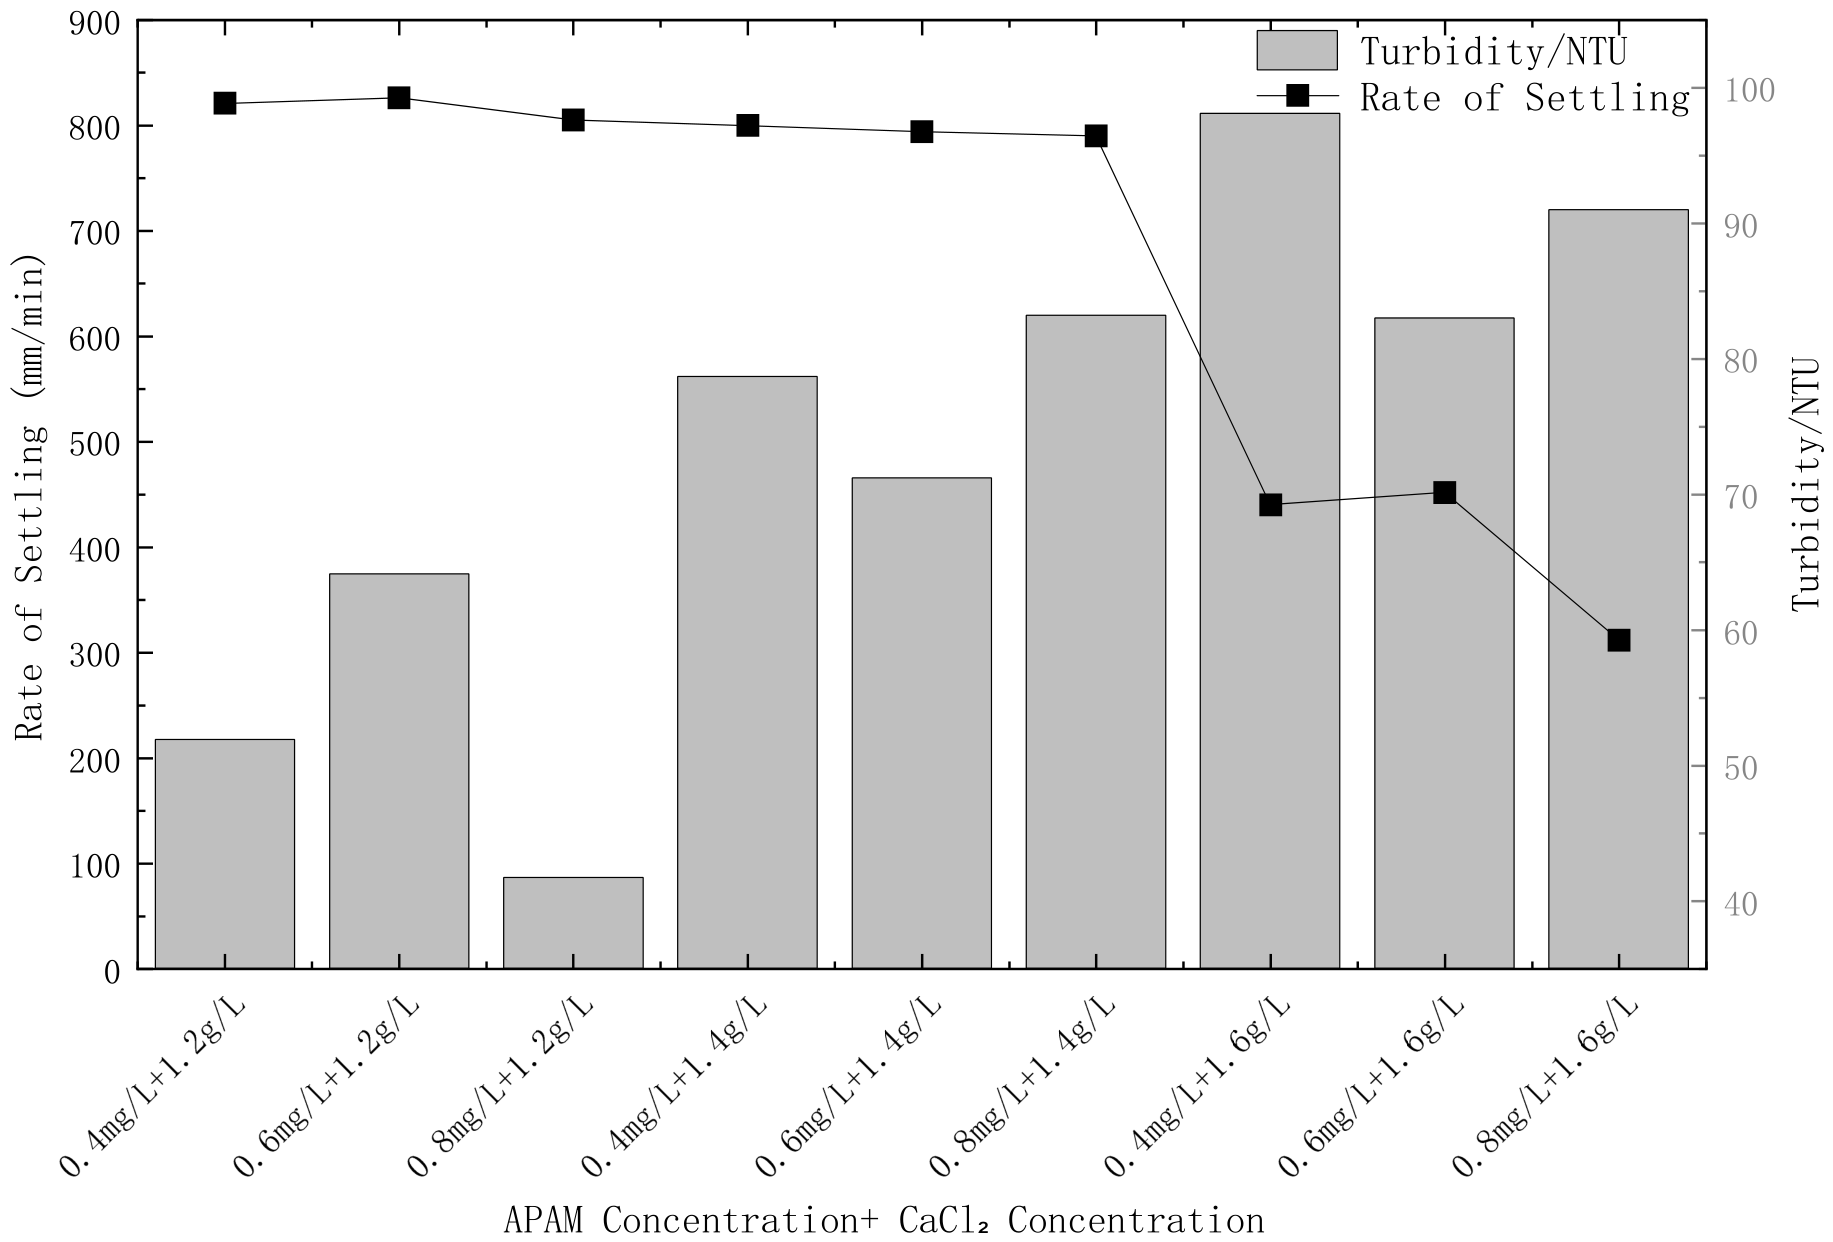
For CaCl2 + APAM, 1.2 g/L CaCl2 + 0.8 mg/L APAM yielded the lowest measured turbidity of 41.7 NTU and an initial settling rate of 805 mm/min (Table 10; Figure 9). The fastest settling rate in this series was 826 mm/min at 1.2 g/L CaCl2 + 0.6 mg/L APAM, for which turbidity was 64.1 NTU. At 1.6 g/L CaCl2, the measured rates ranged from 312 to 452 mm/min and turbidities from 83.0 to 98.1 NTU. The combination giving the clearest supernatant therefore differed from the one giving the fastest initial settling. A specific charge-neutralization or adsorption mechanism cannot be confirmed without additional measurements.

3.4. Particle-Number Independence Results

Increasing the simulated particle number from 15,000 to 20,000 changed the mean floc size by 0.072% and the aggregation-rate output by 5%. On the basis of this comparison and computational cost, 15,000 particles were selected for subsequent sensitivity analyses. An explicit independence tolerance and results for all four tested particle numbers should be reported from the simulation record before a stronger claim of numerical independence is made.

3.5. Effect of Effective Adhesion on Particle Aggregation

With the particle size composition and electrostatic screening condition kept constant, the effective particle adhesion parameter was varied to investigate the effect of post-collision adhesion on floc formation.
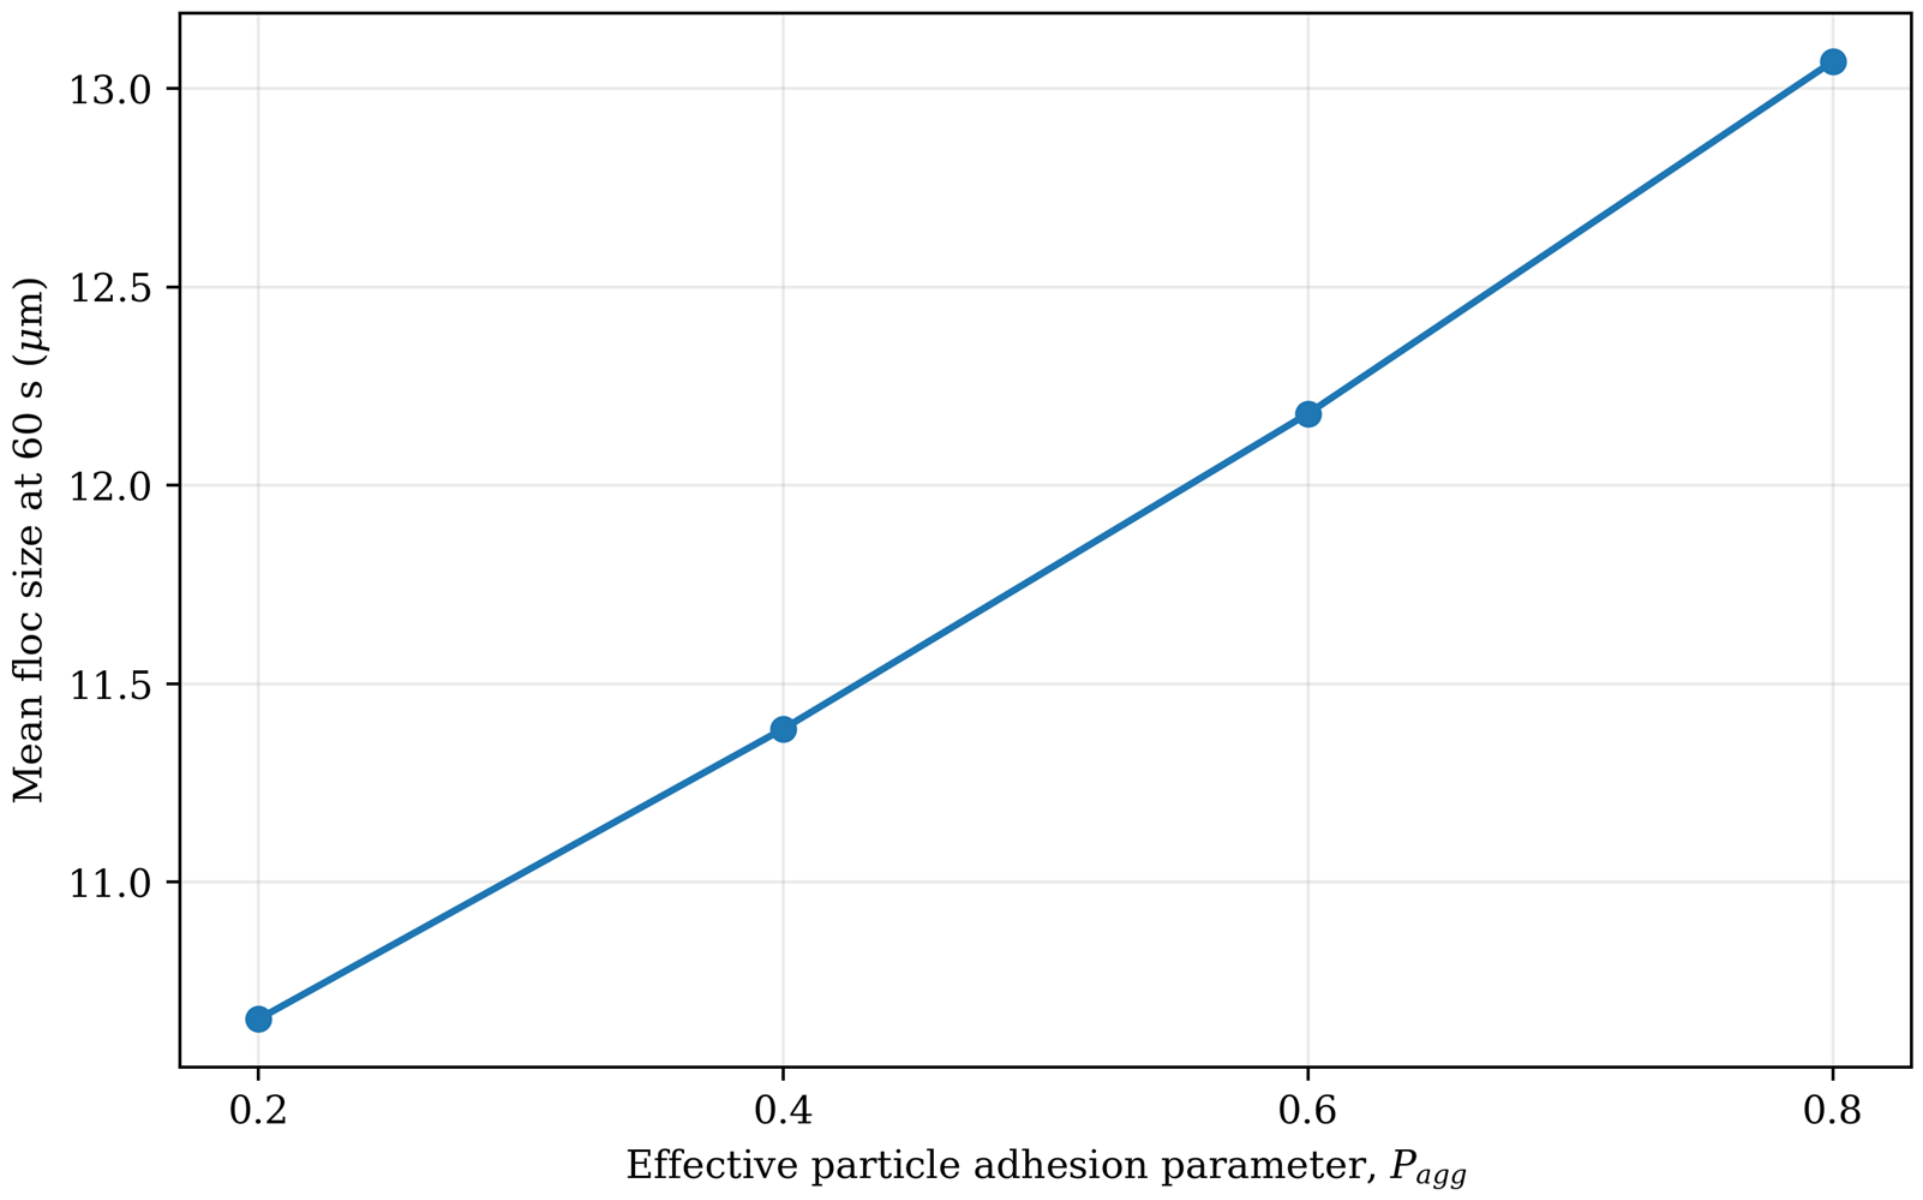
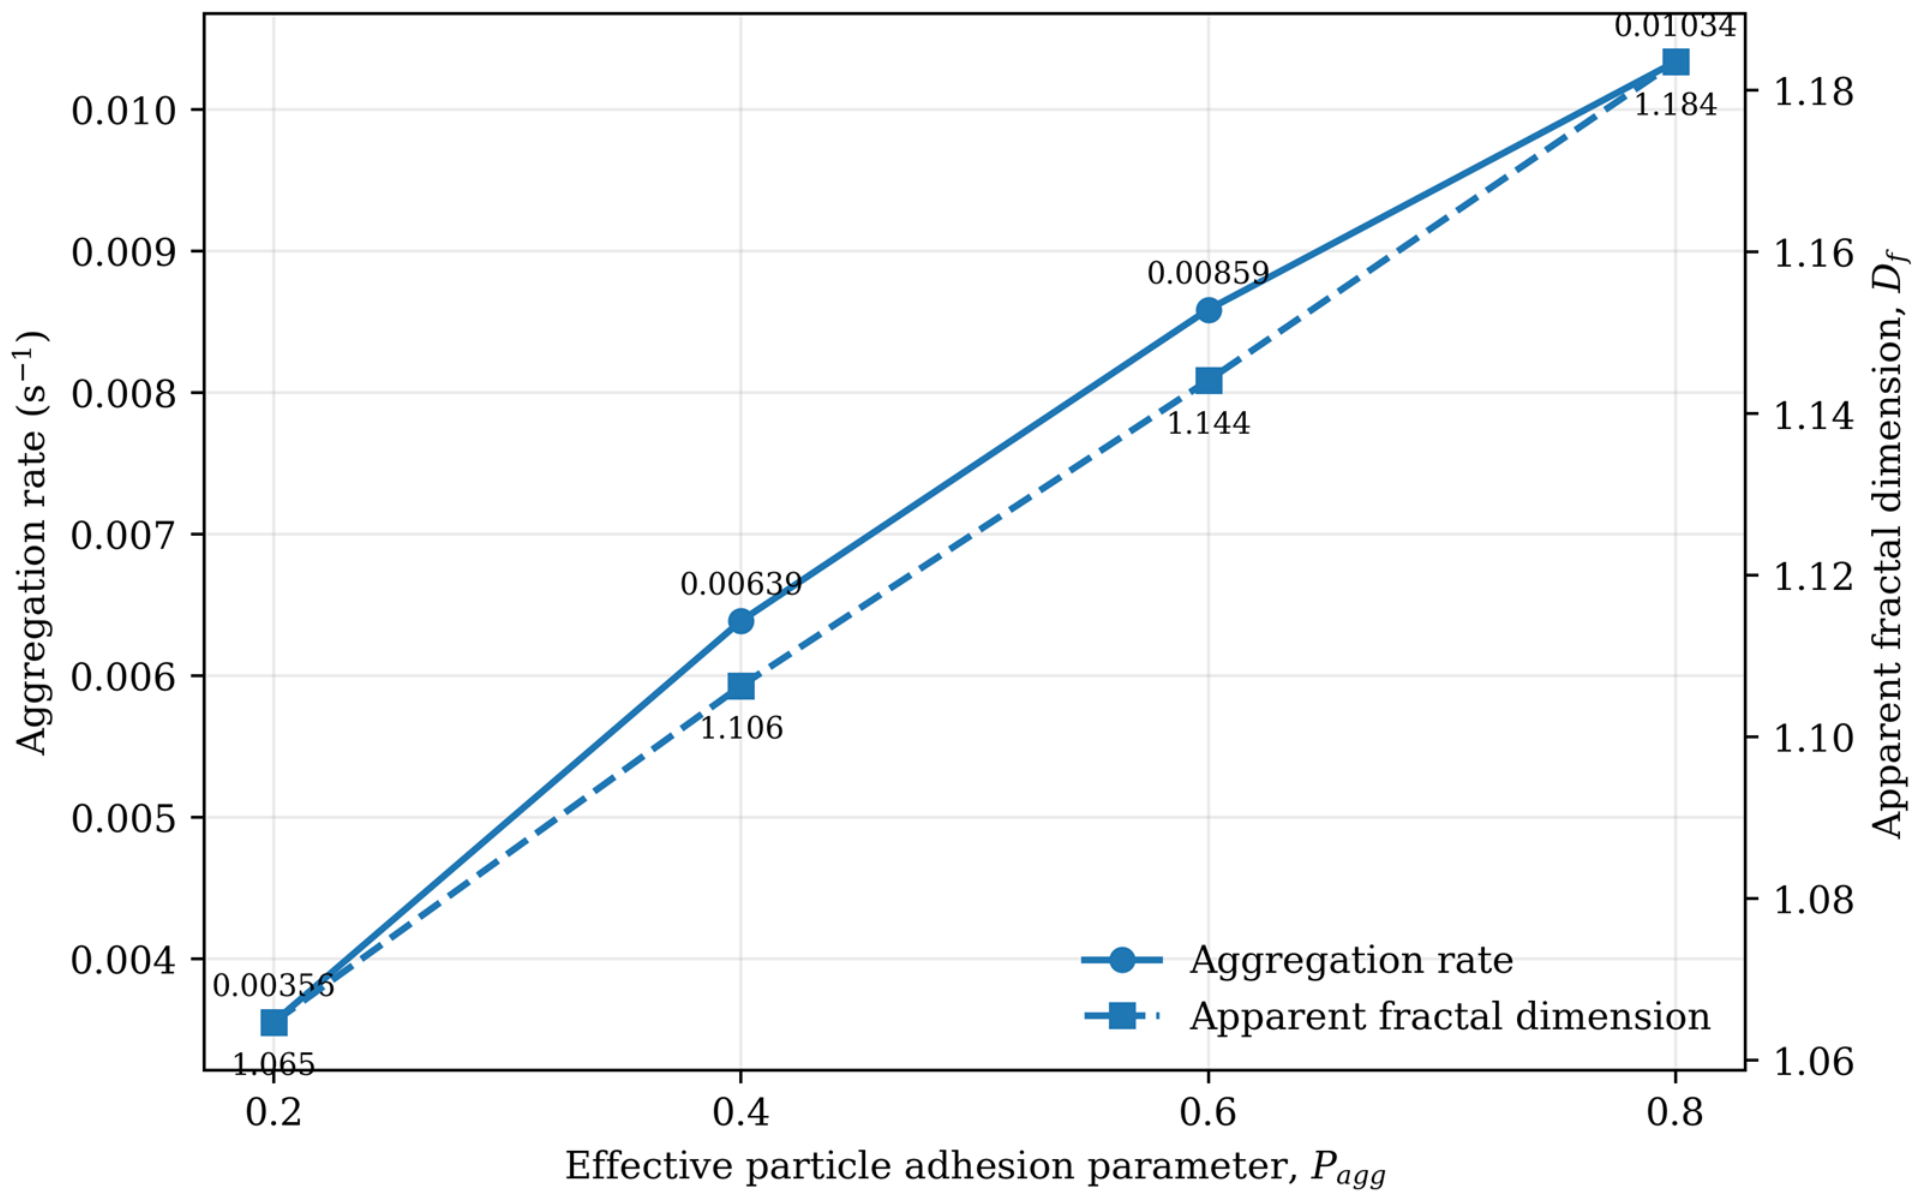
Within the parameter range examined, increasing Pagg increased the proportion of effective collisions that produced stable aggregates and consequently accelerated floc growth. At 60 s, the mean floc size increased from 10.655 μm to 13.065 μm, the aggregation rate increased from 0.00356 s−1 to 0.01034 s−1, and the fractal dimension increased from 1.065 to 1.184.
These results indicate that effective adhesion is an important factor affecting the extent of particle aggregation. They also demonstrate that, in the absence of experimental calibration, assigning a unique adhesion probability directly to different reagent systems may substantially influence the predicted results. Therefore, Pagg was used only for parameter sensitivity analysis and was not associated with a specific real reagent system.
As shown in Figure 10, with the particle size composition and electrostatic screening condition held constant, the mean floc size increased continuously with increasing effective particle adhesion parameter. When Pagg increased from 0.2 to 0.8, the mean floc size at 60 s increased from 10.655 μm to 13.065 μm, corresponding to an increase of approximately 22.6%. This shows that enhanced effective adhesion after particle collision promotes the formation and growth of stable aggregates. It also confirms that the selected Pagg value has a noticeable influence on the numerical output; therefore, the parameter is used only for sensitivity analysis and is not directly assigned to a specific reagent system.
Figure 11 shows that, when the particle size distribution, electrostatic screening condition, and other simulation parameters were kept constant, the effective particle adhesion parameter had a marked influence on aggregation kinetics. As Pagg increased from 0.2 to 0.8, the aggregation rate at 60 s increased from 0.00356 s−1 to 0.01034 s−1, an overall increase of approximately 190.4%. Thus, stronger effective adhesion after collision allows a larger fraction of particle collisions to develop into stable aggregates and substantially increases the aggregate formation rate.
At the same time, the apparent fractal dimension increased from 1.065 to 1.184, corresponding to an increase of approximately 11.2%, and showed a continuous upward trend. Under the simplified particle aggregation model used here, stronger effective adhesion not only increased the aggregation rate but also led to simulated aggregates with a more compact apparent structure. The aggregation rate was more sensitive to Pagg than the apparent fractal dimension, indicating that the effective adhesion parameter first influences the efficiency of post-collision attachment and subsequently affects aggregate structural evolution.
The results also confirm that the numerical output is sensitive to the selected Pagg value. Therefore, in the absence of independent experimental calibration, a fixed Pagg value should not be directly assigned to APAM-only, CaCl2 + PAM, or CaCl2 + APAM reagent systems. In this study, Pagg was used as a sensitivity-analysis variable to examine the influence of effective adhesion on aggregation trends rather than as the unique true adhesion probability of a real system.

3.6. Effect of CaCl2 Dosage on Electrostatic Screening and Aggregation

As the CaCl2 dosage increased, its contribution to the ionic strength of the system increased and the Debye screening length decreased, indicating a shorter effective range of electrostatic interactions at the particle surface. With the other parameters held constant, electrostatic screening conditions corresponding to different CaCl2 dosages were compared.
The simulations showed that, over the CaCl2 dosage range of 0.6–2.4 g/L, stronger electrostatic screening promoted close-range particle contact and aggregate formation. The mean floc size increased from 11.576 μm to 13.534 μm and the aggregation rate increased from 0.00698 s−1 to 0.01106 s−1, showing an overall monotonic increase. It should be emphasized that ζ potential was not measured at different CaCl2 concentrations. Therefore, this simulation only illustrates the influence of increased ionic strength and shortened electrical double-layer screening length on particle aggregation; it is not used to determine whether complete charge neutralization occurs at any specific CaCl2 dosage or to demonstrate surface charge reversal at high CaCl2 concentration.
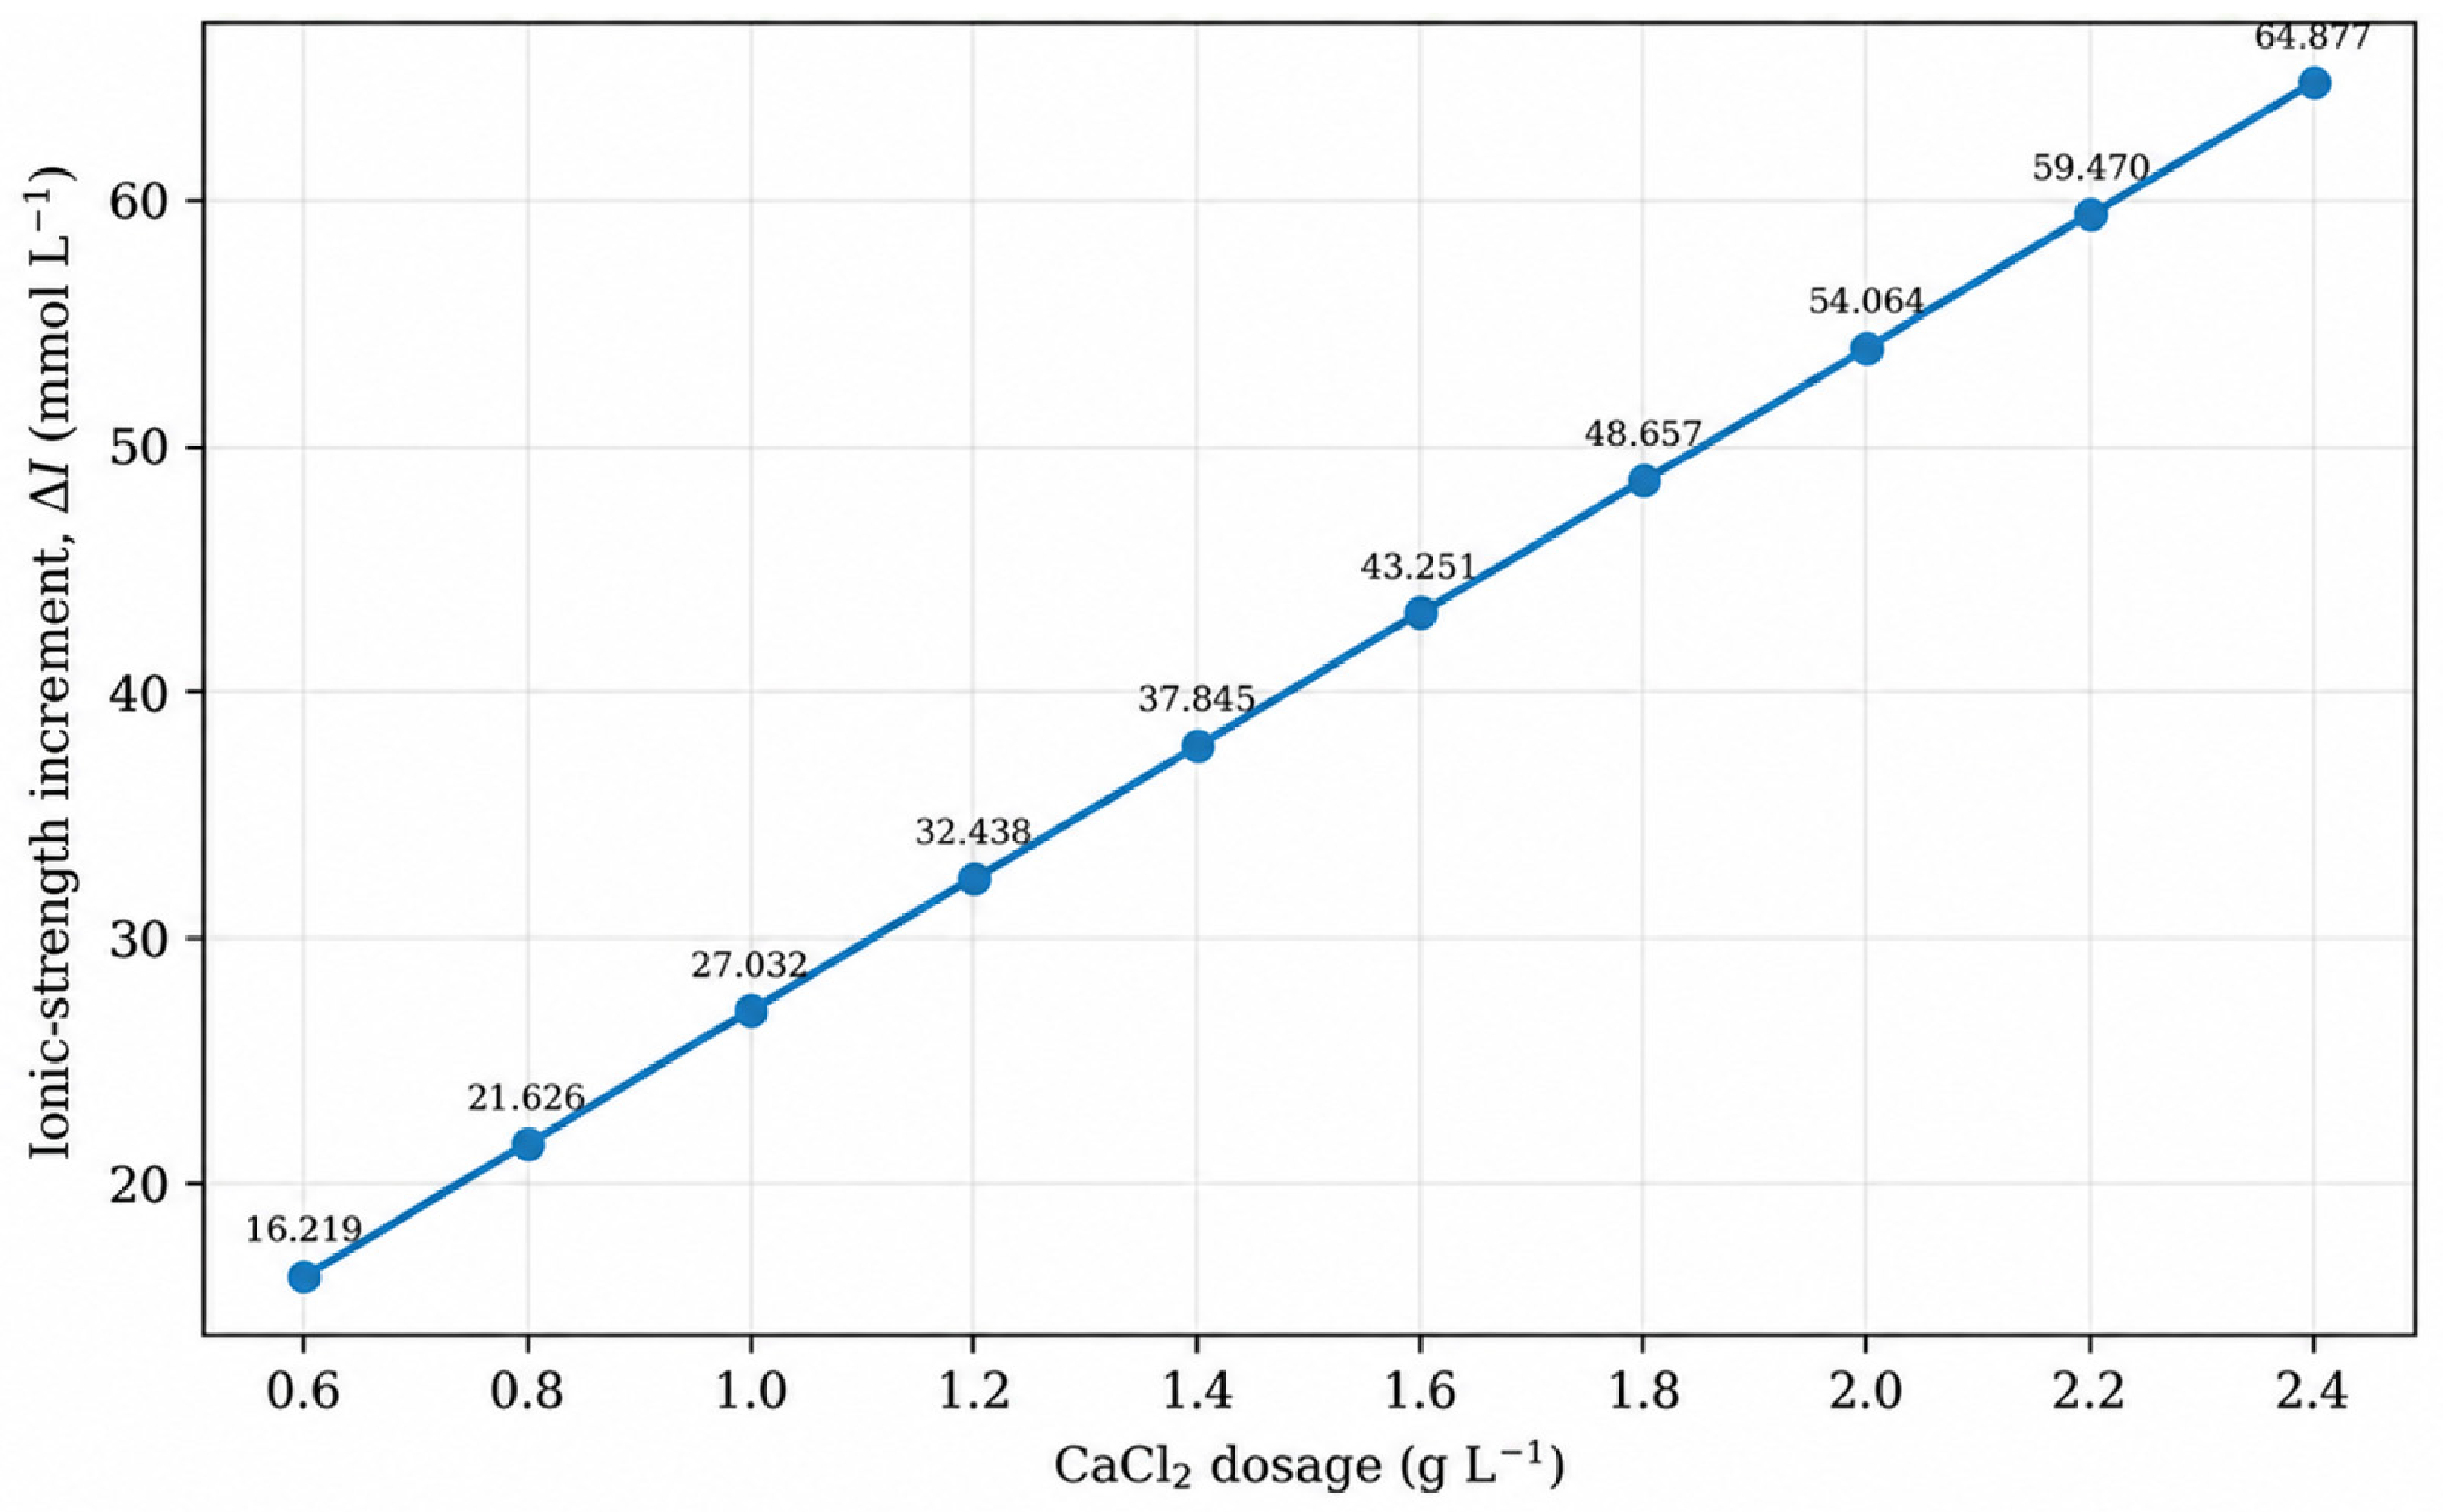
As shown in Figure 12, when the CaCl2 dosage increased from 0.6 g/L to 2.4 g/L, the ionic-strength increment caused by the added CaCl2 increased linearly from 16.219 mmol/L to 64.877 mmol/L. At a CaCl2 dosage of 1.2 g/L, the ionic-strength increment was approximately 32.438 mmol/L. Under the assumption of complete CaCl2 dissociation, the contribution of added CaCl2 to the ionic strength of the system therefore increased continuously with dosage.
According to electrical double-layer theory, increasing ionic strength increases the Debye parameter κ and shortens the Debye screening length κ−1. Consequently, electrolyte screening of particle-surface electrostatic interactions is strengthened and the effective range of interparticle electrostatic interactions is reduced. Therefore, with other conditions held constant, increasing CaCl2 concentration favors close-range particle contact and provides a more favorable electrostatic environment for subsequent particle collision and aggregation.
The ΔI values in Figure 12 represent only the ionic-strength increment contributed by the added CaCl2 and not the absolute total ionic strength of the coal slurry water. The actual system also contains Ca2+, Mg2+, and other dissolved ions. Thus, the calculated values are used primarily to compare relative changes in electrostatic screening under different CaCl2 dosages. In addition, because ζ potential was not measured at different CaCl2 concentrations, these results cannot be used to determine whether complete charge neutralization occurs at 1.2 g/L or to prove charge reversal at higher CaCl2 concentrations.
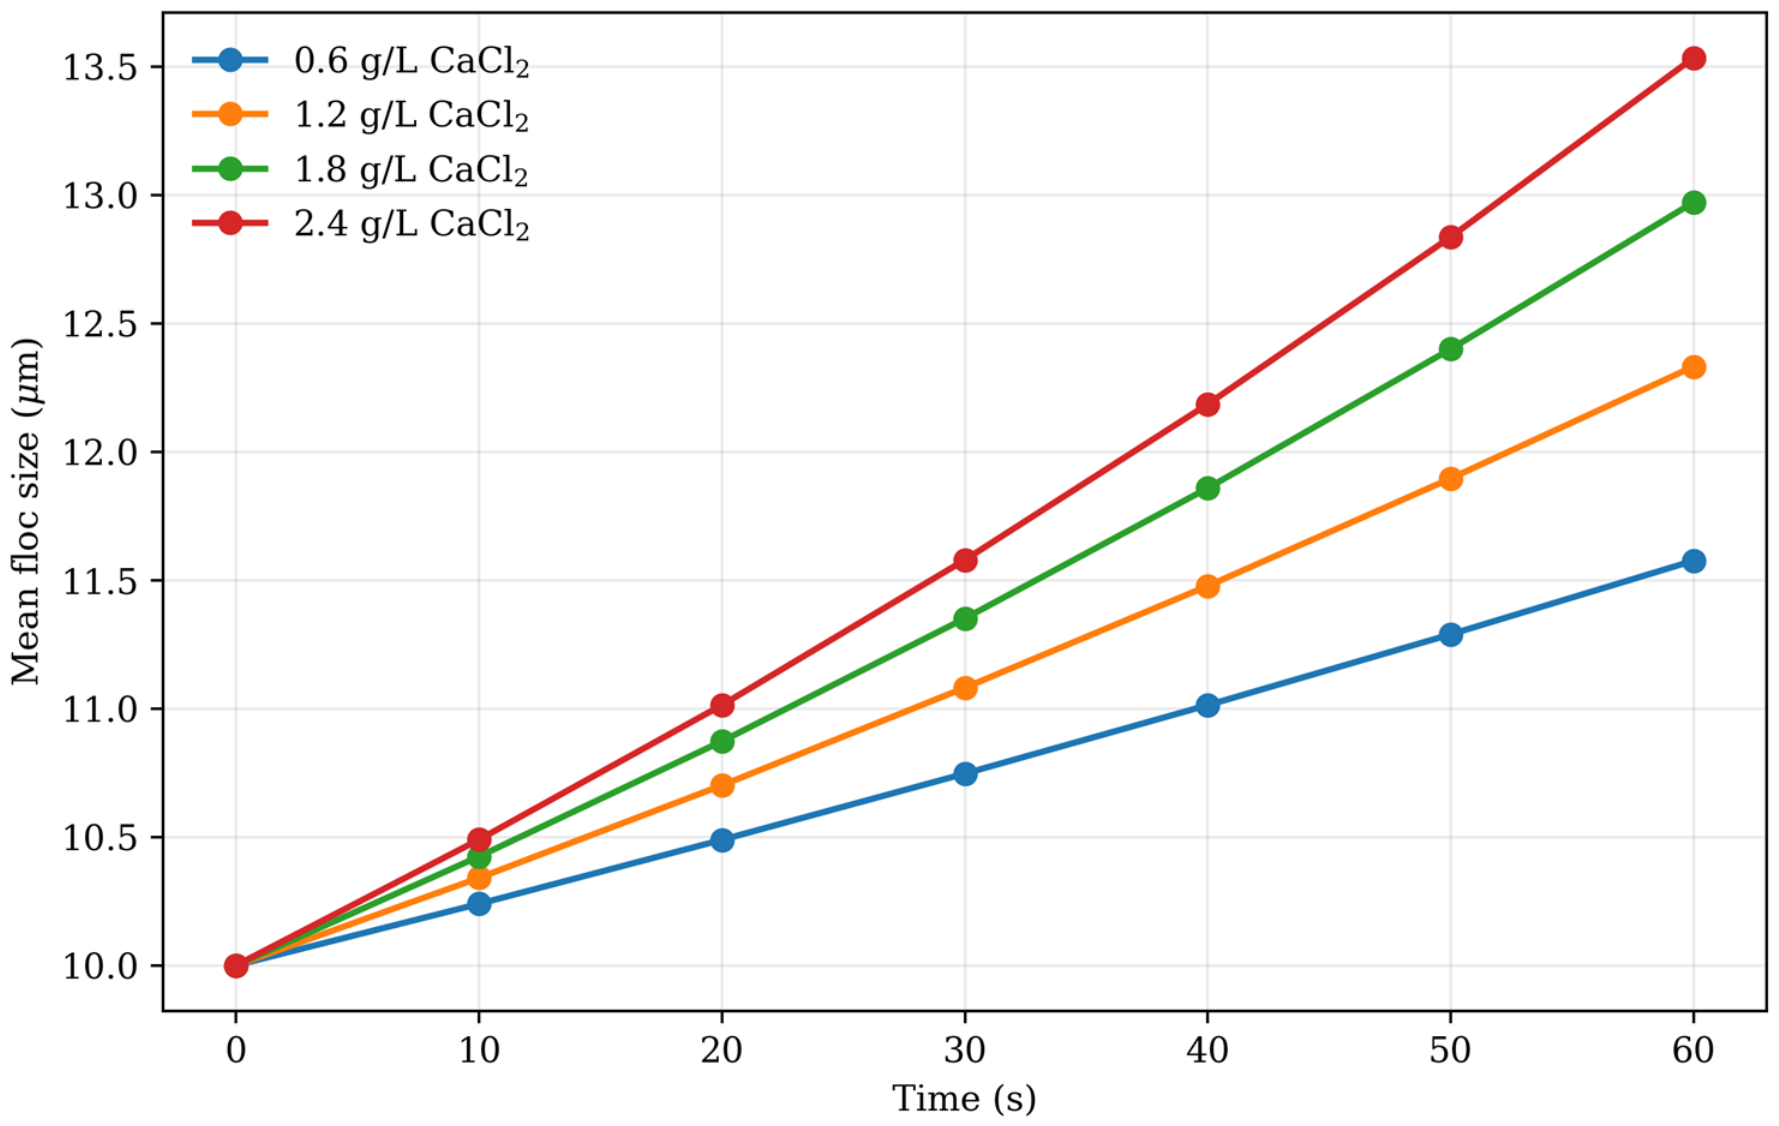
Figure 13 shows that, with the effective particle adhesion parameter, particle size composition, and other simulation conditions held constant, the electrostatic screening corresponding to different CaCl2 dosages had an evident influence on the particle aggregation process. The mean floc size increased continuously with simulation time under all conditions, indicating progressive formation of larger aggregates through particle collision and effective attachment.
At the same simulation time, higher CaCl2 dosages generally corresponded to larger mean floc sizes. At 60 s, when the CaCl2 dosage increased from 0.6 g/L to 2.4 g/L, the mean floc size increased from 11.576 μm to 13.534 μm. Relative to the initial representative particle size of 10 μm, the increase rose from 15.76% to 35.34%. At 1.2 g/L and 1.8 g/L CaCl2, the mean floc sizes at 60 s were 12.332 μm and 12.972 μm, respectively.
These results indicate that, in the present reduced-order model, increasing the ionic-strength increment caused by CaCl2 shortens the Debye screening length and reduces the effective range of interparticle electrostatic interactions. Particles can therefore approach each other more readily, increasing the opportunity for stable aggregate formation and promoting floc growth over time.

3.7. Comparison of Experimental and Numerical Results and Model Limitations

The sedimentation experiments showed that the reagent system had a marked effect on the settling performance of coal slurry water. APAM alone produced relatively favorable sedimentation in the concentration range of 0.6–1.0 mg/L. After CaCl2 addition, the sedimentation performance of both combined systems improved substantially.
For the CaCl2 + PAM system, when CaCl2 was 1.2 g/L and PAM was 4 mg/L, the settling rate was approximately 800 mm/min and the supernatant turbidity was 71.9 NTU. The best overall performance of the CaCl2 + APAM system occurred at 1.2 g/L CaCl2 and 0.8 mg/L APAM, with a settling rate of 805 mm/min and a supernatant turbidity of 41.7 NTU. Overall, the experimental results indicate that the CaCl2 + APAM system achieved better solid liquid separation than APAM alone and the CaCl2 + PAM system.
The numerical sensitivity analysis showed that stronger electrostatic screening and stronger effective particle adhesion both favored the formation of larger stable aggregates. The combined-reagent observations are directionally compatible with this mechanism, although the simulations did not assign a calibrated adhesion parameter to any reagent formulation.
It should be noted that settling rate and supernatant turbidity are macroscopic performance indicators, whereas the numerical outputs of mean floc size, aggregation rate, and fractal dimension describe microscopic or mesoscopic aggregation characteristics. These quantities are not directly equivalent. Therefore, the agreement between simulation and experiment in this study is defined as agreement in the direction of change rather than strict quantitative validation of microscopic model parameters by macroscopic sedimentation data. Floc growth reflects competing aggregation and breakage processes, so a larger aggregate size alone does not establish greater mechanical strength [25].
The combined sedimentation experiments and numerical sensitivity analysis suggest that the addition of CaCl2 increases the ionic strength of the aqueous phase and shortens the effective electrical double-layer screening distance at coal slurry particle surfaces, thereby facilitating close-range particle collisions. On this basis, adsorption and bridging by polymer flocculants further promote the growth of small aggregates into larger flocs.
The experimental results showed that the CaCl2 + APAM system had the best overall sedimentation performance, indicating a synergistic effect between CaCl2 and APAM that favors particle aggregation and solid liquid separation. The numerical sensitivity analysis further showed that particle aggregation increased as electrostatic screening and effective adhesion became stronger, which is consistent with the experimental observations.
However, because the adsorption state of Ca2+ on coal slurry particles and APAM molecules was not measured directly and no molecular-scale characterization of complexation structures was performed, the EDEM results alone cannot demonstrate the formation of a specific Ca2+-COO− ionic bridge. Possible coordination or bridging interactions between Ca2+ and APAM may be considered as a potential mechanism for interpreting the experimental observations, but their specific form requires further verification by surface-chemical measurements or molecular-scale studies.
The experimentally observed increase in turbidity and decrease in settling rate at higher CaCl2 concentrations are therefore described as a macroscopic deterioration of flocculation performance under excess CaCl2 conditions. In the absence of corresponding ζ-potential measurements, this behavior is not directly attributed to particle-surface charge reversal.
Accordingly, the numerical model in this study mainly explains changes in coal slurry particle aggregation from the perspective of electrical-double-layer screening, particle collision, effective adhesion, and floc growth and provides trend-level numerical support for enhanced coal slurry flocculation and sedimentation using combined CaCl2 and polyacrylamide.
The numerical model developed in this study was mainly intended to analyze the effects of electrolyte-induced electrical double-layer screening and effective adhesion on the aggregation behavior of coal slurry particles. Owing to experimental limitations, ζ potential at different CaCl2 concentrations, Ca2+ surface adsorption, particle collision-attachment probability, and transient floc size were not measured. Consequently, these microscopic parameters could not be quantitatively calibrated for the specific sample.
Accordingly, the model was not used to predict absolute ζ-potential values, charge-neutralization points, critical charge-reversal concentrations, or a unique particle adhesion probability for each reagent system. Instead, the numerical simulations were used primarily to examine relative trends in particle aggregation under different electrostatic screening and effective adhesion levels and to compare these trends with the macroscopic sedimentation experiments.
Furthermore, real polyacrylamide molecules exhibit complex chain conformations and adsorption behavior. In the present model, the overall effect of polyacrylamide on particle aggregation was represented by an effective adhesion parameter. Therefore, the model alone cannot demonstrate a specific molecular complexation or ionic-bridge structure between Ca2+ and APAM. Such molecular-scale interactions require further investigation using ζ-potential measurements, adsorption tests, spectroscopic characterization, or molecular simulation. Pan et al. combined sedimentation experiments and molecular dynamics simulations to investigate PAM adsorption at coal/water and kaolinite/water interfaces [26]. This combined approach offers a route for testing adsorption-related interpretations beyond the effective-adhesion representation used here.


4. Conclusions

(1)
The investigated coal slurry water was characterized by high turbidity, high ash content, and a substantial ultrafine-particle fraction. The measured particle-size distribution was therefore retained in the EDEM model, including the 1–5 μm fraction.
(2)
In the single-reagent tests, appropriate dosages were 1.4 g/L CaCl2, 4 mg/L nonionic PAM, and 0.6–1.0 mg/L APAM. Among the combined systems, CaCl2 + APAM provided the best overall solid liquid separation. At 1.2 g/L CaCl2 and 0.8 mg/L APAM, the settling rate was 805 mm/min and the supernatant turbidity was 41.7 NTU.
(3)
Comparison of the 15,000- and 20,000-particle cases informed the choice of 15,000 particles for subsequent sensitivity analyses; a formal independence threshold was not documented. As the effective adhesion parameter increased from 0.2 to 0.8, the mean floc size at 60 s increased from 10.655 to 13.065 μm, the aggregation-rate output from 0.00356 to 0.01034 s−1, and the apparent fractal dimension from 1.065 to 1.184.
(4)
Increasing CaCl2 dosage increased the ionic-strength increment and shortened the effective electrical-double-layer screening length in the reduced-order model. The corresponding numerical trend favored closer particle contact and aggregate growth. This trend was qualitatively consistent with the improved sedimentation observed for the combined reagent systems.
(5)
The numerical model provides trend-level support for the sequence of electrical-double-layer screening, particle collision, effective adhesion, and floc growth. Because ζ-potential, Ca2+ surface adsorption, and polymer adsorption were not independently measured, the present EDEM results should not be interpreted as direct proof of a specific Ca2+–APAM ionic-bridge structure. Further ζ-potential, adsorption, and spectroscopic measurements are required for molecular-scale verification.

Author Contributions

Validation, C.Z.; Writing—original draft, C.Z.; Supervision, H.L. and M.S. All authors have read and agreed to the published version of the manuscript.

Funding

This research was funded by National Key Research and Development Program of China, grant number 2023YFC2907705.

Data Availability Statement

Data are contained within the article.

Conflicts of Interest

The authors declare no conflicts of interest.

References

  1. Xu, Y.P.; Wang, X.; Qiu, C.; Wen, K.; Wang, X.; Wang, C. Experimental study on flocculation and sedimentation of iron ore tailings slurry. Green Technol. 2022, 24, 76–81+98. (In Chinese) [Google Scholar] [CrossRef]
  2. Dang, R.D.; Zhang, Y.F.; Lin, Z. Study on factors affecting flocculation of coal slurry water in Haerwusu Coal Preparation Plant. Coal Eng. 2021, 53, 103–107. (In Chinese) [Google Scholar]
  3. Feng, B.; Qiao, X.L. Experimental study on the effects of flocculant addition on mineral processing indices in a copper mine tailings treatment system. China Min. Eng. 2026, 55, 92–98. (In Chinese) [Google Scholar] [CrossRef]
  4. Xie, B. Analysis of coal slurry water properties and flocculation–sedimentation experiments in coal preparation plants. Shanxi Chem. Ind. 2025, 45, 136–138. (In Chinese) [Google Scholar] [CrossRef]
  5. Liu, G.; Zhang, H.Y.; Sun, Y. Research and practice on the treatment of difficult-to-settle coal slurry water in coal preparation plants. Coal Technol. 2023, 42, 243–245. (In Chinese) [Google Scholar] [CrossRef]
  6. Liu, T.; Liu, J.H. Design and implementation of an intelligent dosing system for coal slurry water treatment in coal preparation plants. Electr. Appl. 2024, 43, 30–36. (In Chinese) [Google Scholar]
  7. Ma, W.W.; Liu, J.; Wu, Y.C.; Liu, B.H.; Tian, W.W.; Li, S.S. Research and application of intelligent thickening and dosing control technology in coal preparation plants. Coal Process. Compr. Util. 2025, 1, 10–14. (In Chinese) [Google Scholar] [CrossRef]
  8. Deng, J.; Liu, W.; Zheng, C.; Wang, C. Agent Addition to Coal Slurry Water Using Data-Driven Intelligent Control. Processes 2025, 13, 280. [Google Scholar] [CrossRef] [Scilit]
  9. Jiang, H.B. Process optimization for improving clean coal recovery at the Jiulong Production Department of Matou Coal Preparation Plant. Coal Process. Compr. Util. 2021, 2, 23–26. (In Chinese) [Google Scholar] [CrossRef]
  10. Ren, P.L. Experimental Study on Deashing of Coal Gasification Fine Slag by Grinding–Flotation. Ph.D. Thesis, Xi’an University of Science and Technology, Xi’an, China, 2021. (In Chinese) [Google Scholar] [CrossRef]
  11. Yan, X.; Wei, L.; Meng, Q.; Wang, J.; Yang, Q.; Zhai, S.; Lu, J. A study on the mechanism of calcium ion in promoting the sedimentation of illite particles. J. Water Process Eng. 2021, 42, 102153. [Google Scholar] [CrossRef] [Scilit]
  12. Lin, Z.; Wang, Q.; Wang, T.; Wang, Z.; Wang, G. Dynamic floc characteristics of flocculated coal slime water under different agent conditions using particle vision and measurement. Water Environ. Res. 2020, 92, 706–712. [Google Scholar] [CrossRef] [Scilit]
  13. Lin, Z.; Li, P.; Hou, D.; Kuang, Y.; Wang, G. Aggregation Mechanism of Particles: Effect of Ca2+ and Polyacrylamide on Coagulation and Flocculation of Coal Slime Water Containing Illite. Minerals 2017, 7, 30. [Google Scholar] [CrossRef] [Scilit]
  14. Li, H.; Chen, J.; Peng, C.; Min, F.; Song, S. Salt coagulation or flocculation? In situ zeta potential study on ion correlation and slime coating with the presence of clay: A case of coal slurry aggregation. Environ. Res. 2020, 189, 109875. [Google Scholar] [CrossRef] [Scilit]
  15. Xu, G.; Liu, L.; Geng, D.; Shao, H.; Wang, H.; Tao, D.; Liu, Z.; Bilal, M. Flocculation and filtration performance of coal slime water: Role of flocculant molecular weight and coagulants. Int. J. Coal Prep. Util. 2026, 46, 1160–1172. [Google Scholar] [CrossRef] [Scilit]
  16. Kroupa, M.; Vonka, M.; Kosek, J. Modeling the Mechanism of Coagulum Formation in Dispersions. Langmuir 2014, 30, 2693–2702. [Google Scholar] [CrossRef] [Scilit]
  17. Kroupa, M.; Vonka, M.; Soos, M.; Kosek, J. Size and Structure of Clusters Formed by Shear Induced Coagulation: Modeling by Discrete Element Method. Langmuir 2015, 31, 7727–7737. [Google Scholar] [CrossRef] [Scilit]
  18. Yu, M.; Yu, X.; Balachandar, S. Particle Nonresolved DNS–DEM Study of Flocculation Dynamics of Cohesive Sediment in Homogeneous Isotropic Turbulence. Water Resour. Res. 2022, 58, e2021WR030402. [Google Scholar] [CrossRef] [Scilit]
  19. Kinoshita, T.; Nakaishi, K.; Kuroda, Y. Determination of kaolinite floc size and structure using interface settling velocity. Appl. Clay Sci. 2017, 148, 11–16. [Google Scholar] [CrossRef] [Scilit]
  20. Allen, T. Particle Size Measurement, 5th ed.; Chapman & Hall: London, UK, 1997; Volume 1. [Google Scholar]
  21. IUPAC Physical and Biophysical Chemistry Division. Quantities, Units and Symbols in Physical Chemistry, 3rd ed.; RSC Publishing: Cambridge, UK, 2007. [Google Scholar] [CrossRef] [Scilit]
  22. Hogg, R. Bridging Flocculation by Polymers. KONA Powder Part. J. 2013, 30, 3–14. [Google Scholar] [CrossRef] [Scilit]
  23. Zeng, L.; Eardley, J.C.; Franks, G.V.; Goudeli, E. Implementation of a Yukawa force model in polymer-induced bridging flocculation of hematite particles using CFD–DEM. Adv. Powder Technol. 2025, 36, 105096. [Google Scholar] [CrossRef] [Scilit]
  24. Liang, L.; Peng, Y.; Tan, J.; Xie, G. A review of the modern characterization techniques for flocs in mineral processing. Miner. Eng. 2015, 84, 130–144. [Google Scholar] [CrossRef] [Scilit]
  25. Jarvis, P.; Jefferson, B.; Gregory, J.; Parsons, S.A. A review of floc strength and breakage. Water Res. 2005, 39, 3121–3137. [Google Scholar] [CrossRef] [Scilit]
  26. Pan, M.; Duan, C.; Huang, L.; Wang, W.; Jiang, H.; Qiao, J.; Zhao, Y. Describing the adsorption of PAM on coal/kaolinite surface in aquatic by combining experiments and MD simulation. J. Mol. Liq. 2023, 372, 121152. [Google Scholar] [CrossRef] [Scilit]
Figure 1. Sample XRD pattern.
Minerals 16 01009 g001
Figure 2. Baseline-corrected FTIR spectrum of the dried coal-slurry solid sample.
Minerals 16 01009 g002
Figure 3. Dried coal slime SEM micrograph.
Minerals 16 01009 g003
Figure 4. Particle size distribution of the coal slurry sample.
Minerals 16 01009 g004
Figure 5. Flocculation–sedimentation curves for different CaCl2 concentrations.
Minerals 16 01009 g005
Figure 6. Flocculation–sedimentation curves for different PAM concentrations.
Minerals 16 01009 g006
Figure 7. Flocculation–sedimentation curves for different APAM concentrations.
Minerals 16 01009 g007
Figure 8. Sedimentation curves for CaCl2 + PAM combined tests.
Minerals 16 01009 g008
Figure 9. Sedimentation curves for CaCl2 + APAM combined tests.
Minerals 16 01009 g009
Figure 10. Variation in mean floc size under different effective particle adhesion parameters.
Minerals 16 01009 g010
Figure 11. Variation in aggregation rate and apparent fractal dimension under different effective particle adhesion parameters.
Minerals 16 01009 g011
Figure 12. Relationship between CaCl2 dosage and ionic-strength increment.
Minerals 16 01009 g012
Figure 13. Comparison of particle aggregation behavior under different electrostatic screening conditions.
Minerals 16 01009 g013
Table 1. Testing equipment and analytical methods.
Surveillance ProjectStandard for Detection MethodsInstruments and Equipment
pHDetermination of pH Value in Water: Electrode Method HJ1147-2020pH meter—Metrohm FE28 (METTLER TOLEDO, Shanghai, China)
turbidityspectrophotometryT6 New Century Spectrophotometer (Beijing Purkinje General Instrument Co., Ltd., Beijing, China)
total hardnessDetermination of Total Calcium and Magnesium in Water: EDTA Titration Method GB/T 7477-1987Electric Hot Air Drying Oven DHG-9140A (Shanghai Yiheng Scientific Instruments Co., Ltd., Shanghai, China)
electroconductibilityPortable Conductivity Meter MethodpH/ORP/Conductivity/Oxygen Dissolved Meter SX751 (Shanghai San-Xin Instrumentation, Inc., Shanghai, China)
Table 2. Conversion of the measured particle size distribution to model inputs.
Measured Size Class (μm)Measured Volume Fraction (%)Representative Diameter (μm)EDEM Number Fraction (%)
1–59.853.075.40
5–1044.677.521.88
10–2035.0514.02.64
20–5010.4230.00.08
Table 3. Main numerical model parameters and their sources.
ParameterSymbolSource or Determination Method
Coal slurry particle size distributiondpMeasured by laser particle size analysis
Volume fraction of each size classwiMeasured by laser particle size analysis
pH—Measured sample characteristic (7.76); not a numerical model input
CaCl2 dosageC(CaCl2)Specified in the flocculation sedimentation tests
Ionic-strength incrementΔICalculated using Equation (5)
Debye parameterκCalculated from the ionic-strength relation for relative analysis
Total particle numberNtotalDetermined by particle-number independence analysis
Particle densityρpModel assumption parameters
Liquid-phase dynamic viscosityμContinuous phase approximated as water; dynamic viscosity of liquid water at 20 °C recommended by IAPWS
Effective particle adhesion parameterPaggSensitivity-analysis parameter; not treated as a measured value
Simulation timetKept identical among simulation cases
Table 4. Water quality test results.
Surveillance ProjectDetection Result
pHTurbidity (Degrees)Total Hardness mg/L (Calculated as CaCO3)Electroconductibility (ms/m)
coal slime water7.762599194.372.50
Table 5. Concentrations of selected metallic elements in the coal slurry water.
Analysis of Metallic Elements in Coal Slime Water
Metal elements in coal slime waterCaMgAlFe
Actual concentration (ug/mL)14.4783.7311.8680.015
Table 6. Sedimentation data for different CaCl2 concentrations.
Concentration (g/L)Turbidity (NTU)Rate of Settling (mm/min)
0.6208.966
0.8206.652
1209.644
1.2207.447
1.4183.566
1.6241.254
1.8243.149
2237.340
2.2242.238
2.4262.842
Table 7. Sedimentation data for different PAM concentrations.
Concentration (mg/L)Rate of Settling (mm/min)Turbidity (NTU)
1400136.9
243098.7
442160.6
641087.1
8415131.4
10400106.9
12415107.9
14200163.8
Table 8. Sedimentation data for different APAM concentrations.
Concentration (mg/L)Rate of Settling (mm/min)Turbidity (NTU)
0.2240152.6
0.4282101.3
0.635088.7
140090.7
2416139.6
4230166.5
650205.1
Table 9. CaCl2 + PAM combined sedimentation test data.
Nonionic Concentration (mg/L)CaCl2 Concentration (g/L)Turbidity (NTU)Rate of Settling (mm/min)
11.279.1790
21.273.8793
41.271.9800
11.487.5812
21.475.1796
41.494.0770
11.692.0800
21.6116.5812
41.699.9750
Table 10. CaCl2 + APAM combined sedimentation test data.
Anion Concentration (mg/L)CaCl2 Concentration (g/L)Turbidity (NTU)Rate of Settling (mm/min)
0.41.251.9821
0.61.264.1826
0.81.241.7805
0.41.478.7800
0.61.471.2794
0.81.483.2790
0.41.698.1440
0.61.683.0452
0.81.691.0312
Disclaimer/Publisher’s Note: The statements, opinions and data contained in all publications are solely those of the individual author(s) and contributor(s) and not of MDPI and/or the editor(s). MDPI and/or the editor(s) disclaim responsibility for any injury to people or property resulting from any ideas, methods, instructions or products referred to in the content.