4.1. Experimental Design
The Taguchi orthogonal array design proves a highly efficient and robust experimental methodology that effectively resolves multi-objective optimization challenges under complex conditions. This approach is particularly suitable for investigating ore comminution processes involving coupling effects among multiple operational parameters in HPGR. The Taguchi orthogonal design employs orthogonal arrays with different factor levels to evaluate the effects of individual factors on the response target. This orthogonal array design enables representative experimental results with balanced dispersion and comparable characteristics to be achieved with significantly fewer experimental runs [
42]. In this paper, the statistical analysis software Minitab 22 was used for experimental design and parameter optimization.
Based on the preceding analysis, a Taguchi orthogonal array design was employed with roller diameter, roller width, roller speed, and roll gap as the parameters to be optimized, each assigned five levels.
Table 4 presents five distinct levels assigned to each of the four parameters.
Table 5 displays the orthogonal array layout constructed following Taguchi’s methodology.
This study targeted five optimization objectives for the HPGR: SRE, throughput, average energy consumption, wear, and edge effect. The optimization objective was to maintain high SRE and throughput of the HPGR while reducing average energy consumption, wear, and edge effects. The SRE (%) of the HPGR was still quantified by the mass fraction of crushed product with particle size ≤ 6 mm. The throughput (t/h) was defined as the mass of ore passing through the release zone per hour. The energy consumption (kwh/t) of the HPGR was characterized by the average energy expended per ton of ore processed by a single roller. The wear (mm/h) of the HPGR was defined as the sum of the average hourly wear losses on both the roller and the cheek plates. The edge effect (%) of the HPGR was quantified as the standard deviation of SRE across different axial positions of the roller.
4.2. Analysis of Variance and Signal-to-Noise Ratio
The Taguchi method employs the signal-to-noise ratio (SNR) to quantify process robustness. Depending on distinct requirements for each optimization objective, the SNR is categorized into three characteristics: larger-the-better (LTB), smaller-the-better (STB), and nominal-the-best (NTB). In the optimization of HPGR, SRE (I) was set as the primary objective, with the optimization expectation that larger values indicate better outcomes. Consequently, the analysis of SRE adopted the LTB characteristic. Under the premise of ensuring SRE, the throughput (II) of the roller press was also treated with the LTB characteristic. For the optimization of HPGR, smaller values were preferred for average energy consumption (III), wear (IV), and edge effect (V). Consequently, the smaller-the-better (STB) characteristic was applied to the analysis of these corresponding objectives. The SNR for distinct characteristic types were derived through the following [
43]:
where
yi is the response target and
n denote the total number of trials.
Table 6 provides the analysis of variance (ANOVA) table for these response targets, where conducting ANOVA reveals the statistical significance of process parameter effects on individual response targets. The response tables of the SNR of each response target are presented in
Table 7.
In ANOVA, the F-distribution table serves as a statistical tool to determine the significance of experimental results. It distinguishes the significance of individual factors based on degrees of freedom and significance levels. The common values of significance level (α) are 0.1, 0.05, and 0.01, indicating the rigour of the test. In ANOVA, degrees of freedom comprise the numerator degrees of freedom (df1) and the denominator degrees of freedom (df2). Here, df1 equals the number of treatment groups minus one, while df2 equals the total degrees of freedom minus the sum of degrees of freedom for all factors in the experiment. The F-distribution table provides critical values as follows: F0.1(4,8) = 2.81, F0.05(4,8) = 3.84, and F0.01(4,8) = 7.01.
Table 6 shows that all four factors exerted significant effects on SRE, as their F-values exceeded F
0.01(4,8). Among these, roller diameter demonstrated the highest F-value, indicating its extremely significant influence, followed by roll gap. In contrast, roller speed and roll width exhibited less pronounced effects. The SNR-based response ranking revealed that the statistical significance ranking of the four factors affecting SRE was: roller diameter > roller gap > roller speed > roller width (
Table 7).
Based on the ANOVA for HPGR throughput, the F-values for roll width and roll speed were significantly greater than F
0.01(4,8), indicating an extremely significant impact on throughput. Conversely, the F-values for roll diameter and roll gap were lower than F
0.1(4,8), suggesting that their effects were negligible (
Table 6). The SNR-based response ranking revealed that the statistical significance ranking of the four factors affecting throughput was: roller speed > roller width > roller diameter > roller gap (
Table 7).
ANOVA of the HPGR’s average energy consumption, wear, and edge effect revealed the following significance rankings of influencing factors:
Average energy consumption: roll diameter > roll speed > roll gap > roll width.
Wear: roll diameter > roll gap > roll width > roll speed.
Edge effect: roll speed > roll diameter > roll gap > roll width.
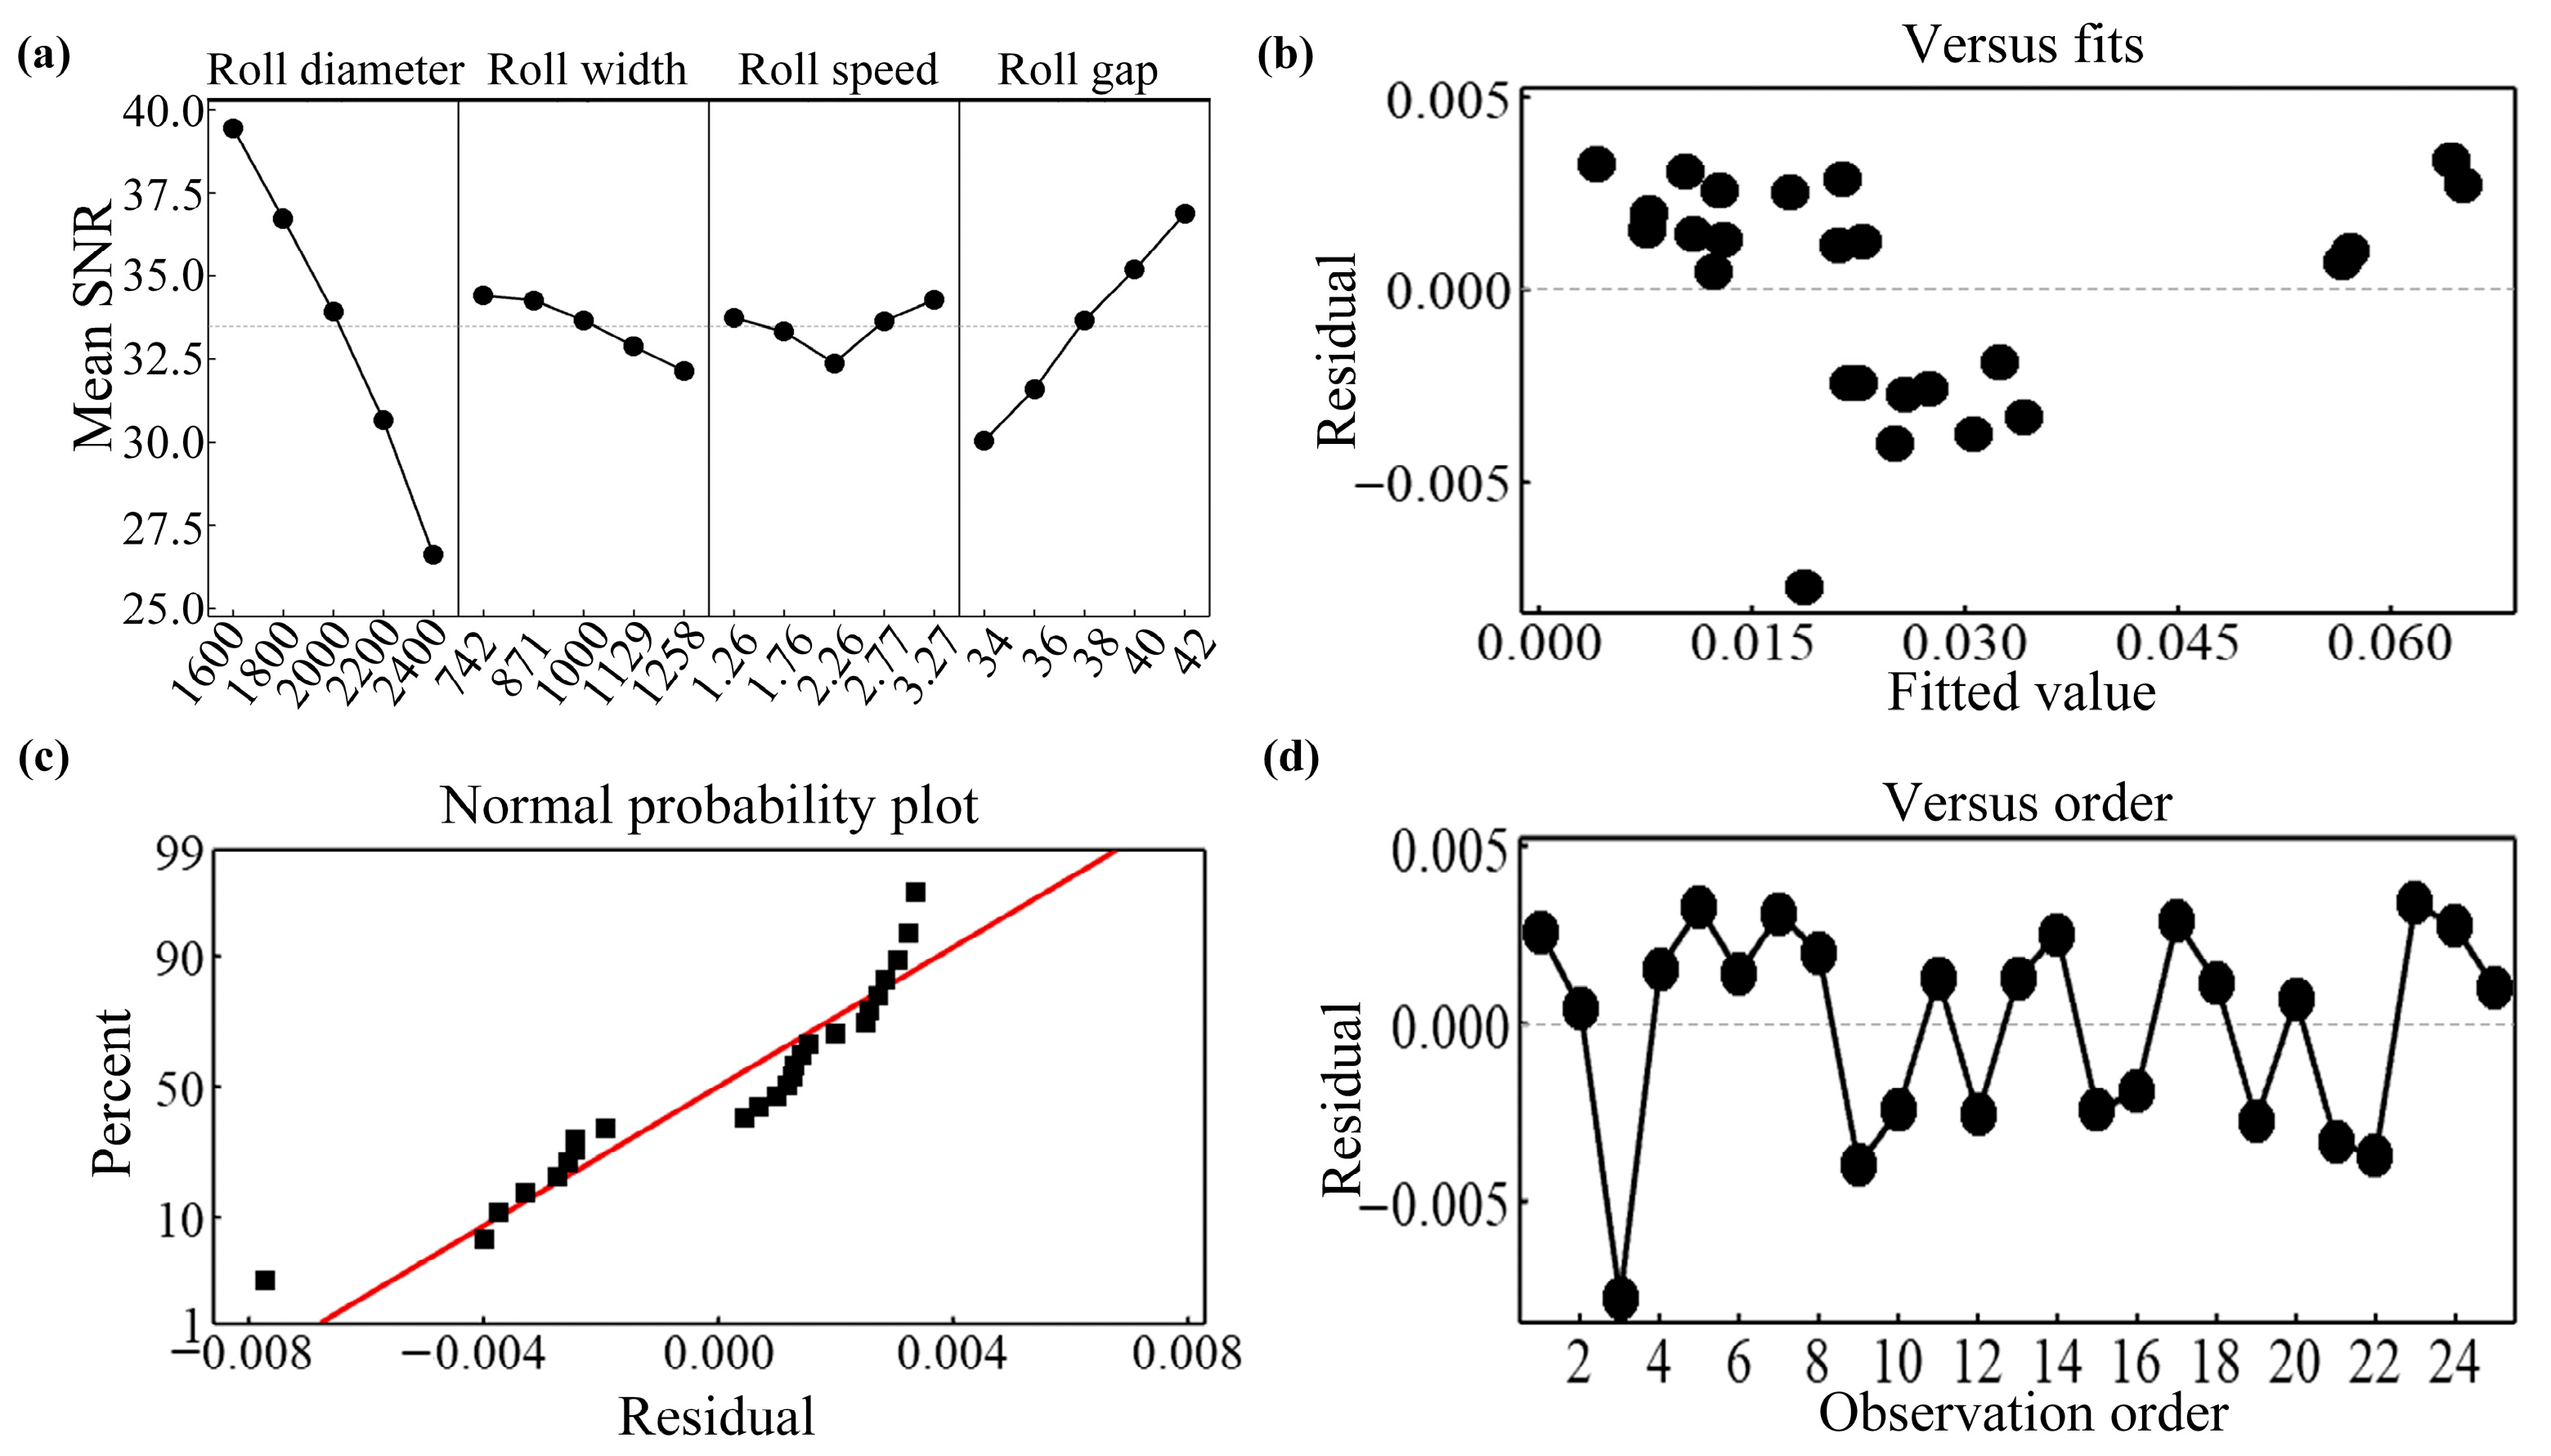
Figure 12 shows the main effect and residual plot of the SNR of the SRE. According to the variation curve of the mean SNR for each factor, the mean SNR of the SRE significantly increased with larger roller diameters (
Figure 12a). As the roller diameter increased, the system stability improved and became less susceptible to noise factors. Consequently, rollers with larger diameters contributed to enhanced SRE. Consequently, larger roller diameters generated finer product fineness, which aligned with the findings reported by Rodriguez et al. [
17].
Figure 12c displays the normal probability plot of the residuals, with the points densely distributed along the diagonal (red reference line) and no obvious bias.
Figure 12b,d show the residuals-versus-fits plot and residuals-versus-order plot, respectively. Both plots exhibit randomly scattered residuals with no discernible patterns, while the residuals collectively sum to zero. These diagnostic graphs fully conform to established statistical standards for model validation.
Figure 13 shows the main effect and residual plot of the SNR of the throughput. Analysis of the SNR for HPGR throughput revealed that increases in roll width and roll speed enhanced the response value, reduced variability, and improved system robustness (
Figure 13a). However, with continued increases, the gradient of the curve gradually declined, indicating diminished effects.
Figure 14 shows the main effect and residual plot of the SNR of the average energy consumption. As roll diameter and roll speed progressively increased, the mean SNR for the average energy consumption of HPGR gradually decreased, indicating that excessive roll diameter and speed elevated energy consumption (
Figure 14a). Conversely, increases in roll gap corresponded to a rise in the mean SNR, reducing energy consumption variability. Although increased roll width elevated the drive energy consumption of the rollers, it concurrently enhanced the throughput of the HPGR, leading to a minor net effect on average energy consumption.
Figure 15 shows the main effect and residual plot of the SNR of the wear. The mean SNR for HPGR wear exhibited negative correlations with roll diameter and roll width, with roll diameter exerting greater influence (
Figure 15a). Conversely, a positive correlation was observed between the roll gap and the mean SNR for wear. The mean SNR for the wear of HPGR initially decreased and subsequently increased with rising roll speed, reaching a minimum value at 2.26 m/s. This demonstrates that this specific speed level maximized the robustness of the wear of HPGR performance.
Figure 16 shows the main effect and residual plot of the SNR of the edge effect. The mean SNR for the edge effect of HPGR exhibited positive correlations with roll speed and roll gap, with roll speed exerting greater influence (
Figure 16a). This occurred because roller speed predominantly governed the uniformity of comminution products across distinct HPGR zones. Conversely, a negative correlation was observed between the roll diameter and the mean SNR for edge effect. The mean SNR for the edge effect of HPGR initially increased and subsequently decreased with rising roll width, peaking at 1000 mm. This indicates that this specific width level resulted in significant fluctuations in the edge effect.
Figure 13,
Figure 14,
Figure 15 and
Figure 16b–d likewise demonstrate that the residual plots for the throughput, average energy consumption, wear, edge effect SNR conform to established statistical criteria.
4.3. Multi-Objective Optimization of HPGR
Taguchi orthogonal experiments are generally employed for single-objective optimization. When optimization involves multiple responses, grey relational analysis (GRA) is required. This methodology converts all response into a grey relational grade (GRG) considering assigned weights prior to optimization. Yang et al. [
24] employed RSM to effectively optimize the throughput, SRE, and roll surface pressure of HPGR, which demonstrated robust predictive capability and revealed significant interaction effects among variables. Whereas this study addressed a more complex multi-objective scenario involving comprehensive optimization of multiple targets including energy consumption and wear, wherein GRA proved more appropriate. In multi-objective optimization, the initial step requires defining a reference sequence and comparison sequences. The reference sequence is set as the desired values for each response target, while the comparison sequences consist of the experimental data obtained for these response targets. Subsequently, the data undergo standardization, typically employing the zero-mean normalization method, given by [
44]
where x
i′(
k) denotes the standardized value, mean(x
i) represents the arithmetic mean of the
i-th sequence, and
n is the size of the sequence.
To quantify the pointwise similarity between comparison sequences and the reference sequence, the grey relational coefficient (GRC) must be calculated. The GRC is given by [
45]
where
xi(
k) denotes the standardized response value,
ζ(
k) represents the grey relational coefficient, and
xi0 indicates the ideal standardized value for the
i-th experimental group. The denominator terms correspond to the minimum and maximum of the absolute differences between the reference sequence and each comparison sequence. The distinguishing coefficient
ζ is set to 0.4 for all calculations.
To quantify the relative importance of each response target in the comprehensive evaluation, the calculation of the GRG must incorporate weights assigned to different response targets [
46].
Based on parameters from an iron ore plant and its actual production conditions, weights for each response targets were established (
Table 8).
Based on the aforementioned data, the GRG incorporating the weights of each response objective was calculated, followed by SNR and ANOVA analyses.
Table 9 and
Table 10 present the ANOVA table and the SNR response table for GRG, respectively.
Table 9 and
Table 10 indicate that roll width exerts the strongest influence on the unified GRG. The factors are ranked by impact magnitude as follows: roll width > roll speed > roll diameter > roll gap.
Figure 17 shows the main effect and residual plot of the SNR of the GRG. The mean SNR for roll width exhibited a monotonic increase with larger roll widths (
Figure 17a). However, excessive width-to-diameter ratios were observed to induce HPGR vibration, potentially leading to equipment failure. Consequently, roll width should be maximized while ensuring stable HPGR operation. In addition, a specific roller speed value was identified that maximized the comprehensive crushing performance of the HPGR. The variations in roll diameter and roll gap exhibited complex nonlinear effects on the comprehensive crushing performance of the HPGR. Consequently, their optimal values should be determined based on the assigned weights of individual response targets through grey relational analysis.
The optimal parameter combination satisfying the assigned weights of all response targets was determined as follows: roll diameter of 2400 mm, roll width of 1258 mm, roll speed of 2.77 m/s, and roll gap of 38 mm (
Figure 17a).
Table 11 displays a comparison of results before and after optimization. The experimental group (1) employs the aforementioned parameter combination, while the control groups represent configurations achieving maximized SRE (2) and maximized average energy consumption (3), respectively.
The group with optimal SRE demonstrated only a 4.4% improvement compared to the experimental group. However, it exhibited a 43.8% reduction in throughput, along with 17.2% and 29.3% increases in wear rate and edge effect, respectively. Owing to its lower throughput, average energy consumption decreased by approximately 16.3%.
The configuration maximizing average energy consumption demonstrated reductions of 7.9% in SRE and 39.1% in throughput compared to the experimental group. However, it also exhibited decreases of approximately 46.6% in wear rate and 11.2% in edge effect. This result indicates that the higher energy consumption yielded only marginal reductions in wear and edge effect at the expense of substantially compromised SRE and throughput, representing a counterproductive trade-off.
The parameter combination optimized via grey relational analysis, which incorporated the assigned weights of response targets, achieved high SRE and throughput while constraining average energy consumption, wear, and edge effect. Therefore, during engineering implementation, the weighting coefficients of parameters were determined based on operational conditions to ensure that the optimized parameters could meet practical production requirements.


