Article

Investigation of the Coloration Mechanisms of Yellow-Green Nephrite from Ruoqiang (Xinjiang), China

1
Gemmological Institute, China University of Geosciences, Wuhan 430074, China
2
Center for Jewelry Heritage and Innovation, Hubei Key Research Base of Humanities and Social Sciences, Wuhan 430074, China
3
National Jewelry Testing Center (Chongqing), Chongqing Academy of Metrology and Quality Inspection, Chongqing 400010, China
4
Institut für Geowissenschaften, Johannes Gutenberg Universität Mainz, 55128 Mainz, Germany
5
Urumqi Silk Road Deyuan Mining Co., Ltd., Urumqi 830037, China
6
Ruoqiang Tiantai Mining Co., Ltd., Ruoqiang 841800, China
*
Author to whom correspondence should be addressed.
Minerals 2025, 15(9), 961; https://doi.org/10.3390/min15090961
Submission received: 19 August 2025 / Revised: 1 September 2025 / Accepted: 9 September 2025 / Published: 10 September 2025

Abstract

This study systematically investigates the color origin and coloration mechanisms of yellow-green nephrite from Ruoqiang, Xinjiang, using multiple analytical techniques including hyperspectral colorimetry, X-ray fluorescence (XRF) spectroscopy, titrimetry, laser ablation inductively coupled plasma–mass spectrometry (LA-ICP-MS), Raman spectroscopy and ultraviolet–visible (UV-Vis) spectroscopy. A pioneering quantitative model (R2 = 0.942) was established between hue (H) and the Fe2O3 ratio (Fe2O3/TFe), revealing that the coloration mechanism is jointly governed by Fe3+ charge transfer (300–400 nm absorption band) and Fe2+→Fe3+ transitions (600–630 nm absorption band). Furthermore, the intensity variation in the 3651 cm−1 Raman peak serves to further confirm the critical role of Fe3+ occupancy in the tremolite lattice for color modulation. In combination with the partition patterns of Rare Earth elements (REEs) (right-leaning LREE distribution with negative Eu anomaly) and trace element characteristics, this study supports the classification of Ruoqiang yellow-green nephrite as a high oxygen fugacity magnesian marble-type deposit. In this type of deposit, the ore-forming environment facilitates Fe3+ enrichment and yellow-green hue formation. The findings provide new theoretical insights into the chromatic genesis of yellow-green nephrite and hold significant implications for its identification, quality grading, and research on metallogenic mechanisms.

1. Introduction

Nephrite is an ornamental stone primarily composed of tremolite [Ca2Mg5Si8O22(OH)2] and actinolite [Ca2(Mg,Fe)5Si8O22(OH)2], with accessory minerals including zircon, apatite, diopside, epidote, garnet, pyrite, quartz, barite, magnetite and phlogopite [1,2]. Major global deposits occur in Xinjiang region (China) [3,4], Siberia (Russia) [5] and Chuncheon (Republic of Korea) [6,7]. Notably, the West Kunlun magnesian marble-hosted tremolitic nephrite belt in the Hetian region of Xinjiang constitutes the largest metallogenic nephrite province in the world.
The Xinjiang nephrite mineralization zones are distributed across three principal areas: Shache–Yecheng, Hetian–Yutian and Qiemo–Ruoqiang [8]. Most of the deposits are genetically associated with contact metasomatism between Precambrian dolomitic marble and intermediate-acidic magmatic intrusions. Secondary placer deposits of tremolitic nephrite have been identified in the Yurungkash and Karakash River systems, particularly within their terrace sediments [1,9]. The recent discoveries of yellow-green nephrite in Ruoqiang County, commercially termed “Huangkouliao” [8,10], have expanded the chromatic diversity of Xinjiang nephrite.
The coloration mechanisms of nephrite remain a central research topic in gemology. Liu et al. [11] investigated the sugar-colored nephrite from Qiemo in Xinjiang through integrated geochemical, isotopic, and geochronological analyses, elucidating its metallogenic processes and temporal constraints. Subsequent studies by Gao et al. [12] and Bai et al. [13,14] characterized newly discovered nephrite deposits in Heilongjiang (Tieli), Guangxi (Dahua), and Jilin (Panshi). Existing research demonstrates positive correlations between FeO content and cyan/black coloration in nephrite. Recent investigations by Du et al. [10] and Zhang et al. [8] employing LA-ICP-MS, FTIR, and XRF techniques proposed Fe3+ as the dominant chromophore in yellow-green nephrite. However, current studies on Ruoqiang yellow-green nephrite remain largely descriptive, lacking quantitative hue-chromophore correlations and systematic mechanistic interpretations, which hinders comprehensive understanding of its coloration genesis. Although previous studies have documented the role of Fe3+, the quantitative correlation between lattice occupancy and hue remains unexplored, particularly in systems hosting magnesian marble.
This study investigates the coloration mechanisms of yellow-green nephrite from Ruoqiang (Xinjiang), through an integrated analytical protocol combining hyperspectral colorimetry (quantitative chromatic measurement), X-ray fluorescence spectroscopy (XRF, bulk composition analysis), laser ablation inductively coupled plasma mass spectrometry (LA-ICP-MS, trace/Rare Earth element determination), laser Raman spectroscopy, ultraviolet-visible (UV-Vis) spectroscopy, and titrimetry. Multivariate regression modeling of chromatic parameters versus geochemical data elucidated the quantitative relationships between hue variation and iron speciation, revealing the oxygen fugacity-controlled chromogenic processes in this magnesian marble-hosted nephrite system.

2. Geological Setting

The Fugoling mining area is situated within in Ruoqiang County (Xinjiang), China (Figure 1). It lies approximately 11 km south of Milan Bridge and east of Ruoqiang County center, with its central geographic coordinates at 88°48′58.4″ E, 38°54′53.9″ N. The area is accessible via roads, with elevations ranging from 2780 m to 2926 m above sea level. The maximum relative relief within the mining area is approximately 140 m, while the total elevation gains from the valley entrance to the highest point reaches approximately 1600 m. The perennial Milan River, located about 5 km north of the mining area, provides a high-quality water source suitable for drinking. No permanent residents or herders are present in the vicinity. All logistical support for production and daily operations must be supplied from Ruoqiang County town [15].

3. Materials and Methods

3.1. Materials

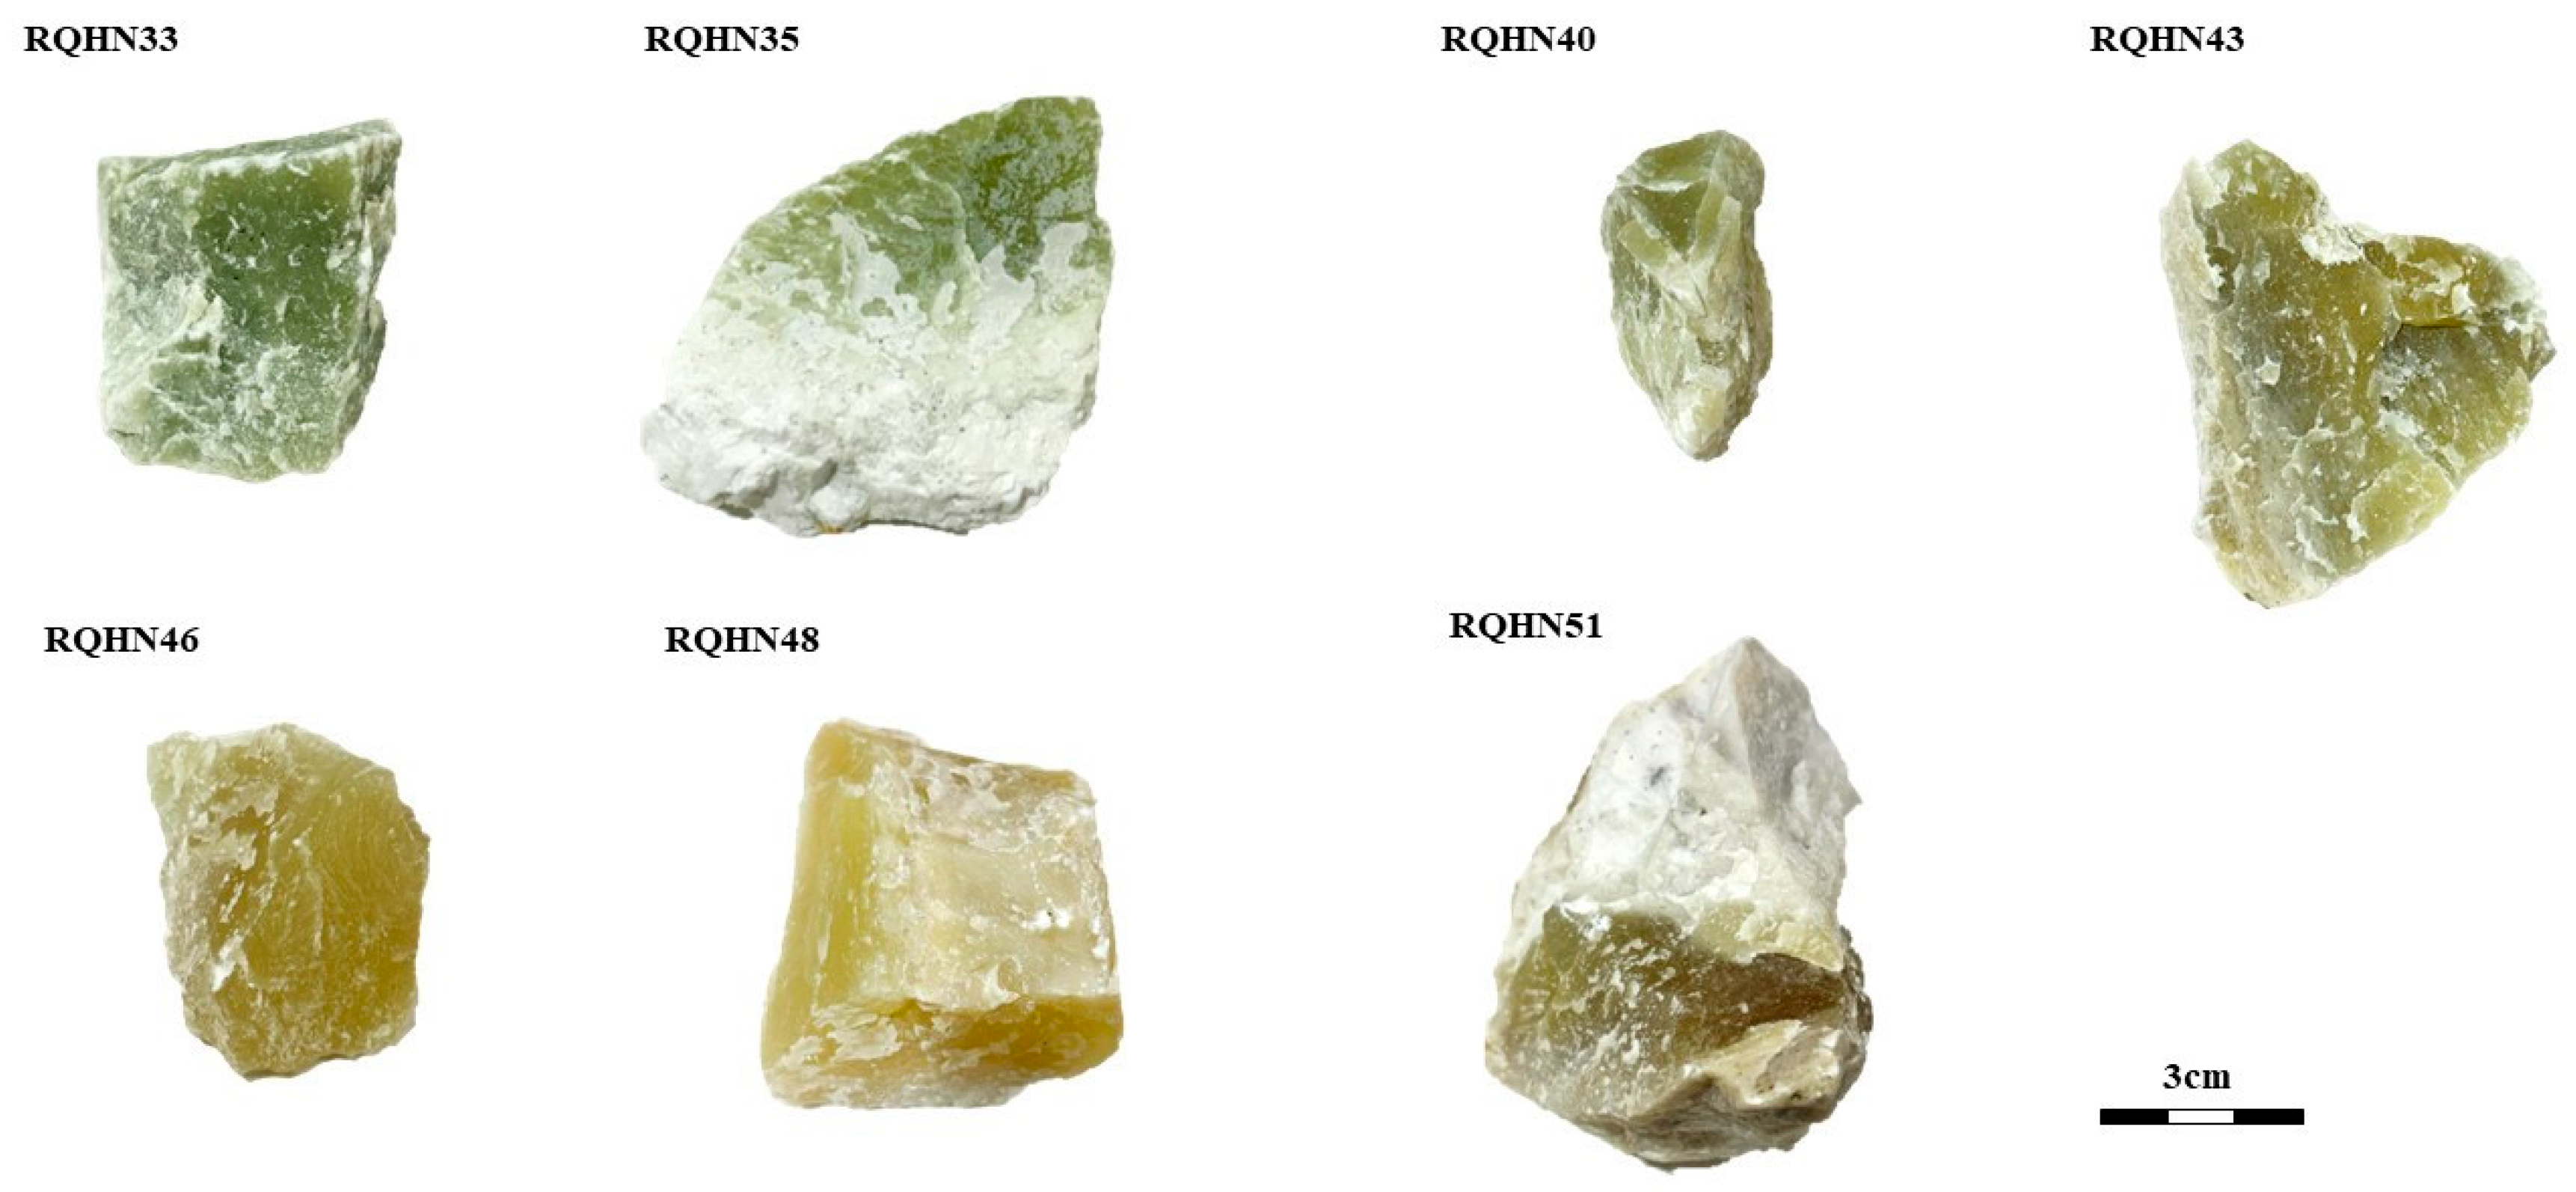
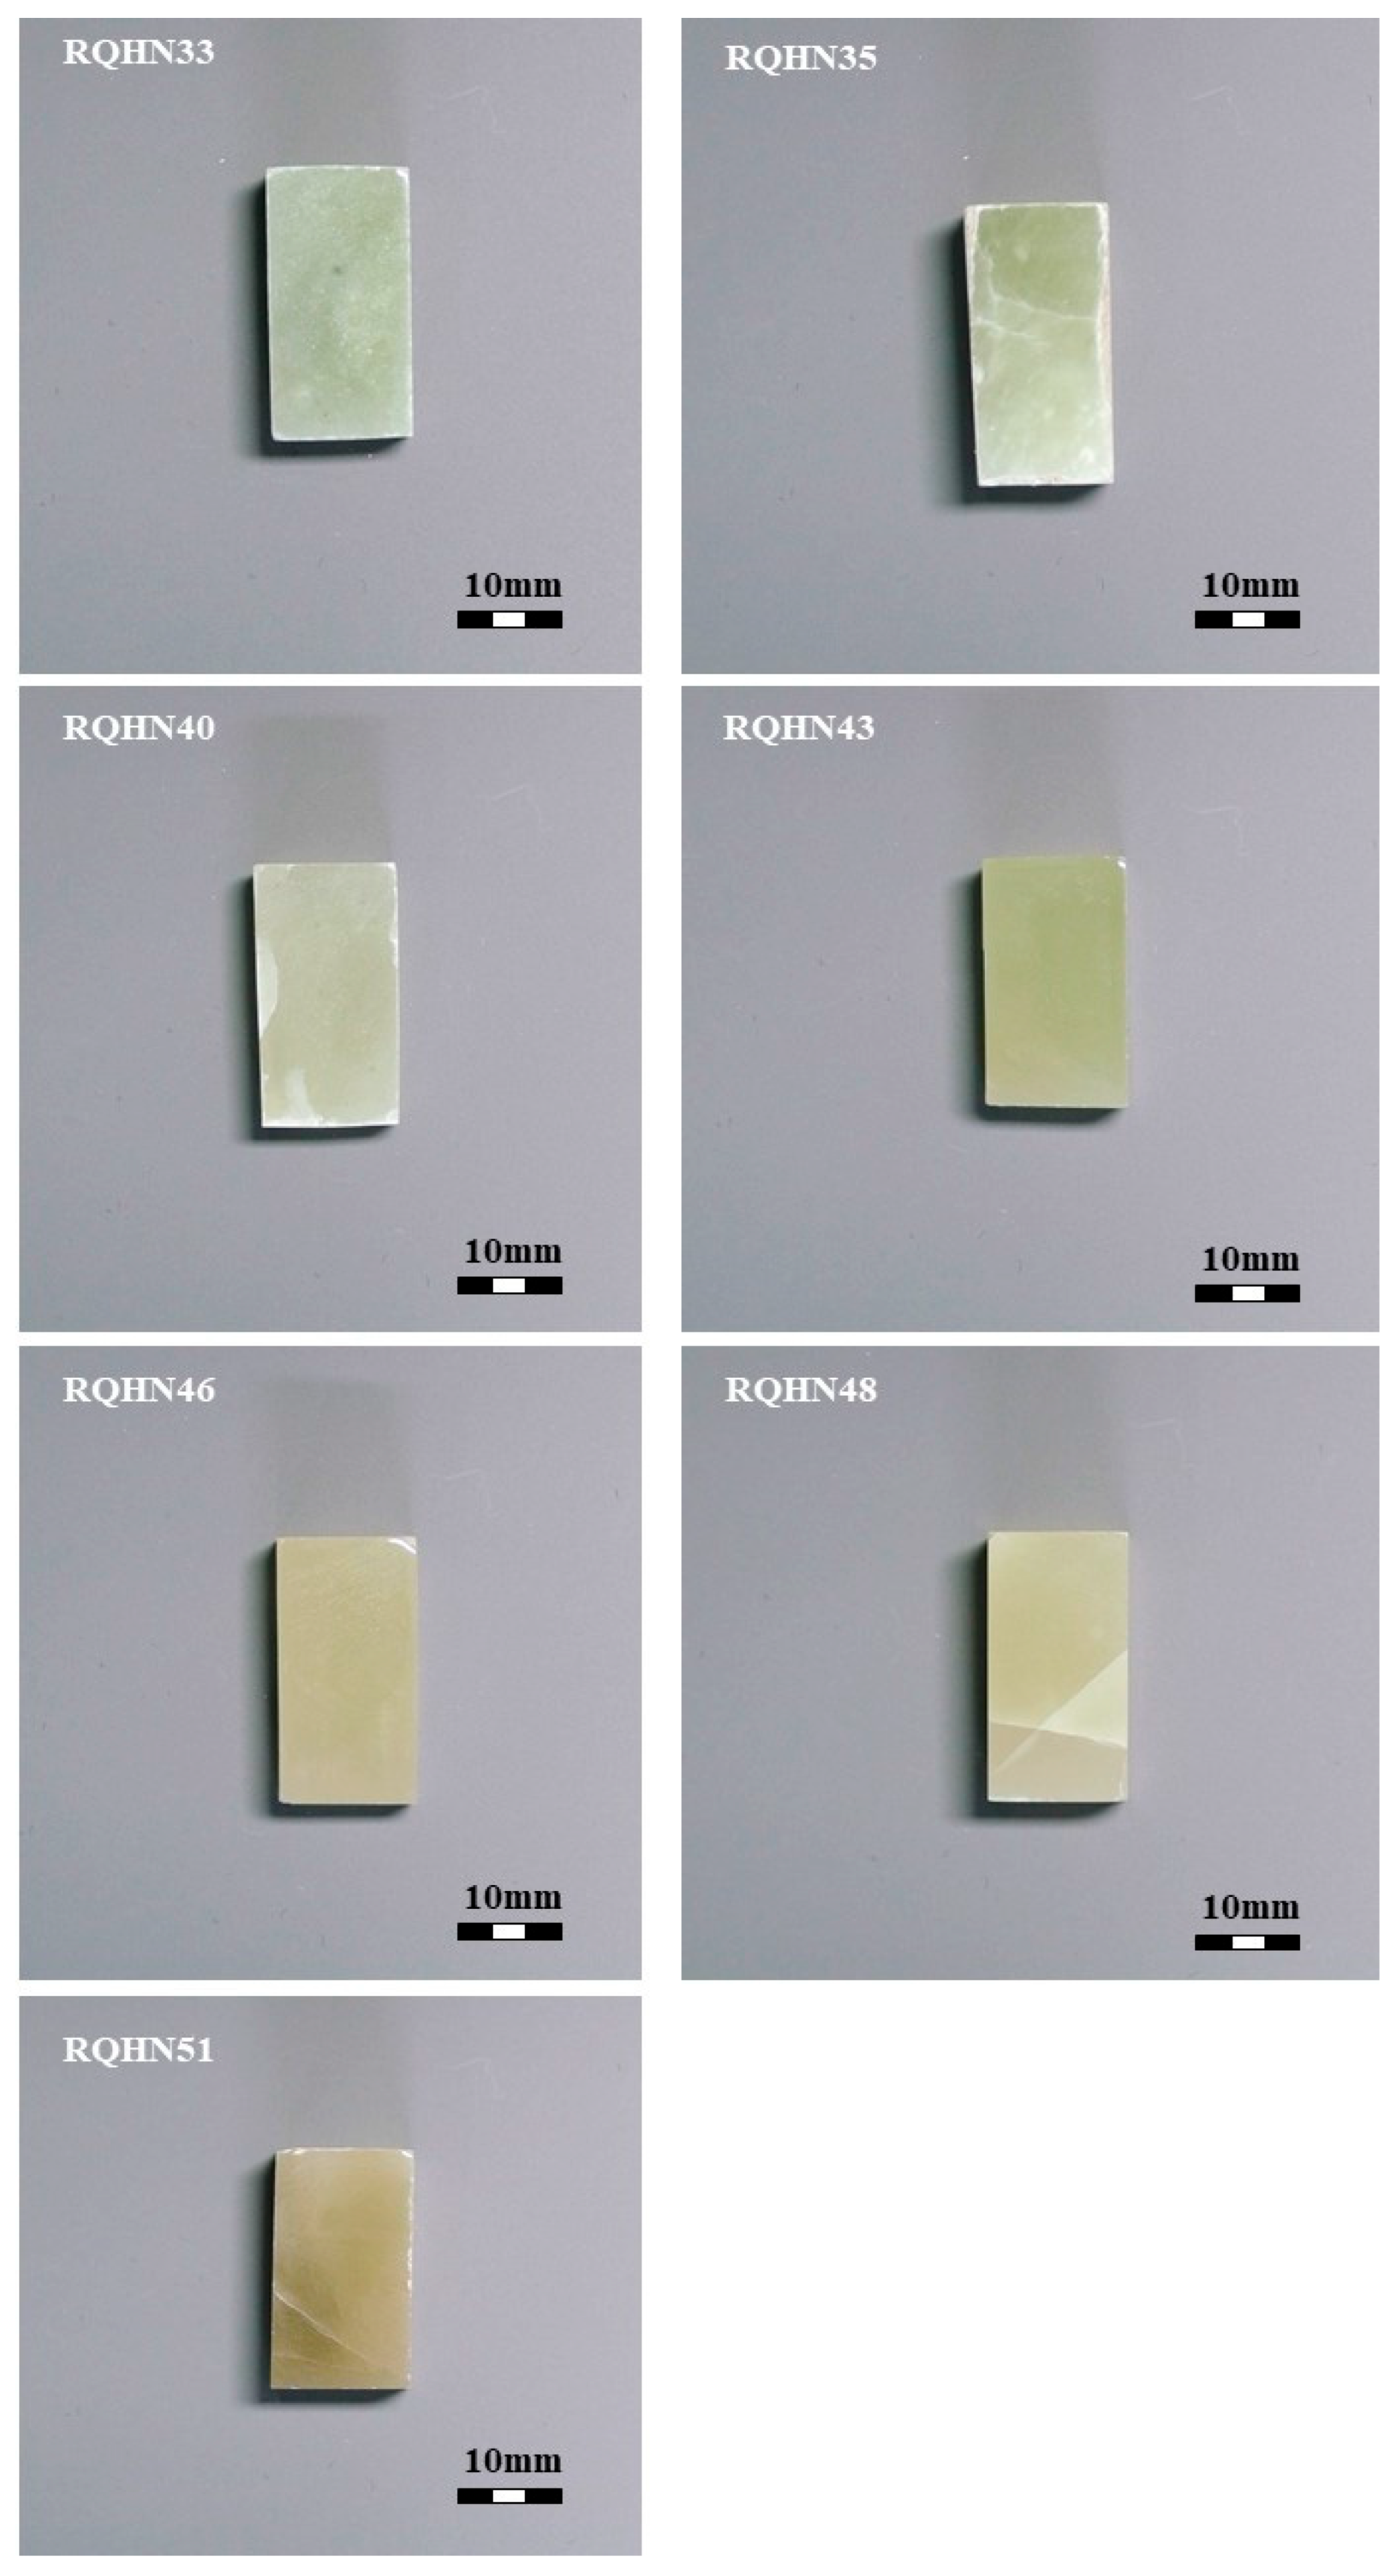
All studied specimens (RQHN33, RQHN35, RQHN40, RQHN43, RQHN46, RQHN48, RQHN51) were collected in Ruoqiang County (Xinjiang), and the morphologies of the rough gems are reported in Figure 2. To enable quantitative colorimetric analysis, all samples were sectioned and polished to standardized dimensions of 20 mm × 10 mm × 8 mm (length × width × thickness) using a precision diamond saw. The prepared samples exhibit a uniform coloration ranging from yellowish to greenish-yellow hues, as shown in Figure 3. Polishing was performed using 0.25 μm diamond suspension on automated polishing equipment.

3.2. Methods

3.2.1. Chromatometric Analysis

The analyses were conducted at the National Jewelry Testing Center (Chongqing), Chongqing Academy of Metrology and Quality Inspection, using a SHIS-V220 hyperspectral imaging system. The spectral range of the system spans from 420 nm to 750 nm, with a LCTF scanning precision of 1 nm and a full width at FWHM of 10 nm at 550 nm. The spectral acquisition protocol adhered to CIE standard illuminant D65 (correlated color temperature 6504 K) with a 10° standard observer geometry, covering the visible spectrum (450–750 nm) at 2 nm intervals. Color parameter conversion to Munsell notation followed ASTM D1535-14 (2023) specifications [16,17,18], implemented through the “Jewelry Color Intelligent Grading System V1.0” software package (NJTC, Chongqing, China).

3.2.2. UV-Vis Spectroscopy

The analyses were conducted at the Gemmological Institute, China University of Geosciences (Wuhan), using a UV-Visible spectrometer model Gem UV-100 (Tianrui, Pizhou, Jiangsu, China), equipped with an integrating sphere, with a wavelength scanning range of 380–780 nm, using a standard BaSO4 whiteboard as a reference, and tested by reflection method. The UV-Vis spectrometer was calibrated daily using a reference.

3.2.3. Raman Spectroscopy

The analyses were conducted at the National Jewelry Testing Center (Chongqing), Chongqing Academy of Metrology and Quality Inspection. The analysis of nephrite was carried out using a Renishaw inVia confocal Raman spectrometer (Renishaw, Gloucestershire, UK). The testing conditions included a laser wavelength of 532 nm, L1800 grating. Each scan lasted 10 s with three accumulations, achieving a resolution of 9–15 cm−1 over a spectral range of 100–4000 cm−1. Raman shifts were calibrated using a single-crystal silicon standard (main peak at 520.5 cm−1), and the results were processed using Wire 4.2 software.

3.2.4. Laser Ablation-Inductively Coupled Plasma Mass Spectrometry (LA-ICP-MS)

The analysis of trace elements was performed at the National Jewelry Testing Center (Chongqing), Chongqing Academy of Metrology and Quality Inspection. The NWR 213 laser ablation system was coupled with a Thermo iCAP RQ mass spectrometer (Thermo, Carlsbad, CA, USA). The carrier gas was helium, and each test included approximately 20 s of background collection followed by 30 s of sample collection. The laser spot size was 45 μm, with a frequency of 10 Hz and energy of 90%. The execution of test steps is undertaken in accordance with the protocol delineated in T/CAQI 134-2020 [19]. NIST SRM 610 and NIST SRM 612 were used as a quality control standard to monitor and correct for instrument sensitivity drift, alongside multiple international standards (BHVO-2G, BCR-2Ga, BIR-1G) for multi-standard calibration, and 29Si was chosen as the normalization element to calibrate all elemental concentrations. LA-ICP-MS analyses were conducted at 23 ± 3 °C and 45 ± 10% relative humidity [8,19].

3.2.5. X-Ray Fluorescence Spectroscopy (XRF) and Titrimetric Analysis

Bulk composition analysis and FeO determination were performed at the National Jewelry Testing Center (Chongqing), Chongqing Academy of Metrology and Quality Inspection and Wuhan SampleSolution Analytical Technology Co., Ltd. (Wuhan, China) For bulk composition analysis, powdered samples were mixed with lithium tetraborate-lithium nitrate flux (8:1 flux-to-sample ratio) in platinum crucibles and fused at 1150–1250 °C for 15 min in a high-temperature furnace. The resulting glass beads were analyzed using a Rigaku ZSX Primus II wavelength-dispersive XRF spectrometer (Rigaku, Tokyo, Japan).
The quantitative determination of FeO was carried out by the following method. Firstly, the powdered sample was eliminated using hydrofluoric acid and sulphuric acid. Secondly, the remaining fluorine in the solution was removed by adding boric acid complexation. Thirdly, the Fe2+ content was titrated with a standard solution of potassium dichromate using sodium dianiline sulfonate as an indicator. Finally, the FeO was calculated.

4. Results

4.1. Chromaticity of Yellow-Green Nephrite

The samples were analyzed using a hyperspectral imaging system (SHIS-V220, spectral range 450–750 nm, resolution 2 nm). The measured CIE 1931 XYZ tristimulus values were converted to Munsell color system (Hue-Value-Chroma, HVC). The sRGB color values were calculated using Equation (1) [20]. The sRGB is a color standard that achieves a wide range of colors through variations in the three color channels of red (R), green (G), and blue (B), as well as their overlaps. sRGB represents the colors of these three channels. This standard encompasses almost all colors perceivable by human vision and is one of the most widely used color systems.
sR sG sB = 3.2404542 1.5371385 0.4985314 0.9692660 1.8760108 0.0415560 0.0556434 0.2040259 1.0572252 X Y Z
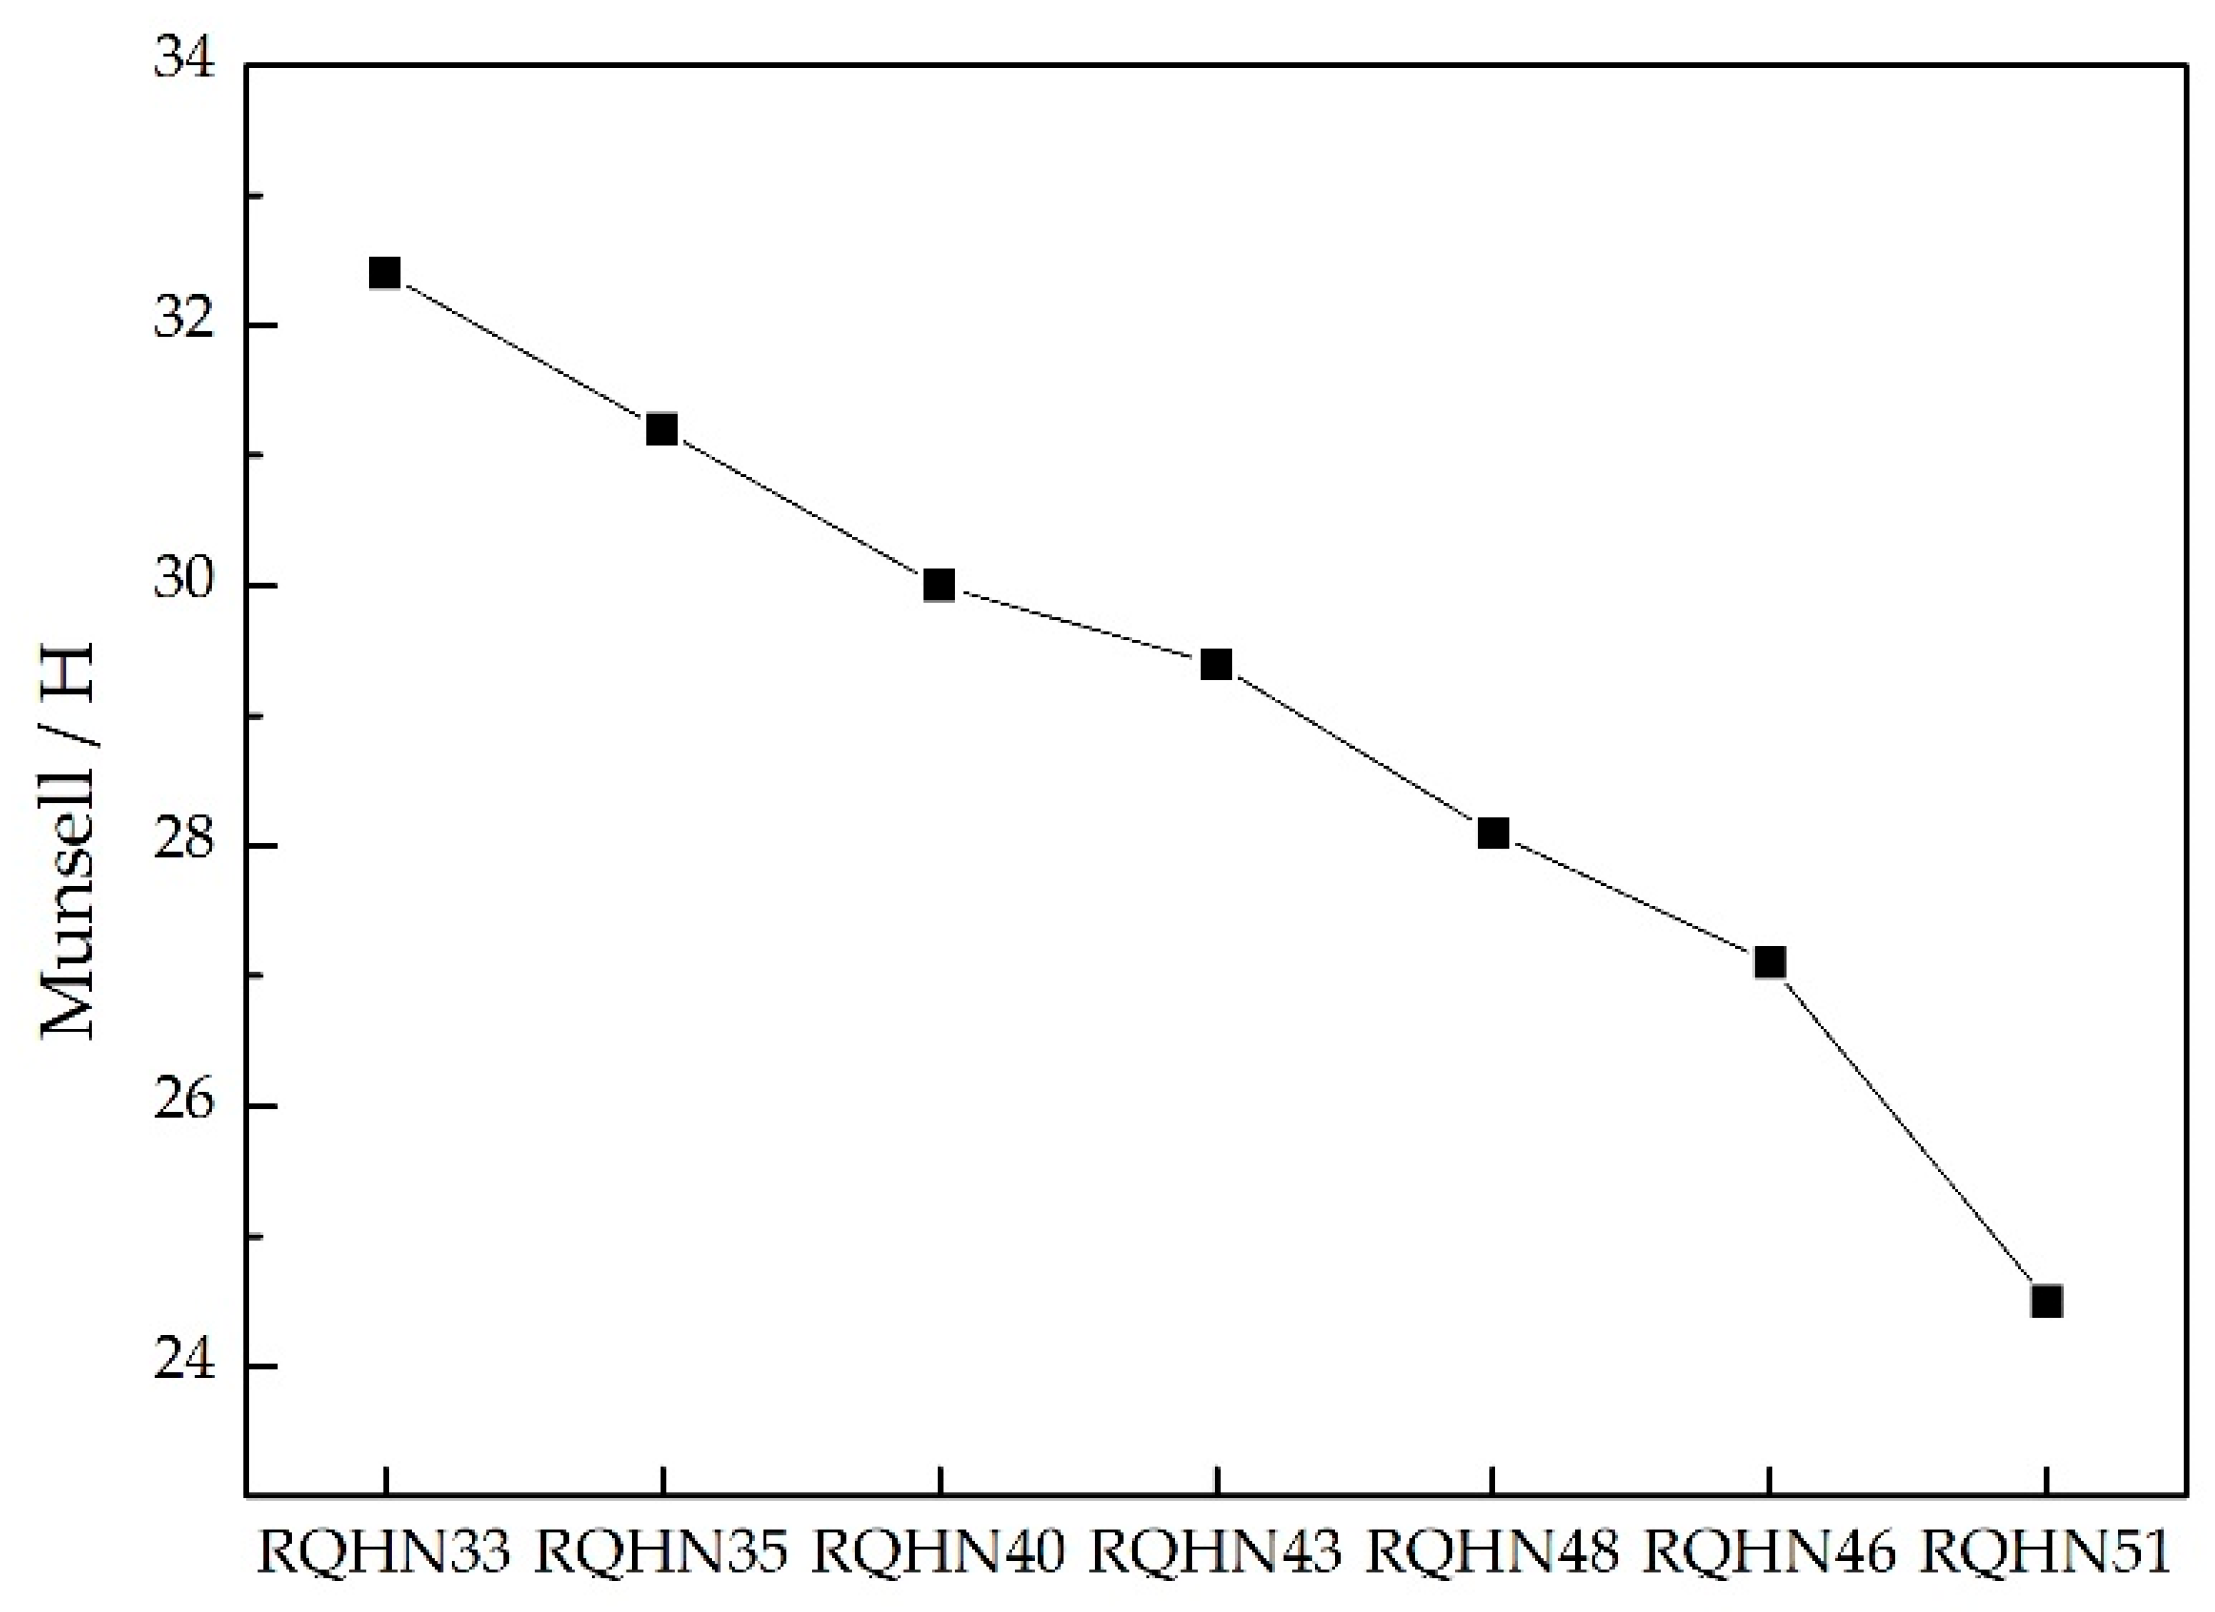
The resulting chromatic parameters are summarized in Table 1. Normalized color coordinates were plotted on the CIE 1931 chromaticity diagram (Figure 3), revealing that all seven samples cluster within the yellow-green region. As can be seen from Figure 3, the hue decreases linearly from 32.4 to 24.5 as the hue changes from green to yellow.
In the Munsell color system, H denotes hue, V represents value (lightness), and C indicates chroma (saturation). To facilitate quantitative analysis of coloration mechanisms, the hue values were digitized according to ASTM D1535-14 (2023) specifications [18], enabling simulation of sample-specific chromatic profiles (Table 2). The studied samples exhibit distinct yellow-green hues, with hue values uniformly distributed between 24.5 and 32.5 (Figure 4, Table 2). Statistical analysis reveals relatively constant value (Vave = 6.10, σ = 0.36) and chroma (Cave = 4.20, σ = 0.46) values across the sample set, while hue variation accounts for 78.3% of total chromatic variance (principal component analysis with Varimax rotation, λ1 = 0.783). This predominant hue variation provides an optimal basis for establishing quantitative chromophore-correlation models through multivariate regression analysis.

4.2. Spectroscopic Characteristics of Yellow-Green Nephrite

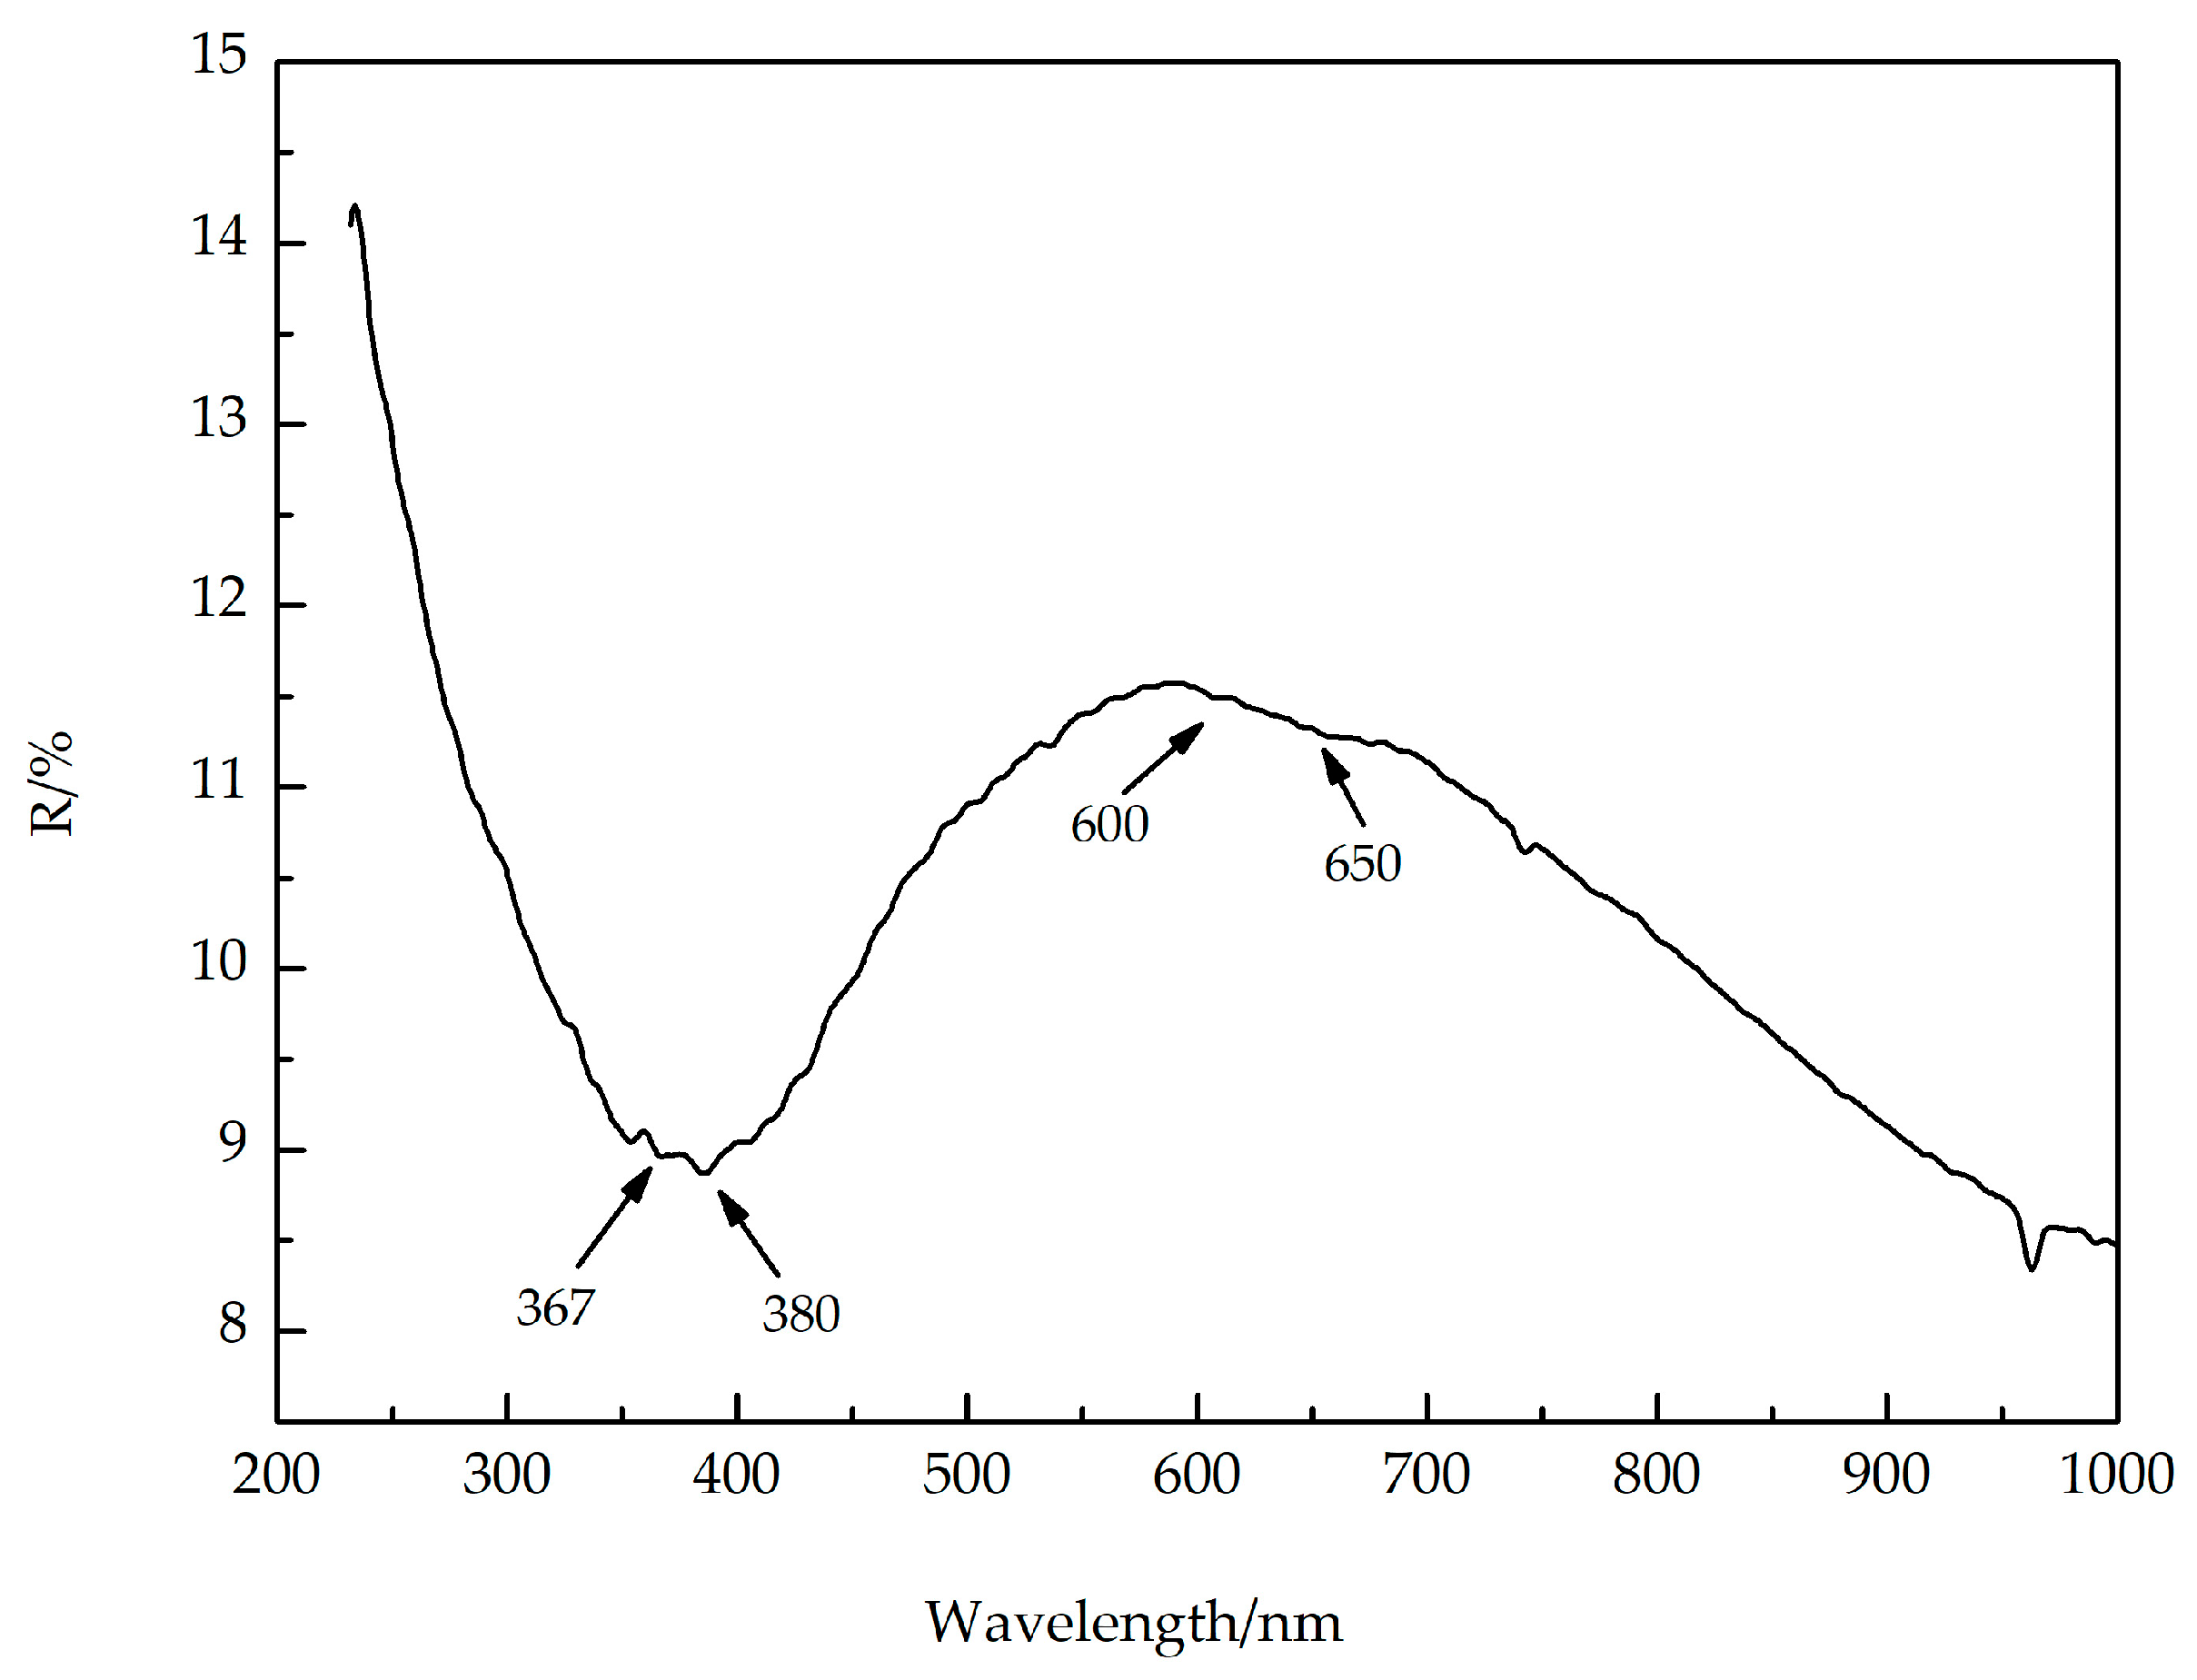
The UV-Vis absorption spectra of the samples are shown in Figure 5. The samples RQHN33 and RQHN35 exhibit a broad absorption band between 600 and 650 nm, while all samples display prominent absorption in the 300–400 nm range, along with sharp peaks at 730 nm and 950 nm. These spectral features indicate that the yellow-green coloration arises from selective absorption in the blue-violet (300–400 nm) and red (600–650 nm) regions, consistent with subtractive color theory.
The broad 600–630 nm absorption band is attributed to Fe2+→Fe3+ intervalence charge transfer (IVCT) occurring between adjacent octahedral sites [21], and the absorption bands at wavelengths of 650 nm are associated with Cr3+ [22]. The 300–400 nm absorption corresponds to Fe3+ ligand-to-metal charge transfer (LMCT) between Fe3+ and O2− ligands. Specifically, the absorption peaks at 367 nm and 380 nm are assigned to crystal field transitions of Fe3+: 6A14E(D) and 6A14T2(D), respectively [23,24].
All samples exhibit Fe3+-O2− LMCT features, confirming the ubiquitous presence of Fe3+ in the tremolite lattice. Notably, the greenish samples (RQHN33, RQHN35) demonstrate enhanced Fe2+→Fe3+ IVCT intensity (IVCT/LMCT ratio = 1.25 ± 0.15). This suggests that the greenish hue arises from increased Fe2+ content, facilitating stronger IVCT interactions, while the dominant yellow component reflects Fe3+-dominated LMCT processes.
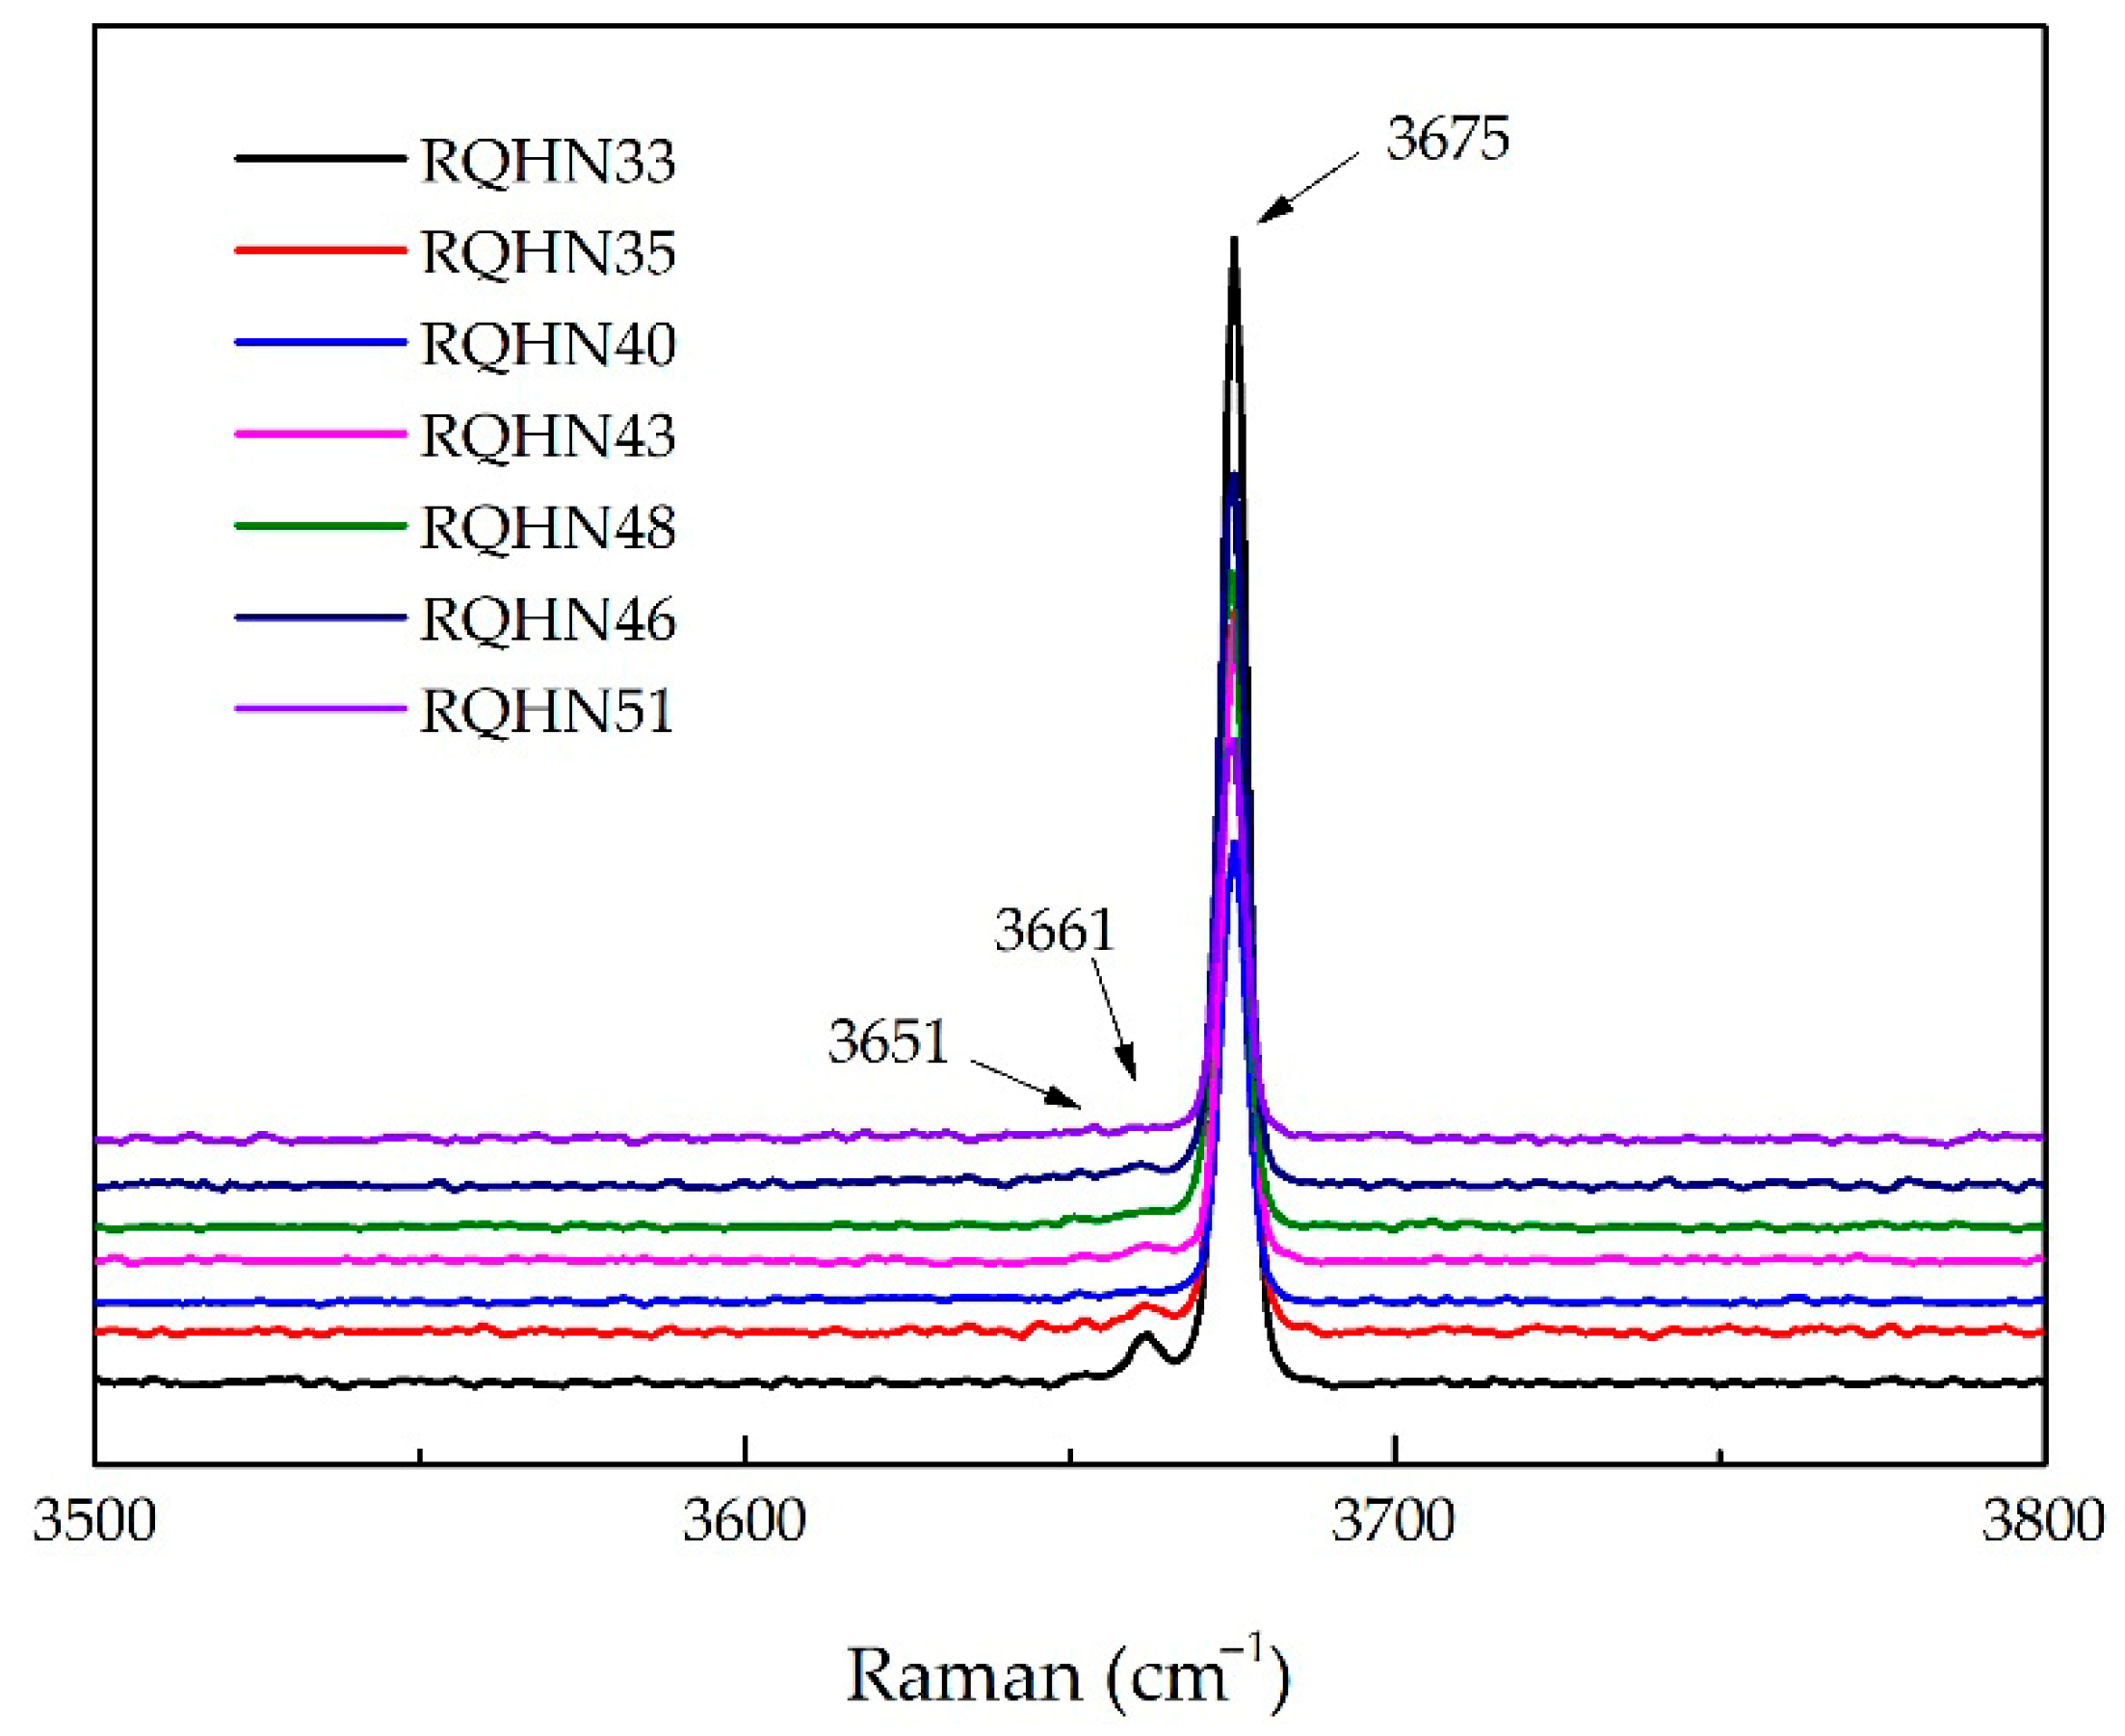
Raman spectroscopic analysis was conducted on polished yellow-green nephrite samples. While nephrite exhibits characteristic Raman peaks in two distinct regions (150–1200 cm−1 and 3500–3800 cm−1), this study focused on the high-frequency region (3500–3800 cm−1) to investigate the chromophore-related M–OH stretching vibrations, as the low-frequency region (150–1200 cm−1) primarily corresponds to SiO4 tetrahedral vibrations [8,25].
In the tremolite structure (ideal formula: Ca2Mg5Si8O22(OH)2), the high-frequency Raman shifts are attributed to M–OH stretching modes, where M denotes octahedrally coordinated cations at the M(1) and M(3) sites. Under ideal Mg2+ occupancy, these sites are fully occupied by Mg2+. However, partial substitution by Fe2+ and Fe3+ at these sites induces distinct spectral changes (Figure 6, Table 3):
  • Fe2+ substitution at M(1) and M(3)sites enhances green hues through crystal field effects [26];
  • Fe3+ substitution at M(1) and M(3) sites intensifies yellow coloration via charge transfer mechanisms [26].
The Raman spectra (Figure 6) reveal a prominent 3661 cm−1 peak in sample RQHN33, attributed to ν(OH)-Mg2+ stretching. Quantitative analysis of the 3651 cm−1 peak (assigned to ν(OH)-Fe3+) demonstrates a systematic increase in its relative intensity (Table 4) with yellow hue enhancement. The 3651 cm−1/(3661 cm−1 + 3651 cm−1) intensity ratio correlates positively with Fe3+ content.
These results confirm that the yellow-green coloration arises from competitive occupancy of Fe2+ and Fe3+ at the M(1) and M(3) sites, with Fe3+ proportion governing yellow intensity through electron-hole recombination processes.

4.3. Bulk Composition and Trace Element Analysis of Yellow-Green Nephrite

4.3.1. Bulk Composition Analysis

The major element composition of yellow-green nephrite is presented in Table 5. The samples are predominantly composed of SiO2 (52.51–58.39 wt.%), MgO (20.62–24.75 wt.%), and CaO (13.46–21.03 wt.%), consistent with the theoretical composition of tremolite (SiO2 59.17 wt.%, MgO 24.81 wt.%, CaO 13.81 wt.%). The low total iron content (TFe = 0.13–0.57 wt.%) is partitioned between Fe2O3 (0.03–0.05 wt.%) and FeO (0.10–0.47 wt.%), yielding an Fe2O3 ratio (Fe2O3/TFe) of 0.117–0.233.
We established a linear regression model between hue and Fe2O3 ratio, with the former as the independent variable (x-axis) and the latter as the dependent variable (y-axis). The fitting results (Figure 7, Table 6) demonstrate a high correlation coefficient (R2 > 0.90), indicating a good linear relationship. The proposed chromatic model is expressed as Equations (2) and (3).
Figure 7. Fe2O3 ratio diagram of yellow-green nephrite samples from Ruoqiang County (Xinjiang).
Minerals 15 00961 g007
Table 6. Linear fitting results of hue and Fe2O3 ratio of yellow-green nephrite samples from Ruoqiang County (Xinjiang).
ValueStandard ErrorAdj. R-Square
Intercept0.6510.04890.942
Slope−0.0170.0017
f F e 2 O 3 = 0.017 H + 0.651
f F e 2 O 3 = ω F e 2 O 3 ω T F e
In the equation:
ωFe2O3→Content of Fe2O3, %;
ωTFe→Content of TFe, %;
H→Hue.
This model provides a petrogenetic framework for predicting hue variations in yellow-green nephrite based on Fe3+ content, with implications for gemological quality assessment and metallogenic studies.

4.3.2. Trace Element Analysis

Trace element compositions of the yellow-green nephrite samples are presented in Table 7. The concentrations of Cr (<0.100–56.676 μg/g), Co (0.513–1.975 μg/g), and Ni (0.905–4.548 μg/g) align with typical values for nephrite deposits [25,26,27]. The concentrations of Ti (12.316–63.387 μg/g), Mn (106.807–242.816 μg/g), and Zn (25.779–93.609 μg/g) is relatively high. The main reason for this is that it was formed in the contact metasomatic zone between magnesium marble and intermediate-acidic magmatic rocks, where mineral-rich hydrothermal activity brought in these elements. These elements are mainly hosted by replacing Mg in the tremolite lattice through isomorphism. The total Rare Earth element (ΣREE) content ranges from 3.802 to 5.375 μg/g, consistent with magnesium marble-hosted nephrite systems (2.84–84.81 μg/g) [28]. The chondrite-normalized REE patterns (Figure 8a) exhibit a pronounced right-leaning trend for light REE (LREE: La–Sm), while heavy REE (HREE: Gd–Lu) remain relatively flat. In addition, a distinct negative anomaly of Eu is also observed.
The primitive mantle-normalized spider diagram (Figure 8b) reveals enrichment in large-ion lithophile elements (Rb, U) and depletion in high-field-strength elements (Ba, Th, Sr, Zr, Hf).
  • Low ΣREE content (<10 μg/g);
  • LREE-enriched patterns with negative Eu anomalies;
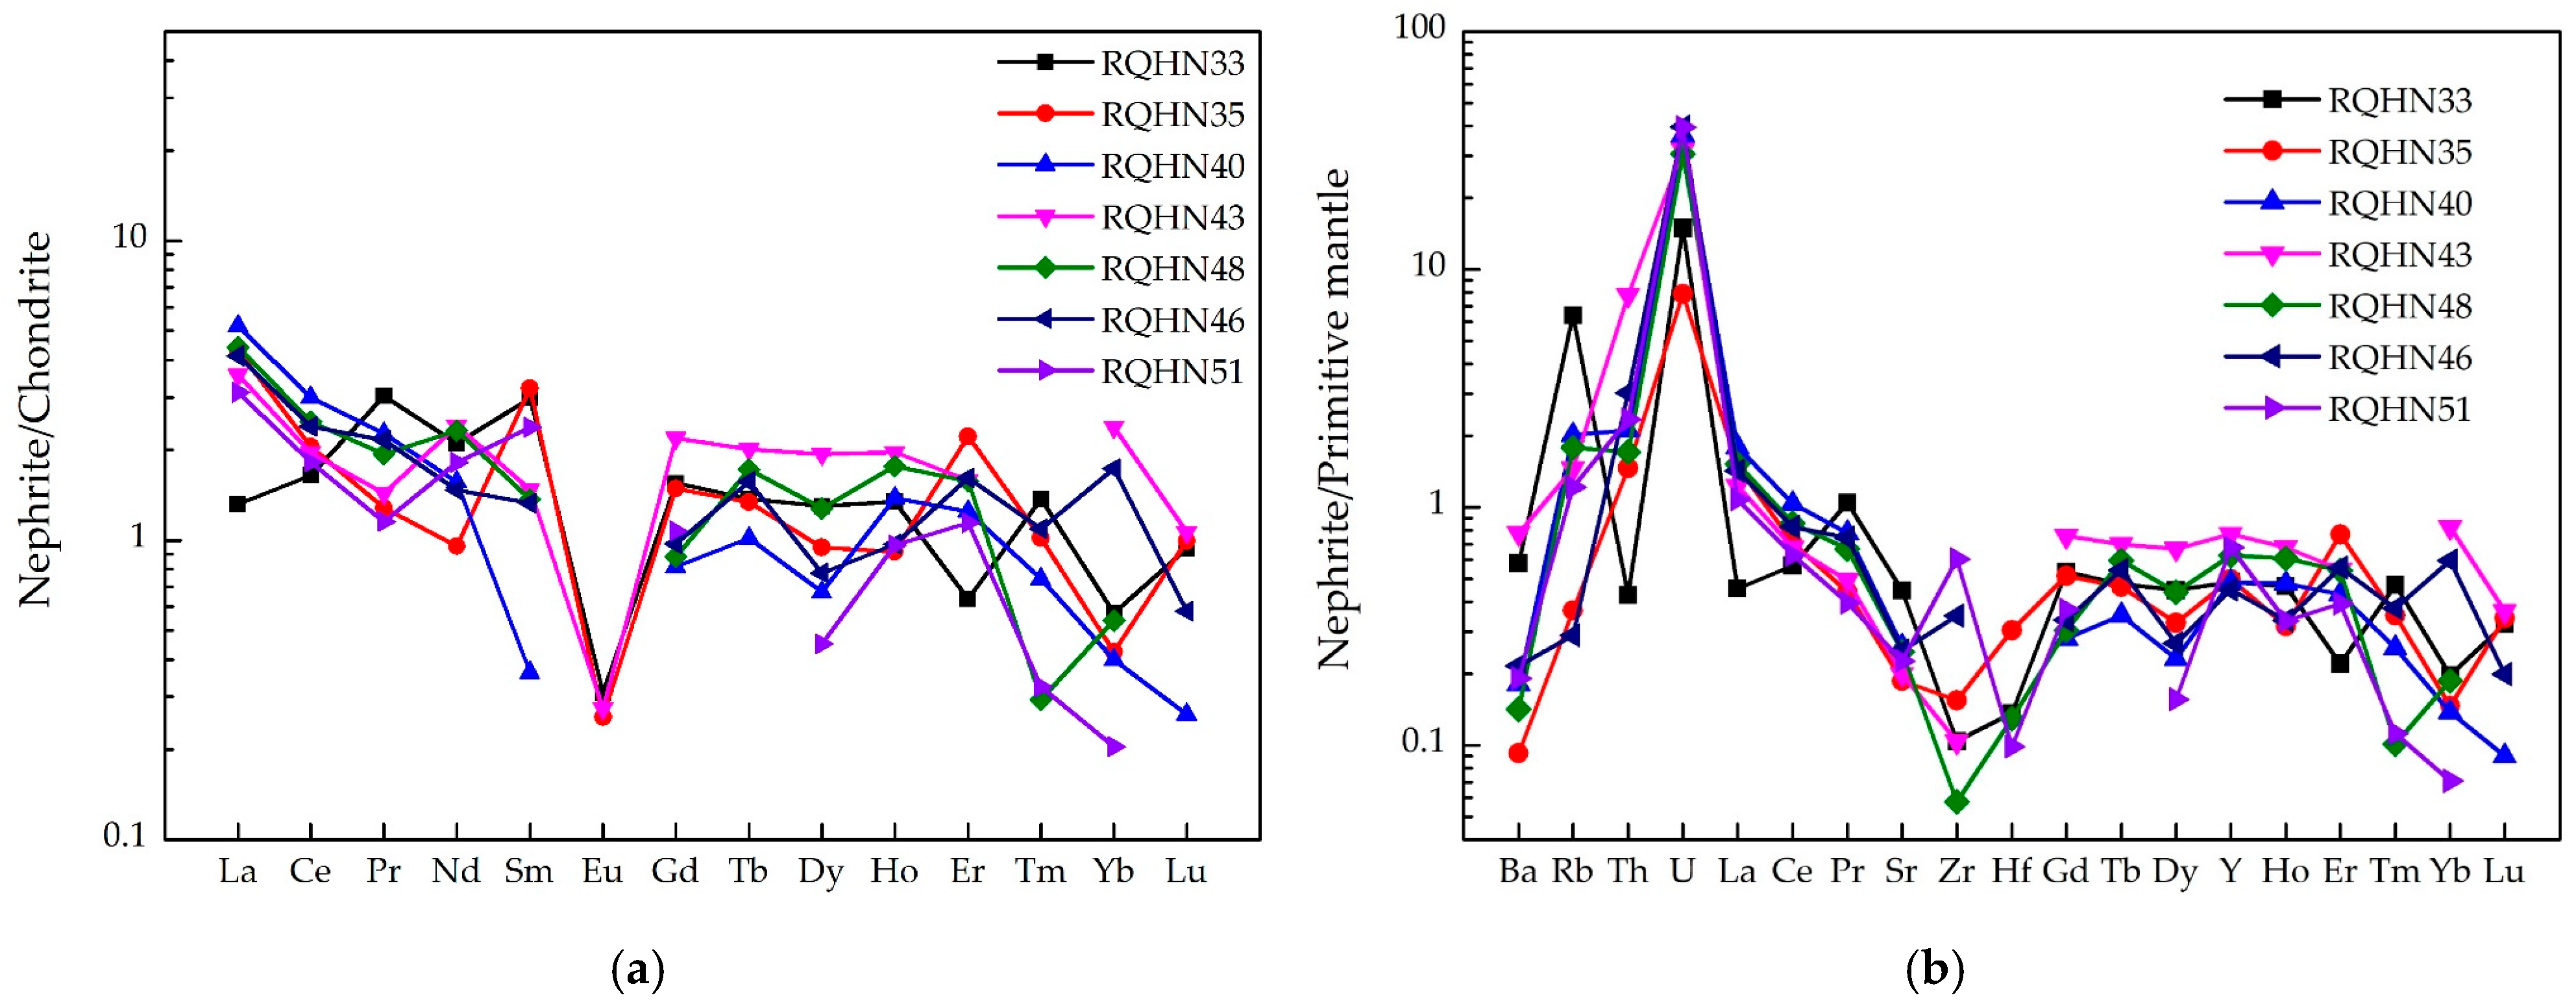
These geochemical signatures are diagnostic of magnesian marble-type nephrite [29,30,31].
Figure 8. (a) Chondrite-normalized trace element diagram of yellow-green nephrite samples from Ruoqiang County (Xinjiang); (b) Normalized trace element diagram of primitive mantle of yellow-green nephrite samples from Ruoqiang County (Xinjiang). Normalizing values of Rare Earth and trace elements are from Sun and McDonough [32].
Minerals 15 00961 g008

5. Discussion

5.1. Coloration Mechanism Analysis

The coloration mechanism, primarily determined by Fe3+, as revealed in this study, is consistent with the hypotheses proposed by Du et al. [10] and Zhang et al. [8]. On this basis, a color model incorporating hue and the Fe2O3/TFe ratio was developed, allowing for the quantitative determination of the hue of yellow-green nephrite through fitting methods. This evidence contrasts with the coloration mechanism determined by Bai et al. [13] in Guangxi nephrites, which instead appears to be Fe2+; this difference may result from regional environmental variations that form the minerals: the highly oxidized conditions of the magnesian marble rock in the Ruoqiang deposit favor the enrichment of Fe3+, while the fluid metamorphic environment in southern China may retain more Fe2+ [29]. Notably, although the TFe content in our nephrites (0.13%–0.57%) is significantly lower than that in traditional green nephrite (>1.5%) [12], even slight changes in the Fe2O3 ratio (0.117–0.233) can trigger marked hue shifts (H = 24.5–32.5), implying that the content of Fe2O3 in tremolite has a certain influence on the yellow hue. The intensity variations in the M-OH stretching vibration peak (3651 cm−1) in Raman spectra provide structural evidence for this, as the Fe3+ substitution at the M1/M3 sites may alter the vibration modes of the hydroxyl [25].
Ultraviolet-visible spectroscopy analysis shows that the yellow-green color of nephrite is determined mainly by electronic transition processes. The 300–400 nm absorption band is attributed to the electronic transitions of 6A14E(D) and 6A14T2(D) of Fe3+, reflecting charge transfer between Fe3+ and O2−. This absorption band causes the absorption of blue-violet light, enhancing the yellow-green hue. The 600–630 nm absorption band corresponds to Fe2+→Fe3+ charge transfer, mainly in greener samples (RQHN33, RQHN35). This transition may be related to the coexistence of Fe2+ and Fe3+ in adjacent octahedral sites [21]. Tremolite, a monoclinic crystal, has M1 and M3 sites in its structure that can be occupied by Fe2+ or Fe3+. According to crystal field theory, Fe3+ has low d-d transition energy in an octahedral field, producing absorption bands in the visible light range that affect color. In this study, Raman spectroscopy revealed that as Fe3+ proportion increases, the intensity of the 3651 cm−1 peak significantly strengthens, indicating that the Fe3+ occupancy at the M1/M3 sites greatly influences the M-OH vibration modes, providing crystallochemical evidence for the Fe3+ coloration mechanism.

5.2. Relationship Between Ore-Forming Environment and Color Genesis

In this study, the Rare Earth element distribution pattern and trace element abundances (enriched in Rb, U, and depleted in Ba, Th, Sr, Zr, Hf), further confirmed that the Ruoqiang yellow-green nephrite belongs to magnesian marble-type deposits [29,30,31], and formed through contact metasomatism between basic rocks and carbonate rocks [33]. Furthermore, this ore-forming environment may influence the genesis of color through the following pathways:
  • Oxidation-reduction conditions: The ore-forming fluid in Ruoqiang, Xinjiang, has a high oxygen fugacity, which favors the oxidation of Fe2+ to Fe3+, thereby increasing the proportion of this ion. The oxidation may result from regional metamorphism or magma-fluid interaction; under high-temperature and high-pressure conditions, Fe2+ and Fe3+ distribution is controlled by oxygen fugacity and fluid composition, and Fe3+ is more stable and color-determining under high oxygen fugacity conditions.
  • Fluid composition and temperature-pressure conditions: High SiO2 activity in ore-forming fluid may affect Fe site selection during tremolite crystallization. In Si-rich conditions, Fe3+ prefers the M1 site, altering M-OH vibration modes. Regional metamorphism may change crystal field splitting energy, affecting Fe3+ d-d transition energy. Higher temperatures may enhance Fe3+ charge transfer intensity, deepening the yellow hue.
  • Influence of country rock properties: The country rock of Ruoqiang in Xinjiang is mainly composed of magnesian marble with high MgO content, which can inhibit the entry of Fe2+ and promote Fe3+ enrichment. This interaction between the properties of the country rocks and the ore-forming fluid is a key factor in yellow-green hue formation. Additionally, intermediate-acidic igneous rocks in the contact zone can provide additional Fe inputs into the ore-forming system through hydrothermal activity.

6. Conclusions

This study, combining colorimetry, spectrometry, and major/trace element analysis, has established for the first time a quantitative model linking hue to the amount of Fe3+ in yellow-green nephrite from Ruoqiang County (Xinjiang). Results show that the color is mainly due to Fe3+ charge transfer (300–400 nm absorption band) and Fe2+→Fe3+ transitions (600–630 nm absorption band). Raman spectroscopy analysis, which determined the intensity of the M-OH vibration peak (3651 cm−1) and quantitative analysis of FeO and Fe2O3, confirmed the key role of Fe3+ occupancy in the tremolitic lattice for color regulation. Furthermore, the formation environment of magnesian marble ore in Ruoqiang, characterized by high oxygen fugacity, was found to be the main factor controlling Fe3+ enrichment and the formation of the yellow-green hue, offering new theoretical insights into the color genesis of yellow-green nephrite.

Author Contributions

Conceptualization, M.Y. and B.H.; methodology, B.H. and M.Y.; software, B.H.; experiment, B.H., X.W. and X.Y.; formal analysis, B.H.; investigation, B.H., M.Y., H.H. and S.W.; resources, M.Y., H.H. and S.W.; writing—original draft preparation, B.H.; writing—review and editing, B.H., M.Y. and T.F.; project administration, M.Y. All authors have read and agreed to the published version of the manuscript.

Funding

This research was funded by Chongqing Administration for Market Regulation, grant number CQSJKJDW2024003, CQSJKJDW2023046 and CQSJKJDW2023045. This research was also funded by Chongqing Academy of Metrology and Quality Inspection, grant number 2023 (Yan)-07. This research was also funded by China University of Geosciences (Wuhan), grant number 2024XLB5 and CIGTXM-04-S202303. This research was also funded by China Scholarship Council, grant number 202406410064. This research was supported by a grant from the Major Programs of the National Cultural Heritage Administration of China [The study of civilizational processes in the middle reaches of the Yangtze River (Xia, Shang and Zhou periods)], Heritage Protection Letter [2020] No. 444.

Data Availability Statement

The data presented in this study are available in the article.

Acknowledgments

The authors are grateful to Junyu Li, Ling Liu, Yan Jiang, Jifu Liu, and Li Liu for the help and valuable suggestions.

Conflicts of Interest

Author Hongwei Han was employed by the company Urumqi Silk Road Deyuan Mining Co., Ltd. Author Shoucheng Wang was employed by the company Ruoqiang Tiantai Mining Co., Ltd. The remaining authors declare that the research was conducted in the absence of any commercial or financial relationships that could be construed as a potential conflict of interest.

References

  1. Liu, Y.; Zhang, R.; Abuduwayiti, M.; Wang, C.; Zhang, S.; Chonghui, S.; Zhang, Z.; He, M.; Zhang, Y.; Yang, X. SHRIMP U–Pb Zircon Ages, Mineral Compositions and Geochemistry of Placer Nephrite in the Yurungkash and Karakash River Deposits, West Kunlun, Xinjiang, Northwest China: Implication for a Magnesium Skarn. Ore Geol. Rev. 2015, 72, 699–727. [Google Scholar] [CrossRef]
  2. Zhang, B.; Gao, Y.; Wang, M.; Shen, M.; Ke, J.; Zhang, J. GB/T 16552-2017; Gems-Nomenclature. Standards Press of China: Beijing, China, 2018.
  3. Harlow, G.; Sorensen, S.S. Jade: Occurrence and Metasomatic Origin. In Proceedings of the 31st International Geologic Congress, Rio de Janeiro, Brazil, 6–17 August 2000. [Google Scholar]
  4. Harlow, G.E.; Sorensen, A.S.S. Jade (Nephrite and Jadeitite) and Serpentinite: Metasomatic Connections. Int. Geol. Rev. 2005, 47, 113–146. [Google Scholar] [CrossRef]
  5. Prokhor, S. The Genesis of Nephrite and Emplacement of the Nephrite-Bearing Ultramafic Complexes of East Sayan. Int. Geol. Rev. 1991, 33, 290–300. [Google Scholar] [CrossRef]
  6. Kim, S.J.; Lee, D.J. A Mineralogical and Gemological Characterization of the Korean Jade from Chuncheon Korea. J. Geol. Soc. Korea 1986, 22, 278–288. [Google Scholar]
  7. Yui, T.-F.; Kwon, S.-T. Origin of a Dolomite-Related Jade Deposit at Chuncheon, Korea. Econ. Geol. 2002, 97, 593–601. [Google Scholar] [CrossRef]
  8. Zhang, X.; Feng, Y.; Zhang, Y.; Maituohuti, A. Characterization of Yellow—Green Hetian Jade in Qiemo-Ruoqiang, Xinjiang. Rock Miner. Anal. 2022, 41, 586–597. [Google Scholar]
  9. Liu, Y.; Zhang, R.; Zhang, Z.; Shi, G.; Zhang, Q.; Abuduwayiti, M.; Liu, J. Mineral Inclusions and SHRIMP U–Pb Dating of Zircons from the Alamas Nephrite and Granodiorite: Implications for the Genesis of a Magnesian Skarn Deposit. Lithos 2014, 212–215, 128–144. [Google Scholar] [CrossRef]
  10. Du, S.; Yang, M.; Feng, X.; Su, J. Gemmological Characteristics and Cause of Colour of Huangkouliao Nephrite. J. Gems Gemmol. 2017, 19, 1–8. [Google Scholar]
  11. Xifeng, L.; Gil, G.; Yan, L.; Xuemei, H.; Xiaochao, S. Timing of Formation and Cause of Coloration of Brown Nephrite from the Tiantai Deposit, South Altyn Tagh, Northwestern China. Ore Geol. Rev. 2021, 131, 103972. [Google Scholar] [CrossRef]
  12. Gao, S.; Bai, F.; Heide, G. Mineralogy, Geochemistry and Petrogenesis of Nephrite from Tieli, China. Ore Geol. Rev. 2019, 107, 155–171. [Google Scholar] [CrossRef]
  13. Bai, F.; Li, G.; Lei, J.; Sun, J. Mineralogy, Geochemistry, and Petrogenesis of Nephrite from Panshi, Jilin, Northeast China. Ore Geol. Rev. 2019, 115, 103171. [Google Scholar] [CrossRef]
  14. Bai, F.; Du, J.; Li, J.; Jiang, B. Mineralogy, Geochemistry, and Petrogenesis of Green Nephrite from Dahua, Guangxi, Southern China. Ore Geol. Rev. 2020, 118, 103362. [Google Scholar] [CrossRef]
  15. Zhang, Y. Geological Survey Report on the Fuguo Ridge Jade Mine in the Milan River, Ruoqiang County, Xinjiang; The Third Geological Brigade of the Xinjiang Geological and Mineral Bureau: Urumqi, China, 2002.
  16. Xu, F.; Xu, H.; Wang, Y. A New Conversion Algorithm between Munsell Color Order System and CIE1931 Standard Colorimetric System. Acta Photonica Sin. 2007, 36, 650–6545. [Google Scholar]
  17. Jin, Q. Mechanized Conversation of Munsell Notation to CIE Coordinates. J. Guangxi Univ. 1988, 2, 70–76. [Google Scholar]
  18. ASTM D1535-14(2023); Standard Practice for Specifying Color by the Munsell System. ASTM International: Philadelphia, PA, USA, 2023.
  19. Zhu, Y.; Wang, X.; Huang, B.; Yang, T. T/CAQI 134-2020; Gems-Determination of Trace Element-Laser Ablation-Inductively Coupled Plasma Mass Spectrometry. Standards Press of China: Beijing, China, 2020.
  20. Hill, B.; Fw, V.; Roger, T. Comparative analysis of the quantization of color spaces on the basis of the CIELAB color-difference formula. Acm Trans. Graph. 1997, 16, 109–154. [Google Scholar] [CrossRef]
  21. Michail, N.T.; Monika Koch-Muller Klaus, L. Electronic Absorption Spectroscopy of Natural (Fe2+, Fe3+)-Bearing Spinels of Spinel s.s.-Hercynite and Gahnite-Hercynite Solid Solutions at Different Temperatures and High-Pressures. Phys. Chem. Miner. 2005, 32, 175–188. [Google Scholar] [CrossRef]
  22. Kislov, E.V.; Erokhin, Y.V.; Popov, M.P.; Nikolayev, A.G. Nephrite of Bazhenovskoye Chrysotile–Asbestos Deposit, Middle Urals: Localization, Mineral Composition and Color. Minerals 2021, 11, 1227. [Google Scholar] [CrossRef]
  23. Li, X. The Color Causes and Spectroscopy Characteristics of Sapphire from Shandong ChangLe. J. Grad. Sun Yat-Sen Univ. 2015, 13, 60–73. [Google Scholar]
  24. Chen, C.; Huang, W.; Shao, T.; Shen, C.; Li, Z.; Shen, X. The Study on UV-Vis Spectrum of a Special Color-Changed Sapphire. Spectrosc. Spectr. Anal. 2019, 39, 2470–2473. [Google Scholar]
  25. Guo, L.; Han, J. The IR Analyses of M1 and M3 Cation Occupation of Hetian Jade, Manasi Green Jude and Xiuyan Old Jade. Acta Petrol. Mineral. 2002, 21, 68–71. [Google Scholar]
  26. Pan, N.; Zhang, L.; Wu, Y.; Song, Y. Study on the Color Classification of Hetian Jade by Colorimetry Test and Raman Spectroscopy. J. Hebei Geo Univ. 2023, 46, 16–23. [Google Scholar]
  27. Kostov, R.I.; Protochristov, C.; Stoyanov, C. Micro-PIXE Geochemical Fingerprinting of Nephrite Neolithic Artifacts from Southwest Bulgaria. Geoarchaeology 2012, 27, 457–469. [Google Scholar] [CrossRef]
  28. Fang, T.; Chang, Y.; Yang, M. Nephrite from Xinjiang Qiemo Margou Deposit: Gemological and Geochemical Insights. Minerals 2024, 14, 458. [Google Scholar] [CrossRef]
  29. Grapes, R.; Yun, S.-T. Geochemistry of a New Zealand Nephrite Weathering Rind. New Zealand J. Geol. Geophys. 2010, 53, 413–426. [Google Scholar] [CrossRef]
  30. Liu, Y.; Deng, J.; Shi, G.; Yui, tzen-fu; Zhang, G.-B.; Abuduwayiti, M.; Yang, L.; Sun, X. Geochemistry and Petrology of Nephrite from Alamas, Xinjiang, NW China. J. Asian Earth Sci. 2011, 42, 440–451. [Google Scholar] [CrossRef]
  31. Siqin, B.; Qian, R.; Zhuo, S.; Gan, F.; Dong, M.; Hua, Y. Glow Discharge Mass Spectrometry Studies on Nephrite Minerals Formed by Different Metallogenic Mechanisms and Geological Environments. Int. J. Mass Spectrom. 2011, 309, 206–211. [Google Scholar] [CrossRef]
  32. Sun, S.-S.; McDonough, W.F. Chemical and isotopic systematics of oceanic basalts: Implications for mantle composition and processes. Geol. Soc. Lond. Spec. Publ. 1989, 42, 313–345. [Google Scholar] [CrossRef]
  33. Li, P.; Liao, Z.; Chen, Q.; Qi, L.; Liu, Y. Multiple Solutions of Ore-Forming Fluids of Carbonate Rock-Related Nephrite Deposits Constrained by Hydrogen and Oxygen Isotopes. Minerals 2025, 15, 272. [Google Scholar] [CrossRef]
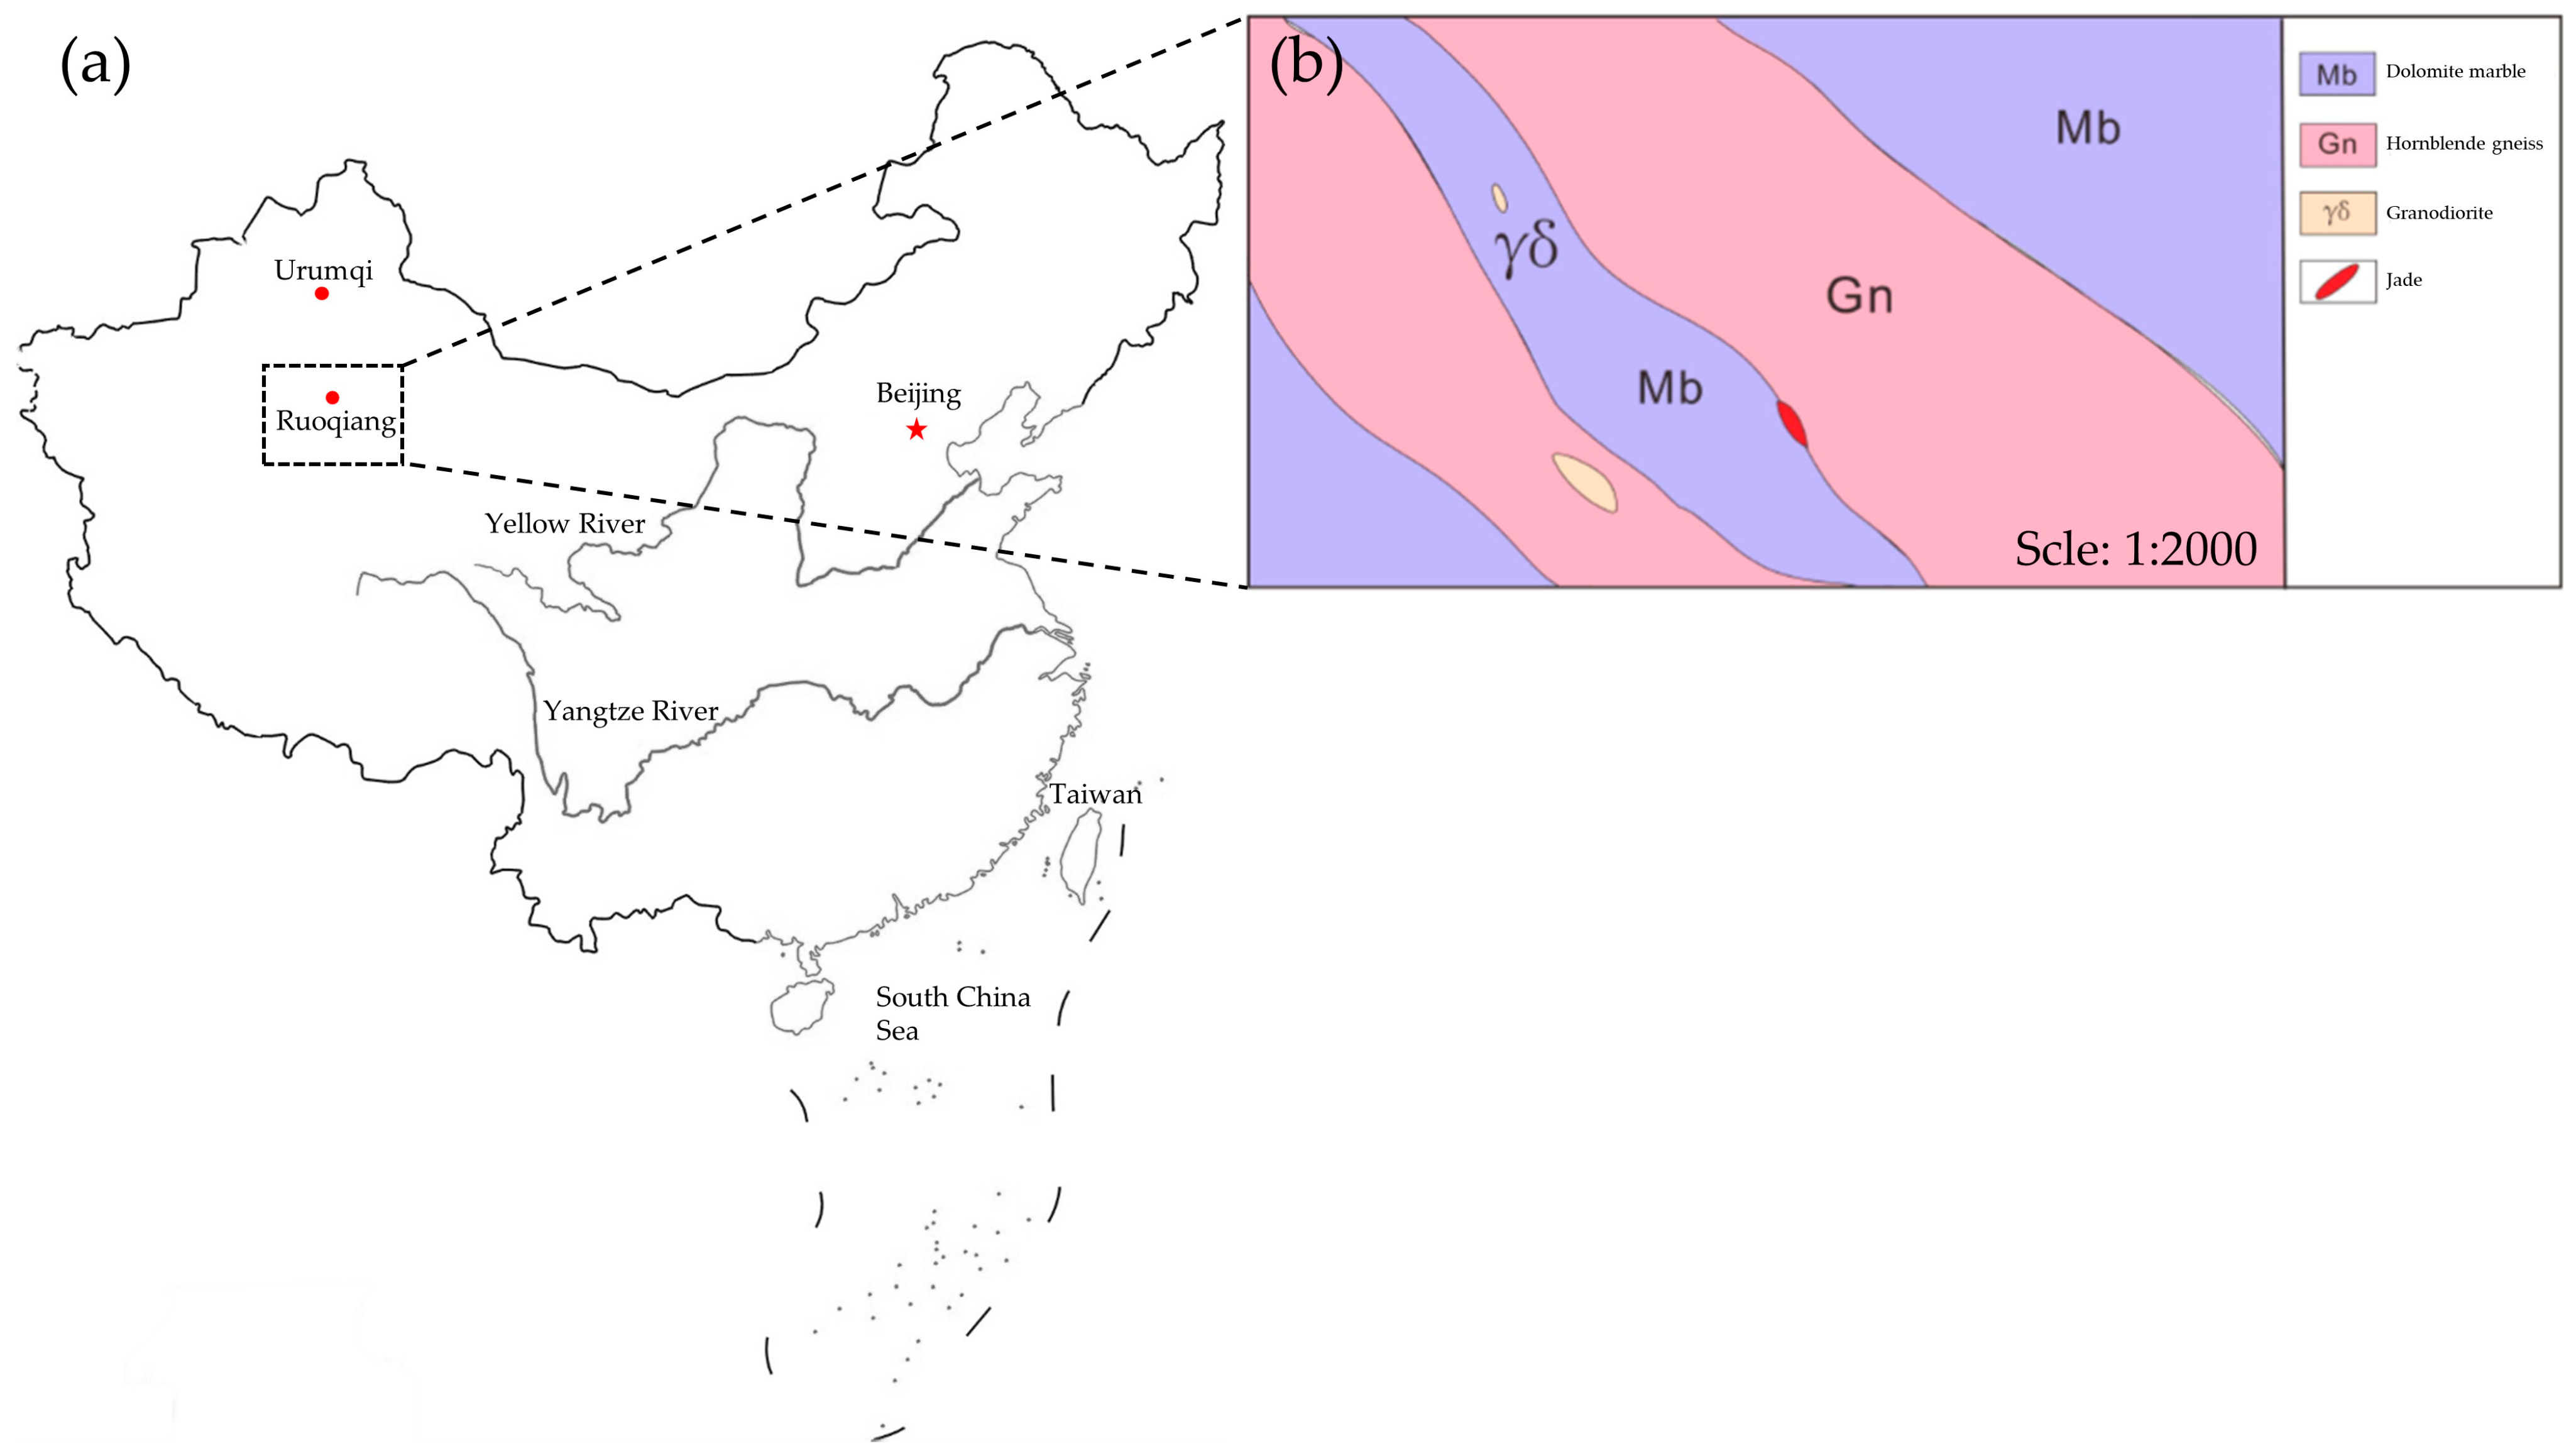
Figure 1. (a) The location of the Fuguoling mining area in Ruoqiang County (Xinjiang), China (within the dashed box in the map); (b) geological map of the Fuguoling mining area [15].
Minerals 15 00961 g001
Figure 2. Yellow-green nephrite raw gems from Ruoqiang (Xinjiang).
Minerals 15 00961 g002
Figure 3. Polished yellow-green nephrite samples from Ruoqiang County (Xinjiang).
Minerals 15 00961 g003
Figure 4. Hue distribution of yellow-green nephrite samples from Ruoqiang County (Xinjiang).
Minerals 15 00961 g004
Figure 5. UV-Vis spectra of yellow-green nephrite samples from Ruoqiang County (Xinjiang).
Minerals 15 00961 g005
Figure 6. Raman spectroscopy (3500–3800 cm−1) of yellow-green nephrite samples from Ruoqiang County (Xinjiang).
Minerals 15 00961 g006
Table 1. Chromatometric information of the polished yellow-green nephrite from Ruoqiang County (Xinjiang).
N.OXYZHVC
RQHN3329.2232.6319.112.4 GY6.363.71
RQHN3524.7227.4813.261.2 GY5.924.42
RQHN4029.2131.7918.5810.0 Y6.293.53
RQHN4325.5927.7914.229.4 Y5.954.05
RQHN4630.9832.9015.717.1 Y6.414.62
RQHN4829.9232.0915.108.1 Y6.334.65
RQHN5121.7322.2910.034.5 Y5.424.43
Table 2. Digital forms of hue and fitted colors.
N.OMunsell/HsRGB
sRsGsBFitted Colors
RQHN332.4 GY32.4160157109
RQHN351.2 GY31.215214588
RQHN4010.0 Y30.0163154107
RQHN439.4 Y29.415614492
RQHN488.1 Y28.117315496
RQHN467.1 Y27.117015394
RQHN514.5 Y24.515112776
Table 3. Raman shift and attribution caused by M-OH stretching vibration in nephrite.
Raman ShiftM-OH
3675 cm−1Mg2+, Mg2+, Mg2+
3661 cm−1Mg2+, Mg2+, Fe2+
3651 cm−1Mg2+, Mg2+, Fe3+
Table 4. The strength of M-OH stretching vibration of yellow-green nephrite samples from Ruoqiang County (Xinjiang).
N.O3651 cm−13661 cm−13651 cm−1/(3661 cm−1 + 3651 cm−1)
RQHN3345025000.15
RQHN3532214150.19
RQHN402135500.28
RQHN432856200.31
RQHN485008330.38
RQHN4676411000.41
RQHN515406320.46
Table 5. Bulk composition analysis of yellow-green nephrite samples (%).
N.ORQHN33RQHN35RQHN40RQHN43RQHN48RQHN46RQHN51
SiO258.2952.5158.3558.3957.8158.3457.31
TiO20.0110.0060.0090.0120.0090.0060.005
Al2O30.750.630.860.670.810.910.90
TFe0.570.330.210.340.130.160.17
MnO0.0310.0210.0150.0190.0160.0140.018
MgO24.6720.6224.5924.6524.7524.7223.13
CaO13.4621.0313.6513.7013.7013.4816.48
Na2O0.160.200.160.140.160.160.19
K2O0.180.050.070.060.060.220.05
P2O50.0080.0160.0100.0130.0120.0180.011
LOI2.035.212.512.532.682.882.05
SUM100.18100.62100.43100.52100.67100.37100.32
FeO0.470.260.170.260.120.100.12
Fe2O30.050.040.030.050.030.030.04
Fe2O3/TFe0.1170.1220.1390.1580.1900.2130.233
Table 7. Trace element compositions of yellow-green nephrite samples from Ruoqiang County (Xinjiang).
Rare
Element
Content (μg/g)
RQHN33RQHN35RQHN40RQHN43RQHN48RQHN46RQHN51
Li2.7845.5042.0613.3520.8712.6461.988
Be1.6432.61310.1545.9957.45411.1674.467
Sc5.0256.3477.9684.0546.5098.2189.571
Ti32.55912.31647.77563.38748.38735.23439.577
V5.8981.242<0.33512.7045.8378.0858.558
Cr5.461<0.1007.159<0.1000.29356.6769.588
Mn242.816118.559106.807153.171120.949122.369121.918
Co1.9751.1280.6360.6670.5030.5131.339
Ni1.5204.5480.9053.8662.4171.7361.557
Cu0.771<0.230<0.2302.904<0.2302.6234.127
Zn93.60976.79038.48847.29949.10654.95425.779
Ga0.6240.6250.7690.7810.9950.9891.515
Rb4.0770.2331.2820.9211.1290.1840.773
Sr9.4013.9255.4884.1955.2035.2524.761
Y2.2022.2622.2053.5072.8472.0573.071
Zr1.1621.727<0.0011.1560.6493.9186.791
Nb0.3770.0470.2820.2020.3210.1640.470
Mo<0.001<0.001<0.001<0.001<0.001<0.0010.227
Ag0.128<0.0270.1040.1560.0790.0790.259
Cd<0.001<0.0010.196<0.001<0.001<0.0010.250
Sn0.5600.9483.4511.9801.0723.1053.874
Sb0.0220.2560.2360.2940.2290.2780.384
Cs0.1760.0660.2330.0820.1500.0790.140
Ba4.0610.6461.2645.4240.9881.5051.333
La0.3131.0221.2320.8441.0450.9790.740
Ce1.0091.2601.8371.2011.5221.4651.116
Pr0.2890.1220.2150.1360.1850.2060.109
Nd0.9820.4460.7311.1251.0860.6860.850
Sm0.4560.4930.0550.2260.2100.2030.365
Eu0.0180.015<0.0010.016<0.001<0.001<0.001
Gd0.3190.3060.1670.4510.1810.2000.221
Tb0.0510.0500.0380.0750.0640.059<0.001
Dy0.3300.2410.1700.4930.3250.1980.114
Ho0.0760.0520.0780.1110.1000.0550.055
Er0.1050.3680.2070.2620.2610.2670.189
Tm0.0350.0260.019<0.0010.0070.0280.008
Yb0.0970.0720.0680.4060.0920.2940.035
Lu0.0240.0250.0070.027<0.0010.015<0.001
Hf0.0420.094<0.001<0.0010.040<0.0010.030
Ta0.059<0.001<0.0010.0520.0550.0090.046
W0.043<0.0010.6620.3610.6450.8810.435
Tl0.021<0.0010.0170.0110.0030.009<0.001
Bi0.018<0.0010.0730.0350.0090.0400.052
Pb0.3450.50919.5141.8301.2161.2980.940
Th0.0360.1240.1790.6640.1450.2580.198
U0.3140.1650.7720.6670.6410.8340.832
LREE3.0493.3424.0713.5324.0473.5383.180
HREE1.0381.1400.7541.8271.0301.1150.622
ΣREE4.1054.4974.8255.3755.0774.6533.802
Disclaimer/Publisher’s Note: The statements, opinions and data contained in all publications are solely those of the individual author(s) and contributor(s) and not of MDPI and/or the editor(s). MDPI and/or the editor(s) disclaim responsibility for any injury to people or property resulting from any ideas, methods, instructions or products referred to in the content.