Abstract
Hessonite, a special variety of grossularite, is well-known for the heat-wave effect, which is a characteristic swirled or roiled interior appearance within the crystal. Although the heat-wave effect has been observed for a long time, it has not been studied in depth. In this study, the gemological properties, mineral compositions, fabric characteristics, and grain sizes of hessonite samples were investigated using infrared spectroscopy, electron backscatter diffraction (EBSD), and energy-dispersive X-ray spectroscopy (EDS). Hessonite exhibits the heat-wave effect and is found to be polycrystal rather than single-crystal, composed of submillimeter-sized granules with random orientation and limited variations in Fe and Al contents. Abundant micropores exist among the granules, indicating imperfect contact among them. Due to these structural features, incident light is interrupted and undergoes changes in direction and speed as it passes through the hessonite granules, grain borders, and micropores. Light reflects off the granules’ surfaces and refracts within the granules, respectively, causing the incident light to swirl and roil within the hessonite and form the heat-wave effect. This study considers that the heat-wave effect is a special optical phenomenon not caused by impurity minerals or inclusions.
1. Introduction
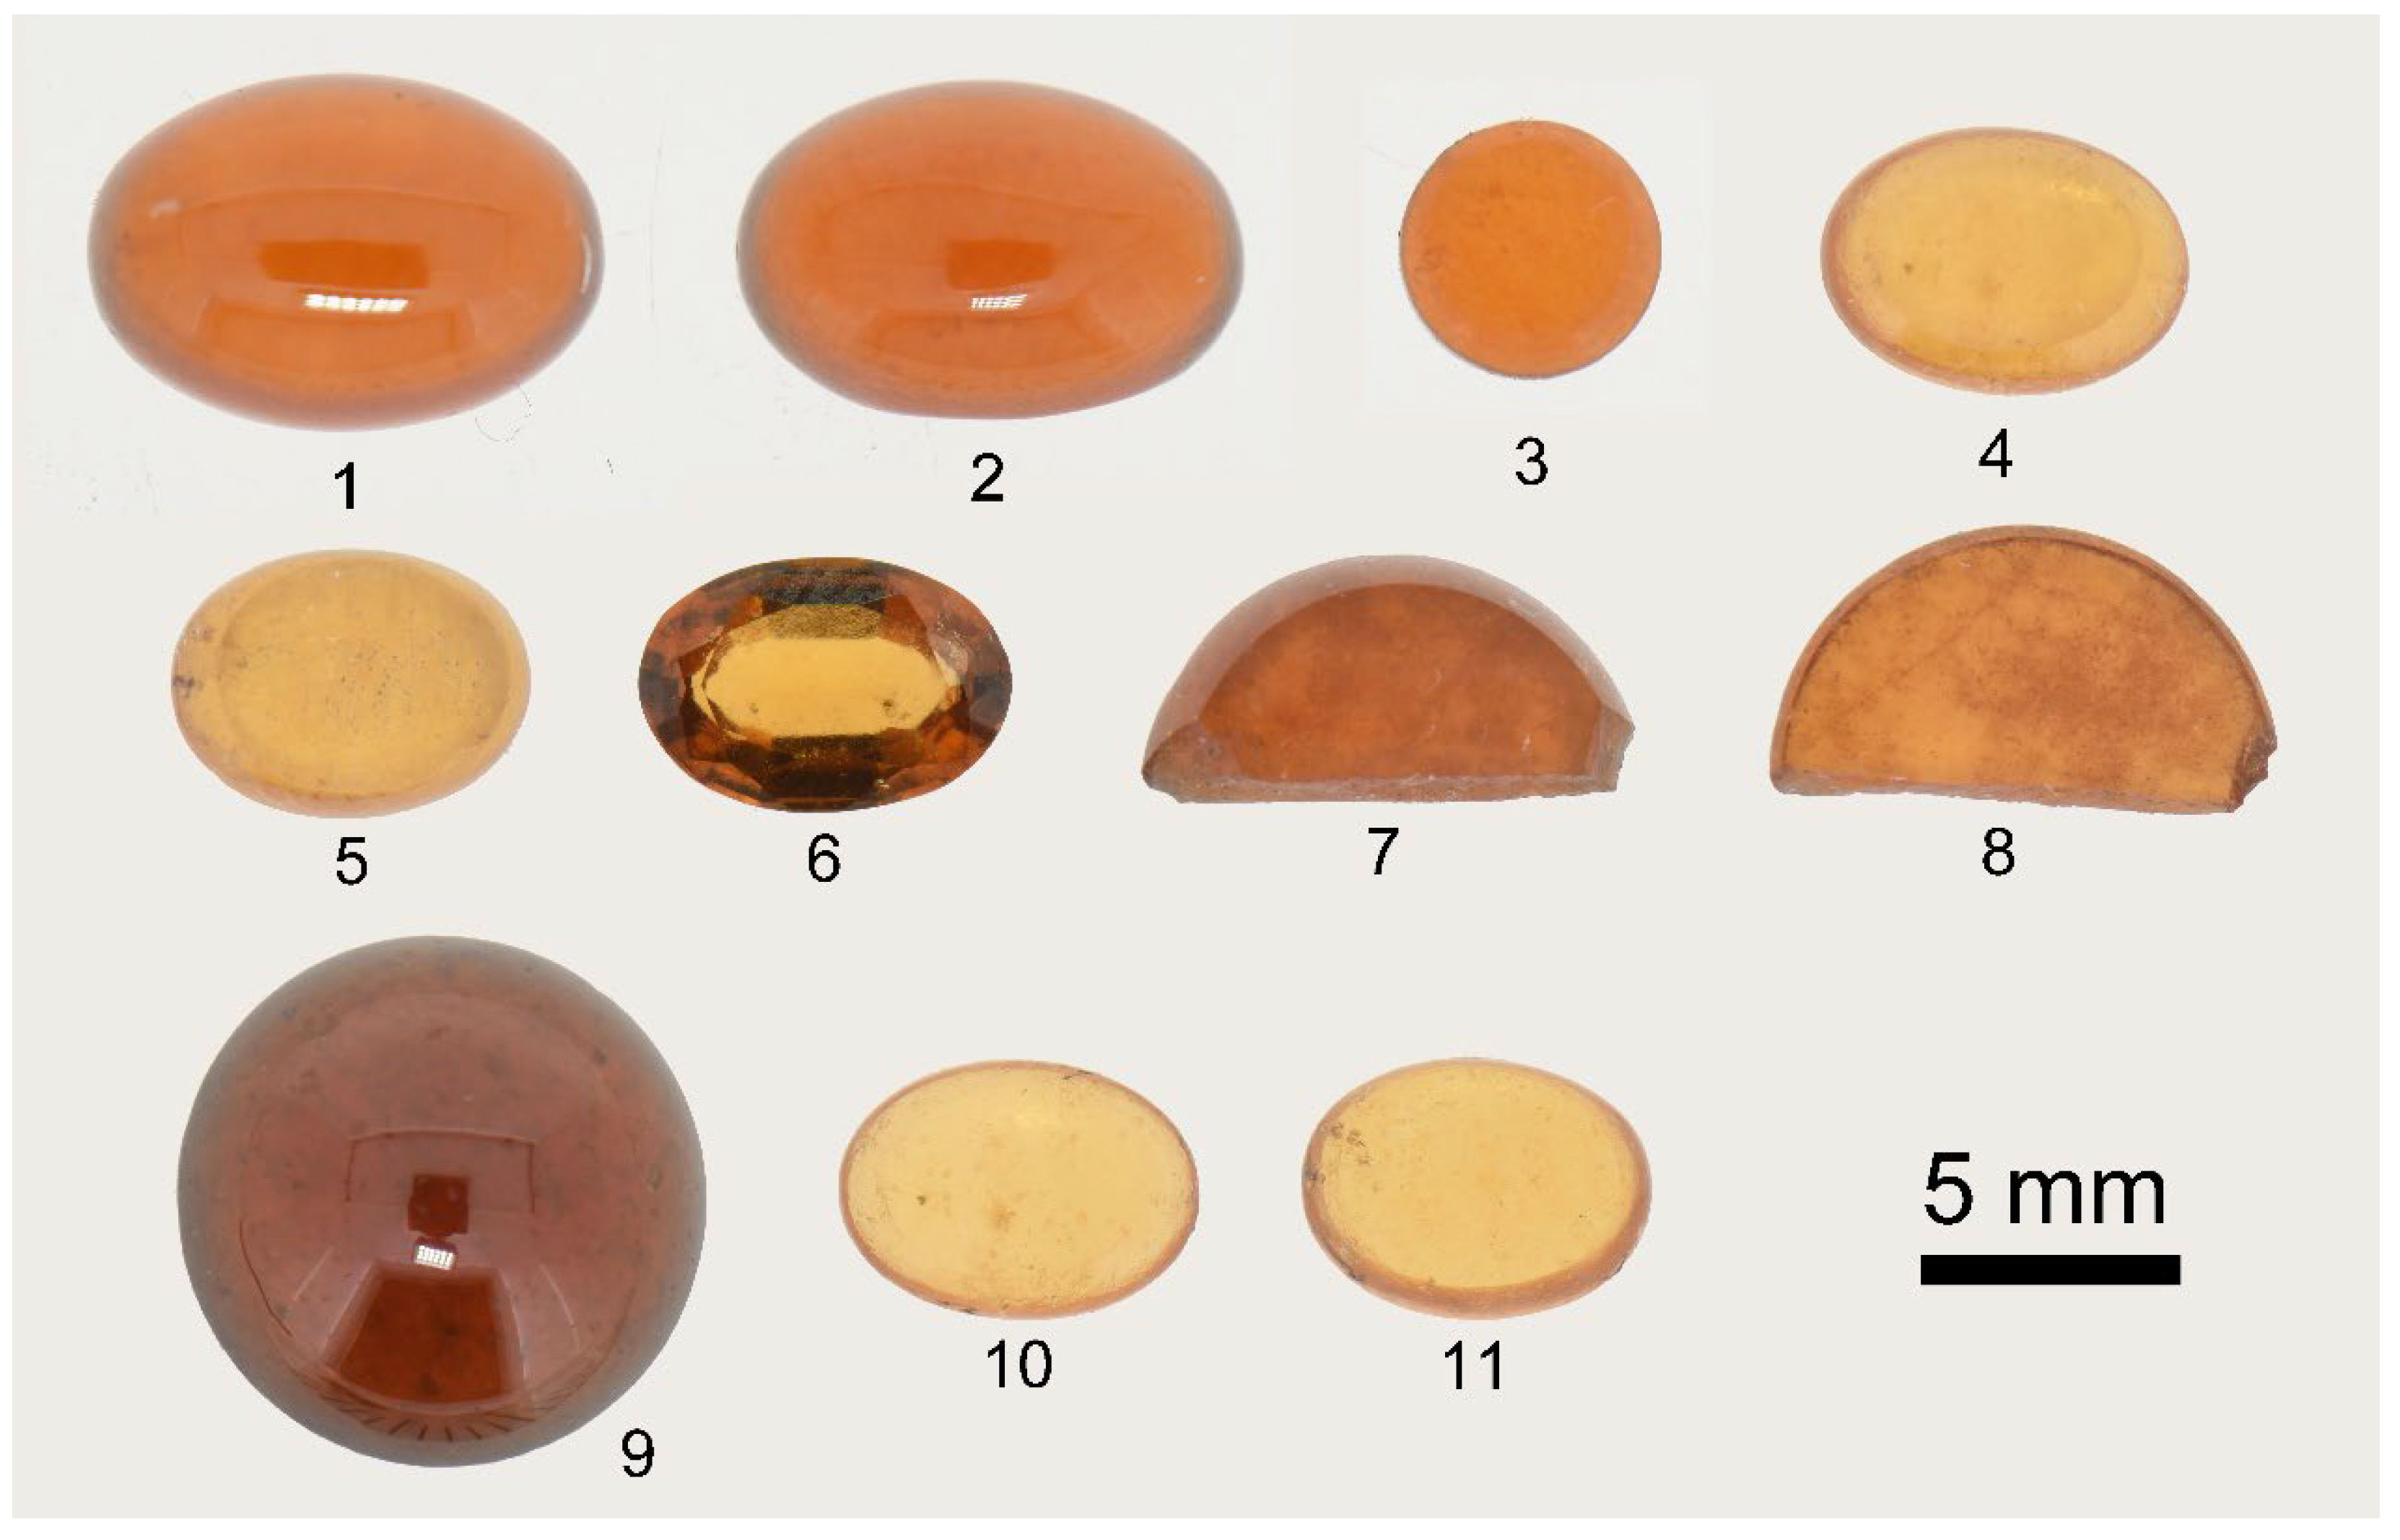
Garnet is a popular single-crystal gemstone with a wide range of isomorphisms forming different species, characterized by the general formula A3B2[SiO4]3 [1,2]. Most garnets belong to two subgroups comprising six species: the pyralspite subgroup (pyrope–almandine–spessartine) and the ugrandite subgroup (grossular–andradite–uvarovite). They have been widely studied on their chemical compositions, classification, color, and spectral characteristics [3,4,5,6]. Grossular is the calcium–aluminum species of garnet with the chemical formula Ca3Al2[SiO4]3. It exhibits a variety of colors, including yellow, orange, and green. The most well-known variety of grossular is hessonite, which typically ranges from brownish red to brownish yellow, and aurora red is particularly prized [4,7,8] (Figure 1).
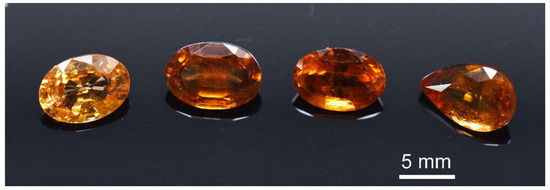
Figure 1.
Orange to brownish orange hessonites.
The internal features of hessonite are highly pronounced and characteristic of this gemstone. The heat-wave effect, also known as a roiled interior appearance (or terms like “oily” appearance, treacle, molasses, and so on), is a distinctive and common feature associated with hessonite, although very few hessonites lack this effect, such as those from Somalia and Afghanistan [7,9,10]. While liquid inclusions and crystals are common in hessonite, they are not exclusive to this gemstone. Another characteristic inclusion in hessonite is the granular texture [8,11]. Gem-quality hessonite is typically mined from secondary deposits, with primary ore deposits located in the high-grade metamorphic khondalite suites or the quartzite–amphibolite contact zones [12].
Hessonite has been well-known for its heat-wave effect for a long time. A strong, roiled appearance will influence its transparency [8]. However, the origin of this unique internal feature remains unclear, with only a limited number of studies briefly discussing it. A relatively common hypothesis attributes the heat-wave effect to tiny transparent crystals, such as zircon and diopside, which appear fused or eroded [11]. Kanis and Redmann (1994) proposed that the heat-wave effect is caused by isomorphic substitution between calcium–aluminum and iron–aluminum garnet species [12]. Hänni (2019) reported that some yellow to orange and green grossulars exhibiting a swirling appearance are polycrystalline materials with a granular structure [8]. Notably, no detailed explanations were provided to explain the nature of this distinctive internal swirling characteristic.
In this study, some hessonite samples are used to investigate the origin of the heat-wave effect. Gemological properties, mineral compositions, fabric characteristics, and grain sizes are analyzed using infrared spectroscopy (IR), energy-dispersive X-ray spectroscopy (EDS), and especially by electron backscatter diffraction (EBSD) to elucidate the formation of the characteristic internal feature.
2. Materials and Methods
Eleven hessonite samples were collected from the jewelry market in Wuhan, China (Figure 2). Since the heat-wave effect is a common internal feature in hessonite from most global localities, i.e., the origin of the hessonites holds no restrictive significance for this characteristic effect, the origin of the studied samples was not investigated. The eleven samples weigh 4.83~11.87 carats (ct). Most are cabochon-cut, except Sample 6, which is faceted. All samples lack information about their original sources. All experiments were performed in the Gemological Institute and the State Key Laboratory of Geological Process and Mineral Resources, in China University of Geosciences (CUG), Wuhan, China.
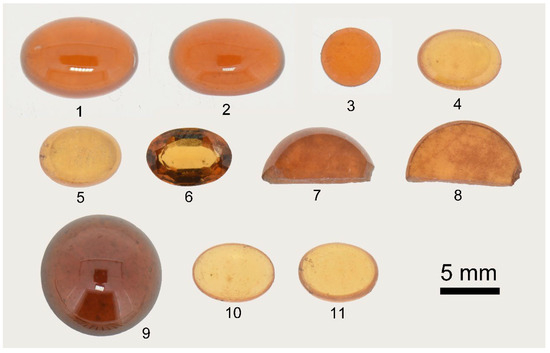
Figure 2.
The 11 studied hessonite samples showing their color range. The top row, left to right, is Samples 1 to 4, the middle row, left to right, is Samples 5 to 8, and the bottom row, left to right, is Samples 9 to 11.
The internal features were observed and photographed using a Leica M205A microscope camera. The refractive index (RI) was measured using a gemological refractometer. Specific gravity (SG) was determined using the hydrostatic method. Ultraviolet fluorescence was observed with UV lamps under long wavelengths (365 nm) and short wavelengths (254 nm).
The Fourier-transform infrared (FTIR) spectra were recorded without orienting the specimens. FTIR spectra were performed using a Bruker Vertex 80 FTIR spectrometer (Bruker, Ettlingen, Germany). The testing range is 400–1200 cm−1 using 220 V scanning voltage, 6 mm raster, 10 kHz scanning rate, 32 scans, and 4 cm−1 resolution, with reflection methods from the Kramers–Kronig transformation method applied.
Electron backscatter diffraction (EBSD), backscattered electron (BSE) imaging, and energy-dispersive X-ray spectroscopy (EDS) experiments were performed using a ThermoFisher Helios G4 CX Focus Ion Beam (FIB) system. Samples 3, 4, 5, 7, and 9 were selected to be critical polished for EBSD testing. They were experimented using an Oxford AZtec Symmetry 2 EBSD detector (Oxford Instruments, High Wycombe, UK) at 25 kV accelerating voltage, 11 nA beam current, ~13 mm working distance, and the sample tilted 70° for EBSD. EDS for simultaneous chemical analyses were made using an Oxford AZtec X-max 80 detector (Oxford Instruments, High Wycombe, UK) at a working voltage of 20 kV. The testing surfaces of the samples were carbon-coated at a 10 nm thickness by a Gatan Model 681 high-resolution ion beam coater. AZtec Crystals 2.1 software was used for EBSD and EDS data analysis, including phase identification, lattice preferred orientation (LPO), grain size, and chemical composition analysis. Pole figures of LPOs are projected with equal area in the lower hemisphere, and contoured with a half-width of 20° and a cluster size of 5°. Fabric strength is quantified by the Multiple of Uniform Distribution (MUD) value. It is a parameter used to quantify the texture strength of a material in EBSD analysis. The MUD value represents the deviation of a specific crystallographic orientation from a uniform (random) distribution. The MUD value is 1 for a random polycrystal distribution and infinity for a uniform or single-crystal orientation.
3. Results
3.1. Gemological Properties and Microscopic Observation
The studied hessonite samples were initially determined using standard gemological methods, including color, refractive index (RI), specific gravity (SG), and characteristic inclusions. Samples 1–3, 7, and 8 are brownish orange; Samples 4, 5, 10, and 11 are brownish yellow; and Samples 6 and 9 are brownish red. The polished surface of each sample exhibits a vitreous luster. The tested RI and SG values of the samples range from 1.740~1.768 to 3.62~3.67, respectively, as listed in Table 1. For cabochon-shaped samples, RI values were recorded to two decimal places using the spot measurement method due to the absence of a flat surface. All samples showed inert fluorescence both under long- and short-wave ultraviolet (UV) fluorescence radiation. Between crossed polarizers, the samples exhibited abnormal birefringence four times upon a 360° rotation. Samples 7 and 8 remained bright when rotated around 360° between crossed polarizers.

Table 1.
Gemological characteristics of the studied hessonite samples.
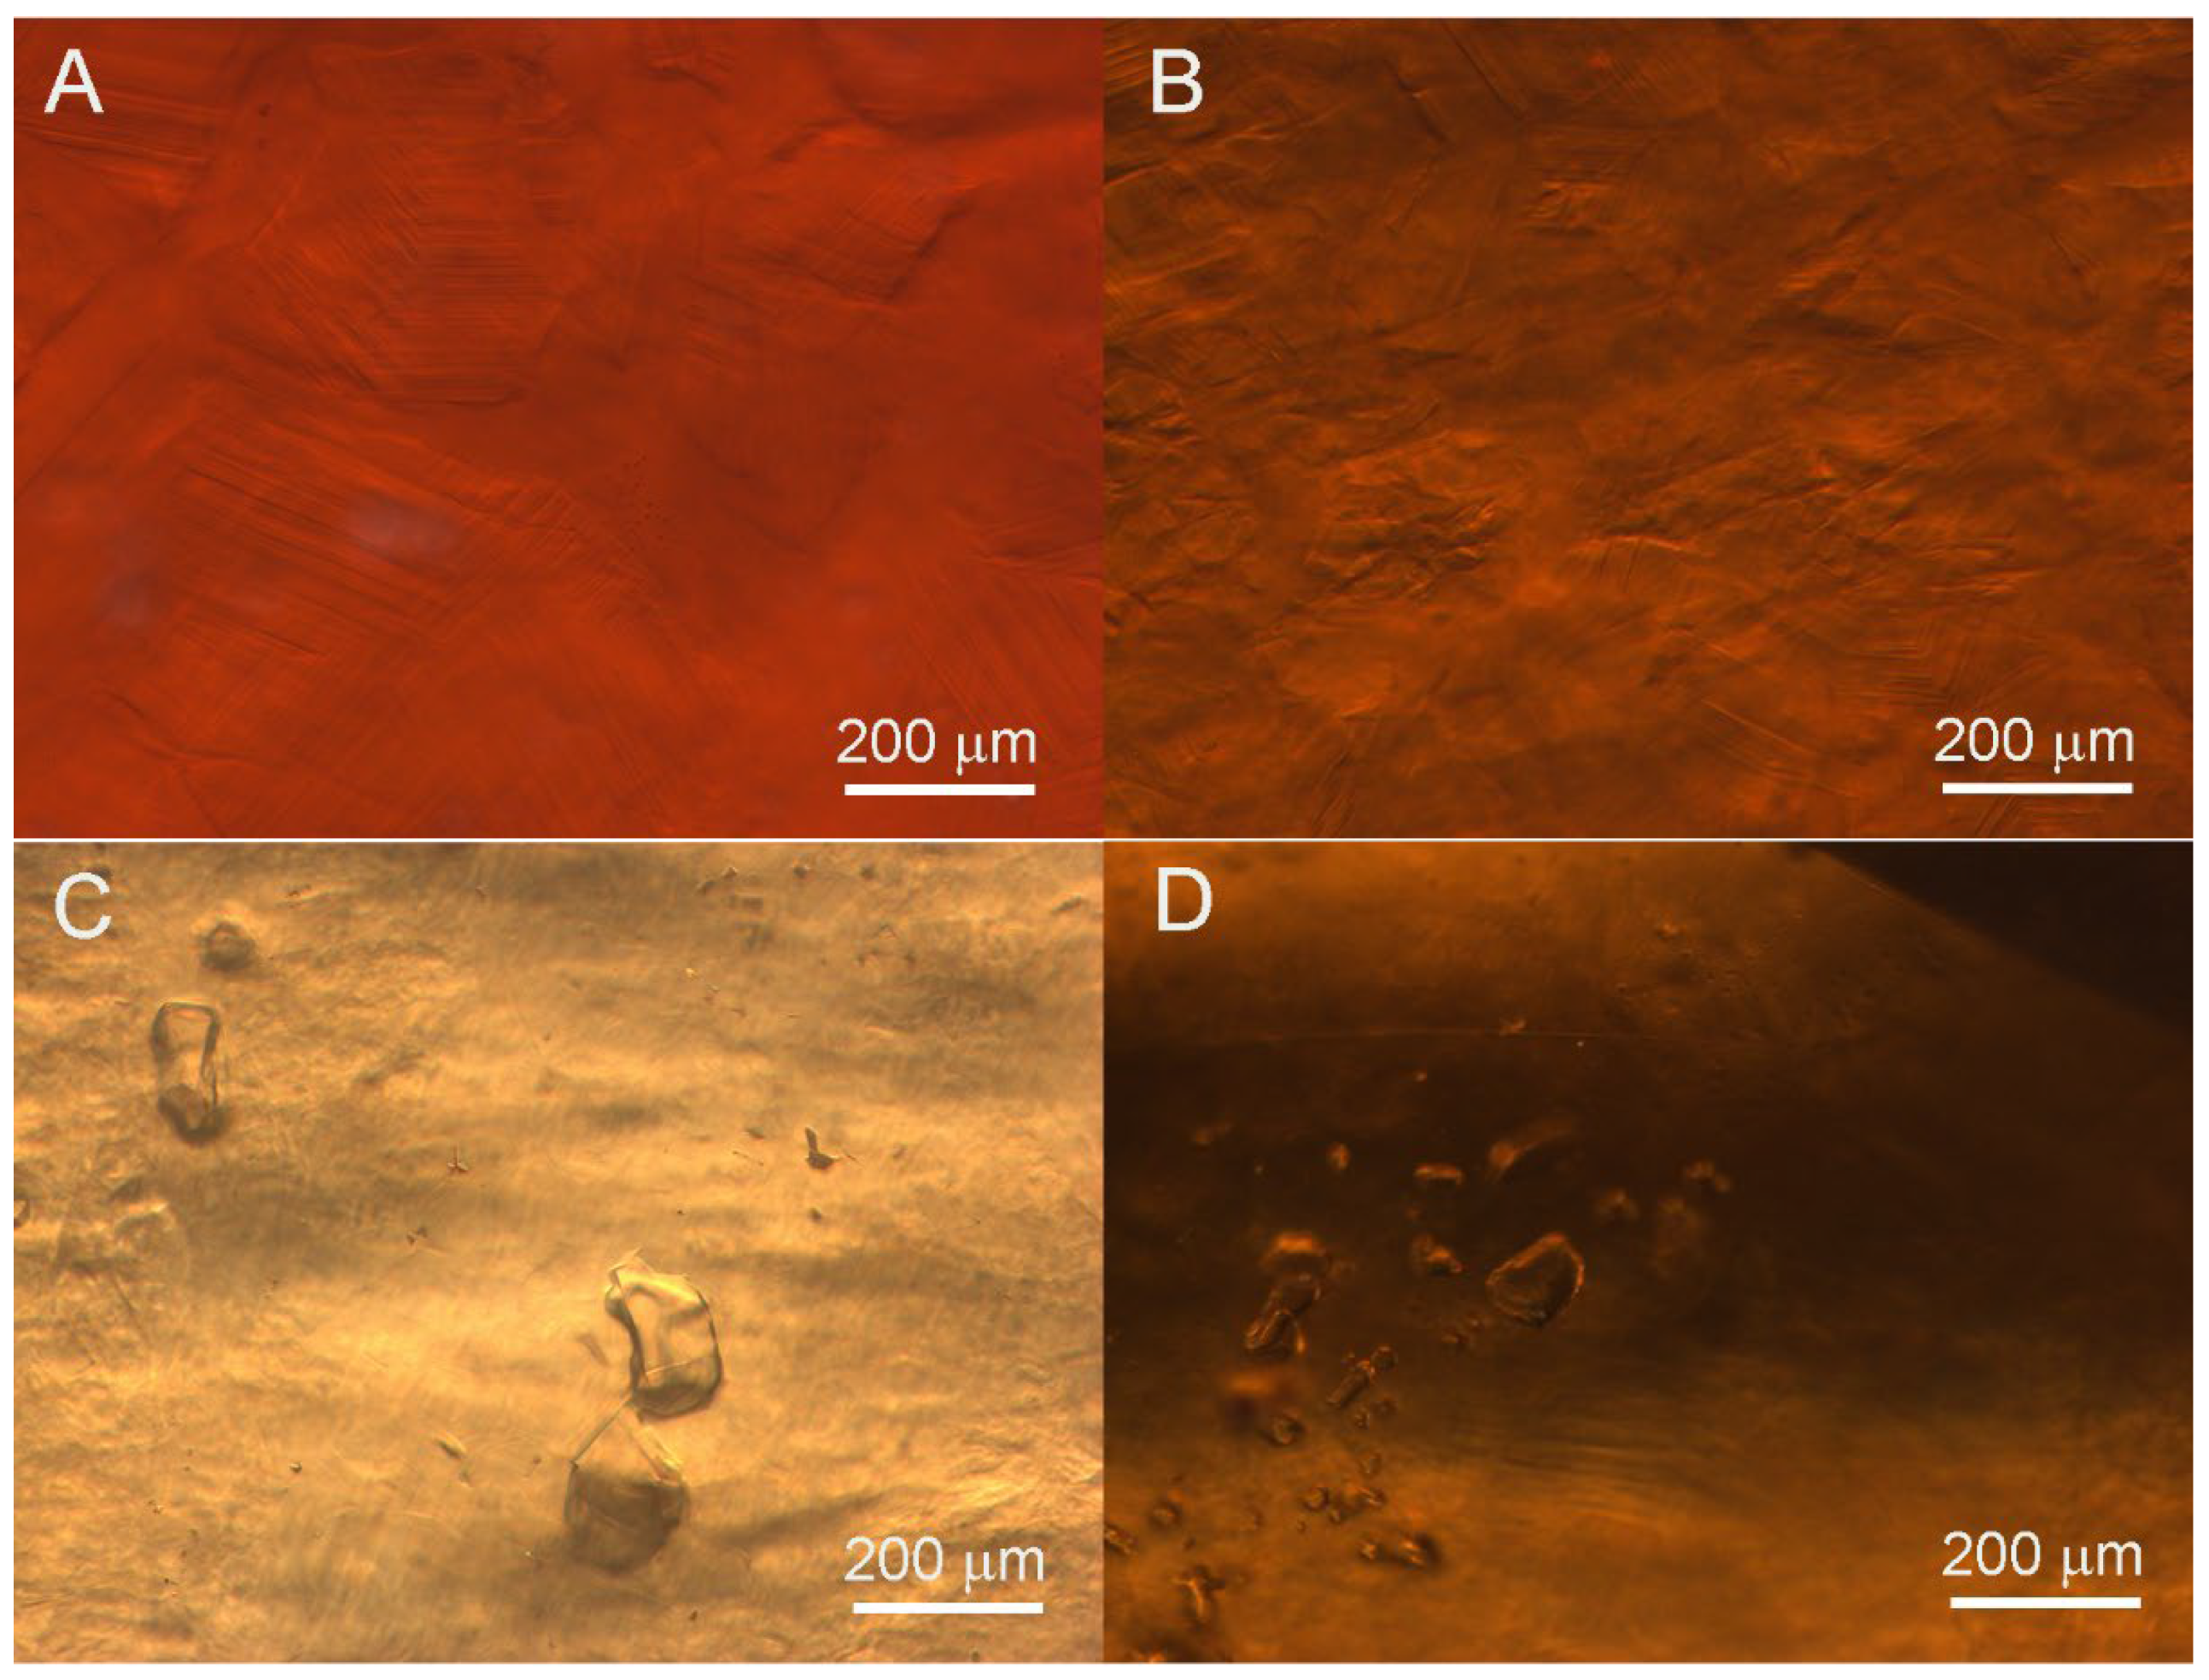
The heat-wave effect was observed in all samples (Figure 3). Compared to other samples, Sample 3 exhibited a more obvious roiled appearance and poorer transparency. And Samples 5 and 9 also exhibit an obvious heat-wave effect. Meanwhile, some samples (e.g., Samples 2 and 3) showed near-straight, angular growth lines, a granular structure (Figure 3A,B), and transparent, irregular-shaped, colorless crystal inclusions (Figure 3C,D). Fluid filling inclusions were observed in Samples 7 and 8.

Figure 3.
Microscopic images of hessonite samples showing heat-wave effect inclusions: (A) heat-wave effect with near-straight and angular growth lines and granular structure in Sample 2; (B) obvious heat-wave effect without crystal inclusions in Sample 3; (C) heat-wave effect with irregular transparent crystal inclusions in Sample 5; (D) heat-wave effect with a group of transparent crystal inclusions in Sample 6.
3.2. Infrared Spectroscopy
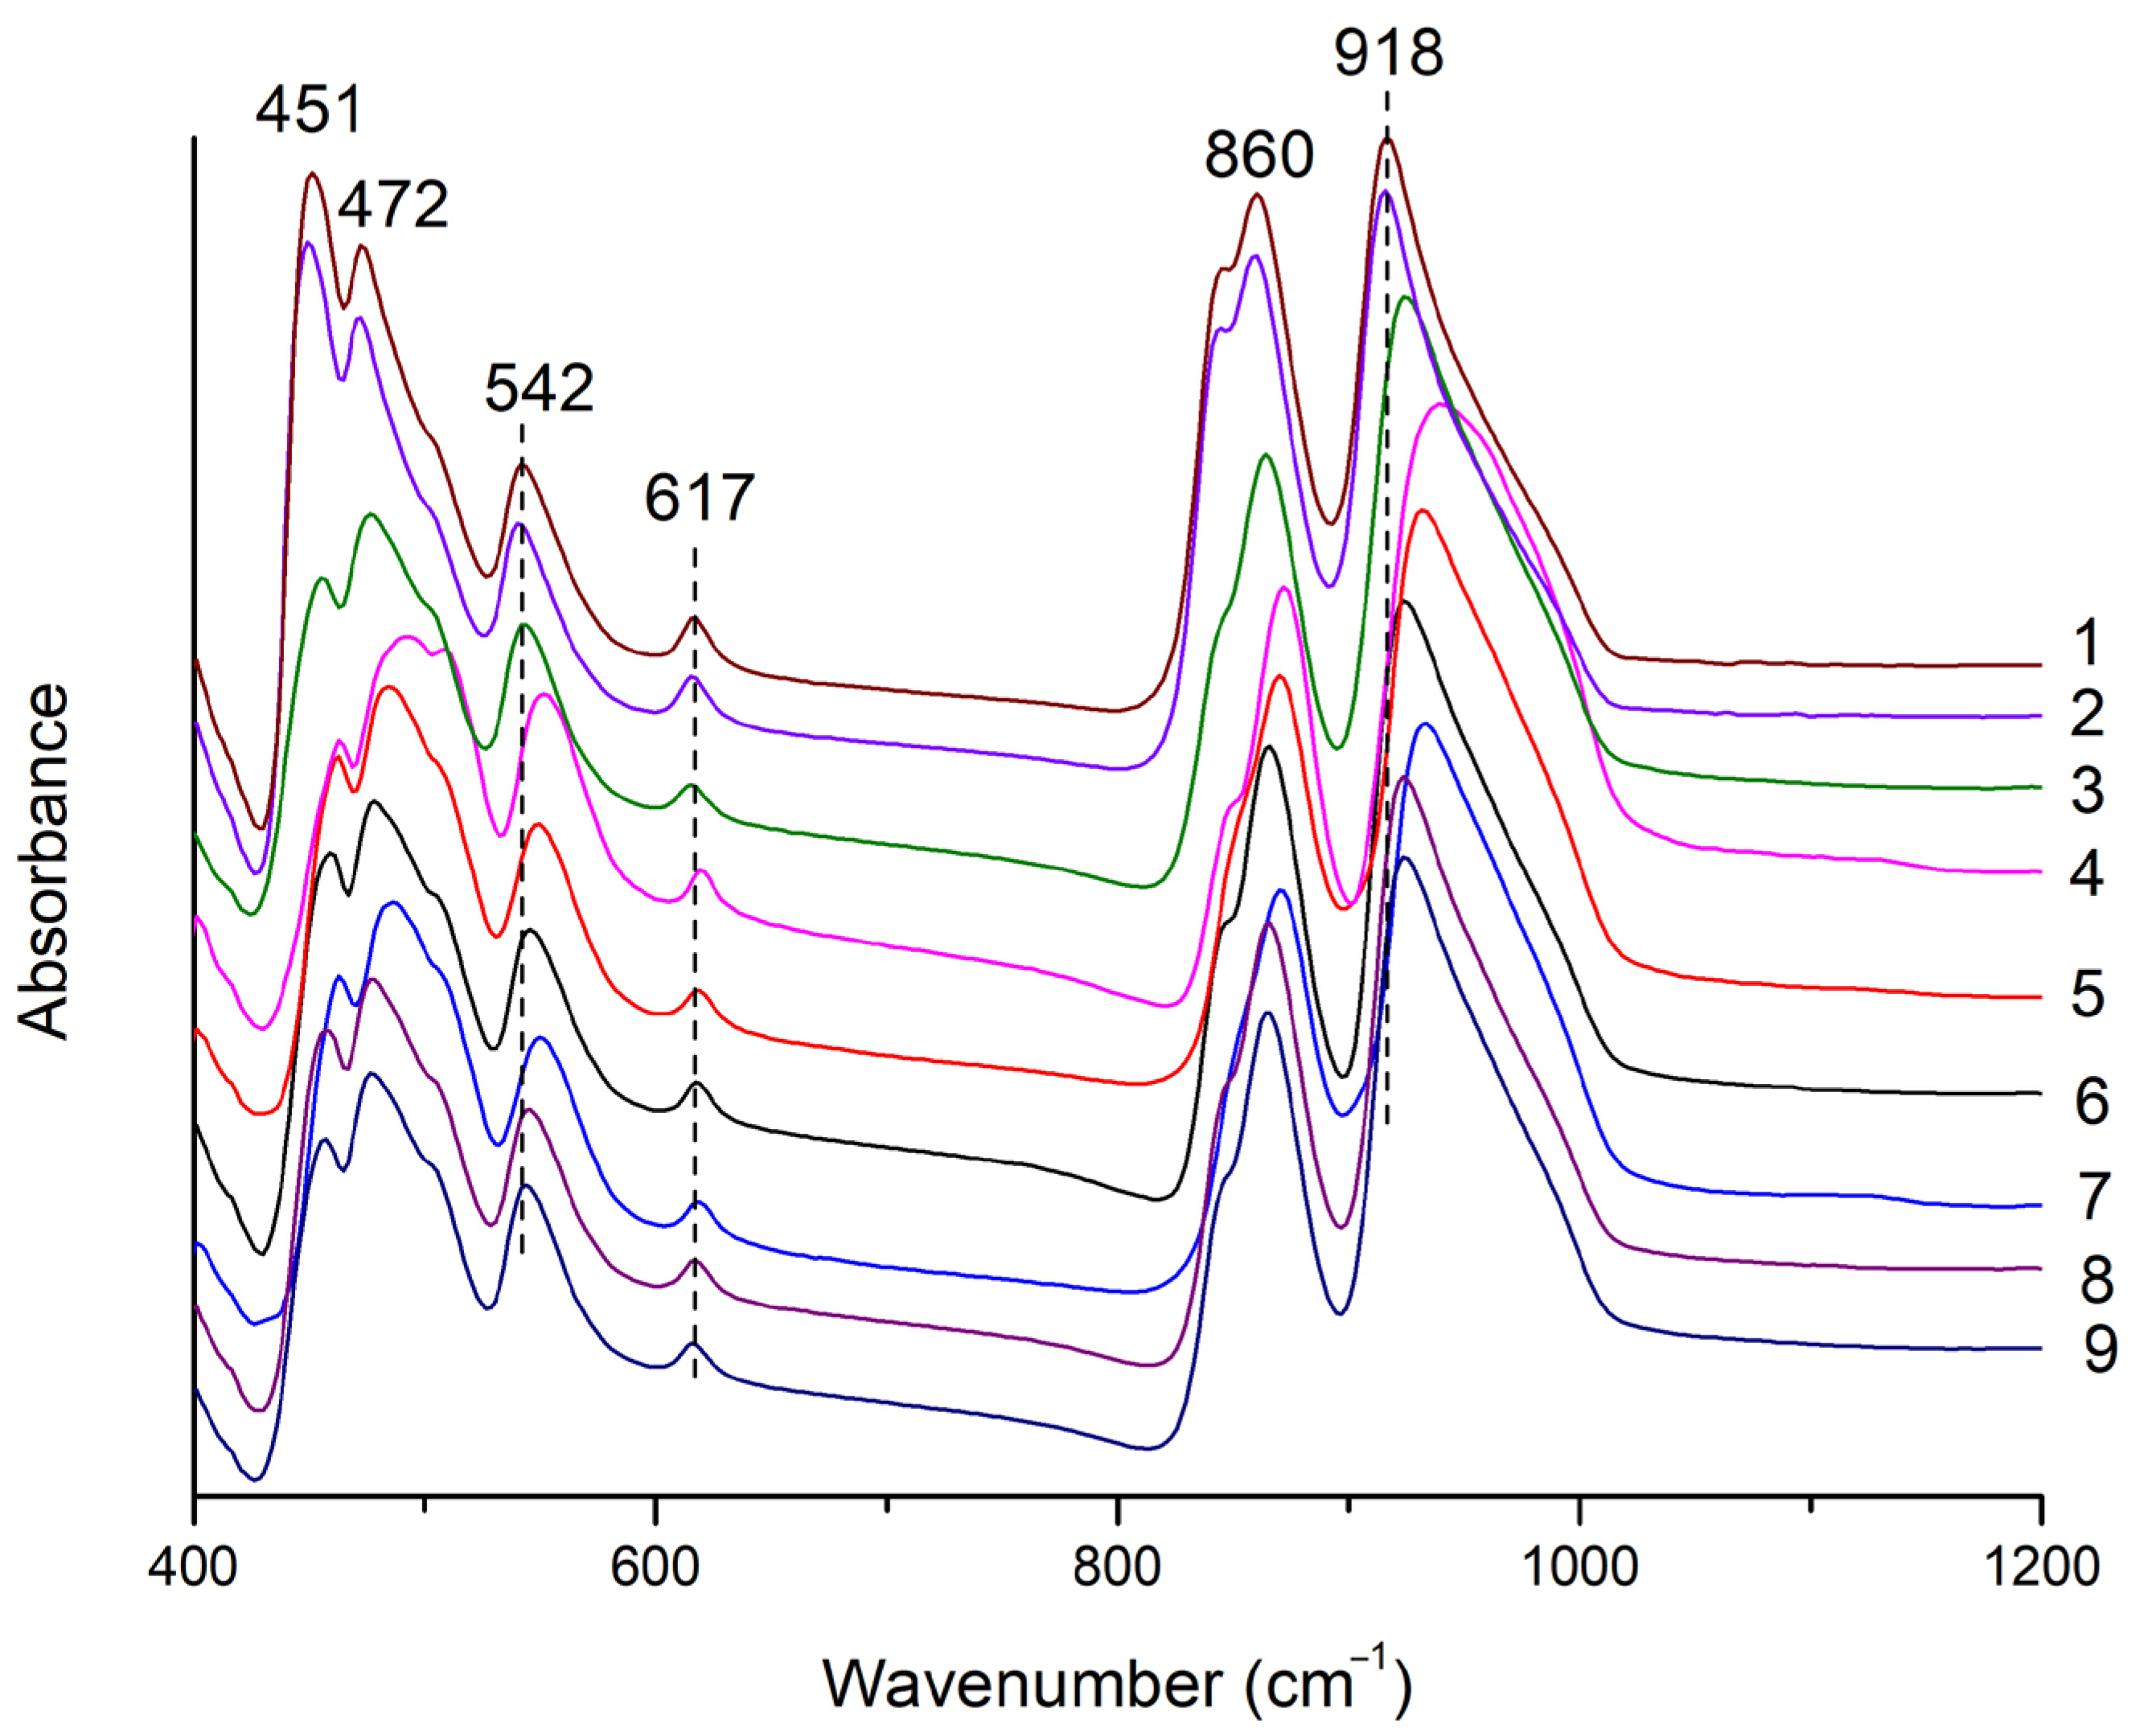
Infrared (IR) spectroscopy was used for phase identification. A set of frequencies and wavenumbers of Si–Ostr and Si–Obend modes obtained from FTIR spectra can be used to identify the garnet species [6]. Garnet has a cubic structure (space group Ia3d). According to theoretical factor group analysis on garnet, there are 10 calculated bands in the mid-infrared region (MIR, 400~4000 cm−1), with concentrations in the 400~1100 cm−1 range [6,13,14,15].
In Figure 4, bands at 918 and 860 cm−1, arising from the higher energy vibrations, were assigned as the asymmetric stretching vibration of Si-O [ν3(SiO4)] [16,17]. Bands at 617 and 542 cm−1 were assigned to the symmetric Si–O bending mode [ν4(SiO4)], and the band at 472 cm−1 was assigned to the asymmetric Si–O bending mode [ν2(SiO4)]. The band at 451 cm−1, arising from the lower energy vibrations, was assigned to translations of the octahedral site cations [6,18]. The IR spectra of the samples were characteristic of grossular species but could not further distinguish varieties within this species, such as hessonite [6].
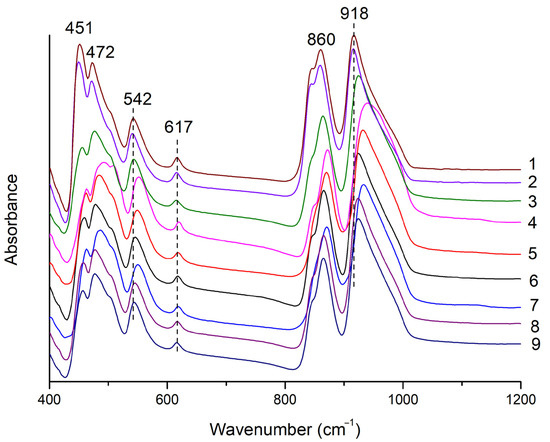
Figure 4.
Infrared spectra of hessonite samples. The number behind the spectrum is the sample number.
3.3. BSE Images and EDS Data
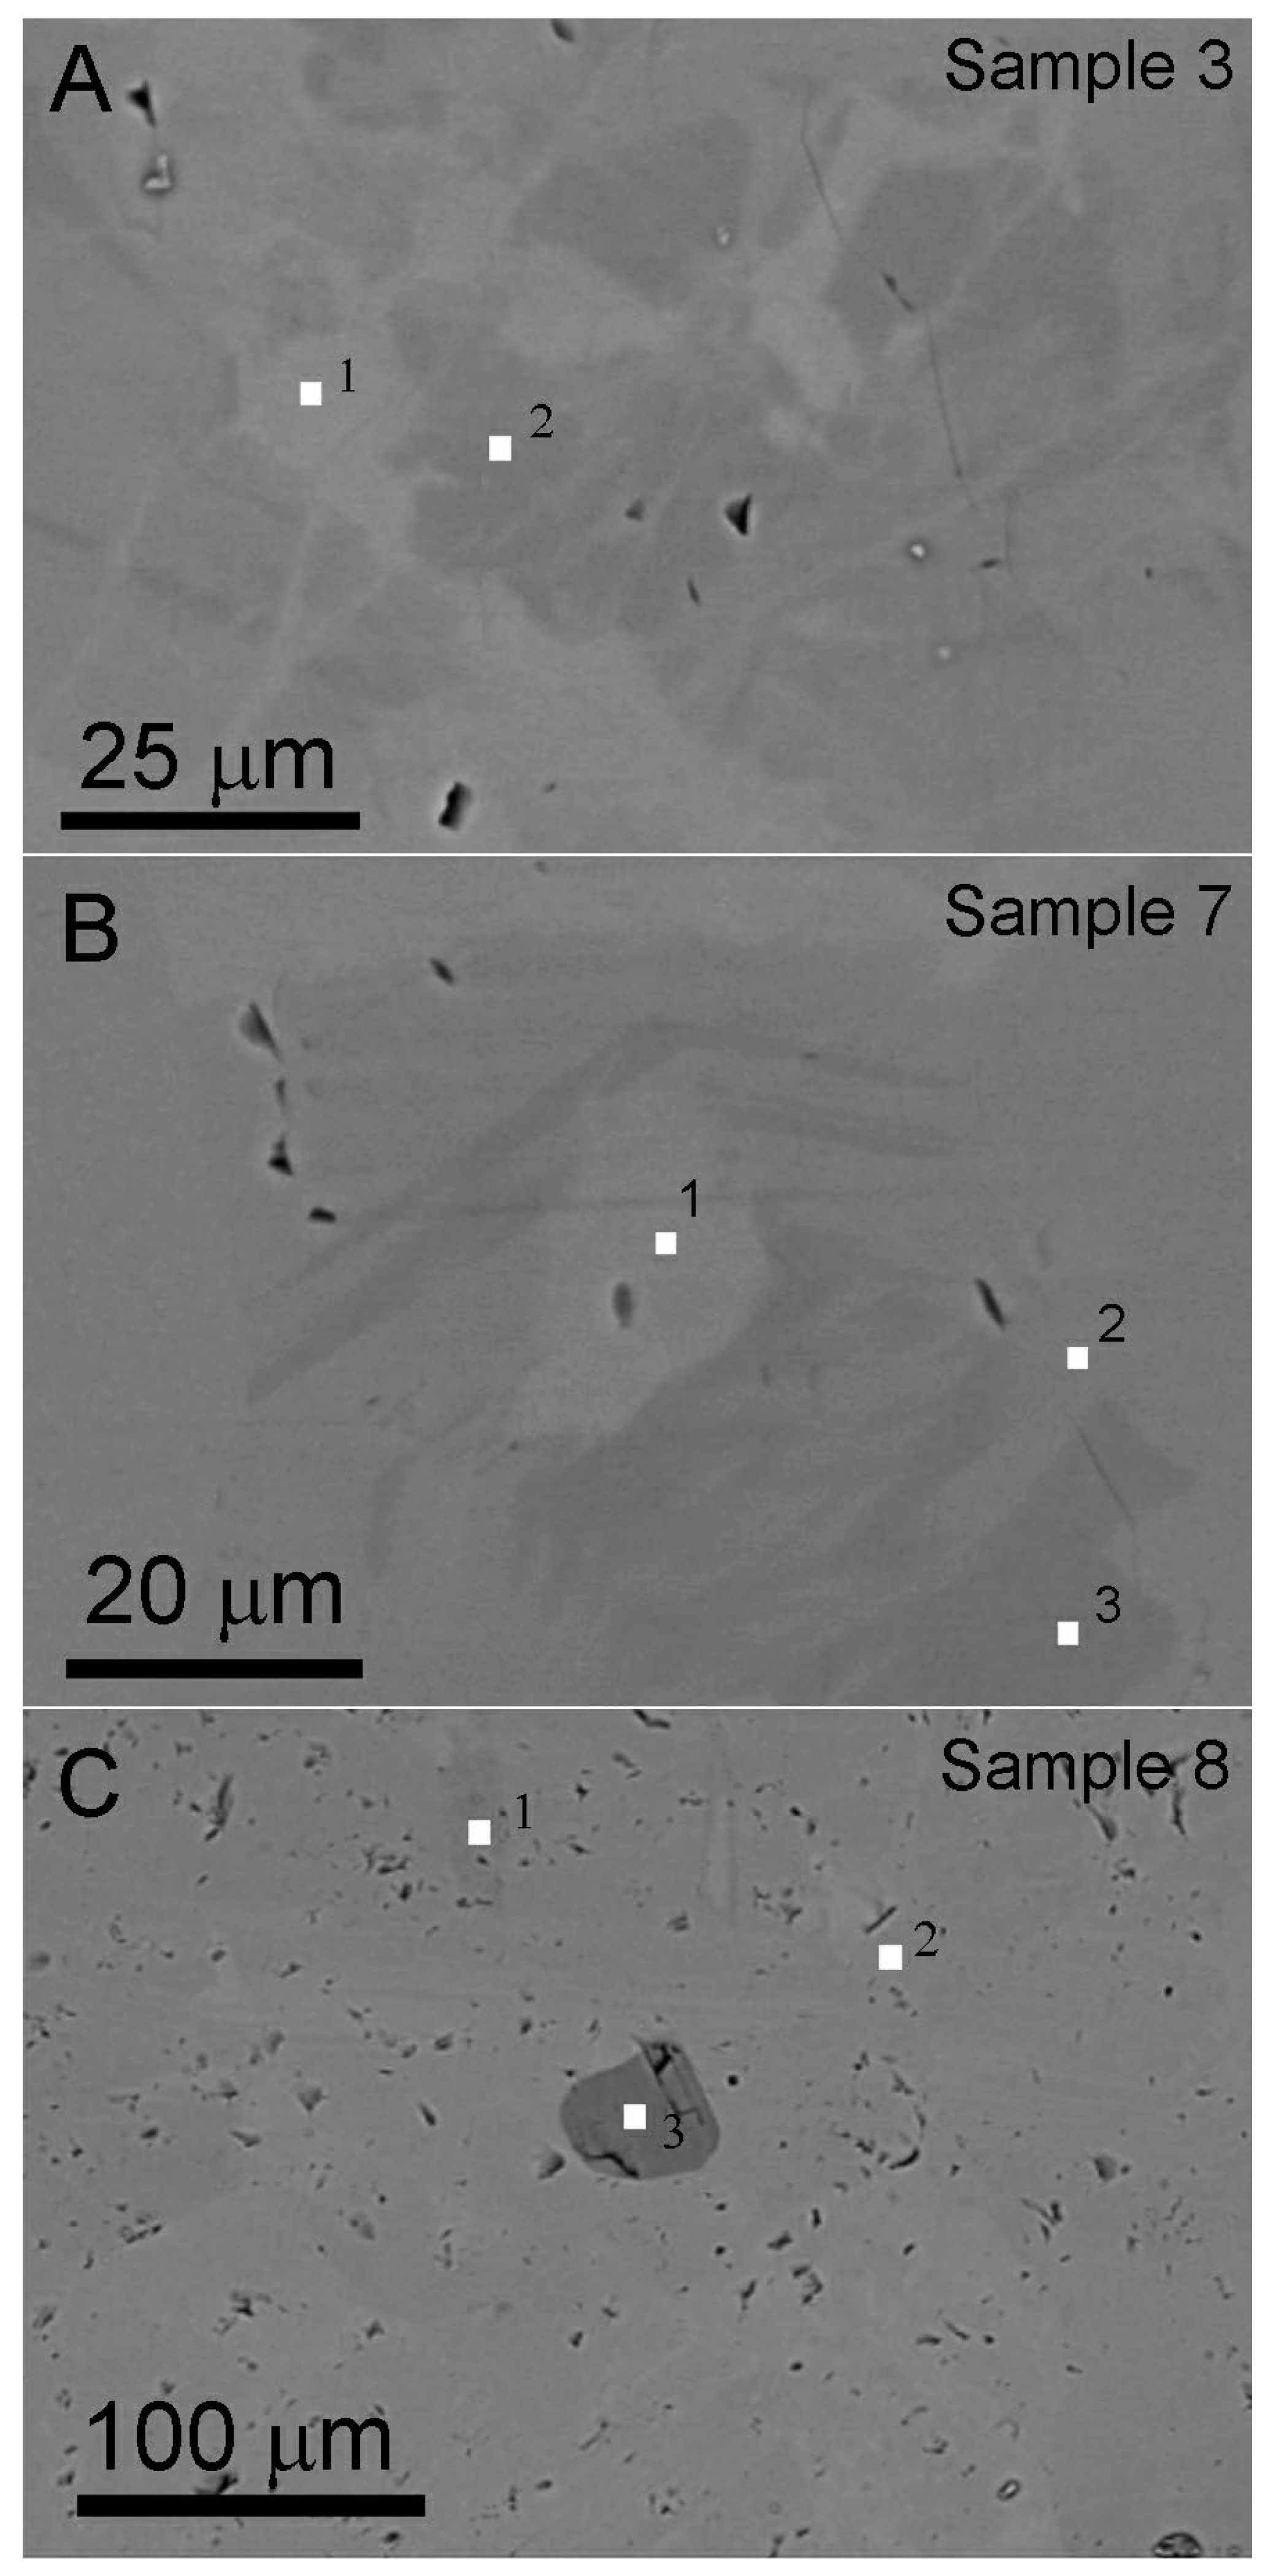
The BSE imaging method is suitable for identifying chemical composition variations in isomorphic mineral series. The gray contrast in BSE images is associated with atomic number, where brighter regions correspond to elements with higher atomic number. Figure 5 shows contrast variation on the polished surfaces, reflecting heterogeneous chemical composition distributions within the hessonite samples. Small white squares in Figure 5 denote areas tested by EDS using the spot testing method. The EDS data are listed in Table 2. The dark contrast particle marked “3” in Figure 5C was identified as diopside via EDS (Table 2, data 8-3), confirming it as an inclusion within hessonite. The other chemical composition data align with hessonite [2].

Figure 5.
BSE images. (A,B) Hessonite with heterogeneous chemical composition showing varying gray contrast, from Sample 3 and Sample 7, respectively. Some voids (black pores) are on the polished surface. (C) Hessonite with inclusion (granule with darker contrast marked “3”) and a lot of irregular small voids are on the polished surface, from Sample 8. The chemical composition of the tested points (marked by small white squares and numbers) is listed in Table 2. The number beside the small white square represents the tested spot number.
Table 2.
Chemical composition of the samples tested by EDS.
Quantitative chemical compositions were calculated assuming the ideal garnet stoichiometry of 8 cations per 12 oxygen atoms. The hessonite samples mainly contained Al and Fe in the “B” site, ranging from 1.66~1.93 and 0.22~0.50 in a unit chemical structure formula, respectively. Because the Fe element has the highest atomic number in the main chemical composition of hessonite, BSE images closely correlate with the content of Fe. Therefore, in BSE images, the contrast of the area with higher Fe content was brighter. Figure 5 shows that Fe-rich areas exhibit a random distribution within hessonite particles.
Additionally, there are a lot of irregular micropores with the darkest contrast revealing on the polished surfaces (Figure 5), suggesting that the hessonite is not a single crystal.
3.4. EBSD Experiments and Phase Identification
EBSD patterns enable the identification of phases and their orientations, making EBSD a widely used technique for mineral phase identification and polycrystalline texture analysis. EBSD mapping can exhibit phase distribution in a testing area, while crystal orientations are typically presented by band contrast (BC) images. The varying brightness in BC images reflects variation in the EBSD signal quality across the sample surface. Generally, regions with higher signal quality (i.e., clearer crystal orientations or less noise) appear. As such, BC images assist researchers in identifying and analyzing the crystal structures and orientations, such as identifying grain boundaries, twins, and other microstructures.
Since hessonite is a subtype of grossular and shares identical EBSD patterns, hessonite was denoted as grossular in the EBSD analyses. In this study, Samples 3 and 9 exhibit obvious heat-wave effects: Sample 3 contains nearly no crystal inclusions, while Sample 9 has abundant crystal inclusions. Samples 4, 5, and 7 are hessonite with crystal inclusions, displaying slight, obvious, and moderate heat-wave effects, respectively. These representative samples were selected for EBSD analysis.
Figure 6 shows EBSD phase mapping and band contrast images of the hessonite samples. Mineral phases were presented in different colors for distinction. Microscopic observation of Sample 3 showed few crystal inclusions (Figure 3B), consistent with its EBSD phase map showing pure grossular (marked by green) in the studied area (Figure 6A). However, quartz (marked by red), diopside (marked by purple), titanite (marked by yellow), and dolomite (marked by blue) were found as impurity minerals in the other samples (Figure 6B–E and Table A1). The black areas in Figure 6B represent voids (pores) on the test surface, which cannot be indexed by EBSD, hence appearing as unindexed regions. Impurity minerals in the testing area of Sample 5 were abundant and diversified (Figure 6C). The band contrast of grossular (i.e., hessonite) is obvious, indicated by the green color. It confirms that all the tested areas consist of polycrystals with random orientations [19].
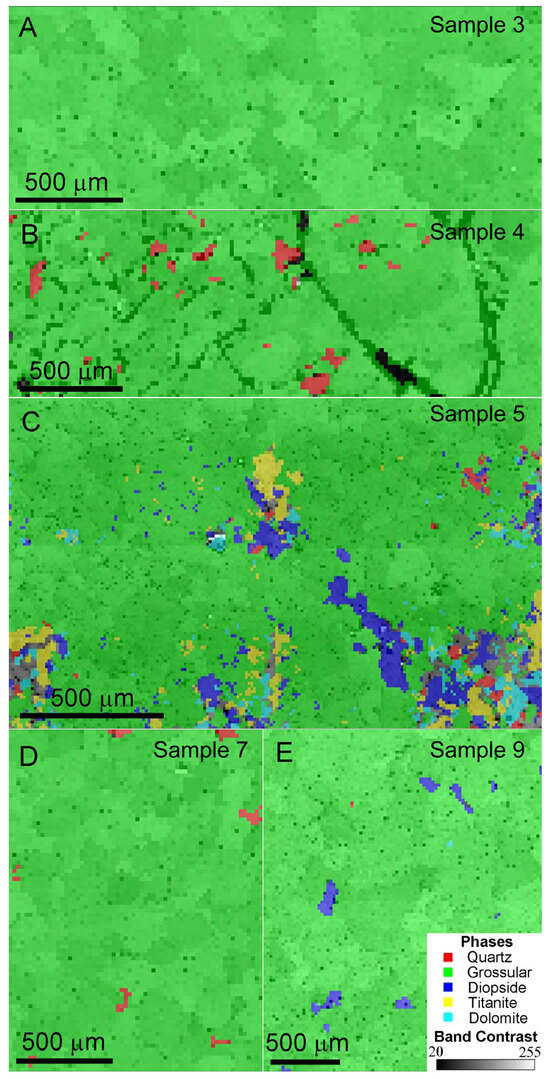
Figure 6.
EBSD phase mapping and band contrast images of the samples: (A) pure grossular (hessonite) granules, Sample 3; (B) grossular (hessonite) granules with quartz and obvious pores, Sample 4; (C) grossular (hessonite) granules with quartz, grossular (hessonite), diopside, titanite, and dolomite, Sample 5; (D) grossular (hessonite) granules with quartz, Sample 7; (E) grossular (hessonite) granules with diopside, Sample 9.
3.5. Fabric and Grain Size Analysis
In order to investigate the polycrystalline structure of the hessonite samples, EBSD data were further analyzed. For example, the area of Sample 9 shown in Figure 6E was mainly composed of grossular (hessonite), with minor occurrences of diopside, quartz, and dolomite. EBSD identified 158 grossular (hessonite) granules in this area. The lattice preferred orientations (LPOs) of this sample were analyzed, and the corresponding pole figures are shown in Figure 7A,B. Figure 7A represents the raw data, while Figure 7B displays the contoured figures on lower-hemisphere equal-area projections for {100}, {110}, and {111} planes. The results indicate that grossular (hessonite) orientations were nearly random (MUD = 0.36~1.83), signifying the absence of LPOs in this sample. Misorientation angles among the granules ranged from 0° to 60°, with frequency distributions aligning with theoretically random distributions (black line in Figure 7C) [20].
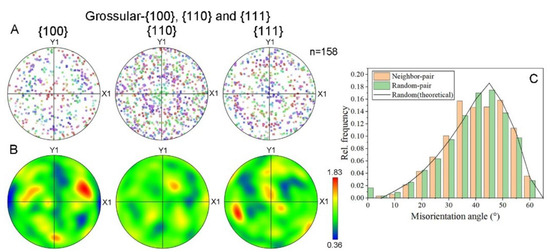
Figure 7.
Fabric of hessonite Sample 9: (A) raw data and (B) contoured lower-hemisphere equal-area projections of hessonite (grossular) lattice preferred orientations (LPOs) expressed as {100}, {110}, and {111} pole figures. n, measured number of grains. Colorful bar: MUD value’s range of tested grains; (C) histogram of the relative frequency of misorientation angles. Orange bar: misorientation angle between neighboring grains. Green bar: misorientation angle between randomly chosen grains.
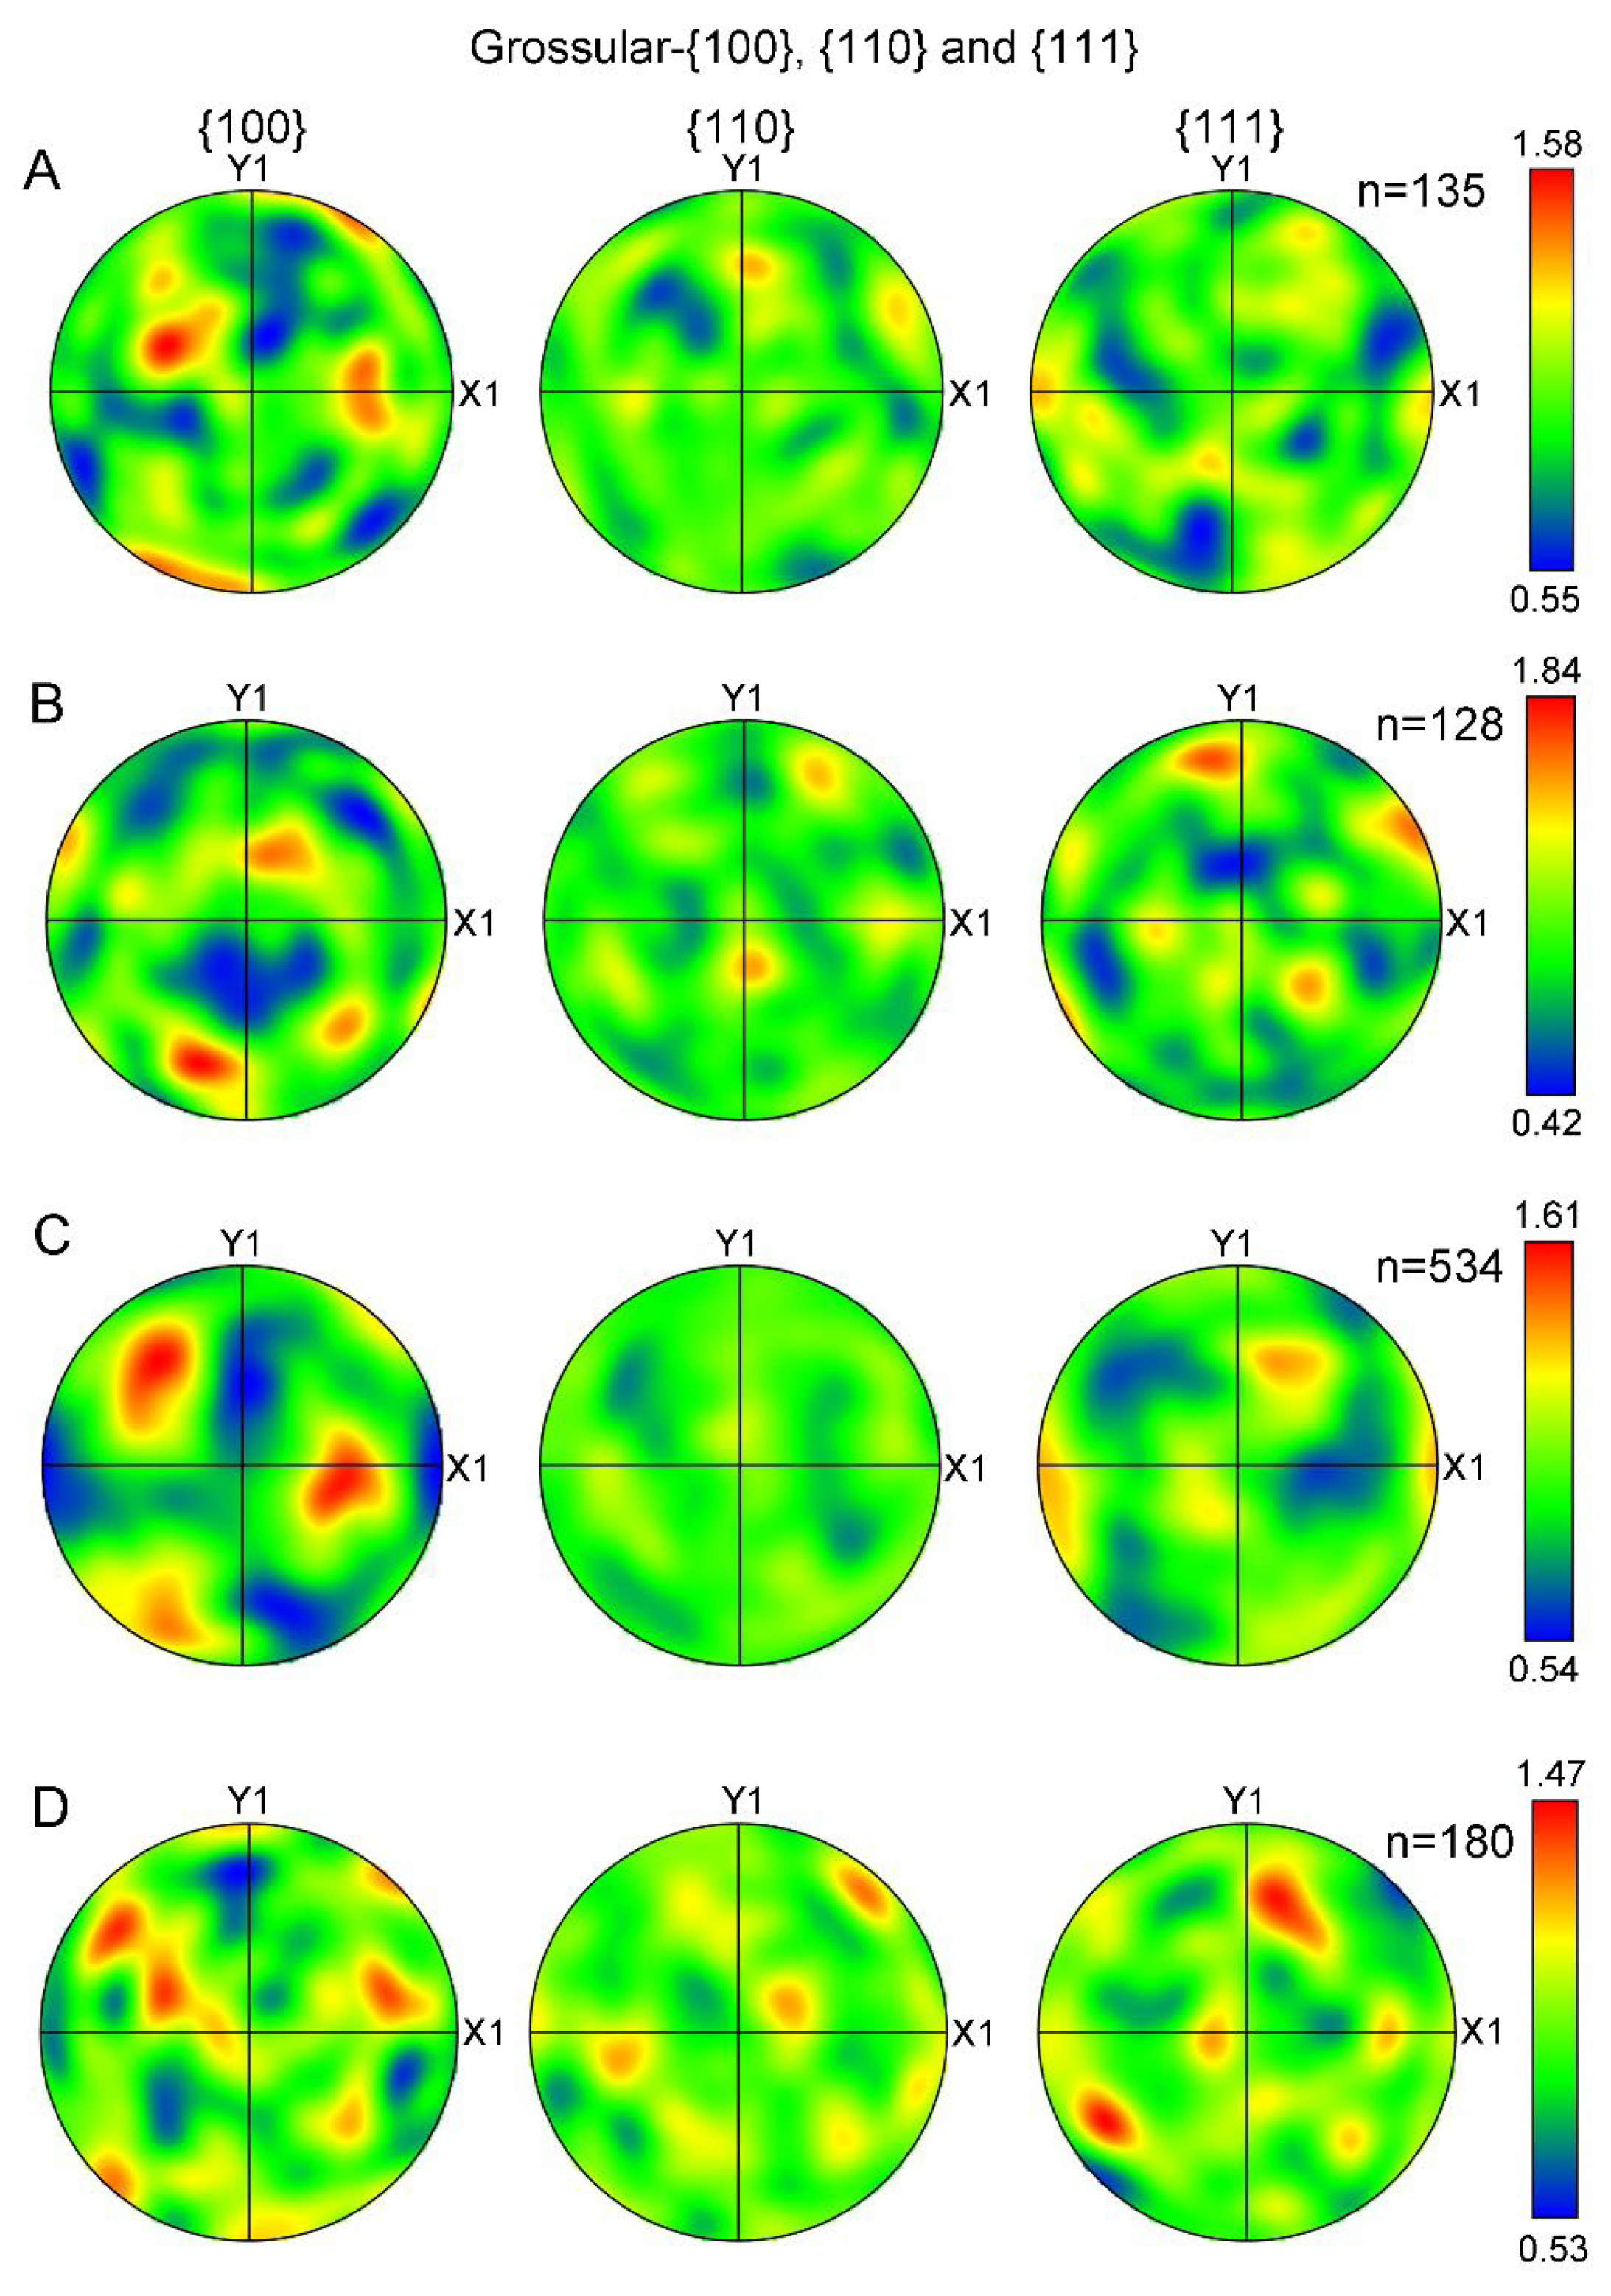
The LPOs of grossular (hessonite) from additional studied samples (No. 3, 4, 5, and 7) were also plotted as fabric diagrams of poles on {100}, {110}, and {111} planes (Figure 8). The tested areas of these samples corresponded to those shown in Figure 7. The contoured pole figures (Figure 7) indicate that granules in all the samples exhibit a similar distribution of orientations. MUD values ranging from 0.4~1.9 indicate the absence of LPOs in all samples.
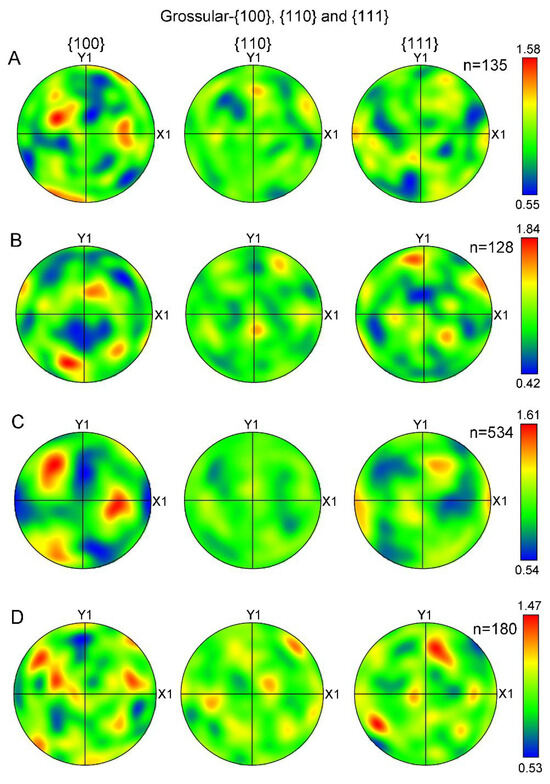
Figure 8.
Contoured pole figures of LPOs of hessonite (grossular) samples expressed on {100}, {110}, and {111}, respectively: (A) Sample 3; (B) Sample 4; (C) Sample 5; (D) Sample 7. Contoured pole figures are processed and expressed in the same manner as Figure 7B. n, measured number of grains.
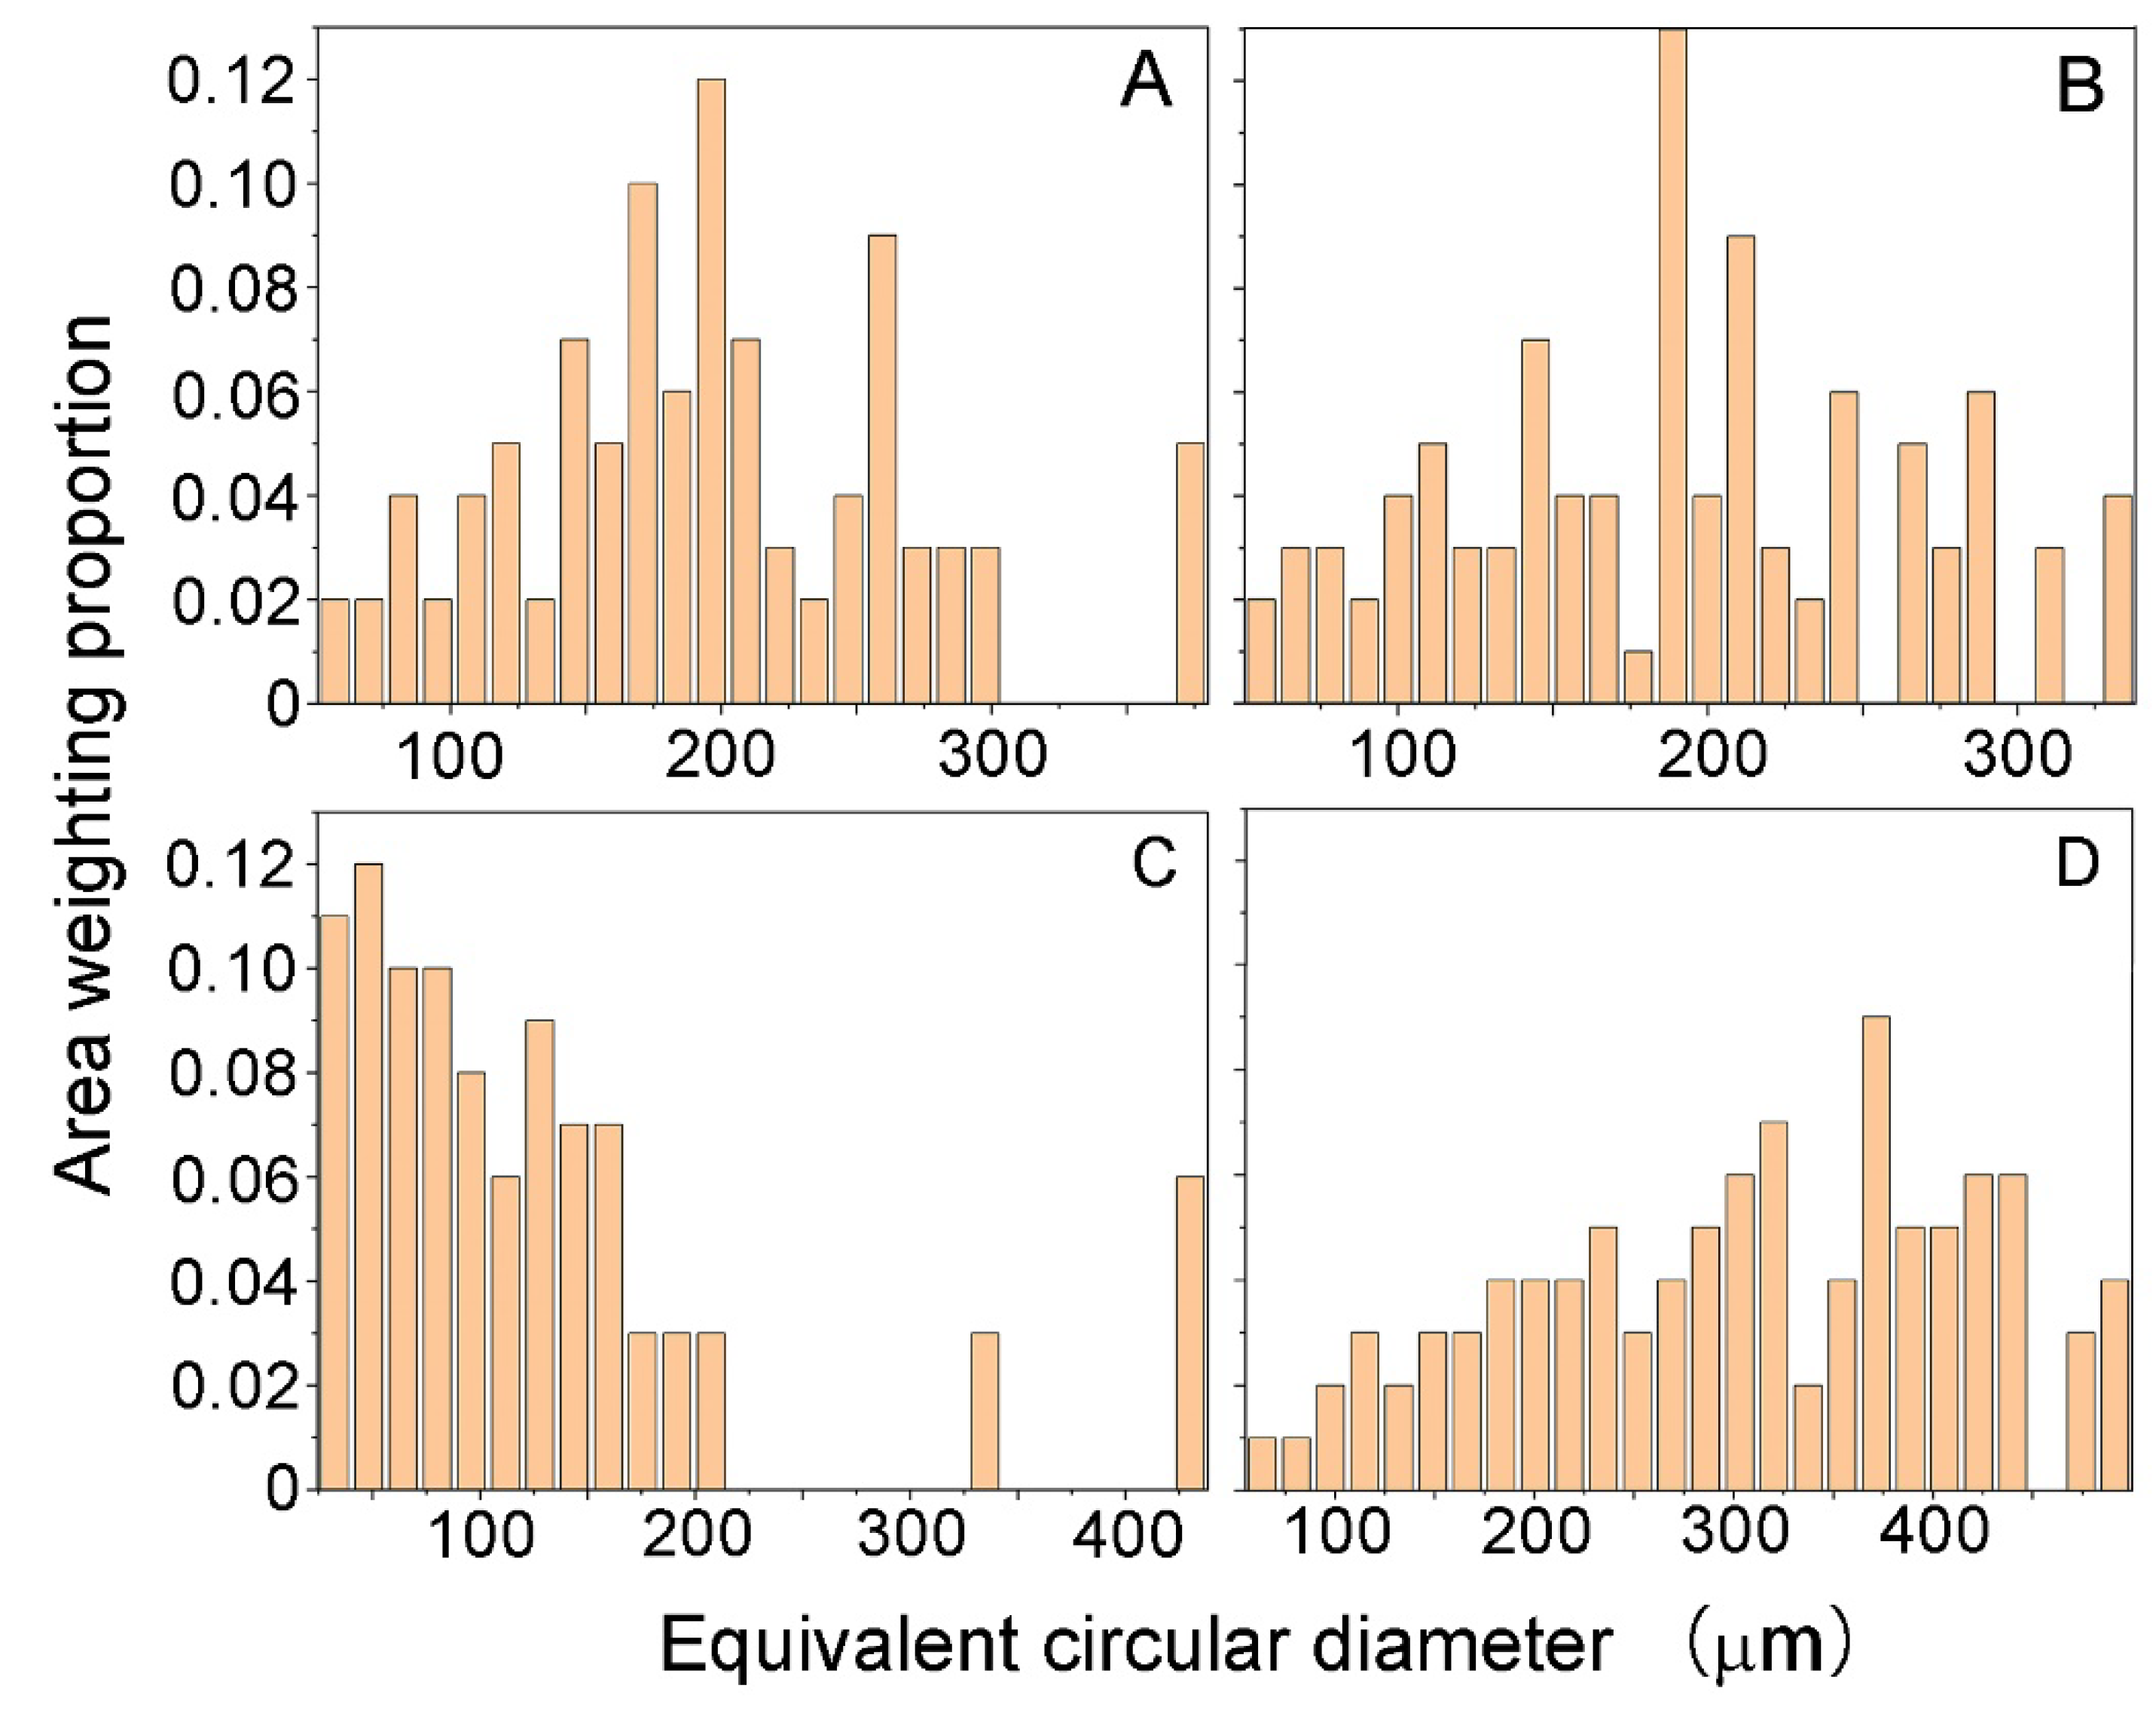
Figure 9 shows the distributions of grain size of grossular (hessonite) in the studied areas corresponding to Figure 7. Due to the irregular morphology of hessonite granules, their size was expressed by the equivalent circular diameter. The analysis of the area weighting proportion of the equivalent circular diameter of hessonite granules reveals that hessonite samples consist of polycrystals with varying grain sizes, ranging from tens of microns to nearly 500 microns. This confirms that hessonite is a polycrystalline aggregate composed of submillimeter-sized granules with random distributions.

Figure 9.
Area weighting proportion of equivalent circular diameter of hessonite samples: (A) Sample 3; (B) Sample 4; (C) Sample 5; (D) Sample 9.
4. Discussion
The heat-wave effect in hessonite has long been recognized as a distinctive internal feature [11]. However, the causative mechanism remains poorly understood.
In this study, all hessonite samples exhibit the heat-wave effect, yet not all contain crystal inclusions. For example, Sample 3 displayed an obvious heat-wave effect but lacked crystal inclusions (Figure 3B and Figure 7A). It indicates that the tiny crystal inclusions are not the primary driver of the heat-wave effect [11].
From the EDS mapping, the chemical composition of hessonite granules is inhomogeneous. Isomorphism substitution is prevalent in garnet. The content of the Fe element varies among different hessonite granules (Figure 5). However, according to the classification of chemical composition of garnet, all the tested spots on the granules belong to grossular, the calcium–aluminum garnet species [2,4,8] (Table 2). Iron–aluminum garnet species were not detected in the samples. On the other hand, the RI values of the samples further confirm that they were classified as grossular (calcium–aluminum) species. Iron–aluminum species (i.e., andradite) were not detected in any samples. Therefore, we propose that the heat-wave effect is unrelated to the combined growth of grossular and andradite.
The variation in Fe content may cause minor RI value differences among different garnet species [8]. Kanis and Redmann (1994) reported a correlation diagram of iron content and the RI based on hessonite samples from four localities. The data show that RI values increase from 1.738 to 1.763 as Fe2O3 content rises from 1.10 wt% to 8.2 wt% [12]. In our study, the FeO content of samples ranges from 3.44 wt% to 7.77 wt%, corresponding to an RI difference smaller than 0.03. This minimal variation may result in small changes in light transmission speed within hessonite.
From EBSD experiments, hessonite granules were distinctly recognizable. Analysis of BC images (Figure 6), pole figures (Figure 7A,B and Figure 8), and grain size analysis (Figure 9) indicates that hessonite consists of randomly orientated submillimeter-sized polycrystals, confirming it is polycrystalline rather than single-crystalline.
The EBSD analysis further shows that the hessonite samples were composed of micron- to submicron-sized grains. The irregular morphology of the hessonite granules prevents perfect intergranular contact, leading to abundant micropores observed among the adjacent hessonite granules (Figure 5). When incident light passes through hessonite, the micropores disturb the light path. As a result, light does not propagate through hessonite as it would through a single crystal. Instead, grain boundaries and micropores disrupt light trajectories and alter propagation speeds within the polycrystalline structure. Minor variations in the refractive index (RI) among granules further interrupt and redirect incident light, causing it to become roiled and generating the heat-wave effect. However, to determine why only most hessonites (yellow to orange calcium–aluminum species of garnet) rather than other garnet species exhibit the heat-wave effect and are composed of polycrystal, further studies are needed based on their geological context.
5. Conclusions
This study demonstrates that hessonite is polycrystalline rather than single-crystalline, composed of submillimeter-sized granules with random orientation and minor chemical composition variations. Abundant micropores exist among the granules. These structural features interrupt incident light as it traverses the hessonite. It will cause changes in both the direction and the speed of the incident light. Such alterations induce light to swirl and roil within the gemstone, ultimately giving rise to the heat-wave effect.
Author Contributions
Conceptualization, supervision, methodology, and writing—original draft preparation, T.C.; software, J.Z.; validation, formal analysis, data curation, and visualization, T.C., M.W. and J.Z.; investigation, T.C., M.W., J.Z., J.T., X.X. and L.L.; resources, J.P.; project administration and funding acquisition, T.C. All authors have read and agreed to the published version of the manuscript.
Funding
This research was funded by National Natural Science Foundation of China grants 42072252 and 41572033.
Data Availability Statement
The data presented in this study are available on request from the corresponding author. The data are not publicly available due to privacy reasons.
Acknowledgments
We would like to express our gratitude to two anonymous reviewers for their thorough and constructive review comments that significantly improved the quality of this manuscript.
Conflicts of Interest
The authors declare no conflicts of interest.
Appendix A
Appendix A.1
Table A1.
The cell parameters of the phases used in phase identification by EBSD.
Table A1.
The cell parameters of the phases used in phase identification by EBSD.
| Phase | a (Å) | b (Å) | c (Å) | Alpha (°) | Beta (°) | Gamma (°) | Space Group | Database |
|---|---|---|---|---|---|---|---|---|
| Pyrope | 11.32 | 11.32 | 11.32 | 90.00 | 90.00 | 90.00 | 230 | AM 1 |
| Almandine | 11.51 | 11.51 | 11.51 | 90.00 | 90.00 | 90.00 | 230 | ICSD 2 |
| Grossular (hessonite) | 11.56 | 11.56 | 11.56 | 90.00 | 90.00 | 90.00 | 230 | ICSD |
| Diopside | 9.68 | 8.85 | 5.22 | 90.00 | 105.57 | 90.00 | 15 | AM |
| Titanite | 6.55 | 8.70 | 7.43 | 90.00 | 119.72 | 90.00 | 15 | ICSD |
| Dolomite | 4.81 | 4.81 | 16.02 | 90.00 | 90.00 | 120.00 | 148 | ICSD |
| Quartz | 4.91 | 4.91 | 5.50 | 90.00 | 90.00 | 120.00 | 152 | AM |
1 AM: American Mineralogist Crystal Structure Database. 2 ICSD: Inorganic Crystal Structure Database.
References
- Stockton, C.M.; Manson, D.V. A Proposed New Classification for Gem-Quality Garnets. Gems Gemol. 1985, 21, 205–218. [Google Scholar] [CrossRef]
- Grew, E.S.; Locock, A.J.; Mills, S.J.; Galuskina, I.O.; Galuskin, E.V.; Hålenius, U. Nomenclature of the Garnet Supergroup. Am. Mineral. 2013, 98, 785–811. [Google Scholar] [CrossRef]
- Krzemnicki, M.; Hänni, H.A.; Reusser, E. Colour Change Garnets from Madagascar. J. Gemmol. 2001, 27, 395–408. [Google Scholar] [CrossRef]
- Adamo, I.; Pavese, A.; Prosperi, L.; Ajo’, D. Gem-quality garnets: Correlations between gemological properties, chemical composition and infrared spectroscopy. J. Gemmol. 2007, 30, 307–313. [Google Scholar] [CrossRef]
- Boffa Ballaran, T.; Woodland, A.B. Local Structure of Ferric Iron-Bearing Garnets Deduced by IR-Spectroscopy. Chem. Geol. 2006, 225, 360–372. [Google Scholar] [CrossRef]
- Li, W.; Zheng, J.; Pei, J.; Xu, X.; Chen, T. Correlations between Garnet Species and Vibration Spectroscopy: Isomorphous Substitution Implications. Crystals 2022, 12, 104. [Google Scholar] [CrossRef]
- Clark, B. Gem Notes: Hessonite from Somalia. J. Gemmol. 2014, 34, 293. [Google Scholar]
- Hänni, H.A. Gemstones of the Garnet Group—About Mixed Crystals and Solid Solution. J. Gemmol. Assoc. Hong Kong 2019, 40, 36–42. [Google Scholar]
- Laurs, B.M.; Quinn, E.P. Gem News International: Hessonite from Afghanistan. Gems Gemol. 2004, 40, 258–259. [Google Scholar]
- Williams, C.; Williams, B. Gem Notes: Hessonite from Kunar Province, Afghanistan. J. Gemmol. 2020, 37, 6–7. [Google Scholar] [CrossRef]
- Pearl, R.M. Garnet Gem and Mineral; Earth Science Publishing Company: Colorado Springs, CO, USA, 1975. [Google Scholar]
- Kanis, J.; Radmann, M. Four Hessonite Occurrences in Orissa, India. J. Gemmol. 1994, 24, 75–83. [Google Scholar]
- Moore, R.K.; White, W.B.; Long, T.V. Vibrational Spectra of the Common Silicates: I. The Garnets. Am. Mineral. 1971, 56, 54–71. [Google Scholar]
- Kolesov, B.A.; Geiger, C.A. Raman Spectra of Silicate Garnets. Phys. Chem. Miner. 1998, 25, 142–151. [Google Scholar] [CrossRef]
- Zicovich-Wilson, C.M.; Torres, F.J.; Pascale, F.; Valenzano, L.; Orlando, R.; Dovesi, R. Ab Initio Simulation of the IR Spectra of Pyrope, Grossular, and Andradite. J. Comput. Chem. 2008, 29, 2268–2278. [Google Scholar] [CrossRef] [PubMed]
- Bosenick, A.; Geiger, C.A.; Schaller, T.; Sebald, A. A 29Si MAS NMR and IR Spectroscopic Investigation of Synthetic Pyrope-Grossular Garnet Solid Solutions. Am. Mineral. 1995, 80, 691–704. [Google Scholar] [CrossRef]
- Makreski, P.; Runčevski, T.; Jovanovski, G. Minerals from Macedonia. XXVI. Characterization and Spectra–Structure Correlations for Grossular and Uvarovite. Raman Study Supported by IR Spectroscopy. J. Raman Spectrosc. 2011, 42, 72–77. [Google Scholar] [CrossRef]
- Hofmeister, A.M.; Chopelas, A. Vibrational Spectroscopy of End-Member Silicate Garnets. Phys. Chem. Miner. 1991, 17, 503–526. [Google Scholar] [CrossRef]
- Zhang, J.F.; Shi, F.; Xu, H.J.; Wang, L.; Feng, S.Y.; Liu, W.L.; Wang, Y.F.; Green, H.W. Petrofabric and Strength of SiO2 near the Quartz-Coesite Phase Boundary. J. Metamorph. Geol. 2013, 31, 83–92. [Google Scholar] [CrossRef]
- Zhang, J.; Green, H.W. Experimental Investigation of Eclogite Rheology and Its Fabrics at High Temperature and Pressure. J. Metamorph. Geol. 2007, 25, 97–115. [Google Scholar] [CrossRef]


Disclaimer/Publisher’s Note: The statements, opinions and data contained in all publications are solely those of the individual author(s) and contributor(s) and not of MDPI and/or the editor(s). MDPI and/or the editor(s) disclaim responsibility for any injury to people or property resulting from any ideas, methods, instructions or products referred to in the content. |
© 2025 by the authors. Licensee MDPI, Basel, Switzerland. This article is an open access article distributed under the terms and conditions of the Creative Commons Attribution (CC BY) license (https://creativecommons.org/licenses/by/4.0/).