Abstract
Effective control of calcium carbonate (CaCO3) scale formation is crucial to improve the performance and economic efficiency of water systems. This study investigates the impact of various scale inhibitors on the nucleation and crystallization processes of CaCO3. Calcium carbonate particles were synthesized by mixing CaCl2·2H2O and NaHCO3 solutions, in the presence of various scale inhibitors that had not previously been investigated using the experimental techniques employed in this study. Particle size distribution and zeta potential were analyzed using dynamic light scattering (DLS), while Ca+2 consumption and pH changes were monitored with ion-selective electrodes. Crystal morphology was evaluated using scanning electron microscopy (SEM) and cryo-transmission electron microscopy (cryo-TEM). We demonstrated that, in all samples, approximately 98% of the CaCO3 particles (sized between 400 and 840 nm) are formed within the first 30 min of synthesis, and these particles then aggregate to form larger particles (840–1100 nm in size). Due to the solution’s high supersaturation, the inhibitors influence calcium consumption only after 5 min of synthesis. All inhibitors, especially DTPMP, decrease calcium consumption and particle size during synthesis. The zeta potential and morphology of the particles in the samples containing inhibitors differed from those in the control group. Cryo-TEM observations revealed distinct nanometric precursor phases in the calcite crystallization process without inhibitors and different nanostructures when scale inhibitors were used. Moreover, conchoidal fractures were observed in the nanoparticles formed in the presence of DTPMP. This study demonstrates the effectiveness of various inhibitors in reducing calcium consumption in solution and altering the morphology of CaCO3 crystals, thereby preventing calcium carbonate (CaCO3) scale formation.
1. Introduction
Calcium carbonate is one of the most common scales found in oil and gas pipes. Controlling the scale deposition process effectively is a significant challenge, and using efficient inhibitors is economically crucial. One of the most successful methods for controlling calcium carbonate crystallization involves the use of chemical inhibitors, which are added to potentially fouling water systems. Developing a robust technique to prevent scale formation requires a thorough understanding of crystal nucleation, growth and their interaction with inhibitors. This knowledge facilitates the development and improvement of more effective chemical additives [1].
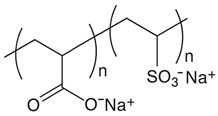
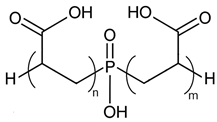
Scale inhibitors are molecules that either prevent or delay scale formation by binding to cations or interfering with intermediate stages of crystal growth. The most commonly used inhibitors in oil fields are amino phosphonates (phosphonates) and polymer-based compounds. Both classes are effective at low concentrations, typically a few milligrams per liter (ppm) or less and are known as threshold inhibitors. Moreover, phosphonates are more effective at inhibiting crystal growth, while polymeric inhibitors are better at preventing nucleation and acting as dispersants [2]. The main phosphonates used as scale inhibitors in the oil and gas industry include ATMP (amino tris-methylene phosphonic acid), HADMP (hexamethylene diamine tetra-methylene phosphonic acid) and DTPMP (diethylene triamine penta-methylene phosphonic acid), while polymeric scale inhibitors include PAA (polyacrylic acid), PVS (polyvinyl sulfonate), PMA (polymaleic acid) and PPCA (polyphosphine carboxylic acid) [3].
The performance of calcite scale inhibitors is usually investigated in high volumes of supersaturated solutions to evaluate factors like induction time, calcium ion concentration, solution pH, and precipitate morphological characteristics [4,5,6]. Studies have assessed the performance of some scale inhibitors—to prevent or decrease—CaCO3 crystallization under diverse conditions [7,8].
The presence of an inhibitor during crystal synthesis can affect crystal morphology, the calcium carbonate phase, the crystal lattice structure, and the overall consumption of calcium carbonate. The efficiency of an inhibitor is influenced by pH, ion strength, and the saturation index [4,5,7], depending on the initial concentration of calcium and carbonate ions in the solution.
Recognizing that some inhibitors act on nucleation while others affect particle growth, several authors have investigated the impact of mixing different inhibitors. Khormali et al. [9] developed a new mixture of scale inhibitors composed of three different phosphonates to enhance calcium sulfate scale inhibition in petroleum reservoirs. The inhibitors concentrations were optimized based on a synergistic inhibition effect, and the results indicated that the phosphonate mixture outperformed industrial inhibitors under all conditions (saturation ratio of CaSO4 was 1.2), with inhibition efficiencies exceeding 90% at any reservoir temperature (60–120 °C).
Zhang et al. [10] developed a simple method to synthesize Ca-DTPMP inhibitor nanomaterials by modifying the surface of PPCA molecules with sonication, aiming for scale control in oilfields. The nanomaterials and their nanofluid were characterized to understand their physicochemical properties. It was demonstrated that the carboxylate groups in the PPCA molecules act as a surfactant, inducing electrostatic repulsion and steric hindrance of particles.
Understanding the complex steps of nucleation, growth, and phase transitions at the nanoscale, remains a challenge. According to Kellermeier et al. [11], calcium carbonate precipitation follows a complex multi-stage process involving nanoclusters as precursors, particle attachment and amorphous phases as intermediates, which eventually transform into calcite or aragonite crystallites. Although the multi-stage process of calcite crystallization is widely accepted, direct visualization of nanostructures during the initial stages is limited. This is due to the rapid timescale of these reactions (ranging from seconds to minutes in pure systems, depending on the driving force), the nanoscale size of the structures and the challenges posed by the liquid-phase environment.
Liquid in situ Transmission Electron Microscopy (TEM) [12] and cryo-TEM [13] are the most appropriate techniques to visualize the precursor phases in liquid reactions. By ultrafast cooling the samples to cryogenic temperatures, cryo-TEM enables the observation of CaCO3 morphologies preserving the sample’s original structure and preventing ice crystal formation in solution. Therefore, cryo-TEM has been employed to identify CaCO3 precursors during the synthesis at the nanoscale, providing insights into the phase transformation mechanisms [14].
However, despite its potential, cryo-TEM sample preparation poses significant challenges, particularly in achieving adequate particle concentration and preserving the liquid-phase structures during blotting and freezing steps. Although some studies have used cryo-TEM to investigate phase transitions in pure CaCO3 [15], none have used this technique to investigate the structural characteristics of calcium carbonate nanoparticles in the presence of scale inhibitors. Therefore, high-resolution images obtained through cryo-TEM are important to support and refine current theories of calcium carbonate crystallization and to elucidate the influence of scale inhibitors on early-stage nucleation events.
Given the importance of understanding calcium carbonate crystallization in the presence of scale inhibitors, and the limited experimental data available for some inhibitors, this work aims to evaluate the influence of five distinct inhibitors on CaCO3 nucleation and crystallization. To achieve this goal, we: (1) monitored changes in free Ca+2 concentration and pH during CaCO3 synthesis; (2) evaluated particle size distribution and zeta potential; (3) characterized crystal morphology using Scanning Electron Microscopy (SEM) and (4) visualized the early stages of CaCO3 nucleation and crystal growth in the presence of HEMPA and DTPMP inhibitors using cryo-TEM.
2. Materials and Methods
2.1. Synthesis of Calcium Carbonate (CaCO3)
The composition of a typical scale-forming solution in the oil and gas industry contains 6870 ppm Na+, 1440 ppm Ca+2, 11,871 ppm Cl−, and 2196 ppm HCO3−, resulting in a supersaturation index (SI) of 1.25 [16]. Experiments were initially designed to replicate similar scaling conditions, a synthetic solution with SI = 1.16 was initially prepared using 4.5 g·L−1 of CaCl2·2H2O and 6.0 g·L−1 of NaHCO3. However, due to the analytical requirements for cryo-TEM analysis, which requires higher sample density after blotting, experiments were performed with more concentrated solutions (45 g·L−1 of CaCl2·2H2O and 60 g·L−1 of NaHCO3) resulting in SI = 2.43. These conditions provided sufficient material for imaging without compromising the qualitative assessment of scale morphology or inhibitor performance.
All results presented in the paper used CaCl2·2H2O and NaHCO3 solutions at 45 and 60 g·L−1, respectively (SI = 2.43). Tests with lower concentrations (4.5 and 6.0 g·L−1, (SI = 1.16)) are presented in the Supplementary Material and showed similar crystal morphology and inhibitor performance.
The scale inhibitors, generously provided by Dorf Ketal (Mumbai, India), were diluted as delivered to create 1000 ppm standard solutions. Table 1 shows the inhibitors investigated in this study and Table 2 details the densities of the inhibitors and the volumes added to 100 mL of deionized water to prepare the standard solutions.

Table 1.
Nomenclature, abbreviation and chemical structures of inhibitors.

Table 2.
Density of scale inhibitors and volume added to prepare 100 mL of 1000 ppm standard solutions.
After preparation, the pH of the NaHCO3 solution was adjusted to 7 with the addition of HCl. Then, 50 mL of CaCl2·2H2O and NaHCO solutions were combined, and 10 mL of the standard inhibitor solution was immediately added, ensuring a final inhibitor concentration of approximately 100 ppm (or 100 mg L−1). The resulting mixture was stirred continuously at 150 rpm using a magnetic stirrer. All experiments were carried out at room temperature (24 °C).
To characterize the crystals formed both in the presence and absence of the inhibitor, the solution was filtered through cellulose filter paper with a pore size of 0.2 μm. The solid material retained on the filter was rinsed with deionized water and dried at room temperature (~24 °C) for 24 h.
2.2. X-Ray Diffraction (XRD)
Analyses were performed using a Malvern Panalytical Empyrean 3rd generation X-ray (Malvern, UK) powder diffractometer with Cu Kα radiation (1.5406 Å). Data were collected over a range of 20–80°, with steps of 0.007° and time constant of 2 s. All diffractograms correspond to the calcite polymorph (see Supplementary Material).
2.3. Ion-Selective Electrode Measurement
To evaluate Ca+2 consumption during the reactions, both in the presence or absence of inhibitors, a Ca+2 ion-selective electrode (9720BNWP Orion, Thermo Fisher Scientific, Waltham, MA, USA) was used. The Ca2+-selective electrode was calibrated before each analysis using 10, 100 and 1000 mg·L−1 Ca2+ solutions, prepared from analytical-grade CaCl2·2H2O. The ionic strength was adjusted with NaCl to match the experimental matrix. The electrode potential was fitted to a Nernstian response (slope ~27 mV/decade at 24 °C), and only calibration curves with an R2 value exceeding 0.99 were accepted. Blanks were measured between runs to check for drift; and replicate solutions were used to confirm the reproducibility of the analyses. The free Ca+2 concentration in solution was monitored from the start of the reaction for up to 2 h. The pH of the solutions was continuously monitored using a pH meter calibrated with standard pH solutions of 4, 7, and 10.
Calcium consumption () and inhibitor efficiency () were calculated according to the Equations:
where corresponds to the initial concentration of calcium, corresponds to the calcium ions measured in solution after a period of time.
where corresponds to the calcium ions measured in solution after a period of time in the presence of an inhibitor and , in the absence of inhibitor.
2.4. Dynamic Light Scattering Analysis
The particle size distribution and zeta potential were investigated using dynamic light scattering (DLS) with a Zetasizer Nano ZS (Malvern Panalytical, Malvern, UK). During the reactions, 5 mL aliquots of the solutions were collected at intervals of 0.5, 0.75, 1, 2, 3, and 4 h, and analyzed via DLS. Each analysis consisted of 12 runs with an equilibrium time of 30 s and a scattering angle of 17 degrees.
For zeta potential measurements, the equipment was set to automatic mode, running until the sample reached stability, with a 30-s equilibrium time. The conductivity of the sample was also measured during zeta potential assessments.
Multiple measurements were performed to calculate the average. The particle size distribution and zeta potential data generated by the software were used to calculate the first order and zero-order moments, from which the average values were derived.
2.5. Scanning Electron Microscopy
The particles’ morphological analysis was conducted using a JEOL 7100 FT scanning electron microscope (Tokyo, Japan) with an acceleration voltage of 2 kV, equipped with an energy dispersive spectrometer (EDS) (Oxford Instruments, Abingdon, UK). Images were captured using a secondary electron detector at a working distance of approximately 10 mm, with magnifications of 1000×, 5000×, and 10,000×.
2.6. Cryo-Transmission Electron Microscopy (Cryo-TEM)
To observe the early stages of CaCO3 nucleation and crystallization, 10 mL of the 45 g L−1 CaCl2·2H2O solution was added to a beaker containing 10 mL of the 60 g L−1 NaHCO3 solution, and the resulting mixture (SI = 2.43) was stirred at 150 rpm. After specific time periods, a reaction aliquot was taken for freezing.
For cryo-TEM analysis, the samples were ultrafast frozen using Vitrobot equipment (Thermo Fisher Scientific, Waltham, MA, USA), which features a humidity and temperature-controlled chamber. A grid is held by tweezers onto which a drop of the sample is deposited. Excess of liquid is removed through blotting, followed by ultrafast freezing by immersing the grid into liquid ethane. This freezing process prevents ice crystal formation and keeps the sample at temperatures below −90 °C, ensuring the ethane remains in a liquid state.
The samples were analyzed using a JEOL 2100 F transmission electron microscope (Tokyo, Japan) with an acceleration voltage of 200 kV, equipped with an energy-dispersive spectrometer (EDS, Xplore 80 mm2, Oxford Instruments) and a CMOS 16 Megapixel OneView digital camera (Gatan Inc., Pleasanton, CA, USA). The grids were observed using a cryogenic sample holder (Model 914, Gatan), which maintains the sample at cryogenic temperatures during TEM observation.
3. Results and Discussion
3.1. Ion-Selective Electrode Measurement
A high supersaturated solution (SI = 2.43), containing calcium (0.3 M or 12.2 g·L−1) and bicarbonate (0.7 M or 43.6 g·L−1), was used to evaluate the effect of scale inhibitors in scale forming solutions. The reaction was initiated through the addition of NaHCO3 solution (with or without inhibitor) to a CaCl2·2H2O solution. The high level of supersaturation drives the solution to fast crystallization of CaCO3 during the first minutes of the reaction. Ca+2 concentration measured 1 min after the addition of the NaHCO3 solution (with or without inhibitor), ranged between 1500 and 1800 ppm, indicating that there was a consumption of 73.6% of Ca+2 (without inhibitor) in the first minute of reaction and reaching 92.1% (without inhibitor) after 30 min (Figure S1 and Table S1). This rapid decrease in calcium concentration corresponds to an initial stage dominated by nucleation and crystal growth. Between 30 and 120 min, calcium consumption slowed significantly, with only an additional 1.9% of the initial ions being consumed, suggesting a transition to a second stage characterized primarily by particle aggregation. Similar two-stage behavior was observed in the presence of inhibitors.
During the first 5 min, no inhibitor effect on calcium ion consumption was observed. The inhibitors only started to influence calcium consumption after approximately 5 min, when the calcium level reached about 1000 ppm (or 0.025 M), decreasing the driving force for the formation of solid CaCO3, and consequently, the crystallization rate (Figure 1). After 5 min, all solutions containing inhibitors showed higher calcium ion levels compared to the control group. DTPMP was the most efficient in reducing calcium consumption presenting 651 ppm (11.7%) of the calcium ions available in solution compared to 335 ppm (6.0%) in the sample without inhibitors (control) after 120 min of reaction (Table S1). Of all the inhibitors, PPCA showed the worst performance, with 462 ppm (8.3%) of the calcium ions available.
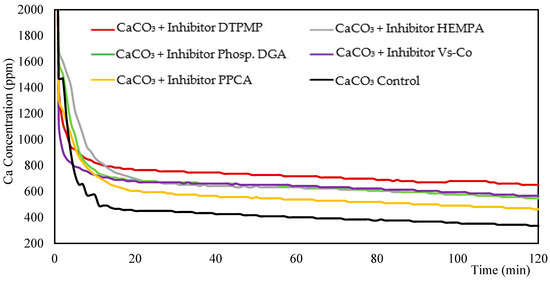
Figure 1.
Measurements of Ca+2 concentration (ppm) over time analyzed by Ca selective ion electrode from mixture of 45 g L−1 CaCl2·2H2O, 60 g L−1 NaHCO3 and 100 ppm inhibitor.
Complementary experiments performed at an SI of 1.16 (see Supplementary Material) produced similar qualitative results. At SI 1.16, the inhibitors exhibited a longer induction time, with nucleation occurring slowly (Figure S3 and Table S2). Table 3 presents the efficiency of each inhibitor, calculated according to Equation (2), for the CaCO3 synthesis with SIs of 2.43 and 1.16. The relative efficiency of the inhibitors at each SI level remained approximately the same, except for Phosp. DGA, which presented relatively higher efficiency after 2 h in the lower SI. These results suggest that the inhibition mechanisms in both SIs are similar.

Table 3.
Efficiency of the inhibitors after 2 h of synthesis, with SI of 2.43 and 1.16.
Scale inhibitors generally increase the saturation index of calcium carbonate by complexing with calcium ions in solution or adsorbing them on the surface of the particles. Complete inhibition of particle formation depends on the calcium and carbonate ion concentrations in the solution and the amount of inhibitor used. Among the inhibitors tested, PPCA showed the lowest concentration of free calcium ions after 120 min of reaction, indicating a lower efficiency in inhibiting the formation of calcium carbonate. PPCA is a polymeric inhibitor that acts mainly by inhibiting nucleation, a mechanism in which the antifouling molecule adsorbs onto the primary clusters or nuclei, thereby slowing down their growth kinetics [17]. Following the principles of Classical Nucleation Theory (CNT), clusters that fail to reach the critical size (typically ranging from 1 to 40 nm) are inherently metastable and tend to dissipate, reverting to constituent ionic species. When antifouling species associate with these incipient clusters, they impair the clusters further growth, preventing them from exceeding the critical size limit [18]. However, under the experimental conditions of this study, PPCA was the least effective inhibitor of particle growth. This may be due to the fact that, at high supersaturation, rapid nucleation and aggregation of CaCO3 particles surpass the inhibitory capacity. As a result, PPCA cannot adequately stabilize the system allowing the formation of larger crystals.
On the other hand, DTMP, Phosph. DGA and HEMPA showed the highest concentrations of free calcium ions at the end of the reaction, demonstrating a higher inhibitory effect. DTPMP is a non-polymeric inhibitor that contains five phosphonate groups linked to nitrogen (diethylenetriamine molecule), while both Phosph. DGA and HEMPA inhibitors contain two phosphonate groups. Therefore, it is possible that the anionic −PO3−2 groups have associated with the positive surface of CaCO3 particles, thus interfering in the reaction, preventing particle growth.
3.2. Dynamic Light Scattering Analysis
Figure 2 shows the particle size distribution. The dispersion of the particle size distribution curves was not pronounced but increased for longer synthesis periods (>0.5 h). Furthermore, the particle size distribution curves shift to the right during the first 0.75 h of reaction, indicating an increase in particle size during this period. After 0.75 h, the curves overlap, suggesting that the particle size remains almost constant.
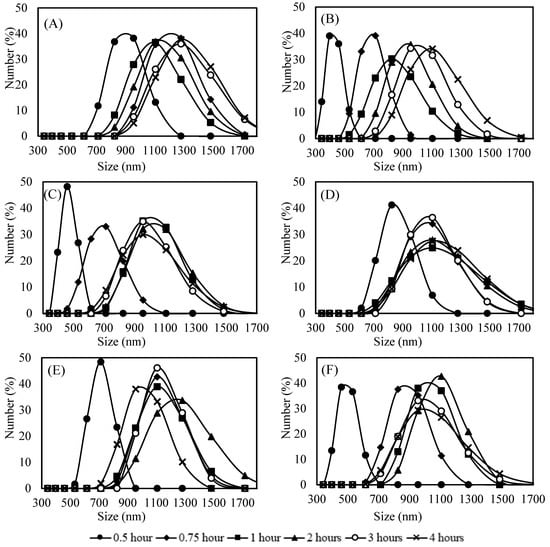
Figure 2.
Particle size distribution of samples with 45 g L−1 CaCl2·2H2O, 60 g L−1 NaHCO3 and 100 ppm inhibitor; (A) Control; (B) DTPMP; (C) HEMPA; (D) Phosph. DGA; (E) Vs-Co; (F) PPCA.
The stabilization of the particle size after 0.75 h is confirmed by the analysis of the average particle size over time (Figure 3). In the control group and in the PPCA sample, the average particle size after 0.5 h of synthesis was approximately 840 nm, stabilizing at around 1200 nm after 0.75 h. The Vs-Co sample exhibited an initial average size of 790 nm, which stabilized at 1000 nm after 0.75 h.
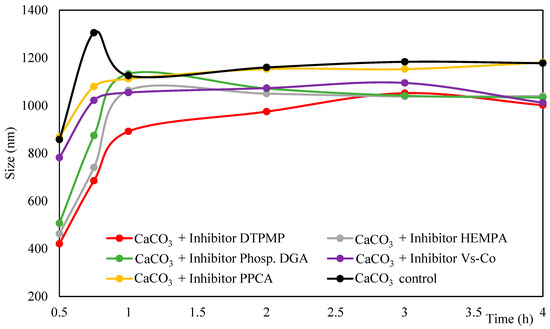
Figure 3.
Average particle size (in number) over time of samples with 45 g L−1 CaCl2·2H2O, 60 g L−1 NaHCO3 and 100 ppm inhibitor, analyzed by DLS.
In contrast, the samples containing DTPMP, HEMPA, and Phosp. DGA showed the formation of much smaller particles in the early stages. At 0.5 h, the particle size distributions included a significant population between 300 and 700 nm, with average diameters around 500 nm, as evidenced in Figure 3. The high collision efficiency of these smaller particles with larger ones likely promotes the formation of a second particle population (700–1000 nm) after 1 h of reaction. After this point, the particle growth becomes less pronounced, suggesting a reduction in agglomeration rates. This transient behavior indicates that these inhibitors act primarily in the generation of very small particles, which later aggregate, leading to a temporary increase in particle’s average size.
On the other hand, in control, Vs-Co and PPCA samples, the presence of larger particles from the early stages suggests that particle formation in these cases occurs more rapidly and is less affected by agglomeration processes. This observation aligns with the hypothesis that the action of the inhibitor was interrupted due to supersaturation of the medium, causing rapid nucleation and aggregation of calcium carbonate particles.
After 3 h, the particle size tends to stabilize for all samples. Specifically, around 1000 nm in the presence of DTPMP, HEMPA, Phosph. DGA, and Vs-Co, and approximately 1200 nm in control and PPCA samples.
3.3. Zeta Potential Analysis
Figure 4 shows zeta potential distribution for samples, demonstrating a wide dispersion (ranging from −100 to +100 mV), and a tendency toward increased zeta potential for samples containing Vs-Co and PPCA inhibitors with increasing synthesis time. This shift suggests a potential improvement in the stability of the suspensions, as values greater than +30 mV were reached in these cases (Figure 4E,F).
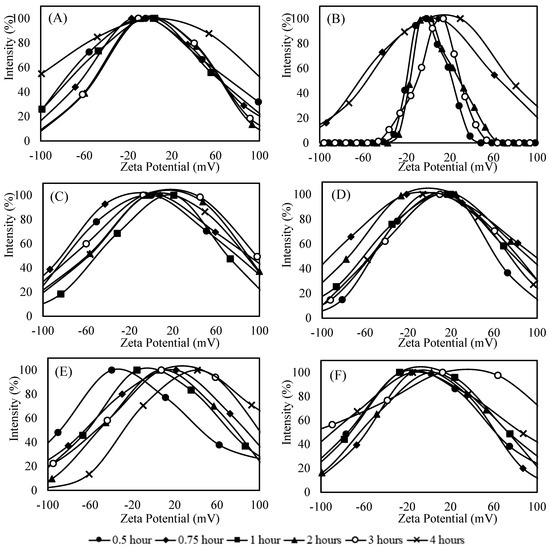
Figure 4.
Zeta Potential distribution of samples with 45 g L−1 CaCl2·2H2O, 60 g L−1 NaHCO3 and 100 ppm inhibitor; (A) Control; (B) DTPMP; (C) HEMPA; (D) Phosph. DGA; (E) Vs-Co; (F) PPCA.
A slight increase in average zeta potential was observed up to approximately 3 h of reaction for the samples containing DTPMP, HEMPA, Phosph. DGA, and Vs-Co, after which the values remained relatively stable (Figure 5). In contrast, in the control group and in the presence of PPCA, the average zeta potential increased only during the first hour and then stabilized.
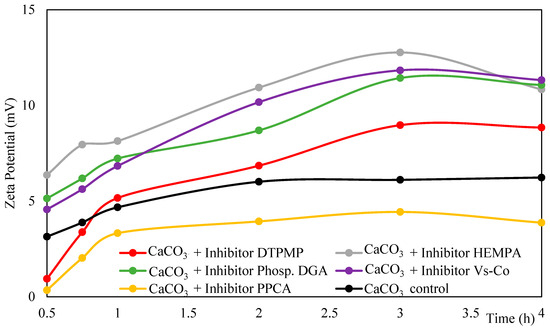
Figure 5.
Average zeta potential over time of samples with 45 g L−1 CaCl2·2H2O, 60 g L−1 NaHCO3 and 100 ppm inhibitor, analyzed by DLS.
Although higher zeta potential values were observed in most inhibitor-containing samples (except PPCA) compared to control, the stability of the suspension cannot be attributed solely to zeta potential. As discussed previously, particle size distribution also plays a critical role in aggregation behavior. In systems where low zeta potential coincides with a mixed population of very small and larger particles (samples with DTPMP and HEMPA), particularly within the first hour, there is a higher probability of agglomeration due to enhanced collision efficiency (Figure 2B,C and Figure 4B,C). Conversely, in cases where the zeta potential is low, but the population consists predominantly of larger particles (control, Vs-Co and PPCA), aggregation is less likely (Figure 2E,F and Figure 4E,F). Therefore, the stability of the system arises from the combined effect of surface charge and particle size distribution, which together explain why certain dispersions with relatively low zeta potential remain stable, while others undergo early aggregation.
The relative abundance of positively and negatively charged sites on the surface of calcium carbonate particles is governed by protonation and deprotonation reactions at surface sites, which are influenced by the chemical species present in solution and strongly dependent on pH (Reactions 1–6) [19]. Therefore, it is common to see the surface charge and/or zeta potential plotted as a function of pH, with the surface charge and/or zeta potential becoming more negative as pH increases and the deprotonation (Reaction 4) is favored, and more positive as pH decreases and the protonation (Reaction 5) is favored [20]. A net surface charge of zero is observed when the number of positively and negatively charged surface sites is exactly balanced.
In addition to pH other factors influence the surface charge of calcium carbonate in solution. Since calcium carbonate is soluble in aqueous media, the lattice ions Ca+2 and CO3−2 can either be released into solution or redeposited onto the surface, depending on the pH of the medium [18]. Furthermore, atmospheric CO2 in open system experiments can dissolve into solutions, affecting the pH and equilibrium concentrations of Ca+2, CO3−2, and HCO3− [21].
In the present study, the pH of all samples decreased abruptly during the first 5 min of the reaction, reaching a minimum value, which varies between 5.3 and 5.8 (Figure 6). As calcium carbonate particles begin to form, the concentration of Ca+2 ions in solution, along with carbonate ions, decreases as they are removed from the solution to form particles. Consequently, the pH of the solution drops.
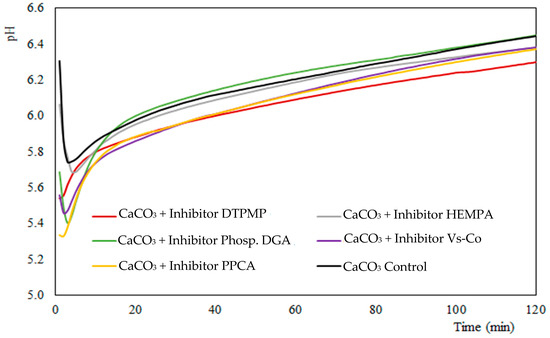
Figure 6.
pH measurements over time from mixture of 45 g L−1 CaCl2·2H2O, 60 g L−1 NaHCO3 and 100 ppm inhibitor.
Following that, an increase in pH is observed within the first 0.5 h of synthesis, favoring the deprotonation (Reaction 4). This increase may be due most likely to two factors: (1) dissolution of metastable vaterite and reprecipitation in the form of calcite and (2) carbonate depletion of the solution because of the acid pH and CO2 release in the atmosphere (open system). In this condition, the inhibitors are likely adsorbed onto the surface of calcium carbonate particles, which helps maintain a higher concentration of Ca+2 ions in the solution compared the control group (Figure 1) and contributes to increase the particles’ zeta potential (Figure 5).
Specifically, the inhibitors Phosph. DGA, HEMPA and DTPMP contain PO3H2 terminal groups that can be partially deprotonated at the experimental pH, thus forming PO3−2. These negatively charged molecules are adsorbed onto the positively charged surface of calcium carbonate particles via electrostatic attraction (Figure 5), thereby decreasing the available surface area for crystal growth. As a result, the rate of particle growth decreases (Figure 3), and the concentration of Ca+2 ions in solution remains higher compared to the solution without inhibitor (Figure 1).
3.4. Morphological Characterization by Scanning Electron Microscopy
CaCO3 precipitates were analyzed through scanning electron microscopy (SEM) in the absence and presence of scale inhibitors. Although these images do not represent the initial stages of crystal formation, they provide valuable insight into the morphological changes that occur during crystal growth.
In the control sample, calcium carbonate crystals developed mainly into regular rhombohedral morphology, indicating the formation of calcite (Figure 7A). In the presence of inhibitors, crystal morphology differed from that of the control precipitates. The crystals formed with scale inhibitors show irregular surfaces, lacking smooth facets, and exhibit some structural defects that give them a fractured appearance (Figure 7B–F). The CaCO3 crystals appeared completely deformed and irregular, with some forming spherical structures when the DTPMP inhibitor was present (Figure 7B). EDS analyses of CaCO3 precipitates in the presence and absence of inhibitors are shown in Figure S6 of the Supplementary Material.
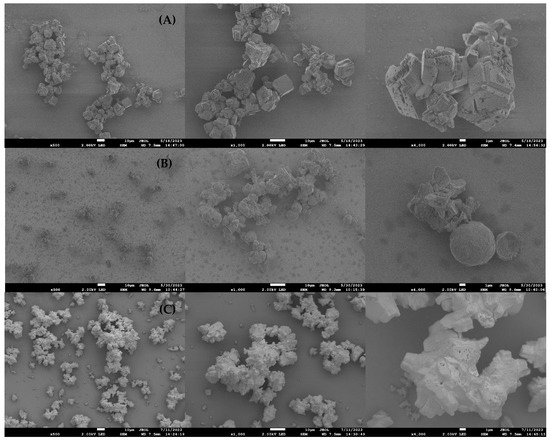
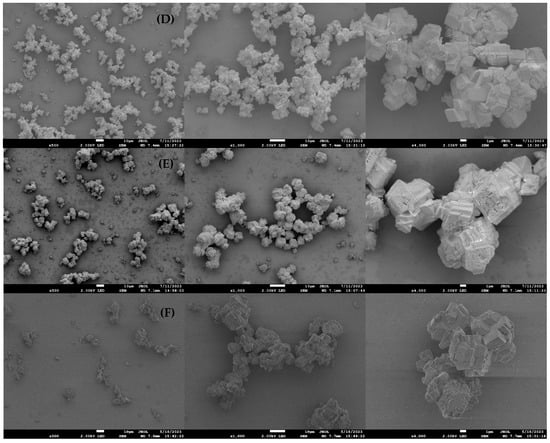
Figure 7.
SEM micrographs after 4 h of 45 g L−1 CaCl2·2H2O and 60 g L−1 NaHCO3 synthesis (A) CaCO3 control; (B) DTPMP; (C) HEMPA; (D) Phosph. DGA; (E) Vs-Co; (F) PPCA. For each sample three different magnifications are presented: 500×, 1000× and 4000×.
In general, the presence of inhibitors decreased the area of {104} facets in the crystallites. This effect could be related to the interaction between the inhibitor molecule and the crystal surface. The inhibitors act by blocking the surface and preventing the binding of scale ions. Some crystalline planes of calcite crystal could be more attractive to the phosphonate groups and grow slowly, deforming the typical rhombohedral calcite shape and forming new morphologies. Molecules could be trapped in the crystal surface forming holes and defects. Similar findings were reported by Kiaei and Haghtalab [4], who studied nano-sized Ca-DTPMP inhibitors for calcite growth inhibition. They observed that the crystals formed with defects, which became more pronounced when nano-sized Ca-DTPMP nanoparticles were used. The authors attributed this effect to the adsorption of Ca-DTPMP on the CaCO3 crystal surface, leading to a change in crystal morphology from sharp-edged rhombohedral to spherical shapes.
3.5. Evaluation of Calcium Carbonate Crystallization by Cryo-TEM
Different stages of CaCO3 crystal formation were observed by cryo-TEM. Figure 8 shows images of a sample synthesized without inhibitors. A CaCO3 precursor phase formed by an agglomeration of pre-nucleation cluster <40 nm was visible after 2 min of reaction (Figure 8A). EDS analyses showed that the clusters were composed of Ca ions excluding the possibility of artefacts such as crystalline water nanoparticles. There was a denser region suggesting an agglomeration of pre-nucleation clusters that would eventually be transformed into a calcite crystal. Probably much smaller precursor nanostructures were present in the frozen solution but could not be observed or detected by EDS. The spatial resolution and X-ray detection in cryo-TEM technique is reduced compared to conventional TEM due to the water layer (~50 nm) where the nanometric clusters are immersed. Events of absorption and fluorescence increase in thick samples preventing the detection of small calcium amounts by EDS. In addition, chromatic aberration caused by inelastic scattering increases with the sample thickness, decreasing image resolution.
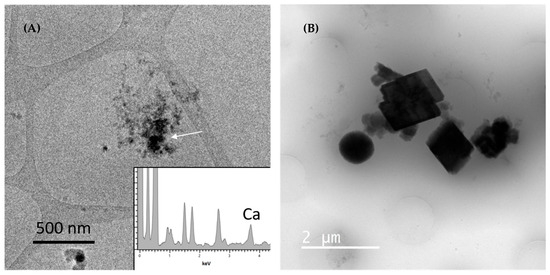
Figure 8.
Cryo-TEM images of 45 g L−1 CaCl2·2H2O and 60 g L−1 NaHCO3 synthesis without inhibitors, frozen at 2 min of reaction. (A) Agglomeration of pre-nucleation clusters (~40 nm). Arrow indicates a denser region, probably the beginning of phase transformation. Insert: EDS obtained in cryo-TEM mode confirming the presence of Ca in the nanoparticles. (B) Large CaCO3 crystallites of spherical vaterite particles and rhombohedral calcite particles.
The pre-nucleation clusters observed in Figure 8A were not homogeneously distributed in the vitreous water thin layer of the TEM grid but were relatively rare and punctual. These clusters were more difficult to observe in less supersaturated solutions and in longer synthesis periods (more than 30 min). We hypothesize that the pre-nucleation clusters are a transient phase, possibly occurring only a few minutes before aggregation and transformation into calcite or vaterite crystals.
Figure 8B shows a cryo-TEM image of spherical and rhombohedral CaCO3 particles (~1 to 2 µm). The spherical particle is likely the vaterite phase, a CaCO3 transient polymorph, while the rhombohedral shape is typical of calcite phase. These images indicate that the CaCO3 syntheses performed in this work present at least two precursor phases before the final rhombohedral calcite phase, the nanoclusters and the vaterite microspheres. These results suggest that agglomeration of nanoclusters (~40 nm) rich in calcium ions undergo densification and transform into large CaCO3 particles of vaterite and/or calcite (~1 µm). The vaterite particles may transform into the final calcite phase by dissolution, precipitation or solid phase transformation [22]. The size of calcite crystals in Figure 8B corresponds to the average particle size obtained by DLS (840 nm). The presence of inhibitors could prevent clusters agglomeration decreasing the nucleation events or increasing the time for nucleation and/or growth in solution.
Additional cryo-TEM experiments were conducted with HEMPA and DTPMP inhibitors to investigate their influence in the early stage of CaCO3 crystallization in solution. The HEMPA inhibitor presents two PO3−2 sites linked to a nitrogen ion, while the DTPMP inhibitor contains five PO3−2 sites linked to three nitrogen ions. It is expected that PO3−2 group will interact with the surface of CaCO3 particles decreasing growth and deforming the shape of particles.
Figure 9 shows CaCO3 particles after 5 min of reaction in the presence of HEMPA (Figure 9A) and after 30 min of reaction in the presence of DTPMP (Figure 9B). In Figure 9A rhombohedral crystals were observed together with amorphous CaCO3 particles, while Figure 9B shows a quite different CaCO3 morphology, a branched, non-ordered structure composed of fragmented CaCO3 particles. An EDS map obtained in STEM mode of this region is presented in the Supplementary Material confirming that this structure is composed of calcium and carbon. The elongated branched region may result from the presence of DTPMP, which binds to specific crystal faces, inhibits growth in certain directions, and eventually becomes incorporated into the crystals.
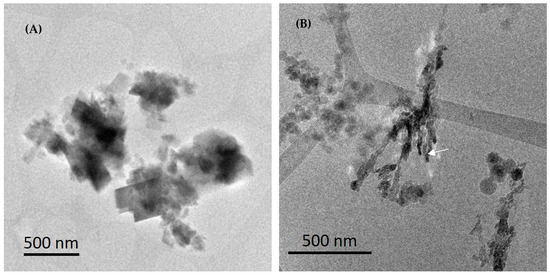
Figure 9.
Cryo-TEM images of 45 g L−1 CaCl2·2H2O and 60 g L−1 NaHCO3 synthesis (SI = 2.43) with inhibitors (A) HEMPA, frozen at 5 min of reaction. (B) DTPMP, frozen at 30 min of reaction. White arrow indicates conchoidal fractures in the crystal.
The arrow in Figure 9B indicates conchoidal fractures in the CaCO3 particles. Calcite crystals generally cleave or fracture along the {104} planes due to their relatively weaker bonding. However, if an organic molecule is incorporated into the bulk of a crystal, it can induce conchoidal fractures instead of {104} fractures. Conchoidal fractures are characteristic of brittle materials such as glass and result in non-planar, curved surfaces when cleaved. Conchoidal fractures have been observed in the calcitic spicules of marine sponges and have been linked to the presence of trace amounts of organic macromolecules within the biomineral [23].
CaCO3 particles could not be visualized by cryo-TEM in DTPMP samples at shorter reaction times, likely due to a reduced number of nucleation events in solution. This contrasts with the control group (without inhibitor) and the sample with HEMPA, where particles were detected.
These results strongly suggest that these inhibitors, in special DTPMP, act at the nanoscale, since the crystals observed by cryo-TEM are only a few nanometers in size or smaller. This nanoscale activity helps explain the high efficiency of these compounds in preventing scale formation (encrustation).
4. Conclusions
Encrustation (scale formation) in oil reservoirs, particularly within large pre-salt deposits, is a critical issue that must be addressed to maintain efficient flow during oil production. In this context, this research focuses on studying the impact of different scale inhibitors on the formation of calcium carbonate crystals.
Comparative analysis of average particle size, zeta potential, and free Ca+2 ion concentration demonstrated that scale inhibitors significantly influence both nucleation and crystal growth. Under the highly supersaturated conditions used in this study, calcium carbonate precipitation occurred rapidly within the first minutes of reaction. Following this initial stage, all tested inhibitors were able to delay crystallization to some extent. Among them, DTPMP was the most effective, maintaining the highest levels of calcium in solution and substantially reducing particle growth and size. HEMPA and Phosph. DGA showed similar and satisfactory performance, likely due to interactions between their phosphonate groups and the positively charged particle surfaces, which contributed to a deceleration of crystal growth. In contrast, PPCA was the least effective under these conditions. These results emphasize how the inhibitor’s chemical structure and mechanism of action influence their performance, especially in high supersaturation conditions.
SEM analyses demonstrated that the presence of inhibitors alters the morphology of CaCO3 crystals at the microscale compared to the control group. This result was confirmed by cryo-TEM analyses, which provided nanoscale images of DTPMP and HEMPA samples during the early stages of synthesis. DTPMP, the most effective inhibitor, induced the formation of branched, elongated CaCO3 particles with conchoidal fractures, reinforcing the modulation effect of these molecules at the nanoscale. In contrast, cryo-TEM images of the control group indicated that CaCO3 particles were formed by agglomeration of pre-nucleation clusters in solution as early as 2 min into the reaction. Overall, these results confirm that effective scale inhibition involves multi-scale action in the CaCO3 crystallization pathway.
- Nucleation (nanoscale): Inhibitors affect nanocluster aggregation.
- Growth stage (<1 µm): Inhibitors reduce initial particle sizes, delay growth (e.g., HEMPA, Phosph. DGA), and alter aggregation dynamics (PPCA, Vs-Co).
- Final stage (>1 µm): Inhibitors distort the crystal morphology and generate defects. Inhibitors delay or prevent ion consumption and modify surface charge in all stages.
Supplementary Materials
The following supporting information can be downloaded at https://www.mdpi.com/article/10.3390/min15090947/s1: Figure S1: Average particle size (in number) over time of samples with 4.5 g·L−1 CaCl2·2H2O, 6.0 g·L−1 NaHCO3 and 100 ppm inhibitor, analyzed by DLS; Figure S2: Average zeta potential over time of samples with 4.5 g·L−1 CaCl2·2H2O, 6.0 g·L−1 NaHCO3 and 100 ppm inhibitor, analyzed by DLS; Figure S3: Measurements of Ca+2 concentration (ppm) over time analyzed by Ca selective ion electrode from mixture of 4.5 g·L−1 CaCl2·2H2O, 6.0 g·L−1 NaHCO3 and 100 ppm inhibitor; Figure S4: pH measurements over time from mixture of 4.5 g·L−1 CaCl2·2H2O, 6.0 g·L−1 NaHCO3 and 100 ppm inhibitor; Figure S5: SEM micrographs after 4 h of 4.5 g·L−1 CaCl2·2H2O and 6.0 g·L−1 NaHCO3 synthesis (A) CaCO3 control; (B) inhibitor DTPMP; (C) inhibitor HEMPA; (D) inhibitor Phosph. DGA; (E) inhibitor Vs-Co; (F) inhibitor PPCA; Figure S6: SEM and EDS of the synthesis of 4.5 g·L−1 CaCl2·2H2O and 6.0 g·L−1 NaHCO3 after 4 h (A) CaCO3 control; (B) inhibitor DTPMP; (C) inhibitor HEMPA; (D) inhibitor Phosph. DGA; (E) inhibitor Vs-Co; (F) inhibitor PPCA. Inserts: calcium maps; (G) sum spectra of the regions indicated by dashed lines; Figure S7: EDS map and STEM-DF image obtained in cryo-TEM of the synthesis product of 45 g·L−1 CaCl2·2H2O and 60 g·L−1 NaHCO3 with DTPMP inhibitors, frozen at 30 min; Figure S8: XRD of 45 g·L−1 CaCl2·2H2O and 60 g·L−1 NaHCO3 after 4 h of synthesis; Figure S9: XRD of 4.5 g·L−1 CaCl2·2H2O and 6.0 g·L−1 NaHCO3 after 4 h of synthesis; Table S1: Concentration of Ca+2 in solution and percentage of Ca+2 consumed over time measured by Ca selective ion electrode in syntheses containing 45 g·L−1 CaCl2·2H2O, 60 g·L−1 NaHCO3 and 100 ppm inhibitor; and Table S2: Concentration of Ca+2 in solution and percentage of Ca+2 consumed over time measured by Ca selective ion electrode in syntheses containing 4.5 g·L−1 CaCl2·2H2O, 6.0 g·L−1 NaHCO3 and 10 ppm inhibitor.
Author Contributions
Conceptualization, A.L.R. and A.G.B.J.; methodology, V.P.L.; validation, A.L.R. and A.G.B.J.; formal analysis, V.P.L.; investigation, V.P.L.; resources, R.B.; data curation, R.G. and F.M.; writing—original draft preparation, V.P.L.; writing—review and editing, A.L.R. and A.G.B.J.; supervision, A.L.R. and A.G.B.J. All authors have read and agreed to the published version of the manuscript.
Funding
This research was funded by CNPq-Brazil (308577/2023-0 and 403572/2023-1), FAPERJ-Brazil (E-26/201.267/2022) and FINEP-Brazil (PROINFRA 2023).
Data Availability Statement
Data are contained within the article and Supplementary Materials.
Conflicts of Interest
The authors declare no conflict of interest.
References
- Macadam, J.; Parsons, S.A. Calcium carbonate scale control, effect of material and inhibitors. Water Sci. Technol. 2004, 49, 153–159. [Google Scholar] [CrossRef]
- Frenier, W.W.; Ziauddin, M. Formation, Removal, and Inhibition of Inorganic Scale in the Oilfield Environment; Society of Petroleum Engineers: Richardson, TX, USA, 2008. [Google Scholar]
- Kelland, M.A. Production Chemicals for the Oil and Gas Industry; CRC Press: Boca Raton, FL, USA, 2014. [Google Scholar]
- Kiaei, Z.; Haghtalab, A. Experimental study of using Ca-DTPMP nanoparticles in inhibition of CaCO3 scaling in a bulk water process. Desalination 2014, 338, 84–92. [Google Scholar] [CrossRef]
- Chen, T.; Neville, A.; Sorbie, K.; Zhong, Z. In-situ monitoring the inhibiting effect of polyphosphinocarboxylic acid on CaCO3 scale formation by synchrotron X-ray diffraction. Chem. Eng. Sci. 2009, 64, 912–918. [Google Scholar] [CrossRef]
- Andrei, M.; Gagliardi, F. Redissolution studies in bulk and in coreflood for PPCA scales inhibitor. J. Pet. Sci. Eng. 2004, 43, 35–55. [Google Scholar] [CrossRef]
- Malaie, K.; Shojaei, O.; Iranpour, S.; Taherkhanu, Z. Crystal growth inhibition of gypsum under normal conditions and high supersaturations by a copolymer of phosphino-polycarboxylic acid. Heliyon 2021, 7, 6064. [Google Scholar] [CrossRef]
- Jarrahian, K.; Sorbie, K.; Singleton, M.; Boak, L.; Graham, A. Building a fundamental understanding of scale inhibitor retention in carbonate formations. SPE Prod. Oper. 2019, 35, 085–097. [Google Scholar] [CrossRef]
- Khormali, A.; Sharifov, A.R.; Torba, D.I. Increasing efficiency of calcium sulfate scale prevention using a new mixture of phosphonate scale inhibitors during waterflooding. J. Pet. Sci. Eng. 2018, 164, 245–258. [Google Scholar] [CrossRef]
- Zhang, P.Q.; Shen, D.; Ruan, G.; Kan, A.T.; Tomson, M.B. Phosphino-polycarboxylic acid modified inhibitor nanomaterial for oilfield scale control: Synthesis, characterization and migration. J. Ind. Eng. Chem. 2016, 45, 366–374. [Google Scholar] [CrossRef]
- Kellermeier, M.; Gebauer, D.; Melero-García, E.; Drechsler, M.; Talmon, Y.; Kienle, L.; Cölfen, H.; García-Ruiz, J.M.; Kunz, W. Colloidal stabilization of calcium carbonate prenucleation clusters with silica. Adv. Funct. Mater. 2012, 22, 4301–4311. [Google Scholar] [CrossRef]
- De Yoreo, J.J. In-situ liquid phase TEM observations of nucleation and growth processes. Prog. Cryst. Growth Charact. Mater. 2016, 62, 69–88. [Google Scholar] [CrossRef]
- Walker, J.M.; Marzec, B.; Nudelman, F. Solid-state transformation of amorphous calcium carbonate to aragonite captured by cryoTEM. Angew. Chem. Int. Ed. 2017, 56, 11740–11743. [Google Scholar] [CrossRef]
- Dalmônico, G.M.L.; López, E.O.; Longuinho, M.M.; Checca, N.R.; Farina, M.; Ersen, O.; Rossi, A.R.; Rossi, A.L. Insight by Cryo-TEM into the growth and crystallization processes of calcium phosphate nanoparticles in aqueous medium. Mater. Chem. Phys. 2019, 237, 121862. [Google Scholar] [CrossRef]
- Pouget, E.M.; Bomans, P.H.H.; Goos, J.A.C.M.; Frederik, P.M.; de With, G.; Sommerdijk, N.A.J.M. The Initial Stages of Template-Controlled CaCO3 Formation Revealed by Cryo-TEM. Science 2009, 323, 1455. [Google Scholar] [CrossRef]
- Chen, T.; Neville, A.; Yuan, M. Calcium carbonate scale formation—Assessing the initial stages of precipitation and deposition. J. Pet. Sci. Eng. 2005, 46, 185–194. [Google Scholar] [CrossRef]
- Thombre, S.M.; Sarwade, B.D. Synthesis and biodegradability of polyaspartic acid: A critical review. J. Macromol. Sci. Part A 2005, 42, 1299–1315. [Google Scholar] [CrossRef]
- Stumm, W.; Wehrli, B.; Wieland, E. Surface complexation and its impact on geochemical kinetics. Croat. Chem. Acta 1987, 60, 429. [Google Scholar]
- Van Cappellen, P.; Charlet, L.; Stumm, W.; Wersin, P. A surface complexation model of the carbonate mineral-aqueous solution interface. Geochim. Cosmochim. Acta 1993, 57, 3505–3518. [Google Scholar] [CrossRef]
- Davis, J.A.; Kent, D. Surface complexation modeling in aqueous geochemistry. Rev. Mineral. Geochem. 1990, 23, 177–260. [Google Scholar]
- Eriksson, R.; Merta, J.; Rosenholm, J.B. The calcite/water interface: Surface charge in indifferent electrolyte media and the influence of low-molecular-weight polyelectrolyte. J. Colloid Interface Sci. 2007, 313, 184–193. [Google Scholar] [CrossRef]
- Rodriguez-Blanco, J.D.; Shaw, S.; Benning, L.G. The kinetics and mechanisms of amorphous calcium carbonate (ACC) crystallization to calcite, via vaterite. Nanoscale 2011, 3, 265–271. [Google Scholar] [CrossRef]
- Rossi, A.L.; Campos, A.P.C.; Barroso, M.M.S.; Klautau, M.; Archanjo, B.S.; Borojevic, R.; Farina, M.; Werckmann, J. Long-range crystalline order in spicules from the calcareous sponge Paraleucilla magna (Porifera, Calcarea). Acta Biomater. 2014, 10, 3875–3884. [Google Scholar] [CrossRef] [PubMed]
Disclaimer/Publisher’s Note: The statements, opinions and data contained in all publications are solely those of the individual author(s) and contributor(s) and not of MDPI and/or the editor(s). MDPI and/or the editor(s) disclaim responsibility for any injury to people or property resulting from any ideas, methods, instructions or products referred to in the content. |
© 2025 by the authors. Licensee MDPI, Basel, Switzerland. This article is an open access article distributed under the terms and conditions of the Creative Commons Attribution (CC BY) license (https://creativecommons.org/licenses/by/4.0/).


