Article

Engineered Organo-Clay Nanocomposites for Dual Cationic/Anionic Dye Removal: Role of Polyethylene Glycol Chain Length

1
Laboratoire de Chimie des Matériaux, Catalyse et Réactivité LCMCR, Université Hassiba Ben Bouali, Chlef 02010, Algeria
2
Faculté Science Exacte Et Informatique, Département de Chimie, Université Hassiba Ben Bouali, Chlef 02010, Algeria
3
Laboratoire de Chimie Physique, Macromoléculaire L.C.P.M, University of Oran1 Ahmed Ben Bella, El-Menaouer, Oran 31000, Algeria
4
Laboratory of Materials Chemistry L.C.M, University of Oran1 Ahmed Ben Bella, BP 1524, El-Mnaouer, Oran 31000, Algeria
5
Institute of Applied Sciences and Techniques (ISTA), University of Oran1 Ahmed Ben Bella, BP 1524, El-Mnaouer, Oran 31000, Algeria
6
Department of Process Engineering, Faculty of Science and Technology, University of Relizane, Relizane 48000, Algeria
7
Department of Chemistry, Faculty of Science and Technology, University of Relizane, Relizane 48000, Algeria
8
Department of Materials Engineering, Faculty of Chemistry, University of Sciences and Technology Mohamed Boudiaf, BP 1505, El-Mnaouer, Oran 31000, Algeria
9
Department of Industrial Engineering, University of Salerno, Via Giovanni Paolo II 132, 84084 Fisciano, Italy
10
Chemistry Department, College of Science, King Khalid University (KKU), Abha 61413, P.O. Box 9004, Saudi Arabia
11
Catalysis Research Group (CRG), Department of Chemistry, College of Science, King Khalid University, Abha 61413, P.O. Box 9004, Saudi Arabia
*
Author to whom correspondence should be addressed.
Minerals 2025, 15(9), 935; https://doi.org/10.3390/min15090935
Submission received: 30 June 2025 / Revised: 12 August 2025 / Accepted: 25 August 2025 / Published: 2 September 2025
(This article belongs to the Special Issue Organo-Clays: Preparation, Characterization and Applications)

Abstract

Water pollution by organic dyes poses serious environmental and health challenges, demanding efficient and selective remediation methods. In this study, we engineered tailored organo-clay nanocomposites by modifying montmorillonite with hexadecyltrimethylammonium bromide (HTAB) and intercalating polyethylene glycol (PEG) chains of two distinct molecular weights (PEG200 and PEG4000). Comprehensive characterization techniques (XRD, FTIR, SEM, zeta potential, and TGA) confirmed the successful modification of the composites. Notably, PEG4000 promoted significant interlayer expansion, as evidenced by the shift of the (00l) reflection corresponding to the basal spacing d, indicating an increase in basal spacing. This expansion contributed to the formation of a well-ordered porous framework with uniformly distributed pores. In contrast, PEG200 produced smaller pores with a more uniform distribution but induced less pronounced interlayer expansion. Adsorption tests demonstrated rapid kinetics, achieving equilibrium in under 15 min, and impressive capacities: 420 mg/g of methylene blue (MB) adsorbed on PEG200/MMT@HTAB, and 385 mg/g of Congo red (CR) on PEG4000/MMT@HTAB. The crucial role of PEG chain length in adsorption selectivity was assessed, showing that shorter PEG chains favored methylene blue adsorption by producing narrower pores and faster kinetics, while longer PEG chains enhanced CR uptake via a stable, interconnected pore network that facilitates diffusion of larger dye molecules. Thermodynamic and Dubinin–Radushkevich analyses confirmed that the adsorption was spontaneous, exothermic, and predominantly driven by physical adsorption mechanisms involving weak van der Waals and dipole interactions. These findings highlight the potential of PEG-modified montmorillonite nanocomposites as cost-effective, efficient, and tunable adsorbents for rapid and selective removal of organic dyes in wastewater treatment.

1. Introduction

Water contamination by harmful substances represents a serious threat to living organisms. Untreated industrial effluents containing water-soluble organic dyes pose direct risks to human health due to their carcinogenic and acute toxic effects [1,2,3]. Approximately 50,000 tons of dyes used annually in industries such as textiles, painting, paper, and cosmetics are discharged into the environment [4]. Dye-contaminated water poses multiple risks to both marine ecosystems and human health, as dyes are inherently persistent, resistant to oxidizing agents, and difficult to degrade aerobically [5]. Therefore, removing dyes from wastewater is essential and continues to be a major focus of environmental research. Various treatment methods, such as membrane separation, biodegradation, coagulation-flocculation, photocatalysis, and adsorption, have been extensively studied for wastewater remediation [6]. However, many of these techniques face practical limitations due to high costs, operational complexity, and demanding synthetic processes. Among these, adsorption stands out as a promising alternative because of its simplicity, high efficiency, and cost-effectiveness. Adsorption can occur via physical adsorption (physisorption), which involves weak, reversible van der Waals interactions, or chemical adsorption (chemisorption), characterized by stronger, often irreversible chemical bonds between adsorbate and adsorbent [7,8]. Understanding these mechanisms is crucial for designing effective adsorbents tailored to specific contaminants. The essential characteristics of an effective adsorbent include low cost, high adsorption capacity, and selectivity. Additionally, it is crucial to evaluate the toxicity of the adsorbent material to avoid secondary pollution during the treatment process. Therefore, the design and development of suitable adsorbent systems that balance performance with environmental safety are of paramount importance. Although many studies have focused on the removal of pollutants from wastewater, comparatively less attention has been given to assessing the environmental toxicity of the adsorbents themselves [9,10]. Several adsorbents have been reported to be effective only under extreme conditions, such as high temperatures and low pH, which are rarely encountered in practice [11]. Moreover, these materials often show selectivity, exhibiting a higher affinity for either acidic or basic dyes depending on their surface charge, further limiting their practical application. In recent years, a variety of adsorbents have been extensively utilized for the removal of cationic dyes (e.g., methylene blue, crystal violet) and anionic dyes (e.g., Congo red, acid blue 113), including carbon nanotubes [12], barium phosphate [13], polysaccharides [2,14], activated carbon [15], alginate beads [16], graphene/montmorillonite composites [17], poly(vinyl alcohol)/montmorillonite [18], smectites [19], zeolites [20], and various economical natural materials such as bamboo carbon, pomace, pumice powder, banana leaves, wood shavings, and corn husk [21,22,23]. Recent advancements in organo-clay nanocomposites [24], particularly those based on montmorillonite modified with hexadecyltrimethylammonium bromide (HTAB), have demonstrated significant potential for dye removal due to tailored surface charge and improved structural stability. To overcome these challenges, customized surface charge modification combined with enhanced structural stability is essential, emphasizing the necessity for multifunctional adsorbents that harmonize economic viability with superior adsorption kinetics and specificity [2,17,25]. The cationic modification introduced by HTAB enhances the affinity of montmorillonite for anionic dyes through strong electrostatic interactions. Furthermore, the incorporation of polyethylene glycol (PEG) as a porogen allows for precise tuning of the pore architecture [26], with the PEG chain length playing a crucial role in adsorption performance. This dual approach not only enhances the overall adsorption capacity and selectivity of the material but also improves dispersion in aqueous media and facilitates efficient regeneration [27]. Consequently, these multifunctional nanocomposites are highly promising candidates for cost-effective and versatile dye removal applications. The chain length of polyethylene glycol (PEG) is crucial in modifying the pore structure and adsorption efficacy of organo-clay nanocomposites for the removal of cationic dyes. Short-chain PEG 200 often generates smaller, more uniform pores, hence improving selectivity and adsorption kinetics for smaller dye molecules. Conversely, higher molecular weight PEG, such as PEG 4000, produces larger and more linked porous networks, enhancing total adsorption capacity by offering more surface area and promoting dye diffusion, especially for larger cationic dyes [28,29]. Research on PEG-modified layered double hydroxides and hydrogel composites indicates that an increase in PEG molecular weight enhances the adsorption capabilities for dyes such as methyl orange and methylene blue, attributed to augmented microporosity and enhanced accessibility of active sites [29]. Consequently, by adjusting the PEG chain length, one can enhance both the selectivity and efficacy of dye removal in organo-clay systems. This study involved the functionalization of montmorillonite with hexadecyltrimethylammonium bromide (HTAB) through ion exchange, followed by the preparation of two different adsorbents via sonication, incorporating either PEG 200 or PEG 4000 to tailor the pore architecture. The adsorption of methylene blue (a cationic dye) and Congo red (an anionic dye) was investigated with respect to pH, adsorbent dosage, initial dye concentration, and PEG chain length. Adsorption behavior was analyzed through kinetic, isotherm, and thermodynamic studies to elucidate the underlying mechanisms. The materials were thoroughly characterized by FTIR to identify functional groups, XRD and SEM to examine pore morphology, and TGA to assess thermal stability. These characterizations facilitated the correlation between structural features and adsorption mechanisms, highlighting electrostatic interactions between HTAB and the dyes, as well as molecular sieving effects induced by PEG. This combined approach aims to develop multifunctional nanocomposites for efficient and selective remediation of polluted water.

2. Materials and Methods

2.1. Materials

The natural clay was sourced from the Hammam Boughrara deposit in western Algeria, exhibiting a cation exchange capacity (CEC) of 80 meq/100 g and a previously characterized chemical composition. Hexadecyltrimethylammonium bromide (HTAB) (98%, 364.45 g/mol) and polyethylene glycols (PEG200: HO(CH2CH2O)4-5H, Mn ≈ 200 g/mol, liquid; PEG4000: HO(CH2CH2O)90H, Mn ≈ 4000 g/mol, solid) were procured from Sigma-Aldrich (Sigma-Aldrich, St. Louis, Missouri, USA). The dye reagents, Congo red dye (C32H22N6Na2O6S2, CAS 573-58-0, MW 696.66 g/mol) was purchased from Merck (Darmstadt, Germany), and methylene blue (C16H18ClN3S, CAS 61-73-4, MW 319.85 g/mol) was obtained from Sigma-Aldrich (St. Louis, Missouri, USA). These two dyes were selected because of their distinct functional groups, including aromatic rings, azo linkages, amine groups, and sulfonic acid moieties. The use of two PEG molecular weights (200 and 4000 g/mol) enabled a systematic investigation of polymer chain length effects on the morphology and adsorption kinetics of hydrogel-clay composites, critical for optimizing pore structure and tuning hydrophilic–hydrophobic balance in dye removal applications.

2.2. Procedure for Clay Pretreatment

Pre-treatment and subsequent alteration of the clay are essential to prevent the leaching of heavy metals contained within it, as described in previous studies [30,31]. This ensures environmental safety and reduces the risk of secondary pollution when the material is applied for water purification. The preprocessing procedure was carried out as follows: 20 g of bentonite were dispersed in 200 mL of distilled water under magnetic stirring at 700 rpm. Then, 2.8 mL of sulfuric acid was gradually added to the mixture. The system was continuously agitated at 95 °C for 6 h. Afterwards, the suspension was filtered, and the solid residue was thoroughly washed several times with distilled water until chloride ions were completely removed, ensuring the elimination of excess acid that had not intercalated into the clay galleries. The resulting solid was then dried in an oven and designated as Montmorillonite (MMT). This pretreatment effectively removes unwanted ions and prepares the clay matrix for subsequent functionalization, which is crucial for achieving selective adsorption of cationic dyes in tailored organo-clay nanocomposites. The sequential steps of the clay treatment and the equipment used for clay modification are illustrated in Figure 1.

2.3. Preparation of Adsorbents

The preparation of the HTAB-modified montmorillonite (MMT@HTAB) and its subsequent composite with polyethylene glycol (PEG) was performed following our previously published methodology, with minor modifications as detailed below. Montmorillonite (MMT), a clay mineral with a layered and negatively charged structure, was rendered organophilic by modification with hexadecyltrimethylammonium bromide (HTAB), a cationic surfactant. In brief, 5 g of MMT was dispersed in 100 mL of distilled water and magnetically stirred at 700 rpm for 30 min. Subsequently, 1 g of HTAB was added, and the mixture was stirred at 700 rpm while heating at 90 °C for 48 h to facilitate efficient cation exchange. After the reaction, the resulting suspension was filtered, and the solid residue was thoroughly washed with distilled water until the filtrate reached neutral pH, ensuring the removal of excess surfactant and other impurities. This procedure was identical to that reported in our previous work [31] unless otherwise specified.
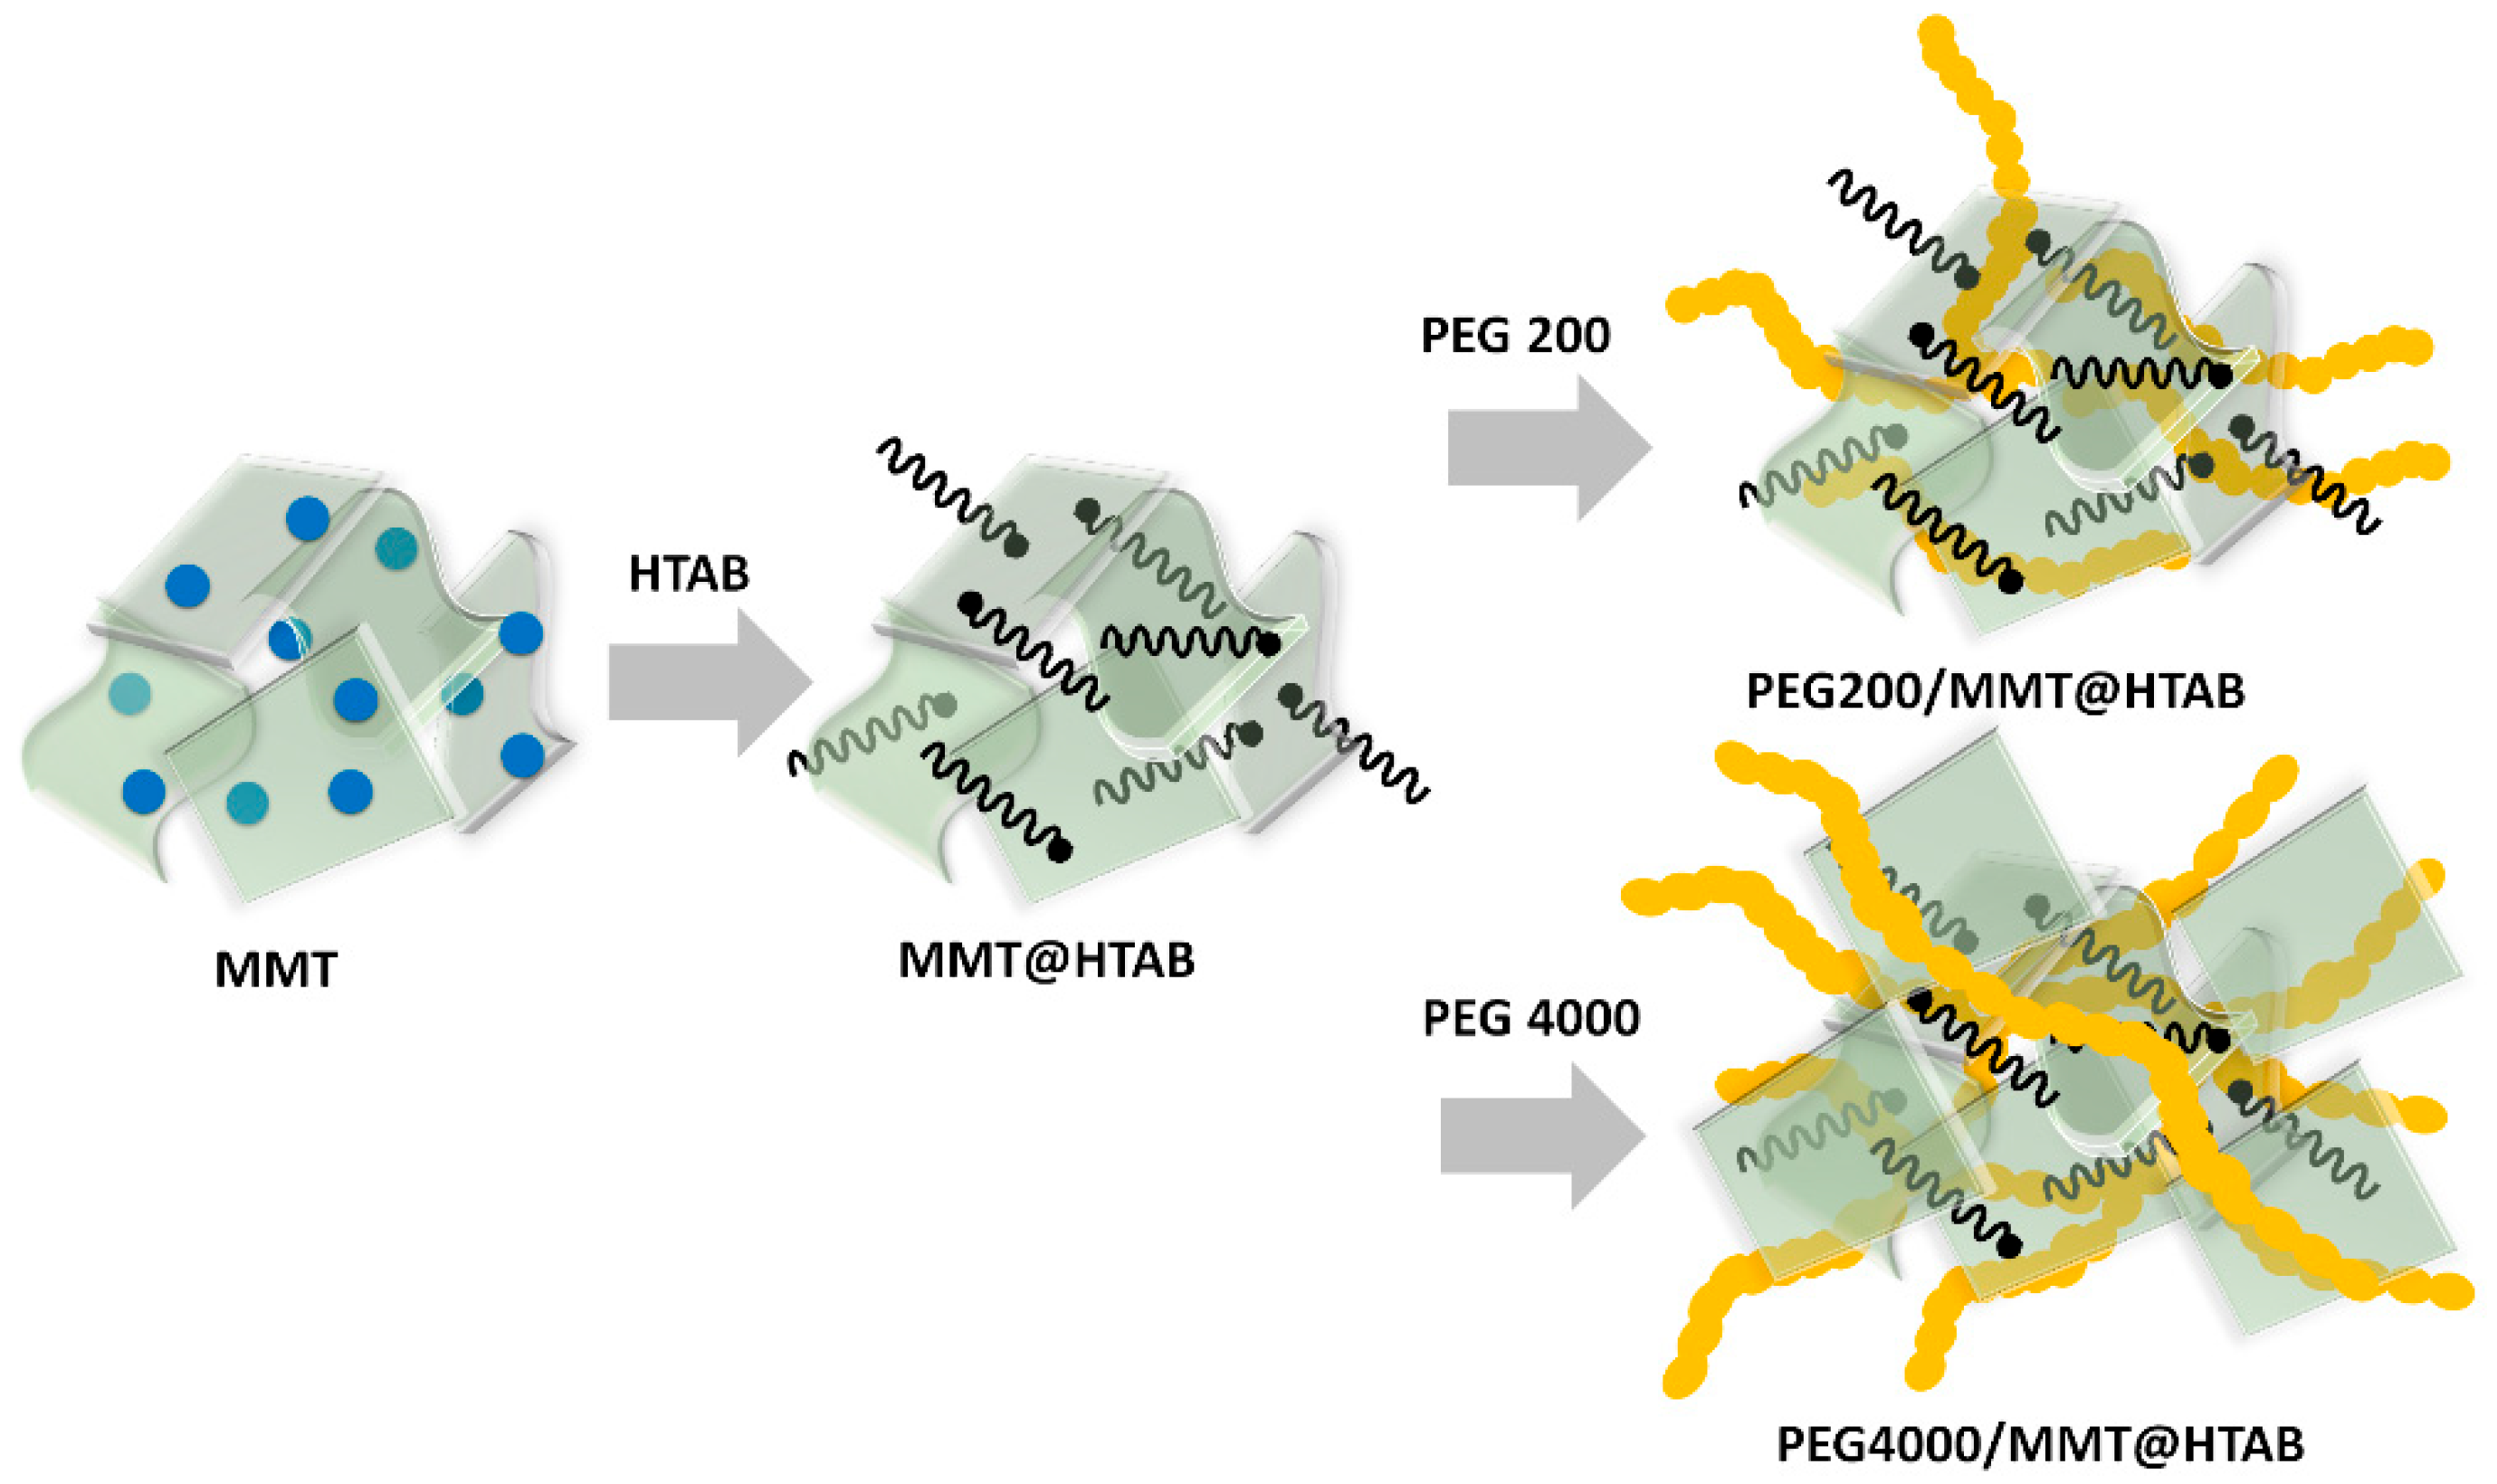
For the preparation of PEG-functionalized MMT@HTAB composite, a two-step modification strategy was employed, as previously described [31]. Briefly, 0.5 g of PEG (PEG 200 or PEG 4000) was dissolved in 100 mL of deionized water with magnetic stirring at 600 rpm for 30 min. Thereafter, 1 g of MMT@HTAB was gradually added to the PEG solution. The mixture was then sonicated at 40% amplitude for 1 h to ensure homogeneous dispersion and effective intercalation of PEG into the clay layers. The resultant suspension was evaporated under reduced pressure and dried in a vacuum oven at 60 °C for 24 h. The final purification involved repeated centrifugation and washing with distilled water to remove unbound PEG, followed by a final drying step. The method is consistent with our previous report [31], with no significant modifications. The final materials, denoted PEG200/MMT@HTAB and PEG4000/MMT@HTAB, provide a cationic surface and tunable porosity for enhanced adsorption capacity and selectivity. A schematic representation of the procedure for preparing PEG-modified MMT is shown in Figure 2.

2.4. Characterization

The point of zero charge (pHpzc) of the composites was determined using a Nano-ZS instrument (Malvern Instruments, Almelo, The Netherlands). Functional groups present in the composites, as well as those associated with adsorbed dyes, were identified by Fourier-transform infrared spectroscopy (FTIR) using a JASCO 4100 spectrometer (JASCO Corporation, Tokyo, Japan). Crystallographic structures were analyzed by X-ray diffraction (XRD) on a Bruker D8 Advance instrument. Surface morphology was examined via scanning electron microscopy (SEM) using a Thermo Scientific Prisma E microscope. Thermogravimetric analysis (TGA) was performed on a Discovery TGA instrument (TA Instruments) to evaluate the thermal degradation behavior of the hybrid materials; approximately 5–10 mg of dried sample was placed in platinum crucibles and heated from 40 °C to 900 °C at a rate of 10 °C/min under a nitrogen atmosphere. Ultraviolet-visible (UV-Vis) absorbance spectra were recorded using a Specord 210 spectrometer is manufactured by (Analytik Jena AG, located in Jena, Germany) equipped with a holmium oxide filter.

2.5. Batch Adsorption

A series of batch adsorption experiments was conducted to evaluate the efficacy of PEG200/MMT@HTAB and PEG4000/MMT@HTAB composites in removing MB and CR dyes from aqueous solutions. For each test, a fixed volume (50 mL) of dye solution, prepared using deionized water at a known initial concentration, was mixed with varying dosages of the composite adsorbents. The mixtures were agitated on a rotary shaker at 600 rpm for 1 h and maintained at a constant temperature of 25 °C. To prevent photodegradation of the dyes, the beakers were wrapped in aluminum foil throughout the experiments. The initial pH of the solutions was either recorded or adjusted as required, and experimental variables including adsorbent dosage, initial dye concentration, initial pH, and contact time were systematically varied to investigate their effects on adsorption performance. The residual dye concentrations were measured at their respective maximum absorption wavelengths (λmax(CR) = 597 nm and λmax(MB) = 664 nm) using a UV-Vis spectrophotometer. The following equations (Equations (1) and (2)) were employed to calculate the adsorption capacity and removal efficiency:
A d s o r p t i o n c a p a c i t y q e = C i C e m × V
R e m o v a l e f f i c i e n c y % = C i C e C i × 100
where Ci is the initial concentration of dye (mg/L), Ce is the equilibrium concentration of dye (mg/L), m is the mass of the adsorbent (g), and V is the volume of the solution (L).

3. Results and Discussion

3.1. Characterization of the Adsorbents

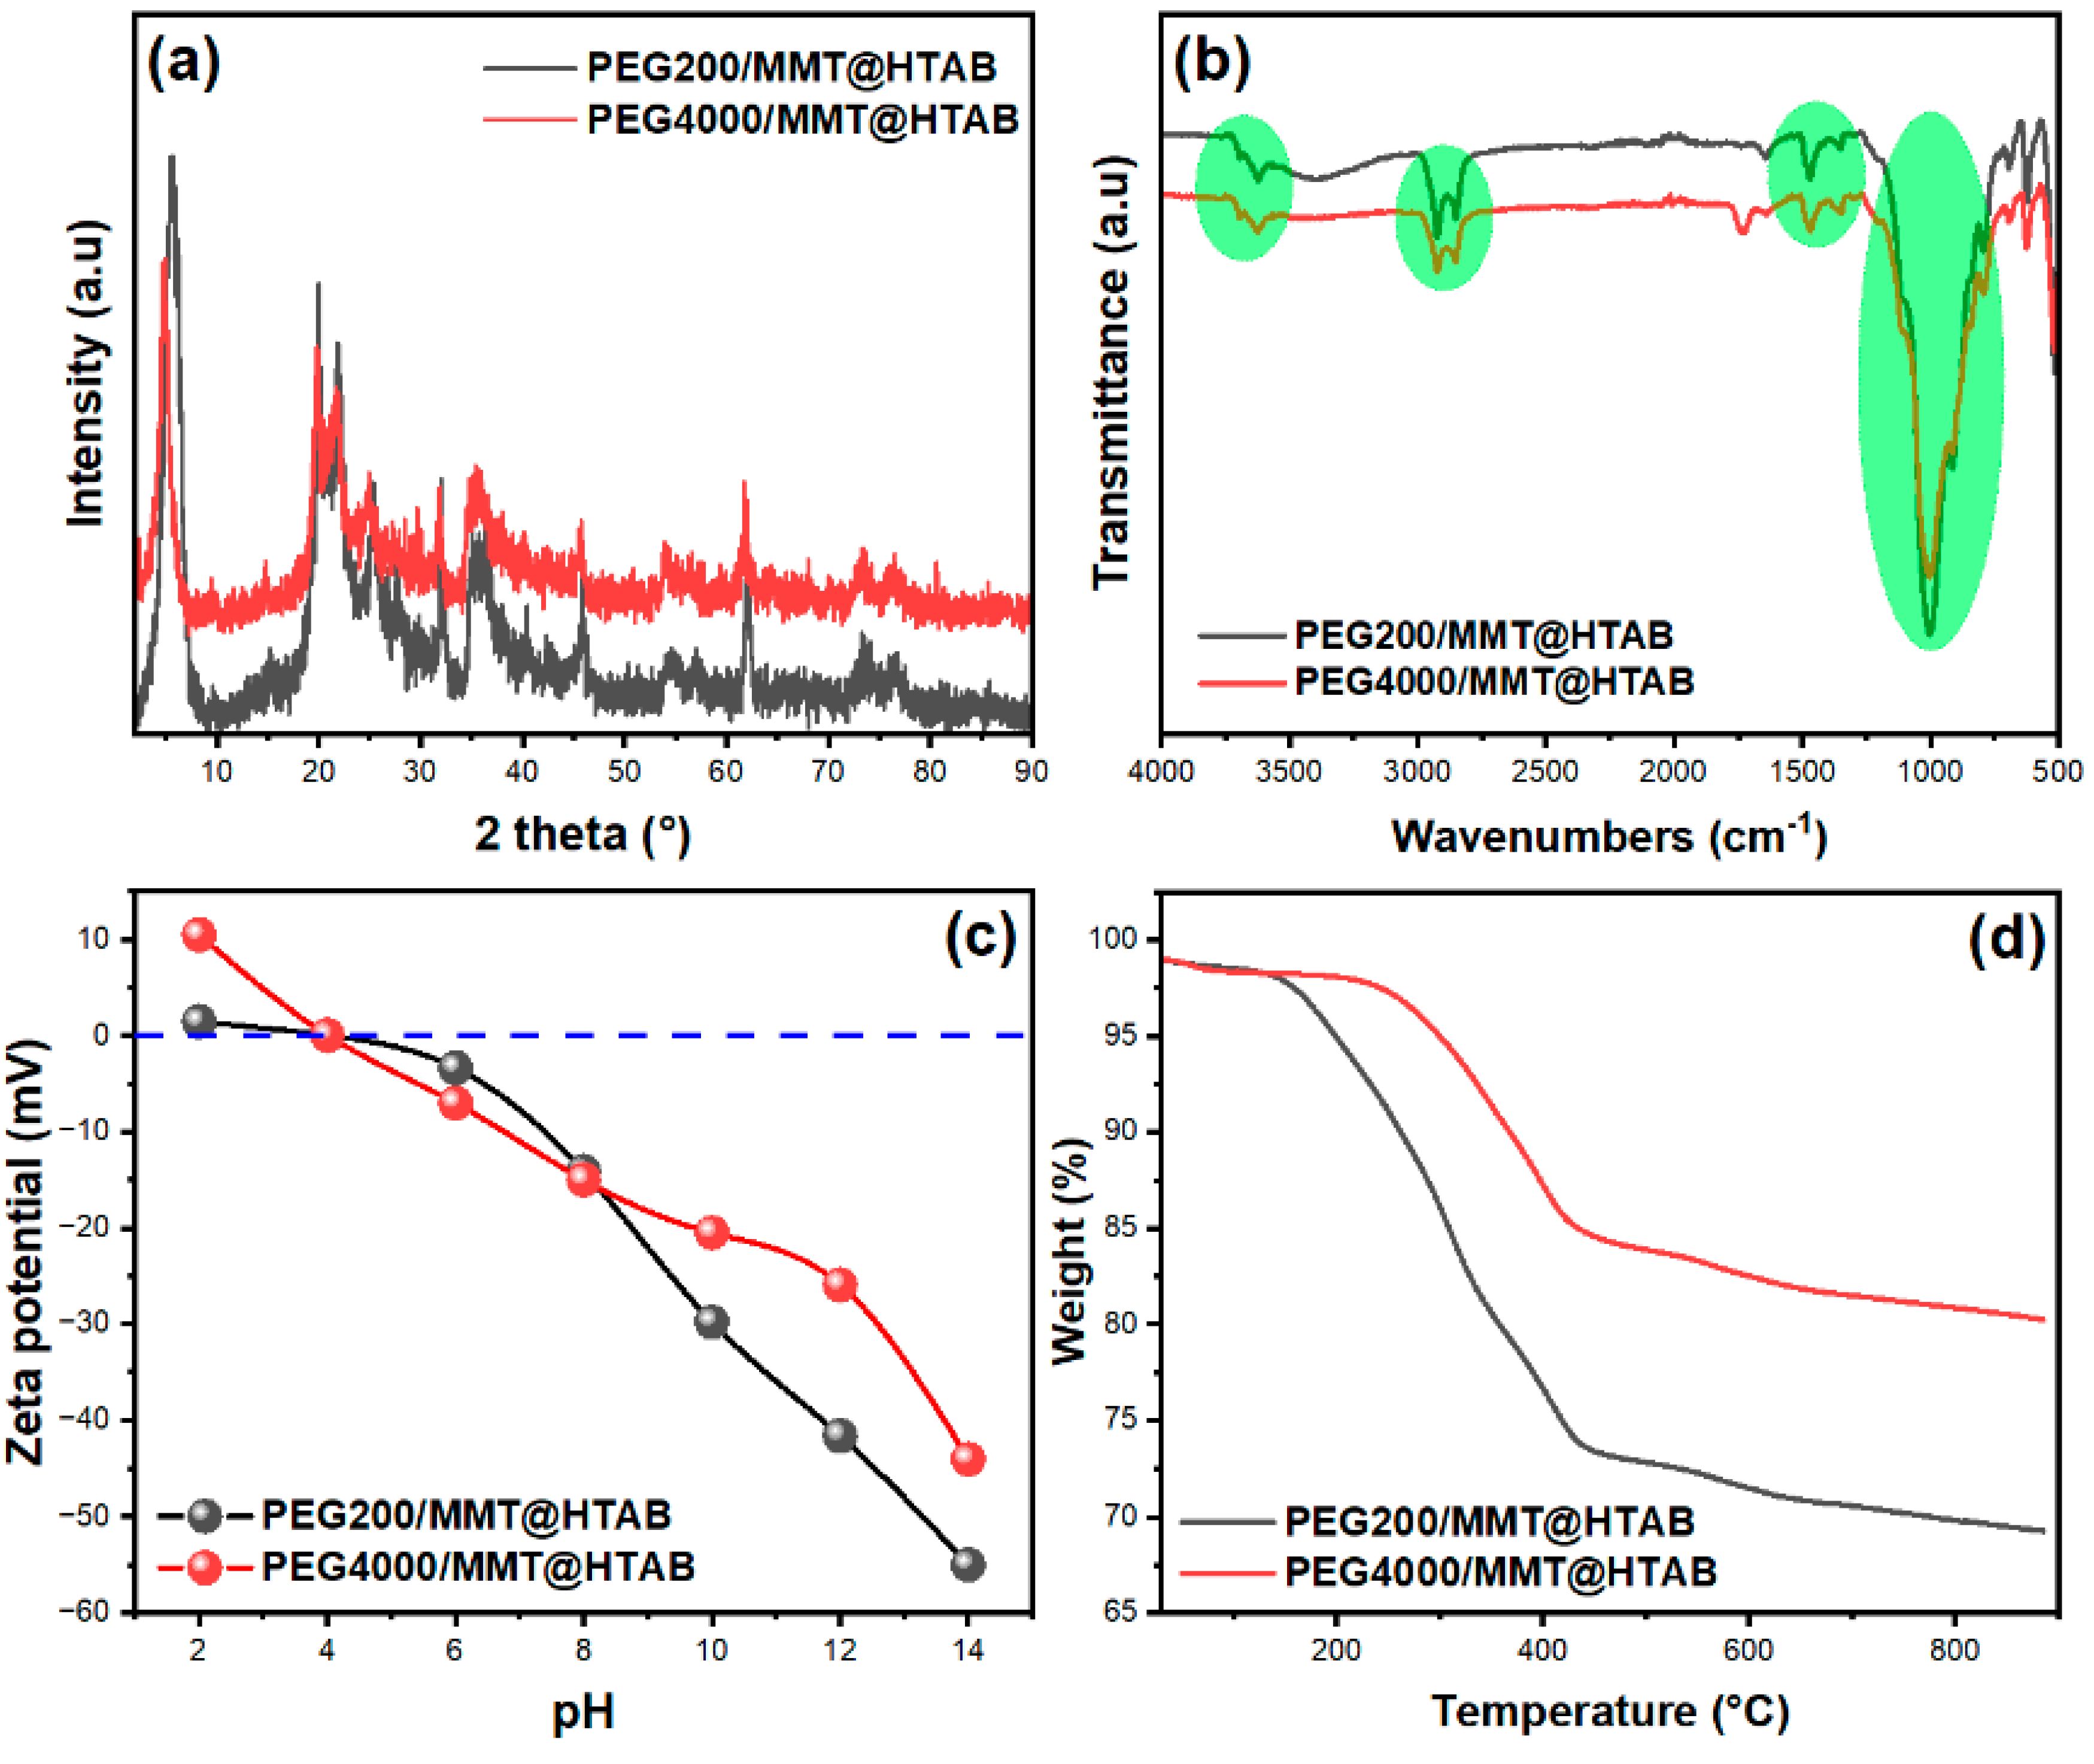
Figure 3a displays the powder XRD patterns of PEG200/MMT@HTAB and PEG4000/MMT@HTAB composites, illustrating the structural alterations caused by PEG intercalation and the effect of polymer molecular weight on clay layer arrangement. The XRD patterns of MMT and MMT@HTAB samples are reported in the Supplementary Data. The diffraction patterns display the distinctive reflections of montmorillonite at (001), (100), (110), and (210) (see Figure S1). The XRD patterns of MMT and MMT@HTAB samples show that the basal spacing d001 increases from 14.87 Å for pristine MMT to 16.23 Å after HTAB intercalation, confirming successful monolayer insertion [32,33,34], so affirming the retention of the essential clay structure following PEG intercalation [35]. Notable discrepancies are seen in the position and strength of the basal (001) reflection, which serves as direct evidence of interlayer expansion and polymer organization inside the clay galleries [36,37,38]. The most notable characteristic is the displacement of the d001 peak to reduce angles for both composites in comparison to the pristine MMT@HTAB, signifying effective PEG intercalation and subsequent enlargement of the interlayer space of clay [38]. The PEG200/MMT@HTAB composite exhibits a d001 reflection indicative of monolayer intercalation (basal spacing = 16.52 Å), whereas the PEG4000/MMT@HTAB pattern reveals a pronounced shift to lower angles (basal spacing = 18.37 Å), aligning with increased interlayer expansion attributed to the higher molecular weight polymer chains. Similar results have been reported by Yang et al. [39] for the intercalation of cetyltrimethylammonium bromide into montmorillonite. Considering the length of a PEG molecule, the increased basal spacing in the PEG4000 system signifies the development of a more structured bilayer arrangement, allowing longer polymer chains to assume extended conformations inside the wider interlayer space. The disparities in peak intensity and width between the two composites indicate discrepancies in structural ordering and crystallinity. The PEG4000/MMT@HTAB pattern displays more distinct peaks with increased intensity, indicating superior structural organization and a more uniform distribution of interlayer spacing in comparison to PEG200/MMT@HTAB. In fact, the peak broadening and intensity decrease suggested the presence of a disordered intercalated or exfoliated structure [40,41]. The improved structural order results from the intensified polymer–clay contacts and the more effective space-filling by the elongated PEG chains, which facilitate more stable intercalated structures. The XRD examination indicates that elevating the PEG molecular weight from 200 to 4000 Da greatly enhances intercalation and facilitates the creation of well-ordered, enlarged clay–polymer nanocomposites with superior structural integrity. Figure 3b displays the FTIR spectra of PEG200/MMT@HTAB and PEG4000/MMT@HTAB composites, indicating unique spectroscopic characteristics that illustrate the effect of PEG molecular weight on the chemical structure and polymer–clay interactions. The emphasized areas reveal systematic disparities between the two composites, elucidating the intercalation behavior and structural alterations of PEG chains within the MMT@HTAB matrix [35,42]. Additionally, the FTIR spectra of pristine MMT and MMT@HTAB samples are provided in the Supplementary Data (see Figure S2) to allow a comprehensive comparison and better insight into the chemical modifications induced by HTAB intercalation. In the high-frequency region (3500–3000 cm−1), both spectra display a large absorption band indicative of O-H stretching vibrations from intercalated water molecules and terminal silanol groups [43,44], together with C-OH stretching from PEG terminal groups. The PEG4000/MMT@HTAB composite exhibits increased intensity and modest broadening of this band relative to PEG200/MMT@HTAB, suggesting intensified hydrogen bonding interactions attributed to the greater concentration of hydroxyl groups from the longer PEG chains. The C-H stretching vibrations in the 3000–2800 cm−1 range, associated with -CH2 groups from both HTAB alkyl chains and the PEG backbone [44], are more prominent in the PEG4000 composite, indicating a higher polymer concentration and extended chain length. The fingerprint region indicates significant variations in polymer organization and clay–polymer interactions. The distinctive C-O-C stretching vibrations of PEG, generally detected at approximately 1095 cm−1 [43], exhibit notable intensity differences between the two composites. The PEG4000/MMT@HTAB spectrum displays more distinct and pronounced peaks in the 1200–1000 cm−1 range, indicating improved organization of polymer chains with enhanced crystalline domains despite the restricted environment. The -CH2 bending vibrations at 1350–1400 cm−1 and the emergence of supplementary bands near 1467 cm−1, ascribed to aliphatic C-H bond vibrations [43], are more pronounced in the PEG4000 composite, affirming the successful intercalation of extended polymer chains. The low-frequency range (900–800 cm−1) encompasses overlapping contributions from clay structural vibrations (Al-O-Si bending at 914 cm−1) and PEG-specific vibrations (-CH2-CH2-O groups at 847 cm−1). The spectrum variations in this location suggest that PEG4000 intercalation more profoundly disrupts the clay structure, potentially due to enhanced interactions between the polymer and the aluminosilicate layers. The FTIR observations indicate that higher molecular weight PEG (PEG4000) facilitates greater intercalation and establishes stronger interfacial interactions with the MMT@HTAB matrix than PEG200, leading to improved structural organization and potentially enhanced adsorption properties.
Figure 3c depicts the variation of zeta potential in relation to pH for PEG200/MMT@HTAB and PEG4000/MMT@HTAB composites. The zeta potential is a crucial indicator of the surface charge of colloidal particles, directly affecting their adsorption affinity for charged species in solution. For both samples, the zeta potential decreases as pH increases, indicating gradual deprotonation of surface functional groups. At very low pH (pH 2), the PEG4000/MMT@HTAB composite displays a distinctly positive zeta potential, around +10 mV, signifying a net positive surface charge due to protonation of surface groups introduced by PEG intercalation. However, as the pH increases to 4 and 6, the zeta potential of PEG4000/MMT@HTAB rapidly decreases to approximately 0 mV and –10 mV, respectively. This observation clarifies that the composite exhibits a positive zeta potential only under strongly acidic conditions (specifically at pH 2), and not consistently throughout the entire pH 2–6 range. The positive surface charge at very low pH can enhance electrostatic attraction to anionic species. As pH increases beyond 6, the zeta potential of PEG4000/MMT@HTAB crosses the isoelectric point (close to pH 7), then becomes negative, reaching approximately –40 mV at pH 14. This charge reversal is attributed to the deprotonation of surface groups, resulting in a net negative charge that promotes the adsorption of cationic species at higher pH values. The PEG200/MMT@HTAB composite exhibits a primarily negative zeta potential throughout the entire pH range, with a slight shift toward neutrality near pH 6–7. This indicates that the lower molecular weight PEG200 exerts a less prominent effect on surface charge modification compared to PEG4000, resulting in a surface that remains predominantly anionic [45]. PEG4000/MMT@HTAB demonstrates significant pH-dependent surface charge variation, with a positive zeta potential only at very low pH (pH 2), and negative values at higher pH. This tunable surface chemistry is advantageous for adsorption applications, as it enables selective attraction of oppositely charged species depending on pH. The data in Figure 3c thus indicate that increasing the PEG molecular weight enhances the pH responsiveness and adsorption capacity of MMT@HTAB-based composites. Figure 3d illustrates the thermogravimetric (TGA) curves of PEG200/MMT@HTAB and PEG4000/MMT@HTAB samples, recorded at a heating rate of 10 °C/min. For comprehensive comparison, the summary Table of TGA results for PEG200/MMT@HTAB and PEG4000/MMT@HTAB composites has been included in the Supplementary Data (see Table S1 in the Supplementary Data), while the thermal degradation behavior of pristine MMT and MMT@HTAB is discussed with reference to relevant literature [31,46,47,48]. The TGA curves reveal several distinct thermal degradation phases. The first stage, observed between 50–150 °C, corresponds to the loss of physically adsorbed water [48]. The second stage, occurring in the 200–400 °C interval, is mainly attributed to the decomposition of PEG chains within the composites. The third weight loss event, typically between 400–700 °C, is assigned to the dehydroxylation of the clay layers. It is noteworthy that the HTAB-modified clay (MMT@HTAB) demonstrates an additional mass loss event in the range of 180–350 °C, reflecting the degradation of intercalated surfactant molecules (HTAB). This phase is distinguishable from the polymer decomposition in PEG-containing samples and is clearly observed when comparing the TGA curves of MMT@HTAB and PEG/MMT@HTAB composites. Comparative analysis shows that the PEG4000/MMT@HTAB composite exhibits enhanced thermal stability relative to PEG200/MMT@HTAB, as evidenced by the higher onset decomposition temperature and reduced mass loss in the polymer degradation region. This improvement can be ascribed to stronger intermolecular interactions and better confinement of higher molecular weight PEG chains within the clay galleries. Overall, the summarized TGA results confirm the impact of PEG molecular weight and surfactant intercalation on the thermal stability of the resulting nanocomposites.
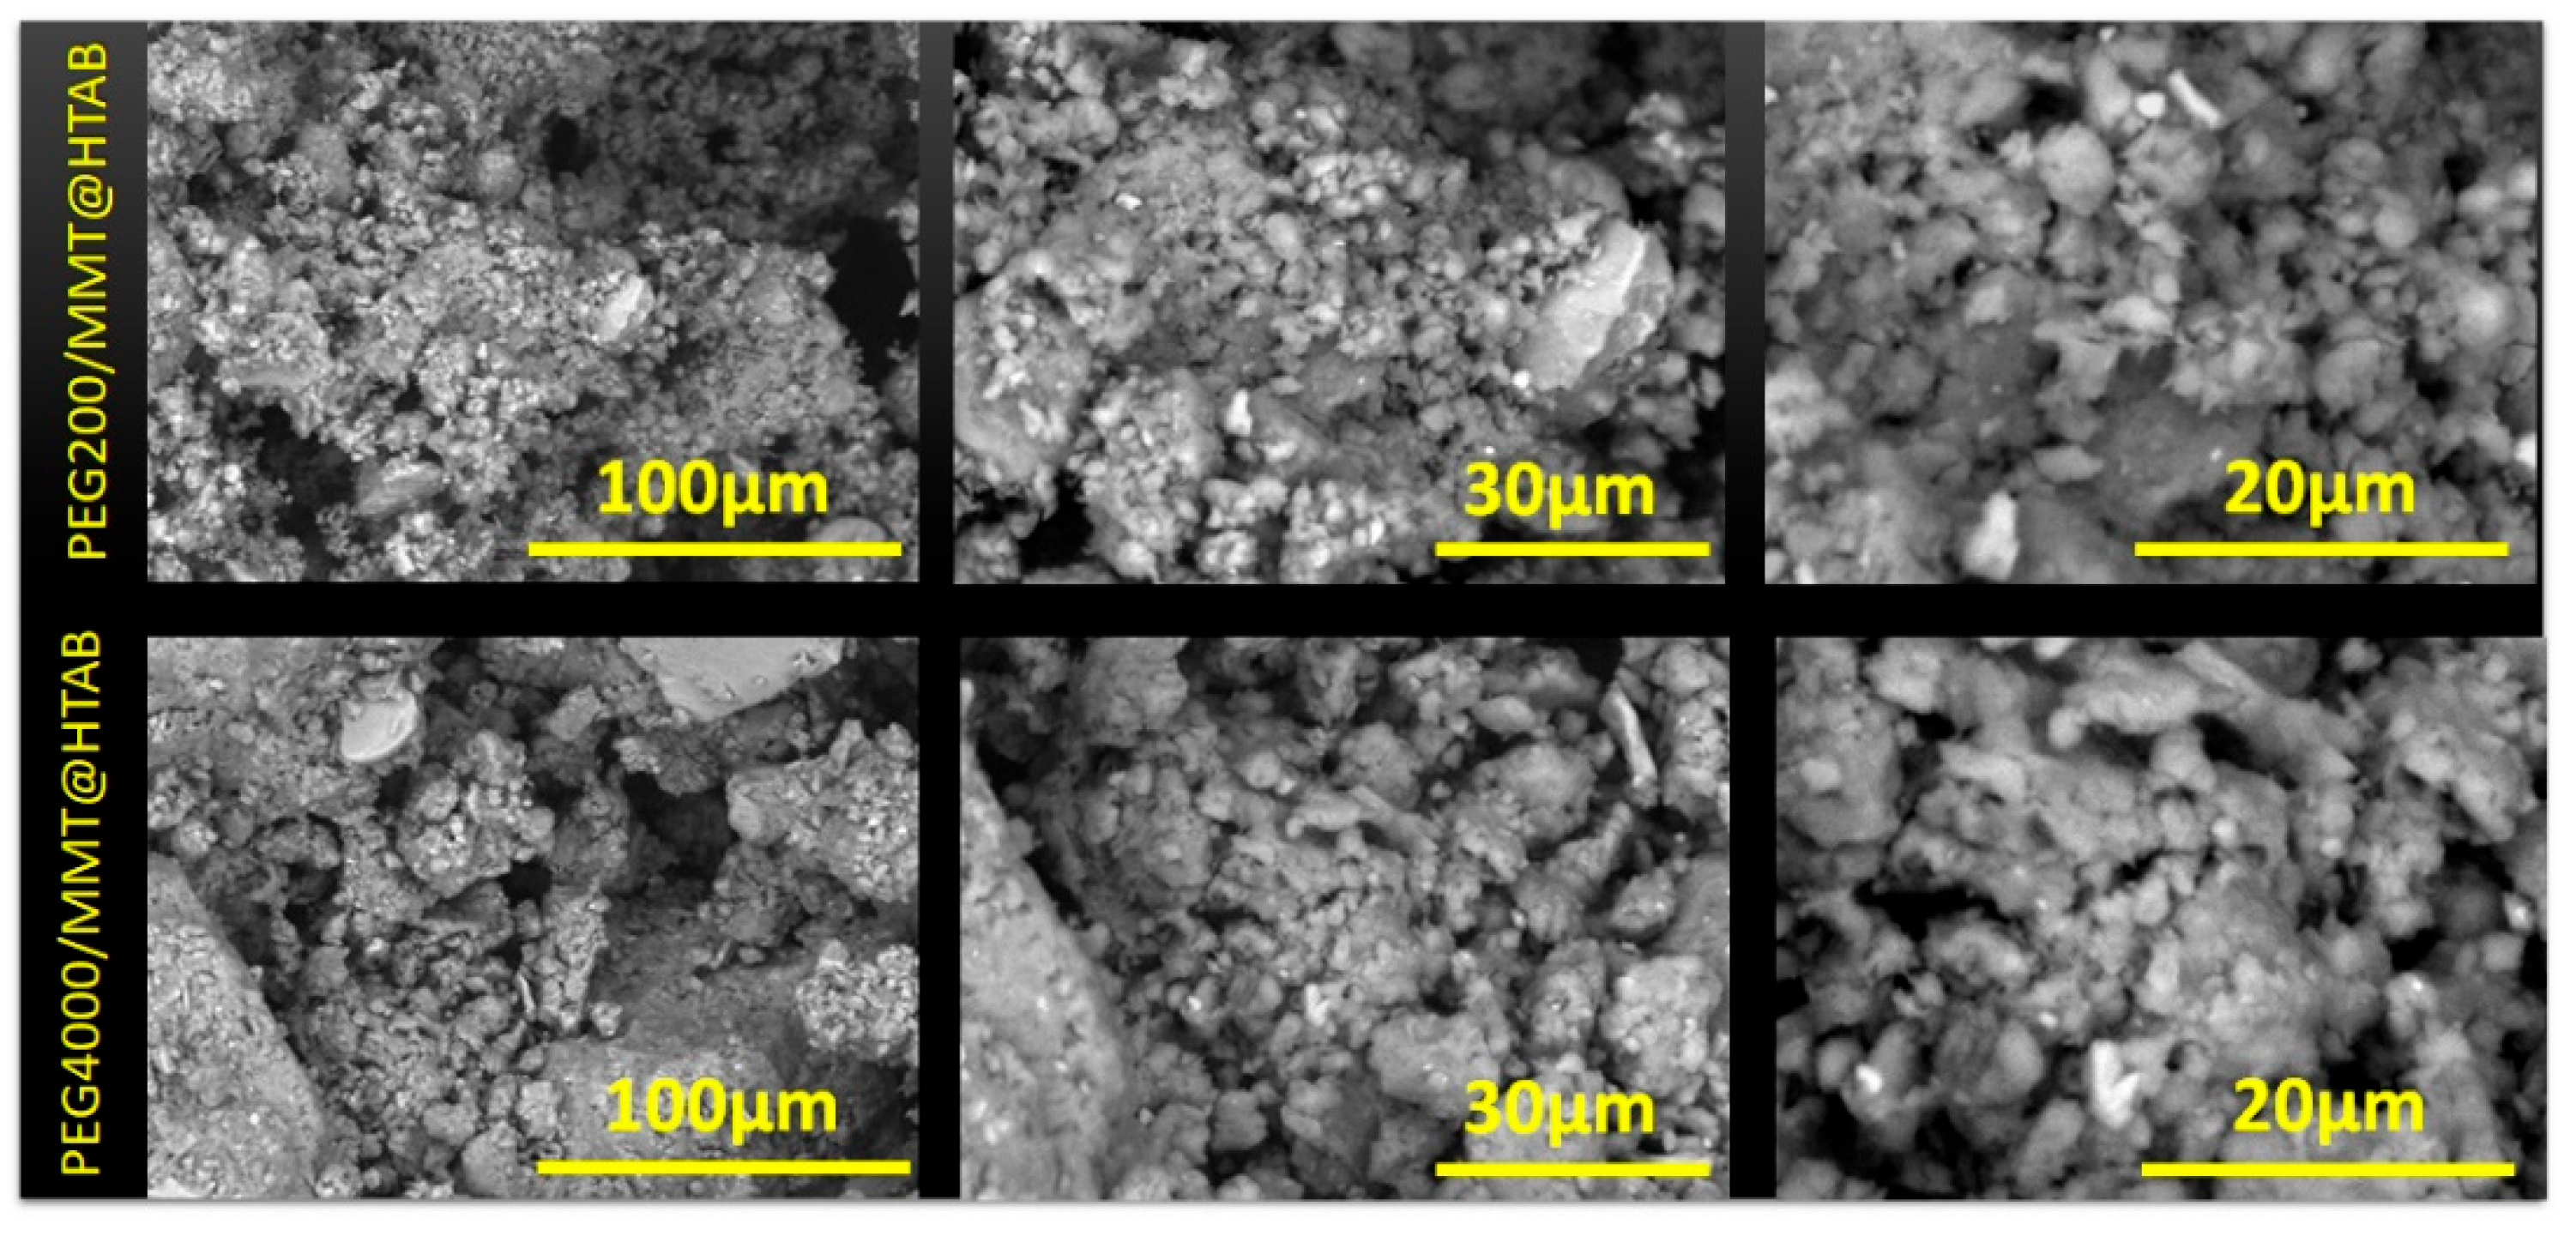
Figure 4 displays SEM micrographs of PEG200/MMT@HTAB and PEG4000/MMT@HTAB composites at three magnifications, illustrating unique morphological features that indicate the effect of PEG molecular weight on particle arrangement and surface texture. Both composites display the typical production of substantial blocks with rather smooth surfaces, validating the successful intercalation and assembly of clay particles via the sequential modification procedure utilizing HTAB and PEG polymers. At the minimum magnification, both samples exhibit irregular, block-like aggregates with a heterogeneous size distribution, suggesting that the intercalation process facilitates the coalescence of individual clay particles into bigger formations. The morphological distinctions between PEG200/MMT@HTAB and PEG4000/MMT@HTAB become increasingly evident at elevated magnifications. The PEG200 composite had a more fragmented morphology characterized by reduced aggregate sizes and enhanced surface imperfections, indicating that the shorter polymer chains offer less efficient bridging between clay particles. Conversely, the PEG4000/MMT@HTAB composite displays larger, more cohesive aggregates with smoother surface areas, signifying improved particle consolidation due to the longer polymer chains that can establish more extensive intercalation networks and stronger interlayer contacts. At the maximum magnifications of 30 μm and 20 μm, both composites reveal the formation of a coarse porous surface texture, notably pronounced in the PEG4000 system. The porosity results from the synergistic effects of HTAB intercalation and subsequent PEG inclusion, generating voids and channels within the clay matrix [49]. The PEG4000 composite exhibits a more uniform and well-defined porous structure, indicating that larger molecular weight polymers enhance the organization of the pore network via more regulated swelling and intercalation processes. The surface characteristics are essential for adsorption applications, as they offer numerous access points.

3.2. Adsorption Study

3.2.1. Impact of Contact Duration on Adsorption at Varied Dye Concentrations

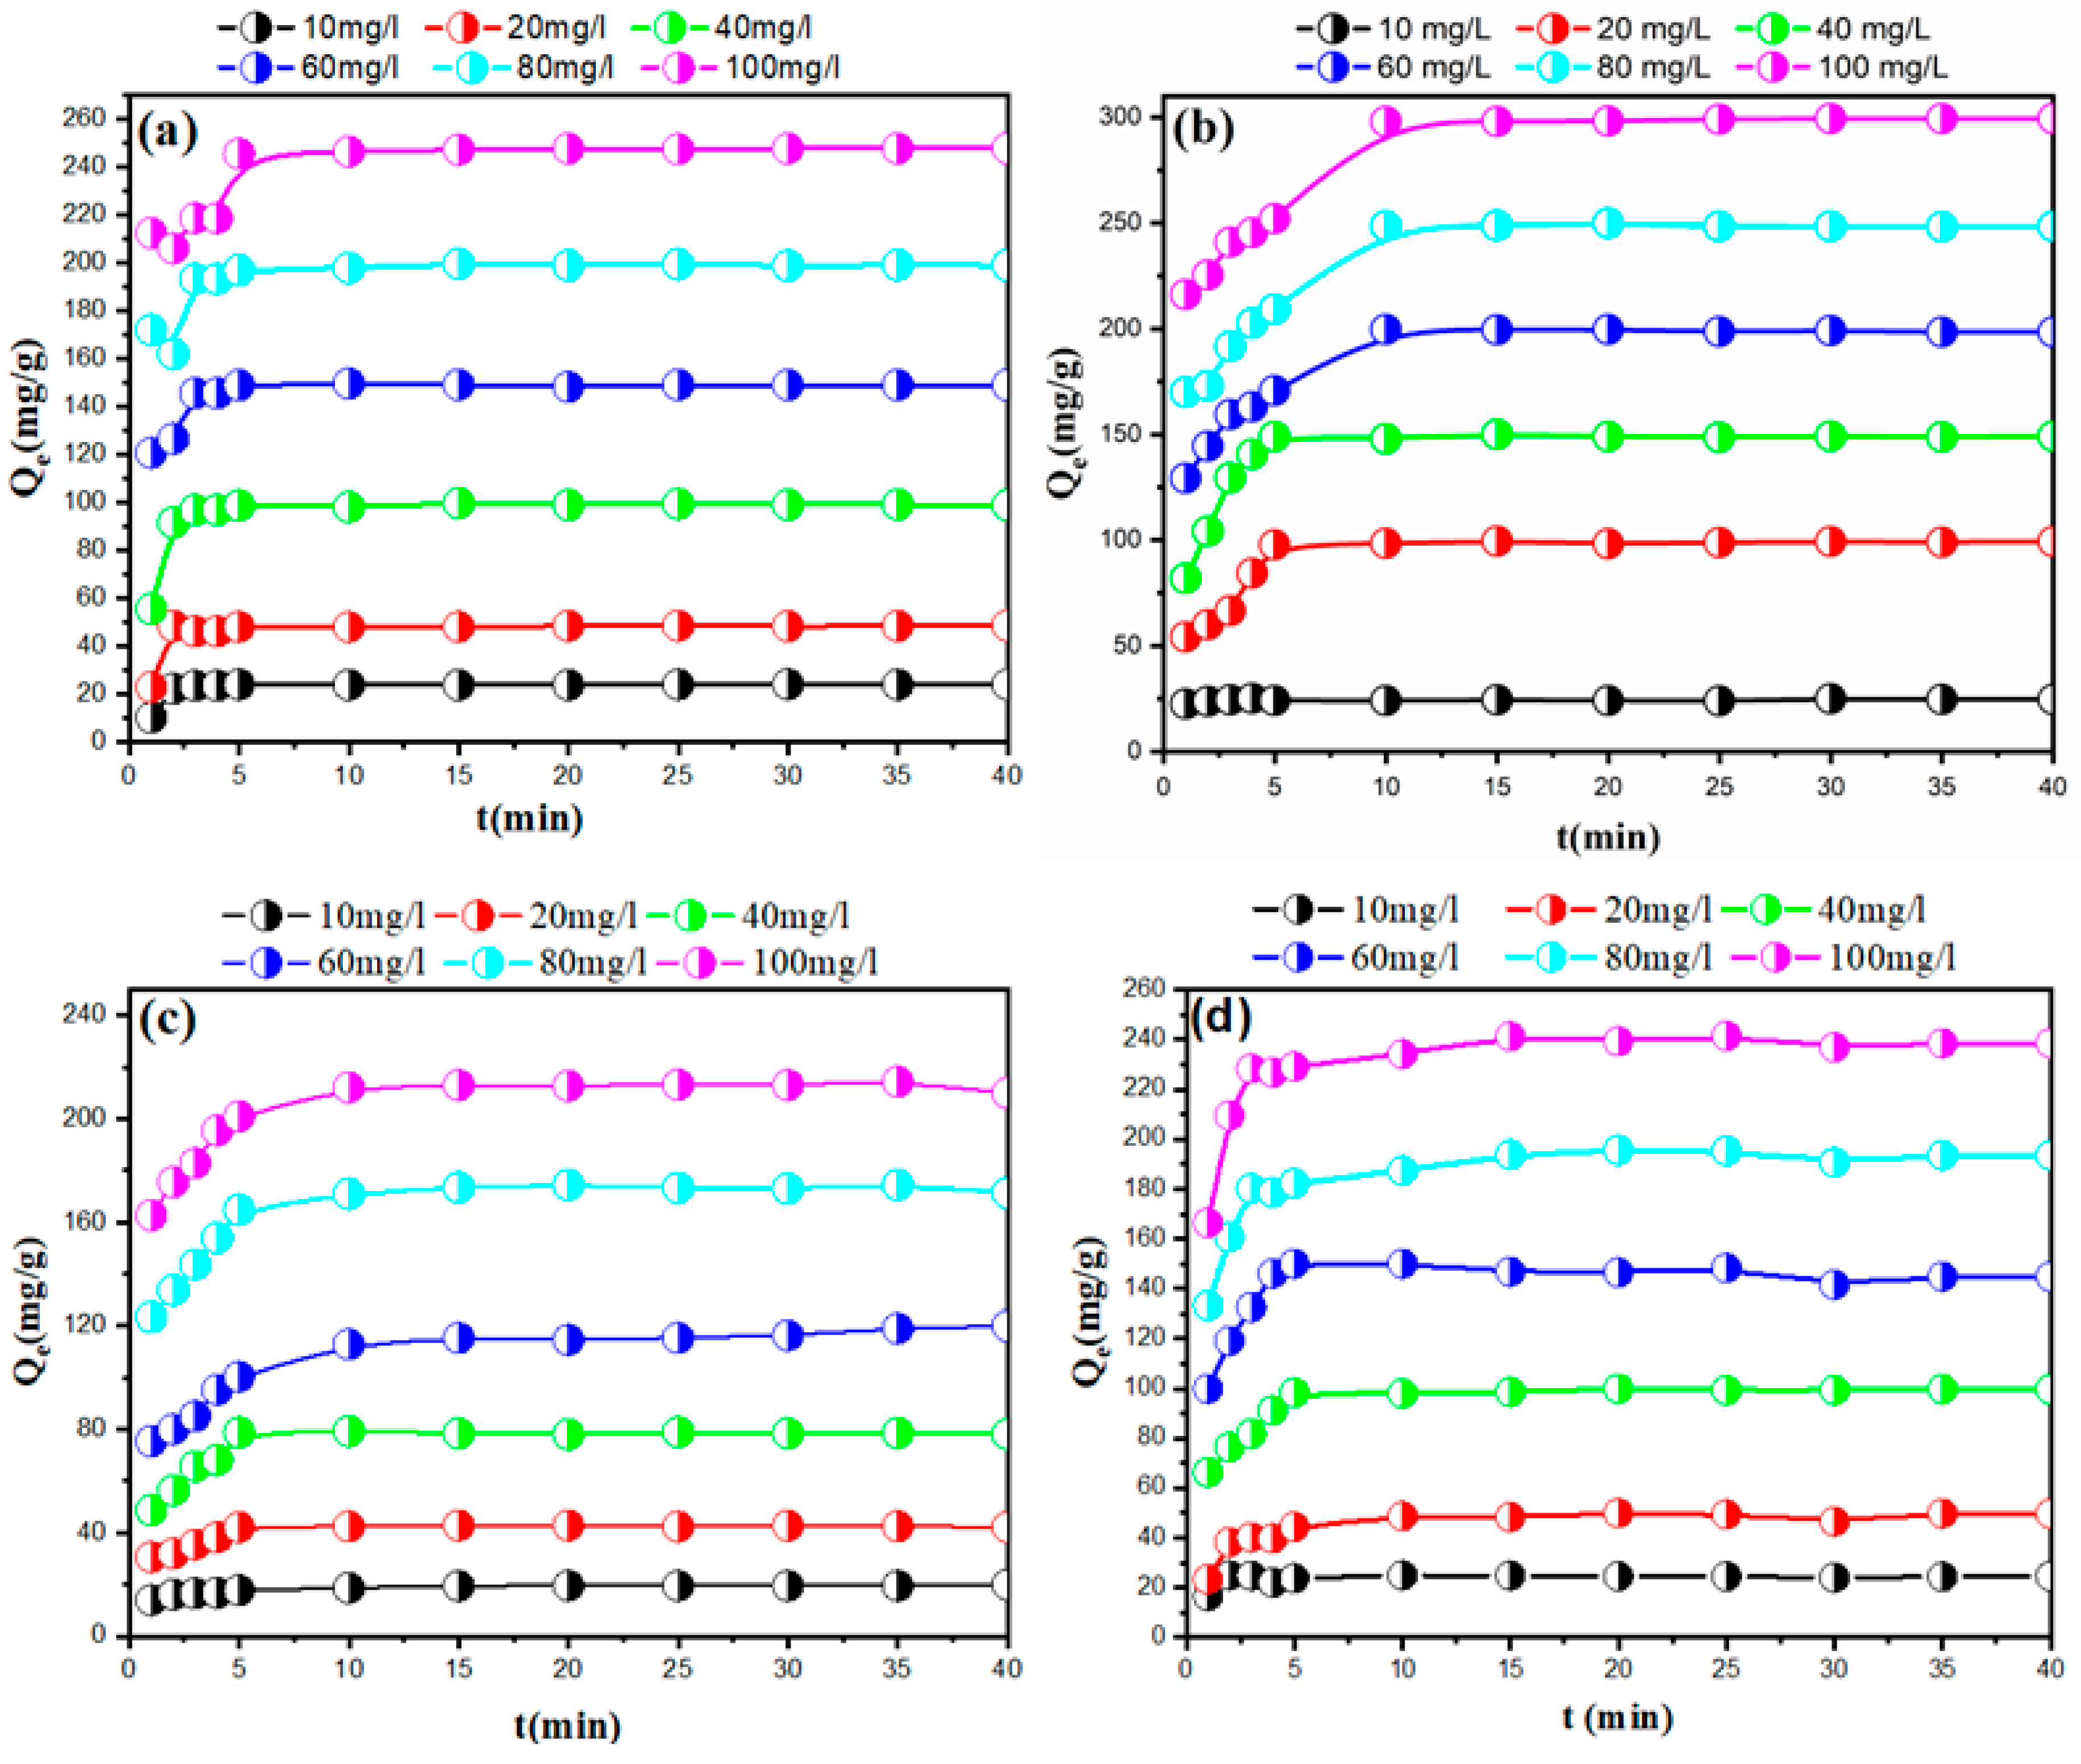
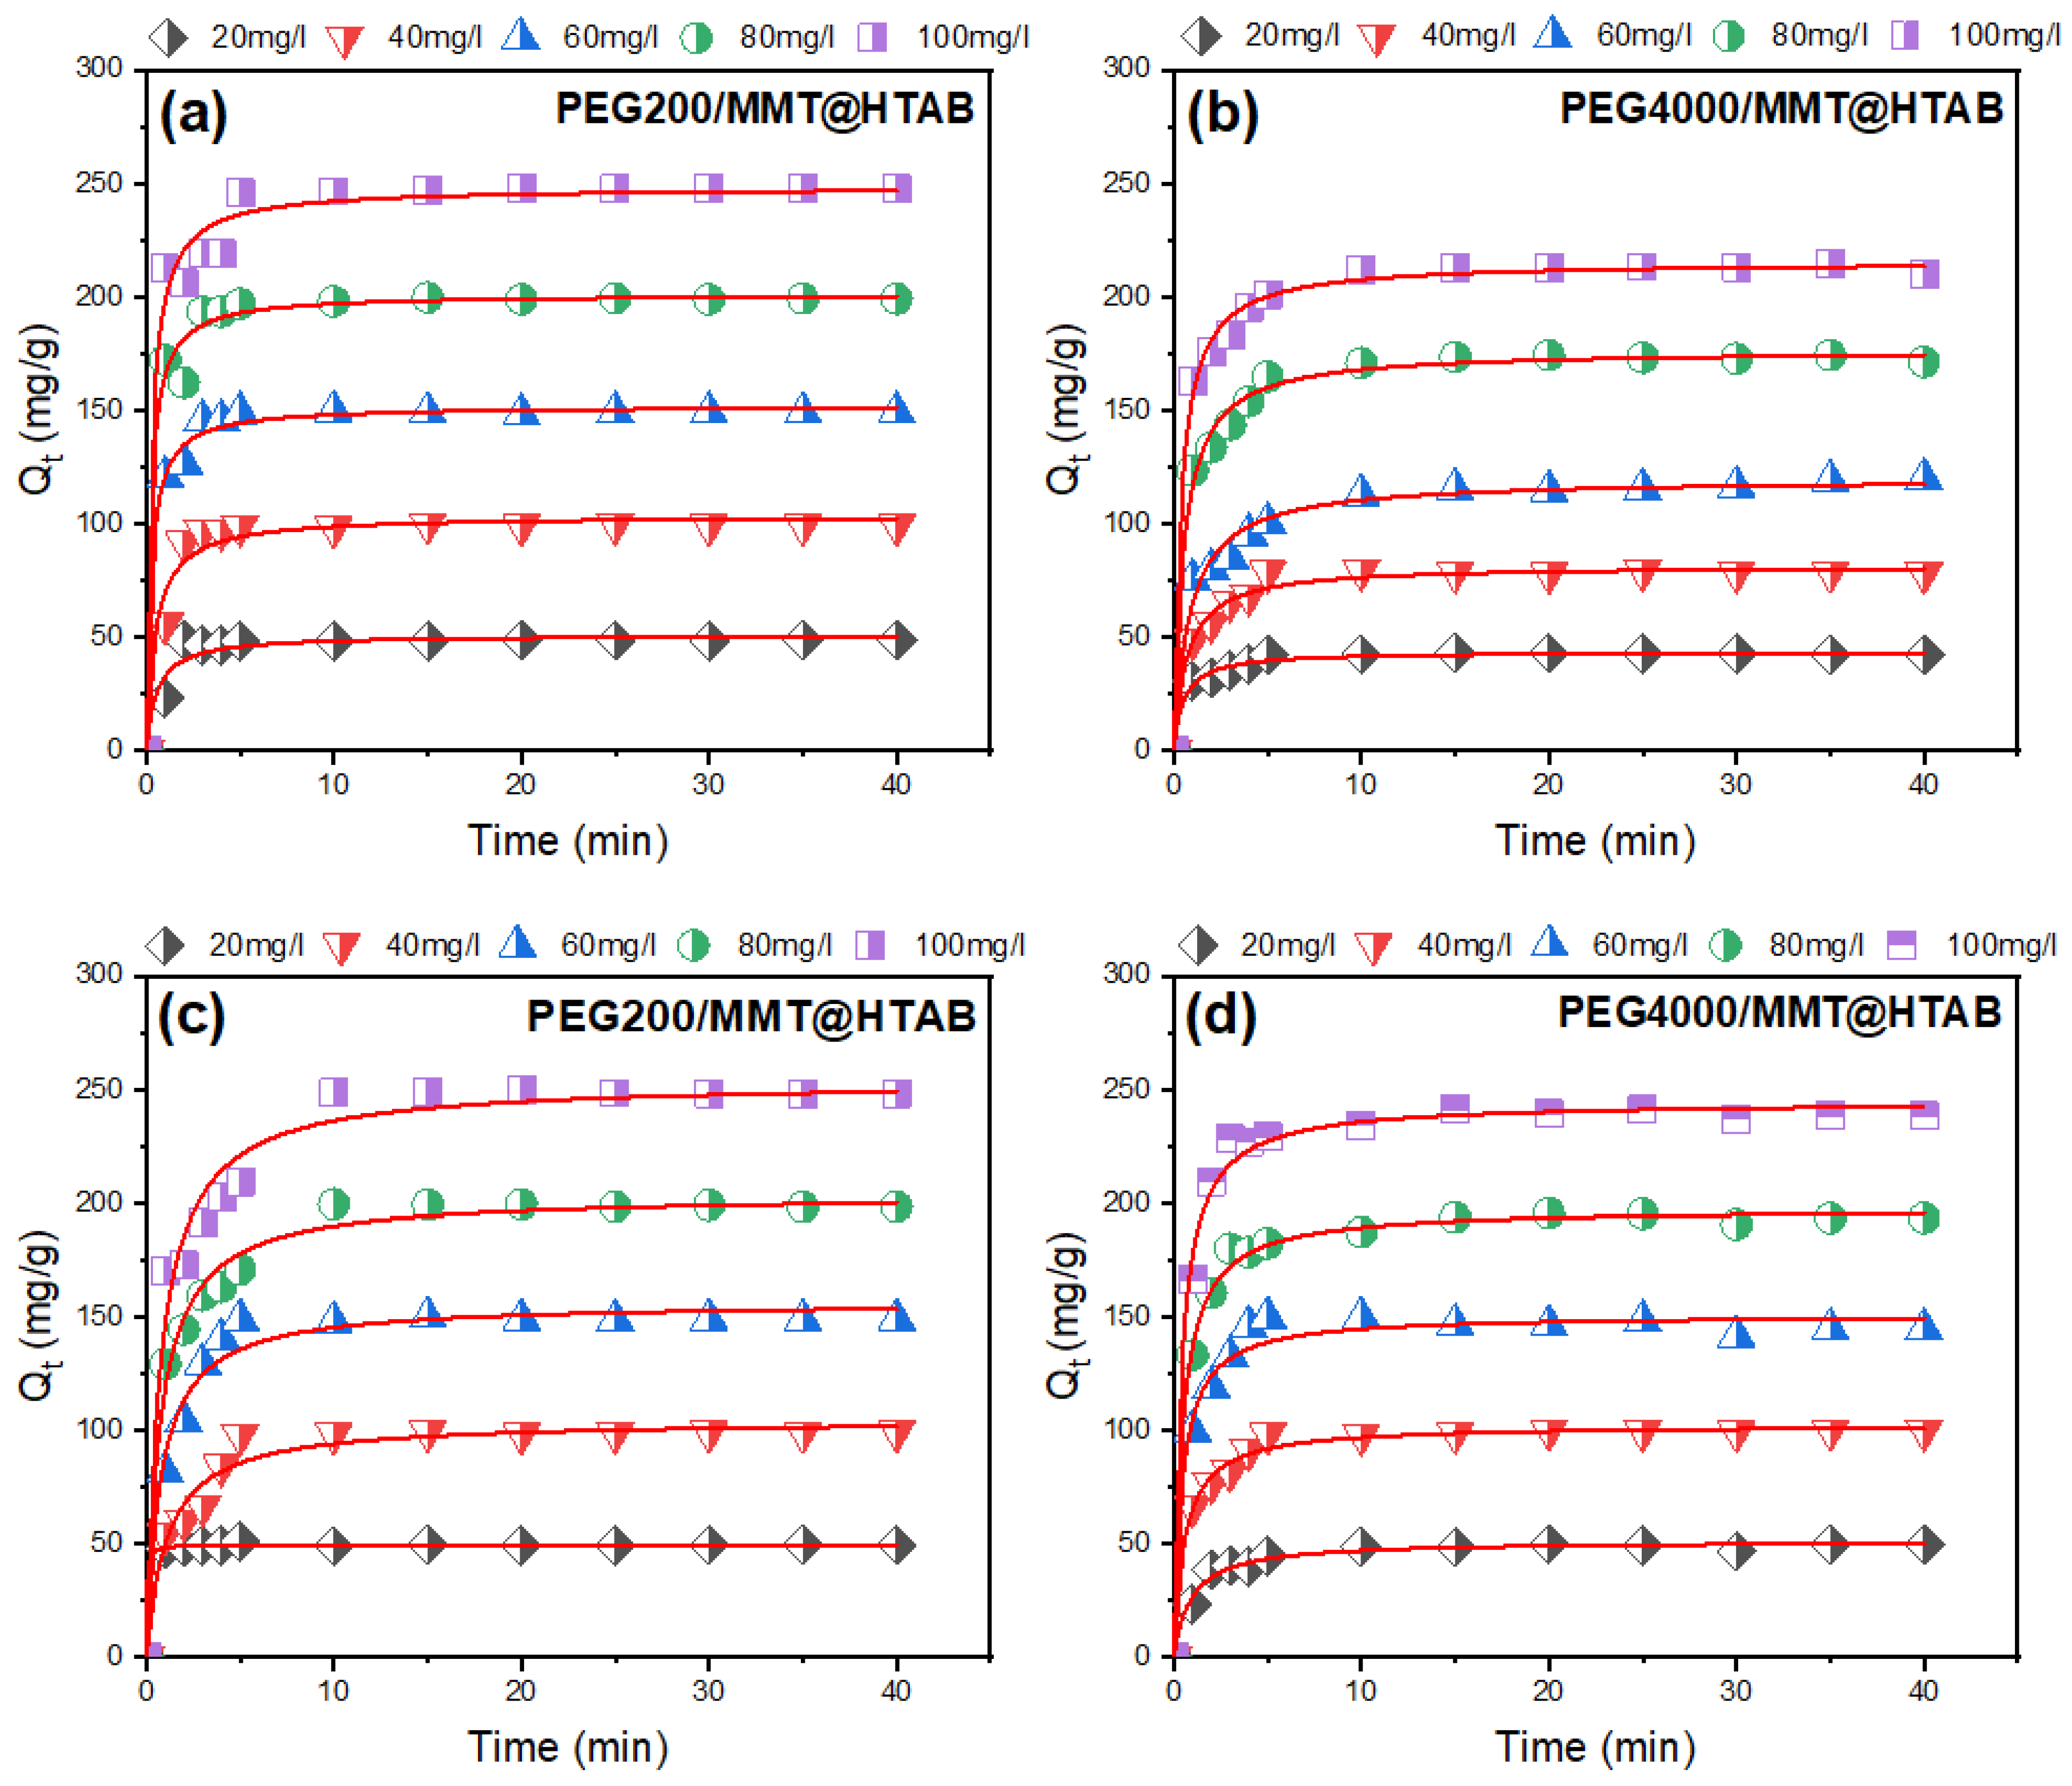
Comprehending the equilibrium time between adsorbent and adsorbate is crucial for enhancing pollutant removal from water and wastewater, as it offers vital insights for the design of adsorption processes. Figure 5 illustrates the effect of contact duration on the adsorption of MB and CR by PEG200/MMT@HTAB (Figure 5a,b) and PEG4000/MMT@HTAB (Figure 5c,d) at different initial dye concentrations. In the first 10 min, the adsorption rate was exceptionally high, exceeding 50% of the dye adsorbed. The fast absorption is due to the plentiful free functional groups on the adsorbent surfaces, which promote robust attractive contacts between the dye molecules and the adsorbent material. As the adsorption process progresses, the rate gradually decreases due to the initially large number of active sites available on the adsorbent surface. After 30 min, nearly all dye molecules are removed from the solution, indicating that adsorption equilibrium has been reached. This slow and gradual approach to equilibrium reflects a pre-equilibrium phase followed by a decline in adsorption rate, demonstrating that the 30-min duration is sufficient for studying the effects of other parameters on the adsorption process [50,51]. The adsorption capacity of PEG200/MMT@HTAB and PEG4000/MMT@HTAB composites for MB and CR notably increases with the initial dye concentration. This trend arises because at higher initial concentrations, the greater number of dye molecules enhances the concentration gradient, thereby promoting more efficient mass transfer to the adsorbent’s active sites [2,31]. Consequently, despite a possible decrease in removal efficiency percentage at very high concentrations, the absolute amount of dye adsorbed per unit mass of adsorbent increases, as reflected in the observed ranking: 100 mg/L > 80 mg/L > 60 mg/L > 40 mg/L > 20 mg/L for both dyes after 30 min of contact. This ranking is supported by the measured adsorption capacities, where each stepwise increase in initial dye concentration corresponded to a proportional rise in the amount of dye adsorbed. These results emphasize the critical role of initial concentration in driving adsorption performance and suggest that under the tested conditions, the adsorbents were not saturated, leaving the potential for even higher capacities at increased dye concentrations. A detailed comparison of the adsorption capacities for MB and CR reveals some notable distinctions between the two types of adsorbents. While it is generally expected that MB, as a cationic dye, exhibits higher adsorption due to favorable electrostatic interactions with the negatively charged functional groups on the adsorbent surface (─COO and ≡Si─O), our experimental results (Figure 5) show that, for PEG200/MMT@HTAB, the adsorption capacity for CR is actually higher than that for MB after 30 min. This suggests that, beyond electrostatic attraction, other interaction mechanisms such as hydrogen bonding, π–π stacking, and differences in dye molecular structure and size also play a significant role in the adsorption process. In contrast, with PEG4000/MMT@HTAB, MB adsorption surpasses that of CR, which aligns with the classical electrostatic mechanism and confirms the strong affinity of this material for cationic dyes. These results highlight the complementary adsorption properties of PEG200/MMT@HTAB and PEG4000/MMT@HTAB, emphasizing the influence of PEG molecular weight and composite structure on selectivity and capacity. Overall, both materials are shown to be highly promising and cost-effective for the removal of both cationic (MB) and anionic (CR) dyes from water, making them versatile candidates for advanced water treatment applications.

3.2.2. Influence of pH on the Adsorption of MB and CR

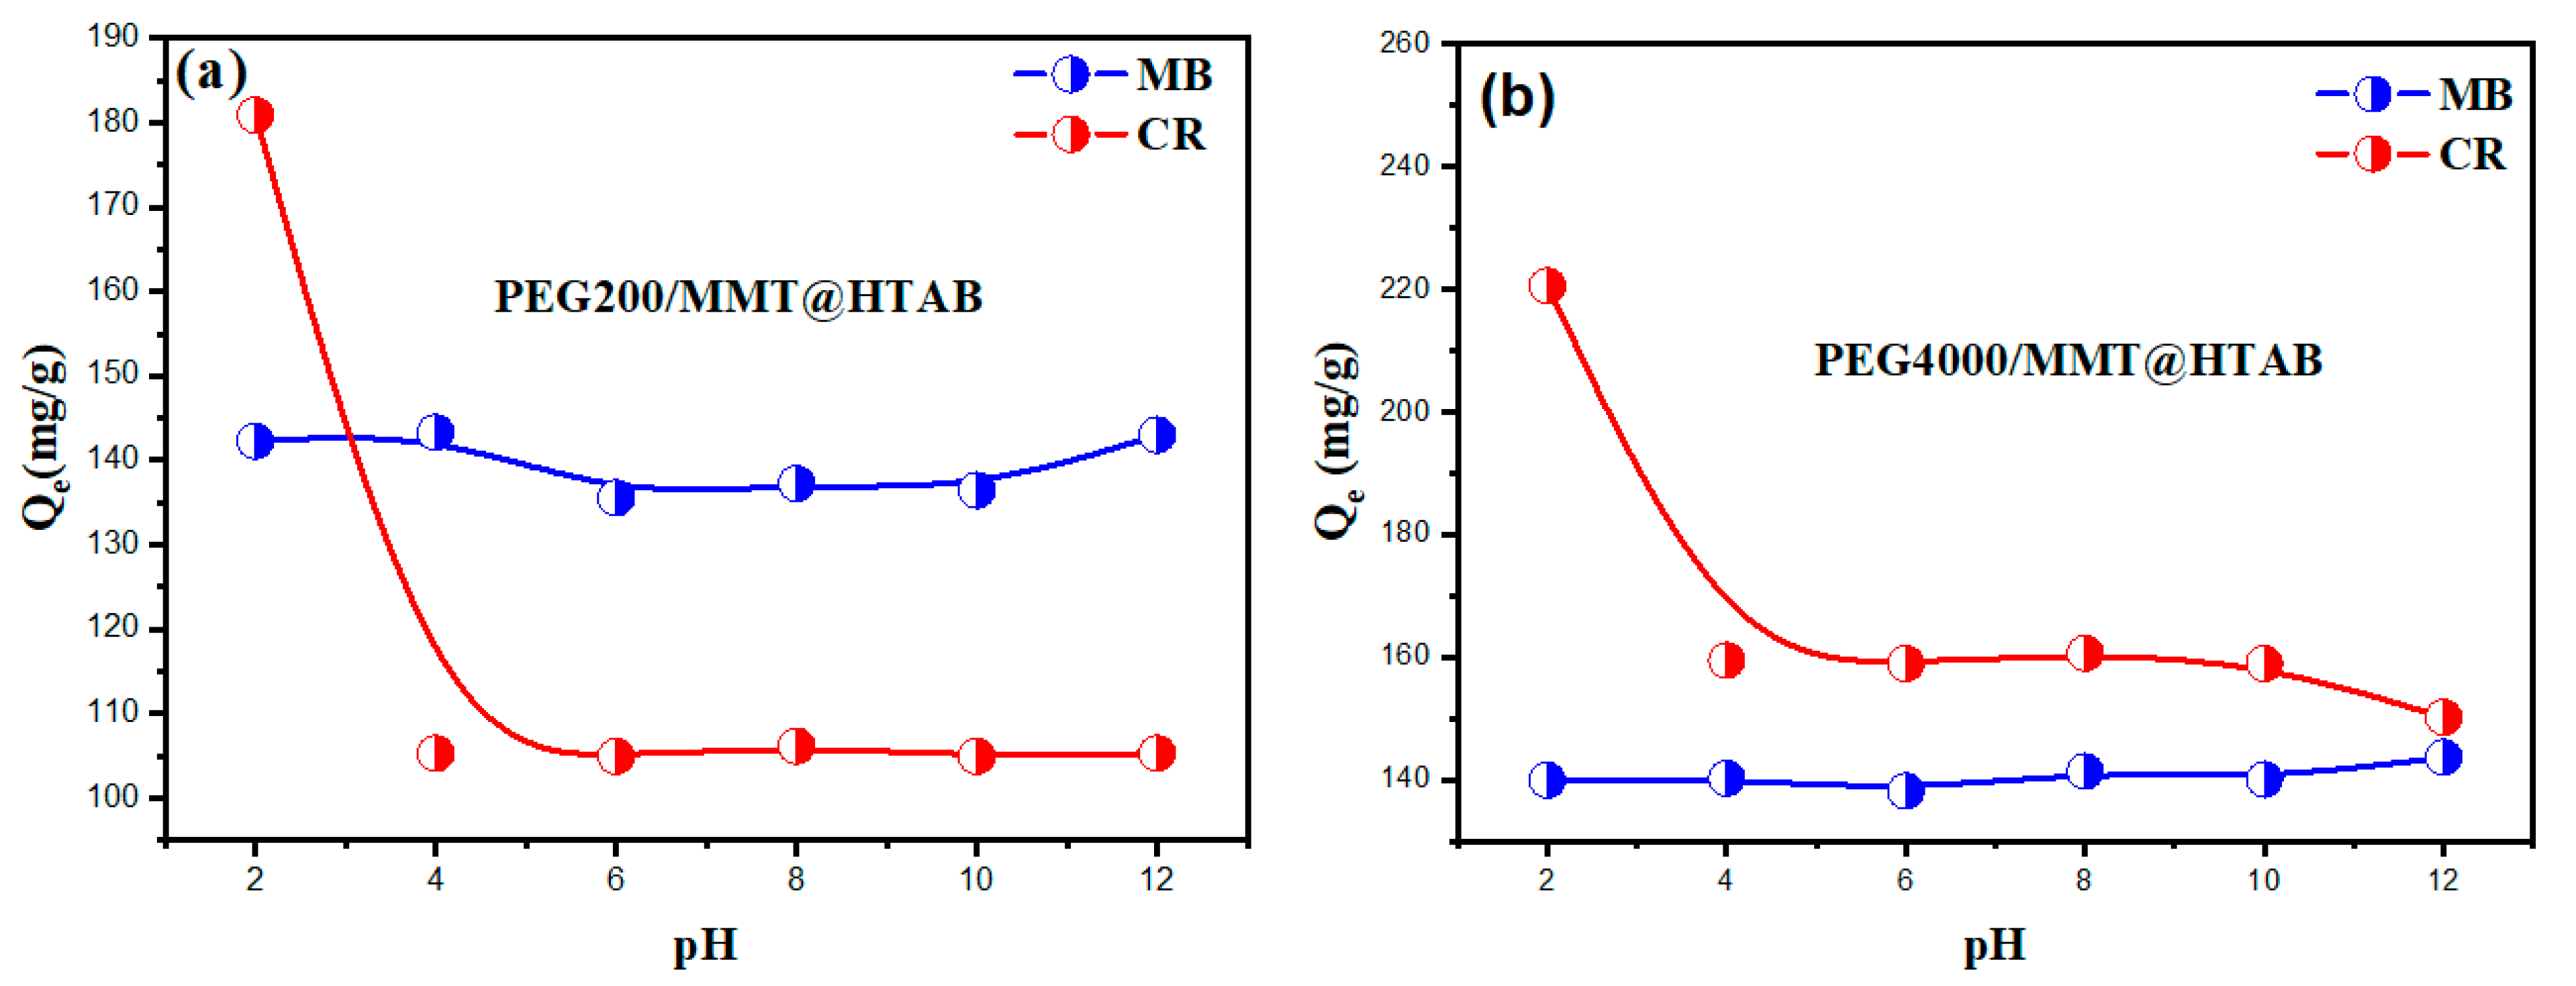
The pH of the dye solution is a crucial factor that markedly affects the adsorption capability of PEG200/MMT@HTAB and PEG4000/MMT@HTAB materials for MB and CR dyes (Figure 6). This phenomenon is mainly ascribed to the alterations in the surface charge of the adsorbent in relation to pH, which directly influences the electrostatic interactions between the adsorbent and the dye molecules. The adsorption capability of both PEG200/MMT@HTAB and PEG4000/MMT@HTAB for the anionic dye CR significantly diminishes as pH increases. At low pH levels, the adsorbent surface has a greater positive charge, hence augmenting the electrostatic attraction to the negatively charged CR molecules, leading to increased adsorption capabilities [32,52]. As the pH rises and the medium becomes more alkaline, the quantity of positively charged functional groups on the adsorbent surface decreases, resulting in heightened electrostatic repulsion between the negatively charged adsorbent and the anionic CR dye, hence diminishing adsorption capacity. Moreover, at elevated pH levels, the surplus hydroxide ions contend with CR molecules for adsorption sites, hence diminishing the adsorption efficiency. In addition to electrostatic interactions, the adsorption of CR on the composites involves mechanisms such as hydrogen bonding between CR functional groups and surface hydroxyls, van der Waals forces, and possible hydrophobic interactions related to the polymeric PEG chains intercalated in the composite structure [2,53,54]. These interactions help overcome the electrostatic repulsion at neutral and basic pH, enabling some adsorption of CR despite unfavorable charge conditions. The adsorption capacity for the cationic dye MB rises with elevated pH, attaining a stable maximum at higher pH levels. This effect arises because, in alkaline conditions, the adsorbent’s surface becomes more negatively charged, thereby aggressively attracting the positively charged MB molecules. The augmented electrostatic attraction leads to increased and more stable adsorption capabilities for MB at increasing pH levels, corroborated by zeta potential studies that validate the negative surface charge of the adsorbent in alkaline conditions. This stability in MB adsorption across the pH range also explains the nominal variation observed in adsorption capacity, as the favorable electrostatic interactions persist even at lower pH values.

3.2.3. Impact of Adsorbent Quantity on Dye Elimination Efficacy

The quantity of adsorbent utilized is pivotal to the efficacy of dye elimination from aqueous solutions. Figure 7 illustrates that augmenting the dosage of PEG200/MMT@HTAB and PEG4000/MMT@HTAB significantly improves the removal percentages of both MB and CR dyes. This tendency is mainly due to the increased availability of unoccupied adsorption sites on the adsorbent surface, enhancing interactions between the dye molecules and the adsorbent material. At reduced adsorbent doses, a significant percentage of the dyes can be eliminated, demonstrating the strong affinity and efficacy of these materials. For example, with merely 10 mg of PEG200/MMT@HTAB, the elimination efficiency for MB and CR attains roughly 80%–90%. Likewise, PEG4000/MMT@HTAB exhibits superior clearance efficiency at the identical dosage, frequently surpassing 90%. This exceptional performance at minimal dosages highlights the efficacy of these adsorbents in remediating dye-contaminated water. The observed increase in removal efficiency with higher adsorbent dosages is due to the presence of more active sites, which enhances the probability of dye molecules being captured and retained on the adsorbent surface. Additionally, the surface charge and the abundance of functional groups on PEG-modified MMT@HTAB materials contribute to their superior adsorption capacity, particularly for cationic and anionic dyes.

3.2.4. Adsorption Kinetic Models

To clarify the rate-limiting processes and adsorption mechanisms, nonlinear regression analysis was used to apply nonlinear forms of pseudo-first-order and pseudo-second-order kinetic models to the experimental adsorption data (model equations are reported in the Supplementary Data). Using well-established equations from earlier research, the experimental time-dependent adsorption capacities (Qt) were fitted to the following basic kinetic equations [55,56]. The non-linear plots of adsorption kinetics of MB and CR dyes on PEG200/MMT@HTAB and PEG4000/MMT@HTAB composites at different dye concentrations are shown in Figure 8 and Figure 9. The resulting kinetic parameters of MB and CR adsorption by MMT@HTAB at different dye concentrations are listed in Table 1 and Table 2. The kinetic analysis focused exclusively on pseudo-first-order (PFO) and pseudo-second-order (PSO) models without including diffusion-based models. This approach was justified by the strong agreement between experimental adsorption data and the kinetic models, as demonstrated by determination coefficients (R2) consistently above 0.922 over the tested concentration range (20–100 mg/L) for both methylene blue (MB) and Congo red (CR) adsorption onto PEG-modified montmorillonite composites. The superior fit of the PSO model (R2 ranging from 0.922 to 0.996 for MB and 0.965 to 0.998 for CR) might imply a chemisorption-dominated mechanisms; however, this interpretation should be made cautiously and considered alongside complementary isotherm analyses [57,58], where rate-limiting steps involve electron sharing or covalent bonding between dye molecules and functional groups (e.g., quaternary ammonium sites) on the adsorbent surfaces, rather than diffusion-controlled processes. This is further supported by the concentration-dependent decrease in PSO rate constants (k2), where elevated initial dye concentrations (20 → 100 mg/L) reduce k2 values by up to two orders of magnitude (e.g., adsorption of MB dye by PEG200/MMT@HTAB: 0.362 → 0.016 g/mg·min−1), reflecting site saturation and diminished adsorption driving force, a behavior characteristic of surface-reaction-controlled kinetics. The negligible deviation between experimental and model-predicted equilibrium capacities (e.g., adsorption of CR dye by PEG4000/MMT@HTAB: 244.880 mg/g calc. vs. 236.450 mg/g exp. at 100 mg/L) confirms that diffusion phenomena were statistically insignificant in this system. The results demonstrate superior modeling of total MB and CR dye adsorption by PEG200/MMT@HTAB and PEG4000/MMT@HTAB composites across the entire adsorption period, as evidenced by determination coefficients (R2) consistently exceeding 0.922 and outperforming pseudo-first-order models [50]. Kinetic analysis confirms faster adsorption rates for PEG4000/MMT@HTAB, particularly, the removal of CR dye by PEG200/MMT@HTAB at low concentrations (e.g., k2 = 0.022 g/mg·min−1 at 20 mg/L vs. 0.008 g/mg·min−1 at 40 mg/L), while both composites show exceptional promise for ultrafast removal of cationic (MB) and anionic (CR) dyes from wastewater. Furthermore, the absence of multiphase kinetics in qt versus t plots characterized by a single linear adsorption phase supports the conclusion that adsorption processes did not govern the rate-limiting steps, validating the exclusive focus on the PSO model for mechanistic interpretation.

3.2.5. Adsorption Isotherm Models

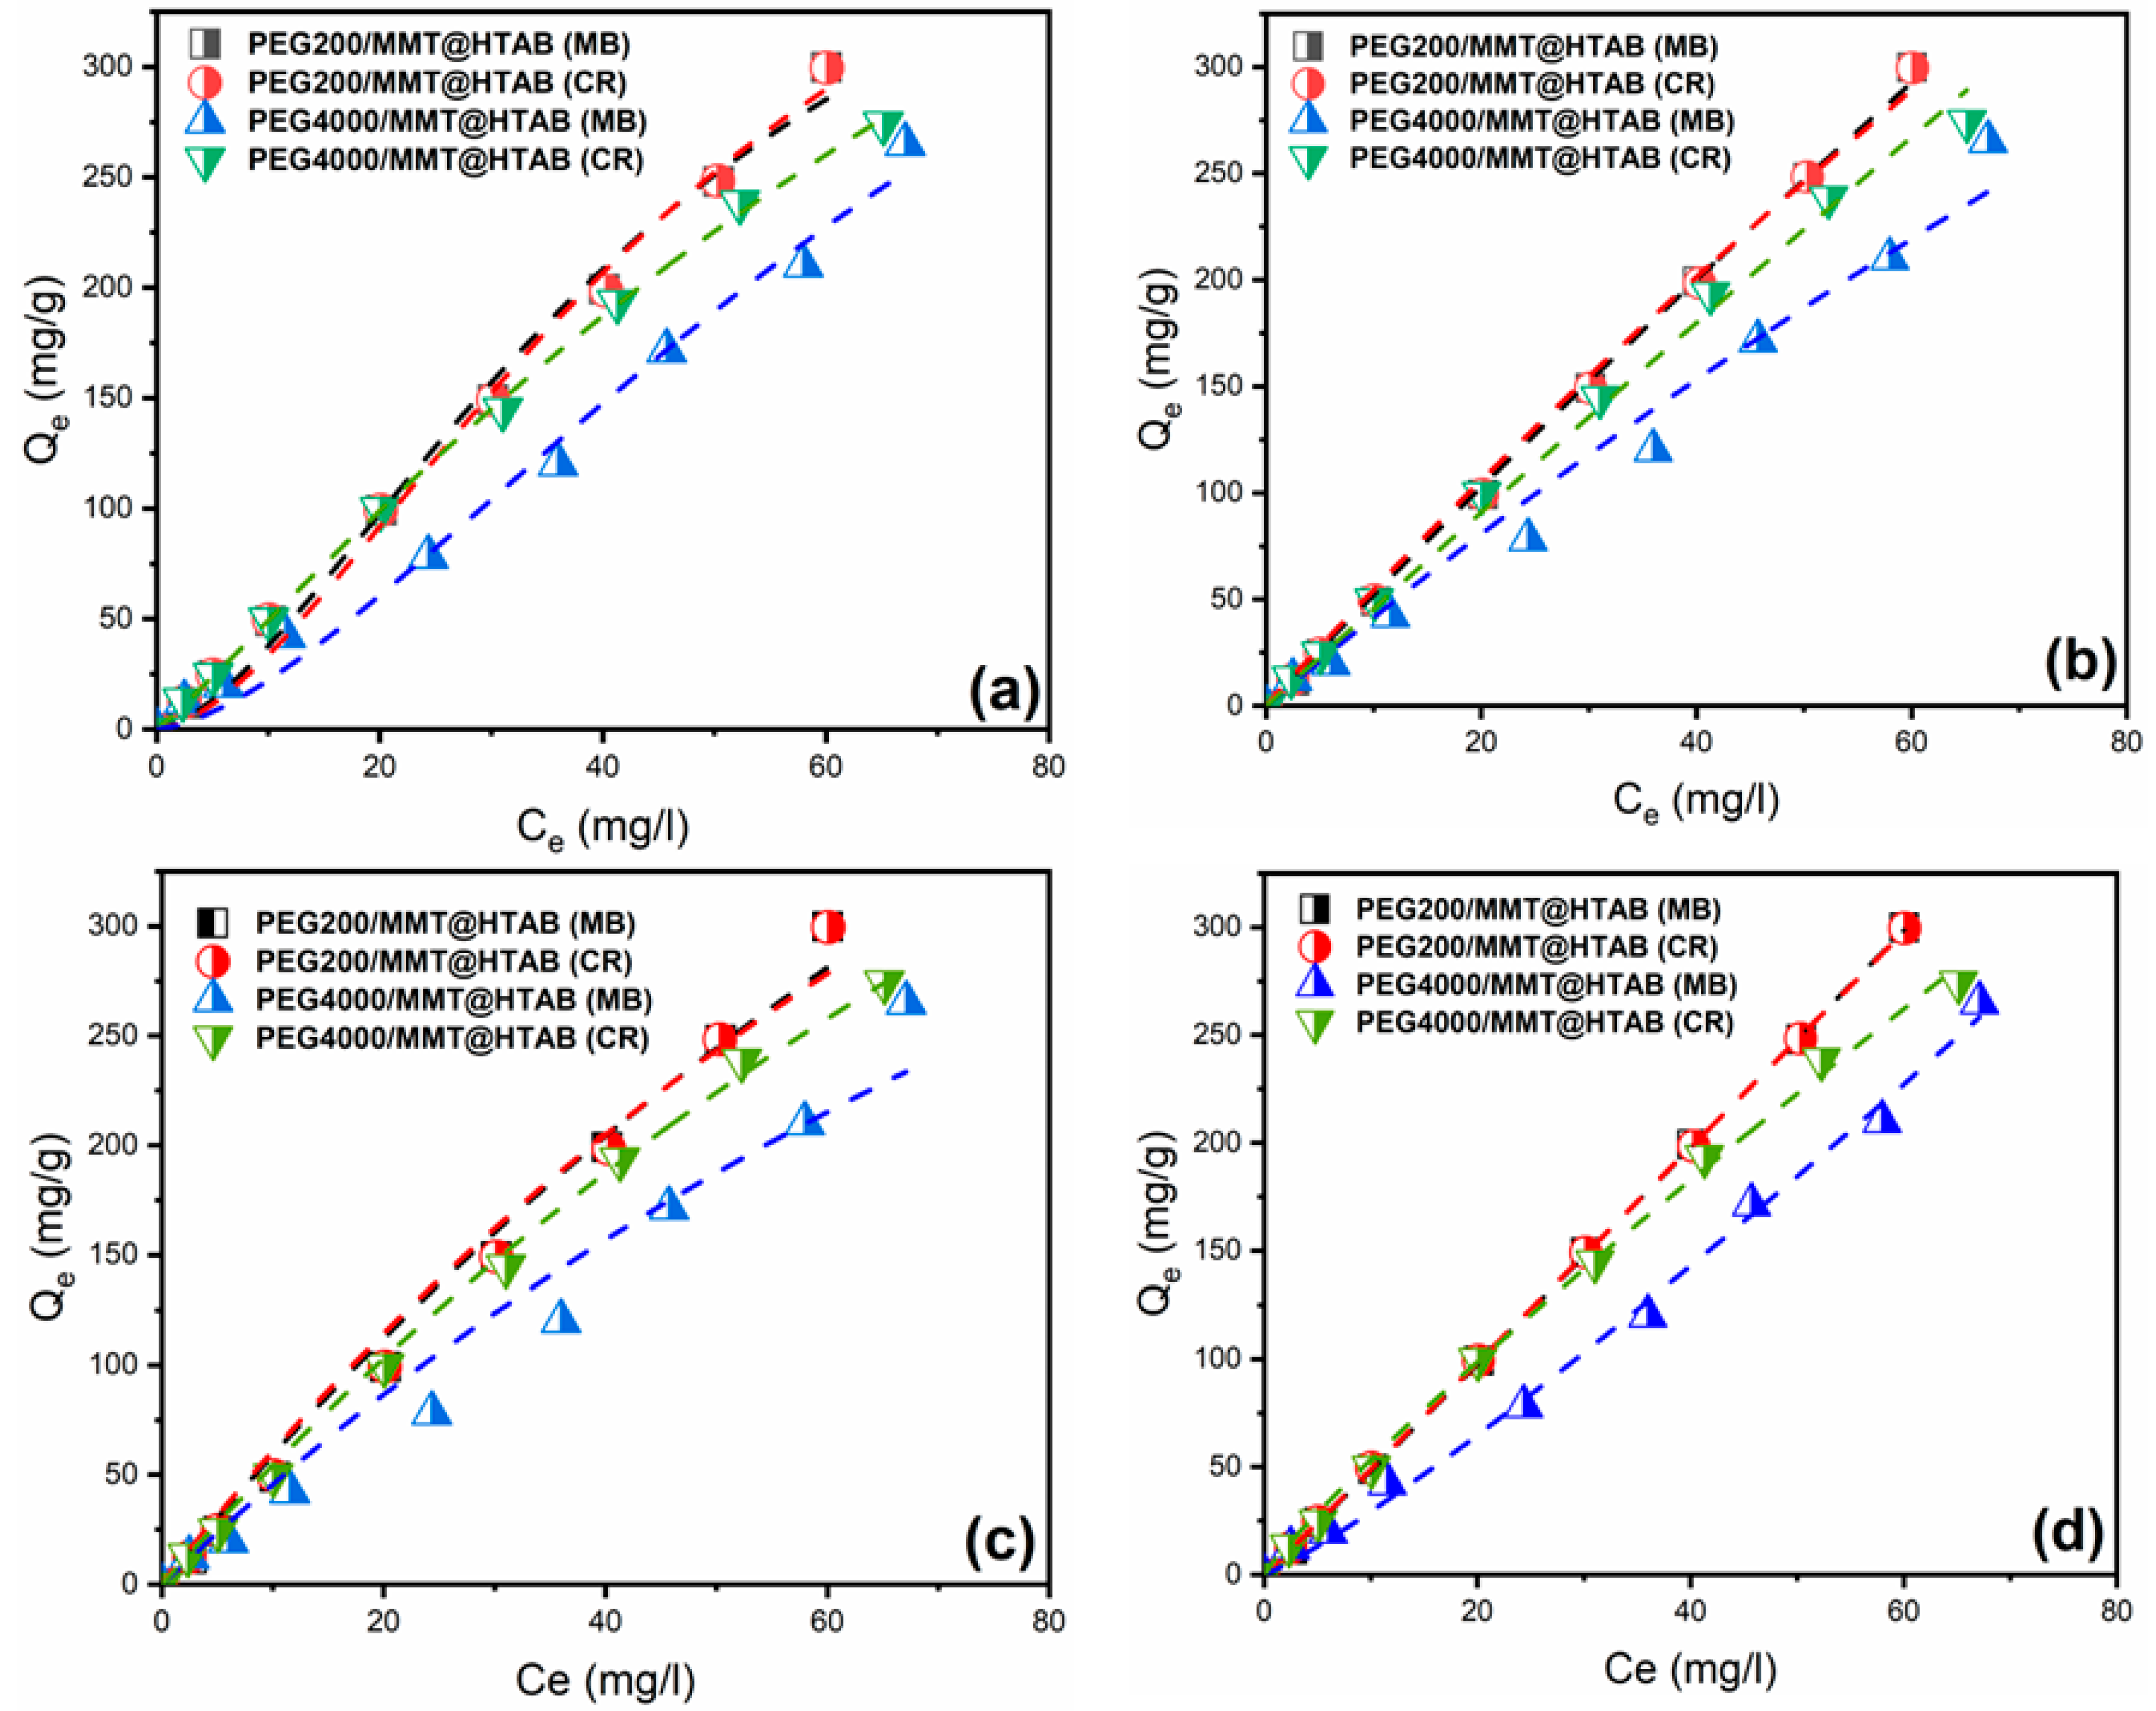
Isotherm adsorption data were modelled by applying different models such as Langmuir/Freundlich (Sips) [59], Langmuir [60,61], Freundlich [62,63], and Dubinin–Radushkevich (D–R) models [64,65]. Equations of models are reported in the Supplementary Data. The isotherm constants for the Langmuir, Freundlich, and Dubinin–Radushkevich (D–R) models were determined using nonlinear regression analysis with Origin software (Origin Pro 2018 v9.5). The experimental results and the model fits for the three isotherms are presented in the corresponding Figure 10 and Figure 11, while the estimated parameters are summarized in the Table 3 and Table 4. Nonlinear isotherm analysis reveals that Langmuir and Freundlich models provide superior mechanistic insights into MB and CR adsorption onto PEG-modified montmorillonite composites, as evidenced by consistently higher determination coefficients across all systems (Table 3). The Langmuir–Freundlich model parameters indicate predominantly monolayer adsorption, with ns < 1 proving the presence of multilayer adsorption on irregular surfaces [66]. The Redlich–Peterson model further reveals mechanistic complexity: β normally changes between 0 and 1, indicating favorable adsorption. Comparative analysis shows that Langmuir maximum adsorption capacities vary significantly, with PEG200/MMT@HTAB adsorbing up to 1132 mg/g of MB dye versus 981.3 mg/g for CR dye. Freundlich parameters confirm favorable multilayer adsorption with moderate surface heterogeneity, aligning well with SEM observations of surface roughness. The superior flexibility and fit of these three-parameter models (Langmuir–Freundlich, and Redlich–Peterson) demonstrate their necessity for accurate characterization of complex, dye-specific adsorption mechanisms.
In parallel, the D–R model fits the adsorption isotherm data (especially for Ce > 0.6) with R2 values between 0.91 and 0.94 (Table 4). The maximum adsorption capacities (Qm) obtained via D–R vary depending on the dye and material, reaching up to 310.74 mg/g for MB on PEG200/MMT@HTAB. Importantly, the mean adsorption energies (E), calculated from the D–R equation, remain consistently below 8 kJ·mol−1 for all systems, indicating that adsorption is primarily physical (physisorption) [67,68], governed by weak and reversible interactions. This aligns with established literature thresholds distinguishing physisorption (E < 8 kJ·mol−1) from chemisorption (8 ≤ E ≤ 16 kJ·mol−1). Taken together, these findings reveal that PEG-modified montmorillonite composites exhibit strong adsorption capacities for organic dyes, with adsorption mechanisms largely dominated by physisorption. The comprehensive modeling approach combining highly descriptive three-parameter isotherm models with energy-focused Dubinin–Radushkevich analysis provides valuable mechanistic insights and confirms the effectiveness of these materials for wastewater treatment and dye removal.

3.2.6. Thermodynamic Investigations

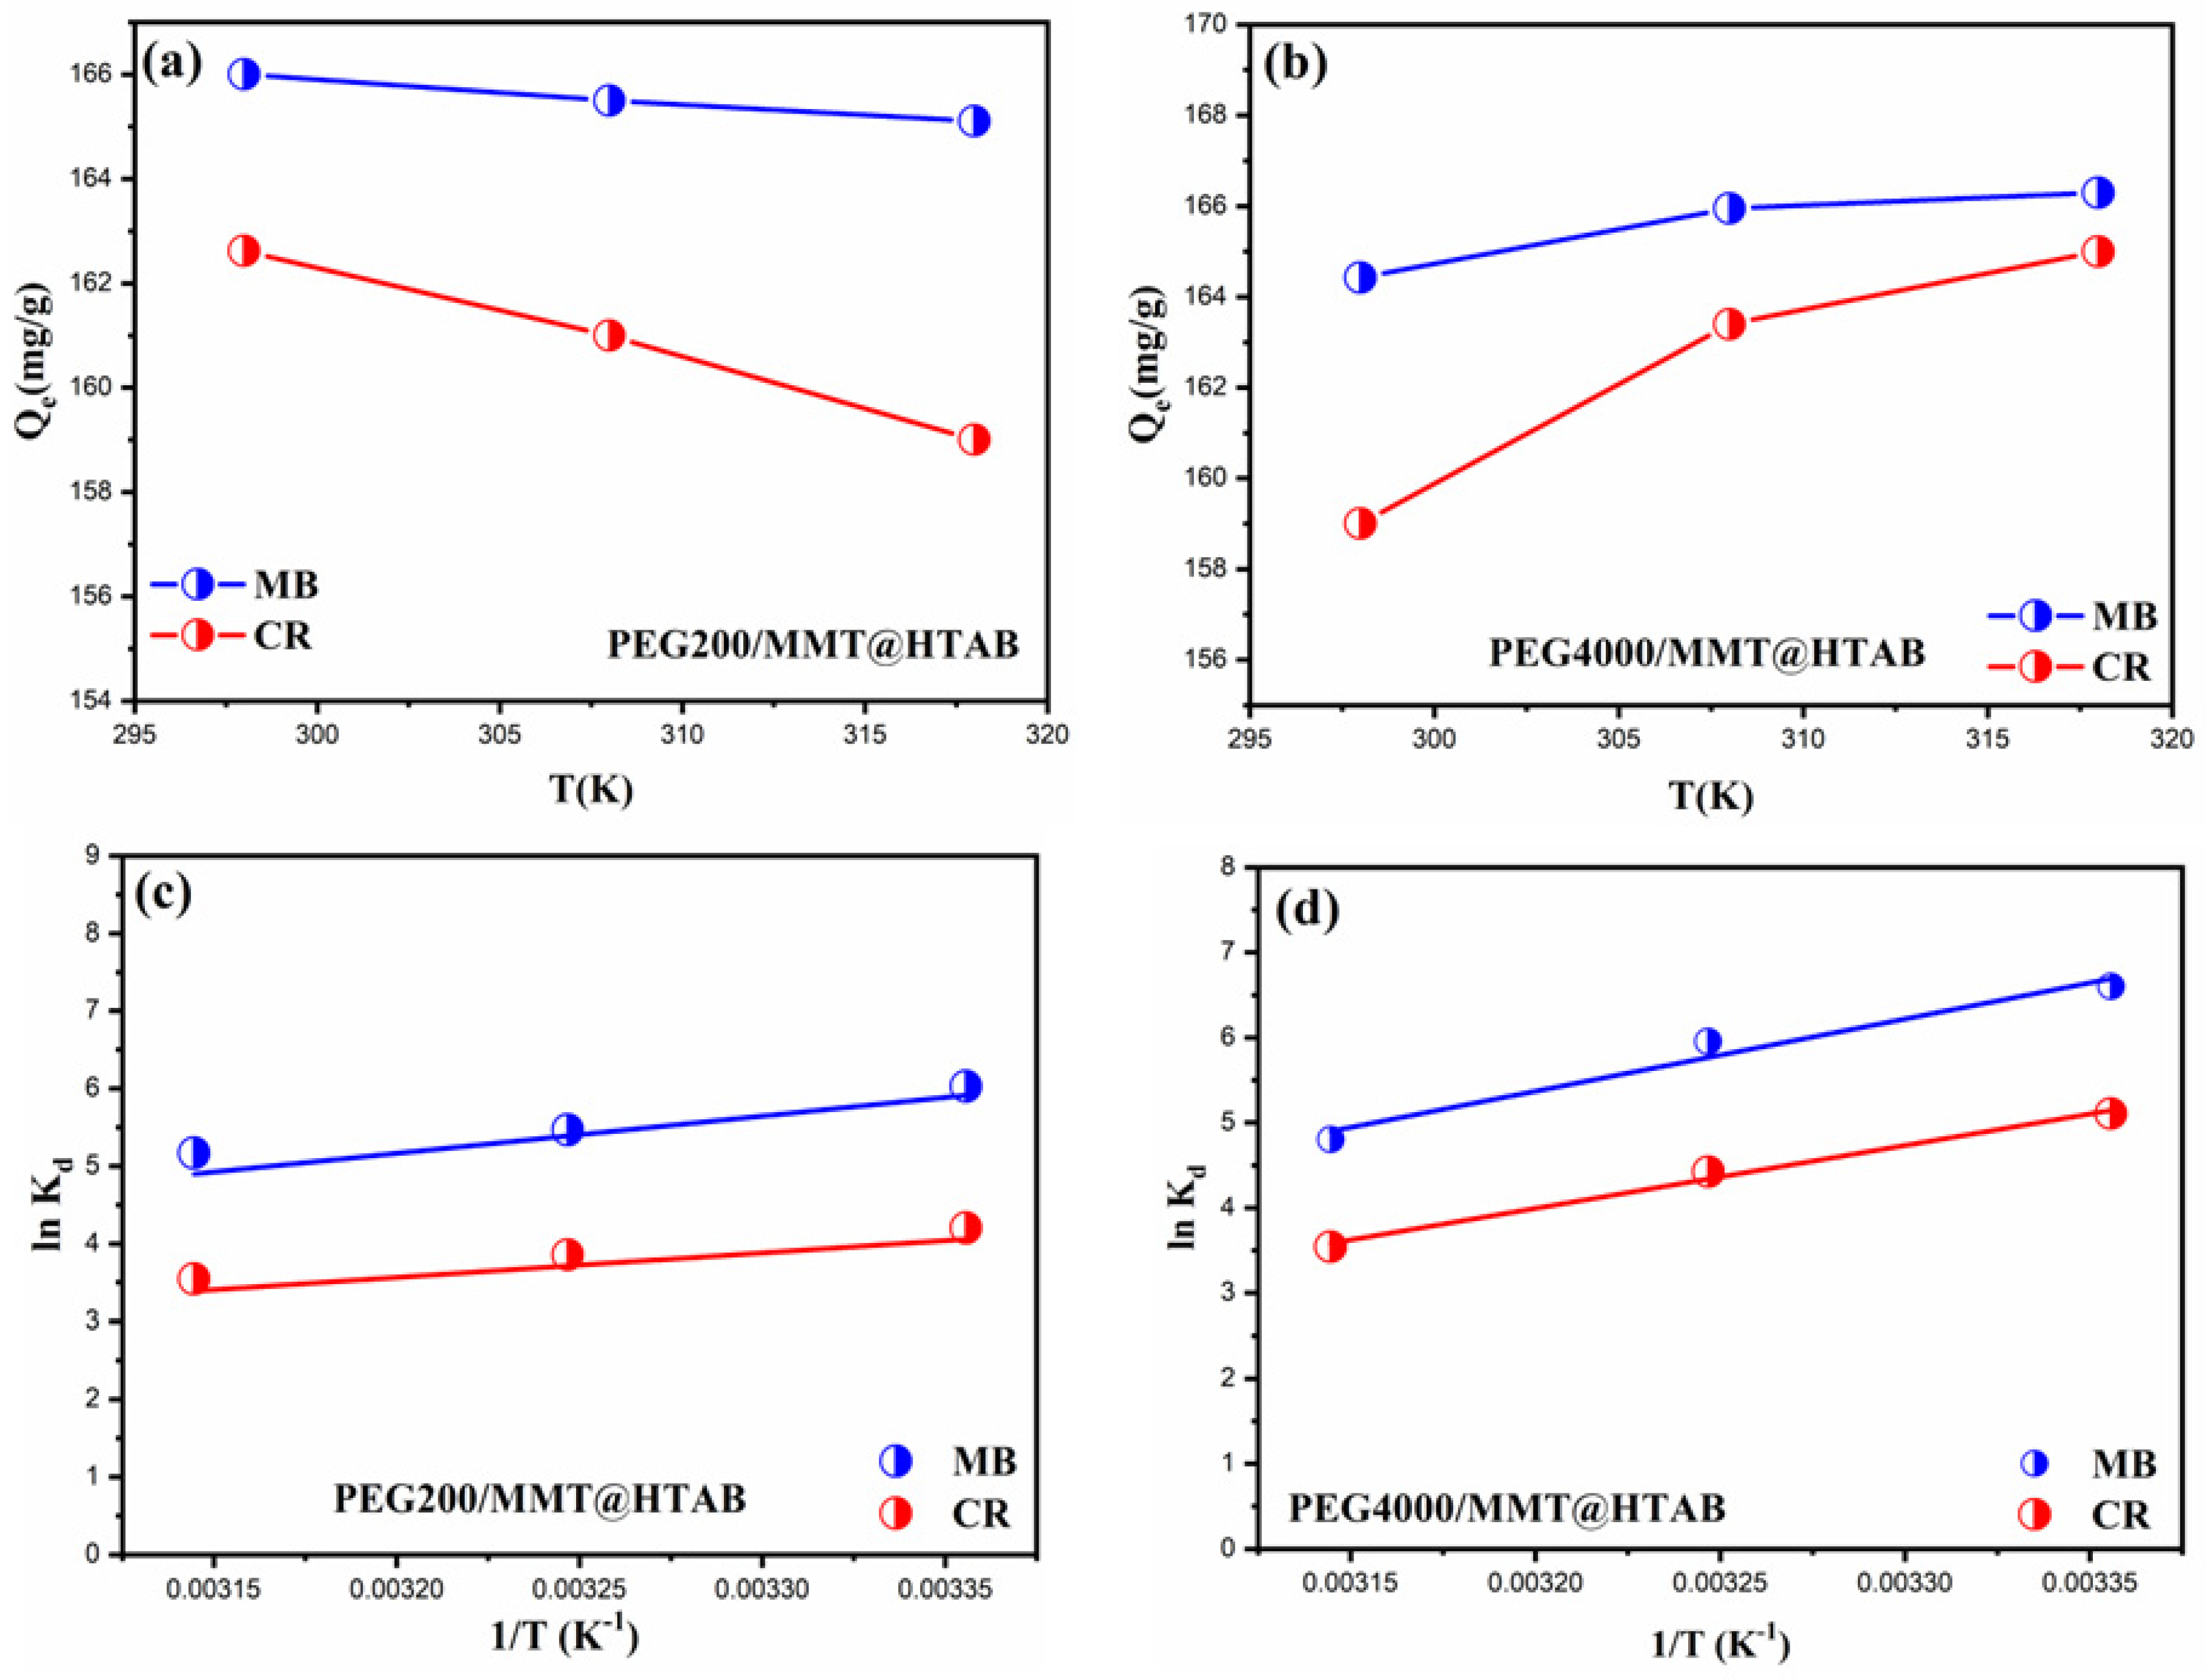
Temperature is a critical factor influencing the adsorption process; therefore, thermodynamic parameters were examined to better understand the energy changes involved, including the standard enthalpy (ΔH°, kJ/mol), standard entropy (ΔS°, kJ/mol·K), and standard Gibbs free energy (ΔG°, kJ/mol). Isothermal adsorption data collected at various temperatures were subsequently used to calculate these parameters using established thermodynamic equations from the literature [31,69]. The temperature-dependent adsorption behavior of cationic dyes on PEG-modified organoclay nanocomposites reveals complex thermodynamic interactions significantly affected by PEG chain length. This is illustrated by the adsorption capacity profiles (Figure 12a,b) and the corresponding Van’t Hoff plots (Figure 12c,d). In the case of PEG200/MMT@HTAB, the MB dye demonstrates a consistently stable adsorption capacity throughout the temperature range of 296–318 K, whereas the CR dye reveals a notable minimum at 308 K, indicating competing thermodynamic effects in which enthalpic and entropic contributions vary depending on the dye and adsorbent system. Conversely, PEG4000/MMT@HTAB exhibits heightened temperature sensitivity, as evidenced by MB dye gradual reduction in adsorption capacity and CR initial increase followed by a decline, suggesting that extended PEG chains generate more intricate adsorption environments with multiple binding sites of differing thermal stability. The linear connections in the ln (Kd) versus (1/T) graphs validate the Van’t Hoff methodology for ascertaining thermodynamic parameters [70,71], with the slopes and intercepts offering insights into the enthalpy and entropy changes that drive the adsorption processes. The differing temperature dependencies of the two PEG chain lengths underscore the essential influence of polymer chain mobility and conformational flexibility on dye–surface interactions, with shorter PEG200 chains offering more rigid binding environments in contrast to the more flexible PEG4000 chains, which can experience temperature-induced conformational alterations that impact accessibility to adsorption sites. The findings indicate that the interaction between PEG chain length and temperature produces unique thermodynamic signatures that can be utilized for selective dye removal applications, allowing the customization of PEG molecular weight to enhance performance under particular operational temperature conditions. The energies such as enthalpy change (ΔH°), the Gibbs free energy change (ΔG°) and the entropy change (ΔS°) were calculated at three temperatures of 298, 308, and 318 K and are recorded in Table 5. As shown, the ΔH energies have values that are less than zero, which illustrates that the adsorption processes of MB and CR by both adsorbents are exothermic [72,73]. If all of the adsorption processes’ ΔG energy levels are calculated to be less than zero, this indicates that the adsorption processes are spontaneous [74]. The adsorption capacity of MB and CR dyes is not significantly impacted by temperature since the Gibbs free energy change is constant as the temperature changes. The disorder between the liquid and solid phase interfaces grows during adsorption, as shown by entropy change values greater than zero. In agreement with earlier research, this demonstrates that van der Waals forces, hydrogen bonding forces, and inter-dipole forces are the primary drivers of MB and CR adsorption by PEG200/MMT@HTAB and PEG4000/MMT@HTAB.

4. Conclusions

This study demonstrates that PEG-modified montmorillonite/HTAB nanocomposites are highly effective and tunable adsorbents for the rapid removal of both cationic methylene blue and anionic Congo red dyes from aqueous solutions. The interplay between PEG chain length and surface modification strongly influenced adsorption performance, with PEG200/MMT@HTAB exhibiting superior capacity for methylene blue adsorption, whereas PEG4000/MMT@HTAB showed enhanced uptake of Congo red. Thermodynamic evaluations indicated spontaneous, exothermic adsorption with minimal temperature dependence, dominated by physical interactions such as van der Waals forces and dipole interactions. Moreover, the materials displayed favorable structural integrity, thermal stability, and adjustable surface charge properties, underscoring their robustness and versatility. Collectively, these results highlight PEG-modified organo-clays as promising, regenerable, and scalable adsorbents for advanced wastewater treatment, offering an effective and sustainable strategy for the selective remediation of dye-contaminated effluents.

Supplementary Materials

The following supporting information can be downloaded at: https://www.mdpi.com/article/10.3390/min15090935/s1, Figure S1. XRD patterns of MMT and MMT@HTAB samples. Figure S2. FTIR spectra of MMT and MMT@HTAB samples. Table S1 Summary of main mass loss stages, temperature ranges, and percentages for PEG200/MMT@HTAB and PEG4000/MMT@HTAB composites as determined by TGA.

Author Contributions

A.S.: resources, methodology, formal analysis and methodology writing-original draft. S.A.: Resources, methodology, writing—original draft. A.M.: conceptualization, methodology, formal analysis, investigation, writing—original draft. K.Z.: methodology, formal analysis, and investigation. M.H.: resources and methodology. B.B.: review and editing, methodology, validation. G.V.: Formal analysis and investigation, formal analysis, review and editing, funding acquisition. Z.A.: conceptualization, formal analysis, supervision, review and editing. M.A.: conceptualization, validation, formal analysis, review & editing, funding acquisition. All authors have read and agreed to the published version of the manuscript.

Funding

The authors thank DGRSDT and the Ministry of Education and Scientific Research of Algeria for funding this work. The authors extend their appreciation to the Deanship of Scientific Research at King Khalid University for funding this work through a large group Research Project under grant number RGP2/132/46.

Data Availability Statement

All the data and materials of this paper are available for the reader.

Conflicts of Interest

All the authors explicitly declare the absence of any conflicts of interest.

References

  1. Zhu, H.; Chen, S.; Duan, H.; He, J.; Luo, Y. Removal of Anionic and Cationic Dyes Using Porous Chitosan/Carboxymethyl Cellulose-PEG Hydrogels: Optimization, Adsorption Kinetics, Isotherm and Thermodynamics Studies. Int. J. Biol. Macromol. 2023, 231, 123213. [Google Scholar] [CrossRef]
  2. Mokhtar, A.; Abdelkrim, S.; Sardi, A.; Hachemaoui, M.; Chaibi, W.; Chergui, F.; Boukoussa, B.; Djelad, A.; Sassi, M.; Abboud, M. A Strategy for the Efficient Removal of Acidic and Basic Dyes in Wastewater by Organophilic Magadiite@alginate Beads: Box-Behnken Design Optimization. Int. J. Biol. Macromol. 2024, 277, 134348. [Google Scholar] [CrossRef]
  3. Mokhtar, A.; Asli, B.; Abdelkrim, S.; Hachemaoui, M.; Boukoussa, B.; Sassi, M.; Viscusi, G.; Abboud, M. Polymer/Clay Nanocomposites as Advanced Adsorbents for Textile Wastewater Treatment. Minerals 2024, 14, 1216. [Google Scholar] [CrossRef]
  4. Bhattacharya, S.; Shunmugam, R. Unraveling the Effect of PEG Chain Length on the Physical Properties and Toxicant Removal Capacities of Cross-Linked Network Synthesized by Thiol–Norbornene Photoclick Chemistry. ACS Omega 2020, 5, 2800–2810. [Google Scholar] [CrossRef] [PubMed]
  5. Ai, L.; Zhang, C.; Liao, F.; Wang, Y.; Li, M.; Meng, L.; Jiang, J. Removal of Methylene Blue from Aqueous Solution with Magnetite Loaded Multi-Wall Carbon Nanotube: Kinetic, Isotherm and Mechanism Analysis. J. Hazard. Mater. 2011, 198, 282–290. [Google Scholar] [CrossRef] [PubMed]
  6. Yagub, M.T.; Sen, T.K.; Afroze, S.; Ang, H.M. Dye and Its Removal from Aqueous Solution by Adsorption: A Review. Adv. Colloid Interface Sci. 2014, 209, 172–184. [Google Scholar] [CrossRef] [PubMed]
  7. Salama, I.E.; Slavchov, R.I.; Filip, S.V.; Clarke, S.M. Chemisorption and Physisorption of Alcohols on Iron(III) Oxide-Terminated Surfaces from Nonpolar Solvents. J. Colloid Interface Sci. 2025, 685, 15–28. [Google Scholar] [CrossRef]
  8. Sharma, K.; Dalai, A.K.; Vyas, R.K. Removal of Synthetic Dyes from Multicomponent Industrial Wastewaters. Rev. Chem. Eng. 2018, 34, 107–134. [Google Scholar] [CrossRef]
  9. Crini, G.; Badot, P.-M. Application of Chitosan, a Natural Aminopolysaccharide, for Dye Removal from Aqueous Solutions by Adsorption Processes Using Batch Studies: A Review of Recent Literature. Prog. Polym. Sci. 2008, 33, 399–447. [Google Scholar] [CrossRef]
  10. Fu, F.; Wang, Q. Removal of Heavy Metal Ions from Wastewaters: A Review. J. Environ. Manag. 2011, 92, 407–418. [Google Scholar] [CrossRef]
  11. Gupta, V.K. Suhas Application of Low-Cost Adsorbents for Dye Removal—A Review. J. Environ. Manag. 2009, 90, 2313–2342. [Google Scholar] [CrossRef] [PubMed]
  12. Zare, K.; Sadegh, H.; Shahryari-ghoshekandi, R.; Maazinejad, B.; Ali, V.; Tyagi, I.; Agarwal, S.; Gupta, V.K. Enhanced Removal of Toxic Congo Red Dye Using Multi Walled Carbon Nanotubes: Kinetic, Equilibrium Studies and Its Comparison with Other Adsorbents. J. Mol. Liq. 2015, 212, 266–271. [Google Scholar] [CrossRef]
  13. Zhang, F.; Song, W.; Lan, J. Effective Removal of Methyl Blue by Fine-Structured Strontium and Barium Phosphate Nanorods. Appl. Surf. Sci. 2015, 326, 195–203. [Google Scholar] [CrossRef]
  14. Ghorai, S.; Sarkar, A.; Raoufi, M.; Panda, A.B.; Schönherr, H.; Pal, S. Enhanced Removal of Methylene Blue and Methyl Violet Dyes from Aqueous Solution Using a Nanocomposite of Hydrolyzed Polyacrylamide Grafted Xanthan Gum and Incorporated Nanosilica. ACS Appl. Mater. Interfaces 2014, 6, 4766–4777. [Google Scholar] [CrossRef] [PubMed]
  15. Li, Z.; Hanafy, H.; Zhang, L.; Sellaoui, L.; Schadeck Netto, M.; Oliveira, M.L.S.; Seliem, M.K.; Luiz Dotto, G.; Bonilla-Petriciolet, A.; Li, Q. Adsorption of Congo Red and Methylene Blue Dyes on an Ashitaba Waste and a Walnut Shell-Based Activated Carbon from Aqueous Solutions: Experiments, Characterization and Physical Interpretations. Chem. Eng. J. 2020, 388, 124263. [Google Scholar] [CrossRef]
  16. Chinoune, K.; Mekki, A.; Boukoussa, B.; Mokhtar, A.; Sardi, A.; Hachemaoui, M.; Iqbal, J.; Ismail, I.; Abboud, M.; Aboneama, W.A. Adsorption Behavior of MB Dye on Alginate-Sepiolite Biocomposite Beads: Adsorption, Kinetics, and Modeling. Inorg. Chem. Commun. 2024, 165, 112558. [Google Scholar] [CrossRef]
  17. Yang, Y.; Yu, W.; He, S.; Yu, S.; Chen, Y.; Lu, L.; Shu, Z.; Cui, H.; Zhang, Y.; Jin, H. Rapid Adsorption of Cationic Dye-Methylene Blue on the Modified Montmorillonite/Graphene Oxide Composites. Appl. Clay Sci. 2019, 168, 304–311. [Google Scholar] [CrossRef]
  18. Roufegari-Nejhad, E.; Sirousazar, M.; Abbasi-Chiyaneh, V.; Kheiri, F. Removal of Methylene Blue from Aqueous Solutions Using Poly(Vinyl Alcohol)/Montmorillonite Nanocomposite Hydrogels: Taguchi Optimization. J. Polym. Environ. 2019, 27, 2239–2249. [Google Scholar] [CrossRef]
  19. Lackovičová, M.; Baranyaiová, T.; Bujdák, J. The Chemical Stabilization of Methylene Blue in Colloidal Dispersions of Smectites. Appl. Clay Sci. 2019, 181, 105222. [Google Scholar] [CrossRef]
  20. Crini, G. Non-Conventional Low-Cost Adsorbents for Dye Removal: A Review. Bioresour. Technol. 2006, 97, 1061–1085. [Google Scholar] [CrossRef]
  21. Ramalingam, G.; Priya, A.K.; Gnanasekaran, L.; Rajendran, S.; Hoang, T.K.A. Biomass and Waste Derived Silica, Activated Carbon and Ammonia-Based Materials for Energy-Related Applications—A Review. Fuel 2024, 355, 129490. [Google Scholar] [CrossRef]
  22. Bouabbaci, S.; Chougui, A.; Asli, B.; Mokhtar, A.; Belouatek, A.; Boukoussa, B.; Abboud, M. Preparation and Characterization of Activated Carbon from Pine Bark Biomass for Malachite Green Removal. Int. J. Environ. Anal. Chem. 2025, 105, 1542–1565. [Google Scholar] [CrossRef]
  23. Singh, S.; Kumar, N. Removal of Dyes from Waste Water Using Low-Cost Adsorbents. Macromol. Symp. 2024, 413, 2400156. [Google Scholar] [CrossRef]
  24. Mao, S.; Gao, M. Functional Organoclays for Removal of Heavy Metal Ions from Water: A Review. J. Mol. Liq. 2021, 334, 116143. [Google Scholar] [CrossRef]
  25. Raninga, M.; Mudgal, A.; Patel, V.K.; Patel, J.; Kumar Sinha, M. Modification of Activated Carbon-Based Adsorbent for Removal of Industrial Dyes and Heavy Metals: A Review. Mater. Today Proc. 2023, 77, 286–294. [Google Scholar] [CrossRef]
  26. Boldog, I.; Dušek, M.; Jelínek, T.; Švec, P.; Ramos, F.S.d.O.; Růžička, A.; Bulánek, R. Porous 10- and 12-Vertex (Bi)-p-Dicarba-Closo-Boranedicarboxylates of Cobalt and Their Gas Adsorptive Properties. Microporous Mesoporous Mater. 2018, 271, 284–294. [Google Scholar] [CrossRef]
  27. Li, G.L.; Zhou, C.H.; Fiore, S.; Yu, W.H. Interactions between Microorganisms and Clay Minerals: New Insights and Broader Applications. Appl. Clay Sci. 2019, 177, 91–113. [Google Scholar] [CrossRef]
  28. Natarajan, S.; Anitha, V.; Gajula, G.P.; Thiagarajan, V. Synthesis and Characterization of Magnetic Superadsorbent Fe3O4-PEG-Mg-Al-LDH Nanocomposites for Ultrahigh Removal of Organic Dyes. ACS Omega 2020, 5, 3181–3193. [Google Scholar] [CrossRef] [PubMed]
  29. Sarkar, N.; Sahoo, G.; Swain, S.K. Graphene Quantum Dot Decorated Magnetic Graphene Oxide Filled Polyvinyl Alcohol Hybrid Hydrogel for Removal of Dye Pollutants. J. Mol. Liq. 2020, 302, 112591. [Google Scholar] [CrossRef]
  30. Edathil, A.A.; Pal, P.; Banat, F. Alginate Clay Hybrid Composite Adsorbents for the Reclamation of Industrial Lean Methyldiethanolamine Solutions. Appl. Clay Sci. 2018, 156, 213–223. [Google Scholar] [CrossRef]
  31. Sardi, A.; Bounaceur, B.; Mokhtar, A.; Boukoussa, B.; Abbes, M.T.; Chaibi, W.; Nacer, A.; Khadidja, K.B.; Issam, I.; Iqbal, J.; et al. Kinetics and Thermodynamic Studies for Removal of Trypan Blue and Methylene Blue from Water Using Nano Clay Filled Composite of HTAB and PEG and Its Antibacterial Activity. J. Polym. Environ. 2023, 31, 5065–5088. [Google Scholar] [CrossRef]
  32. dos Santos, A.; Viante, M.F.; Pochapski, D.J.; Downs, A.J.; Almeida, C.A.P. Enhanced Removal of P-Nitrophenol from Aqueous Media by Montmorillonite Clay Modified with a Cationic Surfactant. J. Hazard. Mater. 2018, 355, 136–144. [Google Scholar] [CrossRef]
  33. Oueslati, W.; Ben Rhaiem, H.; Lanson, B.; Ben Haj Amara, A. Selectivity of Na–Montmorillonite in Relation with the Concentration of Bivalent Cation (Cu2+, Ca2+, Ni2+) by Quantitative Analysis of XRD Patterns. Appl. Clay Sci. 2009, 43, 224–227. [Google Scholar] [CrossRef]
  34. Abdelkrim, S.; Mokhtar, A.; Djelad, A.; Bennabi, F.; Souna, A.; Bengueddach, A.; Sassi, M. Chitosan/Ag-Bentonite Nanocomposites: Preparation, Characterization, Swelling and Biological Properties. J. Inorg. Organomet. Polym. 2020, 30, 831–840. [Google Scholar] [CrossRef]
  35. McLauchlin, A.R.; Thomas, N.L. Preparation and Characterization of Organoclays Based on an Amphoteric Surfactant. J. Colloid Interface Sci. 2008, 321, 39–43. [Google Scholar] [CrossRef] [PubMed]
  36. Alexandre, M.; Dubois, P. Polymer-Layered Silicate Nanocomposites: Preparation, Properties and Uses of a New Class of Materials. Mater. Sci. Eng. R Rep. 2000, 28, 1–63. [Google Scholar] [CrossRef]
  37. Mittal, V. Polymer Layered Silicate Nanocomposites: A Review. Materials 2009, 2, 992–1057. [Google Scholar] [CrossRef]
  38. Sinha Ray, S.; Okamoto, M. Polymer/Layered Silicate Nanocomposites: A Review from Preparation to Processing. Prog. Polym. Sci. 2003, 28, 1539–1641. [Google Scholar] [CrossRef]
  39. Yang, W.; Xia, X.; Liu, X.; Zhang, S. Interlayer Structure and Dynamic Properties of CTMAB–Montmorillonite: Experiment and Molecular Dynamics. RSC Adv. 2023, 13, 13324–13336. [Google Scholar] [CrossRef] [PubMed]
  40. Lertsutthiwong, P.; Noomun, K.; Khunthon, S.; Limpanart, S. Influence of Chitosan Characteristics on the Properties of Biopolymeric Chitosan–Montmorillonite. Prog. Nat. Sci. Mater. Int. 2012, 22, 502–508. [Google Scholar] [CrossRef]
  41. Wang, S.F.; Shen, L.; Tong, Y.J.; Chen, L.; Phang, I.Y.; Lim, P.Q.; Liu, T.X. Biopolymer Chitosan/Montmorillonite Nanocomposites: Preparation and Characterization. Polym. Degrad. Stab. 2005, 90, 123–131. [Google Scholar] [CrossRef]
  42. Baa, N.B.; Mokhnachi, N.B.; Haddadine, N. System Based on Clay/Polymer for Biomedical Application. J. Fundam. Appl. Sci. 2020, 12, 108–117. [Google Scholar]
  43. Sahu, M.; Reddy, V.R.M.; Kim, B.; Patro, B.; Park, C.; Kim, W.K.; Sharma, P. Fabrication of Cu2ZnSnS4 Light Absorber Using a Cost-Effective Mechanochemical Method for Photovoltaic Applications. Materials 2022, 15, 1708. [Google Scholar] [CrossRef]
  44. Mokhtar, A.; Bennabi, F.; Abdelkrim, S.; Sardi, A.; Boukoussa, B.; Souna, A.; Bengueddach, A.; Sassi, M. Evaluation of Intercalated Layered Materials as an Antimicrobial and Drug Delivery System: A Comparative Study. J. Incl. Phenom. Macrocycl. Chem. 2020, 96, 353–364. [Google Scholar] [CrossRef]
  45. Zaichik, S.; Steinbring, C.; Jelkmann, M.; Bernkop-Schnürch, A. Zeta Potential Changing Nanoemulsions: Impact of PEG-Corona on Phosphate Cleavage. Int. J. Pharm. 2020, 581, 119299. [Google Scholar] [CrossRef] [PubMed]
  46. Lee, D.; Char, K.; Lee, S.W.; Park, Y.W. Structural Changes of Polyaniline/Montmorillonite Nanocomposites and Their Effects on Physical Properties. J. Mater. Chem. 2003, 13, 2942–2947. [Google Scholar] [CrossRef]
  47. Moslemizadeh, A.; Khezerloo-ye Aghdam, S.; Shahbazi, K.; Khezerloo-ye Aghdam, H.; Alboghobeish, F. Assessment of Swelling Inhibitive Effect of CTAB Adsorption on Montmorillonite in Aqueous Phase. Appl. Clay Sci. 2016, 127–128, 111–122. [Google Scholar] [CrossRef]
  48. Nie, J.; Ke, Y.; Zheng, H.; Yi, Y.; Qin, Q.; Pan, F.; Dong, P. Preparation and Characterization of Organo Montmorillonite Modified by a Novel Gemini Surfactant. Integr. Ferroelectr. 2012, 137, 67–76. [Google Scholar] [CrossRef]
  49. Șerban, M.V.; Nazarie (Ignat), S.-R.; Dinescu, S.; Radu, I.-C.; Zaharia, C.; Istrătoiu, E.-A.; Tănasă, E.; Herman, H.; Gharbia, S.; Baltă, C.; et al. Silk ProteinsEnriched Nanocomposite Hydrogels Based on Modified MMT Clay and Poly(2-Hydroxyethyl Methacrylate-Co-2-Acrylamido-2-Methylpropane Sulfonic Acid) Display Favorable Properties for Soft Tissue Engineering. Nanomaterials 2022, 12, 503. [Google Scholar] [CrossRef]
  50. Abid, L.H.; Mussa, Z.H.; Al-Qaim, F.F.; Kamyab, H.; Al-Saedi, H.F.S.; Kadhim, N.J.; Deyab, I.F.; Imran, A.F.; Al-Asadi, S.T. Application of ZnCl2-Modified Biowaste to the Removal of Highly Polluted Dye: A Case Study of Investigating the Kinetics and Adsorption Isotherms. Energy Nexus 2025, 19, 100481. [Google Scholar] [CrossRef]
  51. Zeghoud, L.; Gouamid, M.; Ben Mya, O.; Rebiai, A.; Saidi, M. Adsorption of Methylene Blue Dye from Aqueous Solutions Using Two Different Parts of Palm Tree: Palm Frond Base and Palm Leaflets. Water Air Soil Pollut. 2019, 230, 195. [Google Scholar] [CrossRef]
  52. Hua, Z.; Pan, Y.; Hong, Q. Adsorption of Congo Red Dye in Water by Orange Peel Biochar Modified with CTAB. RSC Adv. 2023, 13, 12502–12508. [Google Scholar] [CrossRef] [PubMed]
  53. Bhattacharyya, R.; Ray, S.K. Removal of Congo Red and Methyl Violet from Water Using Nano Clay Filled Composite Hydrogels of Poly Acrylic Acid and Polyethylene Glycol. Chem. Eng. J. 2015, 260, 269–283. [Google Scholar] [CrossRef]
  54. Ozola-Davidane, R.; Burlakovs, J.; Tamm, T.; Zeltkalne, S.; Krauklis, A.E.; Klavins, M. Bentonite-Ionic Liquid Composites for Congo Red Removal from Aqueous Solutions. J. Mol. Liq. 2021, 337, 116373. [Google Scholar] [CrossRef]
  55. Hidayat, A.R.P.; Sulistiono, D.O.; Murwani, I.K.; Endrawati, B.F.; Fansuri, H.; Zulfa, L.L.; Ediati, R. Linear and Nonlinear Isotherm, Kinetic and Thermodynamic Behavior of Methyl Orange Adsorption Using Modulated Al2O3@UiO-66 via Acetic Acid. J. Environ. Chem. Eng. 2021, 9, 106675. [Google Scholar] [CrossRef]
  56. Foo, K.Y.; Hameed, B.H. Insights into the Modeling of Adsorption Isotherm Systems. Chem. Eng. J. 2010, 156, 2–10. [Google Scholar] [CrossRef]
  57. El-Khiyami, S.S.; Ali, H.; Ismail, A.M.; Hafez, R.S. Tunable Physical Properties and Dye Removal Application of Novel Chitosan Polyethylene Glycol and Polypyrrole/Carbon Black Films. Sci. Rep. 2025, 15, 20124. [Google Scholar] [CrossRef]
  58. Ahmad, M.F.; Hassan, S.; Imran, Z.; Mazhar, D.; Afzal, S.; Ullah, S.A. Green Approach to Water Purification: Investigating Methyl Orange Dye Adsorption Using Chitosan/Polyethylene Glycol Composite Membrane. J. Polym. Environ. 2024, 32, 194–212. [Google Scholar] [CrossRef]
  59. Rodríguez, A.; Ovejero, G.; Mestanza, M.; García, J. Removal of Dyes from Wastewaters by Adsorption on Sepiolite and Pansil. Ind. Eng. Chem. Res. 2010, 49, 3207–3216. [Google Scholar] [CrossRef]
  60. Farghali, A.A.; Bahgat, M.; El Rouby, W.M.A.; Khedr, M.H. Preparation, Decoration and Characterization of Graphene Sheets for Methyl Green Adsorption. J. Alloys Compd. 2013, 555, 193–200. [Google Scholar] [CrossRef]
  61. Radoor, S.; Karayil, J.; Jayakumar, A.; Lee, J.; Nandi, D.; Parameswaranpillai, J.; Pant, B.; Siengchin, S. Efficient Removal of Organic Dye from Aqueous Solution Using Hierarchical Zeolite-Based Biomembrane: Isotherm, Kinetics, Thermodynamics and Recycling Studies. Catalysts 2022, 12, 886. [Google Scholar] [CrossRef]
  62. Viscusi, G.; Lamberti, E.; Gorrasi, G. Design of Sodium Alginate/Soybean Extract Beads Loaded with Hemp Hurd and Halloysite as Novel and Sustainable Systems for Methylene Blue Adsorption. Polym. Eng. Sci. 2022, 62, 129–144. [Google Scholar] [CrossRef]
  63. Liu, T.; Li, Y.; Du, Q.; Sun, J.; Jiao, Y.; Yang, G.; Wang, Z.; Xia, Y.; Zhang, W.; Wang, K. Adsorption of Methylene Blue from Aqueous Solution by Graphene. Colloids Surf. B Biointerfaces 2012, 90, 197–203. [Google Scholar] [CrossRef]
  64. Kumar, V. Adsorption Kinetics and Isotherms for the Removal of Rhodamine B Dye and Pb+ 2 Ions from Aqueous Solutions by a Hybrid Ion-Exchanger. Arab. J. Chem. 2019, 12, 316–329. [Google Scholar]
  65. Viscusi, G.; Mottola, S.; Boumezough, Y.; Arris, S.; De Marco, I.; Gorrasi, G. A Novel Porous Adsorbentbased on Cactus Powder/Ionic Liquid for the Removal of Nimesulide from Wastewater. Chemosphere 2025, 376, 144293. [Google Scholar] [CrossRef]
  66. Chen, B.; Li, Y.; Du, Q.; Pi, X.; Wang, Y.; Sun, Y.; Wang, M.; Zhang, Y.; Chen, K.; Zhu, J. Effective Removal of Tetracycline from Water Using Copper Alginate @ Graphene Oxide with In-Situ Grown MOF-525 Composite: Synthesis, Characterization and Adsorption Mechanisms. Nanomaterials 2022, 12, 2897. [Google Scholar] [CrossRef] [PubMed]
  67. Joudi, M.; Nasserlah, H.; Hafdi, H.; Mouldar, J.; Hatimi, B.; Mhammedi, M.A.E.; Bakasse, M. Synthesis of an Efficient Hydroxyapatite–Chitosan–Montmorillonite Thin Film for the Adsorption of Anionic and Cationic Dyes: Adsorption Isotherm, Kinetic and Thermodynamic Study. SN Appl. Sci. 2020, 2, 1078. [Google Scholar] [CrossRef]
  68. Kypritidou, Z.; Argyraki, A. A Multi-Site Mechanism Model for Studying Pb and Cu Retention from Aqueous Solutions by Fe-Mg-Rich Clays. Clay Miner. 2018, 53, 175–192. [Google Scholar] [CrossRef]
  69. Aragaw, T.A.; Alene, A.N. A Comparative Study of Acidic, Basic, and Reactive Dyes Adsorption from Aqueous Solution onto Kaolin Adsorbent: Effect of Operating Parameters, Isotherms, Kinetics, and Thermodynamics. Emerg. Contam. 2022, 8, 59–74. [Google Scholar] [CrossRef]
  70. Karadag, D.; Turan, M.; Akgul, E.; Tok, S.; Faki, A. Adsorption Equilibrium and Kinetics of Reactive Black 5 and Reactive Red 239 in Aqueous Solution onto Surfactant-Modified Zeolite. J. Chem. Eng. Data 2007, 52, 1615–1620. [Google Scholar] [CrossRef]
  71. Lima, E.C.; Gomes, A.A.; Tran, H.N. Comparison of the Nonlinear and Linear Forms of the van’t Hoff Equation for Calculation of Adsorption Thermodynamic Parameters (∆S° and ∆H°). J. Mol. Liq. 2020, 311, 113315. [Google Scholar] [CrossRef]
  72. Li, R.; Chen, J.; Zhang, H.; Rehman, F.; Siddique, J.; Shahab, A.; Mo, Z.; Luo, L. Facile Synthesis of Magnetic-Activated Nanocomposites for Effective Removal of Cationic and Anionic Dyes in an Aqueous Environment: An Equilibrium Isotherm, Kinetics and Thermodynamic Studies. Chem. Eng. Res. Des. 2023, 189, 319–332. [Google Scholar] [CrossRef]
  73. Sevim, F.; Laçin, Ö.; Demir, F.; Erkiliç, Ö.F. Adsorption Capacity, Isotherm, Kinetics, and Thermodynamics Examinations on the Removal of a Textile Azo Dye by Local Natural Adsorbent. Glob. Chall. 2025, 9, 2500024. [Google Scholar] [CrossRef] [PubMed]
  74. Viscusi, G.; Lamberti, E.; Gorrasi, G. Hemp Fibers Modified with Graphite Oxide as Green and Efficient Solution for Water Remediation: Application to Methylene Blue. Chemosphere 2022, 288, 132614. [Google Scholar] [CrossRef] [PubMed]
Figure 1. Different steps involved in the treatment of clay and apparatus for clay modification.
Minerals 15 00935 g001
Figure 2. Schematic representation of the synthesis of PEG-modified montmorillonite (MMT) using HTAB intercalation followed by functionalization with PEG 200 or PEG 4000.
Minerals 15 00935 g002
Figure 3. Characterizations techniques of PEG200/MMT@HTAB and PEG4000/MMT@HTAB: (a) XRD patterns, (b) FTIR spectra, (c) zeta potential measurement and (d) TGA curves.
Minerals 15 00935 g003
Figure 4. SEM images of PEG200/MMT@HTAB and PEG4000/MMT@HTAB samples.
Minerals 15 00935 g004
Figure 5. The influence of adsorption duration on the adsorption capabilities of PEG200/MMT@HTAB and PEG4000/MMT@HTAB for (a,c) MB and (b,d) CR at varying dye concentrations (adsorbent dosage: 30 mg, solution volume: 50 mL, and temperature: 25 °C).
Minerals 15 00935 g005
Figure 6. Adsorption of MB and CR on (a) PEG200/MMT@HTAB and (b) PEG4000/MMT@HTAB at varying pH levels (adsorbent dosage: 30 mg, solution volume: 50 mL, dye concentration: 100 mg/L, temperature: 25 °C).
Minerals 15 00935 g006
Figure 7. Impact of adsorbent dosage on the adsorption of MB and CR for (a) PEG200/MMT@HTAB and (b) PEG4000/MMT@HTAB (solution volume: 50 mL, dye concentration: 100 mg/L, temperature: 25 °C).
Minerals 15 00935 g007
Figure 8. Pseudo-first-order kinetic model fitting for (a,b) MB and (c,d) CR adsorption onto PEG200/MMT@HTAB and PEG4000/MMT@HTAB at different dye concentrations.
Minerals 15 00935 g008
Figure 9. Pseudo-second-order models for (a,b) MB and (c,d) CR adsorption onto PEG200/MMT@HTAB and PEG4000/MMT@HTAB at different dye concentrations.
Minerals 15 00935 g009
Figure 10. Adsorption isotherm plots for MB and CR adsorption onto PEG200/MMT@HTAB and PEG4000/MMT@HTAB composites fitted with (a) Langmuir–Freundlich (Sips), (b) Redlich-Peterson, (c) Langmuir, and (d) Freundlich models.
Minerals 15 00935 g010
Figure 11. Nonlinear adsorption isotherm plots for MB and CR adsorption onto PEG200/MMT@HTAB and PEG4000/MMT@HTAB composites fitted the Dubinin-Radushkevich model.
Minerals 15 00935 g011
Figure 12. (a,b) The adsorption capacity of MB and CR on MMT@HTAB and MMT@HTAB@PEG as a function of temperature. (c,d) Thermodynamic plot of ln (Kd) against (1/T) for the removal of MB and CR using PEG200/MMT@HTAB and PEG4000/MMT@HTAB (adsorbent dosage: 30 mg, solution volume: 50 mL, and dye concentration: 100 mg/L).
Minerals 15 00935 g012
Table 1. Kinetic modeling parameters for pseudo-first-order and pseudo-second-order adsorption of MB and CR onto PEG200/MMT@HTAB composite at varying initial concentrations (20–100 mg/L).
AdsorbentDyeC0 (mg/L)Pseudo-First-Order ModelPseudo-Second-Order Model
Qe (exp) (mg/g)K1 (min−1)R2Qe (exp) (mg/g)K2 (g/mg·min−1)R2
PEG200/MMT@HTABMB2048.8690.9140.96150.9750.3620.922
4099.7400.9660.991103.5890.0190.969
60147.9211.4890.988151.9170.0250.993
80196.0341.7630.973201.3220.0220.986
100293.9851.8100.960248.3860.0160.984
CR2049.3943.6120.99849.6520.7650.998
4098.7960.5170.962104.5210.0080.965
60149.2220.6940.993156.5330.0090.978
80193.5050.7460.947203.7760.0060.988
100240.9320.7300.923253.6630.0050.976
Table 2. Kinetic modeling parameters for pseudo-first-order and pseudo-second-order adsorption of MB and CR onto PEG4000/MMT@HTAB composite at varying initial concentrations (20–100 mg/L).
AdsorbentDyeC0 (mg/L)Pseudo-First-Order ModelPseudo-Second-Order Model
Qe (exp) (mg/g)K1 (min−1)R2Qe (exp) (mg/g)K2 (g/mg·min−1)R2
PEG4000/MMT@HTABMB2049.8270.9460.96243.6150.0450.986
4077.9400.7160.97781.5990.0170.985
60113.5710.6470.933119.8500.0090.982
80169.0290.9740.963176.6740.0110.993
100207.2111.2570.971215.5910.0120.995
CR2048.3830.6360.97951.2410.0220.981
4098.0500.8720.976102.4080.0170.992
60146.9581.0110.989151.0170.0150.981
80190.0851.0790.989197.7550.0110.996
100236.4501.1630.996244.8800.0110.994
Table 3. Fitted parameters for Langmuir–Freundlich (Sips), Redlich–Peterson, Langmuir, and Freundlich isotherm models describing MB and CR adsorption onto PEG200/MMT@HTAB and PEG4000/MMT@HTAB composites.
AdsorbentsDyeLangmuir–Freundlich (Sips)Redlich–Peterson
Qm (mg/g)BnsR2RMSEABΒR2RMSE
PEG200/MMT@HTABMB483.240.0210.630.98513.955.290.00160.980.9983.89
CR504.610.0200.610.98212.385.680.00630.820.9975.67
PEG4000/MMT@HTABMB604.640.0120.650.98910.464.310.00490.880.98113.03
CR944.620.0080.900.9903.014.160.00080.920.9947.28
LangmuirFreundlich
Qm (mg/g)aL (L/g)R2RMSEnFKF(L/g)R2RMSE
PEG200/MMT@HTABMB11320.00550.99010.750.984.630.9991.16
CR981.30.00670.9989.120.994.790.9990.68
PEG4000/MMT@HTABMB833.80.00580.96817.220.872.110.9956.61
CR1039.40.00550.9984.151.126.870.9984.99
Table 4. Fitted parameters for the Dubinin–Radushkevich isotherm model describing MB and CR adsorption onto PEG200/MMT@HTAB and PEG4000/MMT@HTAB composites.
Adsorbents Dubinin-Radushkevich
DyeQm (mg/g)β (104 mol2·J−2)E (kJ·mol−1)R2RMSE
PEG200/MMT@HTABMB310.740.910.070.94326.23
CR304.051.010.070.94425.76
PEG4000/MMT@HTABMB286.761.510.060.91423.12
CR285.670.860.080.94426.10
Table 5. Thermodynamic parameters for MB and CR dyes adsorption onto PEG200/MMT@HTAB and PEG4000/MMT@HTAB.
AdsorbentsDyesΔH° (kJ/mol)ΔS° (J/mol·K)ΔG° (kJ/mol)
298 K308 K318 K
MMT@HTAB@PEG 4000CR−61.5−163.5−12.7−11.1−9.5
MB−70.5−181.1−16.6−14.8−12.9
MMT@HTAB@PEG 200CR−26.1−52.5−10.4−9.8−9.4
MB−33.9−64.2−14.8−14.2−13.5
Disclaimer/Publisher’s Note: The statements, opinions and data contained in all publications are solely those of the individual author(s) and contributor(s) and not of MDPI and/or the editor(s). MDPI and/or the editor(s) disclaim responsibility for any injury to people or property resulting from any ideas, methods, instructions or products referred to in the content.