Abstract
To address the issues of traditional linear inversion methods, such as their dependence on initial models and the high computational cost of Jacobian matrix calculations, this study conducts inversion research on vertical electrical sounding data based on the backpropagation (BP) neural network combined with the Particle Swarm Optimization (PSO) algorithm. First, two-layer and three-layer horizontally layered geoelectric models were constructed to generate the sample data required for neural network training. Secondly, the PSO-BP neural network model was employed to perform test inversions. The inversion results demonstrate that both neural network methods can successfully invert apparent resistivity data into corresponding geoelectric model parameters, thereby validating the correctness of the PSO-BP neural network inversion approach. Finally, the PSO-BP neural network method was applied to training and inversion of field-measured apparent resistivity data. A comparison between the inversion results of the PSO-BP neural network and those of the conventional BP neural network revealed that the PSO-BP neural network yields superior inversion results. This further confirms the reliability, effectiveness, and practical applicability of the proposed inversion method. The work presented in this study provides a novel approach and perspective for the inversion of vertical electrical sounding data.
1. Introduction
Resistivity method exploration is an important geophysical exploration method widely used in the fields of resources exploration, engineering investigation, environmental monitoring, etc. The essence of resistivity method inversion is to infer the physical structure of the subsurface medium by establishing a mapping relationship from the apparent resistivity data to the parameters of the geological model. The application of linearized inversion approaches to resistivity data introduces significant challenges, including pronounced dependence on initial model assumptions, inherent non-uniqueness of solutions, and substantial computational complexity. In contrast, nonlinear neural network-based algorithms and global optimization methods demonstrate strong adaptability in addressing these challenges [1,2,3,4,5]. Consequently, this study employs both neural networks and global optimization techniques to overcome the limitations inherent in linearized inversion approaches.
Many scholars have gradually introduced artificial neural networks into the field of geophysical data inversion, and artificial neural networks provide technical means for the inversion of complex geological problems by virtue of their unique nonlinear mapping capability and global optimization ability [6,7,8,9,10,11]. The Backpropagation (BP) neural network is a multilayer feedforward neural network architecture based on error backpropagation theory. This model computes the error between output results and ground truth values through forward propagation, then employs the chain rule of derivatives to iteratively adjust connection weights in reverse layer-by-layer propagation, ultimately establishing nonlinear mapping relationships between inputs and outputs. As a fundamental framework in deep learning systems, it holds critical importance for complex nonlinear modeling tasks including classification/prediction and function approximation. The Backpropagation (BP) neural network, as the basis of artificial neural network, has a strong nonlinear fitting ability, which can effectively describe the complex relationship between the electric method data and the parameters of the underground medium, and has been successfully applied in the inversion of multi-electrode resistivity method, resistivity tomography, transient electromagnetic method, resistivity method, and magnetotelluric sounding [12,13,14,15,16].
However, BP neural networks still have drawbacks such as being easy to fall into local minima and slow convergence. To address the shortcomings of BP neural networks, the particle swarm algorithm is utilized to dynamically adjust the weights and thresholds of BP neural networks [17,18]. Particle swarm algorithms have the advantages of fast convergence, few parameters, simple formulas, and strong global optimization-seeking ability. Based on its many advantages, the particle swarm algorithm is widely used in magnetotelluric sounding data inversion [19,20,21,22,23], transient electromagnetic method data inversion [24,25,26,27], resistivity method data inversion [28,29], and other electrical data inversion [30,31,32,33,34]. The particle swarm algorithm can effectively circumvent the local optimal solution by simulating the foraging behavior of bird flocks and using the group collaboration mechanism to achieve global search [35,36], and the combined PSO-BP neural network can better adapt to the non-homogeneous subterranean media model [37,38].
In order to verify the feasibility of nonlinear inversion of resistivity bathymetry based on a neural network, the particle swarm algorithm is used to optimize the BP neural network and then carry out the inversion of the apparent resistivity data. First, the two-layer and three-layer horizontally layered geologic theoretical models are constructed for numerical simulation. The apparent resistivity data corresponding to different model parameters are obtained by one-dimensional forward modeling to provide model data for the training of the PSO-BP neural network. After that, the apparent resistivity data were used as inputs to the BP neural network with the geoelectric model parameters as outputs. Finally, the PSO-BP neural network was used to invert the measured real data by the resistivity method to test the effectiveness of the particle swarm algorithm optimized PSO-BP neural network algorithm to invert the real data.
2. Principles of Artificial Neural Networks
2.1. BP Neural Network
Multiple neurons are connected in a certain way to form a neural network model, of which the most representative neural network model is the BP neural network, a multilayer feedforward neural network constructed based on error backpropagation theory. As a fundamental framework in deep learning, it plays a critical role in complex nonlinear modeling tasks such as classification prediction and function approximation.
The BP neural network adopts a classic three-layer architecture (input layer—hidden layer—output layer), where the hidden layer can be extended to single or multiple layers. Its topology facilitates cross-layer information transmission through fully connected weight matrices (Figure 1). During forward propagation, the network’s output is compared with the expected result. If the comparison meets the target accuracy, no weight/threshold adjustments are required. Otherwise, error backpropagation is triggered to modify weights and thresholds using the chain rule for derivative calculation. This process involves the following:
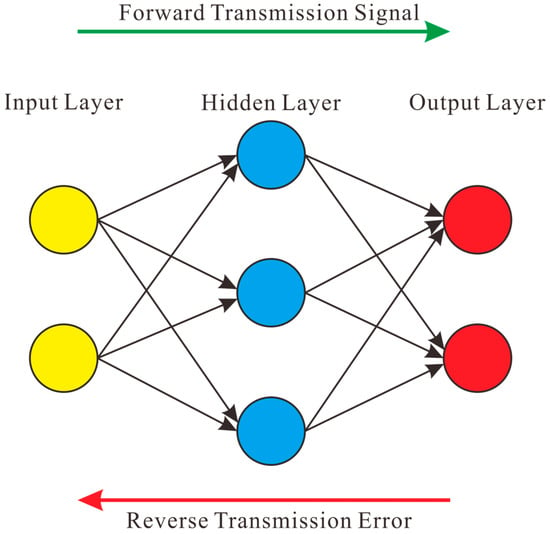
Figure 1.
Neural network architecture diagram.
- (1)
- Layer-by-layer backward adjustment of connection weights.
- (2)
- Parameter value updates.
- (3)
- Iterative forward propagation.
The cycle repeats until outputs match expected results within predefined tolerances.
BP neural networks are capable of learning and storing a large number of mapping relationships for nonlinear input–output patterns, and are therefore more relevant to the target in terms of inversion of electroprocessing data. In the stage of reverse correction weight of neural network errors, the Levenberg–Marquardt algorithm is adopted. This algorithm is a commonly used nonlinear least squares optimization algorithm. Based on gradient descent, a damping factor is introduced, which can adjust the learning rate of the parameters. When the damping factor is relatively small, the algorithm is more inclined to use the gradient descent method. When the damping factor is relatively large, the algorithm is more inclined to use the Newton method. When training BP neural networks, typical data often better reflect the approximation and generalization capabilities of the network model.
2.2. Particle Swarm Optimization Algorithm
The PSO algorithm exhibits significant advantages including rapid convergence, minimal parameter requirements, straightforward formulation, and strong global optimization capabilities. This algorithm, biologically inspired by avian foraging behavior, conceptually represents each potential solution to the optimization problem as a massless and volumeless “particle” within the search space. During iterative computation, each particle’s fitness value is determined by the objective function, which quantitatively evaluates the merit of the particle’s current position. During initialization, the algorithm generates randomized particle positions and velocities. In subsequent iterations, it identifies individual best positions () and the global best position (), then updates particle trajectories through vector operations combining these optima with inertia components.
The particle swarm optimization algorithm simulates avian flocking behavior through particles, where each particle possesses two fundamental attributes: velocity (representing movement speed) and position (indicating movement direction). In a D-dimensional space, a particle’s position is denoted as vector and its velocity as vector . The particle swarm optimization evaluates each particle’s current position via an objective function, while tracking both the historically best position () and current location. Within the swarm, particles dynamically adjust their positions by assimilating global swarm states. Each particle’s trajectory is influenced by both its individual historical experience and collective swarm intelligence, enabling rapid convergence to optimal solutions.
The particle swarm optimization algorithm features simple principles and relatively straightforward implementation. With strong global search capability, it rapidly converges to near-optimal solutions while avoiding local optima entrapment, making it particularly suitable for solving multi-dimensional optimization problems. The detailed motion trajectories of particles are illustrated in Figure 2 (In the diagram, the colored arrows denote the various factors influencing the particles’ behavior, and the black arrows illustrate the actual paths taken by the particles during their movement). The particle’s position is determined by three factors: its personal best (), the global best (), and its own inertial movement direction from the previous step. The velocity formula transforms relative positional deviations (offsets from optimal positions) into directional guidance, ultimately achieving oriented position updates through + .
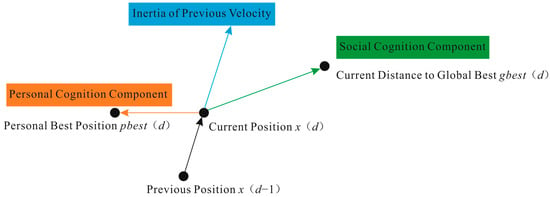
Figure 2.
Neural network architecture diagram.
3. Implementation of a Theoretical Model-Based Synthetic Data Inversion Algorithm Based on PSO-BP Neural Network
3.1. Basic Steps of PSO-BP Neural Networks
The integration of particle swarm optimization (PSO) with BP neural networks effectively overcomes the limitations of standalone BP networks. PSO optimizes the initial weights and thresholds to prevent training instability caused by random initialization, avoids local optima through its global search mechanism, and accelerates convergence while enhancing generalization capability. This PSO-BP hybrid approach demonstrates significant advantages for complex nonlinear problems, representing an effective optimization methodology. The procedural workflow is as follows:
- (1)
- Network Architecture Design
(a) Determine the number of input layer neurons based on the feature dimensions of the input data.
(b) Define the output layer neuron count according to the target variables.
Determining the number of hidden layers and neurons per layer currently lacks definitive theoretical guidance, typically requiring empirical formulas and trial-and-error approaches. Different network architectures may significantly impact model performance, where inappropriate selections could lead to either overfitting or underfitting.
In the formula, n, ni, and n0 are the number of nodes in the hidden, input, and output layers, respectively. The parameter a is a natural number derived from empirical studies, with a value range between 1 and 10.
- (2)
- Parameter Initialization: Initialized parameters include population size, update iterations, maximum velocity, minimum velocity, upper boundary, and lower boundary. Training parameters consist of training epochs, target error, and learning rate.
- (3)
- Calculate the fitness value for each particle to determine its personal best position () and the global best position ().
- (4)
- The algorithm proceeds to the next step when either the global optimal fitness value falls below the predefined network fault tolerance threshold or the maximum number of iterations is reached. Under these conditions, the current global optimum is adopted as the BP neural network’s optimal solution. If neither condition is met, the algorithm returns to Step 3.
- (5)
- Finalization: Update particle velocities and positions. Subsequently, the BP neural network performs apparent resistivity data inversion using the optimized parameters.
3.2. Inversion of Theoretical Model Synthesis Data Based on PSO-BP Neural Network
Prior to apparent resistivity inversion, proper training of the neural network with sample data is essential. This process determines the model’s capability to fit nonlinear relationships, generalize data processing, and perform in practical applications, serving as the critical factor for successful neural network-based inversion of apparent resistivity data. In this study, two-layer horizontally stratified geoelectrical models were designed to encompass all G-type ( < ) and D-type ( > ) two-layer media configurations, while three-layer models incorporated all H-type, A-type ( < < ), Q-type ( > > ), K-type ( < > ), and H-type ( > < ) three-layer media structures. Forward modeling was performed using Fortran programming to generate corresponding apparent resistivity data from these model parameters.
The PSO-BP neural network was trained using synthetic data, where the model parameters consisted of layer thicknesses and resistivities for each stratum. The theoretically modeled apparent resistivity data were treated as field-measured data and served as network inputs, while the corresponding geoelectric model parameters (layer thicknesses and resistivities) constituted the output. For a survey with m AB/2 spacings and an n-layer earth model, the total number of model parameters is 2n − 1 (n − 1 layer thicknesses plus n resistivities), with the neural network taking apparent resistivity values at different AB/2 spacings as input:
The 2n − 1 model parameters constituting the output vector:
The number of hidden layer nodes correlates with the count of input/output parameters, and its range can be determined based on empirical formulas:
where l represents the number of hidden layer nodes, m denotes the number of input layer nodes, n signifies the number of output layer nodes, and the parameter a is a natural number derived from empirical studies, with a value range between 1 and 10.
The following neural network training and inversion calculations are performed for the 2-layer and 3-layer horizontal laminar models.
3.2.1. Two-Layer Horizontally Stratified Geoelectrical Models
The study employed 21 electrode spacings (with minimum AB/2 = 1 m and maximum AB/2 = 1500 m) to design two-layer horizontally stratified models. The neural network architecture consisted of 21 input nodes (corresponding to apparent resistivity values at each spacing) and 3 output nodes (representing model parameters h1, ρ1, ρ2). The optimal number of hidden nodes was determined through extensive testing using empirical formulas.
Firstly, forward modeling was conducted for two-layer horizontally stratified models, initialized with a homogeneous earth model of resistivity ρ = 500 Ω·m. Parameter ranges were set as follows: h1 (10~100 m) for layer thickness, and ρ1, ρ2 (100~1000 Ω·m) for layer resistivities, with uniform sampling intervals. This generated 1000 distinct geoelectric models. Subsequently, the neural network was trained using the forward-modeled apparent resistivity values as inputs paired with their corresponding model parameters as target outputs. Prior to neural network training, all data must undergo normalization to scale values within the 0~1 range, facilitating effective optimization of the network’s output function during both training and testing phases. Subsequent parameter initialization includes configuring the transfer function, maximum training epochs, learning rate, weight/threshold initialization, and target performance metrics. The dataset is then partitioned, with 80% allocated for network training and the remaining 20% reserved for inversion performance evaluation.
The apparent resistivity values shown in Figure 3 were obtained through forward modeling calculations using the model parameters derived from PSO-BP neural network inversion of the apparent resistivity data [39]. These values were then compared with the theoretically synthesized apparent resistivity curves from the model to calculate the fitting error, followed by plotting the forward-modeled apparent resistivity fitting curves.
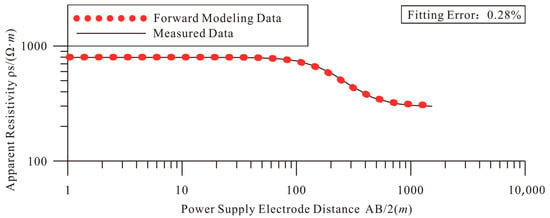
Figure 3.
Fitted curve of measured apparent resistivity and forward apparent resistivity of the two-layer horizontally layered geoelectric models. Model parameters: h1 = 100 m, ρ1 = 800 Ω·m, ρ2 = 300 Ω·m.
Among them, n represents the number of pole distances in the vertical electrical sounding data, a represents the measured apparent resistivity value, and b represents the forward apparent resistivity value.
As shown in Figure 3, the apparent resistivity curves exhibit excellent agreement between measured and modeled data. Quantitative analysis reveals a fitting error of merely 0.28% for the PSO-BP neural network, demonstrating the validity of the optimization approach. A systematic evaluation incorporating 3% noise data was conducted, with comparative analysis performed on the inversion results of ten distinct two-layer model test cases [40]. The corresponding model parameters are detailed in Table 1.

Table 1.
Comparative analysis of inversion results from 10 two-layer model test cases.
Analysis of the 10 datasets in Table 1 demonstrates that the inversion results obtained through the PSO-BP neural network closely approximate the geoelectrical model parameters of the theoretical synthetic models, with maximum and minimum errors of 1.63% and 0.18%, respectively. These findings confirm the validity of the PSO-BP neural network inversion method, warranting its subsequent application to three-layer horizontally stratified apparent resistivity data inversion.
3.2.2. Three-Layer Horizontally Stratified Geoelectrical Models
The construction of the three-layer horizontally stratified model follows a similar approach to the two-layer model, utilizing 21 electrode spacings (AB/2) for design. The neural network architecture consists of 21 input nodes (corresponding to apparent resistivity values at each spacing) and 5 output nodes (representing model parameters: h1, ρ1, h2, ρ2, ρ3), with the optimal number of hidden layer nodes determined through iterative testing. The resistivities (ρ1, ρ2, ρ3) were set within 100~1000 Ω·m and thicknesses (h1, h2) within 10~100 m, with each parameter sampled at 10 equally spaced intervals, generating 105 model combinations through permutation. Eighty percent of this dataset was used for network training, while the remaining twenty percent evaluated inversion performance, maintaining identical initialization parameters as the two-layer model case. For validation, one model configuration was forward-modeled to produce synthetic apparent resistivity data, enabling comparative plotting of measured versus modeled curves and subsequent calculation of their fitting error.
As shown in Figure 4, the apparent resistivity curves exhibit excellent agreement between measured and modeled data. Quantitative analysis reveals a fitting error of merely 1.05% for the PSO-BP neural network, demonstrating the validity of the optimization approach. A systematic evaluation incorporating 3% noise data was conducted, with comparative analysis performed on the inversion results of ten distinct two-layer model test cases [38]. The corresponding model parameters are detailed in Table 2.
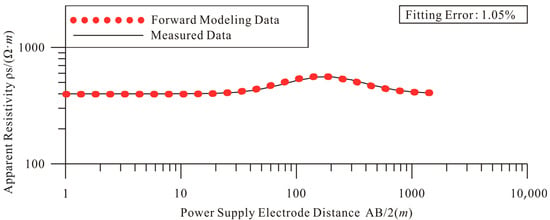
Figure 4.
Fitted curve of measured apparent resistivity and forward apparent resistivity of the three-layer horizontally layered geoelectric models. Model parameters: h1 = 40 m, ρ1 = 400 Ω·m, h2 = 70 m, ρ2 = 800 Ω·m, ρ3 = 400 Ω·m.

Table 2.
Comparative analysis of inversion results from 10 three-layer model test cases.
Analysis of the 10 datasets in Table 2 reveals close agreement between the PSO-BP neural network inversion results and the theoretical geoelectrical model parameters, with maximum and minimum errors of 3.87% and 1.57%, respectively. This performance demonstrates the viability of the PSO-BP neural network inversion methodology.
Moreover, through progressive training iterations, the model demonstrates notable robustness to moderate random noise, showing negligible degradation in predictive performance compared to noise-free conditions. Crucially, it maintains its superior anomaly detection capability for the initial data model architecture.
4. Inversion of Field-Measured Vertical Electrical Sounding Data Based on PSO-Optimized BP Neural Network
To further investigate the nonlinear inversion method’s performance on field data, the lead–zinc deposit in the Greater Khingan Mountains of Heilongjiang Province was selected as the study area.
4.1. Mining Area Documentation
The mining area is tectonically located within the E’erguna Massif of the eastern Sayan-Erguna fold system in the Xing’an-Mongolian geosynclinal fold region, corresponding to the southern margin of the ancient Siberian Plate. The mining area exposes strata from the Sinian-Cambrian Wolegen Group Jixianggou Formation (Z-Єj), Lower Cretaceous Guanghua Formation (K1gh), and Quaternary Holocene Series (Qh). Intrusive rocks in the area are predominantly Jinningian granites (), granodiorites (), Early Cretaceous granite porphyries (), fine-grained granites (), along with various dike rocks. The mining area exhibits wall-rock alteration dominated by limonitization, silicification, and pyritization, with subordinate carbonatization, epidotization, chloritization, and sericitization. These alterations primarily occur in dacitic tuff lavas, dacites, phyllites, secondary felsite porphyries, tuffaceous slate rocks, secondary basalts, and monzonite porphyries, with alteration intensity positively correlating with rock fracturing degree. All discovered magnetite and lead–zinc ore bodies are hosted within the contact zones between granitoid intrusions and marble.
4.2. Data Pre-Processing
Field data acquisition was conducted using vertical electrical sounding (VES), with one measured resistivity curve selected for analysis. The profile comprises 20 measurement stations spaced at 80 m intervals, spanning from −200 m to 1320 m. Each station includes 21 current electrode spacings (AB/2) configured at: 1 m, 1.5 m, 2 m, 3 m, 4.5 m, 7 m, 10 m, 15 m, 20 m, 30 m, 45 m, 70 m, 100 m, 150 m, 200 m, 300 m, 450 m, 700 m, 1000 m, 1250 m, and 1500 m. Based on the apparent resistivity data measured at 21 electrode spacings (AB/2), the corresponding field resistivity sounding curves were plotted. These curves were classified according to their characteristic types, and datasets were constructed for two- to six-layer geoelectrical models. The layer thickness range and resistivity range for each geoelectrical model were determined based on the variation characteristics of apparent resistivity with electrode spacing. The parameter variation step sizes were then defined according to these ranges. Finally, multiple geoelectrical models with different layer thicknesses and resistivities were established using these step sizes. Forward modeling was performed on these models, and the synthetic data generated served as training samples (training dataset).
4.3. Inversion of Field-Measured Vertical Electrical Sounding Data Based on PSO-BP Neural Network
First, the input layer was configured with 21 nodes (corresponding to the 21 electrode spacings), while the output layer node count (i.e., model parameter quantity) was set to 2n − 1 (where n represents the geoelectrical model layer number) to accommodate varying subsurface layer configurations. Second, key parameters were manually specified (Transfer function, Maximum training epochs, Learning rate, Initial weights and thresholds, Training objective settings). Subsequently, 80% of the classical model’s apparent resistivity data was allocated for BP neural network training, while the remaining 20% of synthetic data and field-measured apparent resistivity data were used for iterative inversion testing. Based on survey station locations, a comparative analysis was performed between measured and inverted apparent resistivity curves, with AB/2 spacing versus apparent resistivity (ρs) curves plotted for visualization.
After calculation, the maximum fitting difference of the measured apparent resistivity inversion of the PSO-BP neural network is 6.29%, and the minimum is 0.43%. Five groups of models with measurement points of 440 m, 520 m, 920 m, and 1000 m were selected to draw the apparent resistivity curves. The resulting plot is displayed in Figure 5.
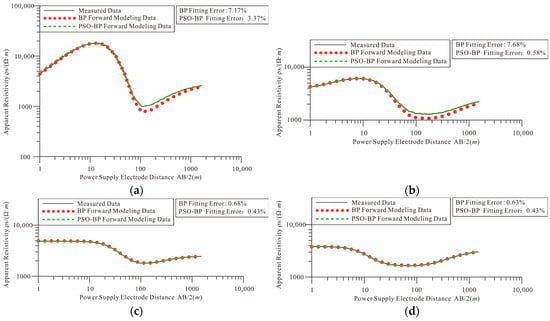
Figure 5.
Matching results between field-measured and forward-modeled apparent resistivity curves: (a) 440 measurement points; (b) 520 measurement points; (c) 920 measurement points; (d) 1000 measurement points.
Four measurement stations were selected for demonstration. At the 920 m and 1000 m stations, both neural network methods achieved excellent curve fitting, with inversion results closely matching the field-measured data. However, at the 440 m and 520 m stations, the BP neural network exhibited significant fitting errors of 7.17% and 7.68%, respectively, compared to the measured apparent resistivity curves. In contrast, the PSO-BP neural network demonstrated superior performance with substantially lower errors of 3.37% and 0.58% at these locations. Closer examination of the curve fitting reveals that the BP neural network exhibits poorer inversion performance near the 100 m electrode spacing (AB/2), whereas the PSO-BP network demonstrates superior alignment with the field curves, achieving more accurate inversion results overall. These results demonstrate that when confronted with complex geoelectrical structures, the BP neural network often suffers from inadequate training, leading to a higher probability of the inversion results converging to local optima. In contrast, the PSO-BP neural network’s optimization of weights and thresholds yields superior training performance compared to the conventional BP network, highlighting both the methodological advantage of this hybrid algorithm in handling complex inversion problems and the effectiveness of its optimization capability.
Subsequent drilling verification was conducted, with the acquired data used to construct a geological profile (Figure 6). This profile was then comparatively analyzed against the resistivity cross-section derived from PSO-BP inversion results.
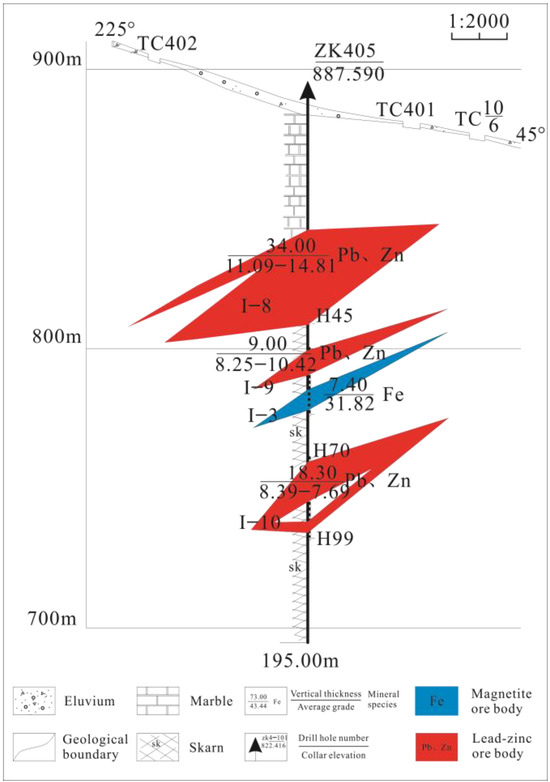
Figure 6.
Geological profile based on drilling information.
Figure 6 shows the geological profile near the 1160 m survey point, constructed based on drill hole ZK405 with a depth of 195 m. Here, the red zones represent lead–zinc ore bodies, while the blue zones indicate magnetite ore bodies. Drill hole verification yielded the following results: A combined lead–zinc and magnetite ore body with a thickness of 96 m was encountered between elevations 856 m and 760 m.
The apparent resistivity data from all measurement stations were integrated to generate two resistivity cross-sections: one derived from linearized inversion and another from PSO-BP neural network inversion (Figure 7).
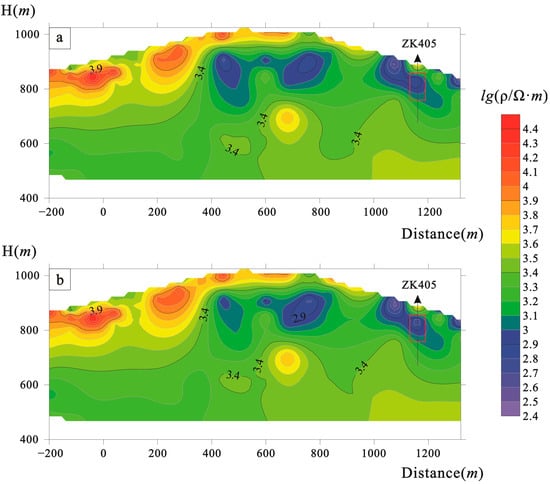
Figure 7.
Resistivity Cross-Section: (a) Linearized Inversion Resistivity Cross-Section; (b) PSO-BP Neural Network Inversion Resistivity Section. The red bounding box indicates the borehole verification results.
Figure 7 demonstrates that the orebody exhibits low-resistivity and high-polarization anomalies relative to the surrounding rock. The inversion results from traditional linear methods and neural network-based nonlinear approaches show close agreement. In Figure 7a,b, a high-resistivity cap layer (ρs > 3500 Ω·m) appears between −200 and 400 m depth points, while low-resistivity zones (ρs < 1000 Ω·m) are observed from 400 to 920 m and 1080 to 1240 m depth points. Drill hole ZK405 confirmed magnetite mineralization at the center of the low-resistivity anomaly.
Comparative analysis with the geological profile derived from actual borehole data (Figure 6) demonstrates strong consistency between field observations and the resistivity section obtained through PSO-BP inversion. While the geophysical anomaly area appears slightly larger due to methodological limitations, the spatial positioning remains accurate. The lead–zinc mineralization zone intercepted by drilling shows excellent alignment with the nonlinear inversion interpretation.
Further comparison with linear methods (least squares approach) reveals that the PSO-BP neural network achieves superior inversion resolution, with nonlinear inversion outperforming linearized methods. Both comparative analyses confirm the reliability and effectiveness of the PSO-BP neural network inversion methodology.
5. Conclusions
Focusing on the inversion of electrical resistivity surveying data and the nonlinear prediction methods of neural network intelligent algorithms, this paper first analyzed the research status of resistivity method data inversion and the application of BP neural network and particle swarm optimization algorithm in the field of electrical resistivity surveying. Then, a horizontally stratified numerical simulation was conducted on the Vertical Electrical Sounding data, and the BP neural network and PSO-BP neural network models were constructed to invert the simulated data. Finally, based on the experimental results obtained from numerical simulation, it is applied to the inversion of the measured data. The types of inversion layers of the measured data include layered model structures ranging from two to six layers. The inversion results of the neural network were compared with those of the linearized inversion to test the effectiveness of the two methods, namely, the BP neural network and the PSO-BP neural network.
The experimental results lead to the following principal conclusions:
- (1)
- Through training on horizontally stratified model parameters to obtain optimal weights, followed by inversion of untrained data, the results demonstrate that both BP and PSO-BP neural network inversion outcomes closely align with conventional linear method results. This confirms the feasibility of employing BP and PSO-BP neural networks for resistivity data inversion.
- (2)
- The Particle Swarm Optimization-enhanced BP neural network (PSO-BP) demonstrates superior global search capability and enhanced generalization performance when processing noisy datasets and mitigating overfitting. The optimized model exhibits enhanced adaptability to real-world complex environments. For instance, during the inversion of electrical resistivity survey data, the complex subsurface geoelectrical structures and wide dynamic range of apparent resistivity measurements present significant challenges. While conventional BP networks face increased susceptibility to local optima convergence, the PSO-BP hybrid algorithm’s effective weight-threshold optimization facilitates the identification of optimal geoelectric parameters, thereby achieving robust inversion of resistivity survey data.
Author Contributions
Conceptualization, Y.W. (Yingjie Wang), G.G. and Y.W. (Ye Wu); methodology, Y.W. (Yingjie Wang)., G.G. and Z.X.; software, Y.W. (Yingjie Wang).; validation, X.N., S.W., X.L. and L.C.; formal analysis, X.N., Z.X. and Y.W. (Ye Wu); investigation, Y.W. (Yingjie Wang), G.G. and S.W.; resources, Y.W. (Yingjie Wang), G.G. and Y.W. (Ye Wu); data curation, Y.W. (Yingjie Wang) and G.G.; writing—original draft preparation, Y.W. (Yingjie Wang) and G.G.; writing—review and editing, X.N., Z.X., S.W., X.L. and L.C.; visualization, Y.W. (Yingjie Wang), G.G. and Y.W. (Ye Wu); supervision, Z.X. and H.H.; project administration, Y.W. (Yingjie Wang), G.G. and Y.W. (Ye Wu); funding acquisition, Y.W. (Yingjie Wang) and G.G. All authors have read and agreed to the published version of the manuscript.
Funding
This study was supported by the Science and Technology Innovation Program for Postgraduate students in IDP subsidized by Fundamental Research Funds for the Central Universities (ZY20240302) and the Science Research Project of Hebei Education Department (ZC2022056).
Data Availability Statement
The dataset combining synthetic data from horizontally layered models and field-measured observations serves as a fundamental component of this vertical electrical sounding inversion study. However, as the research is currently in progress, the data materials are not yet available for sharing. Requests to access the datasets should be directed to 15230890958@163.com (Yingjie Wang).
Conflicts of Interest
Author Yingjie Wang was employed by the Tianjin Survey Design Institute Group Co., Ltd., Authors Shunji Wang and Xinglong Lin were employed by the No. 1 Bureau of China Metallurgical Geology Bureau, Xingguo Niu is an employee of Inner Mongolia Nonferrous Geology and Mining (Group) Geophysical Exploration Co., Ltd. The paper reflects the views of the scientists and not the company.
References
- Singh, U.K.; Tiwari, R.K.; Singh, S. One-dimensional inversion of geo-electrical resistivity sounding data using artificial neural networks—A case study. Comput. Geosci. 2005, 31, 99–108. [Google Scholar] [CrossRef]
- You, X.R.; Zhang, J.F.; Shi, Y. Artificial neural network-based transient electromagnetic imaging. Geophys. Geochem. Explor. 2023, 47, 1206–1214. [Google Scholar]
- Neyamadpour, A.; Taib, S.; Abdullah, W.W. Using artificial neural networks to invert 2D DC resistivity imaging data for high resistivity contrast regions: A MATLAB application. Comput. Geosci. 2009, 35, 2268–2274. [Google Scholar] [CrossRef]
- Sen, M.K.; Stoffa, P.L. Global Optimization Methods in Geophysical Inversion, 2nd ed.; Cambridge University Press: Cambridge, UK, 2013. [Google Scholar]
- Ferreira, N.R.; Porsani, M.J.; Oliveira, S.P. A hybrid genetic-linear algorithm for 2D inversion of sets of vertical electrical sounding. Rev. Bras. Geofísica 2003, 21, 235–248. [Google Scholar] [CrossRef]
- Song, P.; Xu, T. Inversion of Oblique Sounding for Ionospheric Parameters Based on Genetic Algorithm. Mod. Electron. Tech. 2008, 19, 16–18. [Google Scholar]
- Zhu, K.-G. PC-based artificial neural network inversion for airborne time-domain electromagnetic data. Appl. Geophys. 2012, 9, 1–8. [Google Scholar] [CrossRef]
- Noh, K.; Yoon, D.; Byun, J. Imaging subsurface resistivity structure from airborne electromagnetic induction data using deep neural network. Explor. Geophys. 2020, 51, 214–220. [Google Scholar] [CrossRef]
- Zuo, C.; Zhang, X.; Zhao, G.; Yan, L. PCR: A Parallel Convolution Residual Network for Traffic Flow Prediction. IEEE Trans. Emerg. Top. Comput. Intell. 2025, 9, 3072–3083. [Google Scholar] [CrossRef]
- Liu, K.; Jiao, S.; Nie, G.; Ma, H.; Gao, B.; Sun, C.; Wu, G. On image transformation for partial discharge source identification in vehicle cable terminals of high-speed trains. High Volt. 2024, 9, 1090–1100. [Google Scholar] [CrossRef]
- Chunduru, R.K.; Sen, M.K.; Stoffa, P.L.; Nagendra, R. Non-linear inversion of resistivity profiling data for some regular geometrical bodies. Geophys. Prospect. 1995, 43, 979–1003. [Google Scholar] [CrossRef]
- Singh, U.; Tiwari, R.; Singh, S. Inversion of 2-D DC resistivity data using rapid optimization and minimal complexity neural network. Nonlinear Process. Geophys. 2010, 17, 65–76. [Google Scholar] [CrossRef]
- Zhang, L.Y.; Liu, H.F. The application of ABP method in high-density resistivity method inversion. Chin. J. Geophys. 2011, 54, 227–233. [Google Scholar]
- Liu, X.H.; Liu, S.X.; Hu, M.Q.; Sun, Z.Q.; Wang, Q. Research on inversion of high-density resistivity method based on OMAGA-BP algorithm. Geophys. Geochem. Explor. 2023, 47, 1519–1527. [Google Scholar]
- Gao, M.L.; Yu, S.L.; Zheng, J.B.; Xu, C.; Liu, W.Y. Research of resistivity imaging using neural network based on immune genetic algorithm. Chin. J. Geophys. 2016, 59, 4372–4382. [Google Scholar]
- Li, R.; Zhang, H.; Zhuang, Q.; Li, R.; Chen, Y. BP neural network and improved differential evolution for transient electromagnetic inversion. Comput. Geosci. 2020, 137, 104434. [Google Scholar] [CrossRef]
- Wang, H.; Jiang, H.; Wang, L.; Xi, Z.Z.; Zhang, D.J. Magnetotelluric inversion using artificial neural network. J. Cent. South Univ. (Sci. Technol.) 2015, 46, 1707–1714. [Google Scholar]
- Jiang, T.; Zhang, Y.F.; Wang, Y.H. A Study of Application of An Improved PSO Algorithm in BP Network. Comput. Sci. 2006, 9, 164–165+290. [Google Scholar]
- Liu, Y.J.; Yang, X.Q.; Fu, N.; Wang, Y. Method of Particle Swarm Optimization Neural Network on Geological Hazards Comprehensive Evaluation and its Application. J. Seismol. Res. 2012, 35, 571–577+598. [Google Scholar]
- Godio, A.; Santilano, A. On the optimization of electromagnetic geophysical data: Application of the PSO algorithm. J. Appl. Geophys. 2018, 148, 163–174. [Google Scholar] [CrossRef]
- Pace, F.; Santilano, A.; Godio, A. Particle swarm optimization of 2D magnetotelluric data. Geophysics 2019, 84, E125–E141. [Google Scholar] [CrossRef]
- Cui, Y.-A.; Zhang, L.; Zhu, X.; Liu, J.; Guo, Z. Inversion for magnetotelluric data using the particle swarm optimization and regularized least squares. J. Appl. Geophys. 2020, 181, 104156. [Google Scholar] [CrossRef]
- Santilano, A.; Godio, A.; Manzella, A. Particle swarm optimization for simultaneous analysis of magnetotelluric and time-domain electromagnetic data. Geophysics 2018, 83, E151–E159. [Google Scholar] [CrossRef]
- Han, R.T.; Wang, S.M.; Huang, L.S.; Ye, Y.X. A Modified Particle Swarm Algorithm with Crossover Operator and Its Application in Magnetotellutic Data Inversion. Chin. J. Eng. Geophys. 2009, 6, 223–228. [Google Scholar]
- Dong, Y. Joint inversion and application of DC and full-domain TEM with particle swarm optimization. Pure Appl. Geophys. 2022, 179, 371–383. [Google Scholar] [CrossRef]
- Xu, Z.; Fu, Z.; Zhang, J. Research and application of the transient electromagnetic method inversion technique based on particle swarm optimization algorithm. IEEE Access 2020, 8, 198307–198316. [Google Scholar] [CrossRef]
- Cheng, J.L.; Li, M.X.; Li, X.Y.; Sun, X.Y.; Chen, D. Study on particle swarm optimization inversion of mine transient electromagnetic method in whole-space. Chin. J. Geophys. 2014, 57, 3478–3484. [Google Scholar]
- Oyeyemi, K.D.; Aizebeokhai, A.P.; Ukabam, C.S.; Kayode, O.T.; Olaojo, A.A.; Metwaly, M. Nonlinear inversion of electrical resistivity sounding data for multi-layered 1-D earth model using global particle swarm optimization (GPSO). Heliyon 2023, 9, e16528. [Google Scholar] [CrossRef] [PubMed]
- Pace, F.; Godio, A.; Santilano, A.; Comina, C. Joint optimization of geophysical data using multi-objective swarm intelligence. Geophys. J. Int. 2019, 218, 1502–1521. [Google Scholar] [CrossRef]
- Zhang, Q.; Wang, L.; Jiang, F.B. 2-D Improved particle swarm optimization algorithm for electrical resistance tomography inversion. Geophys. Geochem. Explor. 2015, 39, 1047–1052. [Google Scholar]
- Dai, Q.W.; Zhang, H.; Zhang, B. Combined inversion of resistivity sounding and GPR to eliminate equivalent phenomena based on multiple group particle swarm optimization algorithm. Comput. Tech. Geophys. Geochem. Explor. 2019, 41, 761–767. [Google Scholar]
- Cui, Y.A.; Liu, X.; Guo, Y.J.; Xiao, J.P.; Liu, C.M. Research progress of resistivity method in nonferrous metal mineral exploration. Res. Prog. Resist. Method Nonferrous Met. Miner. Explor. 2023, 33, 223–239. [Google Scholar]
- Cui, Y.A.; Chen, Z.; Zhu, X.; Liu, H.; Liu, J. Sequential and simultaneous joint inversion of resistivity and IP sounding data using particle swarm optimization. J. Earth Sci. 2017, 28, 709–718. [Google Scholar] [CrossRef]
- Pace, F.; Raftogianni, A.; Godio, A. A comparative analysis of three computational-intelligence metaheuristic methods for the optimization of TDEM data. Pure Appl. Geophys. 2022, 179, 3727–3749. [Google Scholar] [CrossRef]
- Xu, F.Q.; Qian, Y.; Liu, X.G. GA-BP Neural Network of the Nonlinear Function Approximating. Sci. Technol. Innov. 2012, 28, 148–149+145. [Google Scholar]
- Li, R.; Zhang, H.; Yu, N.; Li, R.; Zhuang, Q. A fast approximation for 1-D inversion of transient electromagnetic data by using a back propagation neural network and improved particle swarm optimization. Nonlinear Process. Geophys. 2019, 26, 445–456. [Google Scholar] [CrossRef]
- Wang, H.; Liu, X.Y. Back-propagation neural network training based on particle swarm optimization with best influential partical. Comput. Eng. Appl. 2007, 18, 69–71+86. [Google Scholar]
- Huang, X.; Guo, L.H.; Li, J.; Yu, Y. Target threat assessment based on BP neural network optimized by modified particle swarm optimization. J. Jilin Univ. (Eng. Technol. Ed.) 2017, 47, 996–1002. [Google Scholar]
- Ruan, B.Y. 1-D Optimization Inversion Method for Resistivity and IP Sounding Data. J. Guilin Univ. Technol. 1999, 4, 321–325. [Google Scholar]
- Shaw, R.; Srivastava, S. Particle swarm optimization: A new tool to invert geophysical data. Geophysics 2007, 72, F75–F83. [Google Scholar] [CrossRef]
Disclaimer/Publisher’s Note: The statements, opinions and data contained in all publications are solely those of the individual author(s) and contributor(s) and not of MDPI and/or the editor(s). MDPI and/or the editor(s) disclaim responsibility for any injury to people or property resulting from any ideas, methods, instructions or products referred to in the content. |
© 2025 by the authors. Licensee MDPI, Basel, Switzerland. This article is an open access article distributed under the terms and conditions of the Creative Commons Attribution (CC BY) license (https://creativecommons.org/licenses/by/4.0/).