Article

Rare Earth Element Concentrations as a Novel Proxy for Lateral Continuity: An Initial Case Study in the Cretaceous Lance Formation of Wyoming

1
Harold Hamm School of Geology and Geological Engineering, University of North Dakota, Grand Forks, ND 58202, USA
2
Department of Biology, Southern Adventist University, Collegedale, TN 37315, USA
3
Department of Biological Sciences, Southwestern Adventist University, Keene, TX 76059, USA
4
Department of Geology, University of Maryland, College Park, MD 20742, USA
*
Author to whom correspondence should be addressed.
Minerals 2025, 15(9), 919; https://doi.org/10.3390/min15090919
Submission received: 29 June 2025 / Revised: 17 August 2025 / Accepted: 27 August 2025 / Published: 29 August 2025
(This article belongs to the Special Issue Mineralogy and Geochemistry of Fossils)

Abstract

Identifying stratigraphic continuity across outcrops can sometimes be difficult, especially if they are dominated by discontinuous strata. Therefore, stratigraphers continue to seek new proxies for testing stratigraphic continuity, including fossiliferous horizons. We present a case study examining the potential of fossil bone trace element signatures as a novel proxy for lateral continuity. Specifically, we performed trace element analyses of Edmontosaurus bones from the Neufeld Quarry at Hanson Ranch (HR) in Wyoming, a stratigraphically verified lateral equivalent of the famous HR Bonebed exposed nearby in five “Main Quarries”, to evaluate if these chemical data would independently lead a researcher to the same conclusion of lateral equivalency. Bones from the “Main Quarries” and Neufeld were found to exhibit similar patterns of trace element alteration, including comparable magnitudes of enrichment, spatial patterns of rare earth element uptake, and proportions of specimens exhibiting various styles of diagenetic alteration. Many bones from both sites also exhibit redox signatures indicative of trace element uptake under reducing conditions. These numerous similarities in geochemical alteration patterns independently indicate that the fossil horizon at Neufeld is a lateral continuation of the nearby HR Bonebed. Our findings thus demonstrate the power of trace elements toward identifying laterally equivalent fossil assemblages.

1. Introduction

Trace elements, such as uranium (U), yttrium (Y), and the rare earth elements (REEs), are ubiquitously adsorbed by bone hydroxyapatite from surface and groundwaters during fossilization [1,2]. This uptake occurs through processes such as surface adsorption, cationic exchange into the crystal lattice, and incorporation into authigenic phosphate precipitated during the recrystallization of hydroxyapatite crystallites into larger and more stable fluorapatite crystals [1,3,4]. Because these elements are negligibly present in bone minerals during life, trace element signatures in a fossil bone provide diagnostic records of the geochemical and hydrodynamic conditions it was exposed to during diagenesis [2,5]. Further, since the proportions of trace elements adsorbed depend largely on pore fluid chemistry [1,2,6], the spatial distributions and concentrations of trace elements in a fossil bone can be used to infer myriad aspects of not only vertebrate taphonomy and diagenesis but also the geochemical character of paleoenvironments and diagenetic regimes over geologic time. To date, taphonomists and geochemists have applied this great utility of trace element signatures in fossil bones to the following:
(1)
Elucidating the chemical nature of paleoenvironments of burial, including the redox state (e.g., [7,8]), paleoclimatic aspects (e.g., seasonality, temperature [9,10,11]), and the general depositional setting, such as upland vs. lowland (e.g., [1]));
(2)
Characterizing the geochemical nature of diagenetic regimes (i.e., redox, pH) over time and space (e.g., [12,13]);
(3)
Estimating the number and relative timing of interactions a bone had with groundwaters postmortem (e.g., [12,13,14,15,16]);
(4)
Identifying reworked bones in a mixed fossil assemblage (e.g., [17,18]);
(5)
Inferring the mode of formation of a vertebrate fossil assemblage (i.e., mass death vs. attritional accumulation) independent of traditional taphonomic observations [18];
(6)
Determining the probable stratigraphic provenance of displaced fossils [19,20,21,22];
(7)
Identifying the least altered bones from a site and the least altered areas within a fossil bone for paleomolecular assays, physiologic inferences, radiometric dating, or study of paleoenvironmental and paleoclimatic proxies [5,23,24,25,26].
Herein, we assessed another potential utility of trace element signatures in fossil bones: as a proxy for the lateral continuity of a vertebrate fossil assemblage and its host facies. The principle of lateral continuity, one of Nicolas Steno’s founding principles of geology, states that sediments are originally deposited in horizontally continuous layers that extend in all directions until they either taper out or deposition is impeded by a physical barrier [27]. Hypothetically, if a vast bonebed assemblage is buried by a single depositional event in an effectively uniform environmental setting, such as on a fluvial floodplain or in a single, broad fluvial channel, then the bones within it are likely to be exposed to similar pore fluids and diagenetic conditions through early diagenesis. As a result, bones throughout the assemblage would then acquire generally uniform trace element signatures reflective of their shared diagenetic history. If, after protracted burial, the fossils have avoided severe late-diagenetic trace element uptake (i.e., overprinting sensu [28]) and the fossil bonebed horizon is dissected by erosion, then the trace element chemistry of bones within the now-separated fossiliferous localities could be used as a means of verifying lateral continuity (stratigraphic equivalency) of each “apparently separate” bonebed assemblage with one another (Figure 1A). Stratigraphic correlation of the host stratum and its overlying and underlying strata based on their lithologies can often be used as a means of drawing this inference, but trace element chemistry could provide a useful, independent tool for testing cases of hypothesized lateral continuity. Such a tool would be especially valuable at outcrops where underlying and overlying strata are discontinuous (i.e., lenticular) across the scale of the modern, eroded landscape. In such a scenario, the geometries of individual rock layers could make stratigraphic correlation by traditional means challenging, but trace element chemistry would still be able to provide compelling evidence for or against lateral continuity (Figure 1B).
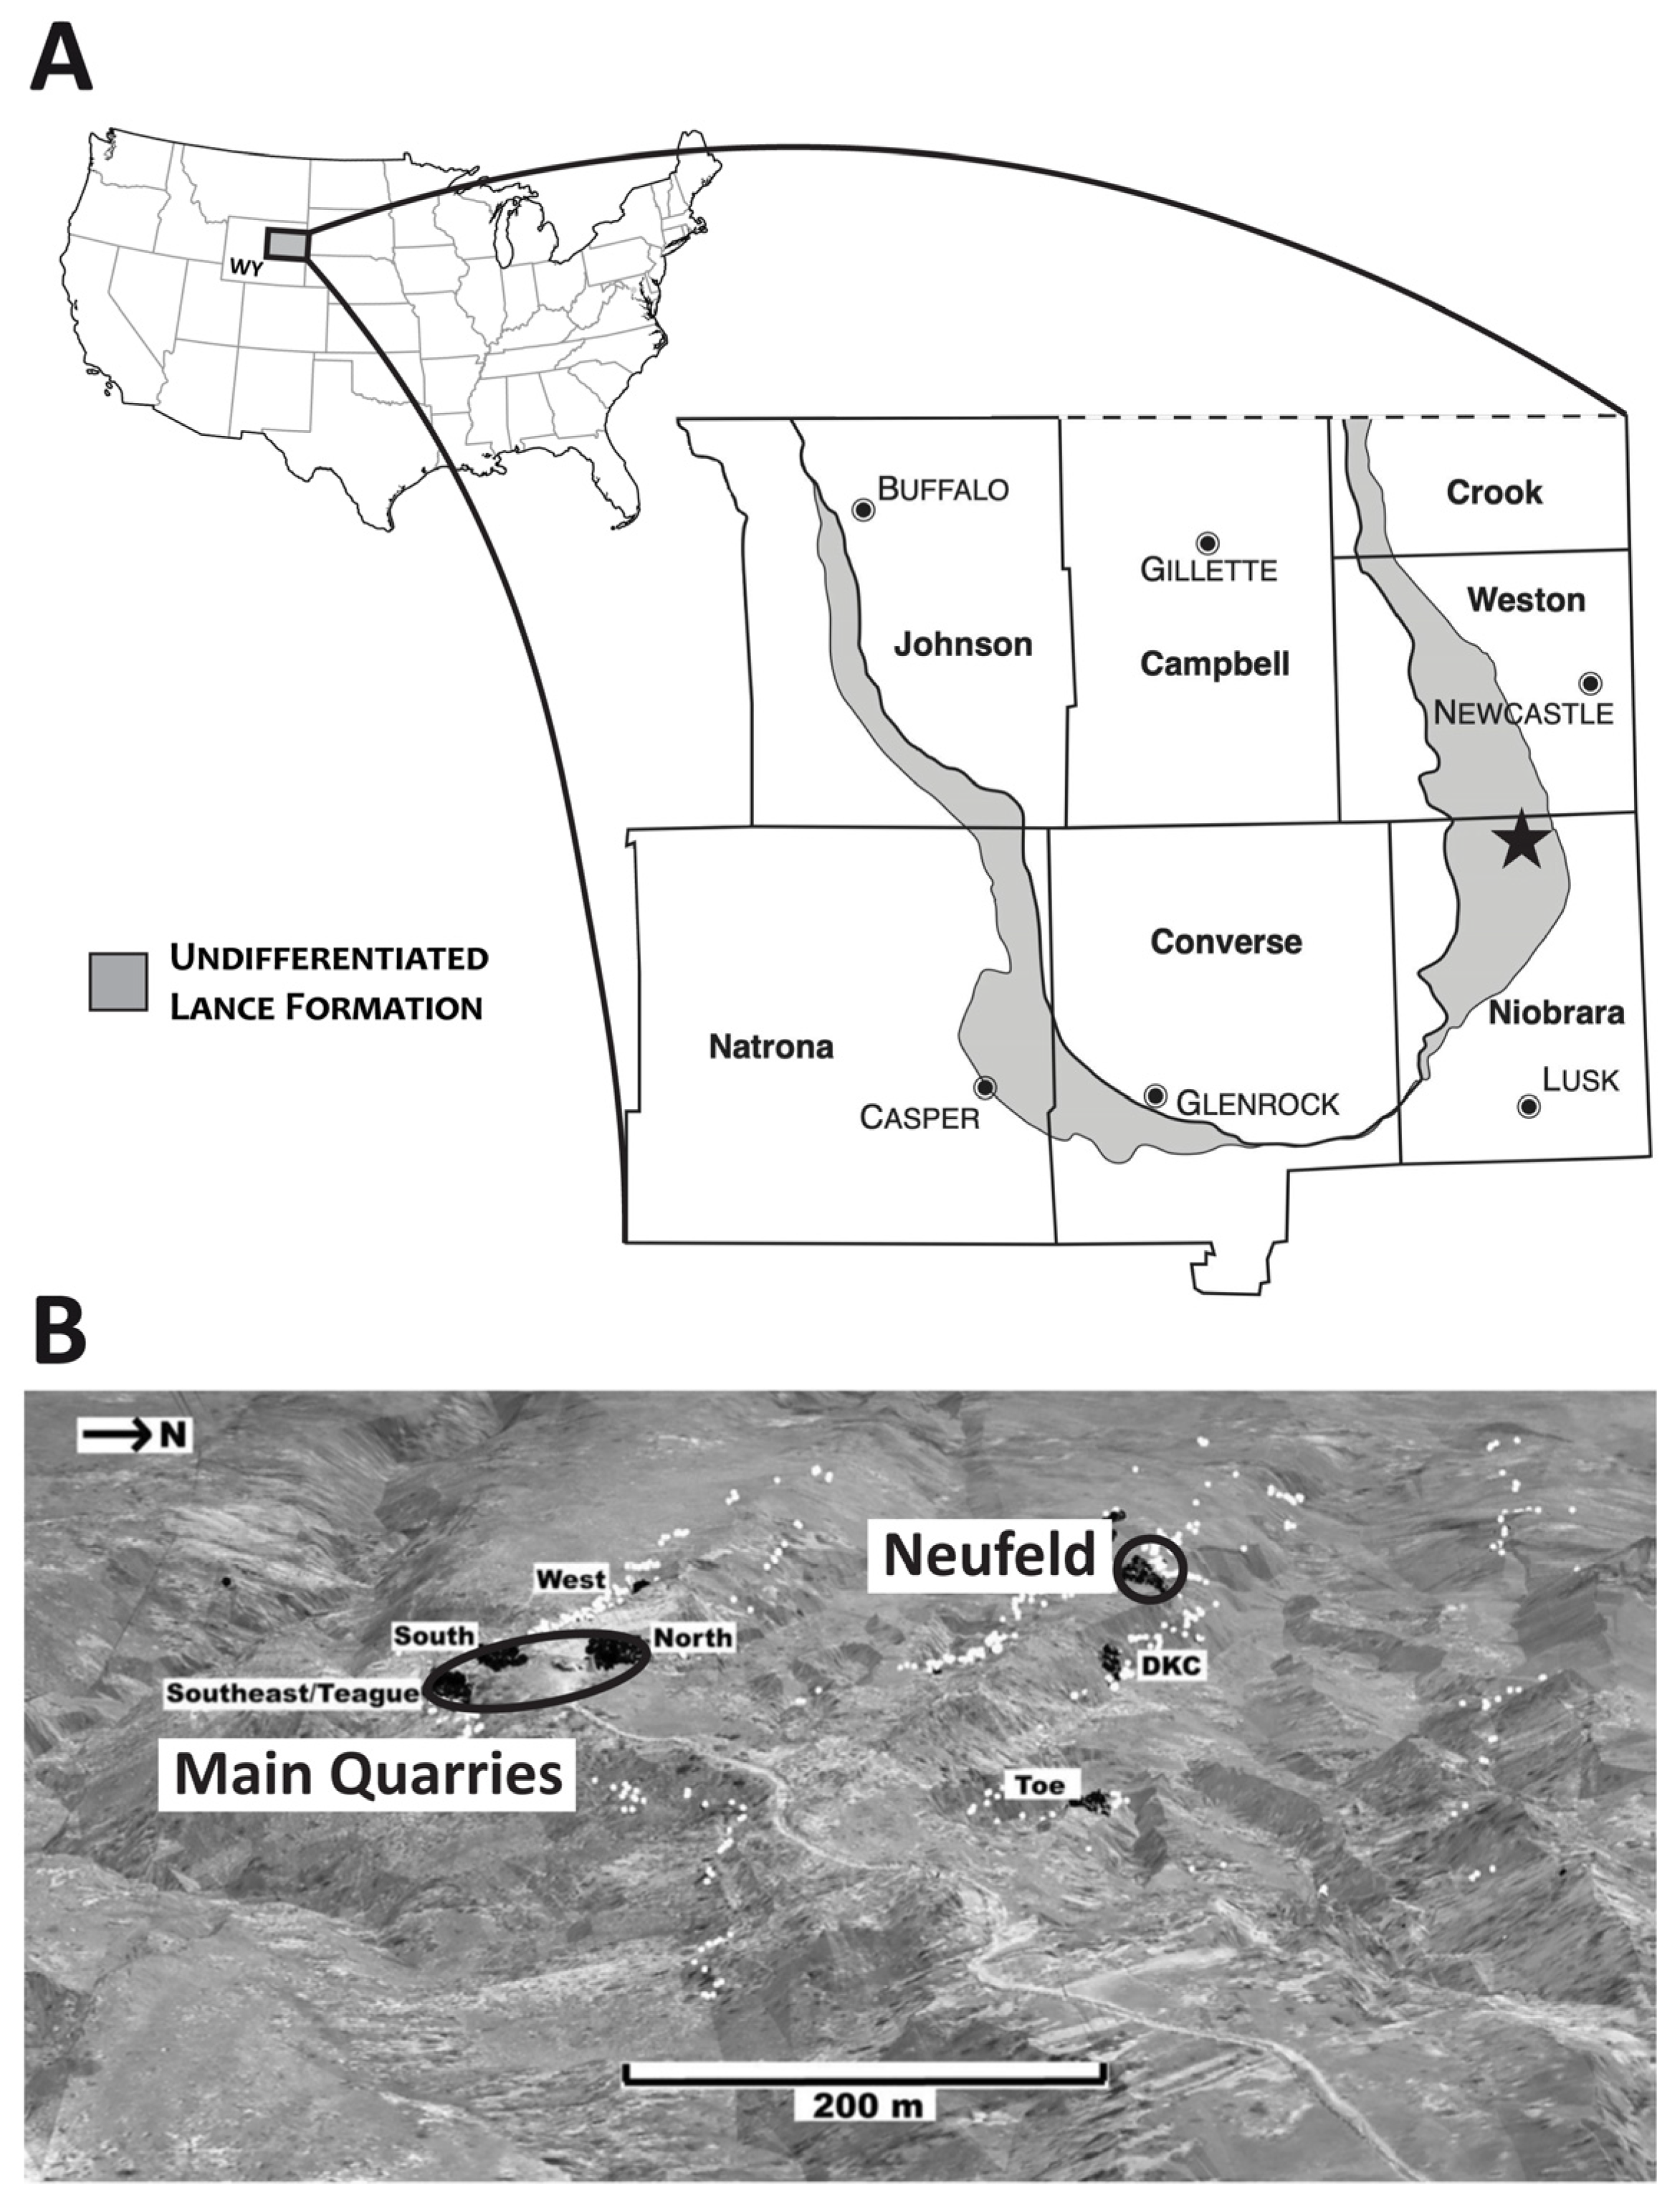
As an initial test of this potential utility of trace elements, we herein describe the results of a case study. Specifically, we conducted trace element analyses of fossil bones collected from a locality named Neufeld, which is adjacent to the well-known and vast Hanson Ranch (HR) Bonebed of Edmontosaurus annectens in the Cretaceous Lance Formation [29]. Neufeld and five “Main Quarries” within the HR Bonebed—North, South, Southeast, Teague, and West—are exposed in adjacent ridgelines in the badlands of the Powder River Basin (Figure 2; [29]). The fossil assemblages at all of these sites are dominated (>92%) by skeletal elements of the common Maastrichtian saurolophine hadrosaurid Edmontosaurus annectens, with less common remains pertaining to theropod dinosaurs (shed teeth of tyrannosaurids and dromaeosaurids), Triceratops, turtles, crocodilians (Brachychampsa and Leidyosuchus), fish (Lepisosteus), birds, and a few other ornithischian dinosaurs well known from the Hell Creek and Lance formations (e.g., Pachycephalosaurus, Thescelosaurus) ([29] and pers. observations by A.C. and K.S.). Based on the close proximity of the Neufeld Quarry to the five “Main Quarries” (Neufeld is ~250 m north of the “Main Quarries”; Figure 2), as well as observation of similar faunal representation and taphonomic modifications to the bones at each site, two of us (K.S. and A.C.) previously hypothesized that the bone-bearing horizon at Neufeld is a lateral continuation of the same bonebed exposed in the five “Main Quarries” [29]. As we will show, our trace element data support this conclusion independent of recent stratigraphic correlation (to be published in an upcoming comprehensive stratigraphic study of the Hanson Ranch field area) and traditional taphonomic assessments [29], thereby demonstrating the utility of trace element geochemistry as a new tool for the evaluation of potential cases of lateral continuity of vertebrate fossil assemblages.

2. Materials and Methods

Seven bones in the Hanson Research Station (HRS) Collection at Southwestern Adventist University that were collected from the Neufeld Quarry were selected for sampling, trace element analyses, and comparison to our prior trace element findings from 12 fossil specimens from the HR Bonebed “Main Quarries” [30]. Due to the rarity of fossil specimens from taxa other than Edmontosaurus in the Neufeld assemblage, only fossils of E. annectens were available for this study. These included, specifically, left dorsal rib HRS 20154, left dorsal rib HRS 20170, right dorsal rib HRS 20212, left radius HRS 20226, right ulna HRS 20284, right humerus HRS 20385, and right pubis HRS 28397. All fossil bones chosen for sampling exhibit excellent morphological preservation, with minimal signs of postmortem damage or alteration (i.e., subaerial weathering, abrasion, or compaction/crushing). For simplicity, hereafter the specimens will simply be referred to by their skeletal element type and HRS specimen number (i.e., rib HRS 20154). Inclusion of both limb bones and axial skeletal elements (ribs) of E. annectens allowed us to examine any trace element alteration trends potentially relating to histologic microstructure within this predominant taxon in the Neufeld assemblage, as the seven specimens exhibit a wide range in both cortical density and thickness.
A sterile chisel and hammer were used to gently excise a fragment comprising the entire thickness of the cortex from each prepared fossil. Thick sections were prepared by embedding each excised fossil bone sample in Silmar 41TM resin (US Composites, West Palm Beach, FL, USA). Due to the range in size of examined skeletal elements, some of the embedded samples span the entire diameter of the bone (e.g., ribs HRS 20154 and 20212), while others (e.g., humerus HRS 20385 and ulna HRS 20284) only span the radial thickness of one wall of the cortex (from the cortical margin through to the medullary cavity). The embedded samples were then sectioned to a thickness of ~3 mm using a Hillquist SF-8 trim saw (Hillquist, Inc., Arvada, CO, USA) and left to dry. Thick sections were then polished using 600-grit silicon carbide powder (AGSCO Corporation, Chicago, IL, USA) to create a smooth surface for laser ablation.
Laser ablation–inductively coupled plasma mass spectrometry (LA-ICPMS) was then used to acquire minor and trace element concentrations. Analyses were conducted using a New Wave UP-213 (213 nm wavelength) Nd:YAG laser ablation system (New Wave Research Inc., Fremont, CA, USA) coupled with a Finnegan Element2 ICPMS in the Plasma Lab at the University of Maryland. Signal intensities were measured for the following isotopes: 45Sc, 55Mn, 57Fe, 88Sr, 89Y, 137Ba, 139La, 140Ce, 141Pr, 143Nd, 147Sm, 153Eu, 157Gd, 159Tb, 163Dy, 165Ho, 167Er, 169Tm, 173Yb, 175Lu, 232Th, and 238U. All listed isotopes were measured in parts per million (ppm), with the exception of manganese and iron, which were measured in weight percent (wt.%) due to their high signal intensities. The laser was operated using a circular spot size of 30 μm, an energy density of 2−3 J/cm2, and a repetition rate of 10 Hz during the analyses, which moved along chosen transects at 50 μm/s. Individual transects ranged from ~5 to 26 mm in length.
Background correction was performed by subtracting average laser-off baseline signal intensities recorded during the initial 20 s of acquisition from sample signal intensities. External calibration was based on measured concentrations in NIST 610 standard reference glass, while internal calibration was performed using 43Ca for the quantification of fossil elemental concentrations (via normalization to 55.8% CaO in bone apatite). Reproducibility, which was taken as the percent relative standard deviation for REEs in the NIST 610 glass, averaged 2% and remained below 4% in all runs for each element except for Eu in two runs. To facilitate comparisons with previous studies of trace elements in fossil bones, measured concentrations were normalized against concentrations of the North American Shale Composite (NASC) derived from [31] and from [32] for praseodymium (Pr), holmium (Ho), and thulium (Tm).
NASC-normalized REE ratios (hereafter denoted with a subscript N) were used to calculate (Ce/Ce*)N, (Ce/Ce**)N, and (La/La*)N anomalies following the equations of [6]: (Ce/Ce*)N = CeN/(0.5LaN + 0.5PrN), (Ce/Ce**)N = CeN/(2PrN − NdN), (Pr/Pr*)N = PrN/(0.5CeN + 0.5NdN), and (La/La*)N = LaN/(3PrN − 2NdN) (Table 1). Since (Ce/Ce*)N anomalies partially depend on La concentrations, La anomalies can introduce bias into traditional (Ce/Ce*)N values. To address this, (Ce/Ce**)N anomalies are alternatively calculated using Pr and neodymium (Nd) concentrations to estimate expected cerium (Ce) concentrations, thereby avoiding any such bias [6]. (Y/Y*)N and (Eu/Eu*)N anomalies were also calculated using equations from [33,34], respectively: (Y/Y*)N = YN*((DyN + HoN)/2); (Eu/Eu*)N = (2 × EuN)/(SmN + GdN). Bell Shape Indices (BSIs), quantifying the magnitude of MREE enrichment (i.e., MREE/MREE*) in shale-normalized spider diagrams (Table 1), were calculated using the equation of [34]: BSI = (2 × (SmN + GdN + DyN)/3)/(((LaN + PrN + NdN)/3) + ((HoN + ErN + TmN + YbN + LuN)/5)). Finally, the magnitude of the T3 tetrad effect was calculated using the following equation from [35], in which X is the concentration of the elements A, B, C, and D, which, in turn, refer to the first through fourth elements of the third REE tetrad (Gd, Tb, Dy, and Ho):
T 3 = 0.5 × X B X A 2 / 3 × X D 1 / 3 1 2 + X C X A 1 / 3 × X D 2 / 3 1 2

3. Results

3.1. Overall REE Composition

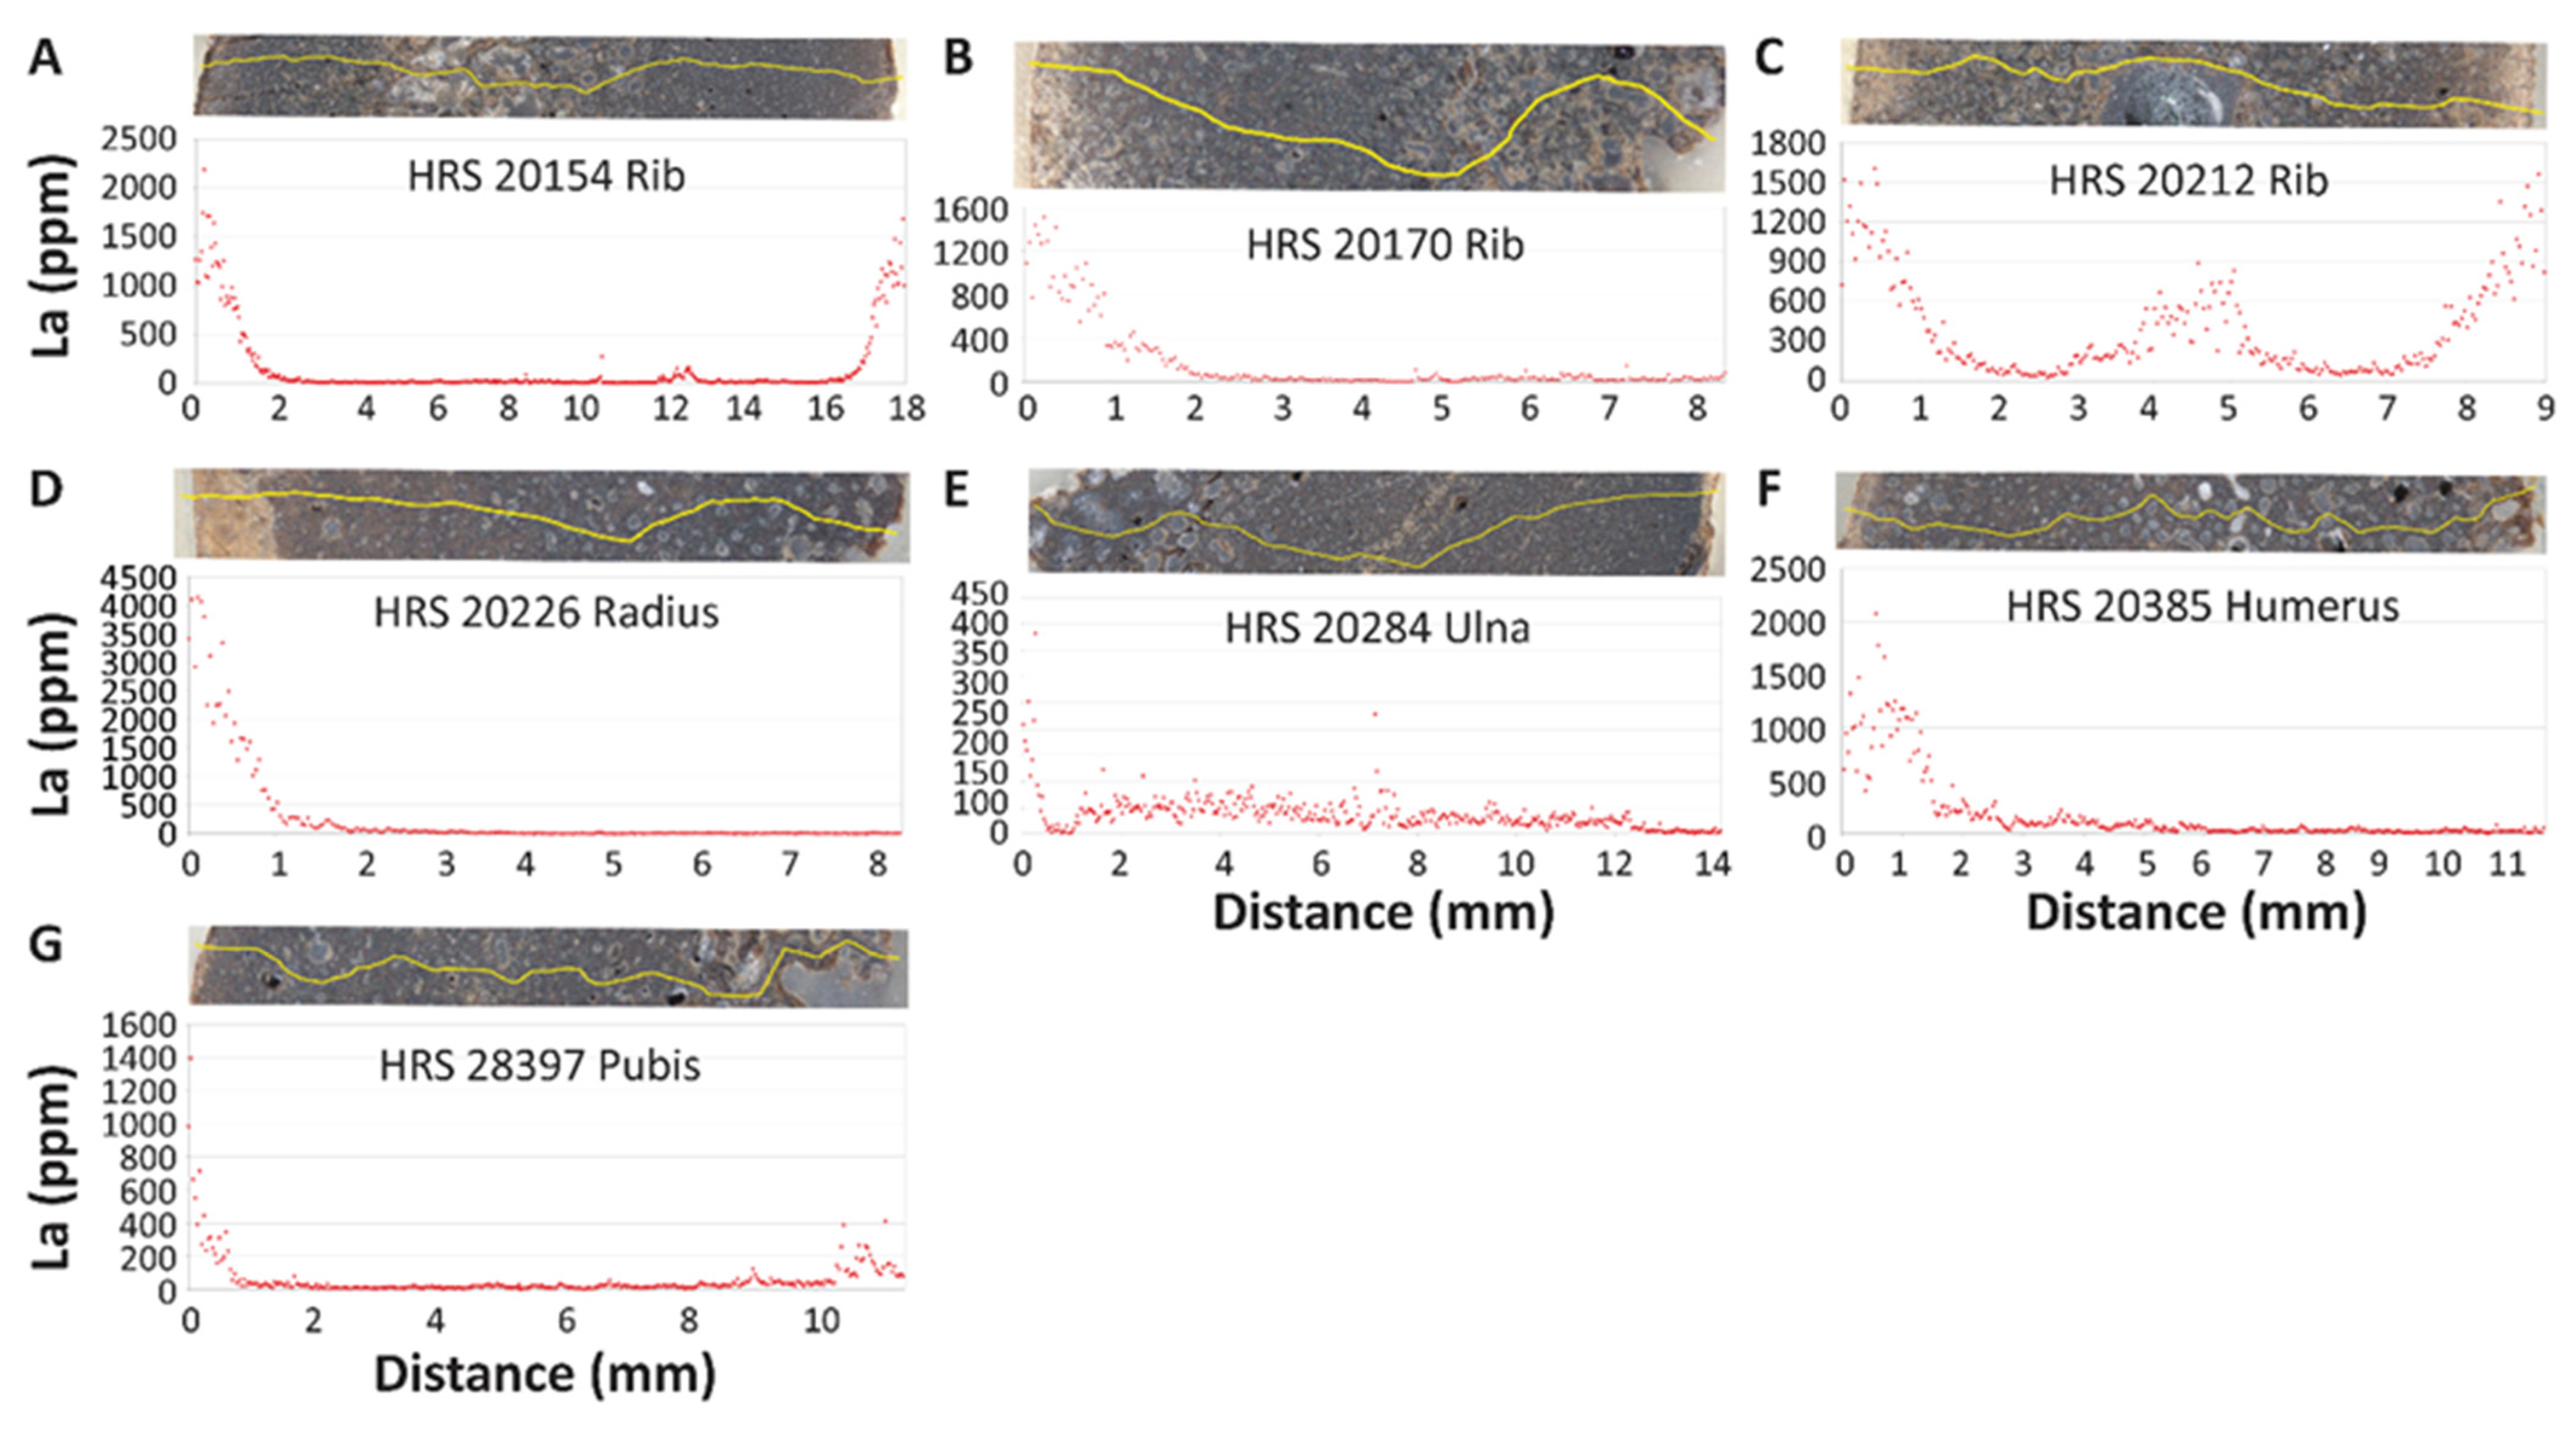
At the whole-bone level (i.e., combining all transect data), the seven specimens (Figure 3) from the Neufeld Quarry exhibit average ∑REE concentrations spanning roughly an order of magnitude (~260–2400 ppm) around an average of 1045 ppm (Table 2). A notable outlier in this generally consistent pattern is rib HRS 20212, which exhibits a ∑REE of 2453 ppm—nearly 1000 ppm higher than any other sampled specimen from the Neufeld Quarry. This elevated trace element enrichment appears to correlate with the greater vascular porosity and larger medullary cavity of this rib compared to the other six examined specimens (Figure 3). Scandium (Sc) concentrations range from 10 to 56 ppm, while uranium (U) concentrations remain low (≤20 ppm), with the highest value observed in the aforementioned, histologically porous rib HRS 20212 (19 ppm; Table 2). Apart from iron (Fe), elements such as manganese (Mn), barium (Ba), and strontium (Sr) are present in the highest concentrations, ranging from 3000 to 4800 ppm in all seven specimens (Table 2). Specimens HRS 20154, 20212, 20170, and 28397 possess positive BSI values (Table 2), indicative of enrichment in middle rare earth elements (MREEs), whereas specimens HRS 20284, 20385, and 20226 present slightly negative BSI values, suggesting slight relative depletion in MREEs compared to light (LREEs) and heavy REEs (HREEs). Additionally, T3 values, which characterize the severity of tetrad effects [35], remain below 0.2 in all specimens (Table 2), indicating weak influences of tetrad effects during the primary phase(s) of trace element uptake from pore fluids.

3.2. Intra-Bone REE Depth Profiles

Although most of the Neufeld Quarry specimens exhibit a sharp decline in REE concentrations with increasing cortical depth (e.g., Figure 3), there are notable variations in the shape of trace element concentration profiles. For instance, ulna HRS 20284 exhibits an oversteepened decline in La concentrations near the cortical margin (Figure 3 and Figure 4A). Other notable examples include clear near-surface leaching of all trace elements examined, as indicated by low concentrations in (typically) the outer ~1 mm of the external cortex, in specimens HRS 20170, 20385, and, to a lesser extent, 20154 and 20212 (Figure 4A).
Deflections of concentration profiles associated with double medium diffusion (DMD; sensu [36]) through Haversian canals in the middle and internal cortices are surprisingly rare, with modest influences of DMD observed only in specimens HRS 20226 and 20385 (e.g., Figure 3). Brief spikes in trace element concentrations, resulting from localized enrichment in osteonal tissues surrounding Haversian canals and other internal cavities, are evident in some specimens, such as HRS 20154 and 20284, but are absent in others, such as HRS 28397 and 20385 (Figure 3). This variability corresponds well with differing degrees of trace element uptake via DMD. Additionally, both HRS 20212 and 28397 exhibit signs of trace element uptake from pore fluids flowing through the medullary cavity, as indicated by elevated trace element concentrations within the internal cortex and/or cancellous tissues of the medullary cavity in the transects through these two specimens (Figure 3).
When comparing the Neufeld Quarry concentration profiles, La concentrations were found to be universally higher than those of U and ytterbium (Yb) across each entire transect (Supplementary Data Files S1 and S2). Similarly, Yb concentrations were found to be higher than those of U across transects in every specimen except ulna HRS 20284, which yielded higher U than Yb concentrations solely in its external cortex (Figure S1). Despite all these variations, concentrations of La uniformly drop to <500 ppm by 2 mm into the cortex of each specimen (Figure 4A). At this scale, it is also evident that specimen ulna HRS 20284 exhibits uniquely low concentrations and shallow profiles for most trace elements in comparison to the other six examined specimens from Neufeld.
As is common in fossil bones, MREEs and HREEs were found to typically present progressively shallower concentration–depth profiles than LREEs (cf., [15,18]). While La concentrations at the cortical margin range from approximately 200 to 3750 ppm, the lower end of this range appears notably influenced by late-diagenetic leaching (e.g., in ulna HRS 20284; Figure 3). In contrast, surface concentrations of Yb remain below 200 ppm in most specimens (Figure S1).
The HREE concentration–depth profile shapes (e.g., Yb) consistently match those of U, though in all but one specimen, the Yb concentrations exceed those of U (Figure S1). The sole exception to this trend is ulna HRS 20284, which exhibits higher concentrations of U than Yb within the outer 0.5 mm of its external cortex. This specimen is also unique in having internal swells of U that exceed U concentrations in the outer 2 mm of its external cortex. Specimen HRS 20212 is the only other bone to show this pattern, perhaps owing to its high porosity.

3.3. NASC-Normalized REE Patterns

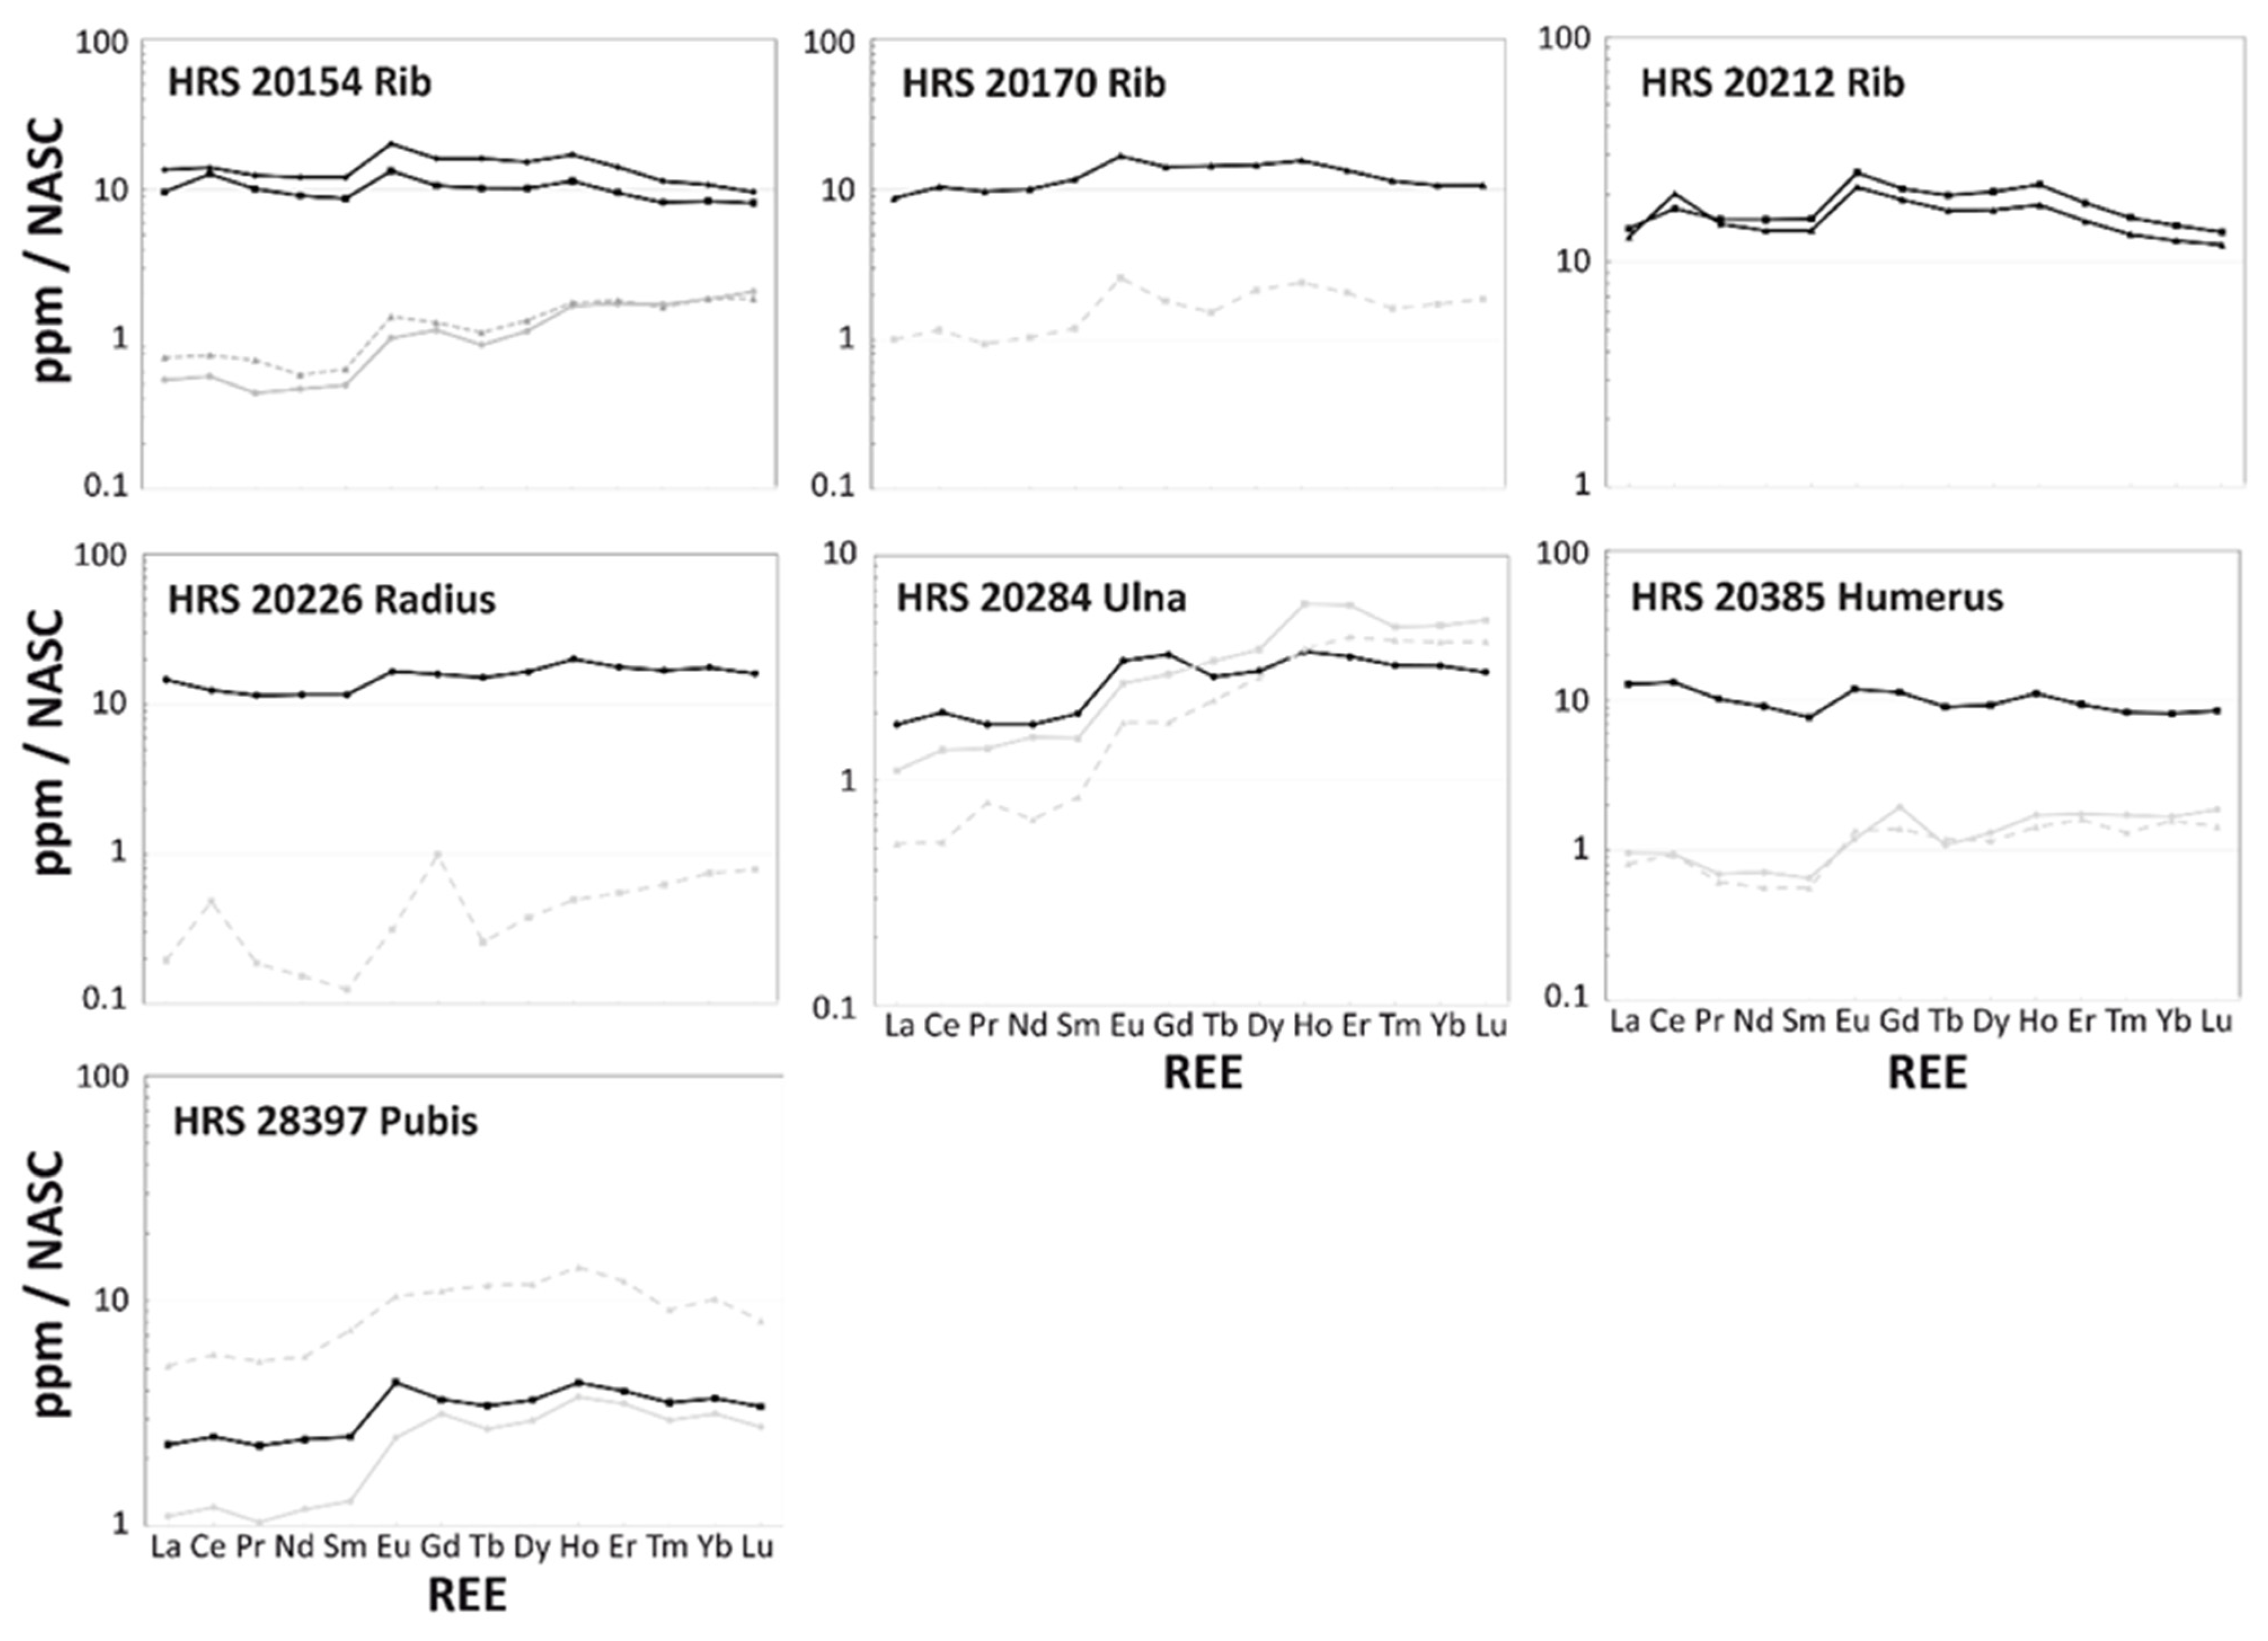
A spider diagram of REE concentrations within the outer 250 μm of each bone reveals several uniform patterns in composition (Figure 5A). In this plot, all specimens exhibit relative HREE depletion with increasing atomic number, as well as (with two exceptions, HRS 20170 and 20284) positive europium (Eu) and holmium (Ho) anomalies. All examined Neufeld specimens vary in shale-normalized REE enrichment within approximately one order of magnitude, ranging from ~8 to 80 times the NASC values. Among the seven specimens, five exhibit a subtle positive inflection of Ce (a positive (Ce/Ce*)N anomaly, see below) compared to the neighboring REEs La and Pr. The two specimens exhibiting a subtle negative Ce anomaly in this plot (Figure 5A) are radius HRS 20226 and ulna HRS 20284. All seven specimens also exhibit slight relative MREE enrichment (Figure 5A), which corresponds well with their typically positive BSI values at the whole-bone level (Table 2). As mentioned above, the only exception to these trends is ulna HRS 20284, for which the apparent lack of relative MREE enrichment is linked with this specimen exhibiting the lowest BSI value in our dataset (Table 1).
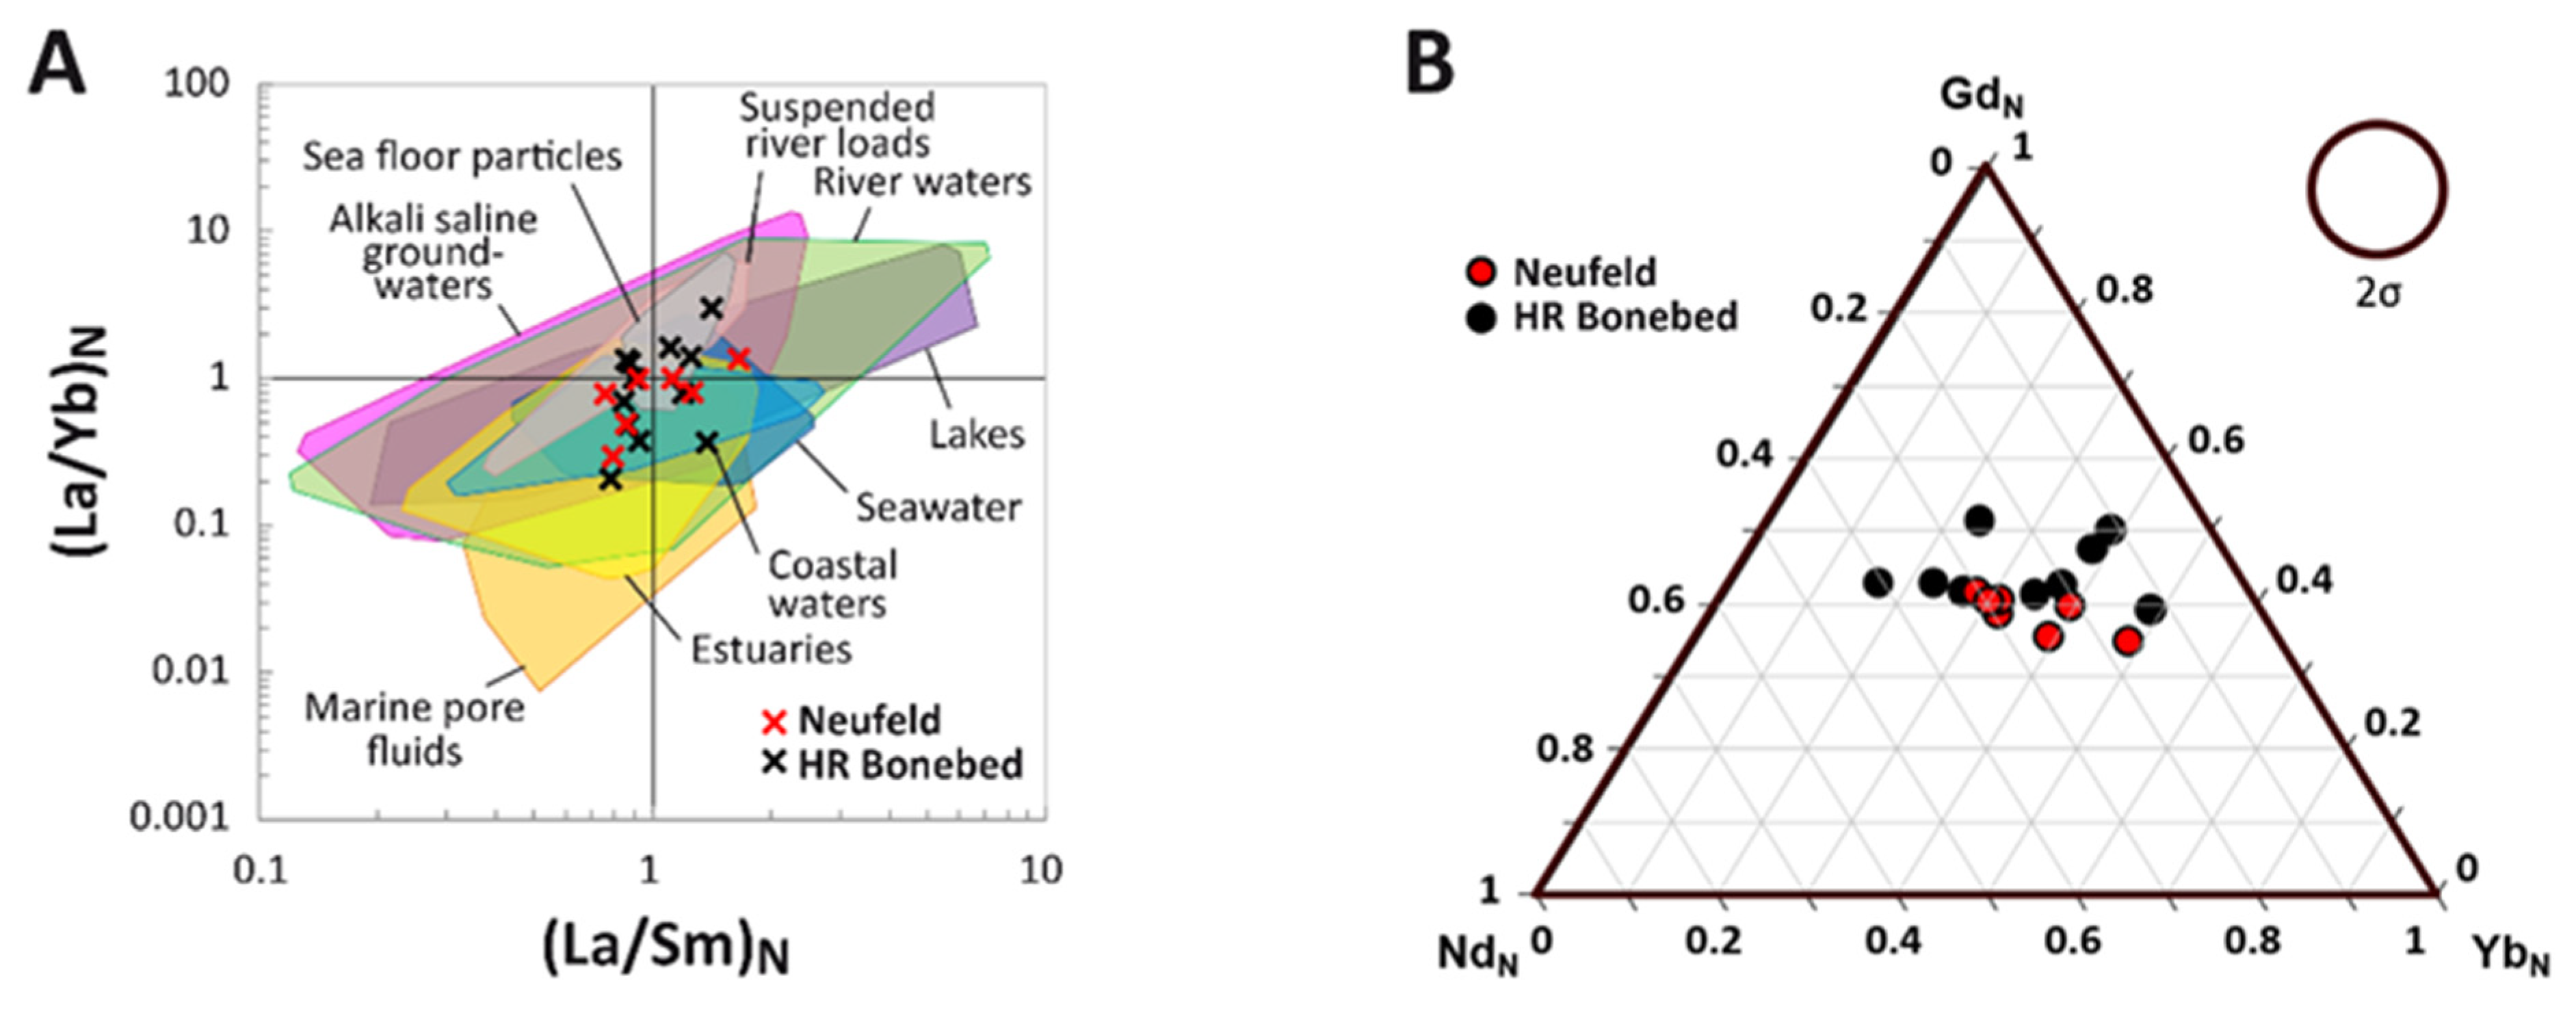
To further explore the compositional trends discussed above, we also examined the relative REE composition of the bones in ternary plots. In a whole-bone ternary diagram of NdN-GdN-YbN (Figure 6B), there is notable variation in LREE content, exceeding two orders of magnitude. However, this apparent variability is clearly linked with contrasts in the overall vascular density of each sample, as distribution end-member specimens HRS 20212 and 20385 are distinctly more histologically porous than the other specimens, which tend to possess a much thicker and denser cortex (e.g., radius HRS 20226). When the data are divided into individual (5 mm) internal and external transects in LaN-GdN-YbN space (Figure 7), the specimens exhibit a uniform pattern of increasing relative HREE enrichment with cortical depth, which is a common byproduct of fractionation during trace element uptake (see Section 4; [37,38]).
Spider diagrams of individual 5 mm transect segments through the internal and external cortices facilitate a more detailed analysis of intra-bone REE patterns relative to the NASC. These graphs reveal noticeable depletion of HREEs in transects that include the cortical margin (Figure 8). Peaks in Eu and Ho are also consistently observed regardless of depth into a specimen, with NASC-normalized concentrations for these two elements rising well above their neighboring REEs in most transects across all seven specimens (Figure 8). Most bones exhibit approximately an order of magnitude difference in REE enrichment between external and internal transects, with the exception of radius HRS 20226, in which the difference is roughly two orders of magnitude. Rib HRS 20226 is the only specimen to exhibit a (slight) negative Ce anomaly in a transect including the cortical margin. Internal transects typically possess equivalent or higher REE concentrations than those of the NASC, with the only notable exceptions being the innermost transects of specimens HRS 20284, 20154, and 20385 (which exhibit substantial LREE depletion relative to the NASC; Figure 8). The entire internal region of radius HRS 20226 also plots at values below those of the NASC. An interesting pattern is observed in rib HRS 20212, which, by cumulatively constituting a diameter cross-section, exhibits relatively even REE composition throughout its entire transect (Figure 8). Two specimens, HRS 20154 and 28397, display elevated NASC-normalized REE concentrations in their innermost transects compared to transects through their middle cortices. Notably, a transect through the internal cortex of pubis HRS 28397 exhibits significantly higher NASC-normalized REE concentrations than in the transect including the cortical margin of this specimen (Figure 8). Finally, occasional Gd spikes are also observed in select internal transects of specimens HRS 20284, 28397, 20385, and 20226, likely due to isobaric interference effects (e.g., [99,100]).

3.4. (La/Yb)N vs. (La/Sm)N Ratio Patterns

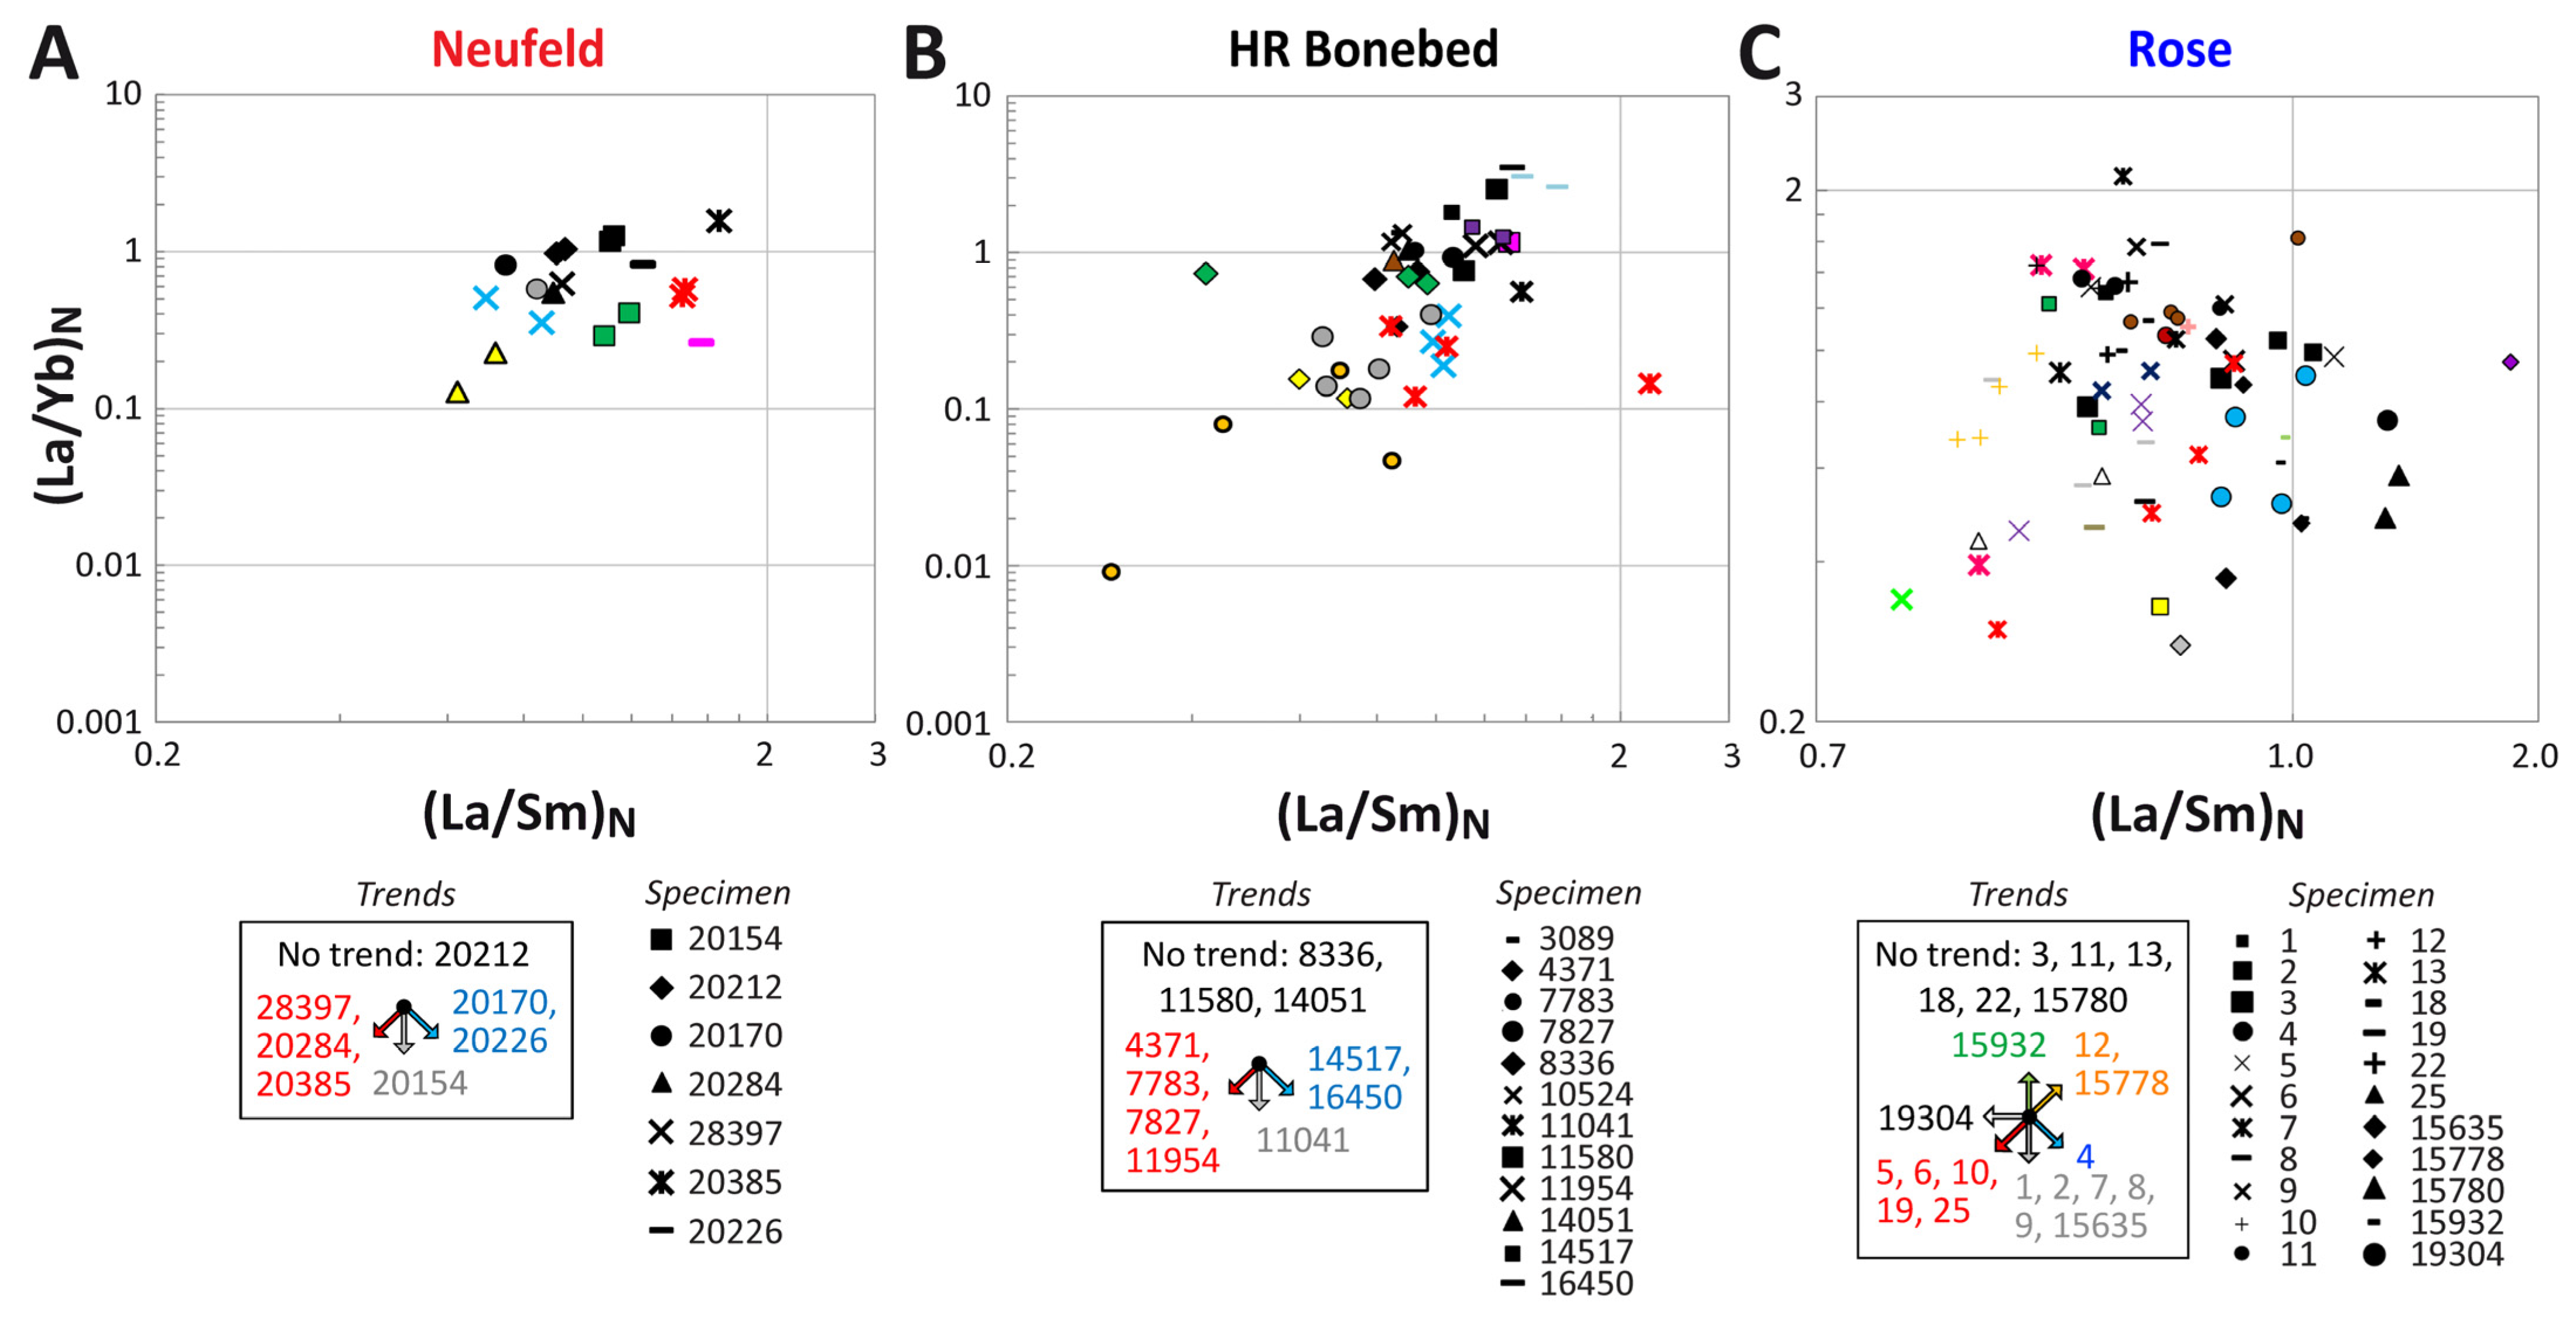
In a plot of whole-bone (La/Yb)N versus (La/Sm)N ratios, the Neufeld specimens exhibit modest variation (Figure 6A). Compositionally, the seven examined bones exhibit a range of variation of approximately one order of magnitude in whole-bone (La/Yb)N and (La/Sm)N ratios. Roughly half of the specimens exhibit averages greater than 1.0 for (La/Sm)N ratios, whereas most specimens present averages at or below 1.0 for (La/Yb)N ratios (Figure 6A), indicating somewhat variable relative enrichment in LREEs, MREEs, and HREEs among the specimens. This general distribution causes the spread of datapoints to cover the central portion of the plot, which signifies that the fossil bone compositions are generally consistent with most sedimentary particulates and nearly any natural water source(s) (Figure 6A). Figure 6A thus highlights both commonalities and variability amongst the seven specimens rather than a clear indication of the type(s) of pore fluid(s) the fossil bones interacted with through burial and diagenesis.
To further investigate differences among the Neufeld specimens, (La/Yb)N and (La/Sm)N ratios for individual transects were plotted and color-coded by depth into each bone (Figure 9A). Only one specimen, rib HRS 20212, shows no noticeable depth-related trend in these REE ratios. Rather, roughly half of the specimens exhibit a decrease in (La/Yb)N ratios with increasing cortical depth. A few specimens (e.g., HRS 28397 and 20284) also exhibit a decrease in (La/Sm)N with increasing cortical depth. Again, histological porosity appears to be a key factor influencing compositional homogeneity, or lack thereof, in the specimens, as more porous specimens typically show a lesser spread among transect data points. One clear example is rib HRS 20212, for which external and internal transect data points nearly overlap, indicating uniform diagenetic alteration throughout the entire specimen (Figure 9A). Cumulatively, transects through the external cortex of the specimens exhibit greater variation in (La/Yb)N (slightly less than one order of magnitude) than (La/Sm)N ratios (around half an order of magnitude). All (La/Yb)N ratios are also higher in external transects than in internal transects. Overall, (La/Yb)N ratios for individual transects range from ~0.1 to 2.0, whereas (La/Sm)N ratios range from ~0.6 to 1.8.

3.5. REE Anomalies

In the specimens examined, all REE anomalies fluctuate between positive and negative values across each transect. However, when considering the whole-bone averages for each specimen, all bones exhibit negative (Pr/Pr*)N anomalies and positive (Eu/Eu*)N, (Ce/Ce**)N, and (Y/Y*)N anomalies (Table 2). Similarly, only one specimen exhibits a negative whole-bone (Ce/Ce*)N anomaly, radius HRS 20226. Contrastingly, (La/La*)N anomalies tend to either be distinctly positive in about half the specimens (HRS 28397, 20385, and 20226), yet negative in the other half (HRS 20154, 20212, 20170, and 20284) (Table 2). (Ce/Ce*)N anomaly values were found to exhibit poor correlation with U concentrations (R2 = 0.161; Figure S2).
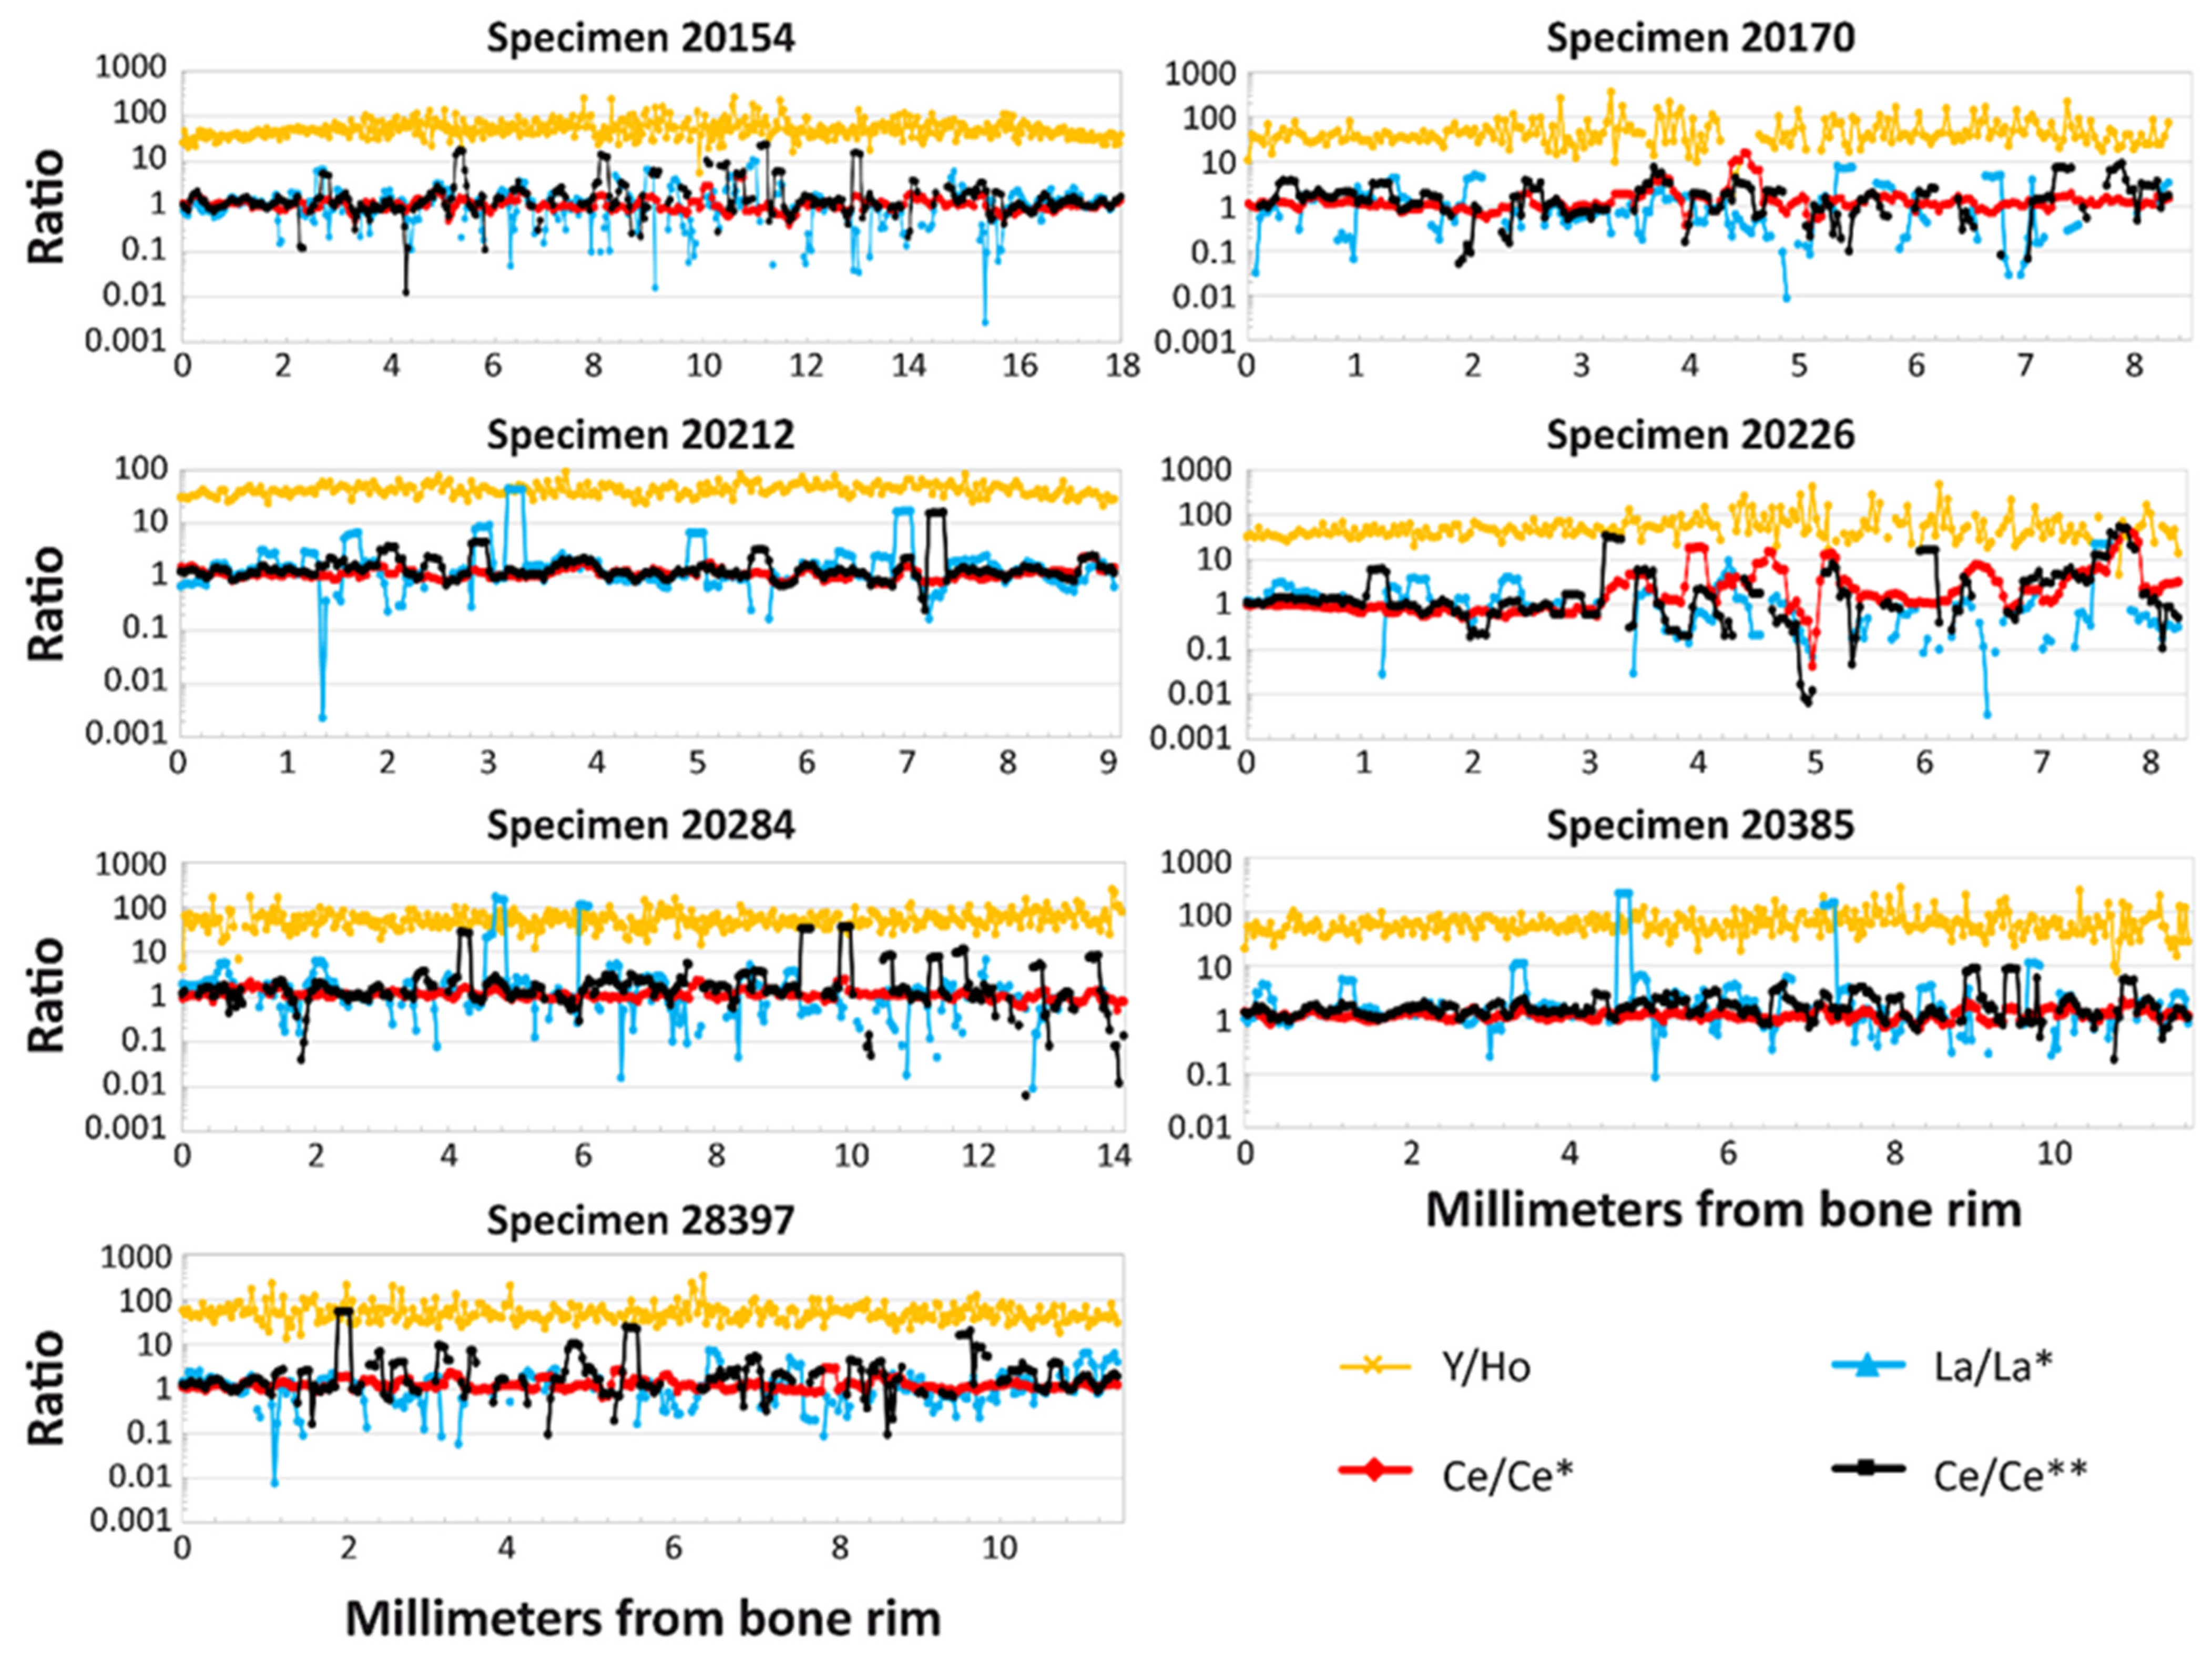
(Ce/Ce*)N anomalies remain basically absent across most transects, with the exception of radius HRS 20226, which exhibits positive (Ce/Ce*)N spikes internally. There is also one short region within the transect across rib HRS 20170 that exhibits similar positive spikes in (Ce/Ce*)N anomalies, but not to the same degree as in specimen HRS 20226 (Figure 10). In a great majority of specimens, (Ce/Ce*)N anomaly values vary by less than an order of magnitude across transects. (La/La*)N and La-corrected (Ce/Ce**)N anomalies, on the other hand, vary considerably more, typically from one to two orders of magnitude throughout transects (Figure 10).
To rule out anomalous La behavior, (Ce/Ce*)N anomalies are often plotted against (Pr/Pr*)N anomalies [42]. In Figure 11, data points are plotted in every field of the graph. Data points from within the interior of each bone form a wider spread than do those from their external cortices, most of the latter of which are plotted in field 3a, suggestive of positive Ce anomalies and negative La anomalies. In contrast, almost no external cortex data points are plotted in field 2a, which would be suggestive of positive La anomalies (Figure 11). As mentioned above, data points from the internal regions of the bones are widespread, mainly being plotted within fields 3a, 2b, and 4a, all of which signify common negative La anomalies. When parsed into individual (Ce/Ce*)N − (Pr/Pr*)N plots for each bone (Figure S3), all external cortex data points fall within these same three fields (3a, 2b, and 4a). The only exception is radius HRS 20226, for which the majority of data points from its external cortex are plotted in field 4b. Similarly, HRS 20226 displays a slightly wider range of values for both anomalies within its plot in comparison to the other six specimens (Figure S3). However, most data points in this ‘outlier’ specimen fall within field 3a, which is indicative of positive Ce and negative La anomalies (Figure S3).
To quantitatively authenticate these inferences of redox-related Ce anomalies, we also used the equations developed by Herwartz et al. [6] to directly calculate (La/La*)N and (Ce/Ce**)N anomalies (see Section 2). At the cortical margin, all seven specimens were found to exhibit neutral or slightly positive (Ce/Ce**)N anomalies (Figure 10). Through the middle cortex, radius HRS 20226 exhibits negative (Ce/Ce**)N anomalies and closely paralleling negative (La/La*)N anomalies. Occasional gaps in (La/La*)N anomaly profiles (e.g., in rib HRS 20226 in Figure 10) occur in regions of the bones that possess greater Nd than Pr concentrations.
Among the anomalies examined, (La/La*)N anomalies are the most variable. (La/La*)N values often vary across transects by more than two orders of magnitude (e.g., in specimens HRS 20154 and 20284; Figure 10). Most specimens exhibit positive (La/La*)N anomalies in the external cortex but variably positive and negative anomaly values internally. In contrast, rib HRS 20212 differs by possessing a negative (La/La*)N anomaly through the external cortex and primarily positive (La/La*)N anomalies through much of its interior (Figure 10).
In the specimens examined, ytterbium/holmium (Y/Ho) ratios are universally above chondritic (26; [101]), specifically ranging from ~40 to 60 at the whole-bone level (Table 2). Y/Ho ratios vary by an order of magnitude across bone transects, with most varying from ~35−55 (Figure 10). Ribs HRS 20154 and 20212, and, to a lesser degree, radius HRS 20226, possess internal swells of slightly higher Y/Ho ratios than in their external cortices.

4. Discussion

Stratigraphic analysis has established the lateral continuity of the fossil-bearing horizon between the HR Bonebed “Main Quarries” and Neufeld Quarry (as will be detailed in an upcoming comprehensive stratigraphic paper on the Hanson Ranch field area). This confirmation provides an ideal case study for testing whether rare earth element (REE) concentrations alone—without relying on traditional taphonomic indicators—can independently confirm the lateral equivalency of a bonebed.
Comparison of the trace element compositions of fossil bones from the five HR Bonebed “Main Quarries” and Neufeld Quarry reveals a strikingly similar magnitude and range of geochemical alteration in both fossil assemblages. For instance, the average ∑REE concentrations of specimens from the Neufeld Quarry fall within the range of 70–7000 ppm found by Ullmann et al. [30] in specimens from the “Main Quarries”. At both sites, the relative histological porosity appears to influence the magnitude (and spatial distribution, see below) of trace element enrichment; the more porous the bone, the higher the ∑REE concentration. This pattern is evident in both the Neufeld dataset and at the “Main Quarries”, wherein the specimens with the largest cancellous medullary region from each site (rib HRS 20212 and caudal centrum HRS 14517, respectively) each exhibit the highest ∑REE concentration observed in each assemblage (Table 2 and [30], Table 2). Surprisingly, BSI values of fossil bones from the Neufeld Quarry vary more than those of bones from the “Main Quarries”, where all but one of the specimens exhibit a slightly positive value. In contrast, roughly half of the Neufeld specimens exhibit negative whole-bone BSI values (though the values are notably weakly negative, i.e., ≥0.92; Table 2). Positive BSI values are indicative of MREE enrichment [34], which commonly arises as a product of protracted uptake [102,103], so the prevalence of weakly positive BSI values at both sites implies that no specimens in either assemblage experienced major protracted uptake from late-diagenetic pore fluids. T3 values, characterizing the severity of tetrad effects during REE uptake [35], also correspond well between the two sites, with bones from both sites exhibiting signs of only weak tetrad effects (i.e., values rarely exceed 0.4 at either site; Table 2 and [30], Table 2).
When focusing on histologically dense specimens (Figure 4), La concentrations drop to or below 1000 ppm by 1 mm into the cortex in all but one specimen from each site. This indicates both a similar magnitude and depth of trace element alteration ‘severity’ in fossils from both sites. The only exception to this shared trend is Neufeld humerus HRS 20385, which likely stems from its relatively higher porosity compared to the other six Neufeld specimens (see transect image insets in Figure 3 and Table 3). Similarly, in all but two cases (specimens HRS 10524 and 3089), La concentrations drop well below 500 ppm by 2 mm into the external cortex in fossil bones from both sites (Figure 4). Both of the exceptions to this pattern are turtle (Adocus) carapace fragments from the “Main Quarries”, which exhibit relatively higher porosity throughout the entire specimen. As is typical, but not universal, for fossil bones (see, e.g., [16] for an exception), all specimens in both datasets also possess higher concentrations of La than Yb or U across the entire length of each transect (e.g., Figure S1 and Supplementary Data File S2).
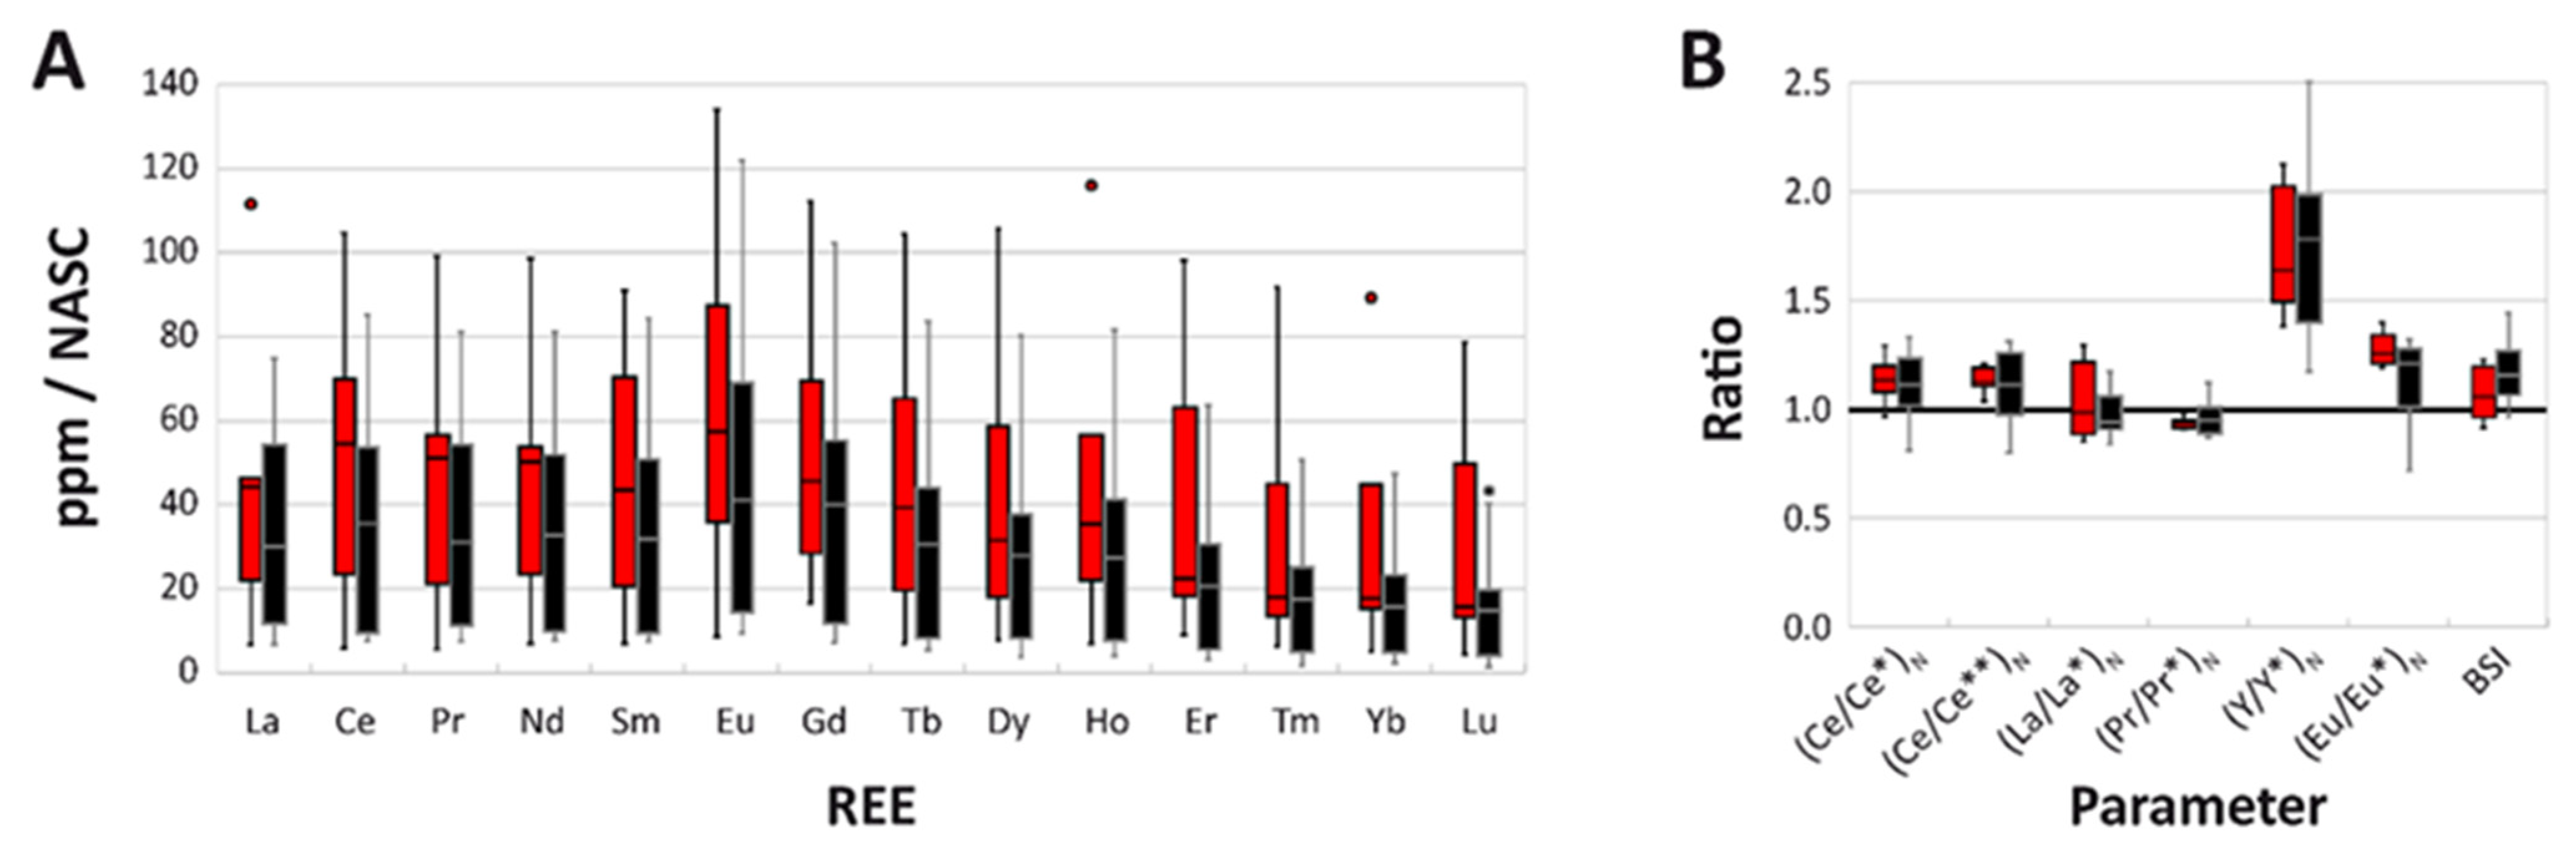
To quantitatively assess these apparent similarities in fossil trace element compositions, we created box and whisker plots of average NASC-normalized REE concentrations in the outermost 250 μm of the bones (Figure 12A) and whole-bone anomaly values of specimens from each site (Figure 12B). Data collected from the outer 250 μm of each specimen, rather than each entire examined transect, were chosen for the first of these comparisons, as this region experiences the greatest interaction with surrounding pore fluids through diagenesis [104], allowing us to compare chemical signatures imparted during the major phase(s) of trace element alteration at the two sites (regardless of timing during diagenesis). As Figure 12A shows, the mean NASC-normalized concentration of each REE in specimens from the Neufeld Quarry is plotted slightly (i.e., <5 ppm/NASC) to modestly (i.e., ~20 ppm/NASC) higher than those from the HR Bonebed “Main Quarries”. However, the general distribution of relative values is very similar among the sites, and the interquartile ranges (IQRs) overlap significantly with one another for each element. The HREEs Er, Tm, Yb, and Lu exhibit the least overlap in IQRs between the two sites (Figure 12A), indicative of slightly greater relative HREE uptake at Neufeld than at the “Main Quarries”. It remains unclear whether this modest contrast might signify one of the following: (1) interaction, if even briefly, with a more HREE-enriched surface water or diagenetic pore fluid by the specimens at Neufeld; (2) progressively increasing fractionation during uptake over a slightly longer timeframe by specimens at Neufeld than those preserved in the “Main Quarries”; (3) an influence of slightly differing average histological porosity/structure among specimens from the two sites; (4) perhaps most likely, a combination of some or all of these factors.
Additionally, and somewhat surprisingly, bones from the Neufeld Quarry exhibit a wider range in NASC-normalized concentrations for every REE than do those in the “Main Quarries” dataset, even though the Neufeld data derive from fewer specimens (N = 7 vs. 12 for Neufeld and the “Main Quarries”, respectively). However, all outlier data points from the Neufeld Quarry (La, Ho, and Yb in Figure 12A) and the maximum data point for each REE in the Neufeld dataset (even if it is not a statistical outlier) derive from rib HRS 20226. Manual removal of this specimen from the dataset was found to shrink the range of values for all REEs in the other six Neufeld specimens to fall within the IQRs exhibited by the “Main Quarries” specimens, as would be otherwise expected based on the relative sample sizes from each site. Thus, rib HRS 20226 clearly exhibits greater REE enrichment than all of the other bones examined from Neufeld. By comparison, the sole outlier in the “Main Quarries” dataset is for lutetium (Lu) in Triceratops frill HRS 8336, which falls barely above the maximum whisker for that element in the “Main Quarries” dataset (Figure 12A). The presence of rare outliers, such as these, at both sites is consistent with the hypothesis of occasional addition of attritionally sourced bones into a large and widespread fossil assemblage, as originally hypothesized by Snyder et al. [29] and independently corroborated by Ullmann et al. [30].
When comparing whole-bone (Ce/Ce*)N, (Ce/Ce**)N, and (Pr/Pr*)N anomalies, the ranges for specimens from Neufeld fit within the IQRs of the corresponding anomalies from the “Main Quarries” specimens (Figure 12B). (La/La*)N is the only anomaly to exhibit greater variation within specimens from the Neufeld Quarry than those from the “Main Quarries”. BSI values reveal slightly greater average MREE enrichment in bones from the “Main Quarries” in comparison to those from Neufeld, as indicated by the slightly higher relative values (Figure 12B). Whole-bone (Y/Y*)N anomalies are universally positive at both sites, and whole-bone (Eu/Eu*)N anomalies are universally positive in the Neufeld specimens (Table 2) and all but two examined specimens from the “Main Quarries” ([30], Table 2), providing further compelling evidence of general geochemical similarity (including exposure to similar redox conditions, see below) among the bones from the two sites.
In addition to overlapping magnitudes and ranges of trace element alteration, bones from the two sites exhibit similarities in chemical alteration patterns. One such pattern in specimens from both sites is a common relative enrichment in Eu and Ho, which are commonly seen to form subtle peaks in NASC-normalized spider diagrams (Figure 5 and Figure 8). Such peaks can be seen in transects across all but three specimens from both sites (“Main Quarries” specimens HRS 11041 and 4371 and Neufeld specimen HRS 20284, which instead only exhibit subtle peaks at Eu). Peaks in Eu (and occasional Gd spikes, e.g., in the outermost cortex of specimen HRS 20284; Figure 5A) in spider diagrams may derive from isobaric interferences with Ba and LREE oxides [99]. Ho spikes, however, cannot reasonably be attributed to such interferences, so we conclude that the observed Eu and Ho spikes may instead reflect a common influence of tetrad effects during uptake by bones at each site, namely, unusual “non-CHARAC” (CHArge-RAdius Control) behavior caused by the configuration of electrons in the 4f orbital of lanthanides [105,106]. The common observation of positive whole-bone (Eu/Eu*)N anomalies and Eu peaks in spider diagrams of bones from both sites may also be an indicator of shared reducing conditions during diagenesis [107]. This interpretation aligns well with the observation of universally positive whole-bone (Ce/Ce*)N anomalies in specimens from Neufeld (Table 2), which are also indicative of significant trace element uptake having occurred under reducing conditions [6].
When taken at face value, the observation that whole-bone (Ce/Ce**)N anomalies are universally positive among bones from Neufeld (Table 2 and Figure 12B) suggests that they experienced significant trace element uptake under oxidizing, rather than reducing, conditions. This inference would appear more consistent with findings from the nearby Rose Quarry, which preserves a diverse, attritional assemblage of vertebrate fossils [18], than it is with the HR Bonebed Edmontosaurus mass death assemblage, where only half of the examined specimens were observed to exhibit notably positive whole-bone (Ce/Ce**)N anomalies ([30], Table 2). This might imply that the fossil assemblages preserved at Neufeld and the “Main Quarries” are not laterally equivalent. However, through recent work by two of us (A.C. and K.S.) to laterally track the strata among all quarries at Hanson Ranch, we know this to be false (these stratigraphic data will be published in an upcoming comprehensive study of the Hanson Ranch field area). Significantly less excavation has taken place at Neufeld (and the Rose Quarry) than at the “Main Quarries”, meaning that the majority of specimens from Neufeld (and Rose) were collected from under less overburden rock than most of the specimens now in collections from the five “Main Quarries” (pers. observations by A.C. and K.S.). This contrast is significant, as specimens positioned closer to the modern ground surface are more vulnerable to modern weathering, including late-diagenetic chemical alteration via interactions with modern meteoric fluids percolating through weathering sediments, which can flow more freely through near-surface, weathering-induced fractures/desiccation cracks ([108] and references therein). It is thus likely that the redox signatures in bones at Neufeld are more altered by modern weathering, which would pull the average for this site toward positive (Ce/Ce**)N values (since weathering typically imparts oxidizing signatures to fossil bones, at least surficially; e.g., [13]). Therefore, (Ce/Ce**)N anomaly transects, and especially (Ce/Ce**)N values from deeper within the fossil specimens, should provide a more reliable comparison among the Neufeld and “Main Quarries” bones than whole-transect averages.
The frequent observation of negative (Ce/Ce**)N anomalies along sections of transects in bones from both sites (e.g., specimen HRS 20226 in Figure 10) is consistent with the presence of small reducing pockets throughout the bone microstructure during diagenesis. This is a common feature in fossil bones due to the rapid depletion of oxygen via the actions of decomposing microbes [109,110,111]. Since ∑REE concentrations in the examined Neufeld specimens remain low for bones of Cretaceous age (cf., [112,113]), and, thus, late-diagenetic addition of REEs must have accordingly been minimal, it is also plausible that these patches of negative (Ce/Ce**)N anomalies within the interiors of several Neufeld specimens may reflect the general early-diagenetic redox regime at the site. This would imply that bones at both Neufeld and the “Main Quarries” primarily experienced reducing conditions during the primary, early-diagenetic phase of trace element uptake, which is corroborated by the overall low U content of bones at both sites (Table 2, Figure S1, and [30], Table 2).
When comparing concentration depth profiles, such as those in Figure 4, similar patterns of spatial alteration are evident in bones at both sites. For example, two of the Neufeld Quarry bones (HRS 20170 and 20385) exhibit an oversteepened profile shape for La (Table 3) and many other trace elements (e.g., Yb and U in Figure S1), as do three from the “Main Quarries” (HRS 4371, 7827, and 11041; [30], Table 3). Oversteepened profile shapes are likely attributable to interaction with a recent pore fluid via modern weathering and exposure [14,114]. Similarly, several specimens from both sites also exhibit surficial leaching of select REEs from the outermost cortex, indicating that some specimens at both sites interacted with similar, REE-depleted recent pore fluids (most likely during modern weathering). This process is evident in Neufeld specimens HRS 20154, 20170, 20212, and 20385 (e.g., La in Figure 4, Table 3), as well as “Main Quarries” specimens HRS 4371, 11580, and 16450 ([30], Table 3). Only one specimen from the Neufeld Quarry was identified to exhibit clear signs of DMD (pubis HRS 28397; Table 3), whereas three specimens from the “Main Quarries” (HRS 3089, 10524, and 11954) exhibit kinks in concentration profiles attributable to this process ([30], Table 3). Two of those “Main Quarries” specimens are pieces of turtle shell, meaning that only one Edmontosaurus bone at each site was identified to exhibit noteworthy signs of DMD. Rare signs of DMD, therefore, represent another chemical similarity between bones preserved at the two sites.
Redox signatures in both the external cortex and internal transects are also quite similar in bones from the Neufeld Quarry and “Main Quarries”. For instance, (Ce/Ce**)N anomalies are commonly neutral or positive at the cortical margin of bones from both sites (Figure 10 and [30], Figure 6). As noted above, this shared pattern is suggestive of recent exposure to oxidizing conditions during late diagenesis, which is a common alteration in fossil bones presumably resulting from modern weathering (e.g., [13,18]). Thus, this shared signature should be considered of little value toward determining the equivalency of the fossil assemblages at the two sites. Another redox indicator, the traditional (Ce/Ce*)N anomaly, is also commonly positive in the internal cortex of many bones from both sites (Figure 10 and [30], Figure 6). This similarity appears to arise from the frequent presence of negative (La/La*)N anomalies through the internal cortex and medullary cavity of bones at both sites—most notably, specimens HRS 20154, 20170, 20226, and 20284 from Neufeld (Figure 10) and HRS 7783, 7827, 8336, and 11041 from the “Main Quarries” ([30], Figure 6). These negative (La/La*)N anomalies, in combination with universally positive whole-bone (Y/Y*)N anomalies (Table 2) and above-chondritic Y/Ho anomalies across transects (Figure 10), indicate that, as at the “Main Quarries” [30], significant fractionation commonly occurred during trace element uptake by fossil bones at the Neufeld Quarry.
In addition to similarities in redox signatures between the bones at both sites, which could be shared simply due to their geographic and stratigraphic proximity to one another rather than a truly shared origin (and lateral equivalency) of their fossil assemblages, bones from Neufeld and the “Main Quarries” exhibit similar ranges in variation of anomaly values internally. In particular, intra-bone anomaly patterns typically exhibit considerably greater variation within the internal cortex and medullary cavity of bones at both sites than in the external cortex of the specimens, where all anomaly signatures tend to appear more homogenous (Figure 10 and [30], Figure 6). As an example, (Ce/Ce*)N anomalies rarely vary by more than one order of magnitude in bones from both sites, with the only exceptions being specimen HRS 20226 at Neufeld and HRS 8336, 11041, and 14517 at the “Main Quarries”. (Ce/Ce**)N anomalies similarly tend to vary within one order of magnitude in most cases, again with few exceptions (i.e., specimen HRS 20226 from Neufeld, and HRS 8336 and 7827 from the “Main Quarries”). All of these exceptions occur as brief spans of variation approaching or exceeding two orders of magnitude for each cerium anomaly in the internal regions of bones. (La/La*)N anomalies, meanwhile, exhibit greater variability within bones at both sites, usually surpassing two orders of magnitude variation along transects (especially within the medullary cavity and/or internal cortex; Figure 10 and [30], Figure 6). While this may sound like high variability, bones from the nearby attritionally accumulated Rose Quarry were found to exhibit even greater ranges in (La/La*)N and (Ce/Ce**)N anomalies, which commonly exceeded three orders of magnitude of variation [18]. Finally, Y/Ho anomalies also commonly exhibit considerable variation internally in bones from both sites. In particular, a few specimens from both sites exhibit a weakly dome-shaped Y/Ho profile, with lower Y/Ho ratios externally than internally (e.g., HRS 20154 from Neufeld and HRS 11954 from the “Main Quarries”). This correspondence occurs in specimens for which a full diameter transect was assessed, indicating a similar extent of trace element fractionation within Edmontosaurus bones of similar size and skeletal element type (ribs) at both sites.
(La/Yb)N versus (La/Sm)N plots of individual transects facilitate further comparison of fractionation trends in bones from the two sites. As shown in Figure 9A,B, bones from both the Neufeld Quarry and “Main Quarries” show strikingly similar trends toward increasing LREE depletion with increasing cortical depth, as well as variable degrees of MREE enrichment with increasing cortical depth. Proportionally, the two sites also exhibit similar numbers of specimens trending in each of these directions in the ratio plots (Figure 9A,B). Notably, the majority of specimens from both sites trend toward decreases in both (La/Yb)N and (La/Sm)N ratios with increasing cortical depth. Approximately half of the remaining specimens at both sites are plotted with increasing (La/Sm)N and decreasing (La/Yb)N ratios with increasing cortical depth, suggestive of increasing MREE depletion internally. Unlike at the nearby, attritionally accumulated Rose Quarry ([18]; Figure 9C), no specimens at Neufeld or the “Main Quarries” exhibit trends toward either homogenous or increasing (La/Yb)N ratios with increasing cortical depth (Figure 9A,B). This contrast between bones from the Rose Quarry compared to Neufeld and the “Main Quarries” cannot be explained simply by differing taxonomic sampling or skeletal element sizes, as some of the bones from the Rose Quarry examined by McLain et al. [18] pertain to turtles (e.g., humerus HRS 15635 and carapace fragment HRS 15780) and large bones of nonavian dinosaurs (e.g., Triceratops frill HRS 19304 and Edmontosaurus rib fragment HRS 15778), just like at the latter two sites. Therefore, these contrasts in fractionation trends between the Rose Quarry and the two sites being compared herein signify that bones from both of the latter sites lack the extensive degree of variation characteristic of an attritional accumulation history at the Rose Quarry. This stands as another strong line of evidence for a similar taphonomic origin and ensuing diagenetic history for the Neufeld Quarry and “Main Quarries” that clearly differ from attritional vertebrate fossil assemblages preserved within the Lance Formation in the same geographic (and stratigraphic) vicinity.
Cumulatively, the abundance of similar trace element signatures and ranges of alteration and variation they exhibit in bones from both Neufeld and the “Main Quarries”, as well as similarities in spatial trace element alteration patterns, leads us to conclude that the fossil assemblage exposed in the Neufeld Quarry is a lateral and stratigraphic equivalent of the HR Bonebed exposed in the nearby five “Main Quarries” examined by Snyder et al. [29]. This conclusion was reached prior to, and is now independently confirmed by, our traditional stratigraphic correlation of the two sites (to be shared in a separate forthcoming manuscript). Bones from Neufeld possess ∑REE values within the range of those found by Ullmann et al. ([30], Table 2) at the “Main Quarries” (70−7000 ppm) and exhibit elevated REE concentrations, which correlate with greater bone porosity/permeability, indicative of a shared histological control over trace element uptake at each locality. Bones from both sites also exhibit consistent decreases in La concentrations within the external cortex and other comparable REE signatures (i.e., signs of tetrad effects, fractionation trends), indicative of exposure to similar early-diagenetic conditions yet limited recent/late-diagenetic overprinting. Few outliers were observed in each dataset, and these may reflect the presence of heterogeneous preservational microenvironments within the host facies or attritional inputs into the mass-death assemblage, as hypothesized by Snyder et al. [29].

5. Conclusions

We conclude that trace element signatures of fossil bones from the Neufeld Quarry and nearby HR Bonebed “Main Quarries” show strong concordance, namely, in the forms of overlapping magnitudes and ranges of trace element uptake, fractionation trends, and redox-sensitive anomaly values, and that these similarities cumulatively support the inference that the fossil assemblages exposed at these sites are laterally (and hence stratigraphically and taphonomically) equivalent. Recent stratigraphic analyses across the Hanson Ranch field area by two of us (A.C. and K.S.) independently suggest this same conclusion. Thus, this novel application of trace element analyses toward assessing lateral continuity of a bonebed across outcrops illustrates the potential of geochemical data to serve as a proxy for stratigraphic and taphonomic correlation, independent of sedimentologic and/or stratigraphic data. This new tool may be especially useful in future studies aiming to assess lateral continuity of outcrops exposing widespread fossil assemblages (i.e., mass-death bonebeds, channel lag deposits) in the fossil record, especially in formations such as the Lance and Hell Creek, which are well known for their abundance of lenticular strata, partial coverage of outcrops by vegetation, and isolated/disconnected outcrops due to stochastic patterns of modern erosion [29,115,116], all of which make traditional stratigraphic correlation difficult.

Supplementary Materials

The following supporting information can be downloaded at: https://www.mdpi.com/article/10.3390/min15090919/s1, Supplemental Data File S1: A DOCX file providing the literature sources for the environmental data shown in Figure 6A, as well as Figures S1–S3; Supplemental Data File S2: An XLSX file providing the raw concentration data acquired from each transect across each bone.

Author Contributions

Conceptualization, P.V.U.; methodology, P.V.U.; formal analysis, S.B., P.V.U. and R.D.A.; investigation, S.B. and P.V.U.; resources, K.S. and A.C.; data curation, S.B. and P.V.U.; writing—original draft preparation, S.B. and P.V.U.; writing—review and editing S.B., P.V.U., K.K.V., K.S. and A.C.; visualization, S.B., P.V.U. and K.K.V.; supervision, P.V.U.; project administration, P.V.U. and S.B.; funding acquisition, K.S. All authors have read and agreed to the published version of the manuscript.

Funding

Funding for this research was provided by Southern Adventist University and the University of North Dakota.

Data Availability Statement

All data generated by this study are available in this manuscript and its accompanying Supplementary Data files.

Acknowledgments

We thank the owners of Hanson Ranch for their ongoing support of scientific research on their property, as well as the multitude of community volunteers who aided in countless hours of excavations from all of the quarries mentioned herein, which made this study possible. Comments from the three reviewers greatly improved the manuscript.

Conflicts of Interest

The authors declare no conflicts of interest.

References

  1. Trueman, C.N. Rare earth element geochemistry and taphonomy of terrestrial vertebrate assemblages. Palaios 1999, 14, 555–568. [Google Scholar] [CrossRef]
  2. Trueman, C.N. Trace element geochemistry of bonebeds. In Bonebeds: Genesis, Analysis, and Paleobiological Significance; Rogers, R.R., Eberth, D.A., Fiorillo, A.R., Eds.; University of Chicago Press: Chicago, IL, USA, 2007; pp. 397–435. [Google Scholar]
  3. Keenan, S.W. From bone to fossil: A review of the diagenesis of bioapatite. Am. Mineral. 2016, 101, 1943–1951. [Google Scholar] [CrossRef]
  4. Suarez, C.A.; Morschhauser, E.M.; Suarez, M.B.; You, H.; Li, D.; Dodson, P. Rare earth element geochemistry of bone beds from the Lower Cretaceous Zhonggou Formation of Gansu Province, China. J. Vertebr. Vertebr. Paleontol. 2018, 38, 22–35. [Google Scholar] [CrossRef]
  5. Ullmann, P.V.; Voegele, K.K.; Grandstaff, D.E.; Ash, R.D.; Zheng, W.; Schroeter, E.R.; Schweitzer, M.H.; Lacovara, K.J. Molecular tests support the viability of rare earth elements as proxies for fossil biomolecule preservation. Sci. Rep. 2020, 10, 15566. [Google Scholar] [CrossRef]
  6. Herwartz, D.; Tütken, T.; Jochum, K.P.; Sander, P.M. Rare earth element systematics of fossil bone revealed by LA-ICPMS analysis. Geochim. Cosmochim. Acta 2013, 103, 161–183. [Google Scholar] [CrossRef]
  7. Williams, C.T.; Henderson, P.; Marlow, C.A.; Molleson, T.I. The environment of deposition indicated by the distribution of rare earth elements in fossil bones from Olduvai Gorge, Tanzania. Appl. Geochem. 1997, 12, 537–547. [Google Scholar] [CrossRef]
  8. Gueriau, P.; Bertrand, L. Deciphering exceptional preservation of fossils through trace elemental imaging. Microsc. Today 2015, 23, 20–25. [Google Scholar] [CrossRef]
  9. Metzger, C.A.; Terry, D.O.; Grandstaff, D.E. Effect of paleosol formation on rare earth element signatures in fossil bone. Geology 2004, 32, 497–500. [Google Scholar] [CrossRef]
  10. Grandstaff, D.E.; Terry, D.O. Rare earth element composition of Paleogene vertebrate fossils from Toadstool Geologic Park, Nebraska, USA. Appl. Geochem. 2009, 24, 733–745. [Google Scholar] [CrossRef]
  11. Goedert, J.; Amiot, R.; Arnaud-Godet, F.; Cuny, G.; Fourel, F.; Hernandez, J.-A.; Pedreira-Segade, U.; Lécuyer, C. Miocene (Burdigalian) seawater and air temperatures estimated from the geochemistry of fossil remains from the Aquitaine Basin, France. Palaeogeogr. Palaeoclimatol. Palaeoecol. 2017, 481, 14–28. [Google Scholar] [CrossRef]
  12. Decrée, S.; Herwartz, D.; Mercadier, J.; Miján, I.; de Buffrénil, V.; Leduc, T.; Lambert, O. The post-mortem history of a bone revealed by its trace element signature: The case of a fossil whale rostrum. Chem. Geol. 2018, 477, 137–150. [Google Scholar] [CrossRef]
  13. Ullmann, P.V.; Ash, R.D.; Scannella, J.B. Taphonomic and diagenetic pathways to protein preservation, part II: The case of Brachylophosaurus canadensis specimen MOR 2598. Biology 2022, 11, 1177. [Google Scholar] [CrossRef]
  14. Trueman, C.N.; Palmer, M.R.; Field, J.; Privat, K.; Ludgate, N.; Chavagnac, V.; Eberth, D.A.; Cifelli, R.; Rogers, R.R. Comparing rates of recrystallisation and the potential for preservation of biomolecules from the distribution of trace elements in fossil bones. Comptes Rendus Palevol 2008, 7, 145–158. [Google Scholar] [CrossRef]
  15. Ullmann, P.V.; Grandstaff, D.E.; Ash, R.D.; Lacovara, K.J. Geochemical taphonomy of the Standing Rock Hadrosaur Site: Exploring links between rare earth elements and cellular and soft tissue preservation. Geochim. Cosmochim. Acta 2020, 269, 223–237. [Google Scholar] [CrossRef]
  16. Ullmann, P.V.; Macauley, K.; Ash, R.D.; Shoup, B.; Scannella, J.B. Taphonomic and diagenetic pathways to protein preservation, part I: The case of Tyrannosaurus rex specimen MOR 1125. Biology 2021, 10, 1193. [Google Scholar] [CrossRef] [PubMed]
  17. Trueman, C.N.; Benton, M.J. A Geochemical method to trace the taphonomic history of reworked bones in sedimentary settings. Geology 1997, 25, 263–266. [Google Scholar] [CrossRef]
  18. McLain, M.A.; Ullmann, P.V.; Ash, R.D.; Bohnstedt, K.; Nelsen, D.; Clark, R.O.; Brand, L.R.; Chadwick, A.V. Independent confirmation of fluvial reworking at a Lance Formation (Maastrichtian) bonebed by traditional and chemical taphonomic analyses. Palaios 2021, 36, 193–215. [Google Scholar] [CrossRef]
  19. Trueman, C.N.; Behrensmeyer, A.K.; Potts, R.; Tuross, N. High-resolution records of location and stratigraphic provenance from the rare earth element composition of fossil bones. Geochim. Cosmochim. Acta 2006, 70, 4343–4355. [Google Scholar] [CrossRef]
  20. Ivanova, V.V.; Nikolskiy, P.A.; Basilyan, A.E. Stratigraphic interpretation of rare earth element signatures in Pleistocene mammal bones: A case study from Kharabai Site, east Siberia. Quatern. Int. 2017, 445, 279–288. [Google Scholar] [CrossRef]
  21. Kocsis, L.; Ulianov, A.; Mouflih, M.; Khaldoune, F.; Gheerbrant, E. Geochemical investigation of the taphonomy, stratigraphy, and palaeoecology of the mammals from the Ouled Abdoun Basin (Paleocene-Eocene of Morocco). Palaeogeogr. Palaeoclimatol. Palaeocl. 2021, 577, 110523. [Google Scholar] [CrossRef]
  22. Kocsis, L.; Botfalvai, G.; Qamarina, Q.; Razak, H.; Király, E.; Lugli, F.; Wings, O.; Lambertz, M.; Raven, H.; Briguglio, A.; et al. Geochemical analyses suggest stratigraphic origin and Late Miocene age of reworked vertebrate remains from Penanjong Beach in Brunei Darussalam (Borneo). Hist. Biol. 2021, 33, 2627–2638. [Google Scholar] [CrossRef]
  23. Trueman, C.N. Chemical taphonomy of biomineralized tissues. Palaeontology 2013, 56, 475–486. [Google Scholar] [CrossRef]
  24. McCormack, J.M.; Bahr, A.; Gerdes, A.; Tütken, T.; Prinz-Grimm, P. Preservation of successive diagenetic stages in Middle Triassic bonebeds: Evidence from in situ trace element and strontium isotope analysis of vertebrate fossils. Chem. Geol. 2015, 410, 108–123. [Google Scholar] [CrossRef]
  25. Greene, S.; Heaman, L.M.; DuFrane, S.A.; Williamson, T.; Currie, P.J. Introducing a geochemical screen to identify geologically meaningful U-Pb dates in fossil teeth. Chem. Geol. 2018, 493, 1–15. [Google Scholar] [CrossRef]
  26. Grimstead, D.N.; Clark, A.E.; Rezac, A. Uranium and vanadium concentrations as a trace element method for identifying diagenetically altered bone in the inorganic phase. J. Archaeol. Method Theory 2018, 25, 689–704. [Google Scholar] [CrossRef]
  27. Chernicoff, S. Essentials of Geology; Worth Publishers: New York, NY, USA, 1997. [Google Scholar]
  28. Kocsis, L.; Trueman, C.N.; Palmer, M.R. Protracted diagenetic alteration of REE contents in fossil bioapatites: Direct evidence from Lu-Hf isotope systematics. Geochim. Cosmochim. Acta 2010, 74, 6077–6092. [Google Scholar] [CrossRef]
  29. Snyder, K.; McLain, M.; Wood, J.; Chadwick, A. Over 13,000 elements from a single bonebed help elucidate disarticulation and transport of an Edmontosaurus thanatocoenosis. PLoS ONE 2020, 15, e0233182. [Google Scholar] [CrossRef]
  30. Ullmann, P.V.; Caputo, C.; Snyder, K.; Chadwick, A.; Ash, R.D. Trace element taphonomy of the Hanson Ranch Edmontosaurus bonebed supports its origin via transportation of a mass death assemblage. Chem. Geol. 2025, 672, 122501. [Google Scholar] [CrossRef]
  31. Gromet, L.P.; Haskin, L.A.; Korotev, R.L.; Dymek, R.F. The “North American Shale Composite”: Its compilation, major and trace element characteristics. Geochim. Cosmochim. Acta 1984, 48, 2469–2482. [Google Scholar] [CrossRef]
  32. Haskin, L.A.; Haskin, M.A.; Frey, F.A.; Wildeman, T.R. Relative and absolute terrestrial abundances of the rare earths. In Origin and Distribution of the Elements; Ahrens, L.H., Ed.; International Series of Monographs in Earth Sciences; Pergamon: Oxford, UK, 1968; pp. 889–912. [Google Scholar]
  33. Lumiste, K.; Lang, L.; Paiste, P.; Lepland, A.; Kirsimäe, K. Heterogeneous REE + Y distribution in early Paleozoic shelly phosphorites: Implications for enrichment mechanisms. Chem. Geol. 2021, 586, 120590. [Google Scholar] [CrossRef]
  34. Tostevin, R.; Shields, G.A.; Tarbuck, G.M.; He, T.; Clarkson, M.O.; Wood, R.A. Effective use of cerium anomalies as a redox proxy in carbonate-dominated marine settings. Chem. Geol. 2016, 438, 146–162. [Google Scholar] [CrossRef]
  35. Monecke, T.; Kempe, U.; Monecke, J.; Sala, M.; Wolf, D. Tetrad effect in rare earth element distribution patterns: A method of quantification with application to rock and mineral samples from granite-related rare metal deposits. Geochim. Cosmochim. Acta 2002, 66, 1185–1196. [Google Scholar] [CrossRef]
  36. Kohn, M.J. Models of diffusion-limited uptake of trace elements in fossils and rates of fossilization. Geochim. Cosmochim. Acta 2008, 72, 3758–3770. [Google Scholar] [CrossRef]
  37. Ferrante, C.; Cavin, L.; Vennemann, T.; Martini, R. Histology and geochemistry of Allosaurus (Dinosauria: Theropoda) from the Cleveland-Lloyd Dinosaur Quarry (Late Jurassic, Utah): Paleobiological implications. Front. Earth Sci. 2021, 9, 641060. [Google Scholar] [CrossRef]
  38. Schroeter, E.R.; Ullmann, P.V.; Macauley, K.; Ash, R.D.; Zheng, W.; Schweitzer, M.H.; Lacovara, K.J. Soft-tissue, rare earth element, and molecular analyses of Dreadnoughtus schrani, an exceptionally complete titanosaur from Argentina. Biology 2022, 11, 1158. [Google Scholar] [CrossRef] [PubMed]
  39. Abbott, A.N.; Haley, B.A.; McManus, J.; Reimers, C.E. The sedimentary flux of dissolved rare earth elements to the ocean. Geochim. Cosmochim. Acta 2015, 154, 186–200. [Google Scholar] [CrossRef]
  40. Åström, M.; Corin, N. Distribution of rare earth elements in anionic, cationic and particulate fractions in boreal humus-rich streams affected by acid sulphate soils. Water Res. 2003, 37, 273–280. [Google Scholar] [CrossRef]
  41. Barroux, G.; Sonke, J.E.; Boaventura, G.; Viers, J.; Godderis, Y.; Bonnet, M.-P.; Sondag, F.; Gardoll, S.; Lagane, C.; Seyler, P. Seasonal dissolved rare earth element dynamics of the Amazon River main stem, its tributaries, and the Curuaí floodplain. Geochem. Geophys. Geosyst. 2006, 7, Q12005. [Google Scholar] [CrossRef]
  42. Bau, M.; Dulski, P. Anthropogenic origin of positive gadolinium anomalies in river waters. Earth Planet. Sci. Lett. 1996, 143, 245–255. [Google Scholar] [CrossRef]
  43. Bau, M.; Knappe, A.; Dulski, P. Anthropogenic gadolinium as a micropollutant in river waters in Pennsylvania and in Lake Erie, northeastern United States. Geochemistry 2006, 66, 143–152. [Google Scholar] [CrossRef]
  44. Bayon, G.; Birot, D.; Ruffine, L.; Caprais, J.-C.; Ponzevera, E.; Bollinger, C.; Donval, J.-P.; Charlou, J.-L.; Voisset, M.; Grimaud, S. Evidence for intense REE scavenging at cold seeps from the Niger Delta margin. Earth Planet. Sci. Lett. 2011, 312, 443–452. [Google Scholar] [CrossRef]
  45. Biddau, R.; Cidu, R.; Frau, F. Rare earth elements in waters from the albitite-bearing granodiorites of Central Sardinia, Italy. Chem. Geol. 2002, 182, 1–14. [Google Scholar] [CrossRef]
  46. Bwire Ojiambo, S.; Lyons, W.B.; Welch, K.A.; Poreda, R.J.; Johannesson, K.H. Strontium isotopes and rare earth elements as tracers of groundwater-lake water interactions, Lake Naivasha, Kenya. Appl. Geochem. 2003, 18, 1789–1805. [Google Scholar] [CrossRef]
  47. Censi, P.; Sposito, F.; Inguaggiato, C.; Zuddas, P.; Inguaggiato, S.; Venturi, M. Zr, Hf and REE distribution in river water under different ionic strength conditions. Sci. Total Environ. 2018, 645, 837–853. [Google Scholar] [CrossRef] [PubMed]
  48. Centeno, L.M.; Faure, G.; Lee, G.; Talnagi, J. Fractionation of chemical elements including the REEs and 226Ra in stream contaminated with coal-mine effluent. Appl. Geochem. 2004, 19, 1085–1095. [Google Scholar] [CrossRef]
  49. Chevis, D.A.; Johannesson, K.H.; Burdige, D.J.; Tang, J.; Moran, S.B.; Kelly, R.P. Submarine groundwater discharge of rare earth elements to a tidally-mixed estuary in Southern Rhode Island. Chem. Geol. 2015, 397, 128–142. [Google Scholar] [CrossRef]
  50. de Baar, H.J.W.; Bacon, M.P.; Brewer, P.G. Rare-earth distributions with a positive Ce anomaly in the Western North Atlantic Ocean. Nature 1983, 301, 324–327. [Google Scholar] [CrossRef]
  51. de Baar, H.J.W.; Bruland, K.W.; Schijf, J.; van Heuven, S.M.A.C.; Behrens, M.K. Low cerium among the dissolved rare earth elements in the central North Pacific Ocean. Geochim. Cosmochim. Acta 2018, 236, 5–40. [Google Scholar] [CrossRef]
  52. De Carlo, E.H.; Green, W.J. Rare earth elements in the water column of Lake Vanda, McMurdo Dry Valleys, Antarctica. Geochim. Cosmochim. Acta 2002, 66, 1323–1333. [Google Scholar] [CrossRef]
  53. Elderfield, H.; Greaves, M.J. The rare earth elements in seawater. Nature 1982, 296, 214–219. [Google Scholar] [CrossRef]
  54. Elderfield, H.; Sholkovitz, E.R. Rare earth elements in the pore waters of reducing nearshore sediments. Earth Planet. Sc. Lett. 1987, 82, 280–288. [Google Scholar] [CrossRef]
  55. Elderfield, H.; Upstill-Goddard, R.; Sholkovitz, E.R. The rare earth elements in rivers, estuaries, and coastal seas and their significance to the composition of ocean waters. Geochim. Cosmochim. Acta 1990, 54, 971–991. [Google Scholar] [CrossRef]
  56. Esmaeili-Vardanjani, M.; Shamsipour-Dehkordi, R.; Eslami, A.; Moosaei, F.; Pazand, K. A study of differentiation pattern and rare earth elements migration in geochemical and hydrogeochemical environments of Airekan and Cheshmeh Shotori areas (Central Iran). Environ. Earth Sci. 2013, 68, 719–732. [Google Scholar] [CrossRef]
  57. Gammons, C.H.; Wood, S.A.; Pedrozo, F.; Varekamp, J.C.; Nelson, B.J.; Shope, C.L.; Baffico, G. Hydrogeochemistry and rare earth element behavior in a volcanically acidified watershed in Patagonia, Argentina. Chem. Geol. 2005, 222, 249–267. [Google Scholar] [CrossRef]
  58. Gammons, C.H.; Wood, S.A.; Nimick, D.A. Diel behavior of rare earth elements in a mountain stream with acidic to neutral pH. Geochim. Cosmochim. Acta 2005, 69, 3747–3758. [Google Scholar] [CrossRef]
  59. Garcia-Solsona, E.; Jeandel, C.; Labatut, M.; Lacan, F.; Vance, D.; Chavagnac, V.; Pradoux, C. Rare earth elements and Nd isotopes tracing water mass mixing and particle-seawater interactions in the SE Atlantic. Geochim. Cosmochim. Acta 2014, 125, 351–372. [Google Scholar] [CrossRef]
  60. German, C.R.; Holliday, B.P.; Elderfield, H. Redox cycling of rare earth elements in the suboxic zone of the Black Sea. Geochim. Cosmochim. Acta 1991, 55, 3553–3558. [Google Scholar] [CrossRef]
  61. German, C.R.; Masuzawa, T.; Greaves, M.J.; Elderfield, H.; Edmond, J.M. Dissolved rare earth elements in the Southern Ocean: Cerium oxidation and the influence of hydrography. Geochim. Cosmochim. Acta 1995, 59, 1551–1558. [Google Scholar] [CrossRef]
  62. Goldstein, S.J.; Jacobsen, S.B. Rare earth elements in river waters. Earth Planet. Sc. Lett. 1988, 89, 35–47. [Google Scholar] [CrossRef]
  63. Grenier, M.; Jeandel, C.; Lacan, F.; Vance, D.; Venchiarutti, C.; Cros, A.; Cravatte, S. From the subtropics to the central equatorial Pacific Ocean: Neodymium isotopic composition and rare earth element concentration variations. J. Geophys. Res. Oceans 2013, 118, 592–618. [Google Scholar] [CrossRef]
  64. Haley, B.A.; Klinkhammer, G.P.; McManus, J. Rare earth elements in pore waters of marine sediments. Geochim. Cosmochim. Acta 2004, 68, 1265–1279. [Google Scholar] [CrossRef]
  65. Hathorne, E.C.; Stichel, T.; Brück, B.; Frank, M. Rare earth element distribution in the Atlantic sector of the Southern Ocean: The balance between particle scavenging and vertical supply. Mar. Chem. 2015, 177, 157–171. [Google Scholar] [CrossRef]
  66. Hongo, Y.; Obata, H.; Alibo, D.S.; Nozaki, Y. Spatial variations of rare earth elements in North Pacific surface water. J. Oceanogr. 2006, 62, 441–455. [Google Scholar] [CrossRef]
  67. Hoyle, J.; Elderfield, H.; Gledhill, A.; Greaves, M. The behaviour of the rare earth elements during mixing of river and sea waters. Geochim. Cosmochim. Acta 1984, 48, 143–149. [Google Scholar] [CrossRef]
  68. Jeandel, C.; Delattre, H.; Grenier, M.; Pradoux, C.; Lacan, F. Rare earth element concentrations and Nd isotopes in the Southeast Pacific Ocean. Geochem. Geophy. Geosyst. 2013, 14, 328–341. [Google Scholar] [CrossRef]
  69. Johannesson, K.H.; Lyons, W.B. Rare-earth element geochemistry of Colour Lake, an acidic freshwater lake on Axel Heiberg Island, Northwest Territories, Canada. Chem. Geol. 1995, 119, 209–223. [Google Scholar] [CrossRef]
  70. Johannesson, K.H.; Lyons, W.B.; Stetzenbach, K.J.; Byrne, R.H. The solubility control of rare earth elements in natural terrestrial waters and the significance of PO43- and CO32- in limiting dissolved rare earth concentrations: A review of recent information. Aquat. Geochem. 1995, 1, 157–173. [Google Scholar] [CrossRef]
  71. Johannesson, K.H.; Stetzenbach, K.J.; Hodge, V.F. Rare earth elements as geochemical tracers of regional groundwater mixing. Geochim. Cosmochim. Acta 1997, 61, 3605–3618. [Google Scholar] [CrossRef]
  72. Johannesson, K.H.; Farnham, I.M.; Guo, C.; Stetzenbach, K.J. Rare earth element fractionation and concentration variations along a groundwater flow path within a shallow, basin-fill aquifer, southern Nevada, USA. Geochim. Cosmochim. Acta 1999, 63, 2697–2708. [Google Scholar] [CrossRef]
  73. Johannesson, K.H.; Tang, J.; Daniels, J.M.; Bounds, W.J.; Burdige, D.J. Rare earth element concentrations and speciation in organic-rich blackwaters of the Great Dismal Swamp, Virginia, USA. Chem. Geol. 2004, 209, 271–294. [Google Scholar] [CrossRef]
  74. Johannesson, K.H.; Palmore, C.D.; Fackrell, J.; Prouty, N.G.; Swarzenski, P.W.; Chevis, D.A.; Telfeyan, K.; White, C.D.; Burdige, D.J. Rare earth element behavior during groundwater-seawater mixing along the Kona Coast of Hawaii. Geochim. Cosmochim. Acta 2017, 198, 229–258. [Google Scholar] [CrossRef]
  75. Kalender, L.; Aytimur, G. REE geochemistry of Euphrates River, Turkey. J. Chem. 2016, 2016, 1012021. [Google Scholar] [CrossRef]
  76. Kim, J.-H.; Torres, M.E.; Haley, B.A.; Kastner, M.; Pohlman, J.W.; Riedel, M.; Lee, Y.J. The effect of diagenesis and fluid migration on rare earth element distribution in fluids of the northern Cascadia accretionary margin. Chem. Geol. 2011, 291, 152–165. [Google Scholar] [CrossRef]
  77. Kulaksiz, S.; Bau, M. Contrasting behaviour of anthropogenic gadolinium and natural rare earth elements in estuaries and the gadolinium input into the North Sea. Earth Planet. Sc. Lett. 2007, 260, 361–371. [Google Scholar] [CrossRef]
  78. Kulaksiz, S.; Bau, M. Rare earth elements in the Rhine River, Germany: First case of anthropogenic lanthanum as a dissolved microcontaminant in the hydrosphere. Environ. Int. 2011, 37, 973–979. [Google Scholar] [CrossRef]
  79. Kulaksiz, S.; Bau, M. Anthropogenic gadolinium as a microcontaminant in tap water used as drinking water in urban areas and megacities. Appl. Geochem. 2011, 26, 1877–1885. [Google Scholar] [CrossRef]
  80. Leybourne, M.I.; Johannesson, K.H. Rare earth elements (REE) and yttrium in stream waters, stream sediments, and Fe-Mn oxyhydroxides: Fractionation, speciation, and controls over REE + Y patterns in the surface environment. Geochim. Cosmochim. Acta 2008, 72, 5962–5983. [Google Scholar] [CrossRef]
  81. Leybourne, M.I.; Goodfellow, W.D.; Boyle, D.R.; Hall, G.M. Rapid development of negative Ce anomalies in surface waters and contrasting REE patterns in groundwaters associated with Zn-Pb massive sulphide deposits. Appl. Geochem. 2000, 15, 695–723. [Google Scholar] [CrossRef]
  82. Liu, H.; Guo, H.; Xing, L.; Zhan, Y.; Li, F.; Shao, J.; Niu, H.; Liang, X.; Li, C. Geochemical behaviors of rare earth elements in groundwater along a flow path in the North China Plain. J. Asian Earth Sci. 2016, 117, 33–51. [Google Scholar] [CrossRef]
  83. Merschel, G.; Bau, M.; Schmidt, K.; Münker, C.; Dantas, E.L. Hafnium and neodymium isotopes and REY distribution in the truly dissolved, nanoparticulate/colloidal and suspended loads of rivers in the Amazon Basin, Brazil. Geochim. Cosmochim. Acta 2017, 213, 383–399. [Google Scholar] [CrossRef]
  84. Nozaki, Y.; Lerche, D.; Alibo, D.S.; Tsutsumi, M. Dissolved indium and rare earth elements in three Japanese rivers and Tokyo Bay: Evidence for anthropogenic Gd and In. Geochim. Cosmochim. Acta 2000, 64, 3975–3982. [Google Scholar] [CrossRef]
  85. Osborne, A.H.; Hathorne, E.C.; Schijf, J.; Plancherel, Y.; Böning, P.; Frank, M. The potential of sedimentary foraminiferal rare earth element patterns to trace water masses in the past. Geochem. Geophy. Geosyst. 2017, 18, 1550–1568. [Google Scholar] [CrossRef]
  86. Piepgras, D.J.; Jacobsen, S.B. The behavior of rare earth elements in seawater: Precise determination of variations in the North Pacific water column. Geochim. Cosmochim. Acta 1992, 56, 1851–1862. [Google Scholar] [CrossRef]
  87. Pokrovsky, O.S.; Viers, J.; Shirokova, L.S.; Shevchenko, V.P.; Filipov, A.S.; Dupré, B. Dissolved, suspended, and colloidal fluxes of organic carbon, major and trace elements in the Severnaya Dvina River and its tributary. Chem. Geol. 2010, 273, 136–149. [Google Scholar] [CrossRef]
  88. Rousseau, T.C.C.; Sonke, J.E.; Chmeleff, J.; van Beek, P.; Souhat, M.; Boaventura, G.; Seyler, P.; Jeandel, C. Rapid neodymium release to marine waters from lithogenic sediments in the Amazon estuary. Nat. Commun. 2015, 6, 7592. [Google Scholar] [CrossRef]
  89. Sholkovitz, E.R. The geochemistry of rare earth elements in the Amazon River estuary. Geochim. Cosmochim. Acta 1993, 57, 2181–2190. [Google Scholar] [CrossRef]
  90. Sholkovitz, E.R.; Landing, W.M.; Lewis, B.L. Ocean particle chemistry: The fractionation of rare earth elements between suspended particles and seawater. Geochim. Cosmochim. Acta 1994, 58, 1567–1579. [Google Scholar] [CrossRef]
  91. Smedley, P.L. The geochemistry of rare earth elements in groundwater from the Carnmenellis area, southwest England. Geochim. Cosmochim. Acta 1991, 55, 2767–2779. [Google Scholar] [CrossRef]
  92. Smith, C.; Liu, X.-M. Spatial and temporal distribution of rare earth elements in the Neuse River, North Carolina. Chem. Geol. 2018, 488, 34–43. [Google Scholar] [CrossRef]
  93. Tang, J.; Johannesson, K.H. Speciation of rare earth elements in natural terrestrial waters: Assessing the role of dissolved organic matter from the modeling approach. Geochim. Cosmochim. Acta 2003, 67, 2321–2339. [Google Scholar] [CrossRef]
  94. Tang, J.; Johannesson, K.H. Controls on the geochemistry of rare earth elements along a groundwater flow path in the Carrizo Sand aquifer, Texas, USA. Chem. Geol. 2006, 225, 156–171. [Google Scholar] [CrossRef]
  95. van de Flierdt, T.; Pahnke, K.; Amakawa, H.; Andersson, P.; Basak, C.; Coles, B.; Colin, C.; Crocket, K.; Frank, M.; Frank, N.; et al. GEOTRACES intercalibration of neodymium isotopes and rare earth element concentrations in seawater and suspended particles. Part 1: Reproducibility of results for the international intercomparison. Limnol. Oceanogr. Methods 2012, 10, 234–251. [Google Scholar] [CrossRef]
  96. Wang, Z.-L.; Yamada, M. Geochemistry of dissolved rare earth elements in the Equatorial Pacific Ocean. Environ. Geol. 2007, 52, 779–787. [Google Scholar] [CrossRef]
  97. Zhang, J.; Nozaki, Y. Rare earth elements and yttrium in seawater: ICP-MS determinations in the East Caroline, Coral Sea, and South Fiji basins of the western South Pacific Ocean. Geochim. Cosmochim. Acta 1996, 60, 4631–4644. [Google Scholar] [CrossRef]
  98. Zheng, X.-Y.; Plancherel, Y.; Saito, M.A.; Scott, P.M.; Henderson, G.M. Rare earth elements (REEs) in the tropical South Atlantic and quantitative deconvolution of their non-conservative behavior. Geochim. Cosmochim. Acta 2016, 177, 217–237. [Google Scholar] [CrossRef]
  99. Kemp, R.A.; Trueman, C.N. Rare earth elements in Solnhofen biogenic apatite: Geochemical clues to the palaeoenvironment. Sediment. Geol. 2003, 155, 109–127. [Google Scholar] [CrossRef]
  100. Smirnova, E.V.; Mysovskaya, I.N.; Lozhkin, V.I.; Sandimirova, G.P.; Pakhomova, N.N.; Smagunova, A.A. Spectral interferences from polyatomic barium ions in inductively coupled plasma mass spectrometry. J. Appl. Spectrosc. 2006, 73, 911–917. [Google Scholar] [CrossRef]
  101. Pack, A.; Russell, S.S.; Shelley, J.M.G.; van Zuilen, M. Geo- and cosmochemistry of the twin elements yttrium and holmium. Geochim. Cosmochim. Acta 2007, 71, 4592–4608. [Google Scholar] [CrossRef]
  102. Kowal-Linka, M.; Jochum, K.P.; Surmik, D. LA-ICP-MS analysis of rare earth elements in marine reptile bones from the Middle Triassic bonebed (Upper Silesia, S Poland): Impact of long-lasting diagenesis, and factors controlling the uptake. Chem. Geol. 2014, 363, 213–228. [Google Scholar] [CrossRef]
  103. Kowal-Linka, M.; Jochum, K.P. Variability of trace element uptake in marine reptile bones from three Triassic sites (S Poland): Influence of diagenetic processes on the host rock and significance of the applied methodology. Chem. Geol. 2015, 397, 1–13. [Google Scholar] [CrossRef]
  104. Kohn, M.J.; Moses, R.J. Trace element diffusivities in bone rule out simple diffusive uptake during fossilization but explain in vivo uptake and release. Proc. Natl. Acad. Sci. USA 2013, 110, 419–424. [Google Scholar] [CrossRef]
  105. Bau, M. Controls on the fractionation of isovalent trace elements in magmatic and aqueous systems: Evidence from Y/Ho, Zr/Hf, and lanthanide tetrad effect. Contrib. Mineral. Petrol. 1996, 123, 323–333. [Google Scholar] [CrossRef]
  106. Herwartz, D.; Münker, C.; Tütken, T.; Hoffmann, J.E.; Wittke, A.; Barbier, B. Lu–Hf isotope systematics of fossil biogenic apatite and their effects on geochronology. Geochim. Cosmochim. Acta 2013, 101, 328–343. [Google Scholar] [CrossRef]
  107. Fadel, A.; Zigaite, Z.; Blom, H.; Perez-Huerta, A.; Jeffries, T.; Maersse, T.; Ahlberg, P.E. Palaeoenvironmental signatures revealed from rare earth element (REE) compositions of vertebrate microremains of the Vesiku Bone Bed (Homerian, Wenlock), Saaremaa Island, Estonia. Est. J. Earth Sci. 2015, 64, 36–41. [Google Scholar] [CrossRef]
  108. Navarre-Sitchler, A.; Brantley, S.L.; Rother, G. How porosity increases during incipient weathering of crystalline silicate rocks. Rev. Mineral. Geochem. 2015, 80, 331–354. [Google Scholar] [CrossRef]
  109. Hubert, J.F.; Panish, P.T.; Chure, D.J.; Prostak, K.S. Chemistry, microstructure, petrology, and diagenetic model of Jurassic dinosaur bones, Dinosaur National Monument, Utah. J. Sediment. Res. 1996, 66, 531–547. [Google Scholar] [CrossRef]
  110. Pfretzschner, H.-U. Pyrite in fossil bone. Neues Jahrb. Geol. P.-A. 2001, 220, 1–23. [Google Scholar] [CrossRef]
  111. Wings, O. Authigenic minerals in fossil bones from the Mesozoic of England: Poor correlation with depositional environments. Palaeogeogr. Palaeoclimatol. Palaeoecol. 2004, 204, 15–32. [Google Scholar] [CrossRef]
  112. Suarez, C.A.; Macpherson, G.L.; González, L.A.; Grandstaff, D.E. Heterogeneous rare earth element (REE) patterns and concentrations in a fossil bone: Implications for the use of REE in vertebrate taphonomy and fossilization history. Geochim. Cosmochim. Acta 2010, 74, 2970–2988. [Google Scholar] [CrossRef]
  113. Herwartz, D.; Tütken, T.; Münker, C.; Jochum, K.P.; Stoll, B.; Sander, P.M. Timescales and mechanisms of REE and Hf uptake in fossil bones. Geochim. Cosmochim. Acta 2011, 75, 82–105. [Google Scholar] [CrossRef]
  114. Trueman, C.N.; Behrensmeyer, A.K.; Tuross, N.; Weiner, S. Mineralogical and compositional changes in bones exposed on soil surfaces in Amboseli National Park, Kenya: Diagenetic mechanisms and the role of sediment pore fluids. J. Archaeol. Sci. 2004, 31, 721–739. [Google Scholar] [CrossRef]
  115. Hartman, J.H. Hell Creek Formation and the early picking of the Cretaceous-Tertiary boundary in the Williston Basin. In The Hell Creek Formation and the Cretaceous-Tertiary Boundary in the Northern Great Plains: An Integrated Continental Record of the End of the Cretaceous; Hartman, J.H., Johnson, K.R., Nichols, D.J., Eds.; Geological Society of America Special Paper 361; Geological Society of America: Boulder, CO, USA, 2002; pp. 1–8. [Google Scholar]
  116. Hartman, J.H.; Butler, R.D.; Weiler, M.W.; Schumaker, K.K. Through the End of the Cretaceous in the Type Locality of the Hell Creek Formation in Montana and Adjacent Areas; Wilson, G.P., Clemens, W.A., Horner, J.R., Hartman, J.H., Eds.; Geological Society of America Special Paper 503; Geological Society of America: Boulder, CO, USA, 2014; pp. 89–122. [Google Scholar]
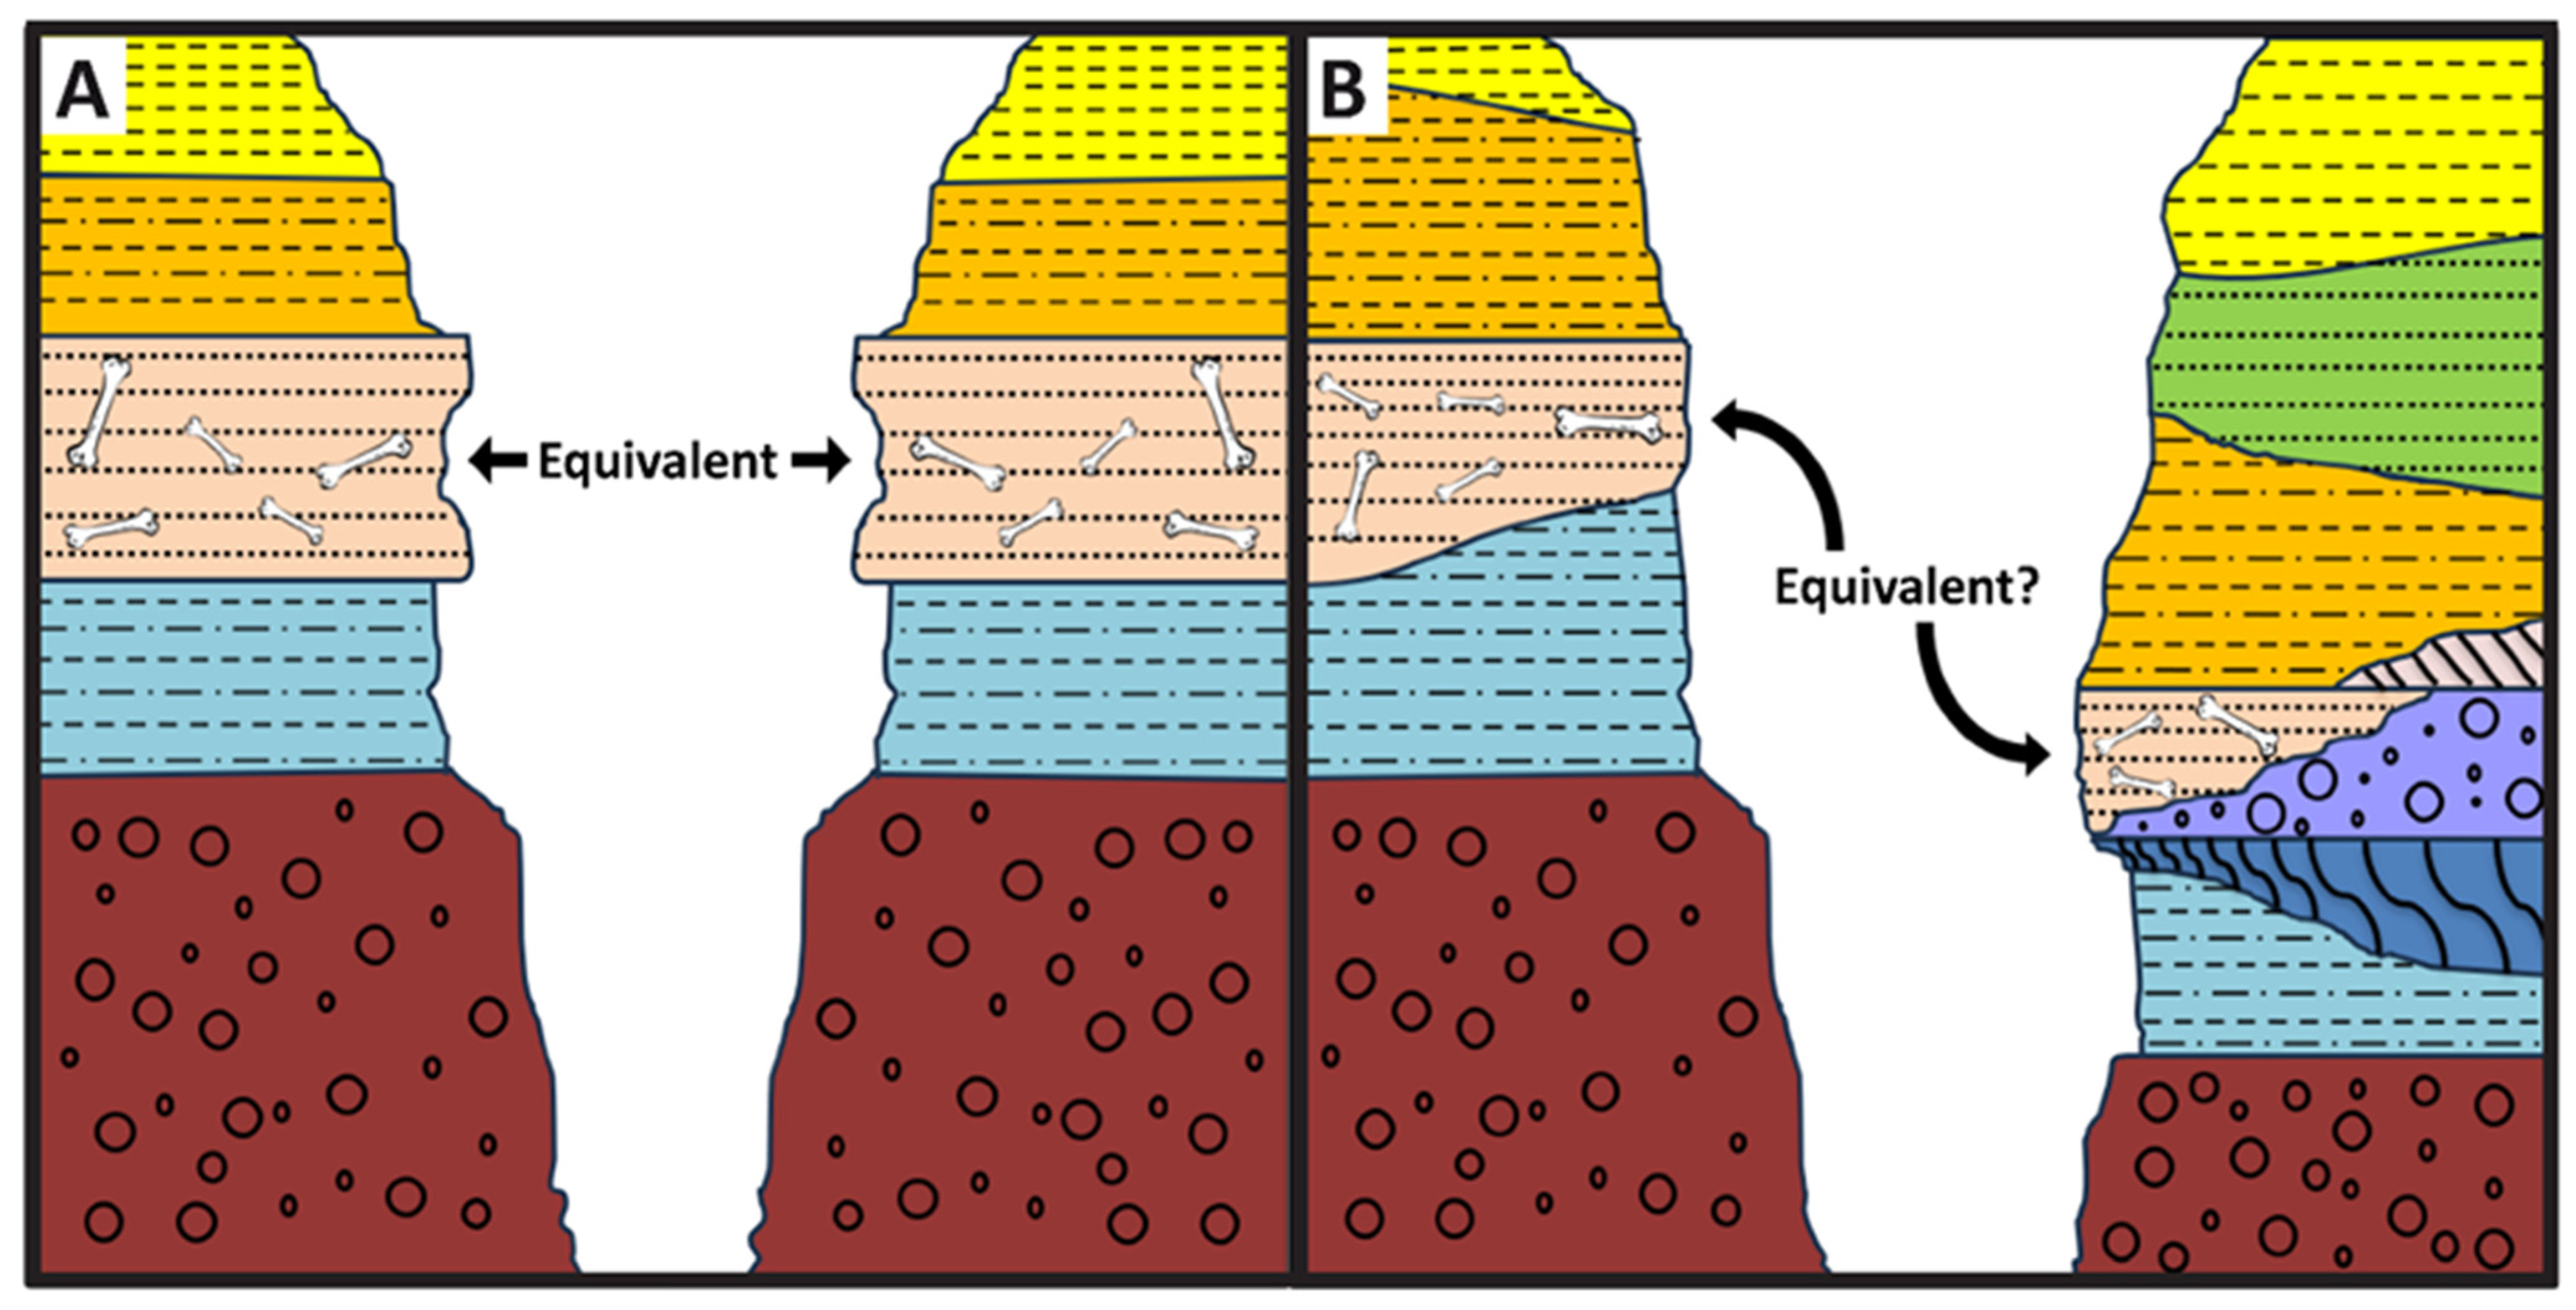
Figure 1. (A) An example of relatively easy stratigraphic correlation of two adjacent outcrops. (B) An example of challenging and potentially ambiguous stratigraphic correlation of the fossil bone layer (denoted by the bone symbols) involving discontinuous, lenticular, and/or deformed strata.
Minerals 15 00919 g001
Figure 2. (A) Location map of the Hanson Ranch (HR) Bonebed, showing outcrops of the Cretaceous Lance Formation in gray. The star represents the location of the Hanson Ranch property. (B) Three-dimensional aerial view of the Hanson Ranch field area highlighting the location of the “Main Quarries” and nearby Neufeld Quarry. Map in (A) modified from [29] under a CC BY-4.0 license.
Minerals 15 00919 g002
Figure 3. Intra-bone concentration profiles of lanthanum (La), shown in red, within Neufeld Quarry fossil bones. All specimens are skeletal elements of Edmontosaurus annectens. (A) Left dorsal rib HRS 20154. (B) Left dorsal rib HRS 20170. (C) Right dorsal rib HRS 20212. (D) Left radius HRS 20226. (E) Right ulna HRS 20284. (F) Right humerus HRS 20385. (G) Right pubis HRS 28397. Profiles of specimens HRS 20154 and 20212 cross the entire diameter of each respective bone. Laser tracks are denoted by the yellow line over each bone cross-section.
Minerals 15 00919 g003
Figure 4. La concentrations by cortical depth in fossil bone specimens from the (A) Neufeld Quarry and (B) HR Bonebed “Main Quarries”. The data in (B) derive from [30], Figure 3A. To account for any influence on the character of La profiles from histology, only specimens with a moderate to highly dense external cortex are presented in each graph (specifically, two highly porous specimens from the HR Bonebed “Main Quarries”, caudal centrum HRS 14517 and pedal phalanx HRS 16450, were removed from the original figure shown in panel (B)).
Minerals 15 00919 g004
Figure 5. NASC-normalized REE compositions of the outermost 250 μm of bones from the (A) Neufeld Quarry and (B) HR Bonebed “Main Quarries”. The graph in (B) is reproduced, with permission, from [30], Figure 3B.
Minerals 15 00919 g005
Figure 6. (A) Comparison of whole-bone averages of (La/Yb)N and (La/Sm)N ratios of HR Bonebed “Main Quarries” and Neufeld Quarry fossil bone specimens. The literature data for environmental samples are explained further in Supplementary Data File 1 and are as follows: [39,40,41,42,43,44,45,46,47,48,49,50,51,52,53,54,55,56,57,58,59,60,61,62,63,64,65,66,67,68,69,70,71,72,73,74,75,76,77,78,79,80,81,82,83,84,85,86,87,88,89,90,91,92,93,94,95,96,97,98]. (B) Whole-bone average REE compositions of Neufeld Quarry and HR Bonebed “Main Quarries” specimens. In each graph, black data points represent specimens from the HR Bonebed “Main Quarries”, whereas red data points represent specimens from the Neufeld Quarry. Data for HR Bonebed “Main Quarries” specimens were derived from [30].
Minerals 15 00919 g006
Figure 7. REE compositions divided into data from each individual laser transect (usually ~5 mm of data each), comparing Neufeld in red and pink and the “Main Quarries” in black and gray. External transects are denoted by diamonds, and internal transects are denoted by circles. The blue arrow shows the trend in direction from external transects to internal transects. The 2σ circle represents two standard deviations based on ±5% of the relative standard deviation.
Minerals 15 00919 g007
Figure 8. Spider diagrams of intra-bone NASC-normalized REE distribution patterns for each examined specimen from the Neufeld Quarry. Patterns recorded from the outermost cortex are indicated by solid black lines, those from deepest within each bone by dotted light gray lines (usually within more porous trabecular bone of the marrow cavity), and all other analyses in between by solid dark-gray lines. Specimens as indicated. Note the different ratio scales for each specimen. The data from specimens HRS 20154 and 20212 both derive from diameter cross-sections, which therefore have two REE profiles across the outermost cortex.
Minerals 15 00919 g008
Figure 9. REE compositions of individual laser transects expressed as NASC-normalized (La/Yb)N and (La/Sm)N ratios in specimens from (A) the Neufeld Quarry, (B) the HR Bonebed “Main Quarries”, and (C) the Rose Quarry. Transects including the external bone edge are denoted by black symbols, whereas all other (internal) transects are represented by colored symbols, with each unique color corresponding to a different fossil specimen. Insets in each panel display cortical depth-related trends for individual specimens (arrows), indicating the direction of data point migration for each bone from the external cortex inward. The graph in (B) is reproduced, with permission, from [30], Figure 5B. The graph in (C) is modified, with permission, from [18], Figure 14B.
Minerals 15 00919 g009
Figure 10. Intra-bone patterns of (Ce/Ce*)N, (Ce/Ce**)N, and (La/La*)N anomalies and Y/Ho ratios of Neufeld Quarry samples. (Ce/Ce*)N values (red curves), (Ce/Ce**)N values (black curves), and (La/La*)N anomalies (blue curves) were calculated as outlined in the last paragraph of Section 2. Y/Ho ratio data are presented as orange curves. Specimens as indicated. Note the different ratio scales for each specimen. Absence of (Ce/Ce*)N, (Ce/Ce**)N, and (La/La*)N anomalies occurs at 1.0.
Minerals 15 00919 g010
Figure 11. (Ce/Ce*)N vs. (Pr/Pr*)N plot (after [42]) of five-point averages along each transect recorded using LA-ICPMS on Neufeld Quarry specimens. (Ce/Ce*)N and (Pr/Pr*)N anomalies are calculated as described in Section 2 of the text.
Minerals 15 00919 g011
Figure 12. Box and whisker plots illustrating NASC-normalized REE concentrations within the outermost 250 μm of fossil bone samples (A) and whole-bone anomalies and BSI values (B). Red boxes correspond to specimens collected from the Neufeld Quarry, while black boxes represent those from the HR Bonebed “Main Quarries.” Panel (A) shows individual REE concentrations, while panel (B) highlights REE anomalies commonly used to assess diagenetic alteration and redox conditions. The solid line at ratio = 1 in panel (B) indicates the shale-normalized reference value for each metric. Outliers are displayed as individual points.
Minerals 15 00919 g012
Table 1. Summary of trace element anomalies and related calculations performed in this study, including brief explanations of how each is interpreted (reproduced, with permission, from [30], Table 1). The source of each equation is listed in the reference column. Abbreviation: MREE, middle rare earth element.
Trace Element MetricUtilityInterpretation of ValuesReferences
(Ce/Ce*)NRedox indicator>1 = reducing
<1 = oxidizing
[6]
(Ce/Ce**)NRedox indicator>1 = oxidizing
<1 = reducing
[6]
(La/La*)NIndicator of fractionation among
REE during uptake
1 = no fractionation; values of >1 and <1
indicate fractionation
[6]
(Pr/Pr*)NIndicator of fractionation among
REE during uptake
1 = no fractionation; values of >1 and <1
indicate fractionation
[6]
(Y/Y*)NIndicator of fractionation among
trace elements during uptake
1 = no fractionation; values of >1 and <1
indicate fractionation
[33]
(Eu/Eu*)NRedox indicator>1 = oxidizing
<1 = reducing
[34]
BSI (Bell Shaped Index)Indicator of fractionation among
REE during uptake
>1 = MREE enrichment
<1 = MREE depletion
[34]
T3 (Third Tetrad Effect)Track severity of tetrad effects on
REE uptake
0 = no tetrad effects; the more + or − the value, the greater the influence of tetrad effects[35]
Table 2. Average whole-bone trace element compositions of seven fossil specimens from the Neufeld Quarry. Numbers are averages of all transect data for each specimen. Manganese (Mn) and iron (Fe) are reported in weight percent (wt%); all other elements are in parts per million (ppm).
Element/RatioHRS Specimen Number
20154201702021220226202842038528397
Sc22195733111813
Mn0.360.390.390.370.330.350.32
Fe3.191.322.310.930.891.000.84
Sr4206453746503381439742813895
Y270372793509217314221
Ba3717480146093970446341314316
La1571773922853819860
Ce402450113152793436142
Pr394910957104015
Nd1271773722003912457
Sm2542774192213
Eu9132612375
Gd314810053153220
Tb58158243
Dy325310157182721
Ho7112113565
Er20305638161815
Tm2475222
Yb15224134121412
Lu2365222
Th2426020
U13102085125
∑REE874108724541336265932371
Y/Ho39513961566355
(Ce/Ce*)N1.201.131.290.971.081.151.10
(Ce/Ce**)N1.121.121.191.101.031.181.21
(La/La*)N0.880.990.851.290.921.061.22
(Pr/Pr*)N0.940.940.910.950.980.910.91
(Y/Y*)N1.611.381.491.642.022.131.90
(Eu/Eu*)N1.401.321.341.191.231.211.26
BSI1.061.231.190.980.920.961.12
T30.090.030.070.130.160.210.13
Table 3. Summary of attributes of the Neufeld Quarry specimens analyzed for trace element composition in this study. Relative ∑REE content categories are based on the values shown in Table 2. Abbreviations: DMD, double medium diffusion (sensu [36]); LREEs, light rare earth elements.
HRS
Specimen Number
Profile Type(s) in External CortexClear DMD Kink for LREEs?Relative Noise in Outer Cortex for LaREE Suggest Flow in Medullary Cavity?Relative ∑REE Content (Whole Bone)Relative Porosity of the Cortex
20154Simple diffusion, leachedNoLowNoModerateLow
20170Oversteepened, leachedNoLowNoHighLow
20212Simple diffusion, leachedNoLowYesHighModerate
20226Simple diffusionNoModerateNoHighModerate
20284Simple diffusionNoModerateNoLowModerate
20385Oversteepened, leachedNoModerateNoModerateHigh
28397DMDYesLowYesLowModerate
Disclaimer/Publisher’s Note: The statements, opinions and data contained in all publications are solely those of the individual author(s) and contributor(s) and not of MDPI and/or the editor(s). MDPI and/or the editor(s) disclaim responsibility for any injury to people or property resulting from any ideas, methods, instructions or products referred to in the content.