Article

Experimental Investigation of Kaolinite–Zeolite Transformation: Insights from Al-Habala Area Saprolite, Abha, Saudi Arabia

by
Ali Sarbast Khoshnaw
1,
Dana Nader Alismail
1,
Abdulwahab Muhammad Bello
2 and
Khalid Al-Ramadan
1,2,*
1
Geosciences Department, College of Petroleum Engineering and Geosciences, King Fahd University of Petroleum & Minerals, Dhahran 31261, Saudi Arabia
2
Center for Integrative Petroleum Research, College of Petroleum Engineering and Geosciences, King Fahd University of Petroleum & Minerals, Dhahran 31261, Saudi Arabia
*
Author to whom correspondence should be addressed.
Minerals 2025, 15(9), 920; https://doi.org/10.3390/min15090920
Submission received: 17 July 2025 / Revised: 14 August 2025 / Accepted: 22 August 2025 / Published: 29 August 2025
(This article belongs to the Special Issue Diagenetic and Paleoenvironmental Significance of Clay Minerals)

Abstract

This study investigates the synthesis of zeolite from kaolinite-rich saprolite from Al-Habala Area, Saudi Arabia, providing insights on kaolinite as an economically viable precursor for zeolite formation. This study was conducted using hydrothermal rectors with a 0.5 M Na2CO3 solution at temperatures of 150 °C, 200 °C, and 250 °C over a duration of 336 h. At 150 °C, the dissolution of the clay and feldspar grains began, forming amorphous silica, from which mordenite rods formed. Increased temperatures promoted the formation of cubic analcime crystals at 200 °C to well-developed trapezohedron aggregates at 250 °C. The mineralogical transformations were characterized using SEM, XRD, and ICP-OES analyses, revealing the role of temperature on the morphologies, compositional alteration, and decreasing Na concentrations correlating with the formation of analcime. The newly formed analcime closely matched the composition of natural analcime from different basins. The results confirm that saprolite can effectively serve as a medium for zeolite synthesis, highlighting its potential for cost-effective industrial applications and expanding the understanding of kaolinite-to-zeolite conversion pathways.

1. Introduction

Zeolites are significant aluminosilicates with a wide variety of industrial applications across various sectors, including the oil and gas industry, pharmaceuticals, environmental protection, and agriculture [1,2,3,4]. The synthesis of zeolites started in the late 1900s and continues to be investigated using a variety of precursors, solutions, and techniques [5,6]. Furthermore, zeolites are naturally found in hydrothermal vents, often coexisting with quartz in igneous or metamorphic rocks under temperatures less than 300 °C [1,7,8]. The extensive research on zeolites is primarily due to their ability to be synthesized from various precursors, yielding different types with distinctive morphologies [9,10].
Analcime is one of the well-known forms of zeolites that is utilized predominantly as sorbents in the oil and gas industry and in agriculture, and it exhibits a silica-poor composition and shows several morphologies—the most distinctive of which are the trapezohedron aggregates [9,10]. Additionally, analcime is found naturally in volcanic and metamorphic rocks [1]. However, several studies investigated the synthesis of analcime from clay-rich sedimentary rocks, usually in the presence of an alkaline medium and under temperatures varying from 100 to 300 °C, and demonstrated the possibility of synthesizing pure forms of zeolites [1,10,11], such as the studies of Jamil et al. under 160 °C [12]; Atta et al. under 180 °C [13]; and Moraes et al. under 210 °C [14].
Saprolite rocks are one of the most clay-rich rocks, specifically in kaolinite clay minerals, and the rock forms as a result of the intensive weathering of exposed basement rocks [15]. This process leads to high concentrations of clay minerals that are enriched during saprolitization [15]. The integration of zeolites in various applications often leads to high synthesis costs, highlighting the need for more cost-effective and feasible synthesis techniques [16]. Saprolites are abundant resources that are rich in aluminum and silica and are found in the laterite zone [15]. Utilizing saprolites can help reduce the expenses associated with sourcing pure aluminum and silica in laboratories [16]. Furthermore, the transformation pathway of kaolinite to zeolite is influenced by the precursor type, fluid chemistry, temperatures, and available minerals in the starting material [4]. Some of these minerals developed as part of the conversion process are economically valuable and exhibit a wide range of applications. For instance, mordenite, which represents a silica-rich zeolite, exhibits a distinctive crystal size and morphology, allowing its utilization in various sectors, including in fuel cells [17].
This study aims to experimentally investigate the conversion of kaolinite into zeolite using a saprolite sample from Al-Habala Area in Abha, Saudi Arabia, as the starting material. The process involves the use of hydrothermal reactors and the synthesis of a specific fluid to transform minerals by simulating natural geological conditions, providing insights into the complex dynamics of diagenesis [18,19].
Thus, the objectives of this study are as follows: (1) to examine the mineralogical and geochemical composition of saprolite, (2) to investigate the transformation mechanism of kaolinite into zeolite, and (3) to determine the role of zeolite types synthesized in the formation of the zeolite of interest.

2. Geologic Background

The saprolite sample was obtained specifically from the Al-Habala Area in Abha (18°06′4′′ N 42°50′14′′ E). The region is generally characterized by uplifted granitic complexes that were exposed to heavy weathering, creating a saprolite weathering profile. The saprolite thickness is 1–1.5 m, located at the base of the outcrop, showing no clear sedimentary structure (Figure 1).
According to the National Geological Database Portal, the Abha sample is located at an unconformity on top of the Khamis Mushayt Gneiss complex (km), which is part of the Arabian Shield Basement [20]. The km is Precambrian in age and inclusive of metamorphosed and folded orthogneiss, with an upper layer described as light in color and with a subhedral form [20]. These light materials could be the saprolites, in which the contact between the two units was described as difficult to categorize. The Khamis Mushayt Gneiss is located at the Abha quadrangle GM-075C, specifically at GM-5 Khamis Mushayt, and the km represents the magmatic basement part of the greater Biotite Granodiorite and Monzogranite Suite, which are overlain by unconformable surfaces across the same area [20]. It is generally deemed that saprolites are common in the Abha and Khamis Mushayt Regions due to rainfall and are Pleistocene to Holocene in age, developing as a large weathered body and diminishing over time due to erosion [20]. Additionally, this study represents the first attempt to characterize the saprolites at the Al-Habala Area.

3. Materials and Methods

3.1. Bulk X-Ray Diffraction (XRD) Analysis

A portion of the sample was designated for bulk XRD analysis. An approximate 10 g of the sample was weighed and manually disaggregated using a mortar and pestle to ensure uniform particle size and was then moved to an electric mortar and further powdered for measurement accuracy.

3.2. Clay Fraction X-Ray Diffraction (XRD) Analysis

Clay fraction XRD was conducted by disaggregating another part of the sample manually and transferring it to a vial with 40 mL of deionized water to create a uniform suspension and prepare it for ultrasonication for 20 min. During ultrasonication, high-frequency sound waves was applied to the sample to ensure thorough dispersion of the clay particles throughout the solution. The suspended clay was then moved to a different vial and centrifuged for 10 min at a rate of 6000 rpm. In centrifugation, the separation of clays from larger particles is facilitated through differential settling. The clay samples are then placed on discs and air-dried for 48 h to prepare them for analysis using the Malvern Empyrean PANalytical diffractometer equipped with Ni-filtered Cu k-α radiation. The analysis was conducted at a current of 40 mA and a voltage of 45 kV. The data was then analyzed via the Highscore Plus (v. 4.9) search–match module, equipped with a mineralogical library of ICDD PDF-2-2024, and the Retvield refinement was performed.

3.3. Thin Section Microscopy

Thin section petrography was conducted after preparing a standard petrographic thin section. The thin sections were injected with a blue resin to highlight porosities. The sample was then examined under an Olympus BX53F petrographic microscope equipped with both plane-polarized and cross-polarized light capabilities. This detailed microscopic examination allowed for a comprehensive assessment of the sample’s mineralogical composition, including the identification of major and accessory mineral phases and mineral textures.

3.4. Scanning Electron Microscopy (SEM)

The samples are prepared and coated with 5 nm layer of palladium–gold and analyzed using Quorum QR150R sputter coater. After coating, SEM analysis is conducted to understand and identify the morphology and distribution of minerals using both backscattered electron (BSE) detector and an Aztec energy dispersive X-ray spectrometer (EDX) in the Zeiss Gemini 550 scanning electron microscope, under a voltage of 15 keV and a tilt angle of 0–32°. Furthermore, SEM-EDX analysis was conducted to determine the elemental compositions of both framework and authigenic mineral phases.

3.5. Hydrothermal Reactors

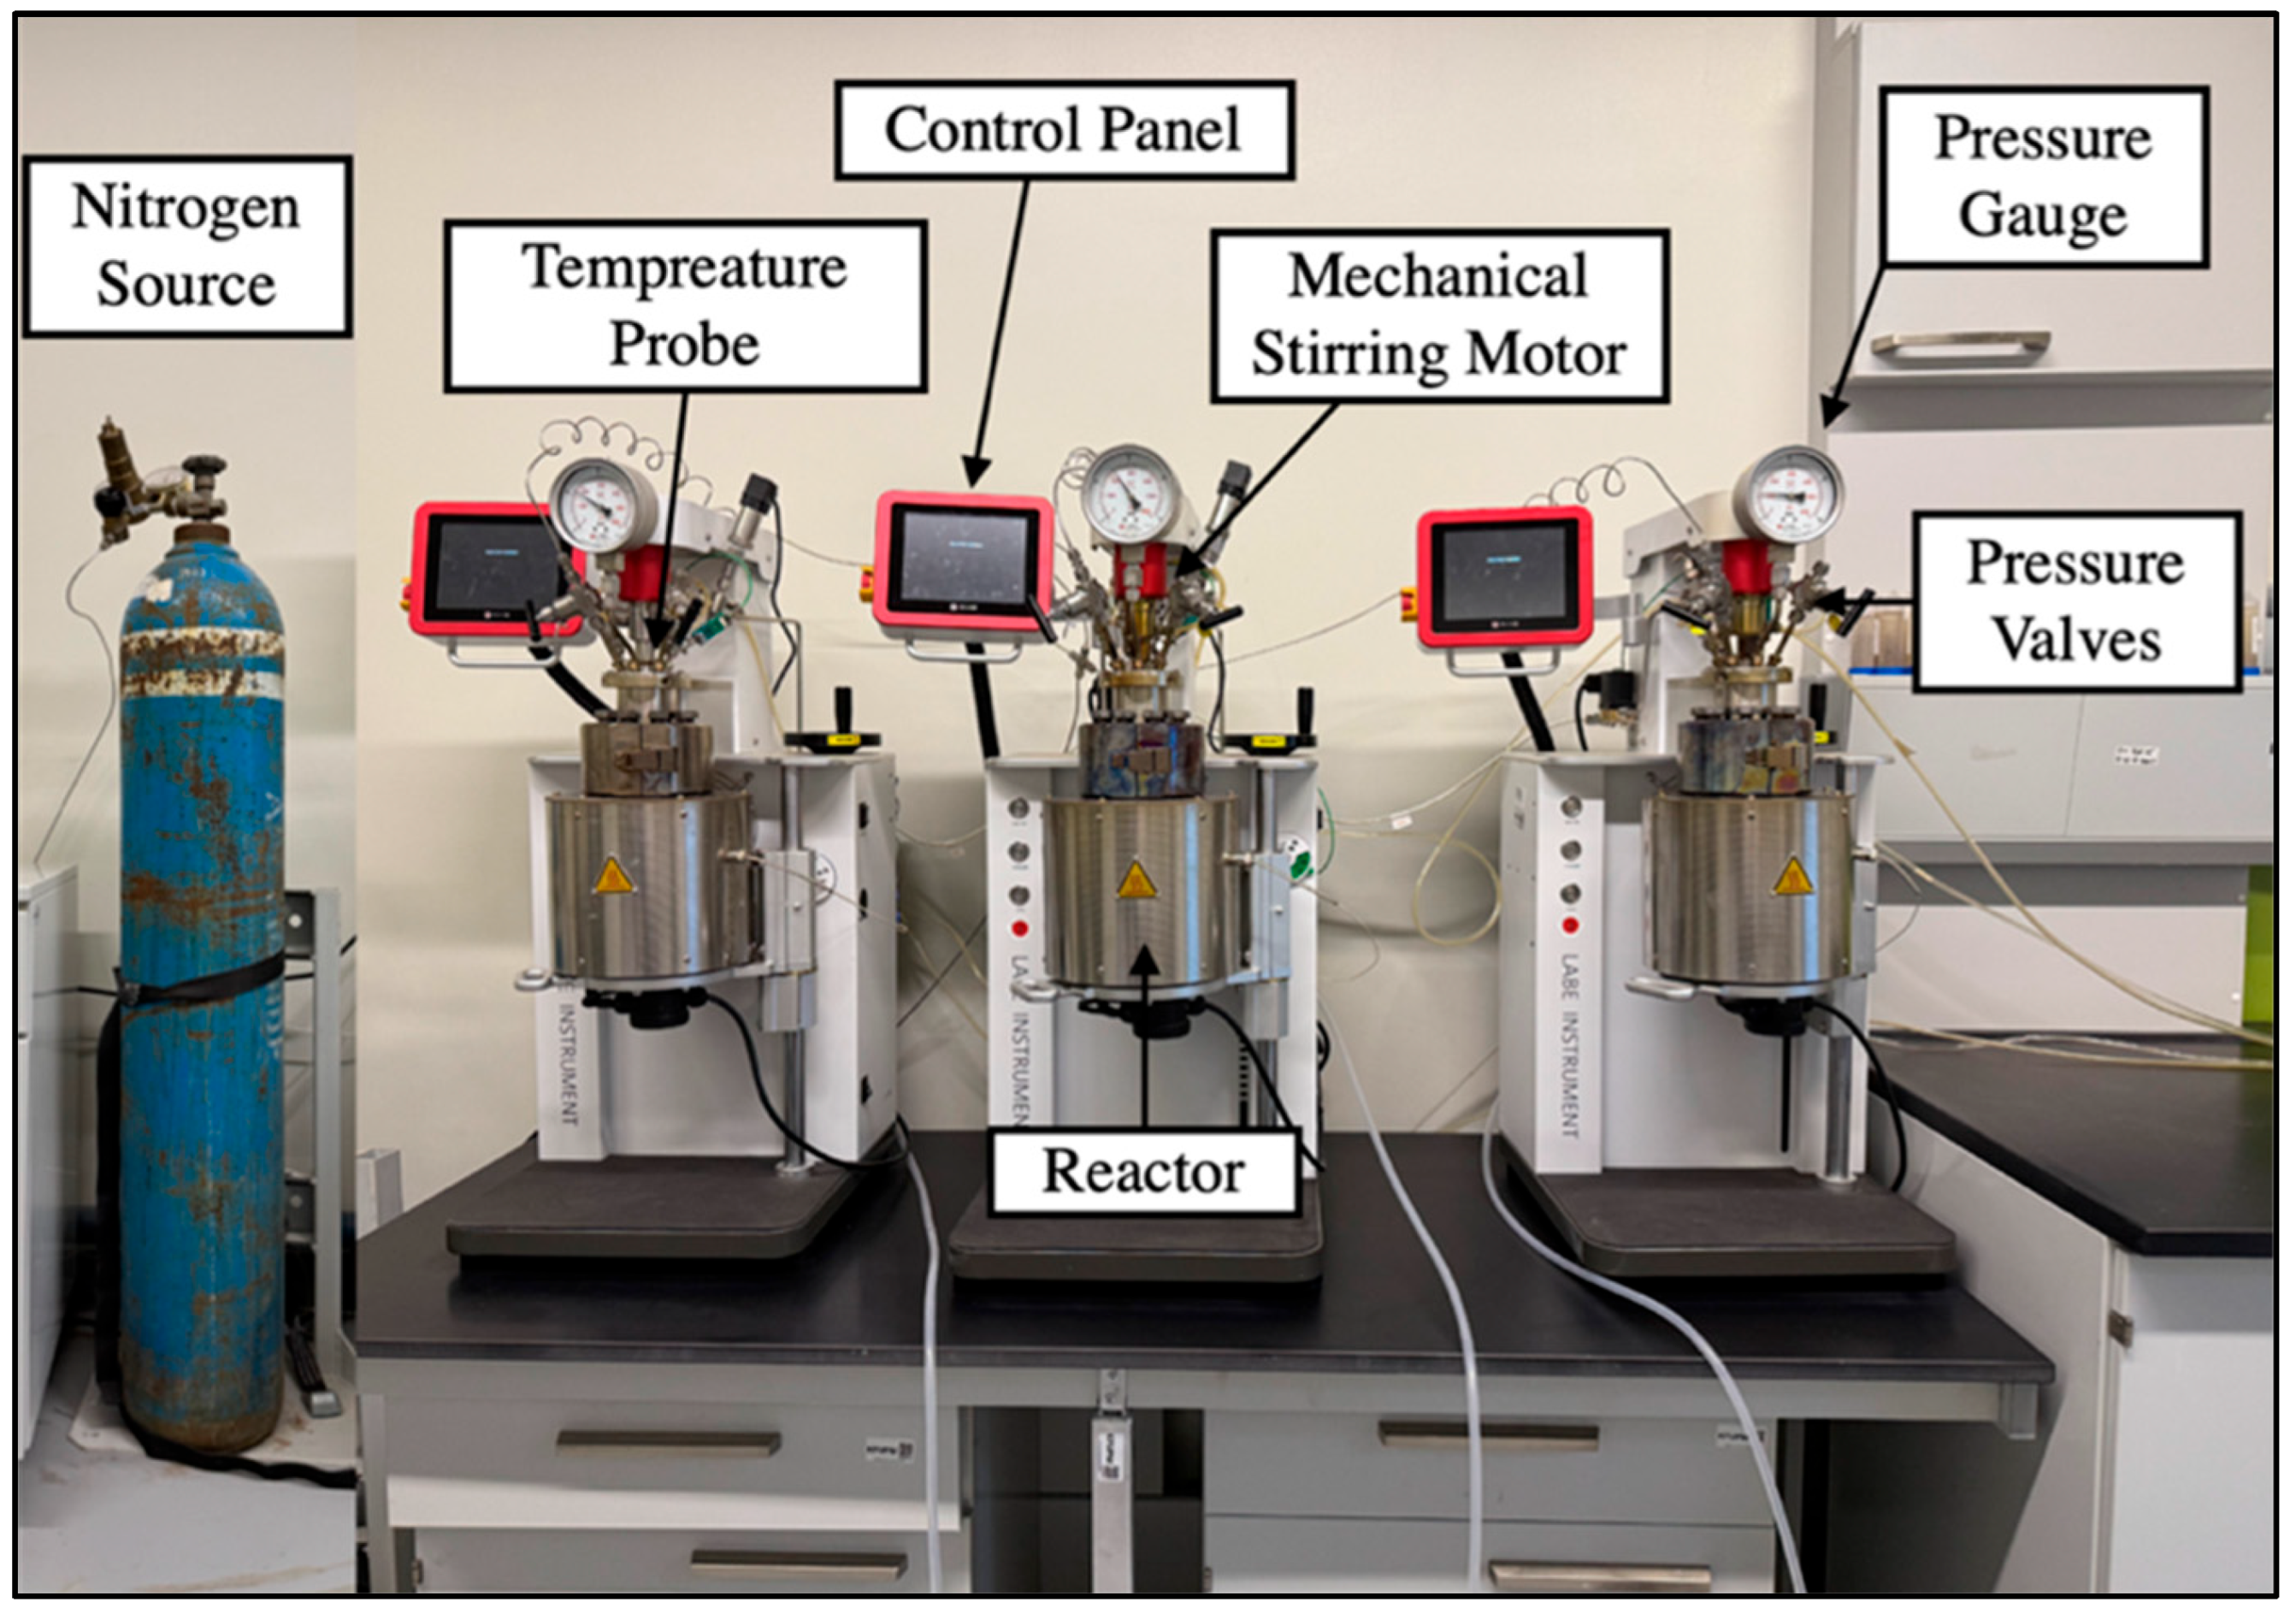
Bulk XRD analysis revealed a significant percentage of kaolinite in the saprolite sample (72.6%). Consequently, a series of hydrothermal reactor experiments were performed at the Experimental Diagenesis Laboratory, Centre for Integrative Petroleum Research, College of Petroleum Engineering and Petroleum Geoscience, at King Fahd University of Petroleum & Minerals, Saudi Arabia based on the criteria described by (Bello et al., 2022, 2025; Salisu et al., 2025a) [18,19]. The experiments were carried out using a system of hydrothermal reactors, manufactured by Lab Instruments (BSD500-HPHT), and connected to a nitrogen gas supply (Figure 2). These reactors facilitated the study of mineral transformations as they are capable of reaching temperatures up to 350 °C, under controlled conditions in 500 mL cylindrical pressure vessels. Given the high proportion of kaolinite identified in the sample, hydrothermal reactor experiments were conducted to induce mineralogical transformations under controlled laboratory conditions.
To convert kaolinite to zeolite, a reaction fluid composed of 200 mL of 0.5 M Na2CO3 for each experiment was used to facilitate the conversion. The experiment was conducted at three different temperatures: 150 °C, 200 °C, and 250 °C. The reaction was carried out under a pressure of 40 bars prior to heating, maintained using nitrogen gas. Each experimental run lasted for a duration of 336 h (14 days).

3.6. Inductively Coupled Plasma Optical Emission Spectroscopy (ICP-OES)

The solutions obtained from the hydrothermal reactor experiments were subject to ICP-OES analysis. This analysis was conducted at the Organic Geochemistry Laboratory, College of Petroleum Engineering and Geosciences, King Fahd University of Petroleum & Minerals, Saudi Arabia. The machine utilized was Plasma Quant 9000 ICP-OES (manufactured by Analytik Jena, Jena, Germany), which relies on plasma to detect the optical emissions of the required major cations of the analysis. These cations are specifically Na, Al, Ba, Ca, Li, and P.

3.7. Post-Synthesizing Analysis

Upon the completion of the hydrothermal reactor experiments, the solid samples were collected and allowed to dry for 48 h. The samples then underwent bulk XRD, clay fraction XRD, and SEM to evaluate mineralogical transformations and track variations in morphology following the experimental diagenesis.

4. Results

4.1. Mineralogical Composition of Starting Material

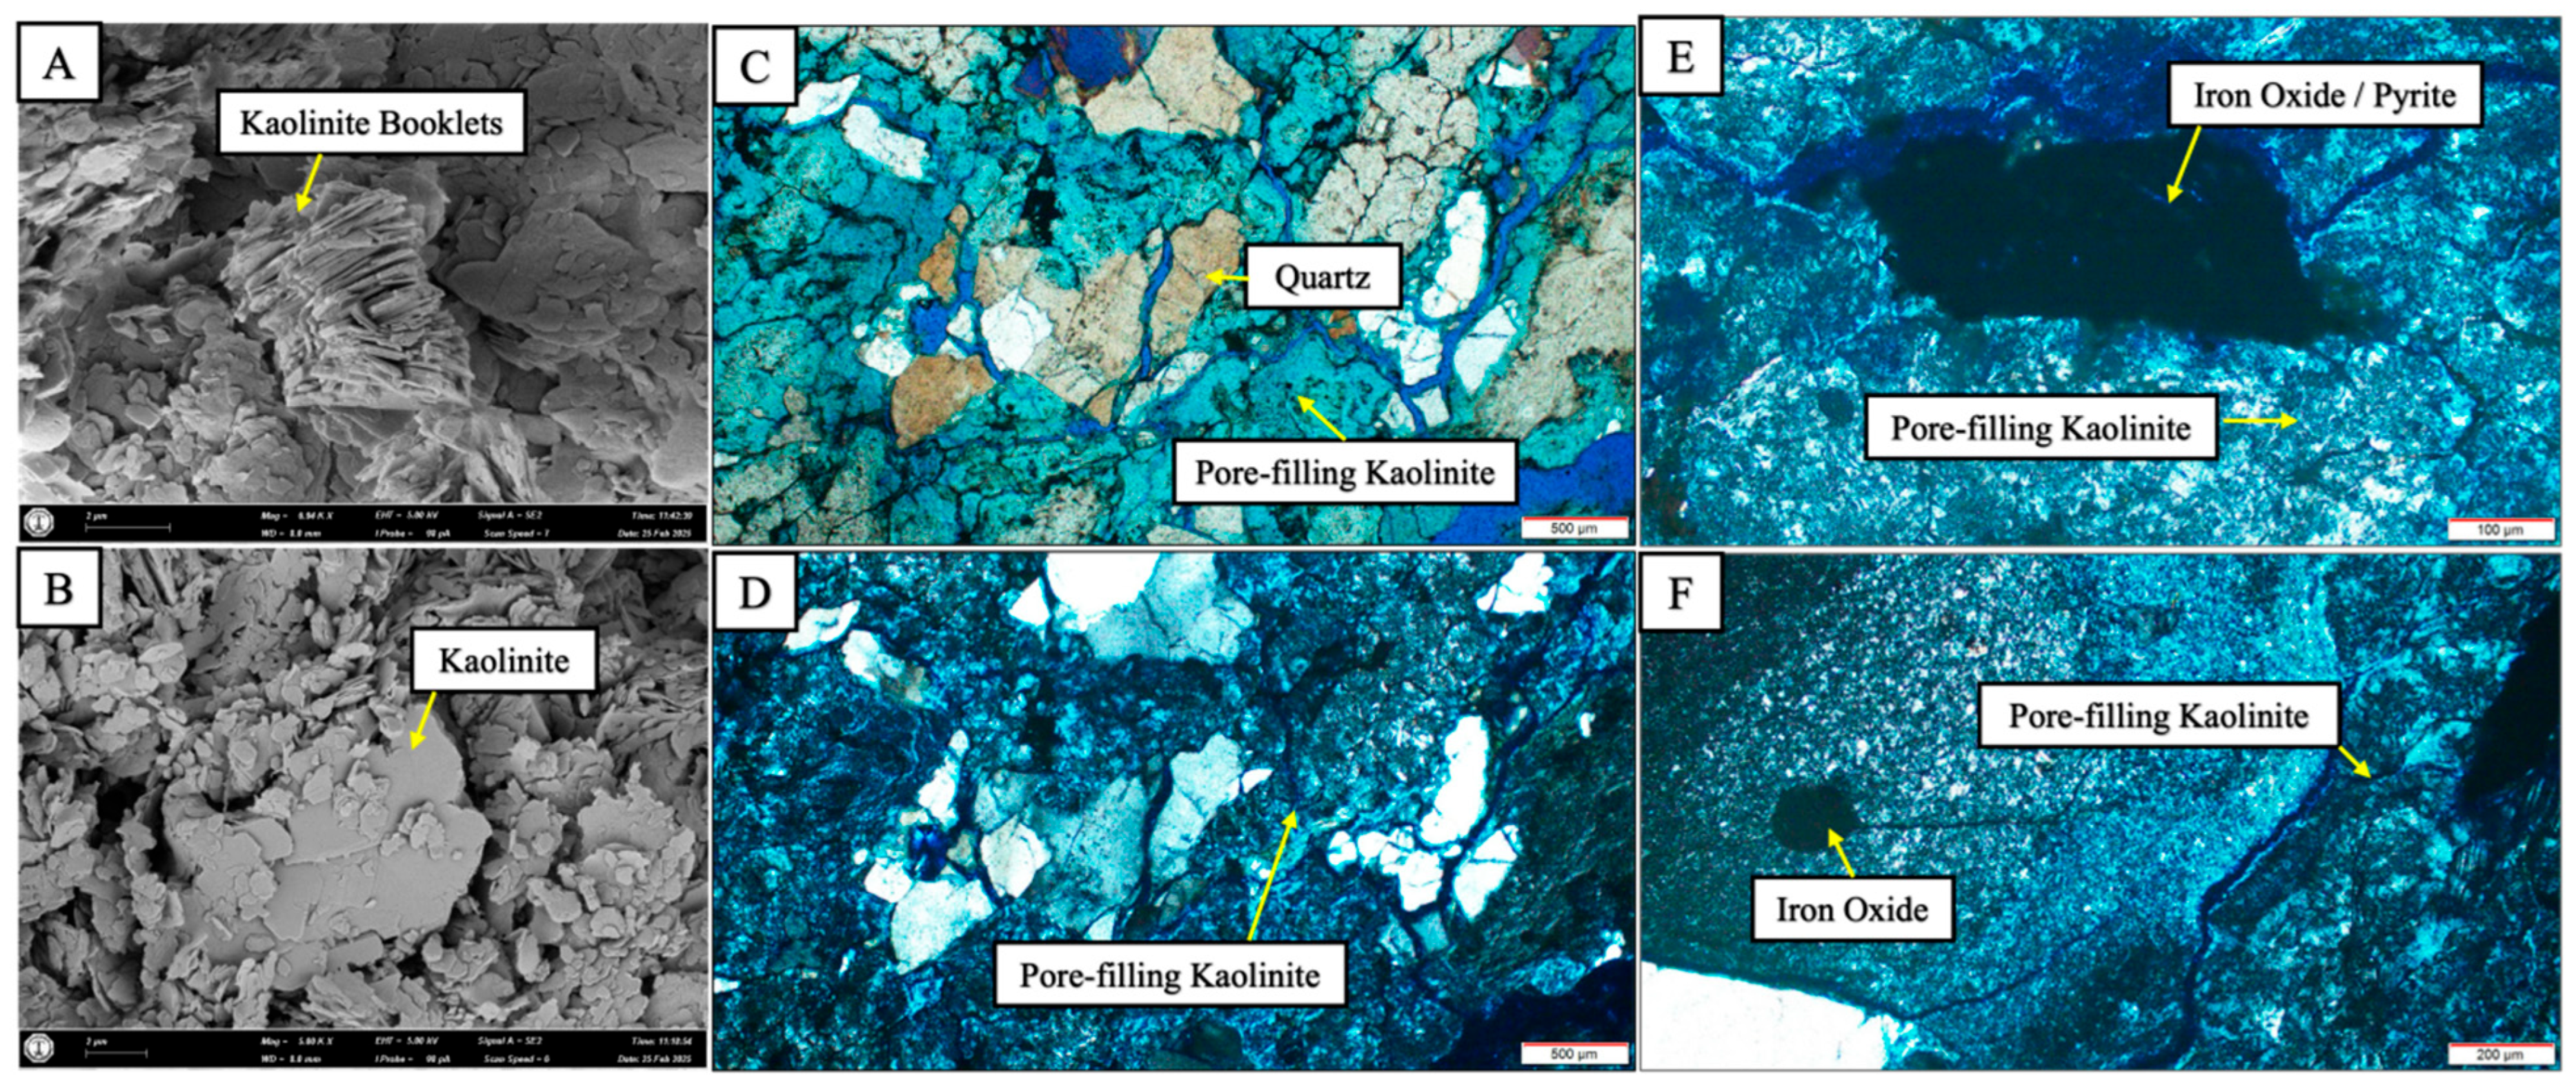
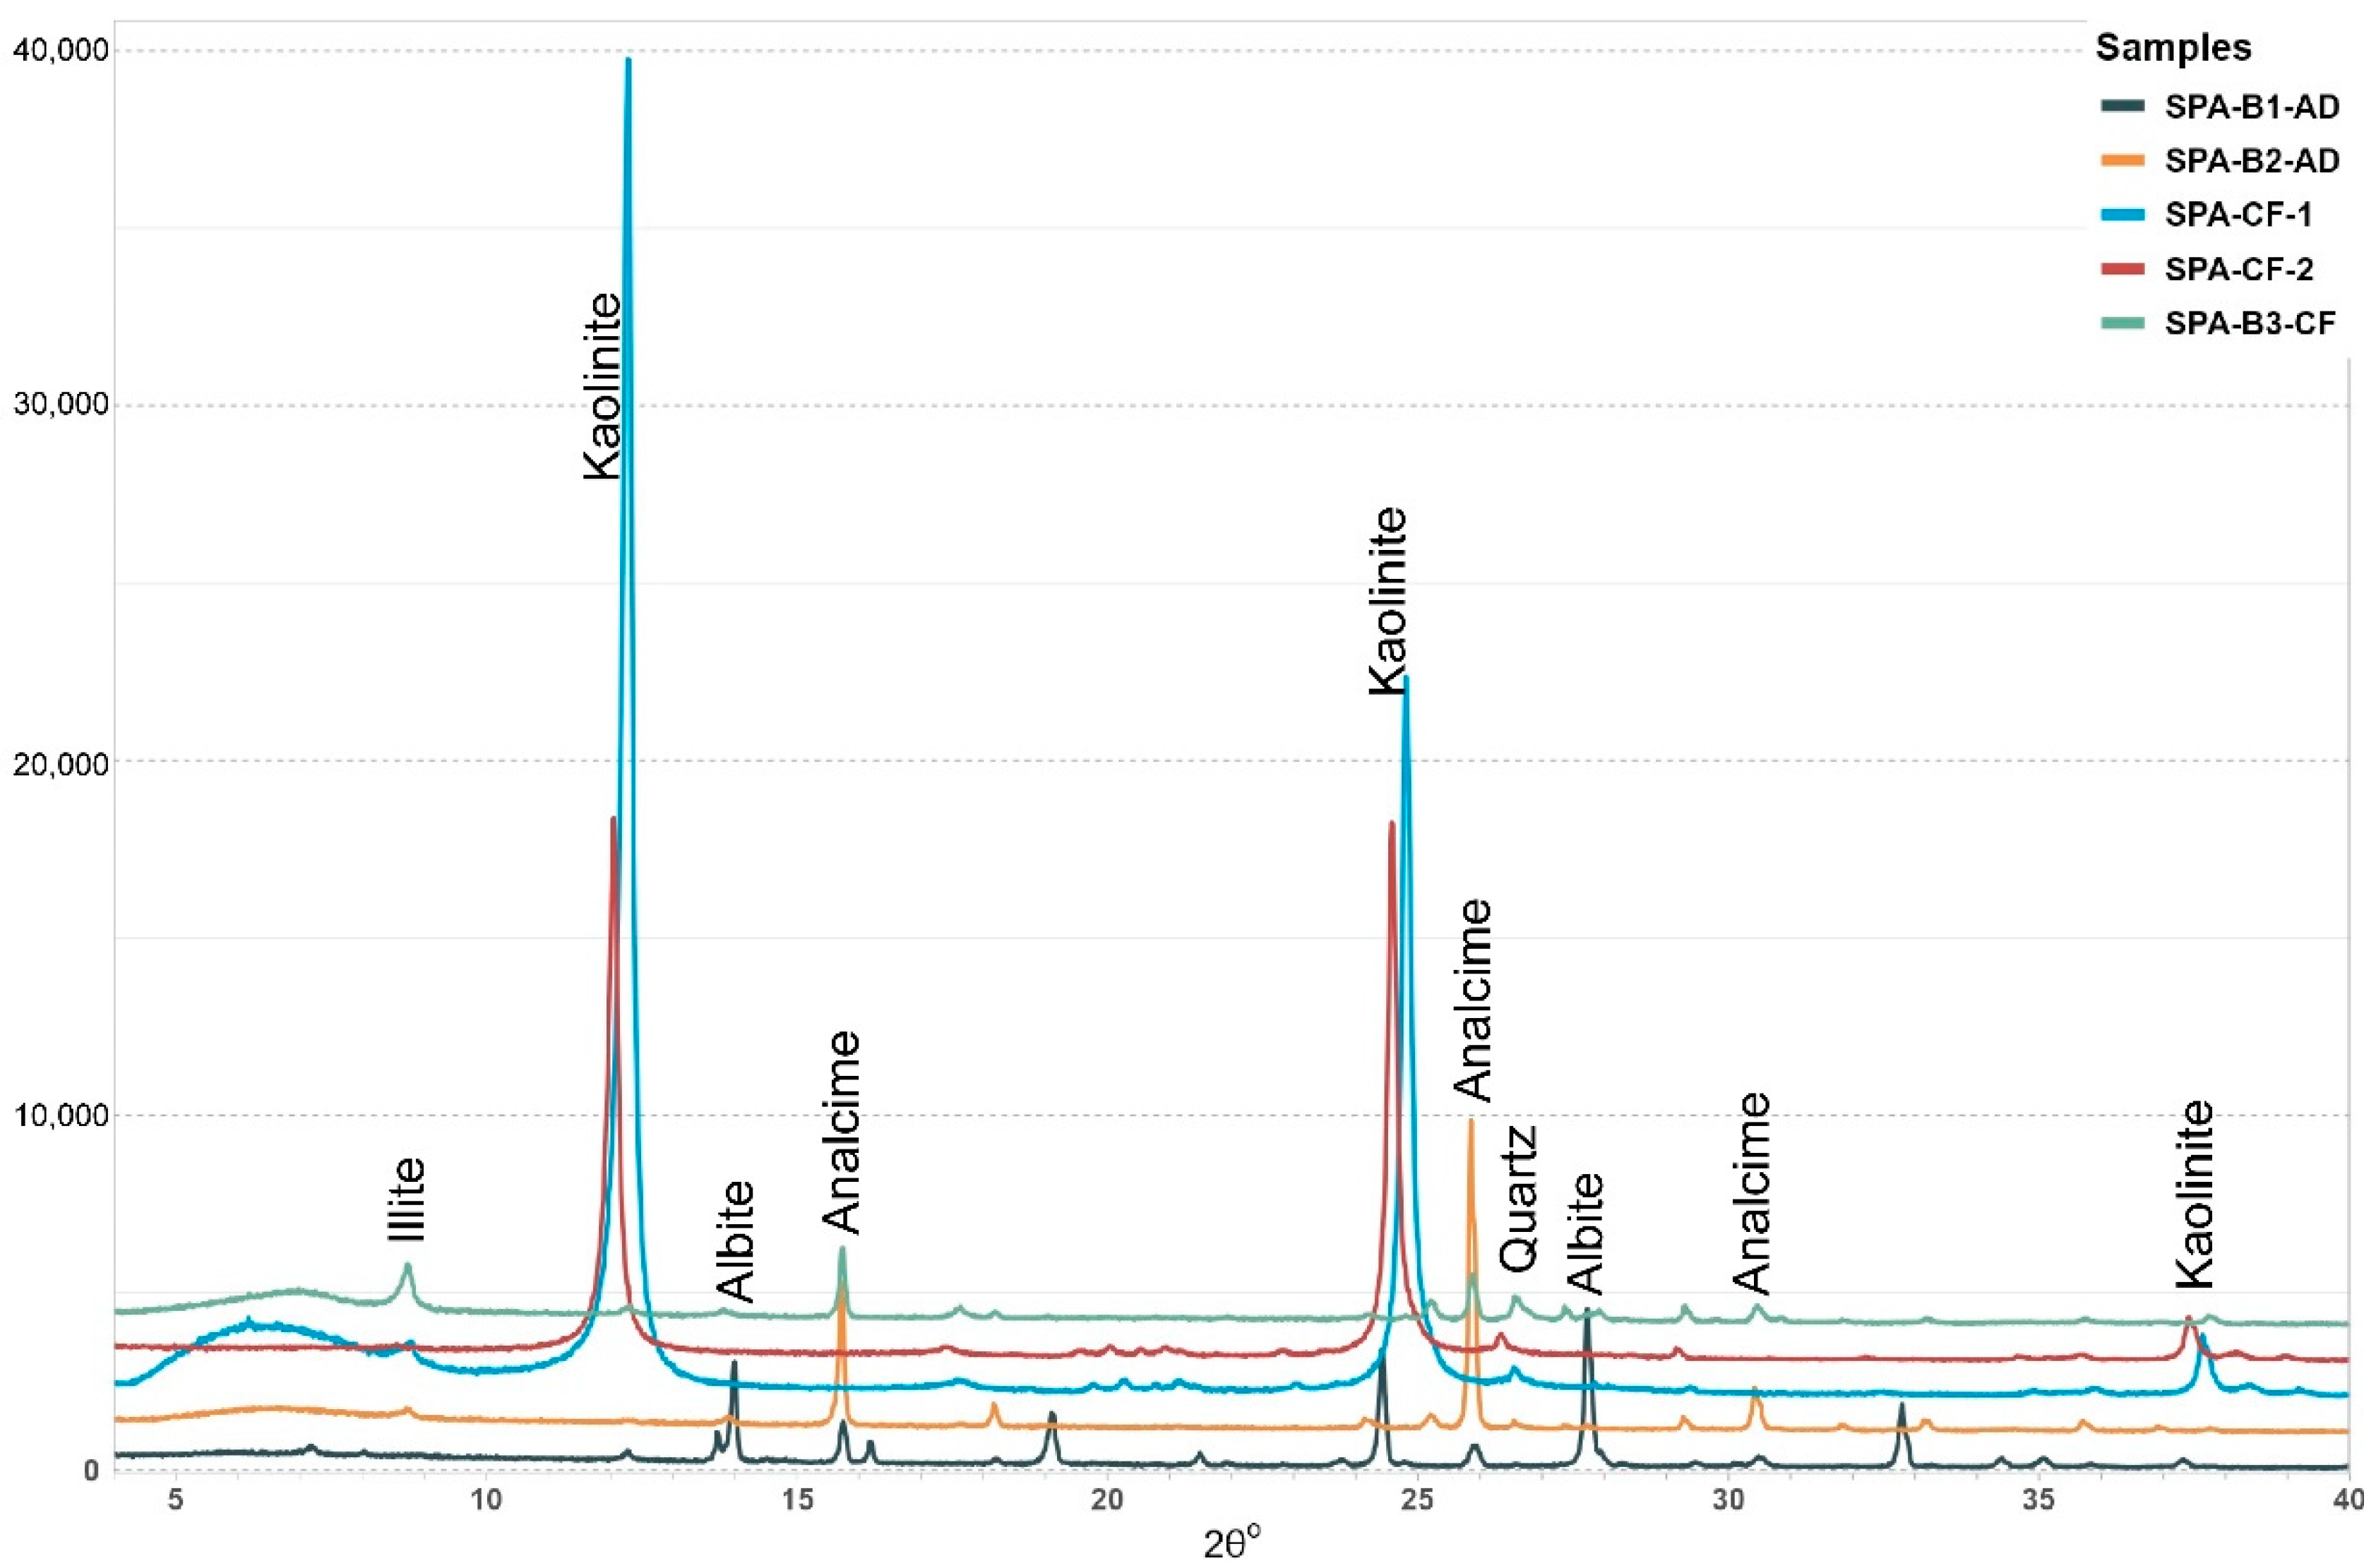
The bulk XRD demonstrates that the original sample exhibits 72.6% kaolinite, occurring as pore-filling clay and exhibiting a distinctive clay booklet structure in the thin section (Figure 3A). SEM further displays platy, vermicular, stacked, and pseudohexagonal arrangements of the kaolinite (Figure 3A,B). The bulk XRD also revealed the presence of 27% mono-crystalline quartz (Figure 3C) and minor quantities of calcite, hematite, and albite (feldspar). These findings are confirmed by the SEM-EDX, showing high atomic percentages for Al and Si, while low Ca and Fe concentrations. Additionally, the clay fraction XRD revealed the presence of 85.9% kaolinite and 5.8% albite, in addition to several minerals of minor quantities including analcime, quartz, and illite.

4.2. Reacted Samples’ Mineralogical Composition

Three experiments were conducted for three Abha Saprolite (SPA) samples, and each sample exhibits a sample ID, denoted by the B letter to distinguish the experiments’ temperature. The three temperatures started from 150 °C for sample SPA-B1, 200 °C for sample SPA-B2, and 250 °C for SPA-B3, as demonstrated in Table 1.
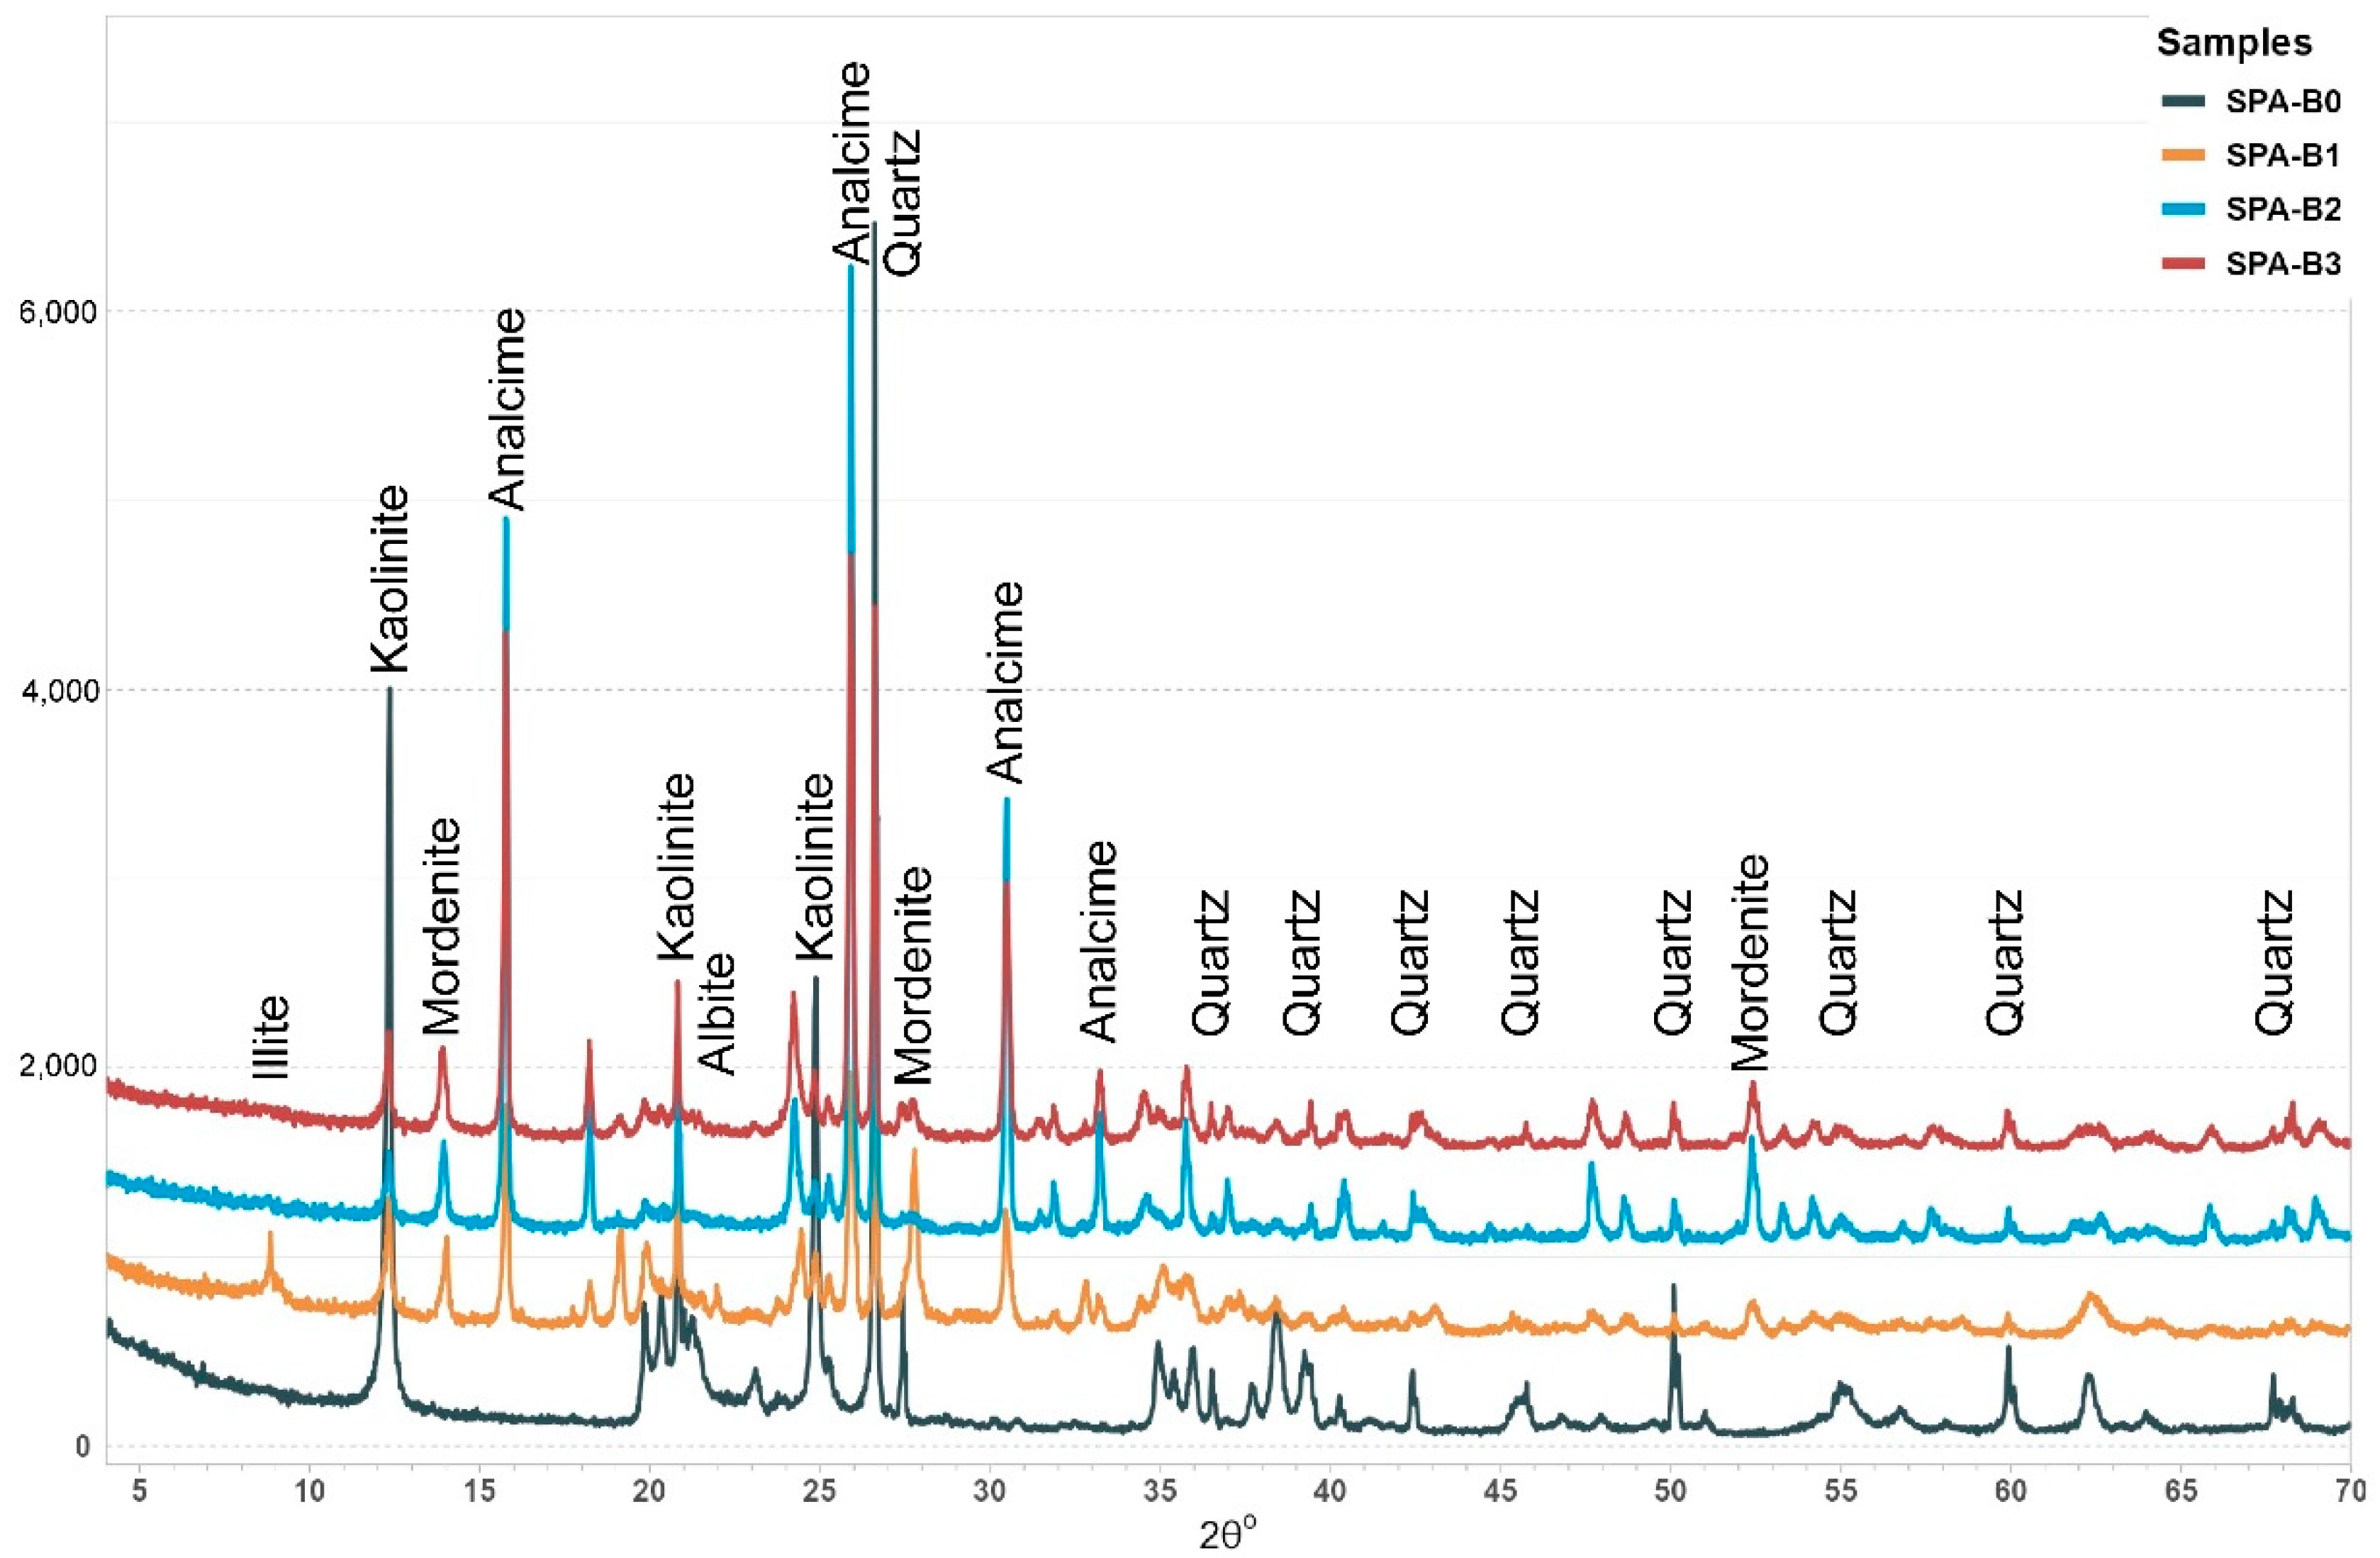
The samples demonstrated an increase in the analcime concentration and a gradual reduction in kaolinite, as demonstrated in the XRD pattern in Figure 4 and Figure 5.

4.2.1. Experiment 1—SPA-B1 (150 °C)

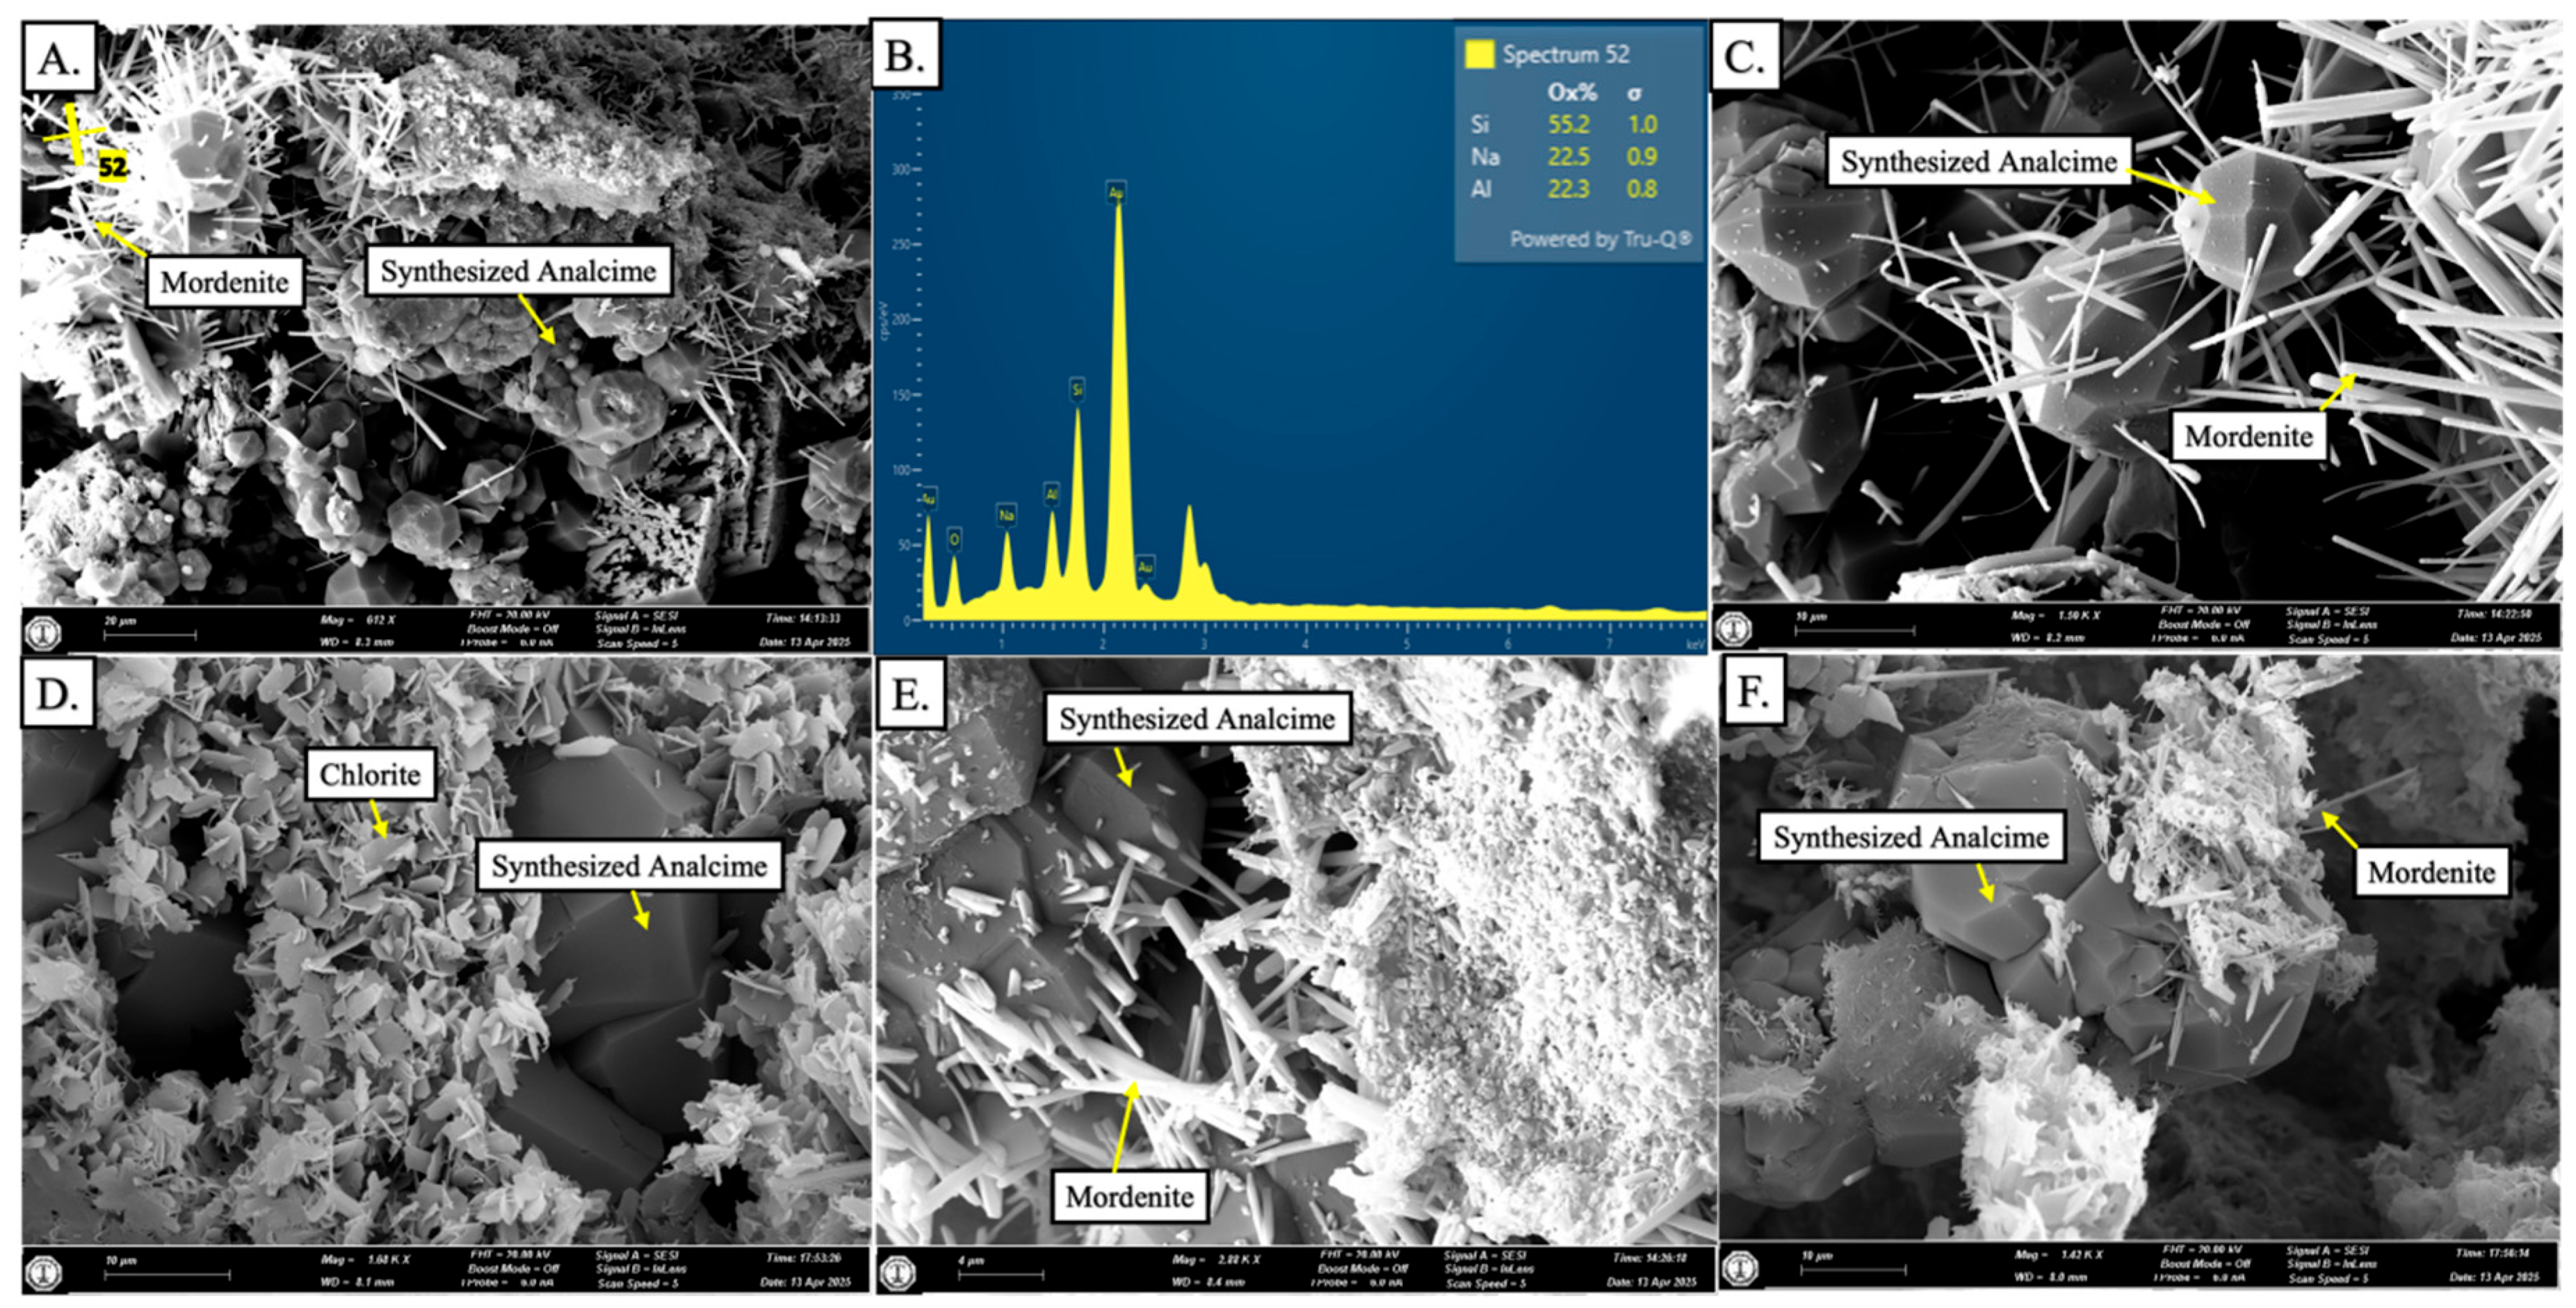
The bulk XRD demonstrates the presence of 58.8% kaolinite, 17.9% albite, 15.5% analcime, and less than 10% of quartz, chabazite, and illite (Figure 6A). Clay fraction XRD results identify the presence of high concentrations of albite and less than 15% of analcime, illite, and minor quartz (Figure 6B). These findings are further confirmed by SEM, showing dissolved kaolinite crystals adjacent to newly developed analcime crystals of 10 µm in diameter (Figure 7A), evident by equal aluminum and sodium concentrations in the SEM-EDX (Figure 7B). These newly formed analcime crystals show ghosts of thin elongated mordenite rods (Figure 7C). Each rod is approximately >10 µm and radiates from the synthesized analcime crystals. Furthermore, synthesized chlorite is found rimming analcime crystals (Figure 7D). The chlorite consists of euhedral and pseudohexagonal crystals, with each individual crystal being perpendicular to one another. Additionally, SEM identifies the presence of amorphous silica (Figure 7E) next to the mordenite rods and synthesized analcime crystals.

4.2.2. Experiment 2—SPA-B2 (200 °C)

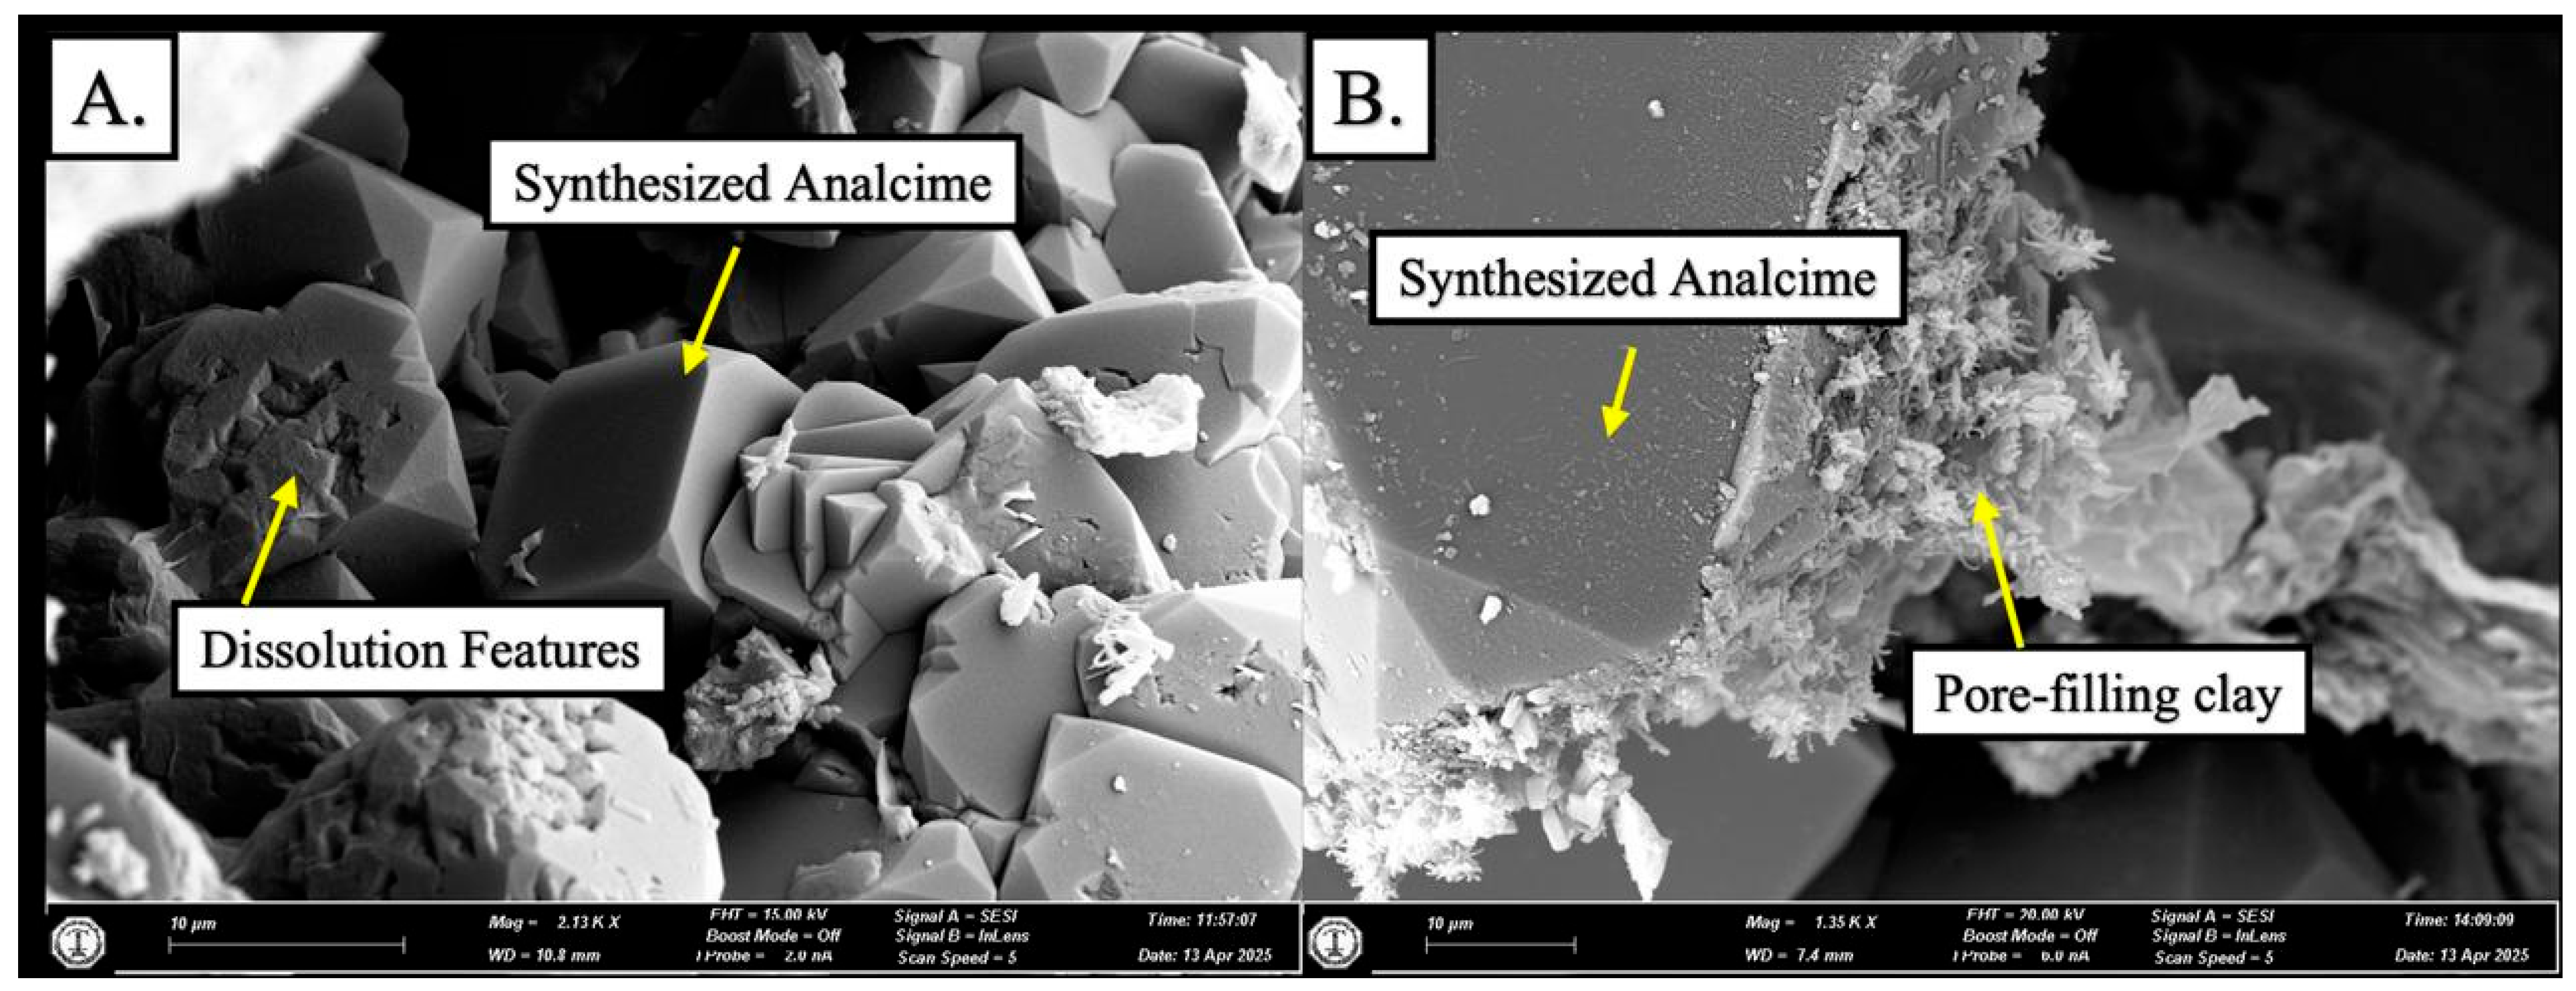
The bulk XRD results show 45.5% analcime, 39.5% kaolinite, 9.4% quartz, and minor quantities of albite, chabazite, and illite. The clay fraction XRD demonstrates the presence of 86.4% analcime, 9.7% illite, and minor quantities of kaolinite, quartz, and albite. SEM shows the dissolution of kaolinite and the development of synthesized analcime crystals (Figure 8A,B). In addition, the newly developed amorphous silica demonstrates several chemical compositions and several morphologies.

4.2.3. Experiment 3—SPA-B3 (250 °C)

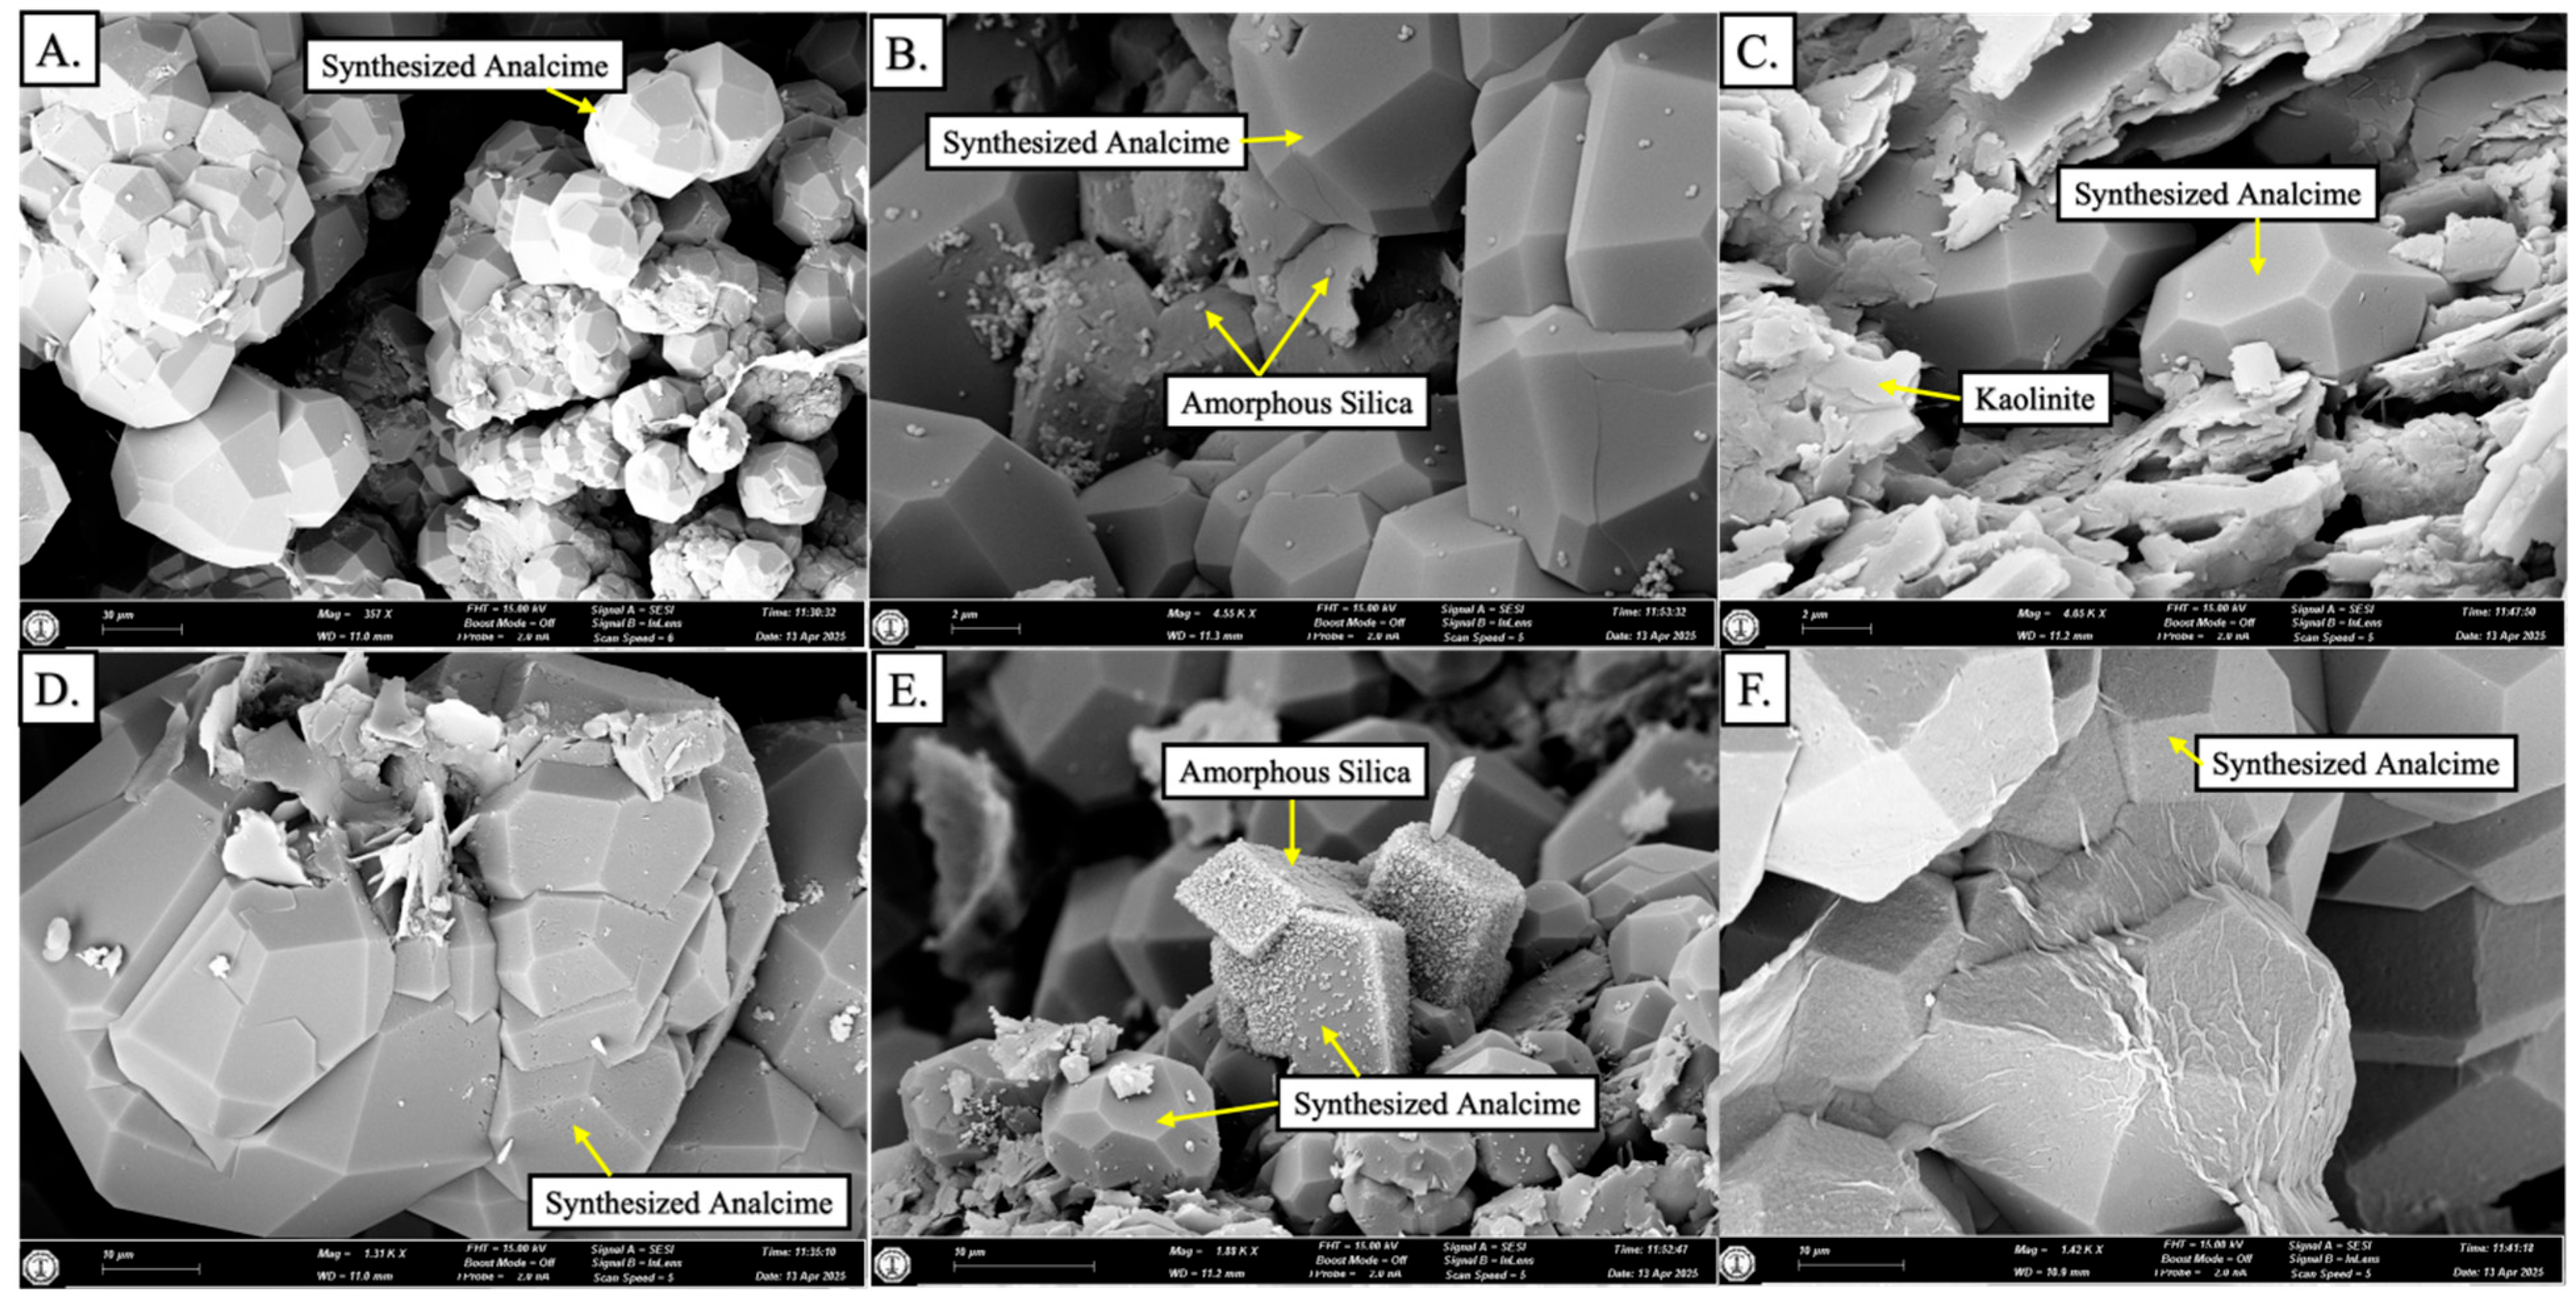
According to the bulk XRD results, the sample contains 44.1% kaolinite, 35.1% analcime, 10.3% quartz, 8.7% albite, and minor chabazite, with no illite in the sample. The clay fraction XRD demonstrates 28.2% analcime, which is well developed, with some crystals occurring with sharp euhedral edges and clean surfaces under SEM (Figure 9A), while others show remnants of the amorphous silica on the crystal surfaces (Figure 9B). The SEM identifies the presence of kaolinite occurring as pore-filling clay between the analcime crystals (Figure 9C).

4.3. ICP-OES

The analysis of major element concentrations in the solution of the starting material and of the three post-reaction samples was conducted using ICP-OES. The starting material solution results demonstrate 88,600 mg/L of sodium (Na), 1340 mg/L of potassium (K), 230 mg/L of aluminum (Al), 42.6 mg/L of calcium (Ca), and 12.5 mg/L of iron (Fe). In the post-reaction sample solution, the results demonstrate a decreasing trend in the Na contents, which were measured at 24,800 mg/L in SPA-B1 (150 °C), subsequently reducing to 6200 mg/L in SPA-B2 (200 °C) and further to 18,300 mg/L in SPA-B3 (250 °C). A similar trend is observed for Al, with concentrations of 265 mg/L in SPA-B1 (150 °C), 254 mg/L in SPA-B2 (200 °C), and 250 mg/L in SPA-B3 (250 °C). In contrast, Ca exhibited a minor concentration of 3.8 mg/L in SPA-B1(150 °C), which was not detectable in the subsequent samples.

4.4. Structural Formula

Structural formulas for the synthesized mordenite and analcime were calculated on the basis of 72 and 96 oxygen atoms, respectively. The average compositions for the zeolites that were calculated are summarized in Table 2. The results of the calculations reveal that, on average, the values of Si and Al for the synthesized analcime fluctuate between the temperatures, as they first decrease from 150 °C to 200 °C but increase again between 200 °C and 250 °C (Table 2). The Fe content however exhibits a reverse trend, as it sharply increases between temperatures of 150 °C and 200 °C and decreases between 200 °C and 250 °C. The Na content decreases as the temperature rises, as it is consumed by the forming analcime.

5. Discussion

5.1. Synthesized Zeolite Formation

Various attempts to synthesis analcime from a wide range of starting materials have been conducted, including industrial waste [21,22], ash [13,23], glass [24,25], and kaolinite-rich rocks [10,11]. These attempts demonstrate that zeolites generally can be synthesized from a spectrum of precursors. One of the earliest attempts of zeolite synthesis utilized amorphous silica as the primary source of SiO2 and developed a silica-rich form of zeolite, identified as zeolite beta [26]. Amorphous silica is characterized by a high surface area and its ability to be induced from alumina or alkaline solutions and sources, facilitating the synthesis of pure forms of zeolite, which is dependent on the gel dissolution rate [27,28]. Each precursor to amorphous silica results in a different crystal morphology and crystal size and exhibits a different reaction rate [24]. Furthermore, the nucleation of zeolite is controlled by the dissolution of the amorphous silica and mordenite, reaching zeolite supersaturation and increasing nucleation [24].
In this study, the formation of synthesized zeolite from kaolinite-rich saprolite demonstrated three phases. These phases started with the development of amorphous silica (Figure 7E) and the formation of elongated mordenite rods in SPA-B1 at 150 °C. These rods radiate from the newly developed analcime crystals (Figure 7C), followed by the formation of well-developed, trapezohedron analcime crystals in the last experiment, SPA-B3 at 250 °C (Figure 9A). This path is demonstrated under SEM and SEM-EDS, where the morphology and the elemental composition of the mordenite (Figure 7B) amorphous silica and analcime were distinguishable. Analcime crystals formed in SPA-B2 at 200 °C showed the continued development of analcime from cubic crystals (Figure 8 and Figure 9A–E) to fully trapezohedron crystal aggregates in the final experiment (Figure 9A). These morphologies are controlled by the temperature, the Si/Al ratio, and the dissolution of mineral phases, specifically mordenite and amorphous silica. The morphologies observed in this study are similar to those reported in the attempt to synthesize zeolite A from a k-feldspar rock [27].

5.2. Mechanism of Zeolite Formation

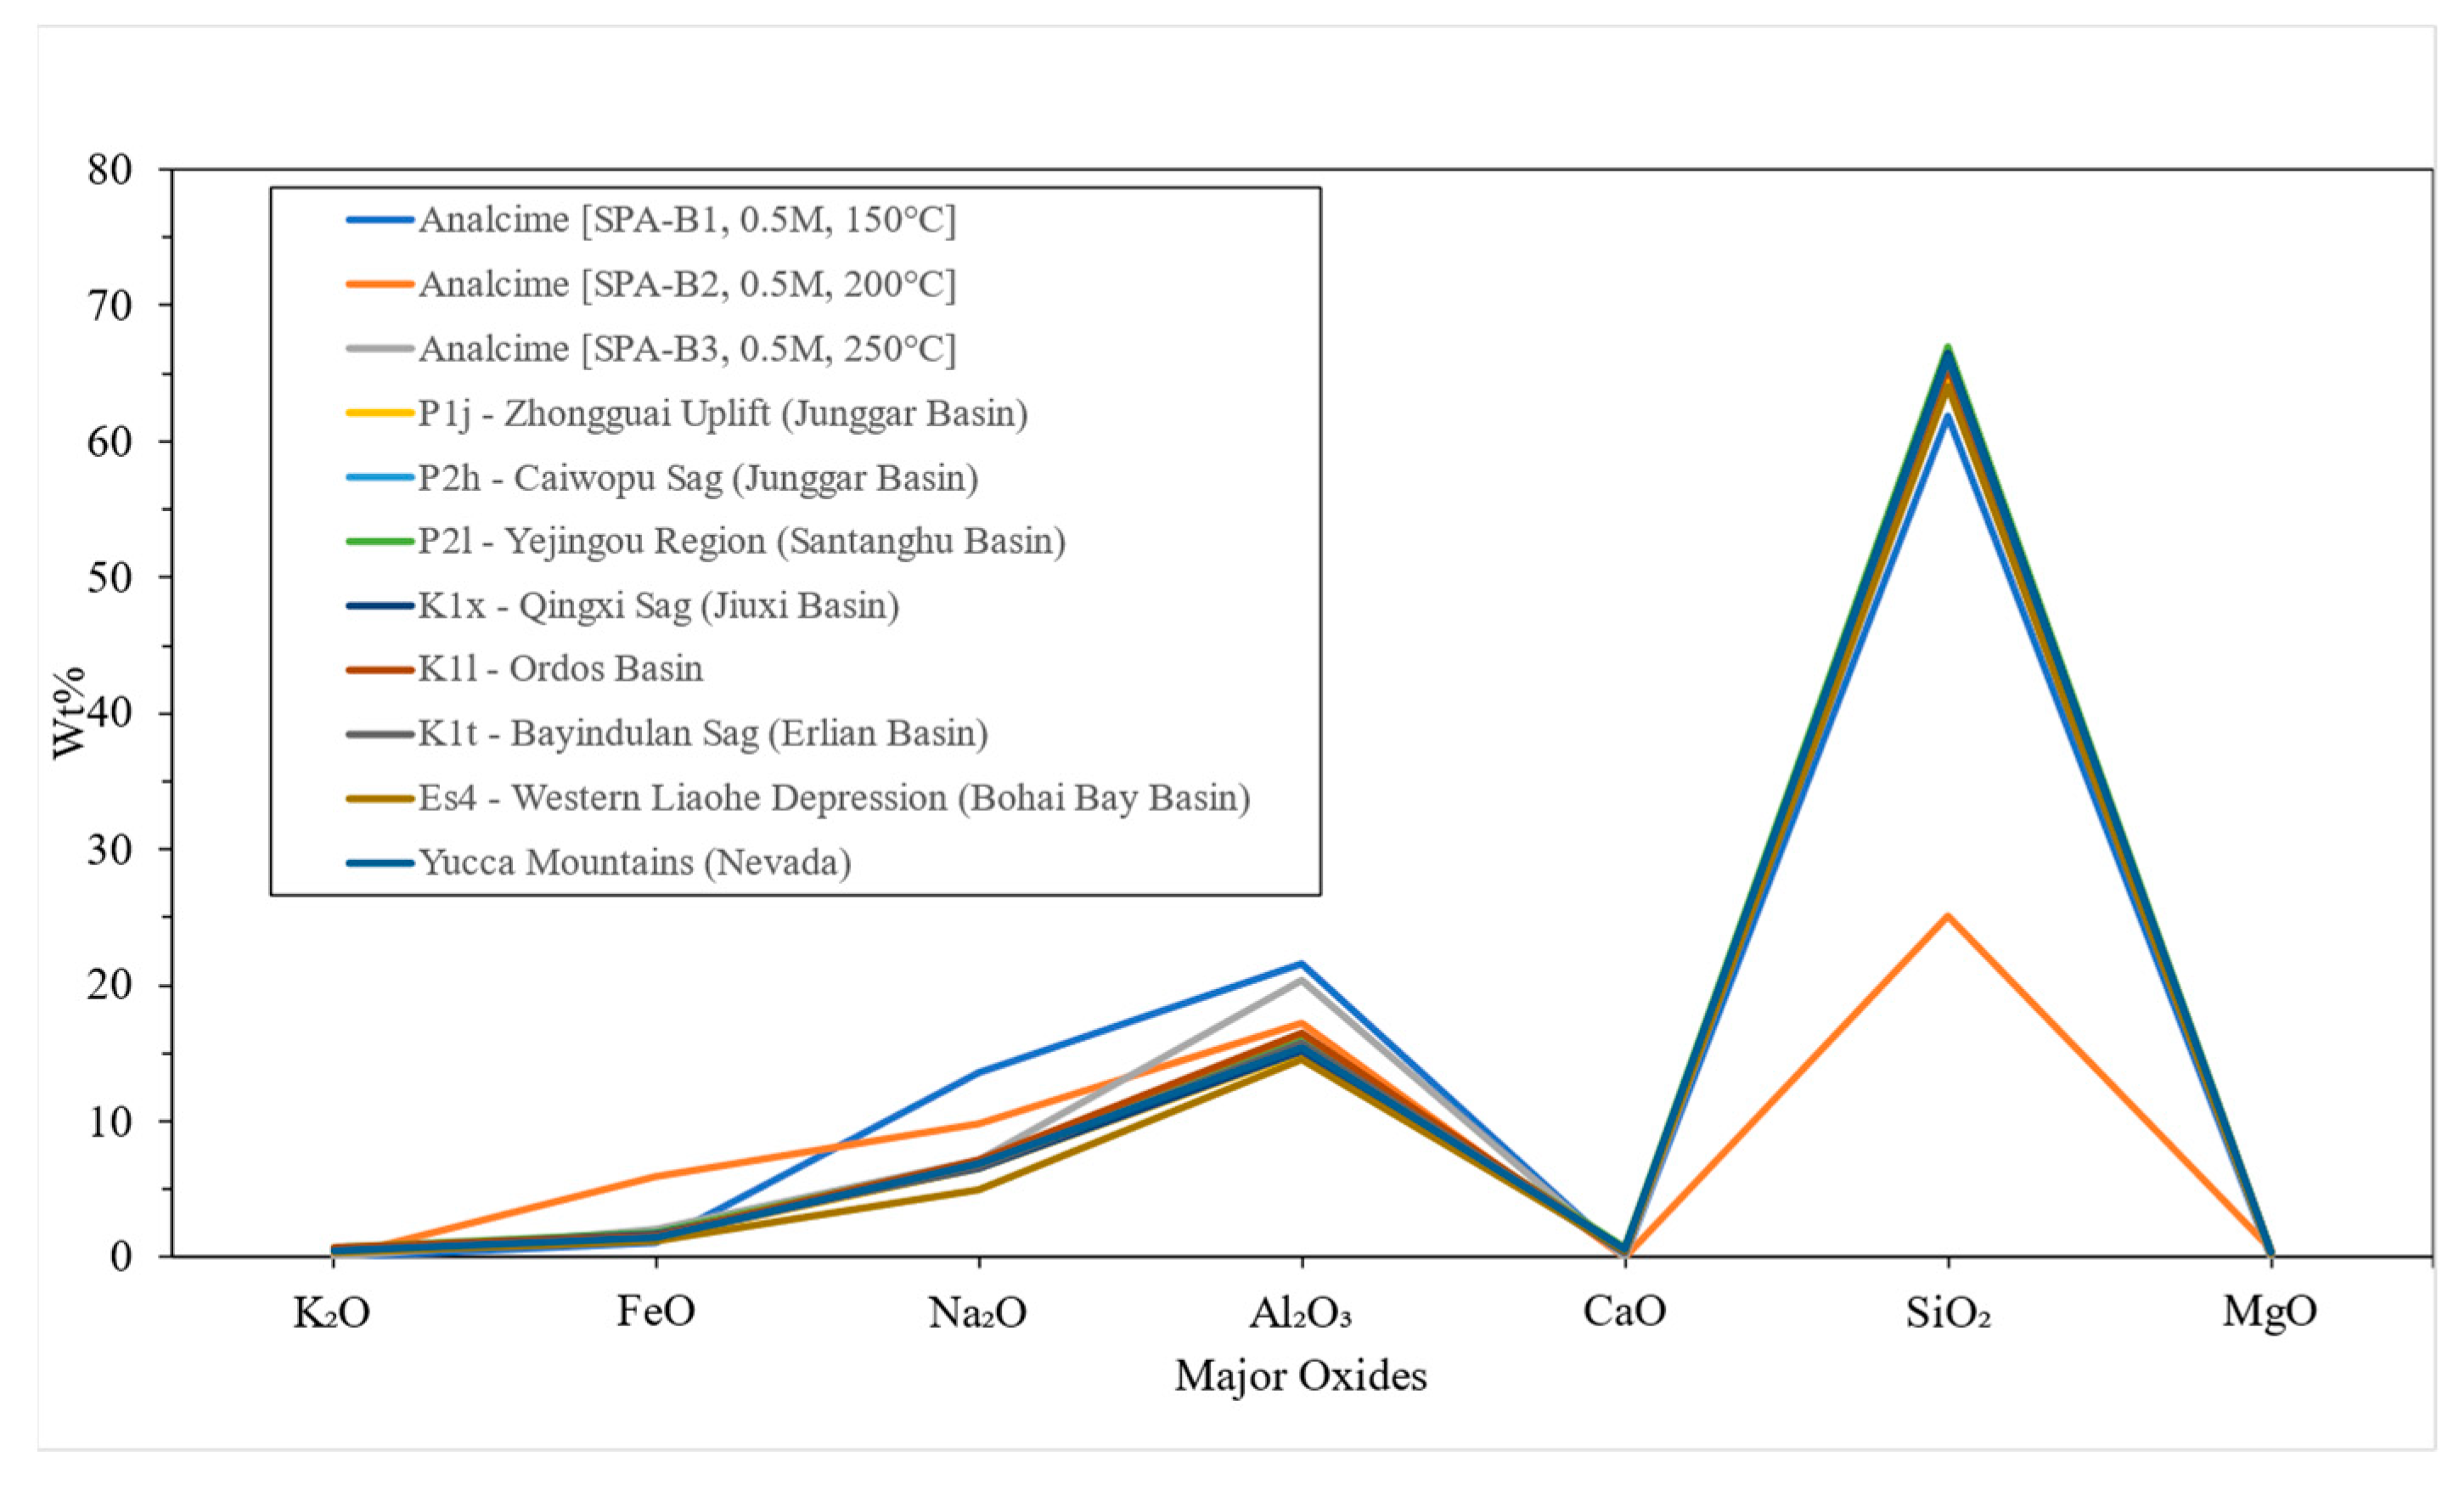
As observed in this study, the zeolite formation demonstrated two key pathways; one is influenced by kaolinite and the other by amorphous silica. The starting material’s mineralogical composition played a key role in influencing the transformation pathway [9,10]. The saprolite exhibited high concentrations of kaolinite and quartz, supplying Al and Si for the formation of amorphous silica. The solution utilized, Na2CO3, created an alkaline environment (pH = 11), which promotes analcime formation and simulates the conditions of alkaline lakes where analcime naturally forms [1,29]. Additionally, the solution supplied the necessary Na+ for mordenite formation. Mordenite is a unique form of zeolite that exhibits equal concentrations of aluminum and sodium, high concentrations of silica, and a distinctive needle morphology [17,30]. Similarly to other types of zeolites, mordenite can be synthesized from a wide range of precursors—one of which is amorphous silica [17,30,31]. The development of amorphous silica and mordenite at 150 °C followed by the development of trapezohedron analcime at 250 °C shows that the formation of synthesized zeolite followed a particular thermal stability curve amongst these different zeolite framework types. Previous attempts to synthesize mordenite using amorphous silica precursors were conducted between 150 and 190 °C, producing amorphous, irregular-shaped mordenites at 150 °C and a prismatic morphology at 190 °C [31]. These findings show that the unique needle morphology produced in this study was not only influenced by the presence of amorphous silica but might have also been controlled by the solution chemistry, the presence of potassium, and the starting material composition. The structural formulas that were calculated for the synthesized analcime demonstrate that the average value of Na decreases with the increasing temperature, showing the supply of sodium that the solution provides for the formation of the analcime (Table 2). The newly synthesized analcime was compared to analcime that naturally occurs in the Junggar Basin, the Santanghu Basin, the Jiuxi Basin, the Ordos Basin, the Erlian Basin, the Bohai Bay Basin, and the Yuccas in Nevada [10]. The synthesized analcime in this study demonstrates a similar chemical composition, and the values of the oxides fall within the compositional range observed in natural occurrences (Figure 10). The compositional similarity validates the mineralogy of the produced analcime as comparable to the ones occurring in ancient rock records.

5.3. Limitations of Study and Future Work

The similarity in the chemical composition between the synthesized analcime developed from the kaolinite precursor as part of this study and naturally occurring analcime suggests that kaolinite can serve as an economically viable precursor for analcime formation [9,13]. In addition, further experiments could explore the impact of the experiment time on the synthesized zeolite morphology, chemistry, and mineralogy, specifically on the early development of the zeolite crystals. Further experimentation is also recommended to assess how variations in the concentration and pH of the experiment solution influence the formation and characteristics of the analcime derived from the kaolinite precursor.

6. Conclusions

  • This study aims to convert kaolinite into zeolite and investigate the transformation within zeolite phases. A series of hydrothermal reactor experiments were conducted utilizing saprolite from the Al-Habala Area (NW Saudi Arabia) as the starting material. Analcime was synthesized at temperatures ranging from 150 °C to 250 °C over a duration of 336 h (14 days), using a synthetic solution. The dissolution of kaolinite initially occurred at 150 °C, resulting in the formation of synthesized analcime crystals. These crystals exhibited a continued development of trapezohedron faces at temperatures of 150 °C and 200 °C, transitioning to aggregate formations at the higher temperature of 250 °C.
  • Zeolite demonstrated two mineral phases, including mordenite and analcime, showing an unusual transformation pathway, identified through SEM and SEM-EDX.
  • Amorphous silica formed through the dissolution of the clay and feldspar grains, which supplied the Si and Al.
  • Mordenite formed from the amorphous silica, with a sufficient Na+ supply from the synthetic solution used in this study.
  • Analcime was synthesized under alkaline conditions of a pH = 11 in a sodium carbonate solution, forming crystals that are similar in composition to naturally occurring analcime.
  • SPA-B3 represents the final product of the experiments, exhibiting several phases, specifically analcime, mordenite, amorphous silica, and minor kaolinite.

Author Contributions

Conceptualization, A.M.B.; methodology, A.S.K.; software, A.M.B.; validation, A.S.K., D.N.A., A.M.B., and K.A.-R.; formal analysis, A.M.B.; investigation, A.M.B., resources, A.M.B. and K.A.-R.; data curation, A.M.B.; writing—original draft preparation, A.S.K. and D.N.A.; writing—review and editing, A.S.K., D.N.A., A.M.B., and K.A.-R.; visualization, A.S.K., D.N.A., A.M.B., and K.A.-R.; supervision, K.A.-R. and A.M.B.; project administration, K.A.-R.; funding acquisition, K.A.-R. All authors have read and agreed to the published version of the manuscript.

Funding

The resources used in this study were provided by the College of Petroleum Engineering and Geosciences (CPG) at King Fahd University of Petroleum & Minerals, Dhahran 32261, Saudi Arabia (Grant number: SF24004).

Data Availability Statement

The data presented in this study are available upon request by contacting the corresponding author.

Acknowledgments

The authors sincerely thank the College of Petroleum Engineering and Geosciences (CPG) at King Fahd University of Petroleum & Minerals for providing the necessary resources for this study. We wish to thank Ajibola H. Okeyode, Bandar D. Al-Otaibi, Abduljamiu Olalekan Amao, Anas Muhammad Salisu, and Habeeb Al-Abbas for their assistance in the sample preparation for the SEM analysis, conducting the XRD and clay fraction XRD analysis, and for their support with the visuals and thin section preparation, respectively. and thin section preparation, respectively.

Conflicts of Interest

The authors declare no conflicts of interest.

References

  1. Chipera, S.J.; Apps, J.A. Geochemical Stability of Natural Zeolites. Rev. Miner. Geochem. 2001, 45, 117–161. [Google Scholar] [CrossRef]
  2. Tran, Y.T.; Lee, J.; Kumar, P.; Kim, K.-H.; Lee, S.S. Natural zeolite and its application in concrete composite production. Compos. Part B Eng. 2019, 165, 354–364. [Google Scholar] [CrossRef]
  3. Cataldo, E.; Salvi, L.; Paoli, F.; Fucile, M.; Masciandaro, G.; Manzi, D.; Masini, C.M.; Mattii, G.B. Application of Zeolites in Agriculture and Other Potential Uses: A Review. Agronomy 2021, 11, 1547. [Google Scholar] [CrossRef]
  4. Kovo, A.S.; Holmes, S.M.; Rios, C.A.; Otaru, A.J.; Abdulkareem, A.S.; Eluwa, V.C. Synthesis of zeolites from different kaolin deposits worldwide. Appl. Clay Sci. 2025, 269, 107757. [Google Scholar] [CrossRef]
  5. Barrer, R.M. Hydrothermal Synthesis of Zeolites; Academic Press: New York, NY, USA, 1982. [Google Scholar]
  6. Lobo, R.F.; Zones, S.I.; Davis, M.E. Structure-direction in zeolite synthesis. J. Incl. Phenom. Mol. Recognit. Chem. 1995, 21, 47–78. [Google Scholar] [CrossRef]
  7. Król, M. Natural vs. Synthetic Zeolites. Crystals 2020, 10, 622. [Google Scholar] [CrossRef]
  8. Iijima, A. Zeolites in Petroleum and Natural Gas Reservoirs. Rev. Mineral. Geochem. 2001, 45, 347–402. [Google Scholar]
  9. Zhu, S.; Cui, H.; Jia, Y.; Zhu, X.; Tong, H.; Ma, L. Occurrence, composition, and origin of analcime in sedimentary rocks of non-marine petroliferous basins in China. Mar. Pet. Geol. 2020, 113, 104164. [Google Scholar] [CrossRef]
  10. Novembre, D.; Gimeno, D. Synthesis and characterization of analcime (ANA) zeolite using a kaolinitic rock. Sci. Rep. 2021, 11, 13373. [Google Scholar] [CrossRef]
  11. Esaifan, M.; Al Daboubi, F.; Hourani, M.K. Preparation of Mesoporous Analcime/Sodalite Composite from Natural Jordanian Kaolin. Materials 2024, 17, 4698. [Google Scholar] [CrossRef]
  12. Jamil, T.S.; Youssef, H.F. Microwave Synthesis of Zeolites from Egyptian Kaolin: Evaluation of Heavy Metals Removal. Sep. Sci. Technol. 2016, 52, 2876–2886. [Google Scholar] [CrossRef]
  13. Atta, A.Y.; Jibril, B.Y.; Aderemi, B.O.; Adefila, S.S. Preparation of analcime from local kaolin and rice husk ash. Appl. Clay Sci. 2012, 61, 8–13. [Google Scholar] [CrossRef]
  14. Moraes, C.G.; Rodrigues, E.C.; Angelica, R.S.; Macedo, E.N.; Neves, R.F. Analcime zeolite production from amazon kaolin. Ceramica 2013, 59, 563–569. [Google Scholar] [CrossRef]
  15. Godang, S.; Idrus, A.; Fadlin, B.P.; Basuki, N.I. Saprolitization’s Characteristics of Rare Earth Elements in Volcanic Regolith on Drill Core #65 in Western Sulawesi, Indonesia. Asian J. Appl. Sci. 2019, 7, 435–450. [Google Scholar] [CrossRef]
  16. Youssef, H.F.; Nasr, R.A.; El-Anwar, E.A.A.; Mekky, H.S.; El Rahim, S.H.A. Preparation and characterization of different zeolites from andesite rock: Product evaluation for efficient dye removal. Microporous Mesoporous Mater. 2021, 328, 111485. [Google Scholar] [CrossRef]
  17. Narayanan, S.; Tamizhdurai, P.; Mangesh, V.L.; Ragupathi, C.; Krishnan, P.S.; Ramesh, A. Recent advances in the synthesis and applications of mordenite zeolite—Review. RSC Adv. 2020, 11, 250–267. [Google Scholar] [CrossRef] [PubMed]
  18. Bello, A.M.; Charlaftis, D.; Jones, S.J.; Gluyas, J.; Acikalin, S.; Cartigny, M.; Al-Ramadan, K. Experimental diagenesis using present-day submarine turbidite sands. Front. Earth Sci. 2022, 10, 952690. [Google Scholar] [CrossRef]
  19. Bello, A.M.; Salisu, A.M.; Amao, A.O.; Umar, M.; Al-Ramadan, K. Experimental development of chlorite: Insights from a kaolinite precursor. J. Sediment. Res. 2025, 95, 462–484. [Google Scholar] [CrossRef]
  20. Overstreet, W. A Geological and Geochemical Reconnaissance of the Tathlith One-Degree Quadrangle, Sheet 19/43 Kingdom of Saudi Arabia; U.S. Geological Survey: Reston, VA, USA, 1978; pp. 78–1072.
  21. Yoldi, M.; Fuentes-Ordoñez, E.; Korili, S.; Gil, A. Zeolite synthesis from industrial wastes. Microporous Mesoporous Mater. 2019, 287, 183–191. [Google Scholar] [CrossRef]
  22. Mencía, R.V.d.l.V.; Goiti, E.; Ocejo, M.; Giménez, R.G. Synthesis of zeolite type analcime from industrial wastes. Microporous Mesoporous Mater. 2020, 293, 109817. [Google Scholar] [CrossRef]
  23. Vereshchagina, T.A.; Kutikhina, E.A.; Solovyov, L.A.; Vereshchagin, S.N.; Mazurova, E.V.; Chernykh, Y.Y.; Anshits, A.G. Synthesis and structure of analcime and analcime-zirconia composite derived from coal fly ash cenospheres. Microporous Mesoporous Mater. 2018, 258, 228–235. [Google Scholar] [CrossRef]
  24. Fang, J.; Lin, I.; Lo, H.; Song, S.; Chen, Y. The Kinetics of Analcime Synthesis in Alkaline Solution. J. Chin. Chem. Soc. 2004, 51, 1267–1272. [Google Scholar] [CrossRef]
  25. Lin, C.; Wang, D.; Ye, S. Synthesis of micro-mesoporous glass-analcime composite structure with soda–lime–silica glass as raw material. Funct. Mater. Lett. 2019, 12, 1950021. [Google Scholar] [CrossRef]
  26. Bhat, R.N.; Kumar, R. Synthesis of zeolite beta using silica gel as a source of SiO2. J. Chem. Technol. Biotechnol. 1990, 48, 453–466. [Google Scholar] [CrossRef]
  27. Su, S.; Ma, H.; Chuan, X. Hydrothermal synthesis of zeolite A from K-feldspar and its crystallization mechanism. Adv. Powder Technol. 2016, 27, 139–144. [Google Scholar] [CrossRef]
  28. Jiang, H.; Wang, D.; Tan, J.; Chen, Y.; An, Y.; Chen, Y.; Wu, Y.; Sun, H.; Shen, B.; Wu, D.; et al. In Situ Hydrothermal Conversion of Silica Gel Precursors to Binderless Zeolite X Pellets for Enhanced Olefin Adsorption. Ind. Eng. Chem. Res. 2020, 59, 9997–10009. [Google Scholar] [CrossRef]
  29. Wang, J.; Liang, C.; Cao, Y.; Tian, Y. Occurrence, Genesis, and Significance of Analcime in Fine-Grained Sedimentary Rocks. Geofluids 2022, 2022, 3633047. [Google Scholar] [CrossRef]
  30. Hincapie, B.O.; Garces, L.J.; Zhang, Q.; Sacco, A.; Suib, S.L. Synthesis of mordenite nanocrystals. Microporous Mesoporous Mater. 2004, 67, 19–26. [Google Scholar] [CrossRef]
  31. Gili, M.; Conato, M. Synthesis and characterization of mordenite-type zeolites via hydrothermal method using amorphous silica and sodium aluminate as Si and Al sources at varying temperature. J. Phys. Conf. Ser. 2019, 1191, 012038. [Google Scholar] [CrossRef]
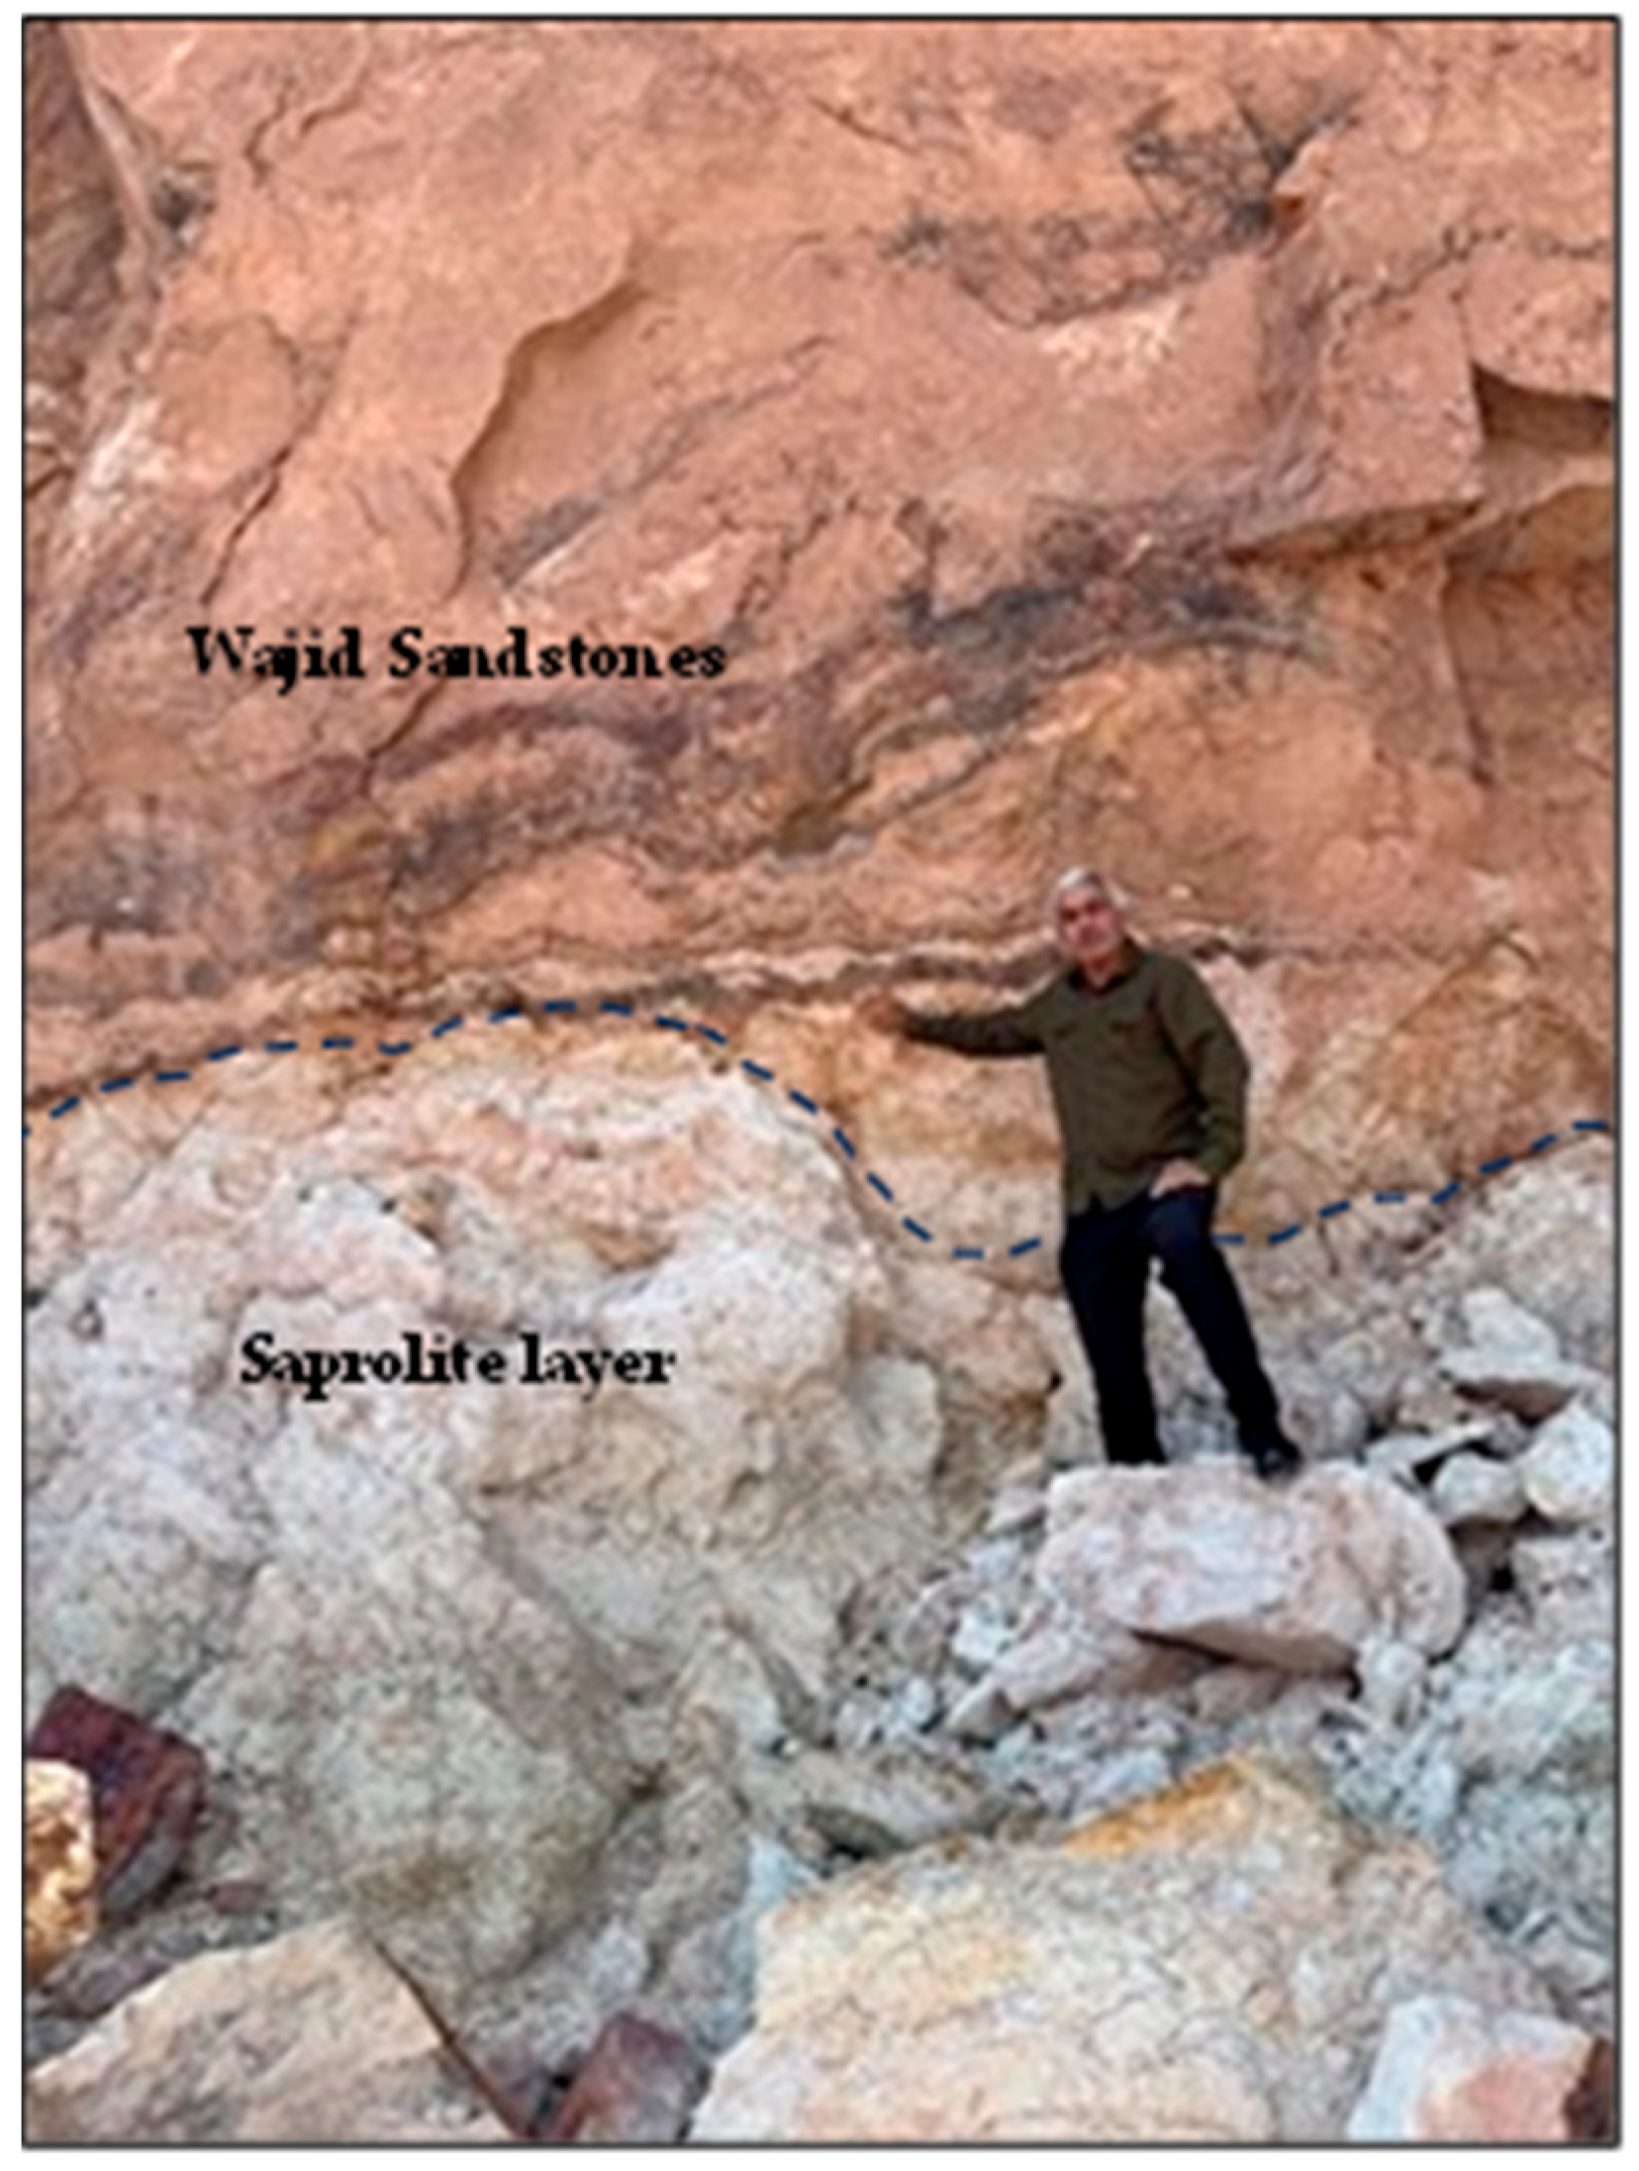
Figure 1. A saprolite layer found at the base of the Al-Habala Area outcrop (below the dashed line).
Minerals 15 00920 g001
Figure 2. Hydrothermal reactors with their associated components, in addition to a nitrogen source.
Minerals 15 00920 g002
Figure 3. (A) SEM showing vermicular aggregates of booklet kaolinite, (B) pseudo-hexagonal plates of kaolinite, and (C,D) kaolinite occurring as pore-filing clay, observed under PPL (C) and XPL (D). (E) Iron oxide grain. (F) Kaolinite in thin section showing booklet morphology next to iron oxide grain.
Minerals 15 00920 g003
Figure 4. Stacked bulk XRD patterns.
Minerals 15 00920 g004
Figure 5. Stacked clay fraction XRD patterns.
Minerals 15 00920 g005
Figure 6. (A) Stacked histogram showing bulk XRD results in the starting material (SPA) and post-reaction materials. (B) Stacked histogram showing the clay fraction XRD results in the starting material (SPA-CF) and post-reaction materials.
Minerals 15 00920 g006
Figure 7. SEM images of SPA-B1 at 150 °C showing (A) dissolved crystals and newly developed synthesized analcime and mordenite mineral phase. (B) SEM-EDX of a point in (A), showing mordenite composition of equal sodium and aluminum concentrations. (C) Synthesized analcime radiating mordenite rods. (D) Chlorite pore filling in newly developed synthesized analcime. (E) Synthesized analcime radiating mordenite rods. (F) Dissolution features of synthesized analcime and radiating mordenite rods.
Minerals 15 00920 g007
Figure 8. SEM images of SPA-B2 showing (A) newly formed analcime crystals with a cubical morphology, showing dissolution features and some remnants of amorphous silica. (B) Synthesized analcime crystal with pore-filling clays.
Minerals 15 00920 g008
Figure 9. SEM images of SPA-B3: (A) aggregates of analcime showing well-developed trapezohedron morphology, (B) synthesized analcime with amorphous silica, (C) kaolinite found pore-filling synthesized analcime crystal, (D) dissolution pore features in analcime crystals, (E) newly developed cubical analcime crystals with amorphous silica, and (F) trapezohedron faces of synthesized analcime.
Minerals 15 00920 g009
Figure 10. Chemical composition of synthesized SPA analcime compared to naturally occurring analcime crystals’ composition in several basins (Edited from Zhu et al., 2020 [9]).
Minerals 15 00920 g010
Table 1. Summary of the conditions for hydrothermal experiments.
ExperimentSample IDSolution (M)Temperature (°C)Duration (Days)
1SPA-B1 200 mL of 0.5 M Na2CO315014
2SPA-B220014
3SPA-B325014
SPA = Abha Saprolite.
Table 2. Average structural formulas for the precipitated zeolites. The formulas were calculated on the basis of 72 and 96 oxygen atoms for mordenite and analcime, respectively.
OxideAnalcime [SPA-B1, 0.5 M, 150 °C]Analcime [SPA-B2, 0.5 M, 200 °C]Analcime [SPA-B3, 0.5 M, 250 °C]Mordenite [SPA-B1, 0.5 M, 150 °C]
SiO262.9342.4268.7954.37
TiO20.150.7600
Al2O321.9629.2521.4922.62
FeO Total1.1310.072.110
MnO0000
MgO00.9300
CaO0000
Na2O13.8316.567.6223.01
K2O0000
Cr2O30000
V2O30000
Structural Formula
ElementAnalcime [SPA-B1, 0.5 M, 150 °C]Analcime [SPA-B2, 0.5 M, 200 °C]Analcime [SPA-B3, 0.5 M, 250 °C]Mordenite [SPA-B1, 0.5 M, 150 °C]
Si33.4423.7034.5122.86
Ti0.060.190.000.00
Al13.7611.0212.9011.24
Fe2 + all ferrous0.514.931.070.00
Mn0.000.000.000.00
Mg0.000.420.000.00
Ca0.000.000.000.00
Na14.2710.317.9218.84
K0.000.000.000.00
Cr0.000.000.000.00
V0.000.000.000.00
P0.000.000.000.00
F0.000.000.000.00
Cl0.000.000.000.00
Si/Al2.432.152.672.03
(Ca + Mg)/(Na + K)0.000.040.000.00
(K + Na)/(K + Na + Ca)1.001.001.001.00
(Na + K + Ca + Mg)14.2710.737.9218.84
Disclaimer/Publisher’s Note: The statements, opinions and data contained in all publications are solely those of the individual author(s) and contributor(s) and not of MDPI and/or the editor(s). MDPI and/or the editor(s) disclaim responsibility for any injury to people or property resulting from any ideas, methods, instructions or products referred to in the content.