Article

Advancing Deep Ore Exploration with MobileMT: Rapid 2.5D Inversion of Broadband Airborne EM Data

by
Alexander Prikhodko
*,
Aamna Sirohey
and
Aleksei Philipovich
Expert Geophysics Surveys Inc., Newmarket, ON L3Y 9C3, Canada
*
Author to whom correspondence should be addressed.
Minerals 2025, 15(8), 874; https://doi.org/10.3390/min15080874
Submission received: 18 July 2025 / Revised: 13 August 2025 / Accepted: 18 August 2025 / Published: 19 August 2025
(This article belongs to the Special Issue Electromagnetic Inversion for Deep Ore Explorations)

Abstract

The increasing demand for critical minerals is forcing the mineral exploration industry to search for deposits beneath deeper cover and over larger areas. MobileMT, an airborne passive, broadband, total-field AFMAG-class system, couples three-component measurements of airborne magnetic field variations with a remote electric-field base station to image electrical resistivity from the surface to depths of >1–2 km. We present a workflow that integrates MobileMT data with the parallelized, adaptive finite-element 2.5D open-source inversion code MARE2DEM, accompanied by automated mesh generation procedures, to create a rapid and scalable workflow for deep ore exploration. Using this software on two field trials, we demonstrate that (i) high-frequency (>2 kHz) data are essential for recovering not only shallow geology but also, when combined with low frequencies, for refining deep structures and targets and that (ii) base station effects modify the shape of the apparent conductivity curve but have negligible impact on the inverted sections. The proposed workflow is a reliable and effective approach for identifying mineralization-related features and refining geologic models based on data from extensive airborne geophysical surveys.

Graphical Abstract

1. Introduction

The global demand for critical minerals is pushing exploration to greater depths, with high-resolution methods being used to detect complex structures and targets related to mineralization. Airborne electromagnetic (EM) inductive methods are widely used because they efficiently cover large areas and can detect electrical conductivity contrasts associated with geological structures and ore systems. However, conventional EM systems often face limitations due to strict terrain clearance requirements, restricted primary field strength, narrow frequency bandwidths, or limited sensitivity to certain resistivity differentiations and orientations of geoelectrical gradients.
To overcome these limitations, Expert Geophysics has developed the MobileMT system. This advanced passive airborne system measures the EM field across a broadband frequency range, spanning more than three orders of magnitude in frequency, typically starting from 26 Hz. This broad spectral coverage enables simultaneous sensitivity to both near-surface and deep structures. The system’s orthogonal three-component receiver provides directional sensitivity to any orientation of geoelectrical boundaries, making MobileMT particularly well-suited for exploration of covered terrains and geologically complex regions.
The large quantity of broadband frequency-domain data generated by MobileMT surveys require the use of robust inversion techniques to produce geologically meaningful models within a reasonable timeframe. Full 3D inversions remain computationally demanding and costly when applied to regional airborne survey blocks; purely 2D algorithms ignore the inherently 3D source field. In this work, we integrate MobileMT data with MARE2DEM (ver. 5.2), an open-source software (licensed under the GNU GPLv3 license) that utilizes parallelized, adaptive finite-element modeling, parallel linear algebra, and flexible structural regularization. Earlier studies have applied MARE2DEM to marine CSEM and MT, and Alumbaugh et al. [1] demonstrated its application with airborne passive-field ZTEM data. However, its extension to an airborne AFMAG-class system, where apparent conductivities are derived using spatially separated magnetic (H) and electric (E) stations, as in MobileMT, is novel. MARE2DEM performs 2.5D (or quasi-3D) inversion, where the subsurface conductivity model is 2D (invariant along strike), but the source field retains its natural 3D characteristics. This enables rapid processing of extensive airborne survey blocks and supports timely decision-making in exploration workflows. This inversion strategy offers a practical balance between computational efficiency and geological realism, allowing the rapid processing of large datasets without compromising structural detail. The approach supports early-stage exploration by identifying key structures and anomalous zones.
In this paper, we
-
Describe an automated mesh-generation routine that embeds separate, high-resolution sub-meshes beneath flight lines and the remote base station, capturing local electric-field scaling without inflating model size;
-
Validate the workflow on a field test line in the Abitibi Greenstone Belt, showing that base station position alters the apparent-resistivity curve shape but not the inverted resistivity sections;
-
Demonstrate the importance of retaining the upper-decade (>2 kHz) MobileMT data for resolving deep structures and conductors with the support of recovering near-surface geology.

2. MobileMT Technique Overview

MobileMT is a passive airborne EM system developed by Expert Geophysics Limited that utilizes natural EM fields for deep geophysical imaging. The operating principles of MobileMT (Appendix A) describe its basis, relating three-component airborne magnetic fields to two horizontal base station electric fields via a complex transfer tensor, from which rotationally invariant attributes are derived for orientation-independent mapping. Operating on the principles of audio-frequency magnetotellurics and magnetovariational techniques, MobileMT measures both magnetic (H) and electric (E) field variations across a broad frequency spectrum, typically from 26 Hz to 21,000 Hz. The mechanical or motion noise of the moving air sensor defines the lower frequency limit. This extended frequency range, divided into up to 30 windows, enables the system to recover geoelectrical structures from the near surface down to depths of 1–2 km, and even deeper in resistive terrains [2]. A characteristic feature of this broadband spectrum is a typical ‘dead-band’ in the range of approximately 1–5 kHz, where signal-to-noise ratios are often reduced. The extent and position of this dead-band window can vary and, in some cases, become narrower, depending on regional, seasonal, and temporal variations in the natural electromagnetic field.
Since the E-field data does not include spatial variations, the anomalous magnetic component, measured along survey lines, primarily drives the shape and location of apparent conductivity anomalies over survey areas.
The inductive sensor with three orthogonal coils implemented into the airborne EM technology provides the following significant advantages [2]:
-
Directional sensitivity to horizontal, vertical, and sloping geoelectrical boundaries;
-
Rotational invariance, eliminating the need for tilt corrections, which are not efficient in rugged relief and near 3D sources of anomalies and improving signal-to-noise in comparison with tipper measurements in the air.
The electric base station, equipped with two independent orthogonal pairs of grounded lines (“signal” and “reference”), delivers denoised and bias-free electric field variation data. The base station is usually located outside survey blocks, but preferably in the same geological terrain. Since electric field measurements are taken from a stationary single base station, MobileMT data is not influenced by spatial variations in the electric field, and the output quantity is normalized by the electric field measured at the base station. When both the airborne magnetic and stationary electric sensors are influenced by the same EM field signals, including natural variations and external noise, such as from marine short-period sources, the correlated component is interpreted as part of the external primary field. Only airborne magnetic variations uncorrelated with the stationary electric field are attributed to geological structures along the survey lines.
The stationary electric field component produces the following positive effects and features of the MobileMT configuration:
-
Elimination of galvanic distortion and the need for related static corrections;
-
Suppression of short-period surf and tidal EM noise in near-coastal surveys;
-
Reduced sensitivity to topographic effects compared with ground magnetotellurics (MT) in H-mode and with tipper data, because the MobileMT configuration is functionally equivalent to TE-mode, which is inherently less affected by topographic distortions than H-mode or tipper measurements [3].
In addition, the sensitivity of electric field measurements at the base station to local conductivity, where the base station is placed, causes a systematic scaling of the calculated apparent conductivity (reference effect), which is consistent for the entire survey block relative to the same base station. In practice, a priori knowledge about the host conductivity in a survey area is used for data calibration (if necessary) and to establish a suitable inversion starting model. There are situations when primarily near-surface geoelectrical conditions around the E-field base station scale the data only at high frequencies, thereby altering only the shape of the apparent conductivity (or resistivity) versus frequency curves with minimal influence on the overall level of apparent conductivities. This case is discussed below, accompanied by an example of a field test.
Compared to traditional ground MT, where both electric and magnetic fields are measured at each site, MobileMT acquires continuous, high-resolution magnetic field data from the air while referencing electric field measurements from a single fixed base station. Forward modeling over a compact conductor [4] shows that the apparent conductivity maps from MobileMT and ground MT configuration measurements exhibit similar anomaly locations. However, the reduction in apparent conductivity values over the conductor is greater and more widespread for ground MT, whereas MobileMT anomalies generally have comparatively lower amplitudes, as indicated by the forward modeling results.
Because the vertical component of the total magnetic field is typically much weaker than the horizontal components in most survey situations and only becomes significant in the presence of strongly 2D structures with linear current systems or pronounced 3D effects, MobileMT data inversion is generally based on the determinant of the 2 × 2 admittance tensor formed from the horizontal field components (as described in [4,5,6]). In this context, the apparent conductivity values, as they relate to frequencies, the main output of MobileMT surveys, can then be inverted using conventional MT inversion algorithms, modified to accommodate the spatial separation between the airborne moving sensor and the fixed position of the reference base station.
Considering the advantages outlined above, MobileMT surveys have proven effective in detecting both near-surface and deep-seated geoelectrical features, conductive and resistive, across various geologic environments and for variety of commodities, such as magmatic sulfide systems and VMS [7], polymetallic epithermal systems [2], unconformity-related uranium controlling structures [2,7], kimberlite pipes [2], porphyry-style systems [6], sedimentary copper [8], and orogenic gold [9].

3. Inversion Software, Data Preparation, and Inversion Workflow

MARE2DEM [10] supports arbitrary locations and rotations for receivers through its data formatting protocol, specifying which receivers or stations should be used for the magnetic fields of the MT response, and which receiver to use for the electric fields. This capability enables the accurate 2.5D inversion of MobileMT data under conditions of physical separation of the E- and H-field sensors, thereby preserving the geophysical integrity of the derived resistivity models.
MARE2DEM (Modeling with Adaptively Refined Elements for 2D EM) is designed for 2D forward modeling and inversion in EM geophysics. It solves the EM forward problem using adaptive finite-element methods on unstructured triangular meshes with flexible regularization strategies, allowing for an accurate representation of topography and complex geological boundaries [10,11]. It supports isotropic, transversely isotropic, and triaxial anisotropic conductivity models. Inversion parameters can be bounded individually, reducing the risk of nonphysical artifacts and ensuring numerical stability. The inversion is implemented using parallel dense matrix operations with ScaLAPACK, allowing for the efficient handling of very large-scale problems (e.g., >100,000 parameters). Enables preferential smoothness, known boundaries, and model prejudice via flexible roughness penalty functions and user-defined structural priors.
One of the strengths of the MARE2DEM algorithm is the use of the adjoint sensitivity method, which directly relates changes in deeper parts of the model to the measured responses, allowing the inversion to focus on fitting deeper features robustly. The method improves stability by utilizing a dual-weighted error estimator that downweights regions where near-surface inaccuracies have minimal impact on deep responses. This allows for the accurate recovery of deep conductors, even in the presence of complex near-surface geoelectrical conditions, by separating their effects through adaptive meshing and error weighting.
MARE2DEM is well-matched for MobileMT data inversion due to its ability to
-
Accurately model hybrid MT field configurations with E–H separation;
-
Resolve complex geoelectrical structures at multiple scales using adaptive meshing;
-
Handle large and data-intensive surveys typical for airborne EM through parallel inversion;
-
Support anisotropy and advanced inversion constraints needed for modern exploration.
The MATLAB-based Model Builder interface (Mamba2D, ver.2 and later) included in the MARE2DEM tools enables the construction of forward models with arbitrarily complex 2D geometries. The tool’s interactive graphical user interface supports generating inversion parameter grids using unstructured triangular or conforming rectangular meshes along a survey line. Triangular meshes offer many advantages, including accurate surface representation and flexibility in modeling and analysis.
Generally, for inversions of MobileMT data, the model comprises air and ground half-spaces (Figure 1). The ground surface (boundary between air and subsurface) is defined by the topography along the survey line and is extended with a straight line from the first and last point along the line to the edge of the model bounding box, which is usually set to 100 km × 100 km, but can be increased or decreased as desired. The resistivity of the air is always set as a fixed parameter with a resistivity of 1 gigohm-m. Beneath the topography line, a region of interest box is created and filled with a detailed mesh (Figure 2). A slight buffer of 10%–20% should be added to the predicted depth of investigation when defining the vertical extent of the region of interest box. The outer pad area surrounding the detailed mesh can be filled with arbitrarily larger triangles.
For massive and unconstrained MobileMT data inversions, the resistivity of the ground uniform half-space is set as a free parameter with an initial resistivity equal to the expected background resistivity value of the survey area.
Airborne survey blocks typically comprise numerous survey lines over variable terrain, and using the Mamba2D tool individually for each line, even without any additional constraints, is time-consuming. To address this, we developed a specialized software tool capable of automatically generating meshes, either unstructured triangular or conforming quadrilateral, for all lines within an entire survey block.
The automated process for mesh generation begins by considering a 100 km × 100 km bounding box model. The extents of this bounding box can be adjusted as required. The algorithm takes the length of a survey line and the topographic surface along the line as input. To avoid or at least reduce possible artifacts on the line’s ends (so-called “edge effect”), the area of interest is then defined by extending this line by a user-specified value (e.g., 500 m) at both ends. To define the bottom of the bounding box, the lowest elevation along the line is considered, and the bottom of the bounding box is calculated as the lowest elevation plus the user-defined depth of the model. The top of the region of interest box is defined by the topographic surface for the survey line. The area of interest is triangulated using external calls to the open-source constrained and conforming Delaunay triangulation code Triangle, as described in [12]. The user-specified maximum triangle length defines the resolution of the detailed mesh, while the surrounding pad area is meshed with arbitrarily large triangles. With some manipulation of the files, the *.resistivity and *.poly files required for input to MARE2DEM can be produced without any user involvement, except for specifying the mesh parameters or for preparing constrained inversions. Additionally, an algorithm has been developed to generate rectangular meshes automatically. It operates similarly to the previously described method but uses a rectangular mesh instead of a triangular one in the region of interest. The rectangles have user-specified height and width (Figure 3). This approach is suitable only when the terrain can reasonably be approximated as flat.
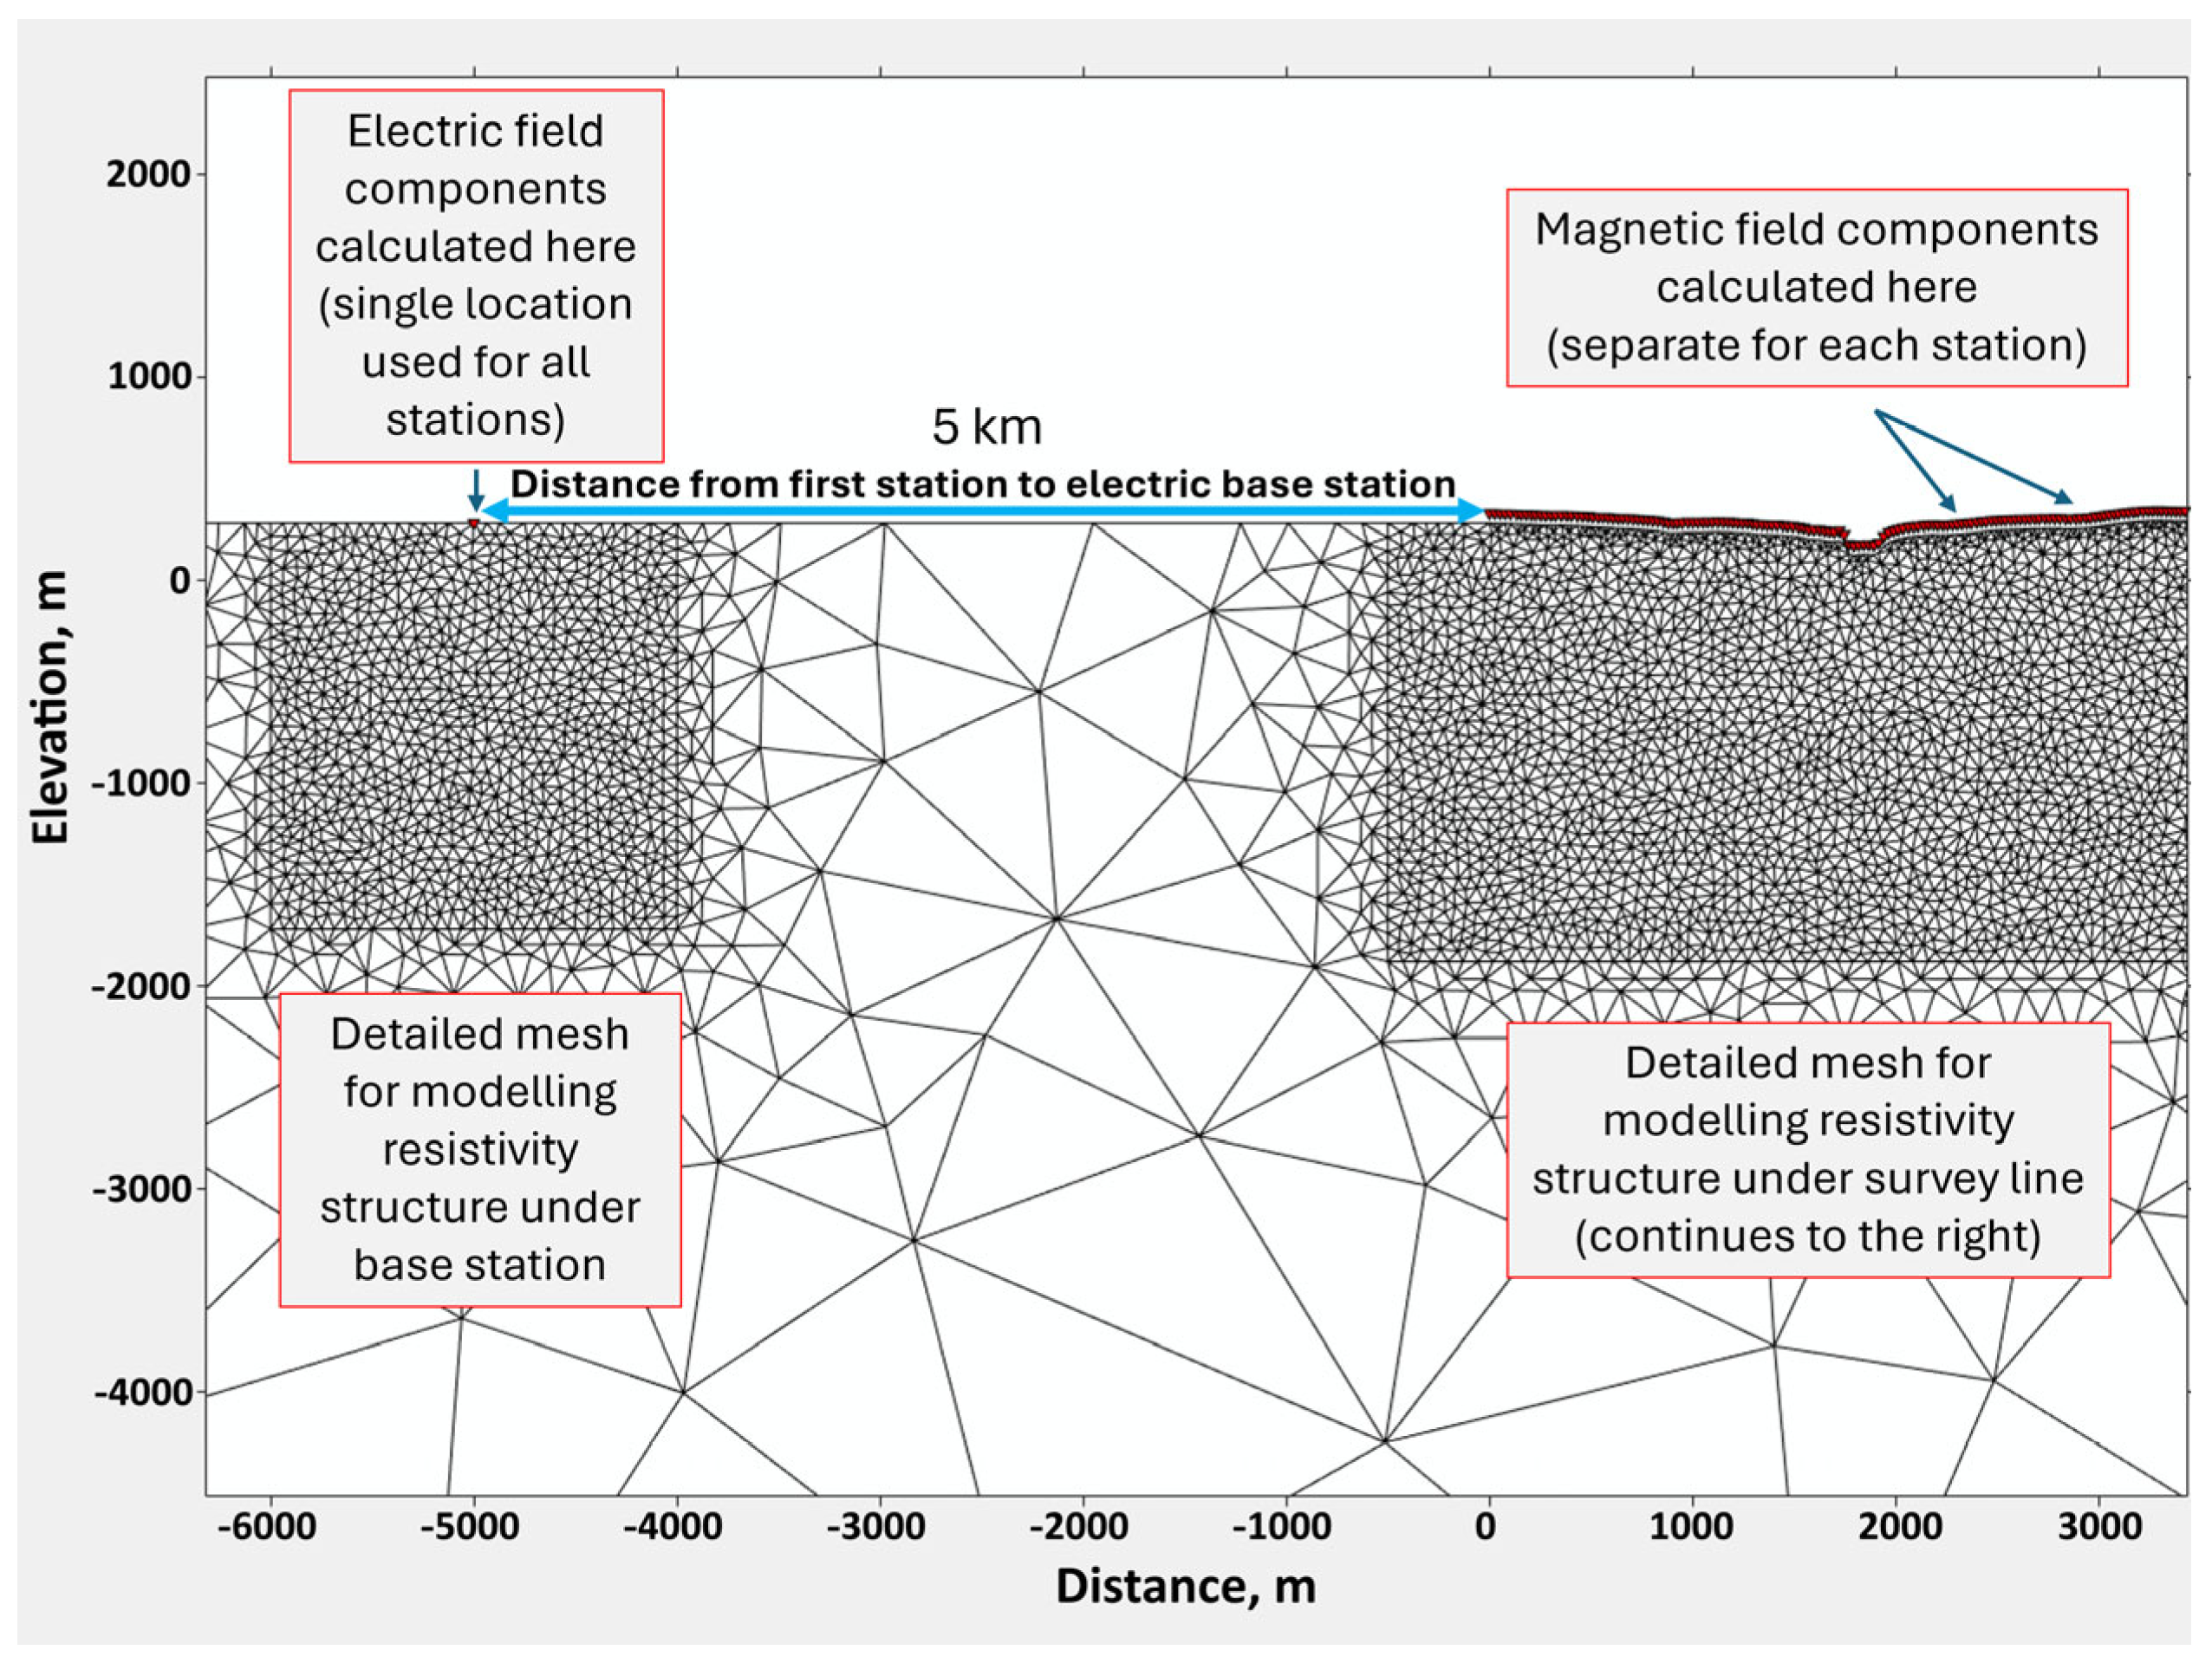
To account for the E-field base station separation from survey H-field measurements during modeling, a smaller box with a detailed mesh is created a distance away from the survey line (Figure 4). In the inversion, MARE2DEM’s hybrid station capability allows magnetic fields from the flight line and electric fields from an offset base station to be jointly modeled within a mesh containing both locations. This allows the separate and distinct resistivity structure under the stationary base station and the survey line to be considered in the modeling.
The generation of the smaller detailed mesh under the base station is built into the previously described automatic mesh generation algorithm. The user must only specify the distance of the base station from the first station of the survey line and the lateral extent of the detailed mesh around the base station location.

4. Test Field Examples with MARE2DEM Inversions and Analysis

The following test field examples are presented to demonstrate
(1)
The impact of local geoelectrical conditions at the base station location on apparent conductivity datasets and their corresponding inversion results (Field Example 1);
(2)
The effect of including high-frequency data on the recovery and resolution of deep structures, particularly in the presence of a comparatively conductive near-surface layer within an overall resistive environment (Field example 2).

4.1. Field Example 1: Effect of Base Station Location on Apparent Conductivities Curves and the Data Inversions

Cowan et al. [13] stated that the local geoelectrical conditions at the base station influence data acquired by systems using an electric field base station. This influence appears because the electric fields measured at the base station scale the airborne magnetic fields. The local geoelectrical conditions at the electric field base station may influence the computed apparent conductivity (or resistivity) data in two ways: (1) shifting the amplitude of the apparent conductivities, and (2) changing the shape of the apparent conductivity (or resistivity)–frequency curve. As noted earlier, for the first case, the amplitudes of apparent conductivities can be corrected by scaling based on a priori knowledge of the host resistivity. In this test field example, we demonstrate that while different base station locations around a survey block can alter the shape of apparent conductivity (or resistivity)–frequency curves, the impact on the final resistivity sections after inversion with MARE2DEM is minimal.
The test survey line was acquired using two independent base stations (BS), which recorded variations in the electric field simultaneously during data collection. The same three-component magnetic field variations dataset was used twice, with reference to BS1 and BS2, separately, to produce two separate apparent conductivity–frequency datasets. The distance between the base stations was 7.1 km, as shown in Figure 5.
The survey line is situated within the Abitibi Greenstone Belt in northern Ontario. The supracrustal rocks in the survey area comprise a thick sequence of mafic to ultramafic units, predominantly of volcanic origin. The volcanic assemblage is intruded by large, weakly foliated granodioritic to tonalitic intrusions and is often overlain by chemical sedimentary layers ~200 m thick.
All apparent resistivity curves collected along the test line, which extends for more than 20 km, are presented in Figure 6, grouped into two sets corresponding to BS1 and BS2. The differences in curve shapes, particularly at higher frequencies, reflect variations in the near-surface geoelectrical conditions at the two base stations. BS2, located in a more conductive environment, results in generally lower apparent resistivities and altered curve shapes. These variations illustrate the sensitivity of the airborne system to shallow base station effects, which are subsequently minimized during inversion.
The color gradient in the profiles in Figure 7 represents frequencies from low to high, with high-frequency data showing stronger sensitivity to shallow near-surface conditions. The differences between the two sets of profiles are consistent with the base stations’ differing local conductivities.
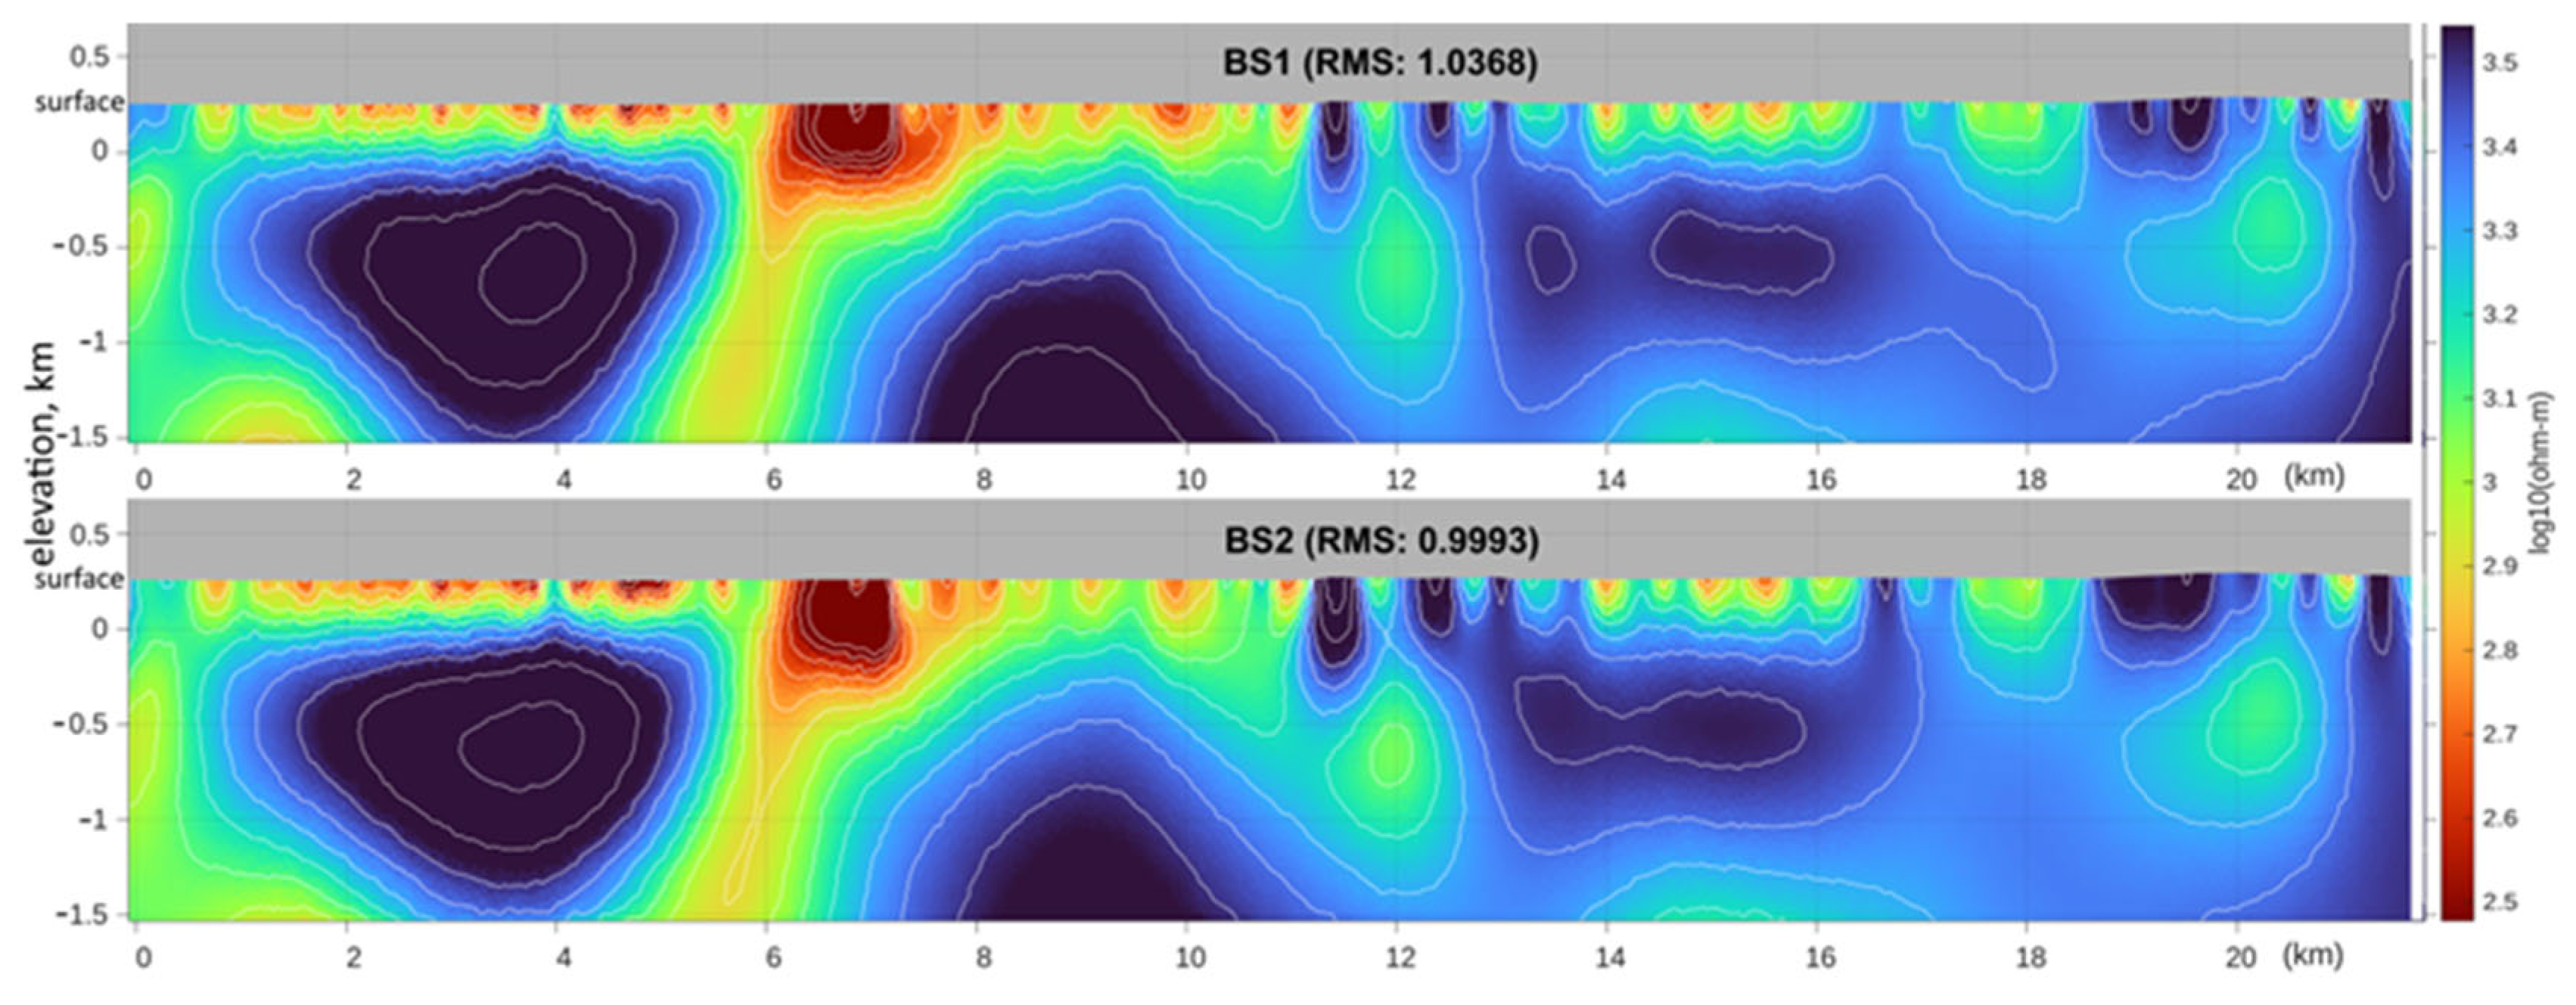
Both sets of data (for BS1 and BS2, as shown in Figure 7) were inverted into resistivity-depth images (Figure 8) using MARE2DEM. The initial models consisted of uniform half-spaces. No constraints were applied during the inversion processes. As the field test results show, quasi-3D inversions of MobileMT datasets related to different electrical base stations located in different near-surface geoelectrical conditions tend to converge toward identical geological solutions with minor differences. Thus, while the initial apparent conductivity curves show differences attributable to the local site conditions at base stations, the comprehensive inversion strategy implemented in MARE2DEM minimizes the effects of these differences, producing stable and consistent resistivity-depth imaging of subsurface geological structures.
Each base station sits on its own patch of near-surface geology, so the apparent-conductivity curves recorded at BS1 and BS2 diverge, especially at the high-frequency end, which is most sensitive to shallow heterogeneities. MARE2DEM overcomes these local biases in two ways:
-
Reference station normalization: Apparent conductivities are first computed by normalizing the acquired airborne magnetic spectra by the electric-field spectra from a single base station. MARE2DEM then inverts these apparent conductivity data, removing the frequency-dependent amplitude bias introduced by the shallow ground beneath the base station.
-
A full update of the Jacobian elements is provided at each iteration of the finite-element inversion. The algorithm honors the correct frequency behavior of the EM field while it adjusts the resistivity model to fit the data.
Despite the shape differences in apparent conductivity (or resistivity)–frequency curves, both inversions converge on virtually identical resistivity sections: depths, shapes, and lateral extents of conductive and resistive units match, confirming that the workflow reliably retrieves geologically meaningful targets while minimizing the effects of shallow geoelectrical conditions at a base station location.
Mathematically, the apparent resistivity ρa(f), in ohm-m, is related to the admittance transfer function Y(f) by
ρa(f) = 1/µ0ω(|Y(f)|2),
where µ0 is the magnetic permeability of free space (4π × 10−7 H/m), and ω is the angular frequency of the electromagnetic signal (2πf).
Y(f) is proportional to the complex ratio of airborne and base station fields:
Y(f) ∝ Hair(f)/Ebase(f),
where Ebase(f) reflects the base station’s comparatively near-surface geoelectric environment.
While this E base station location effect alters the shapes of apparent resistivity curves (as observed in Figure 6 and Figure 7), the inversion procedure implemented within MARE2DEM compensates for such distortions during the model updates, normalizing the Hair(f) data by the stationary Ebase(f). The inversion’s sensitivity to deeper structures, especially at low frequencies, dominates the overall solution. In the result, the inversion reliably reconstructs the same subsurface structures, with only minor differences between the results from data considering each of the two base stations.

4.2. Field Example 2: Impact of High-Frequency Data on Resistivity Imaging

The Mann Lake Project [14], situated in the southeastern Athabasca Basin in northern Saskatchewan (Canada), lies approximately 15 km northeast of the Millennium uranium deposit and 25 km southwest of the McArthur River Mine—the world’s largest high-grade uranium deposit. Uranium mineralization in this region is commonly associated with the unconformity contact between the late Paleoproterozoic to Mesoproterozoic Athabasca Group sedimentary rocks and the underlying Archean to early Paleoproterozoic basement at depths exceeding 500 m [15]. The Mann Lake prospect is located within the Wollaston–Mudjatik Transition Zone (WMTZ), a major crustal-scale structural corridor in the eastern Athabasca Basin.
The region is also covered by a complex assemblage of Quaternary glacial deposits, including till, glaciofluvial sands and gravels, drumlins, eskers, and glaciolacustrine clays, with thicknesses ranging from 10 m to over 100 m [16].
An airborne MobileMT survey performed in 2022 identified several conductive targets within the Mann Lake Project, including zones along the unconformity and within the basement [17]. Follow-up drilling confirmed several of these conductors. Notably, drillhole MN22-008 (910 m deep) intersected graphite, pyrite, and chalcopyrite mineralization near the unconformity, which is located at approximately 649 m below the surface [18].
To investigate the impact of including high-frequency (HF) apparent conductivity data on inversion results, two inversions were conducted over a survey line crossing drillhole MN22-008:
-
Dataset 1 (low frequencies only, LF): 12 frequencies ranging from 26 Hz to 338 Hz;
-
Dataset 2 (low + high frequencies, LF+HF): The same 12 frequencies plus 3 higher frequencies at 5382, 6786, and 8550 Hz.
Both datasets were inverted using identical inversion parameters, with a noise floor of 2% and a maximum of 20 iterations allowed.
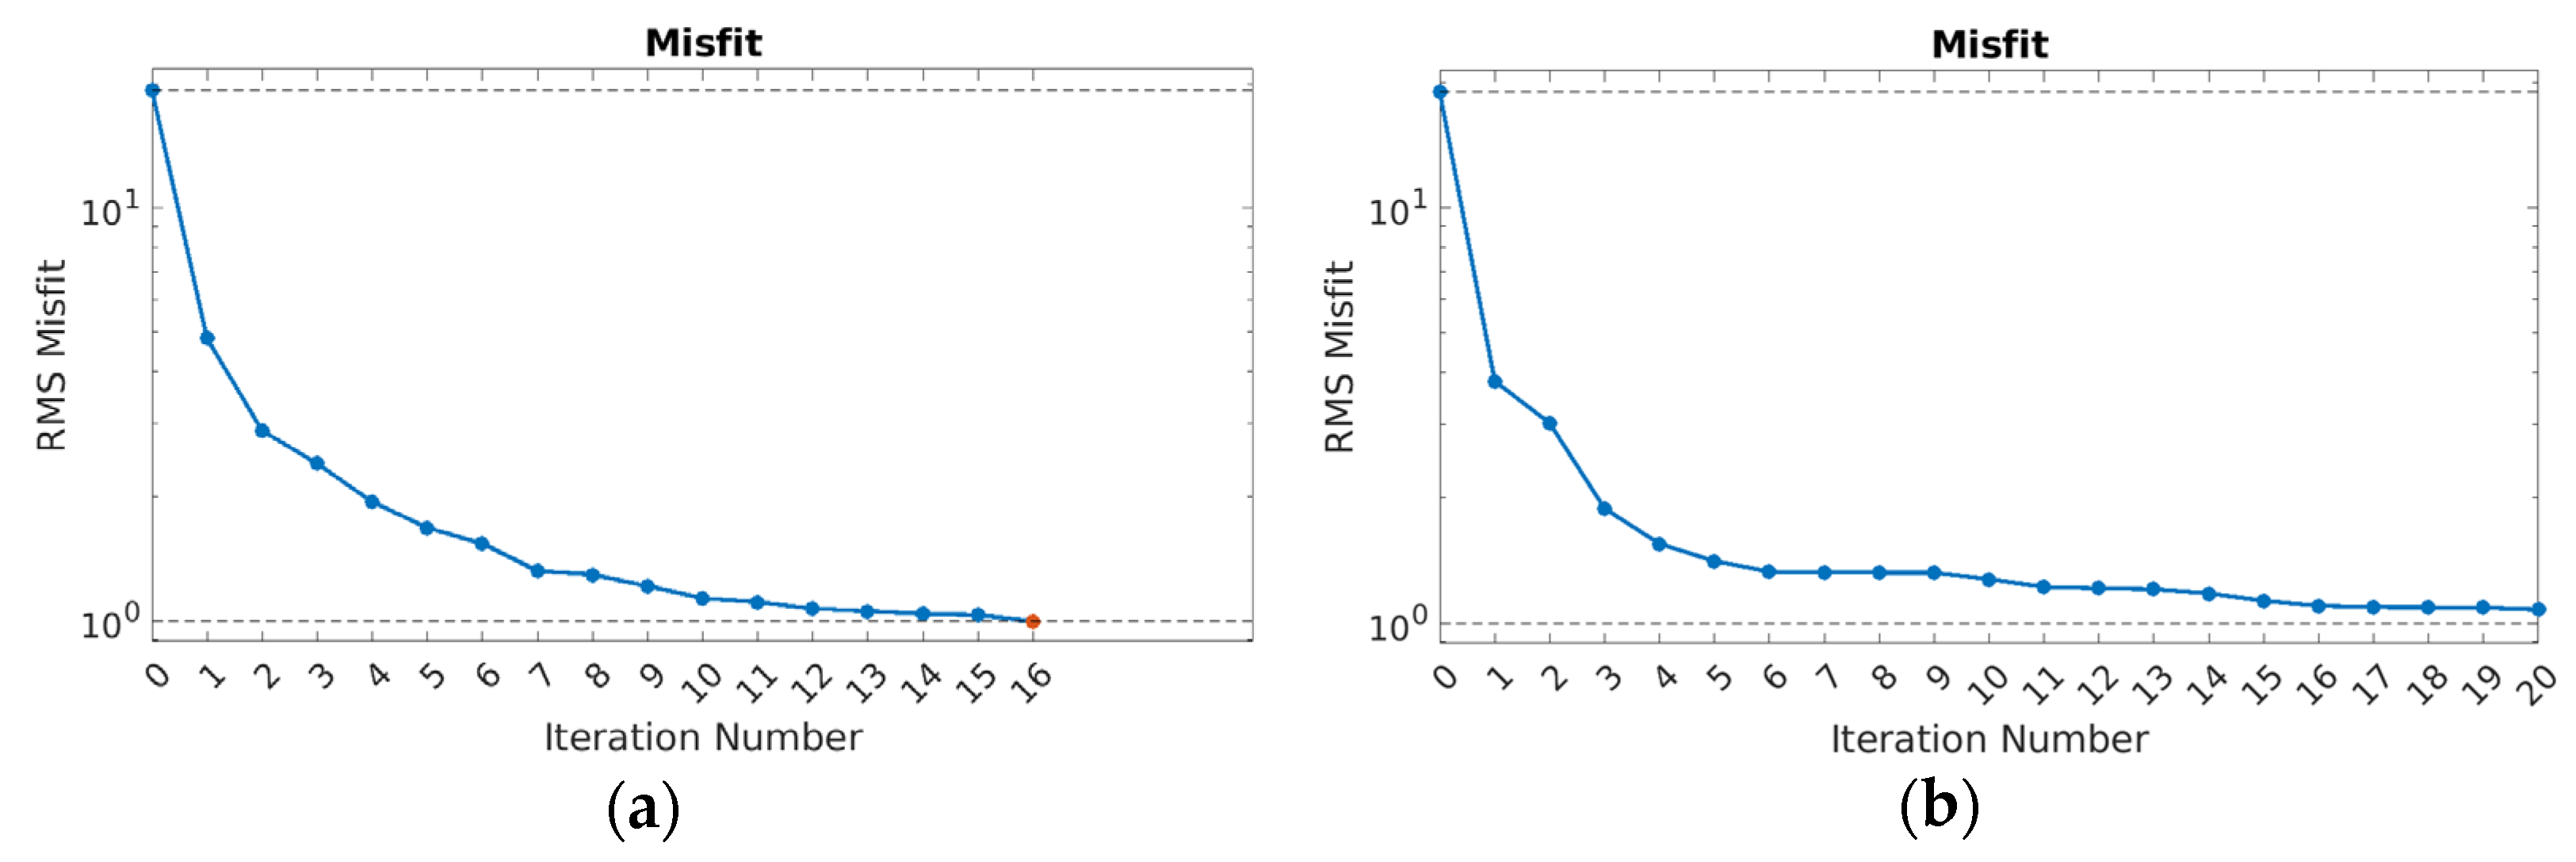
Inversion using the broadband dataset (with HF) converged more rapidly, achieving the target root-mean-square (RMS) misfit by iteration 16 (Figure 9a). In contrast, the inversion without high frequencies failed to converge within the iteration limit, suggesting slower and less stable inversion performance when HF data are excluded (Figure 9b).
The difference in the conditioning of frequencies is quantitatively reflected by the evolution of the model roughness norm (Figure 10a,b):
‖Rm2 = mT RT R m,
where R is the first-difference roughness operator, so ‖Rm2 is the standard Tikhonov roughness norm used in the inversion;
m is the current model vector being updated during the inversion. In this paper (and in MARE2DEM generally), it is defined as m = log σ, i.e., the logarithm of conductivity (or, equivalently, the negative logarithm of resistivity) for every cell in the 2D mesh;
T is the matrix, or vector transpose.
Figure 10a plots ‖Rm2 versus iteration for the broadband (HF + LF) inversion.
Roughness climbs monotonically after iteration 3, stabilizing at ≈38 by iteration 16.
Figure 10b shows the same metric for the LF-only run. Roughness plateaus early and never exceeds ≈11, even after four extra iterations, making the resistivity-depth model around 3.5 times smoother than the inversion of HF + LF data.
Comparison of sensitivity histograms derived from the MobileMT data inversion along the test line with and without high-frequency (HF) data included in Figure 11. In both histograms, the horizontal axis shows log10 (Sensitivity), representing the logarithm (base 10) of sensitivity matrix entries from the inversion Jacobian, while the vertical axis indicates the count, i.e., the number of sensitivity matrix entries falling within each sensitivity bin.
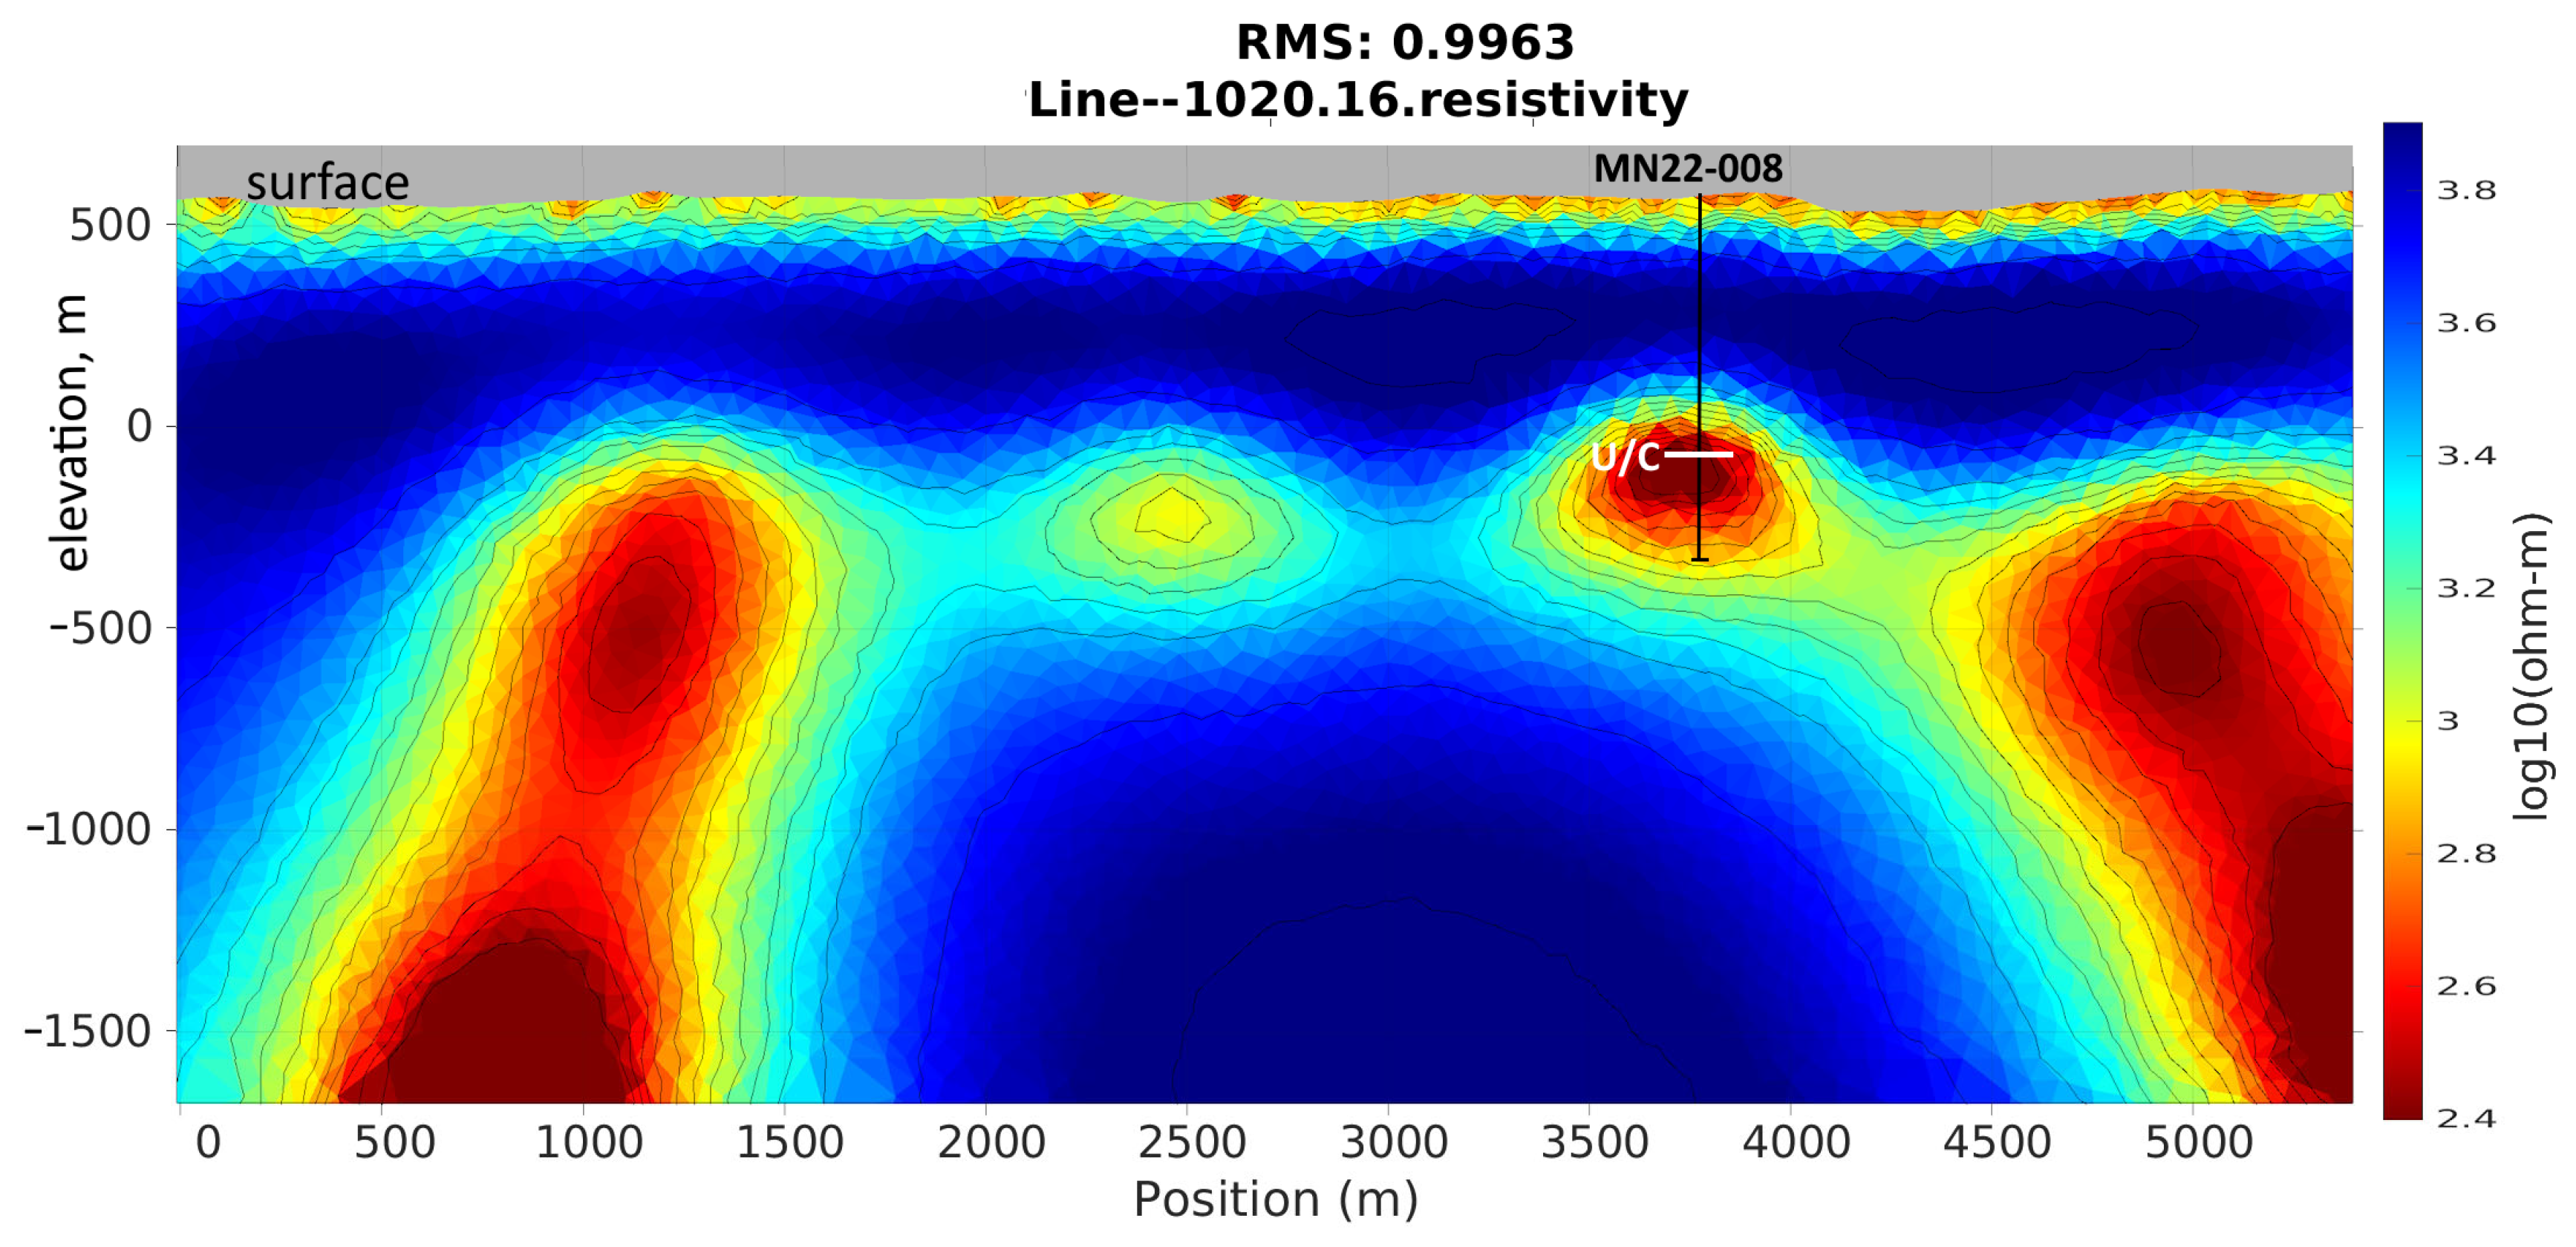
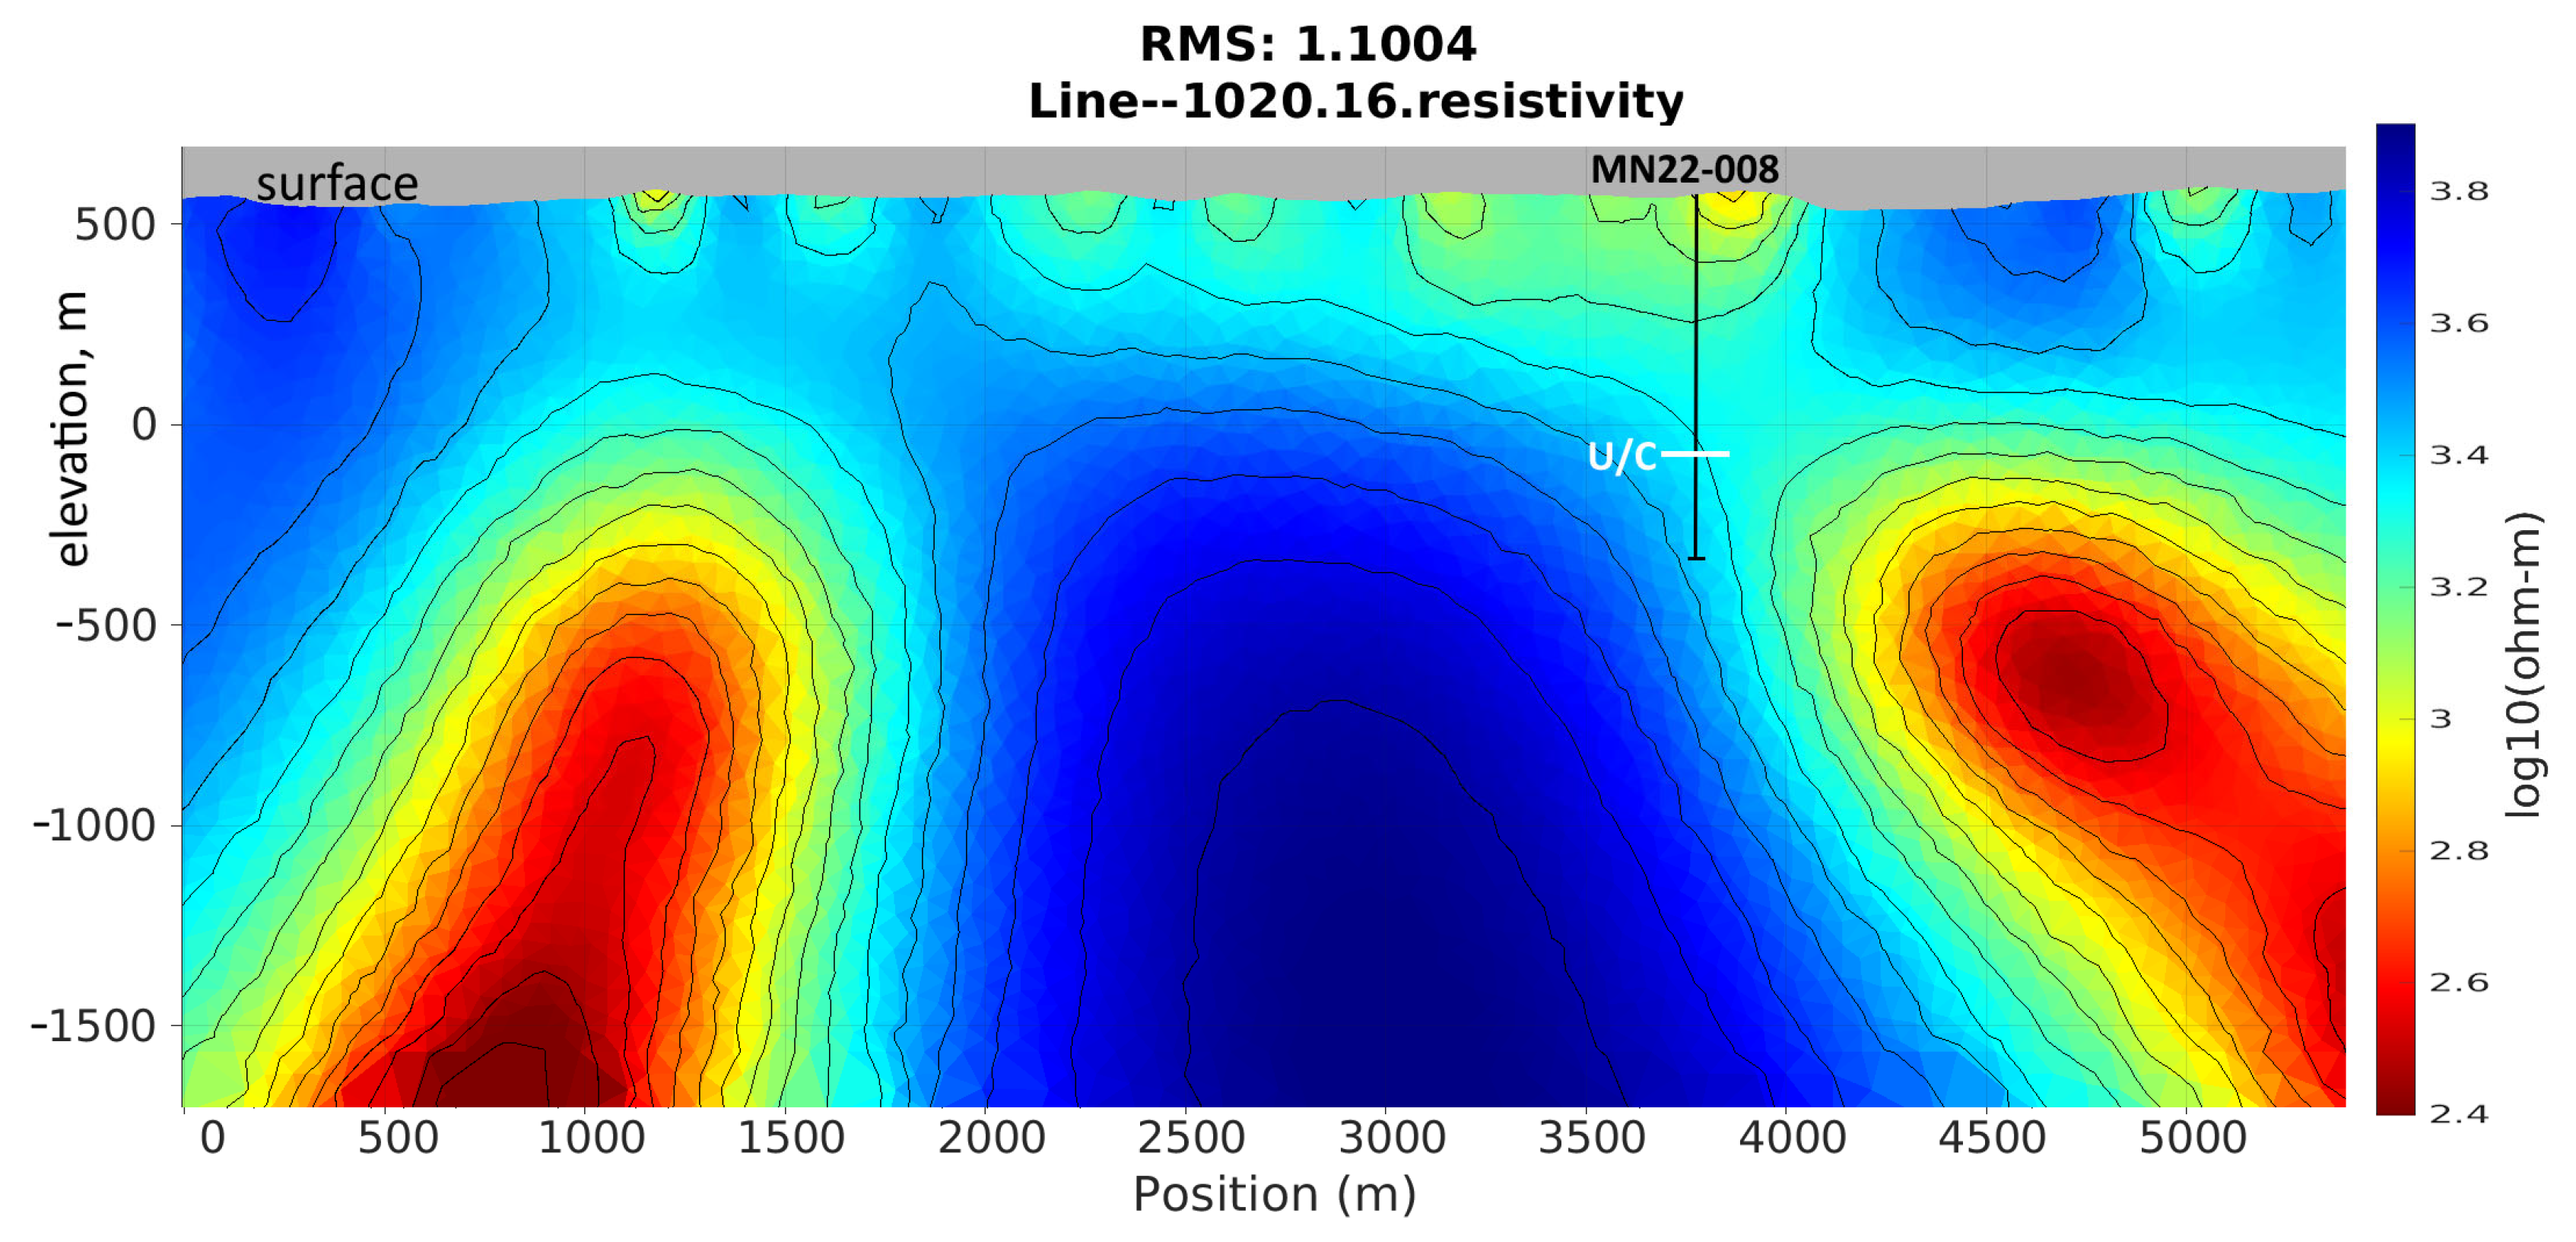
Figure 12 and Figure 13 present the resulting resistivity sections for iteration 16 in both scenarios. As can be seen in the resistivity-depth image in Figure 12, inversion with high frequencies.
-
Clearly resolves shallow conductive features; the comparatively conductive layer on the surface most likely corresponds to the glacial sediment cover documented in the region [16];
-
Defines the thickness of the Athabasca Basin Group sandstones and the unconformity contact more accurately;
-
Recovers the deeper conductor near the unconformity, confirmed by drillhole MN22-008, with well-defined geometry;
-
Demonstrates both improved shallow resolution and enhanced deep structure delineation.
Inversion without high frequencies shows (Figure 13)
-
Poor resolution of near-surface layers, while barely recovering the glacial sediments;
-
More diffuse inversion results, showing a smearing of deeper conductors and displaced or poorly resolved anomalies;
-
Broader, less sharply defined conductive and resistive zones with greater depth uncertainty;
-
Slow convergence due to greater non-uniqueness caused by unresolved shallow structures.
This example demonstrates that including high-frequency data improves both near-surface and deep resistivity imaging in MobileMT data inversions. High frequencies enable clearer detection of shallow layers and refine the geometry of deeper targets by constraining inversion ambiguity. In highly resistive environments, like the Athabasca Basin, broadband frequency coverage is essential for achieving reliable and geologically meaningful inversion results.
Next, we interpret and explain the empirical test results from a theoretical standpoint.
The skin depth fundamentally governs the improved performance with high-frequency data δ of electromagnetic fields:
δ = 2 / μ 0 σ ω     ,
where
-
μ0 = magnetic permeability of free space (4π × 10−7 H/m);
-
σ = electrical conductivity (S/m);
-
ω = angular frequency (2πf).
In general, higher frequencies (f) correspond to smaller skin depths (δ), enabling the detection of fine-scale near-surface resistivity variations. However, even high-frequency EM data can represent significant depths due to their increased skin depth in highly resistive environments, such as the Athabasca Basin.
Additionally, high-frequency data enhances near-surface resolution and stabilizes inversion results by reducing ambiguity between shallow and deep structures [19].
This statement can be supported by the following reasoning.
Suppose the frequency–depth sensitivity kernel relating the data to the conductivity σ at depth z is denoted by K(f, z). Then, a frequency-dependent parameter d(f) derived from field measurements (such as apparent conductivity) can be expressed as
d ( f ) = 0 K f ,   z σ z d z .
For a horizontally layered reference model:
K f , z     e x p [ 2 z / δ ( f ) ] , w h e r e δ f =   2 μ σ 2 π f
For high frequencies, K(f,z) is strong at shallow depths and negligible at greater depths. For low frequencies, K(f,z) is broader and extends deeper, but is still affected by shallow layers, especially if the layers are comparatively conductive.
Therefore, errors in shallow σ(z) affect the inversion results at depth:
-
Shallow σ(z) is underconstrained without HF data, and the error propagates into depth;
-
Shallow σ(z) is tightly constrained with HF data, and deep recovery becomes more robust.
Following [10], linearizing the forward operator around the current model yields the Gauss–Newton update:
Δm = (JT Wd J + λWm)−1 JT Wd(dobsF(m0)),
where J is the Jacobian, Wm is a roughness operator, and λ is the trade-off weight.
Because JTWdJ contains all depth rows, shallow sensitivities control the conditioning of the entire inverse system: if HF rows are absent, the matrix loses rank, λWm dominates, and the solution is forced to be smoother, as can be seen in Figure 10b and the related Figure 13.
The corresponding model-resolution matrix [19], defined as the update operator from (7) is
R = (JT Wd J + λWm)−1 JT Wd J
Adding HF data restores rank, raises eigenvalues, and drives Rii  →  1 throughout the model, i.e., deep cells become better resolved.
Figure 11a,b plot the distributions of log10 (Sensitivity) for the same MobileMT test survey line as follows:
  • HF + LF inversion (Figure 11a): A wide distribution with a strong right-hand tail reflects many large-magnitude sensitivity entries; near-surface constraints are strong, and a useful tail persists through increasing depth.
  • LF-only inversion (Figure 11b): The right, most sensitive tail is truncated; high-magnitude entries disappear and the overall distribution narrows, indicating diminished near-surface control and a less stable deep solution.
These histograms visualize exactly what Equations (7) and (8) predict: broadband data provide better-conditioned Jacobians and, therefore, more information at greater depth.
The roughness norm (Equation (3)), which was tracked during the inversions, further confirms the MobileMT test results (Figure 10a,b):
-
HF + LF run (Figure 10a): Roughness increases steadily after iteration 3 and stabilizes ≈38, showing that genuine geological gradients are preserved.
-
LF-only run (Figure 10b): Roughness plateaus early at ≈11; the algorithm must over-smooth the model to offset the rank loss caused by missing HF rows.
The three- to four-fold roughness gap is the numerical signature of the conditioning argument: lacking HF rows, the inversion leans on the damping term λWm; with HF present, λ can be smaller, and the model remains appropriately rough.
The practical implications of the test are as follows:
  • High-frequency data are indispensable, not optional, especially in highly resistive environments where skin depths of high frequencies are significant. They secure strong, comparatively shallow sensitivities, improve the condition number of JT Wd J, and raise the resolution matrix toward the identity at all depths.
  • Broadband inversion relaxes the need for heavy smoothing, allowing legitimate resistivity gradients to persist.
  • Field sections Figure 12 and Figure 13 confirm the following theory: only the HF + LF inversions simultaneously respect near-surface control and delineate deep conductors, whereas LF-only inversion runs smear shallow interfaces and miss and mis-position deep targets.
Together, Equations (3) and (5)–(8), the sensitivity histograms (Figure 11a,b), and the roughness plots (Figure 10a,b) constitute theoretical–statistical–iterative proof that including high frequencies is the key to accurate deep-structure recovery in MobileMT inversions, specifically in resistive environments.

5. Conclusions

The integration of broadband, three-component MobileMT data with the adaptive 2.5-D finite-element engine of MARE2DEM provides a practical route to imaging conductive and resistive features from the surface to >1–2 km depths across regional airborne surveys. This combination can produce geologically reliable resistivity images fast enough for modern exploration cycles. Field trials demonstrated that retaining the upper-decade frequencies (>2 kHz) is essential for refining deep structures and targets, particularly in resistive environments, and that remote station scaling, while it distorts apparent-resistivity curve shapes, leaves the recovered resistivity sections essentially unchanged when an adaptive mesh and goal-oriented regularization are used. Resolution sensitivity analysis of EM inverse problems on field data shows that adding high-frequency moments (preferably above 800–1000 Hz) stabilizes the Gauss–Newton Jacobian and suppresses the ambiguity between shallow and deep parameters, thereby extending the practical depth of investigation and preserving sharp conductivity contrasts.
Automated mesh generation routines further reduce turnaround time, enabling rapid target ranking and model updates over hundreds and thousands of line-kilometers. Together, these advances position MobileMT as a cost-effective tool for exploration under cover, capable of detecting mineralization-related structures that elude conventional airborne EM techniques.
Despite the achievements in technique development and success in integrating modern inversion approaches, there are practical problems that demand future research. We see the following directions for future research. The present workflow assumes a quasi-2D geology; strongly 3D settings may require the development of a fully 3D adaptive approach, at least over comparatively discrete anomalies or zones of interest. Additionally, ongoing research should aim to quantify the optimal placement of base stations.

Author Contributions

Conceptualization, A.P. (Alexander Prikhodko); methodology, A.P. (Alexander Prikhodko), A.S., and A.P. (Aleksei Philipovich); validation, A.P. (Alexander Prikhodko) and A.S.; software, A.S.; analysis, A.P. (Alexander Prikhodko); inversions, A.S., A.P. (Aleksei Philipovich), and A.P. (Alexander Prikhodko); writing—original draft preparation, A.P. (Alexander Prikhodko) and A.S.; writing—review and editing, A.P. (Alexander Prikhodko), A.S., and A.P. (Aleksei Philipovich); visualization, A.P. (Alexander Prikhodko), A.S., and A.P. (Aleksei Philipovich); supervision, A.P. (Alexander Prikhodko). All authors have read and agreed to the published version of the manuscript.

Funding

This research received no external funding.

Data Availability Statement

Some data supporting the reported results can be requested from Expert Geophysics Surveys, Inc.

Acknowledgments

The authors express their sincere gratitude to the field crews, technicians, engineers, and data processors at Expert Geophysics, whose expertise, dedication, and meticulous efforts in data acquisition and processing were essential to the success of the surveys and analyses presented in this study. We also thank the anonymous reviewers for their insightful comments and constructive suggestions, which significantly improved the clarity and quality of the manuscript.

Conflicts of Interest

The authors are employees of Expert Geophysics Surveys Inc. The paper reflects the views of the scientists and not the company.

Abbreviations

The following abbreviations are used in this manuscript:
EM Electromagnetic
MTMagnetotelluric
2DTwo-dimensional
3DThree-dimensional
LFLow-frequency
HFHigh-frequency
BSBase station
MARE2DEMModeling with Adaptively Refined Elements for 2D EM
ScaLAPACKScalable Linear Algebra PACKage

Appendix A

The MobileMT system comprises two primary modules:
-
A mobile airborne magnetic sensor, towed beneath a helicopter or drone, with three orthogonal dB/dt inductive coils for recording magnetic field variations:
H t = ( H x t ,   H y t ,   H z ( t ) ) T
-
A stationary ground-based electric field receiver, consisting of two perpendicular pairs of grounded wire lines, measuring horizontal E-field variations, used for remote reference processing:
E 0 t = ( E x 0 t ,   E y 0 t ) T
The H and E0 components are synchronized to GPS time (t).
Following [20], and accounting for the electric field base station, the magnetic field variations measured by the moving three-component sensor can be expressed in terms of the horizontal base station components via a 3 × 2 tensor S(f). At each frequency f, the relationship between the airborne magnetic field vector and the ground-measured electric field vector is expressed as follows:
H f = S f E 0 ( f )
where
-
S(f) is a 3 × 2 matrix of complex, frequency-dependent transfer coefficients that relate the two orthogonal electric field components measured at the base station to the three orthogonal magnetic field components measured in the airborne module. The transfer tensor S(f) inherently contains the responses for all source polarizations present in the natural EM field;
-
H(f) and E0(f) are the Fourier-transformed components of airborne and base station data, respectively.
The tensor S(f) is estimated via complex least squares:
S ^ = H E 0 H ( E 0 E 0 H ) 1 .
Because survey conditions may cause variations in orientation between the airborne sensors and the ground dipoles, interpretation is based on rotationally invariant parameters derived from S(f). Let s1 and s2 be the two columns of the S(f) matrix. Common invariants include the following:
(1)
Cross-product vector:
K = s1 × s2.
Magnitude |K| is invariant under simultaneous rotation of both coordinate frames and represents the area gain from the two-component reference electric field to the airborne three-component magnetic field:
K = K x 2 + K y 2 + K z 2 .
This attribute can be considered an analog of the root-mean-square (RMS) impedance in AMT, as it combines information from both principal polarizations into a single, orientation-independent quantity.
(2)
Singular value decomposition of the transfer tensor defined under (A3):
S(f) = U diag(σ1, σ2) VT,
where U is the orthonormal basis for airborne magnetic responses; σ1 and σ2 are singular values (rotation-invariant amplitude measures); V is the orthonormal basis for base station electric inputs. The parameters, area gain IA = σ1 σ2 (which is equal to |K| defined above) and shape ratio IR = σ12, both are invariant to sensor orientation.
(3)
The norm gain, which is defined as the ratio of the total amplitude of the three-component airborne magnetic field to the total amplitude of the two-component base station electric field:
Γ f = | H f | | | E 0 f | |
where the Euclidean norms are
H ( f ) = | H x f | 2 + | H y f | 2 + | H z f | 2 ,
E 0 f = E x 0 f 2 + E y 0 f 2 .
Here Hx, Hy, and Hz are the complex spectral values of the airborne magnetic field components, and E x 0   a n d   E y 0 are the complex spectral values of the base station electric field components at frequency f.
Note: Although Γ is a scalar quantity, it is derived from the full 3 × 2 complex transfer tensor S(f). The MobileMT system is inherently a multicomponent (vector/tensor-based) EM measurement system, not a scalar one.
This configuration enables the derivation of frequency-dependent admittance tensors through robust spectral estimation techniques. These tensors are used to calculate total field apparent conductivities invariant to the sensors’ orientation [2].

References

  1. Alumbaugh, D.; Huang, H.; Livermore, J.; Velasco, M.S. Resistivity imaging in a fold and thrust belt using ZTEM and sparse MT data. First Break 2016, 34, 65–72. [Google Scholar] [CrossRef]
  2. Prikhodko, A.; Bagrianski, A.; Wilson, R.; Belyakov, S.; Esimkhanova, N. Detecting and recovering critical mineral resource systems using broadband total-field airborne natural source audio frequency magnetotellurics measurements. Geophysics 2024, 89, WB13–WB23. [Google Scholar] [CrossRef]
  3. Saini, S.; Tyagi, D.K.; Kumar, S.; Sehrawat, R. Modelling of the terrain effect in magnetotelluric data from the Garhwal Himalaya region. Nonlinear Process. Geophys. 2024, 31, 175–184. [Google Scholar] [CrossRef]
  4. Cowan, D.C.; Understanding MobileMT Data. UBC-GIF 2023. Available online: https://giftoolscookbook.readthedocs.io/en/latest/content/comprehensive_workflow/mmt/1_basic_anomalies.html (accessed on 15 July 2025).
  5. Sattel, D.; Witherly, K.; Kaminski, V. A brief analysis of MobileMT data. In Proceedings of the 89th Society of Exploration Geophysicists International Exposition and Annual Meeting, San Antonio, TX, USA, 15–20 September 2019. [Google Scholar] [CrossRef]
  6. Jorgensen, M.; Zhdanov, M.S.; Gribenko, A.; Cox, L.; Sabra, H.E.; Prikhodko, A. 3D Inversion and Interpretation of Airborne Multiphysics Data for Targeting Porphyry System, Flammefjeld, Greenland. Minerals 2024, 14, 1130. [Google Scholar] [CrossRef]
  7. Prikhodko, A.; Bagrianski, A.; Kuzmin, P. Airborne Natural Total Field Broadband Electromagnetics—Configurations, Capabilities, and Advantages. Minerals 2024, 14, 704. [Google Scholar] [CrossRef]
  8. White Cliff Minerals Limited. Geophysical Anomalies Reveal New Copper Targets at Rae Project. White Cliff Minerals Limited (ASX:WCN). Available online: https://www.listcorp.com/asx/wcn/white-cliff-minerals-limited/news/geophysical-anomalies-reveal-new-copper-targets-at-rae-3118754.html (accessed on 15 July 2025).
  9. Prikhodko, A.; Sirohey, A.; Bagrianski, A. Exploration for Deep Gold-Bearing Structures with Natural Field Airborne Electromagnetics. In Proceedings of the 17th SAGA Biennial Conference & Exhibition, Sun City, South Africa, 28 November–1 December 2022. Extended Abstracts. [Google Scholar]
  10. Key, K. MARE2DEM: A 2-D inversion code for controlled-source electromagnetic and magnetotelluric data. Geophys. J. Int. 2016, 207, 571–588. [Google Scholar] [CrossRef]
  11. MARE2DEM. About MARE2DEM. 2022. Available online: https://mare2dem.bitbucket.io/master/about.html (accessed on 15 July 2025).
  12. Key, K.; Weiss, C. Adaptive finite-element modeling using unstructured grids: The 2D magnetotelluric example. Geophysics 2006, 71, G291–G299. [Google Scholar] [CrossRef]
  13. Cowan, D.C.; Heagy, L.J.; Oldenburg, D.W. Airborne Natural Source Electromagnetics for an Arbitrary Base Station. Geophys. J. Int. 2025, 241, 1962–1975. [Google Scholar] [CrossRef]
  14. Basin Uranium Corp. Mann Lake Project. Available online: https://basinuranium.ca/mannlake-project/ (accessed on 17 July 2025).
  15. Jefferson, C.W.; Thomas, D.J.; Gandhi, S.S.; Ramaekers, P.; Delaney, G.; Brisbin, D.; Cutts, C.; Quirt, D.; Portella, P.; Olson, R.A. Unconformity-Associated Uranium Deposits of the Athabasca Basin, Saskatchewan and Alberta. In Mineral Deposits of Canada: A Synthesis of Major Deposit-Types, District Metallogeny, the Evolution of Geological Provinces, and Exploration Methods; Goodfellow, W.D., Ed.; Special Publication No. 5; Geological Association of Canada, Mineral Deposits Division: St. John’s, NL, Canada, 2007; pp. 273–305. [Google Scholar]
  16. Campbell, J.E. Quaternary Geology of the Eastern Athabasca Basin, Saskatchewan. In EXTECH IV: Geology and Uranium Exploration Technology of the Proterozoic Athabasca Basin, Saskatchewan and Alberta; Jefferson, C.W., Delaney, G., Eds.; Geological Survey of Canada, Bulletin 588: Ottawa, ON, Canada, 2007; pp. 211–228. [Google Scholar] [CrossRef]
  17. Basin Uranium Corp. Basin Uranium Completes Geophysical Surveys at Mann Lake. 2022. Available online: https://basinuranium.ca/basin-uranium-completes-geophysical-surveys-at-mann-lake/ (accessed on 17 July 2025).
  18. Basin Uranium Corp. Basin Uranium Continues to Intersect Anomalous Uranium Mineralization at Mann Lake. 2023. Available online: https://basinuranium.ca/basin-uranium-continues-to-intersect-anomalous-uranium-mineralization-at-mann-lake/ (accessed on 17 July 2025).
  19. Zhdanov, M.S. Inverse Theory and Applications in Geophysics, 2nd ed.; Elsevier: Amsterdam, The Netherlands, 2015. [Google Scholar]
  20. Berdichevskiĭ, M.N.; Zhdanov, M.S. Advanced Theory of Deep Geomagnetic Sounding; Elsevier Science Ltd.: Amsterdam, The Netherlands, 1984; Volume 19. [Google Scholar]
Figure 1. General layout of model mesh for inversion of MobileMT data. Full extent of model: 100 km × 100 km.
Minerals 15 00874 g001
Figure 2. Configuration of triangular mesh for input to inversions. The detailed mesh is located below the survey line, and the pad mesh extends to the edge of the model’s bounding box.
Minerals 15 00874 g002
Figure 3. Rectangular mesh.
Minerals 15 00874 g003
Figure 4. Example of two separate detailed meshes used to approximate the MobileMT measurement configuration, one under the location of the electric base station, and the other under the survey line.
Minerals 15 00874 g004
Figure 5. Schematic diagram showing the test line and the locations of the two base stations (BS1 and BS2). Distances between key points and along the test line are indicated.
Minerals 15 00874 g005
Figure 6. Apparent resistivity curves calculated along the test survey line using base stations BS1 (a) and BS2 (b). Set of frequencies: 84, 103, 138, 165, 209, 267, 339, 420, 533, 676, 844, and 1067 Hz.
Minerals 15 00874 g006
Figure 7. Apparent conductivity profiles along the test survey line in the 84–1067 Hz range (12 frequency windows), calculated for each frequency using BS1 (top) and BS2 (bottom). Blue—low frequencies, pink—high frequencies.
Minerals 15 00874 g007
Figure 8. Inverted resistivity-depth sections along the test survey line obtained with MARE2DEM from apparent conductivity datasets referenced to BS1 (top) and BS2 (bottom).
Minerals 15 00874 g008
Figure 9. RMS misfits versus iteration number for the inversion processes including high-frequency data (a) and excluding high-frequency data (b). The final converged iteration is marked in red.
Minerals 15 00874 g009
Figure 10. Roughness versus iteration number for the inversion processes including high-frequency data (a) and excluding high-frequency data (b).
Minerals 15 00874 g010
Figure 11. Sensitivity histograms from MobileMT inversion along the test line (iteration 16), comparing results with (a) and without (b) high-frequency (HF) data.
Minerals 15 00874 g011
Figure 12. Resistivity section of the results of unconstrained MobileMT data inversion for the set of frequencies 26, 33, 42, 50, 70, 84, 103, 137, 166, 209, 267, 338, 5382, 6786, and 8550 Hz, U/C (unconformity contact).
Minerals 15 00874 g012
Figure 13. Resistivity section of the results of unconstrained MobileMT data inversion for the set of frequencies 26, 33, 42, 50, 70, 84, 103, 137, 166, 209, 267, and 338 Hz, U/C (unconformity contact).
Minerals 15 00874 g013
Disclaimer/Publisher’s Note: The statements, opinions and data contained in all publications are solely those of the individual author(s) and contributor(s) and not of MDPI and/or the editor(s). MDPI and/or the editor(s) disclaim responsibility for any injury to people or property resulting from any ideas, methods, instructions or products referred to in the content.