Article

Analysis of Occurrence States of Rare Earth Elements in the Carbonatite Deposits in China

1
School of Minerals Processing and Bioengineering, Central South University, Changsha 410083, China
2
Key Lab of Biohydrometallurgy of Ministry of Education, Changsha 410083, China
*
Author to whom correspondence should be addressed.
These authors contributed equally to the work.
Minerals 2025, 15(8), 866; https://doi.org/10.3390/min15080866
Submission received: 24 June 2025 / Revised: 6 August 2025 / Accepted: 14 August 2025 / Published: 16 August 2025

Abstract

Rare earth elements (REEs), as necessary elements in many industries, have driven increased demand for mineral exploitation. However, understanding the occurrence states of REEs is crucial for their extraction. Therefore, this work primarily investigated the differences in the occurrence states of REEs and the thermal decomposition behavior of carbonatite rare earth deposits in China using scanning electron microscopy, Fourier transform infrared spectroscopy, X-ray powder diffraction, and X-ray photoelectron spectroscopy. The results showed that the bastnaesite concentrate from the M deposit in southwestern China (referred to herein as B-ore), contained REEs accounting for 53.59%, and was associated with small amounts of wulfenite, barite, and iron ore. In contrast, the contents of REEs in the raw ores of N deposit in northern China (referred to herein as R-ore) was relatively low (3.71%), but were also enriched in Fe. R-ore consisted of small particle, with 32.44% sized between 0.075 and 0.11 mm, and 26.38% below 0.075 mm. The contents of Fe, La, and Ce in these smaller particles were higher than those of larger particles. Fe might be substituted with Ce, La, and other REEs in magnetite crystals, forming isomorphic structures. This research was expected to provide assistance in the efficient extraction of REEs from carbonatite deposits.

1. Introduction

Rare earth elements (REEs) were first discovered by Carl Axel Arrhenius in Sweden in the 18th century [1]. The International Union of Pure and Applied Chemistry (IUPAC) defined the 15 lanthanides in the periodic table, along with scandium (Sc) and yttrium (Y), as REEs [2,3]. REEs were divided into light rare earth elements (LREEs) and heavy rare earth elements (HREEs) according to their differences in atomic electron layer structure and physical and chemical properties. Among them, LREEs included La, Ce, Pr, Nd, promethium (Pm), samarium (Sm), and europium (Eu), while HREEs included gadolinium (Gd), terbium (Tb), dysprosium (Dy), holmium (Ho), erbium (Er), thulium (Tm), ytterbium (Yb), lutetium (Lu), Sc, and Y [4]. In modern industry, REEs are generally used in petrochemical, aerospace, electronic and optical industries, automobile industries, medicine, and environment protection to manufacture catalysts, special alloys, fiber optics, storage batteries, and superconductors. Additionally, with the development of renewable energy, REEs are often used in the manufacture of solar panels, wind turbines, energy-efficient lighting, and electric vehicles. Due to the increase in demand, the consumption of REEs will increase by 7%–8% per year [5,6,7]. Therefore, many countries are strategizing for the better extraction of REEs and the development of sustainable energy [8].
The distribution of global REEs is highly concentrated in several countries, including China, Vietnam, Brazil, the United States, Russia, India, and Australia [9]. Notably, China’s reserves constitute a significant portion, accounting for 34% of the world’s total. Over the past decade, China alone has accounted for around 70%–90% of global production and has been the leading producer of REEs since the 1980s [10]. In terms of China’s rare earth element production, some scholars predicted that it will reach a maximum in 2040 and then slowly decline [11]. The largest and second largest rare earth element deposits in China are Bayan Obo in the Inner Mongolia and Maoniuping in western Sichuan Province, respectively. The Bayan Obo deposit is also the largest Fe ore deposit in China and the second largest Nb deposit in the world, which stores more than 80% of China’s LREE resources [12]. The reserves of REEs in Maoniuping deposit were as high as 3.17 million tons, with an average grade of about 3% [13]. However, current exploitation practices of rare earth minerals (REMs) result in significant wastage of valuable associated resources, including fluorine (F), phosphorus (P), calcium (Ca), and thorium (Th) [14]. It is therefore very important to study the geological conditions and occurrence of REMs, which can further satisfy the supply of REEs.
The fluid evolution pathways in Carbonate-Associated Rare Earth Deposits (CARDs) exhibit significant variability, critically influencing their mineralization mechanisms, spatial distribution, and economic potential [5]. The enrichment of REEs in these deposits is primarily governed by two distinct magmatic-hydrothermal processes: (1) fractional crystallization of alkaline magmas (M deposit) and (2) pervasive metasomatism driven by alkaline granite-derived fluids (N deposit). The M deposit exhibits a distinct hydrothermal vein mineralization system accompanied by a well-defined mineral zonation sequence. However, the basement of M deposit is geologically complex and requires advanced mining technology, comprising five key units: (1) N-S trending granitic plutons (−723 Ma; 90 km long, 6–14 km wide); (2) Neoproterozoic (750–600 Ma) rhyolite strata; (3) Devonian-Paleozoic metamorphosed sediments (limestone, basalt) intruded by Mesozoic granites; (4) a 700 m thick Triassic coal-bearing sedimentary cover; and (5) a 1400 m long, 260–350 m wide zone of carbonate veins and intrusive rocks [15]. In contrast to the M deposit, the N deposit exhibits a comparatively simpler geological setting. The mineralization in N deposit is predominantly attributed to carbonatitic magmatism, characterized by laminar flow regimes that entrain tabular dolomite crystals, apatite, and iron oxides [16]. The mineralization occurs as stratiform or lenticular ore bodies amenable to large-scale mechanized extraction. Ma et al. [17]. used many methods to study the occurrence states of REEs in the Svanbergite in Sichuan province, China. They inferred that the REE’s exist in Cradalite as isomorphism by replacing the Ca2+ and H+ ions. Hou et al. [18] investigated the occurrences states of Th in iron ores from the Bayan Obo deposit by using some basic characterization methods. The results showed that Th was predominantly found in REE deposits as isomorphic structures and that trace elements Sc, Nb, Zr, and Ta exhibited strong correlations with Th. Furthermore, the primary minerals containing ThO2 are closely associated with the specific types of iron ore. Xiong et al. [19]. studied the occurrence mode of REEs within phosphate deposits in the Zhijin area of Guizhou Province. REEs can be found in two main forms—isomorphic substitution in the lattice defects of apatite and combined with organic compounds. Additionally, the enrichment of REEs in bioclasts also suggested that the decomposition of biological soft tissues and the high content of REEs in the original soft tissues may be responsible for this phenomenon. Li et al. [20] conducted a comparative investigation of the thermal decomposition behavior and reaction kinetics of bastnaesite during roasting under both N2 and air atmospheres. Zhao et al. [21] investigated the thermal decomposition and oxidation of bastnaesite concentrate in inert and oxidative atmosphere, elucidating the fundamental understanding governing additive-free roasting processes. However, the occurrence states and thermal decomposition of REEs exhibit significant variations that are fundamentally constrained by their ore conditions. Previous investigations have predominantly emphasized the regulation of thermal decomposition parameters and comparative analysis of oxidition efficiency, while largely neglecting the inherent mineralogical diversity among different ore deposits.
Therefore, the purpose of this work was to investigate the concentrate and raw ores of two representative carbonatite rare earth element deposits (M and N deposits) to address this knowledge gap by comparing mineral morphology, composition, element contents, and the difference in REEs after heating treatment with inductively coupled plasma optical emission spectrometer (ICP-OES), scanning electron microscopy-energy dispersive spectroscopy (BSE-EDS), X-ray powder diffraction (XRD), Fourier transform infrared spectroscopy (FTIR), and X-ray photoelectron spectroscopy (XPS) analysis. Understanding the occurrence states of REEs was of great significance to the exploration, exploitation and extraction of rare earth resources, which can provide important support for the country’s economic development and their rational utilization.

2. Materials and Methods

2.1. Sample Collection

The bastnaesite concentrate (referred to herein as B-ore) was provided from the M deposit in southwestern China after beneficiation, while the REE raw ore (referred to herein as R-ore) was collected from N deposit in northern China. In the flotation of B-ore, hydroxamate-based collectors (hydroximic acid) serve as the dominant reagents, while fatty acids (oleic acid) are employed as auxiliary collectors in minor quantities. Moreover, the REE raw ore was passed through the standard sieves to determine particle size distribution. The other experimental samples were all mixed evenly and ground into powder. In addition, all bastnaesite concentrate samples were passed through the 100 mesh sieve and stored in a vacuum drying oven for characterization experiments.

2.2. REE Concentration

REE concentrations in the studied ore samples were determined by ICP-OES (Agilent 5110, in Santa Clara, CA, USA) with microwave digestion. A certain number of samples were first placed in a Polytetrafluoroethylene (PTFE) tube and digested by 10 mL aqua regia at 120 °C for 1.5 h. After pre-digestion, the samples were digested according to the following procedure: (1) 5 min ramp to 130 °C and hold for 3 min; (2) 3 min ramp to 150 °C and hold for 10 min; (3) 3 min ramp to 180 °C and hold for 30 min; (4) cooled to 60 °C and catch acid to 1 mL; (5) diluted the digested samples in deionized water and determined by ICP-OES.

2.3. Concentration Coefficient (CC)

Concentration coefficient (CC), which is a parameter to evaluate the enrichment degree of trace elements in a specific geological body or environment, is often used to express the ratio of the amount of an element in a sample to the average amount of that element in the Earth’s crust [22]. Additionally, the formula for calculating the CC value of REEs is given by Equation (1)
C C = C 1 × 10 4 C 2
where CC is the extent of concentration coefficient, C1 is the concentration of REEs in the ore (%) and C2 is the average amount of REEs in the Earth’s crust (ppm).

2.4. Mineralogical Techniques

The chemical compositions of the ore’s samples were analyzed by XRF (Axios MAX, PANalytical, in Almelo, The Netherlands). The surface morphology of the REE ores were observed by SEM (MIRA3 LMH, TESCAN, in Shanghai, China) associated with EDS (One Max 20), Delhi, India. FTIR (NEXUS 670, Nicolet, in Thermo Scientific, Waltham, MA, USA) was used to analyze the functional groups of ores. XPS was used to study the elemental composition and chemical state of mineral surface. Meanwhile, the mineralogical composition was analyzed by XRD (X’Pert 3 Powder, Panalytical, in Almelo, The Netherlands) at a speed of 5 °/min.

2.5. Roasting Experiment

Simultaneous thermal analyzer (TG-DSC, TGA/STA8000-FTIR-GCMS-ATD 8000, PerkinElmer, in Waltham, MA, USA) was used for thermogravimetric analysis, the heating rate was controlled at 10 °C/min in flowing air. Furthermore, the ore samples were roasted in a chamber electric furnace (SX-5-12, in Shanghai, China) at a certain temperature (according to the TG-DSC result) for 2 h. After roasting, the sample powders were collected for further characterization analysis.

3. Results and Discussion

3.1. REE Analysis

The chemical compositions of the two ore samples are displayed in Table 1. The major elements of B-ore were Ce (27.22%), O (24.23%), La (18.05%), F (9.13%), Nd (6.58%), and Pb (3.51%), but the R-ore mainly consisted of Fe (34.51%), O (30.62%), Ca (10.86%), F (7.68%), and trace amount of REEs. As depicted in Table 2, the contents of Ce in the two ores were comparatively higher than that of other REEs (i.e., La, Pr, Nd).
In order to investigate the content of main elements and trace elements in R-ore, the CC evaluation method was adopted [23]. The contents of La, Ce, Pr, and Nd were of abnormal enrichment in R-ore, which was also enriched in Fe and F elements. The detailed results are presented in Table 3 and Table 4. According to the above results, R-ore may be a kind of bastnaesite ore with magnetite and fluorite, which needs to be further explored using other characterization methods.

3.2. REE Ore Composition

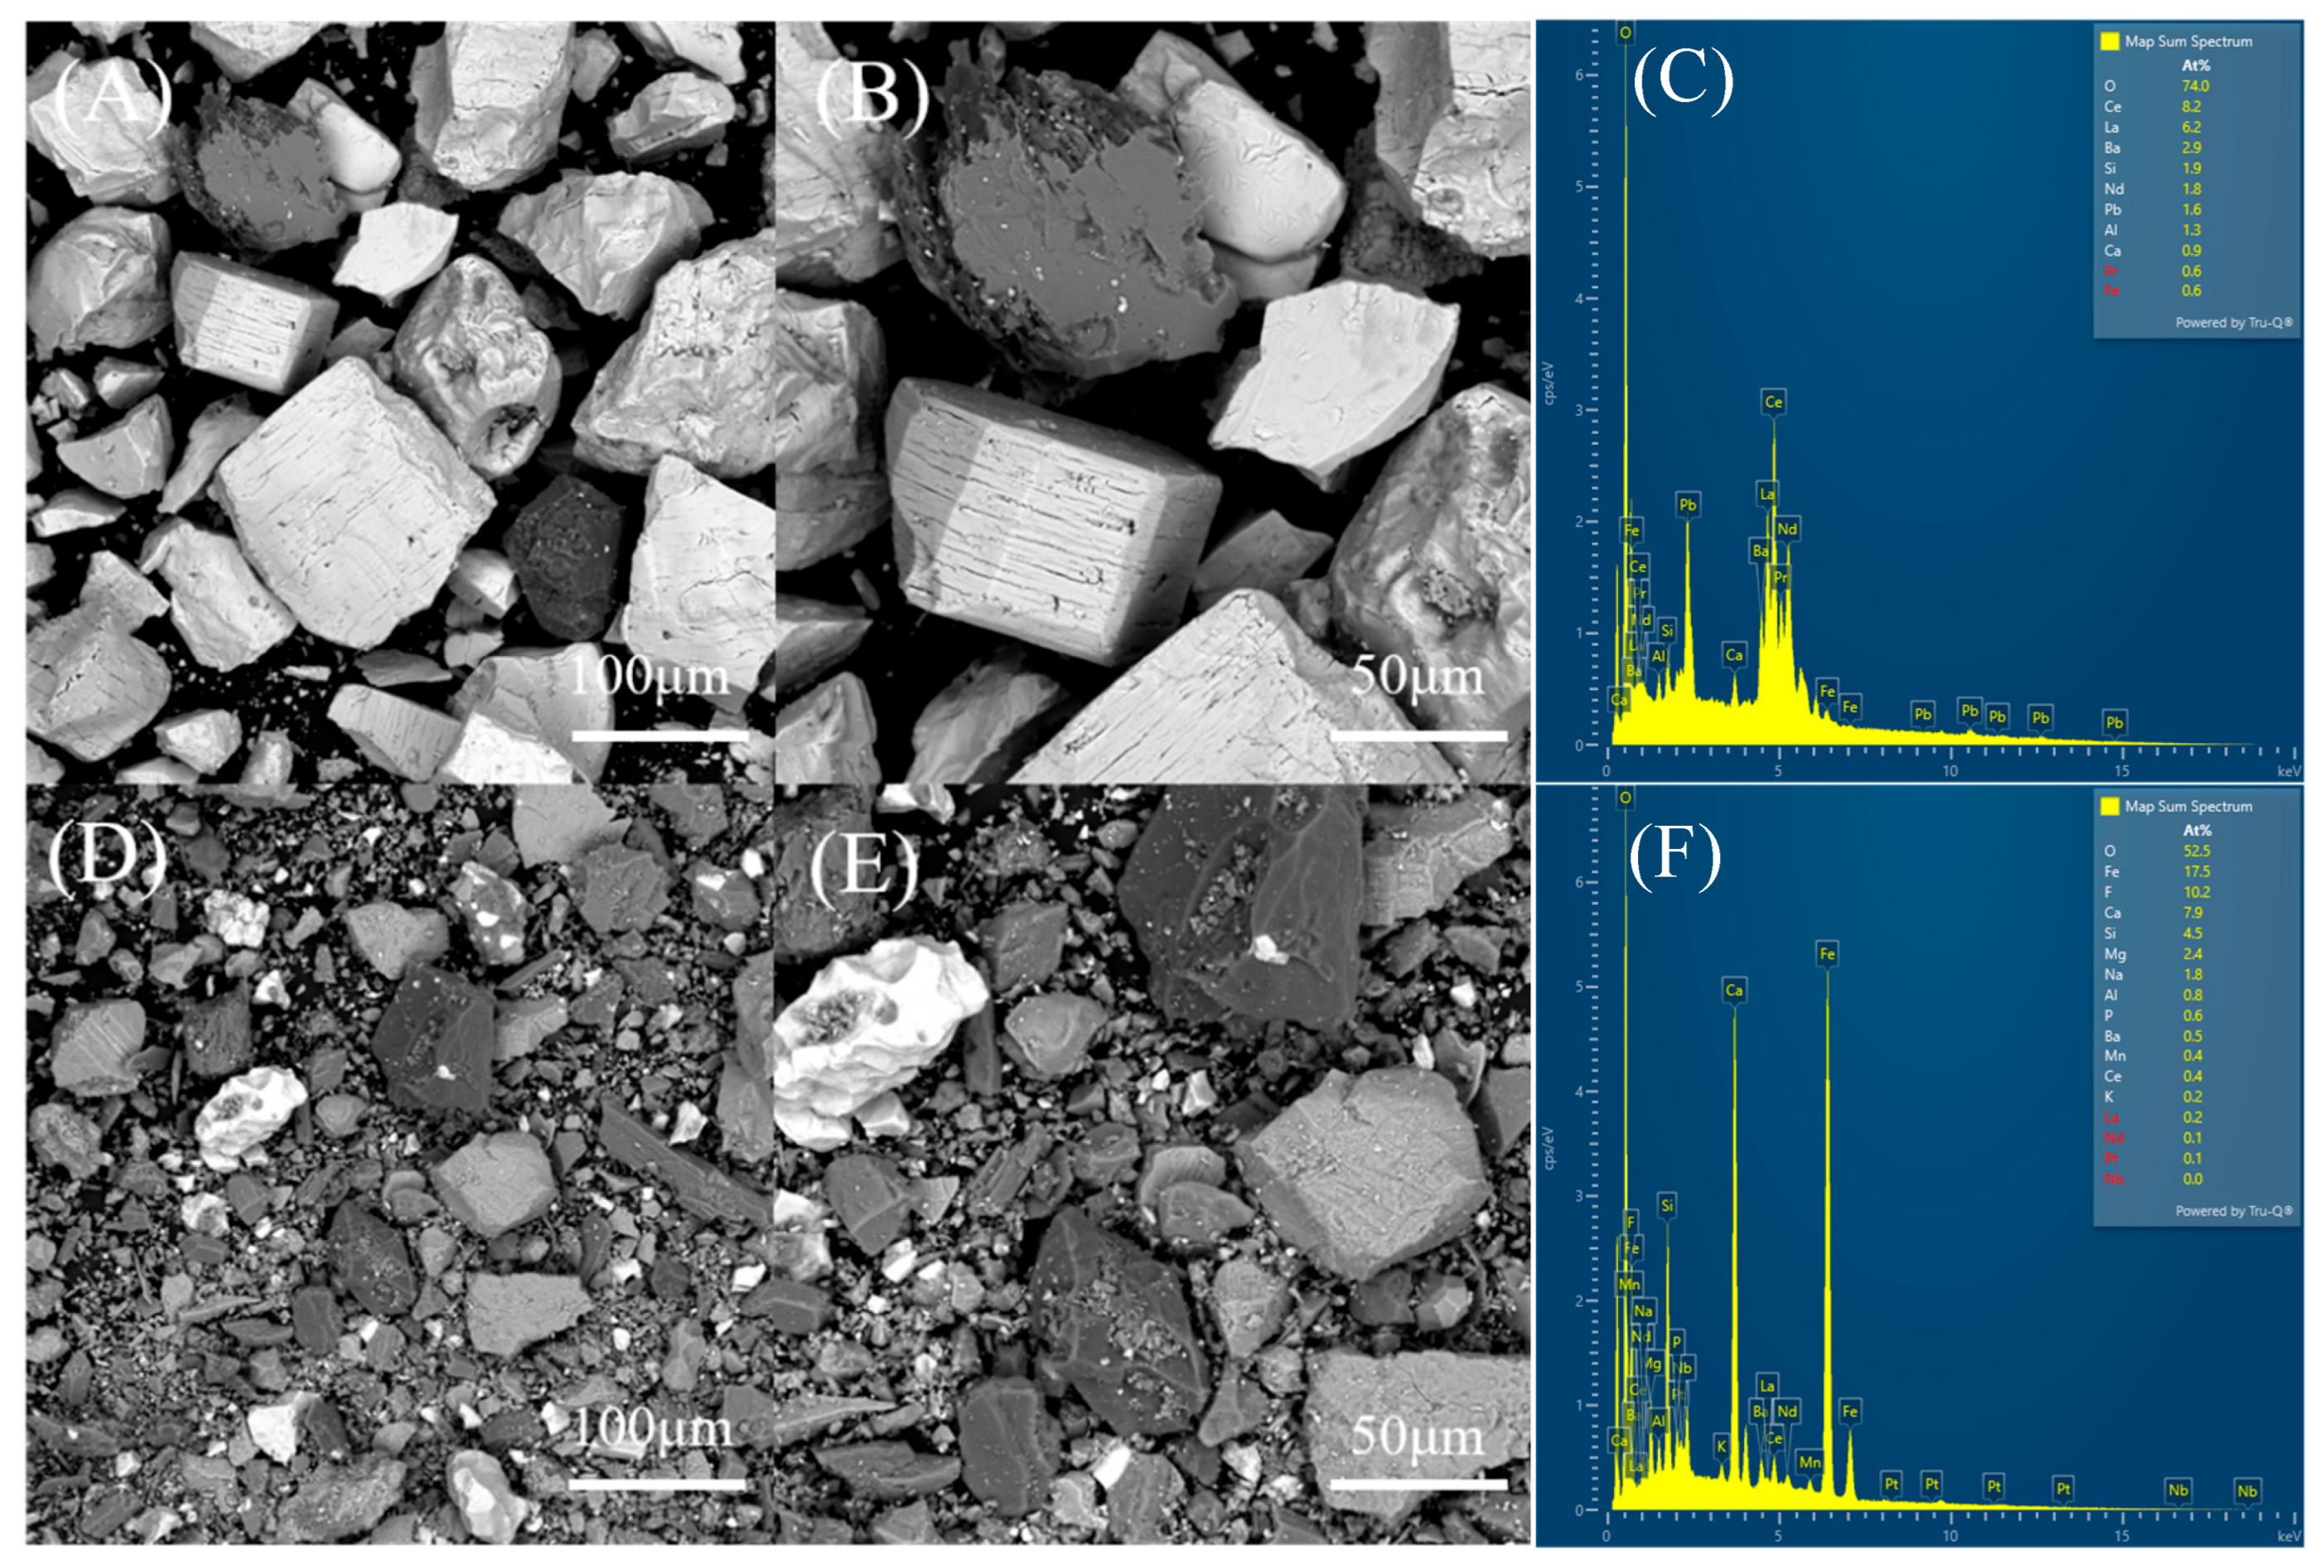
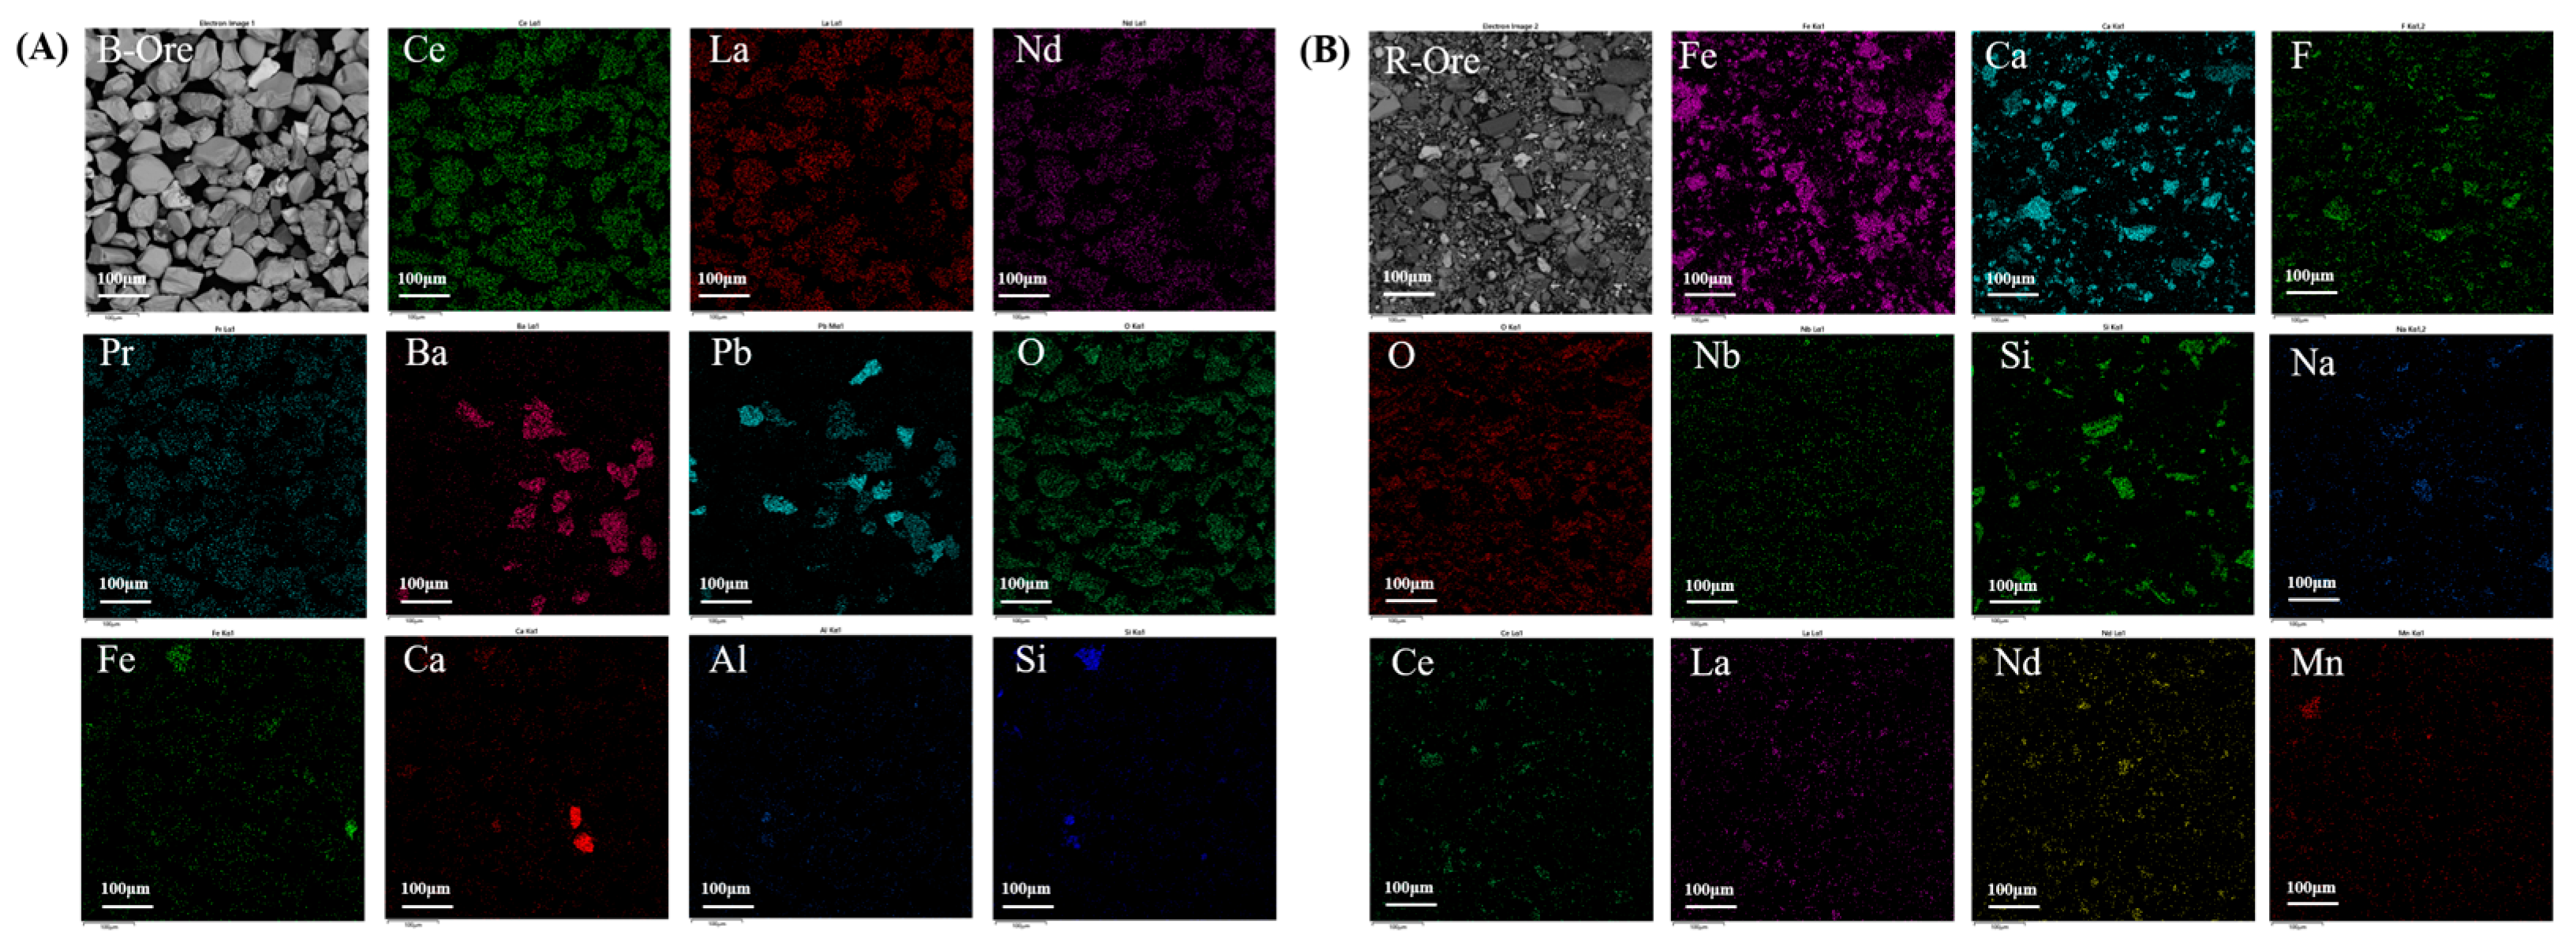
REE deposits can be divided into 10 groups according to rock types, including carbonatites, peralkaline igneous rocks, pegmatites, metamorphic, iron oxide copper-gold (IOCG), porphyry molybdenum, stratiform phosphate, residual deposits, paleoplacer, and placer deposits [24]. The analysis of mineral composition could be determined by XRD, and the results are presented in Figure 1. The XRD pattern of the B-ore was basically consistent with the standard spectrum of the bastnaesite, and the presence of wulfenite could also be determined. The surface appearance and crystallographic information of the B-ore could be observed by the backscattered electron microscope (BSE) analysis of B-ore (Figure 2A,B). It was found that the bastnaesite ((La, Ce)(CO3)F) appeared gray and white under the BSE, and most of them were well-developed idiomorphic crystals, with a small amount of heteromorphic crystals. The EDS results Figure 2C showed that the main REE ores components were O, Ce, La and so on. Therefore, the main ore-forming rocks may be carbonate and alkaline rock type in B-ore. The REE ores in the N deposit can be classified into six categories, including the fluorite-type Nb-REE-Fe ore, massive-type Nb-REE-Fe ore, dolomite-type Nb-REE-Fe ore, aegirine-type Nb-REE-Fe ore, riebeckite-type Nb-REE-Fe ore and biotite-type Nb-REE-Fe ore [25]. The mineral compositions of R-ore, associating with magnetite, a trace of phlogopite, fluorite, zinc iron oxide, wollastonite, and bastnaesite are shown in Figure 1. BSE results (Figure 2D,E) also indicate that the minerals in the R-ore were not high in purity; most of them were massive or granular, and the crystallinity of the mineral surface was poor. The minerals appeared grayish-white, gray, and black, among which the grayish-white minerals were identified as bastnaesite, corresponding to the distribution of Ce and La in the EDS Map, shown in Figure 3B. In a large amount of magnetite (Fe3O4) and fluorite (CaF2) was also present. Therefore, the R-ore might be classified as a fluorite type Nb-REE-Fe ore. Nevertheless, it was noted that regions with significant concentrations of La, Fe, and F exhibited a high degree of overlap. This observation indicates that REEs, with La as the primary constituent, might undergo an isomorphic substitution with Fe2+ within the crystal structure of magnetite and phlogopite [19]. After a general understanding of the R-ore, sieving was the next step to further study the occurrence forms of REEs.

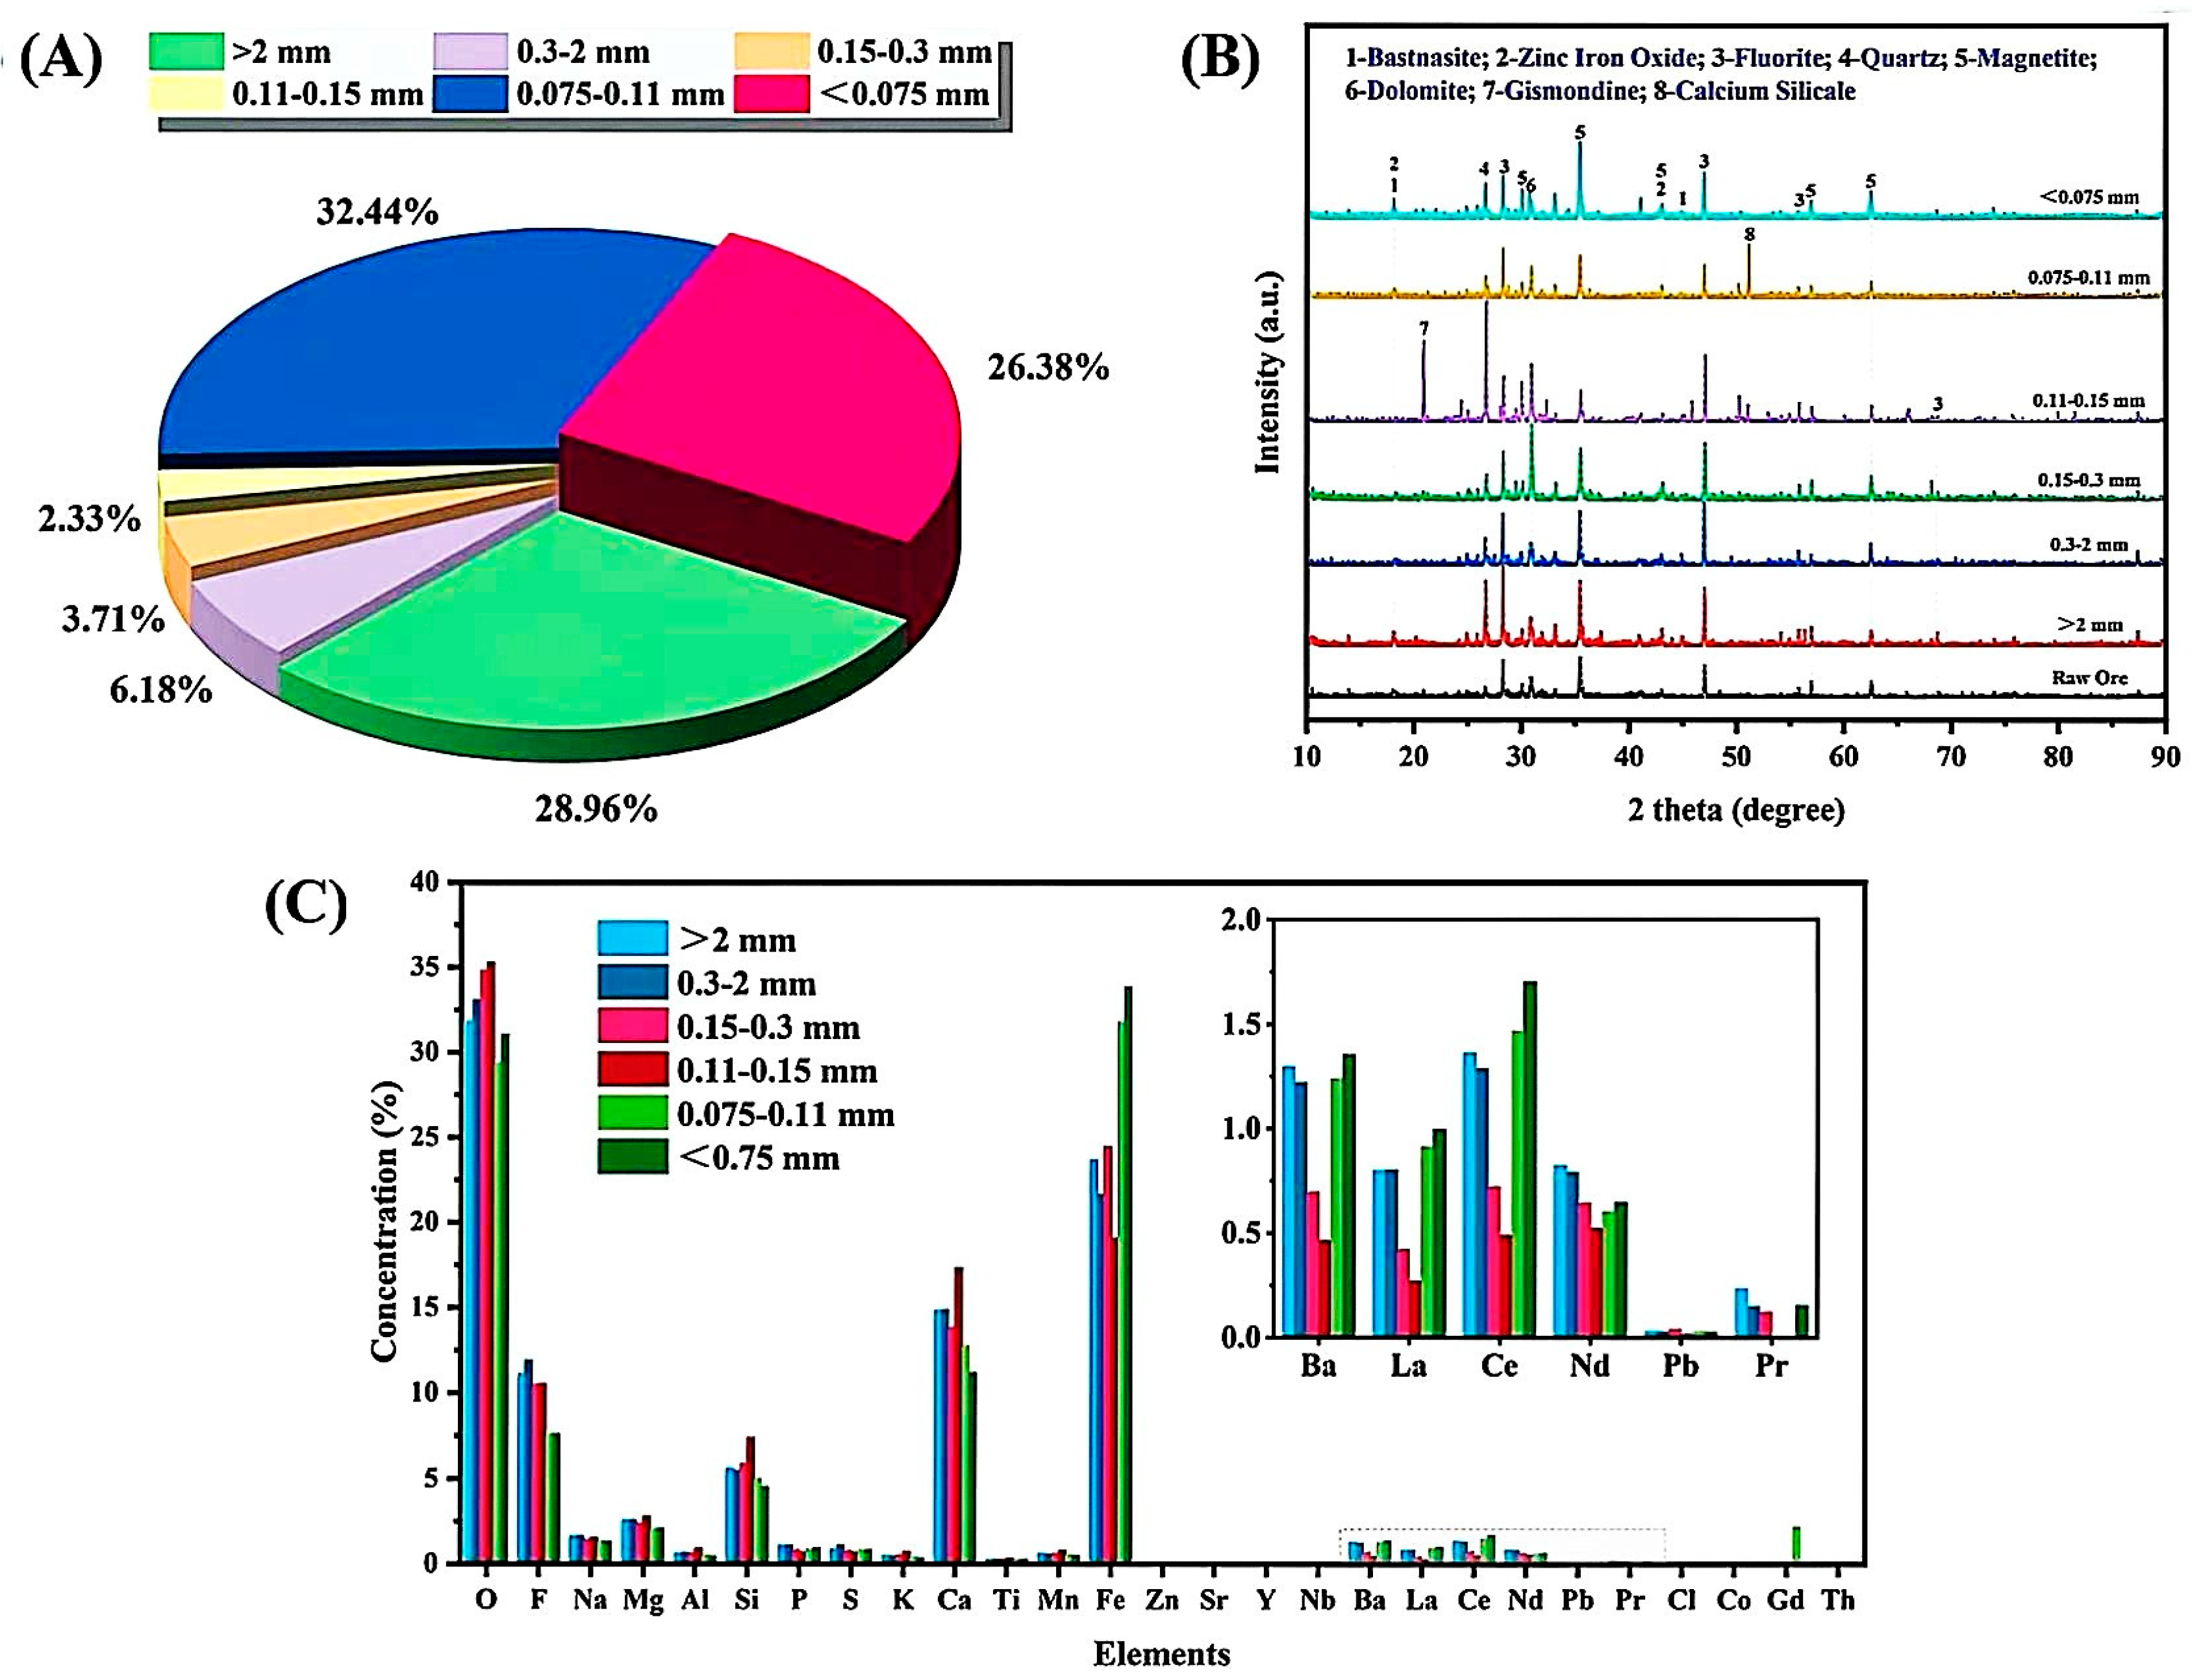
3.3. Analysis of REE Raw Ores in Different Particles Sizes

In this study, the R-ore samples were just dried and directly sieved through the standard sieves without grinding treatment. As shown in Figure 4A, R-ore was present in small particles, of which 32.44% had a size of 0.075–0.11 mm and 26.38% below 0.075 mm. The ore types and compositions of R-ore with different particle sizes are shown in (Figure 4B,C). As shown in Figure 4C, the main elements in this mineral are O, Fe, Ca, F, Si, Mg, etc., and the REEs detected are predominantly La and Ce. The results showed that when the particle size was less than 0.11 mm, the contents of Fe, La and Ce were higher compared to larger particles. Conversely, the contents of O, Ca, F, Si, Mg, and Nd were reduced. This indicated that the composition of REEs might be different in the ore samples with different particle sizes. In Figure 4, it can be seen that as the particle size decreased, the contents of quartz, dolomite, and gismondine gradually decreased, while the contents of magnetite and bastnaesite gradually increased. In addition, in the particle size range of <0.075 mm, the main minerals were magnetite, followed by fluorite, zinc iron oxide, and bastnaesite, wherein REEs were mostly of La, Ce, and Nd. Especially in the particle size of 0.11–0.15 mm, the content of Fe was the lowest, and the corresponding content of REEs was also the lowest. It showed that there was a positive correlation between REEs and Fe. In summary, it could be seen that Fe may be substituted with Ce, La, and other REEs in magnetite crystals to form isomorphic structures [18].

3.4. Thermal Decomposition Behavior of REE Ores

3.4.1. TG-DSC Analysis

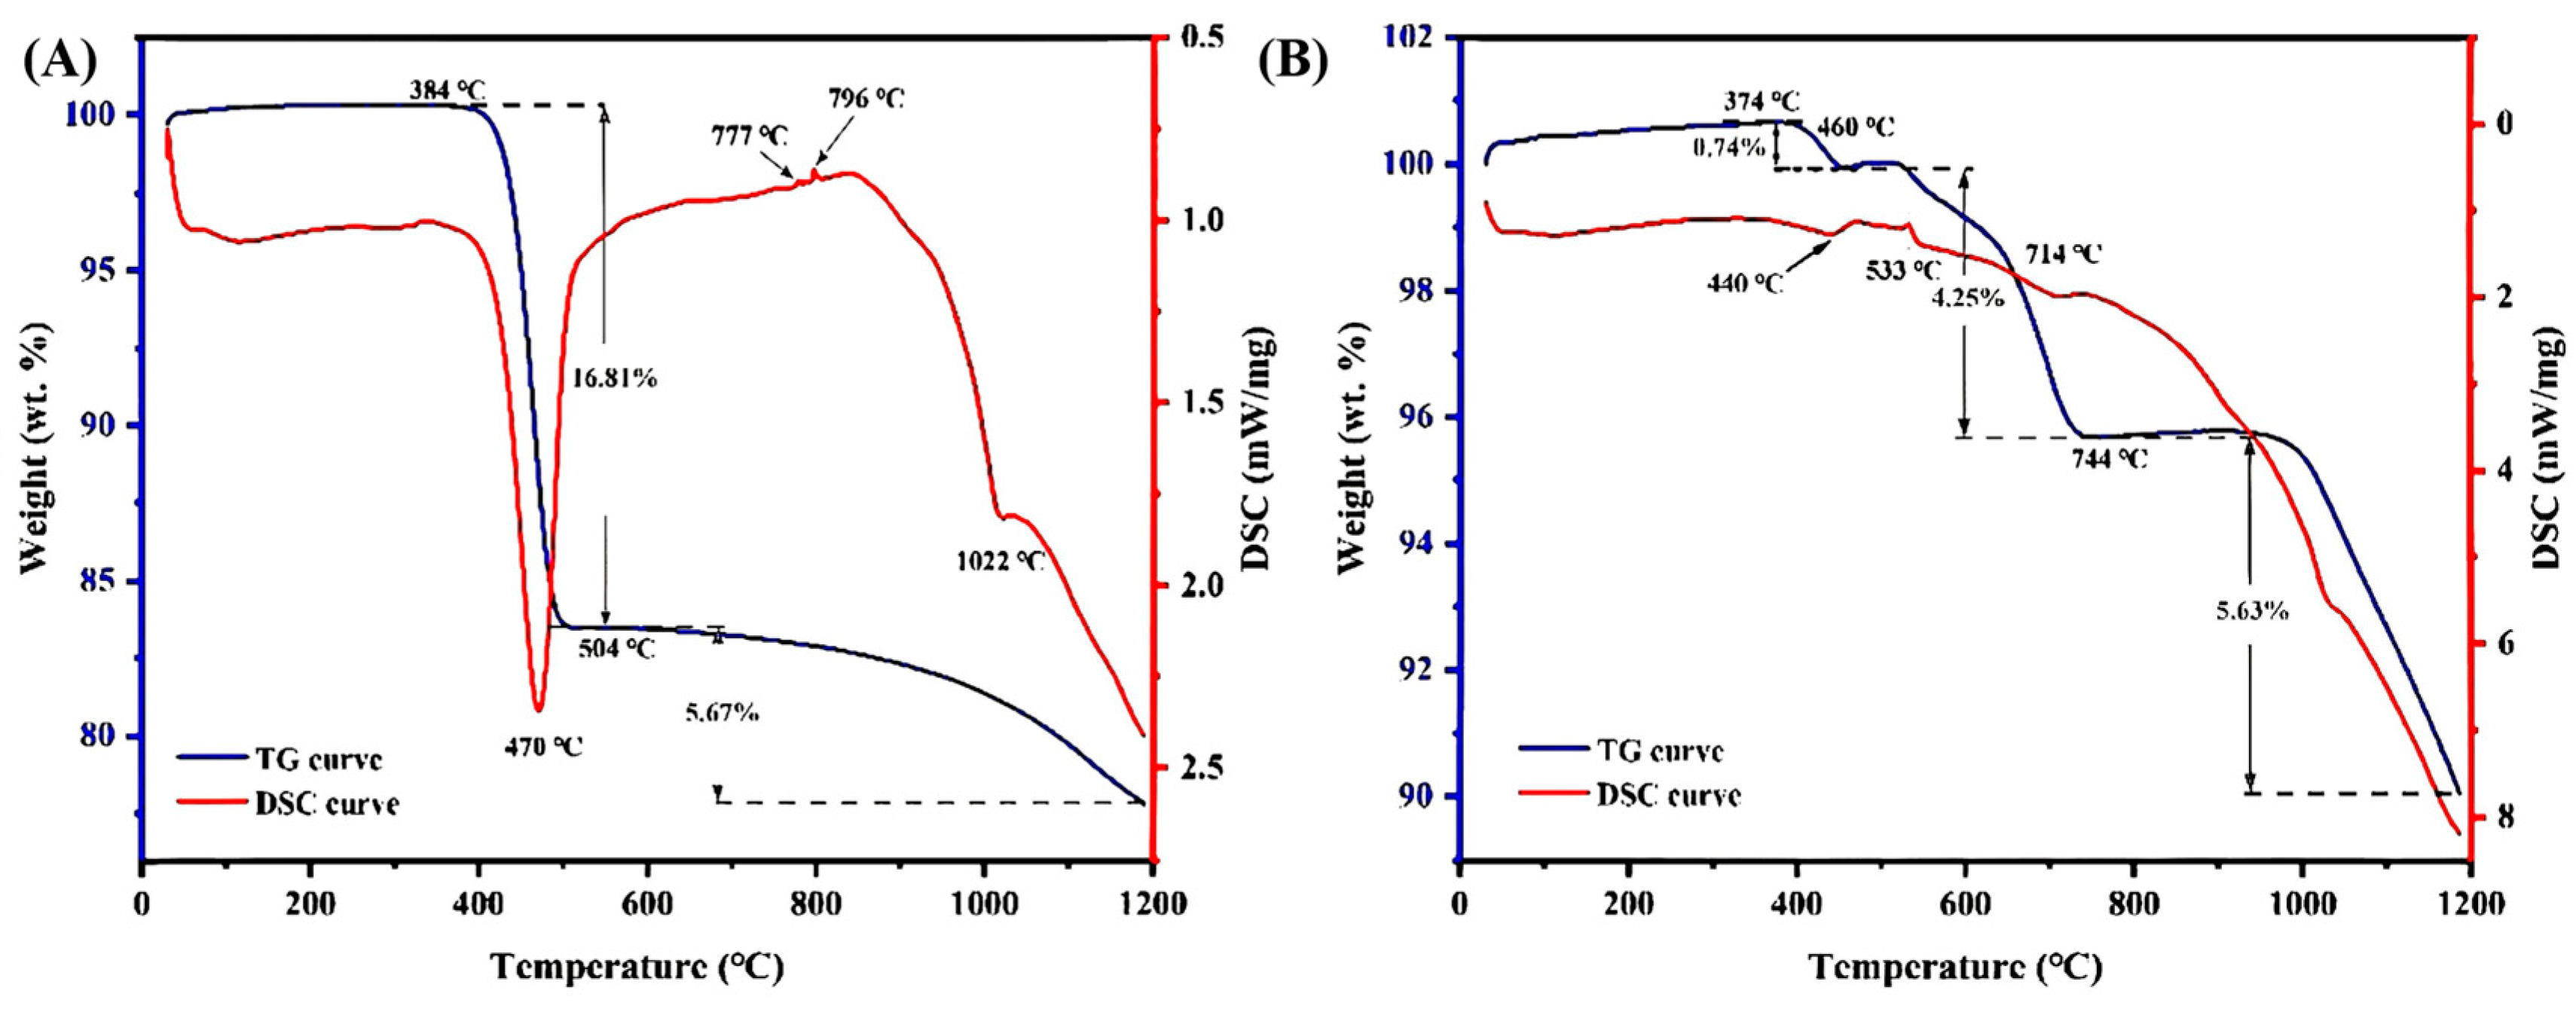
The TG-DSC curve was used to determine the decomposition temperature ranges of the B-ore (Figure 5A) and R-ore (Figure 5B). It was found that there were some differences in the thermal decomposition behaviors between the two ores. Firstly, in the range of 370~470 °C, R-ore exhibited a mass loss of about 0.74%, which was attributed to the decomposition of organic matter and bastnaesite, which would release significant amounts of CO2 [26]. When heated to 504 °C, the mass loss of B-ore was 16.81%, indicating that the bastnaesite content was higher, as it begins to decompose at 400 °C, reaching a maximum at 500 °C [27].
However, different thermal decomposition behaviors occurred in the following temperature ranges. As shown in Figure 5A, there were two exothermic peaks, which occurred at 777 °C and 796 °C due to the rapid decomposition of calcium carbonate and magnesium carbonate around 800 °C [28]. Subsequently, bastnaesite decomposed to rare earth oxides (REOs) at 700–1200 °C, and this region was considered a delay in the decarbonization process, coupled with a mass loss of 5.67%. This may be attributed to the thermal decomposition of trace impurities as well as a small amount of coarse-sized bastnaesite particles that were not decomposed with time. Another possible explanation is that the decomposition products of bastnaesite may undergo continuous transformation at high temperatures [29]. However, for the R-ore in Figure 5B, the magnetite could directly transform to hematite through oxidation, which was confirmed by the exothermic peaks observed at 533 °C [30]. Because the mineral compositions of R-ore is more complex than that of B-ore [24], the silicate and carbonate impurities exhibit more intricate thermal decomposition behaviors during heating. Although the mass loss observed in the subsequent process might share some similarities with that of B-ore, further experimental investigation is needed.

3.4.2. Variation in REE Ores After Roasting

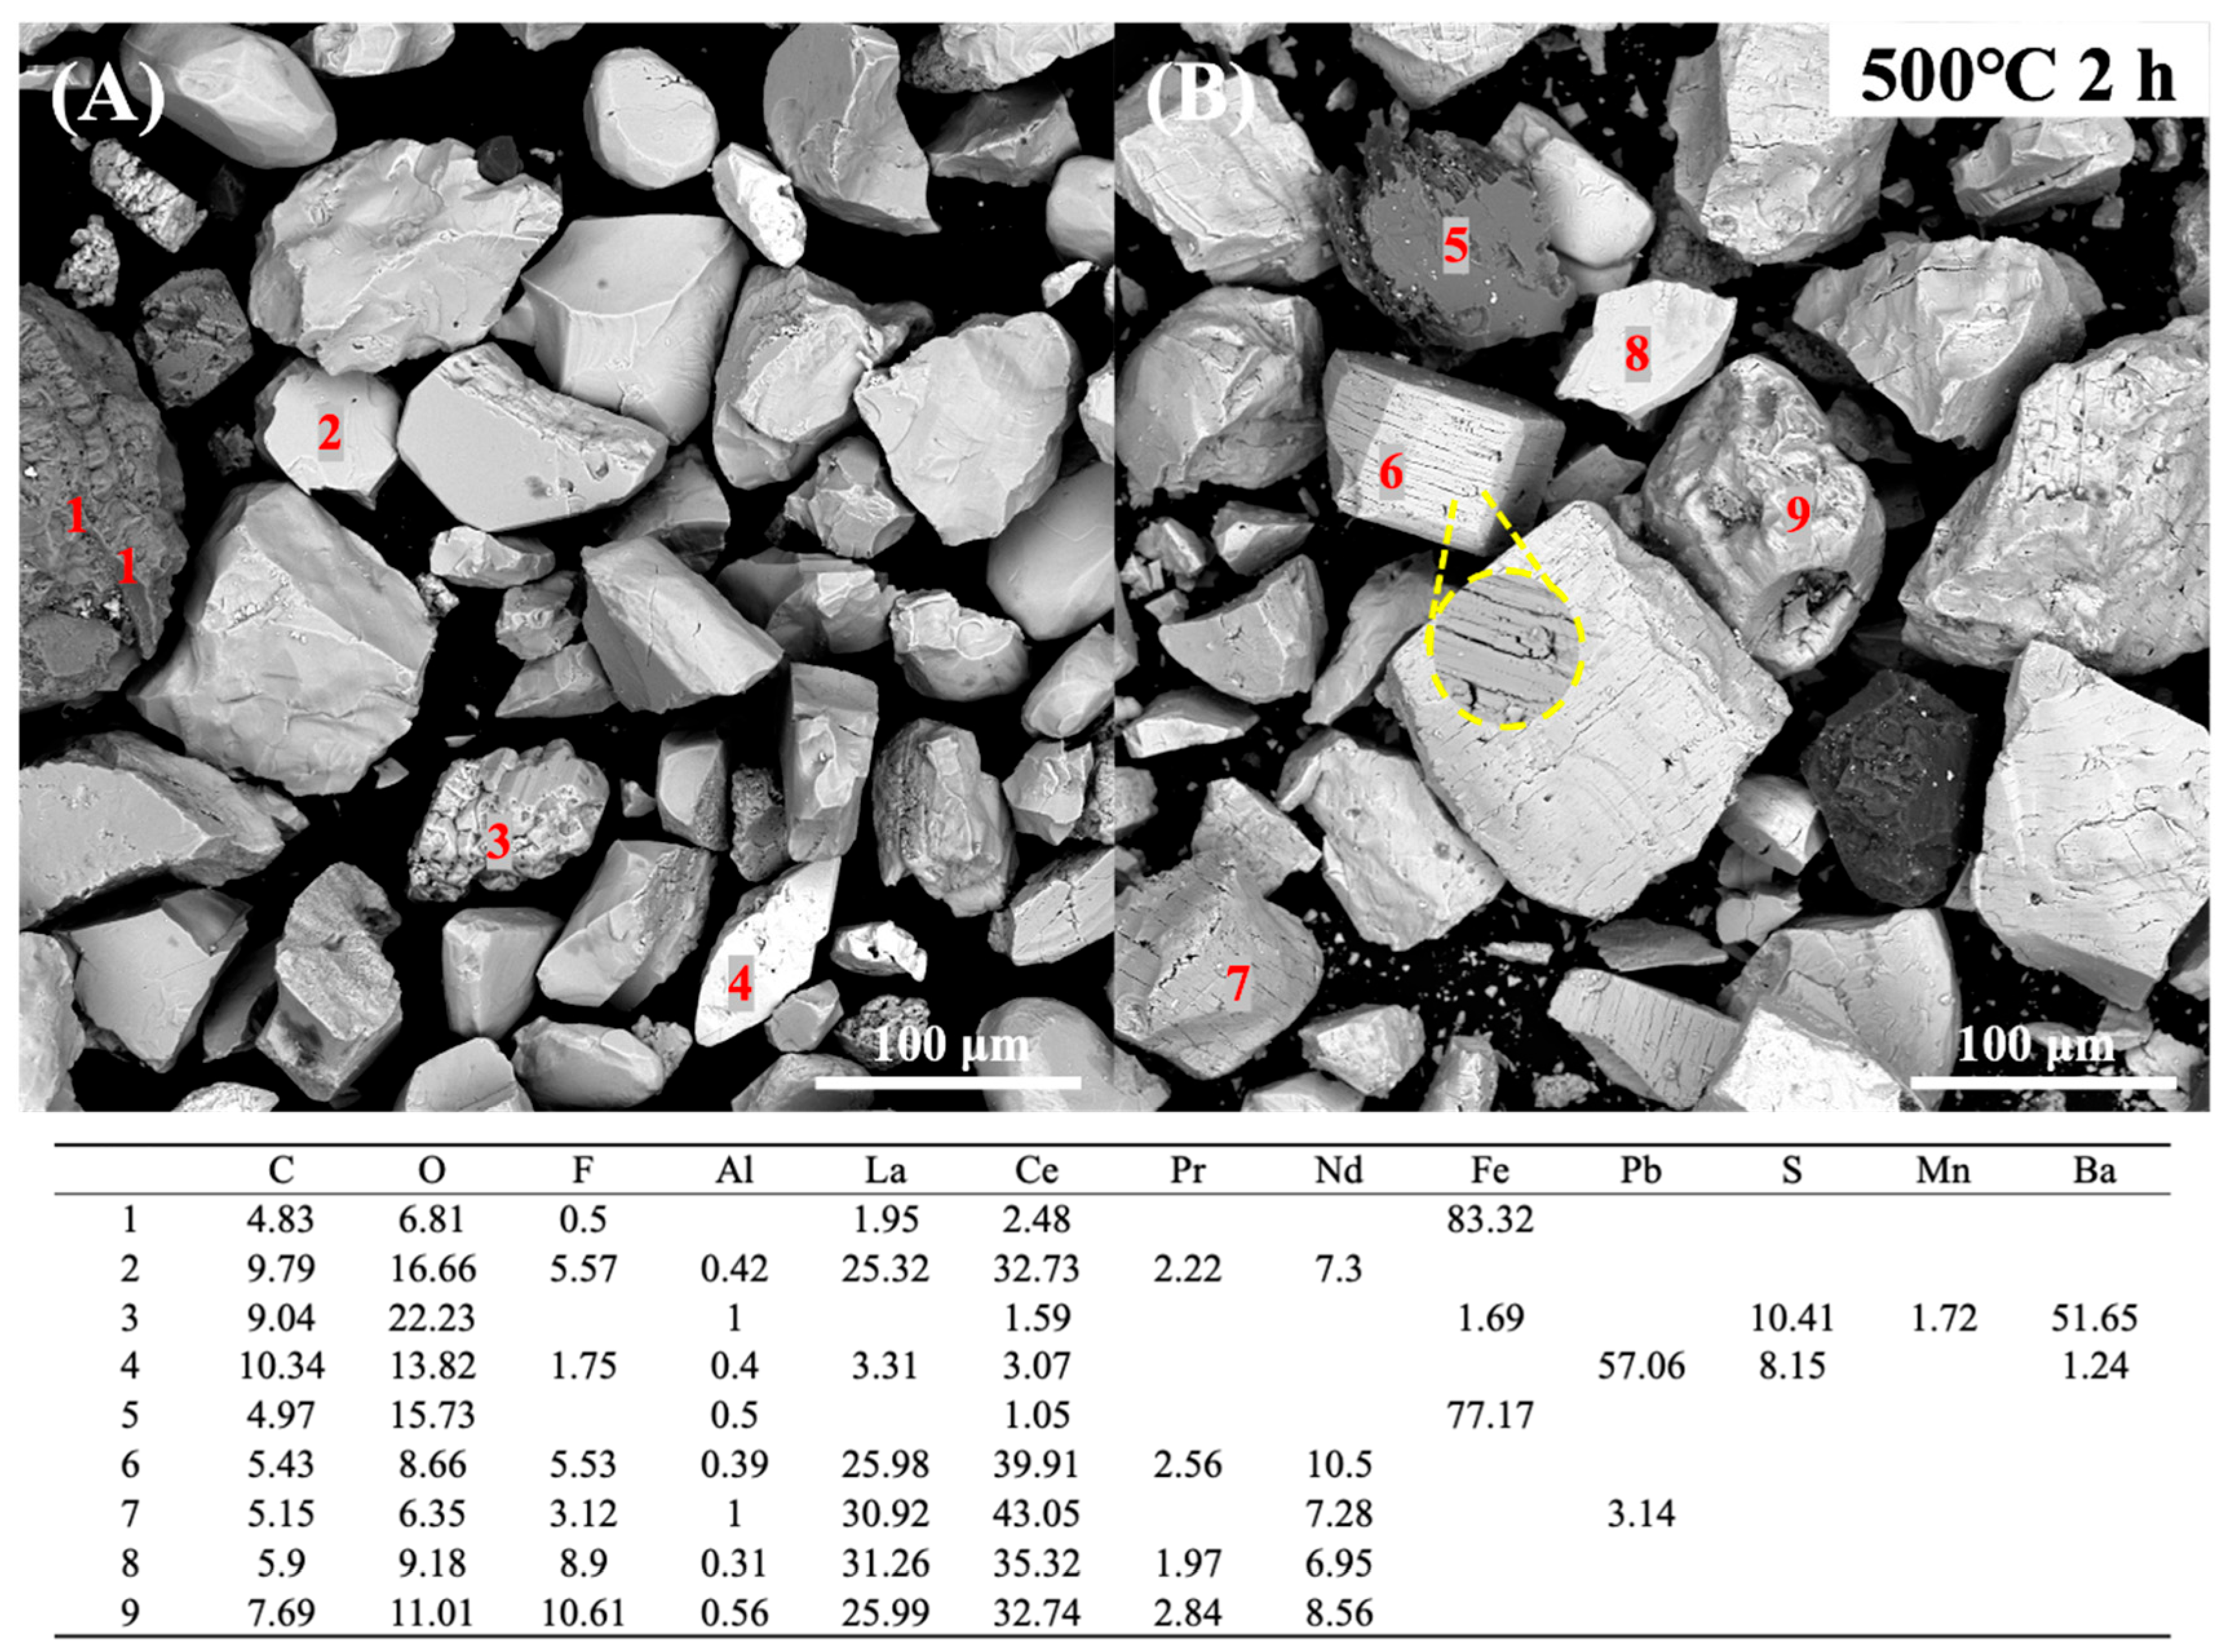
According to the TG-DSC results, the roasting experiments were conducted at 500 °C and 750 °C for 2 h to further analyze the decomposition behavior of the two REE ores. In Figure 6A, the surface of the original bastnaesite (site 2) was smooth, dense, and structurally intact, with no obvious cracks or holes. After roasting, a large number of irregular cracks and holes appeared on the surface of the bastnaesite (site 6) in Figure 6B. The contents of C and O were decreased due to the rapid decomposition of bastnaesite, which released large amounts of CO2 and produced solid-phase roasting products. These changes occurred during the oxidation process, which also led to reconstruction of the crystal lattice [20]. Bastnaesite decomposed to form REOs, rare earth fluorine oxides, fluorine containing oxides, rare earth fluoride, and CO2 [29]. The decomposition reaction equation is shown in Equation (2).
4 ( C e ,   L a ) C O 3 F     ( C e ,   L a ) 2 O 3 + ( C e ,   L a ) O F + ( C e ,   L a ) F 3 + 4 C O 2
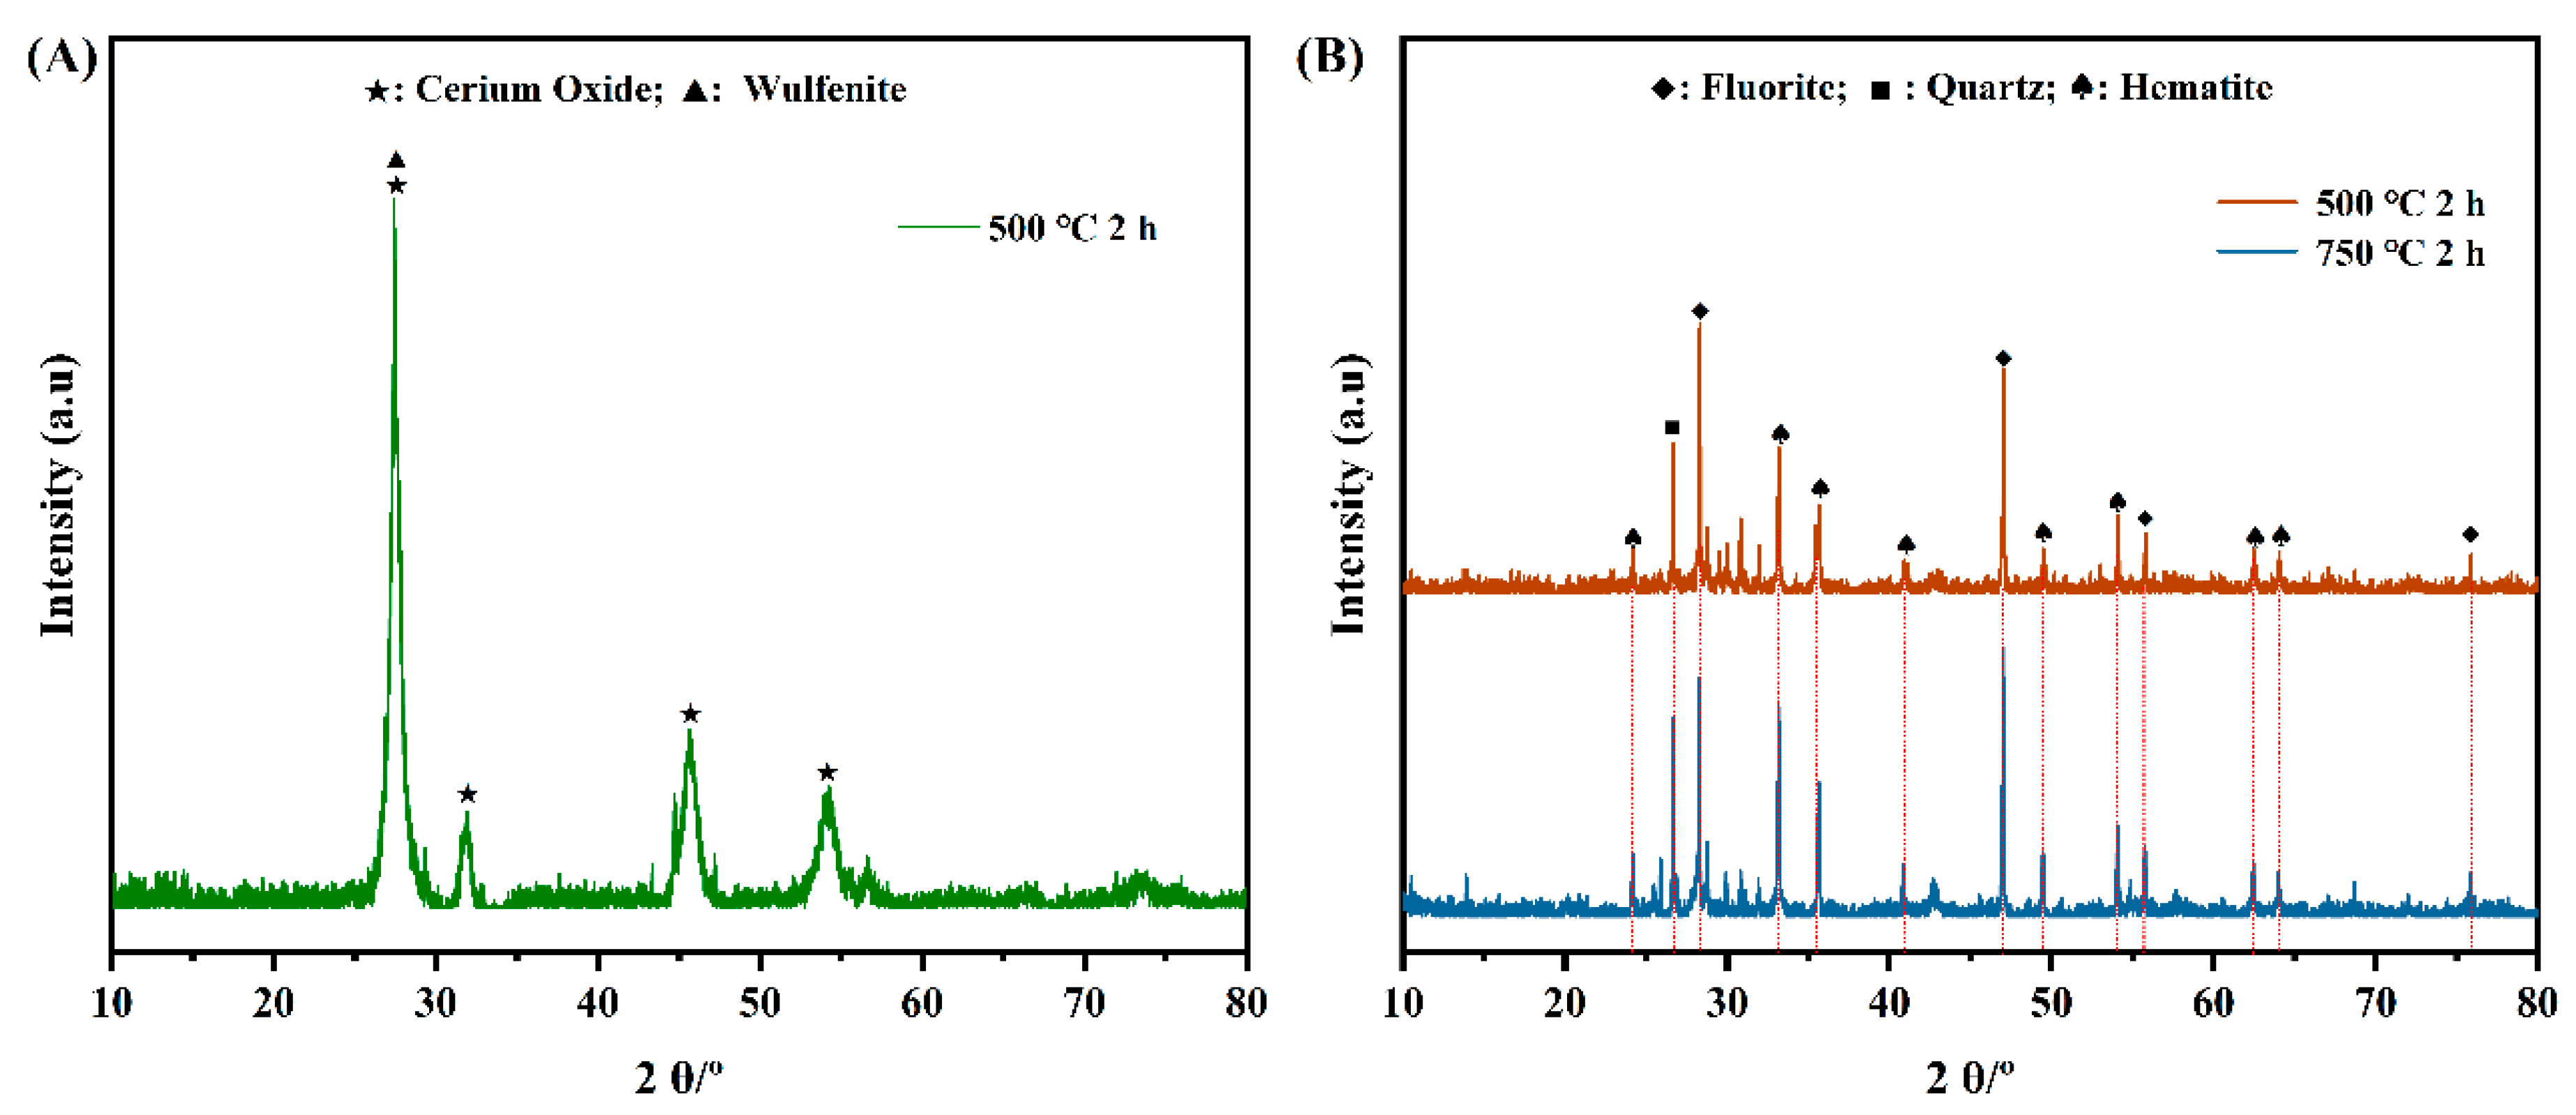
Sites 1 and 5 had higher Fe contents, which presented a darker color due to the larger atomic number. The Pb content of site 4 was 57.06%, which may be wulfenite. And the contents of O, S, and Ba in site 3 were 22.23%, 10.41%, and 51.65%, respectively, which was barite in Figure 6. After roasting, the contents of Ce and La were increased due to the decomposition of bastnaesite particles and the removal of impurities, and the peaks of bastnaesite were oxidized into cerium oxide in Figure 7A.
The oxidation reaction equation is shown in Equation (3) [31].
( C e ,   L a ) 2 O 3 + 2 ( C e ,   L a ) O F + O 2   3 ( C e ,   L a ) O 2 + ( C e ,   L a ) O F 2  
According to the results of this analysis, B-ore was mainly composed of was bastnaesite, and small amounts of wulfenite, barite, and iron ore.
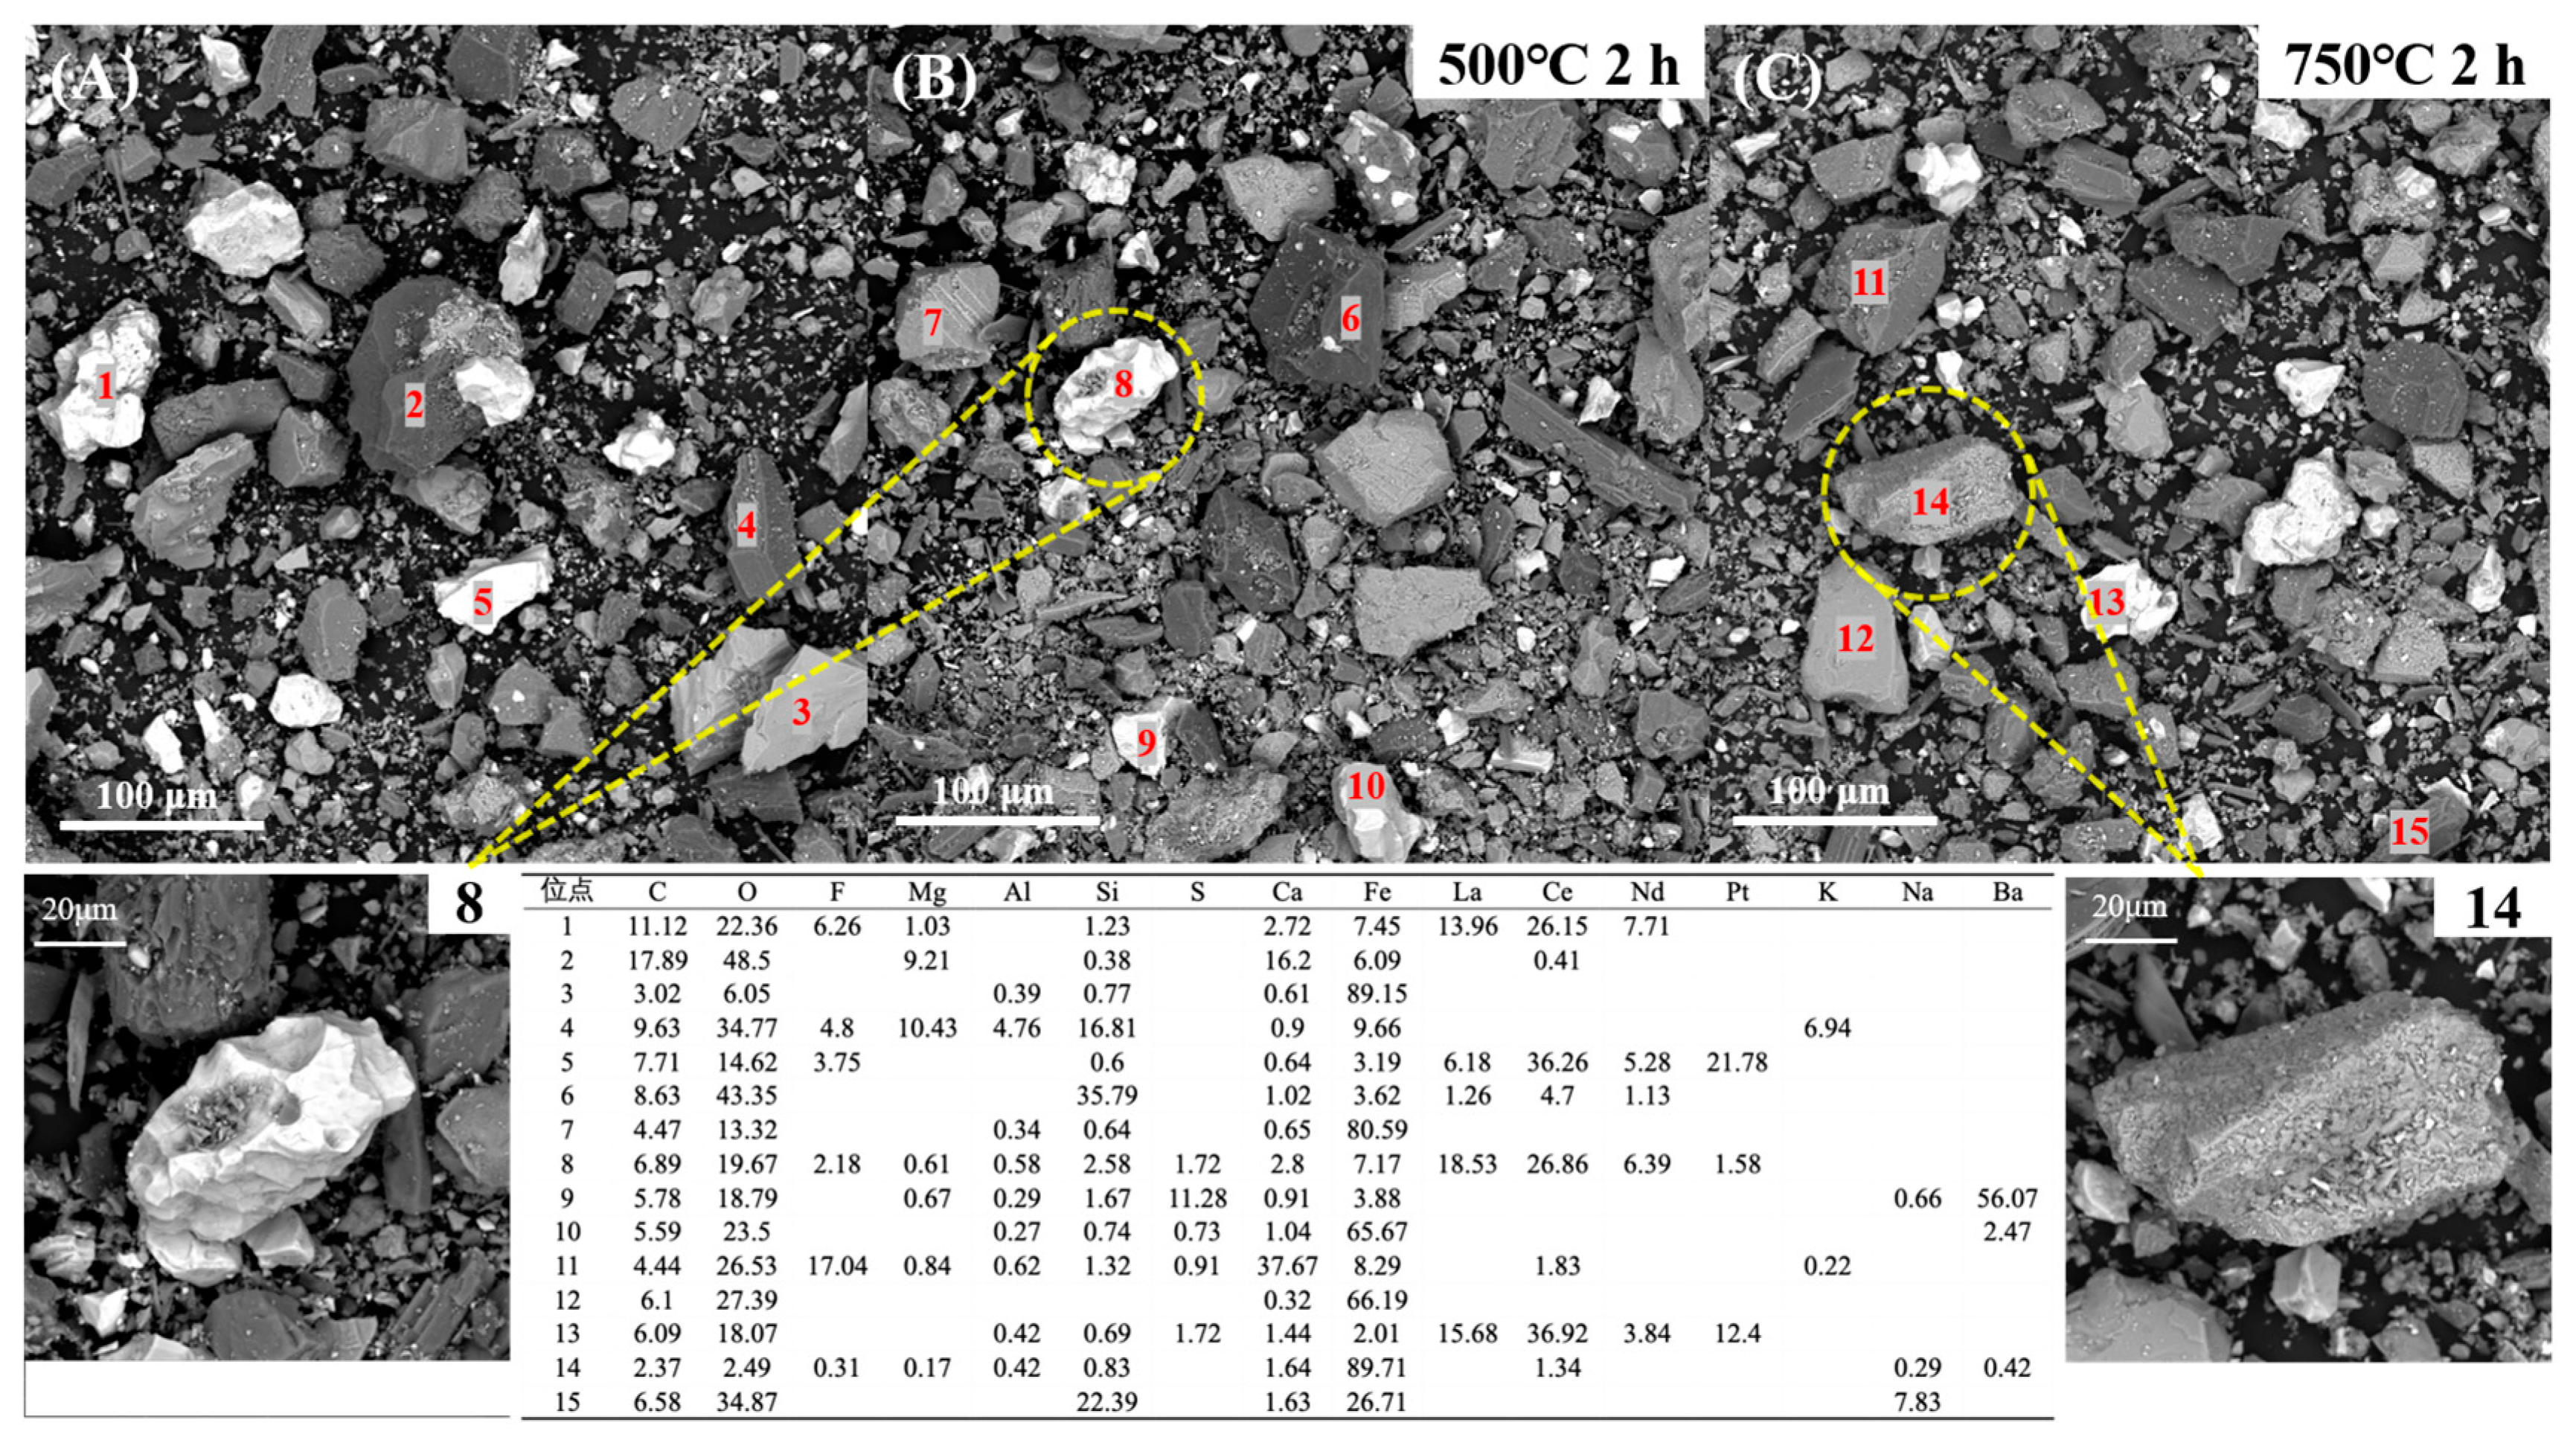
By comparing sites 1, 8, and 13 in Figure 8, it could be seen that after roasting, the contents of REEs were increased significantly, while the content of F was decreased, which might be attributed to the fact that R-ore contained more H2O than B-ore, rare earth fluorine oxides hydrolyzed, and hydrogen fluoride gas was released.
The hydrolysis reaction equation is shown in Equation (4) [31].
2 ( C e ,   L a ) O F + H 2 O   ( C e ,   L a ) 2 O 3 + H F
By comparing the XRD images of 500 °C and 750 °C in Figure 7B and Figure 2, changes in the diffraction peak intensity of hematite, fluorite, and quartz can be observed. Firstly, a higher conversion rate of magnetite to hematite as the temperature increased could be found through comparing the content of O in Figure 8. Then, the enhanced intensity of fluorite diffraction peak attributed to the reaction of calcite and rare earth fluoride.
The possible reaction equation is shown in Equation (5) [32].
2 ( C e ,   L a ) F 3 + 3 C a O   ( C e ,   L a ) 2 O 3 + 3 C a F 2
Moreover, quartz might undergo a phase transition around 573 °C, from α-quartz (low-temperature quartz) to β-quartz (high-temperature quartz) [33].

3.4.3. FTIR Analysis

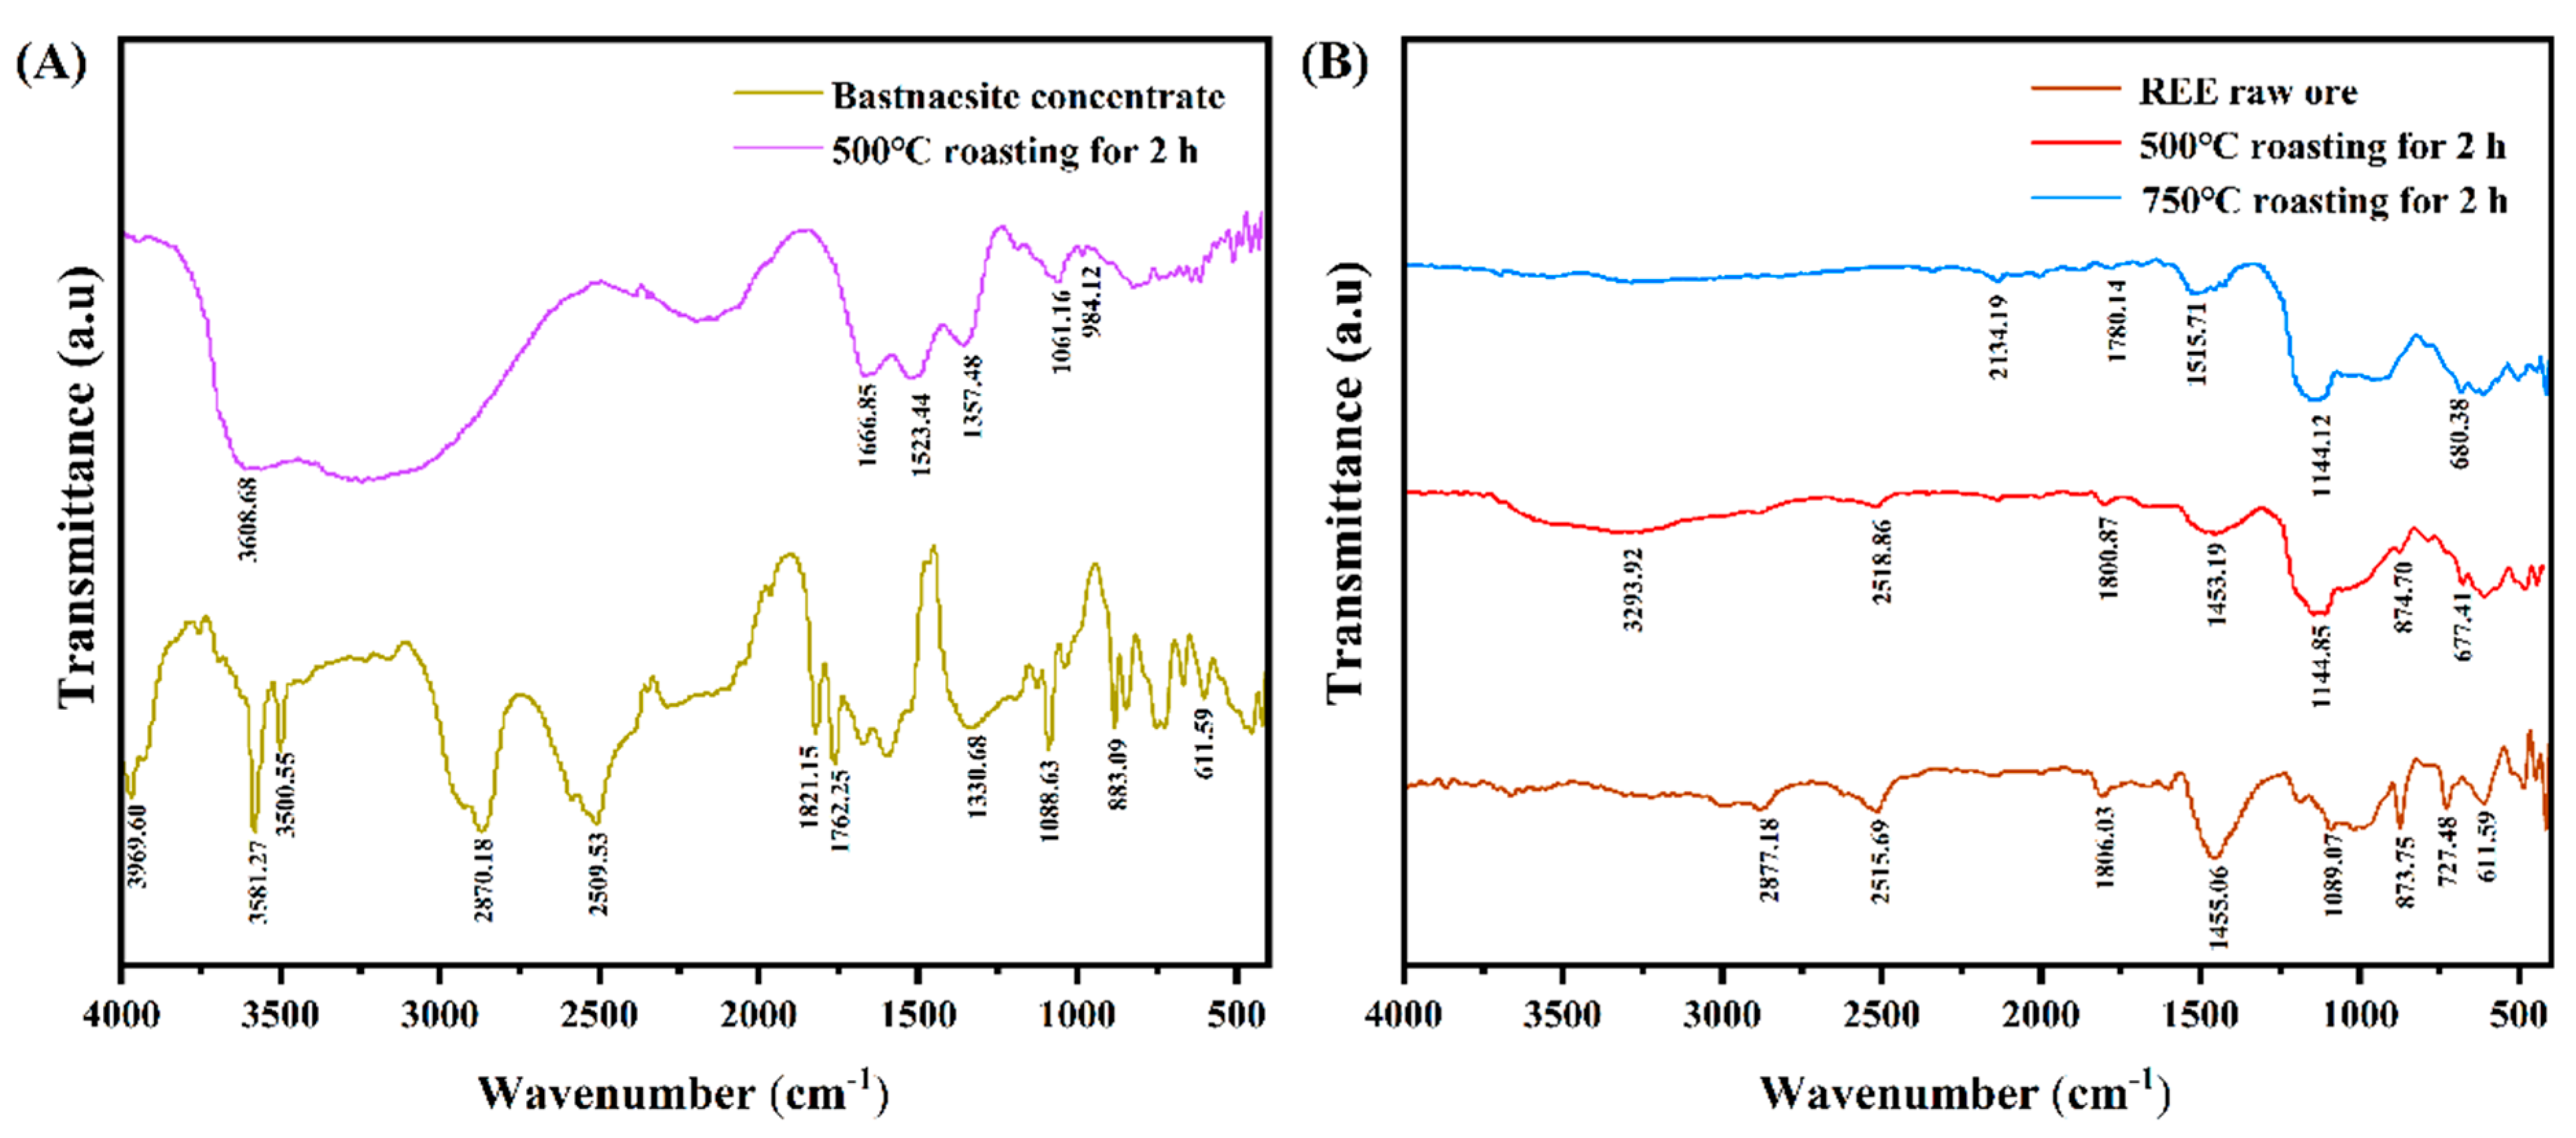
Figure 9 shows the FTIR spectra between wave numbers 400 and 4000 cm−1, which reveal the changes in functional groups of REE ores before and after roasting. The peaks around 1088 cm−1 and 883 cm−1 were ascribed to the characteristic peaks of bastnaesite in Figure 9A [34]. The peaks appearing in 3500 cm−1 and 3581 cm−1 were sharp, which were the stretching vibration peaks of hydroxyl groups, possibly free hydroxyl groups, or intermolecular hydrogen bonds. The peaks appearing at 1330 cm−1 and 1762 cm−1 were C-O stretching vibration and C=O vibration peaks. In addition, there were two wide, almost connected stretching vibration peaks of O-H between 2500 and 3000 cm−1; these peaks presented the existence of fatty acids [35]. After roasting, most of these peaks disappeared, indicating the decomposition of residual flotation agents (oleic acid- and hydroximic acid-based agents) and the oxidation of bastnaesite. Figure 9B depicts the infrared spectra of R-ore before and after roasting. The peaks appearing in 1089 cm−1 is the asymmetrical stretching vibration of Si-O-Si, which involved the changes of silicates [36]. As a carbonatite mineral, the infrared characteristic absorption spectrum of bastnaesite was mainly composed of C O 3 2 vibration, the asymmetric stretching vibration absorption peak of C O 3 2 at 1455 cm−1, the out-of-plane and in-plane bending vibration absorption peaks of C O 3 2 at 873 cm−1 and 727 cm−1, respectively [37]. The variation in these peaks indicates that during the pyrolysis of R-ore, the decomposition of silicate and bastnaesite constitutes the predominant reactions occurring in the process.

3.4.4. XPS Analysis

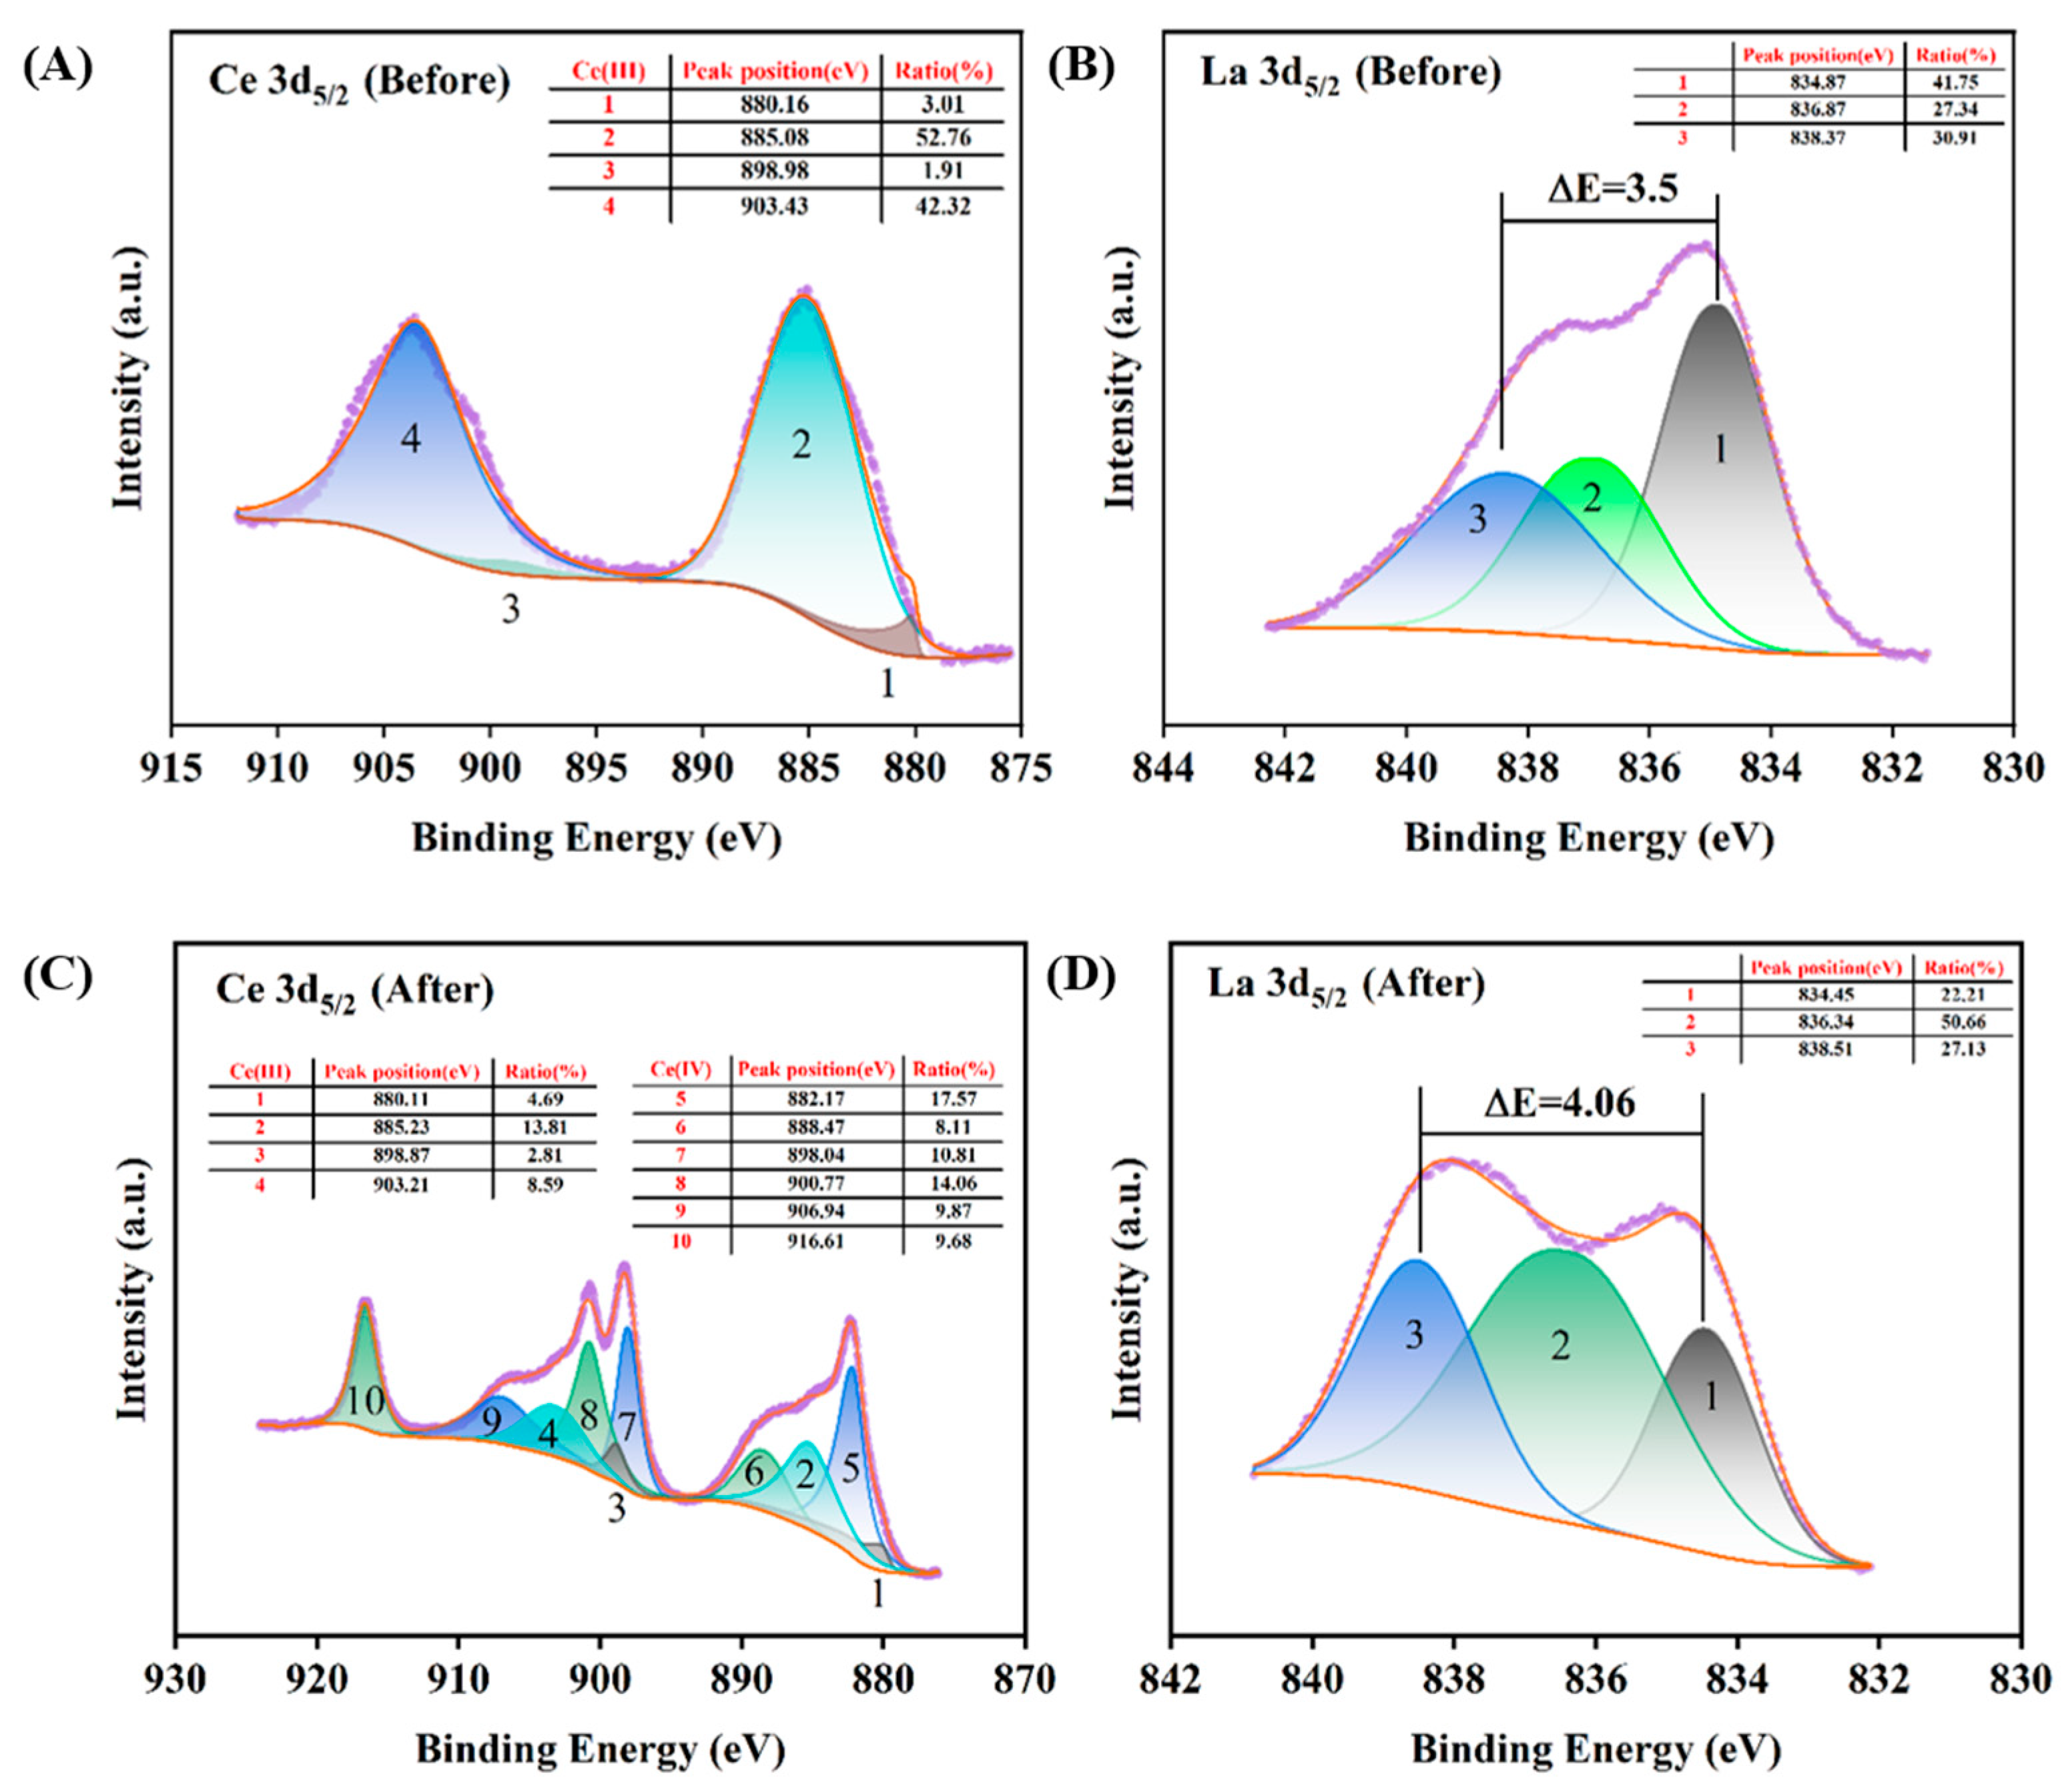
To understand the oxidation behaviors of REEs with changing electrovalence during the thermal decomposition of bastnaesite concentrate, XPS was employed to analyze both the bastnaesite concentrate and the samples after roasting. As depicted in Figure 10A,C, Ce3+ exhibits four characteristic peaks, while Ce4+ demonstrates a more complex splitting pattern with six peaks, arising from both spin–orbit coupling and multiplet splitting effects. Prior to calcination, no Ce4+ species were detected; however, post-calcination, a mixed-valence state was observed, with Ce4+ becoming the dominant species (70.1%) alongside residual Ce3+ (29.9%) [21,38]. For La as depicted in Figure 10B,D, the pre-calcination La 3d5/2 spectrum displayed a multiplet splitting energy difference of 3.5 eV, coupled with a binding energy of −834.87 eV, consistent with La2(CO3)3 as the primary phase. After calcination at 500 °C, the multiplet splitting energy difference increased to 4.06 eV, and the La 3d5/2 binding energy shifted to 834.45 eV, indicating partial conversion of La2(CO3)3 into La2O3 or La(OH)3.
These findings demonstrate that thermal treatment at 500 °C enhances the separation rate and purity of REEs from associated impurities and by promoting the oxidation of Ce3+ to Ce4+ and the decomposition of La2(CO3)3 into higher-purity oxide or hydroxide phases. XPS spectral analysis for R-ore was not performed in this study due to its complex thermal decomposition behavior.

4. Conclusions

In this study, systematic investigations were conducted on the occurrence states of REEs and thermal decomposition behaviors in two types of carbonate-hosted bastnaesite ores, leading to the following key conclusions.
(1) The B-ore is predominantly composed of bastnaesite (53.59% REEs), with minor amounts of wulfenite, barite, and iron oxides. The R-ore exhibits a fluorite-type Nb-REE-Fe mineralization, characterized by paragenetic fluorite, magnetite, and bastnaesite. Notably, isomorphic substitution of Fe by Ce, La, and other REEs occurs within magnetite crystals.
(2) Thermal treatment induces decomposition of bastnaesite into REOs, oxidation of magnetite to hematite, and reactions between fluorite and REOs to form rare earth fluorides, collectively enhancing REEs concentration. Controlled pyrolysis at 500 °C (demonstrated across carbonate-hosted bastnaesite ores from diverse localities) optimizes REEs extractability by promoting these phase transitions.
(3) Elucidating the occurrence states of REEs (e.g., isomorphic vs. mineral-bound) is critical for designing targeted extraction protocols. This study systematically deciphers the complex mineralogical interplay in carbonate-hosted REE ores, providing a theoretical foundation for optimizing extraction methodologies.
(4) Subsequent studies should prioritize chemical leaching or bioleaching to selectively recover REEs while separating Fe impurities.

Author Contributions

Z.J.: Writing—original draft, Formal analysis, Writing—review and editing. N.H.: Writing—original draft, Methodology, Data curation, Writing—review and editing. L.H.: Supervision, Project administration, Funding acquisition, Writing—review and editing. Y.L.: Writing—review and editing. J.G.: Writing—review and editing. H.Z.: Writing—review and editing, Funding acquisition. All authors have read and agreed to the published version of the manuscript.

Funding

This research was funded by the National Natural Science Foundation of China (52222406, 52270172), and Ecological Environment Research Project of Hunan Province (HBKYXM-2024023).

Data Availability Statement

The raw data supporting the conclusions of this article will be made available by the authors on request.

Conflicts of Interest

The authors declare that they have no known competing financial interests or personal relationships that could have appeared to influence the work reported in this paper.

References

  1. Dushyantha, N.; Batapola, N.; Ilankoon, I.M.S.K.; Rohitha, S.; Premasiri, R.; Abeysinghe, B.; Ratnayake, N.; Dissanayake, K. The story of rare earth elements (REEs): Occurrences, global distribution, genesis, geology, mineralogy and global production. Ore Geol. Rev. 2020, 122, 103521. [Google Scholar] [CrossRef]
  2. Erust, C.; Karacahan, M.K.; Uysal, T. Hydrometallurgical Roadmaps and Future Strategies for Recovery of Rare Earth Elements. Miner. Process. Extr. Metall. Rev. 2023, 44, 436–450. [Google Scholar] [CrossRef]
  3. Neil, G.C.; Ture, D.; Richard, M.H.; Alan, T.H. Nomenclature of Inorganic Chemistry-IUPAC Recommendations 2005. Chemistry International-Newsmagazine for IUPAC. Chem. Int. 2005, 27, 25–26. [Google Scholar]
  4. Chen, Z.Y.; Li, Z.; Chen, J.; Kallem, P.; Banat, F.; Qiu, H.D. Recent advances in selective separation technologies of rare earth elements: A review. J. Environ. Chem. Eng. 2022, 10, 107104. [Google Scholar] [CrossRef]
  5. Zheng, X.; Liu, Y. Mechanisms of element precipitation in carbonatite-related rare-earth element deposits: Evidence from fluid inclusions in the Maoniuping deposit, Sichuan Province, southwestern China. Ore Geol. Rev. 2019, 107, 218–238. [Google Scholar] [CrossRef]
  6. Yin, J.N.; Song, X. A review of major rare earth element and yttrium deposits in China. Aust. J. Earth Sci. 2021, 69, 1–25. [Google Scholar] [CrossRef]
  7. Seredin, V.V.; Dai, S.; Sun, Y.; Chekryzhov, I.Y. Coal deposits as promising sources of rare metals for alternative power and energy-efficient technologies. Appl. Geochem. 2013, 31, 1–11. [Google Scholar] [CrossRef]
  8. Hower, J.; Granite, E.; Mayfield, D.; Lewis, A.; Finkelman, R. Notes on Contributions to the Science of Rare Earth Element Enrichment in Coal and Coal Combustion Byproducts. Minerals 2016, 6, 32. [Google Scholar] [CrossRef]
  9. Zhou, B.; Li, Z.; Chen, C. Global Potential of Rare Earth Resources and Rare Earth Demand from Clean Technologies. Minerals 2017, 7, 203. [Google Scholar] [CrossRef]
  10. Chen, P.; Ilton, E.S.; Wang, Z.; Rosso, K.M.; Zhang, X. Global rare earth element resources: A concise review. Appl. Geochem. 2024, 175, 106158. [Google Scholar] [CrossRef]
  11. Wang, X.; Yao, M.; Li, J.; Zhang, K.; Zhu, H.; Zheng, M. China’s Rare Earths Production Forecasting and Sustainable Development Policy Implications. Sustainability 2017, 9, 1003. [Google Scholar] [CrossRef]
  12. Fan, H.; Yang, K.; Hu, F.; Liu, S.; Wang, K. The giant Bayan Obo REE-Nb-Fe deposit, China: Controversy and ore genesis. Geosci. Front. 2016, 7, 335–344. [Google Scholar] [CrossRef]
  13. Liu, Y.; Hou, Z. A synthesis of mineralization styles with an integrated genetic model of carbonatite-syenite-hosted REE deposits in the Cenozoic Mianning-Dechang REE metallogenic belt, the eastern Tibetan Plateau, southwestern China. J. Asian Earth Sci. 2017, 137, 35–79. [Google Scholar] [CrossRef]
  14. Qiao, S.; Bian, X.; Cui, J.; Cen, P.; Wu, W. Clean metallurgy and technical progress of light rare earth minerals. Can. Metall. Q. 2023, 63, 538–550. [Google Scholar]
  15. Yuheng, J.; Yan, L. Factors controlling the generation and diversity of giant carbonatite-related rare earth element deposits: Insights from the Mianning–Dechang belt. Ore Geol. Rev. 2020, 121, 103472. [Google Scholar] [CrossRef]
  16. Wang, K.; Fang, A.; Zhang, J.; Yu, L.; Dong, C.; Zan, J.; Hao, M.; Hu, F. Genetic relationship between fenitized ores and hosting dolomite carbonatite of the Bayan Obo REE deposit, Inner Mongolia, China. J. Asian Earth Sci. 2019, 174, 189–204. [Google Scholar] [CrossRef]
  17. Ma, K.; Zhang, J.; Deng, Q.; Men, P.; Zhang, Y.; Shi, X. Study on REE occurrence in a Svanbergite and basic ore characteristics. Physicochem. Probl. Miner. Process. 2022, 58, 147377. [Google Scholar] [CrossRef]
  18. Hou, X.; Yang, Z.; Wang, Z.; Wang, W. The occurrences and geochemical characteristics of thorium in iron ore in the Bayan Obo deposit, Northern China. Acta Geochim. 2019, 39, 139–154. [Google Scholar] [CrossRef]
  19. Xiong, C.; Xie, H.; Wang, Y.; Wang, C.; Li, Z.; Yang, C. Microdistribution and Mode of Rare Earth Element Occurrence in the Zhijin Rare Earth Element-Bearing Phosphate Deposit, Guizhou, China. Minerals 2024, 14, 223. [Google Scholar] [CrossRef]
  20. Li, W.; Chen, J.; Cheng, S.; Sun, J.; Zhang, X. Thermal decomposition mechanism and kinetics of bastnaesite in suspension roasting process: A comparative study in N2 and air atmospheres. J. Rare Earths 2024, 42, 1809–1816. [Google Scholar] [CrossRef]
  21. Zhao, L.; Wang, L.; Shuai, G.; Long, Z.; Cui, D.; Huang, X. Thermal decomposition and oxidation of bastnaesite concentrate in inert and oxidative atmosphere. J. Rare Earths 2018, 36, 758–764. [Google Scholar] [CrossRef]
  22. Taylor, S.R. Abundance of chemical elements in the continental crust a new table.pdf. Geochim. Cosmochim. Acta 1964, 28, 1273–1285. [Google Scholar] [CrossRef]
  23. Dai, S.f.; Seredin, V.V.; Ward, C.R.; Hower, J.C.; Xing, Y.; Zhang, W.; Song, W.; Wang, P. Enrichment of U-Se-Mo-Re-V in coals preserved within marine carbonate successions: Geochemical and mineralogical data from the Late Permian Guiding Coalfield, Guizhou, China. Miner. Depos. 2015, 50, 159–186. [Google Scholar] [CrossRef]
  24. Shuai, Z.; Zhu, Y.; Gao, P.; Han, Y. Rare earth elements resources and beneficiation: A review. Miner. Eng. 2024, 218, 109011. [Google Scholar] [CrossRef]
  25. Hou, X.; Yang, Z.; Wang, Z. The occurrence characteristics and recovery potential of middle-heavy rare earth elements in the Bayan Obo deposit, Northern China. Ore Geol. Rev. 2020, 126, 103737. [Google Scholar] [CrossRef]
  26. He, J.; Li, Y.; Xue, X.; Ru, H.; Huang, X.; Yang, H. Leaching of fluorine and rare earths from bastnaesite calcined with aluminum hydroxide and the recovery of fluorine as cryolite. Rsc Adv. 2017, 7, 14053–14059. [Google Scholar] [CrossRef]
  27. Liu, P.; Yang, L.; Wang, Q.; Wan, B.; Ma, Q.; Chen, H.; Tang, Y. Speciation transformation of rare earth elements (REEs) during heating and implications for REE behaviors during coal combustion. Int. J. Coal Geol. 2020, 219, 103371. [Google Scholar] [CrossRef]
  28. Salameh, Y.; Albadarin, A.B.; Allen, S.; Walker, G.; Ahmad, M.N.M. Arsenic(III,V) adsorption onto charred dolomite: Charring optimization and batch studies. Chem. Eng. J. 2015, 259, 663–671. [Google Scholar] [CrossRef]
  29. García, A.C.; Latifi, M.; Chaouki, J. Kinetics of calcination of natural carbonate minerals. Miner. Eng. 2020, 150, 106279. [Google Scholar] [CrossRef]
  30. Khan, U.S.; Amanullah; Manan, A.; Khan, N.; Mahmood, A.; Rahim, A. Transformation mechanism of magnetite nanoparticles. Mater. Sci. 2015, 33, 278–285. [Google Scholar] [CrossRef]
  31. Wang, H.; Li, M.; Zhang, D.; Gao, K.; Li, J.; Weng, Z.; Xu, W. Phase change, micro-structure and reaction mechanism during high temperature roasting of high grade rare earth concentrate. J. Rare Earths 2020, 38, 1140–1150. [Google Scholar] [CrossRef]
  32. Tong, Z.; Hu, X.; Wen, H. Effect of roasting activation of rare earth molten salt slag on extraction of rare earth, lithium and fluorine. J. Rare Earths 2023, 41, 300–308. [Google Scholar] [CrossRef]
  33. Fukuhara, M.; Sampei, A. Effects on high-temperature-elastic properties on Æ-=â-quartz phase. J. Mater Ials Sc Ience Lett. 1999, 18, 751–753. [Google Scholar] [CrossRef]
  34. Duan, H.; Liu, W.; Wang, X.; Zhao, L.; Fang, P.; Gu, X. Preparation of a novel bis hydroxamic collector and its impact on bastnaesite flotation. Miner. Eng. 2020, 156, 106496. [Google Scholar] [CrossRef]
  35. Hu, J.; Zheng, X. Practical Infrared Spectroscopy, 1st ed.; Science Press: Beijing, China, 2011. (In Chinese) [Google Scholar]
  36. Huseynov, E.; Garibov, A.; Mehdiyeva, R.; Huseynova, E. Fourier transform infrared spectroscopic study of gamma irradiated SiO2 nanoparticles. Int. J. Mod. Phys. B 2018, 32, 1850074. [Google Scholar] [CrossRef]
  37. Wang, Y.; Wang, D.; Xu, L.; Xue, K.; Zhang, X.; Shi, X.; Liu, C.; Meng, J. Synthesis and utilization of a novel oleate hydroxamic acid collector for the flotation separation of bastnaesite from barite. Miner. Eng. 2023, 204, 108405. [Google Scholar] [CrossRef]
  38. Li, J.; Xu, Y.; Zhang, X.; Wu, J.; Dong, Z.; Liu, Z.; Hao, X. Decomposition Model of Bastnaesite and Its Fluorine Oxygen Coupling Escape Mechanism. ACS Omega 2024, 9, 38437–38451. [Google Scholar] [CrossRef]
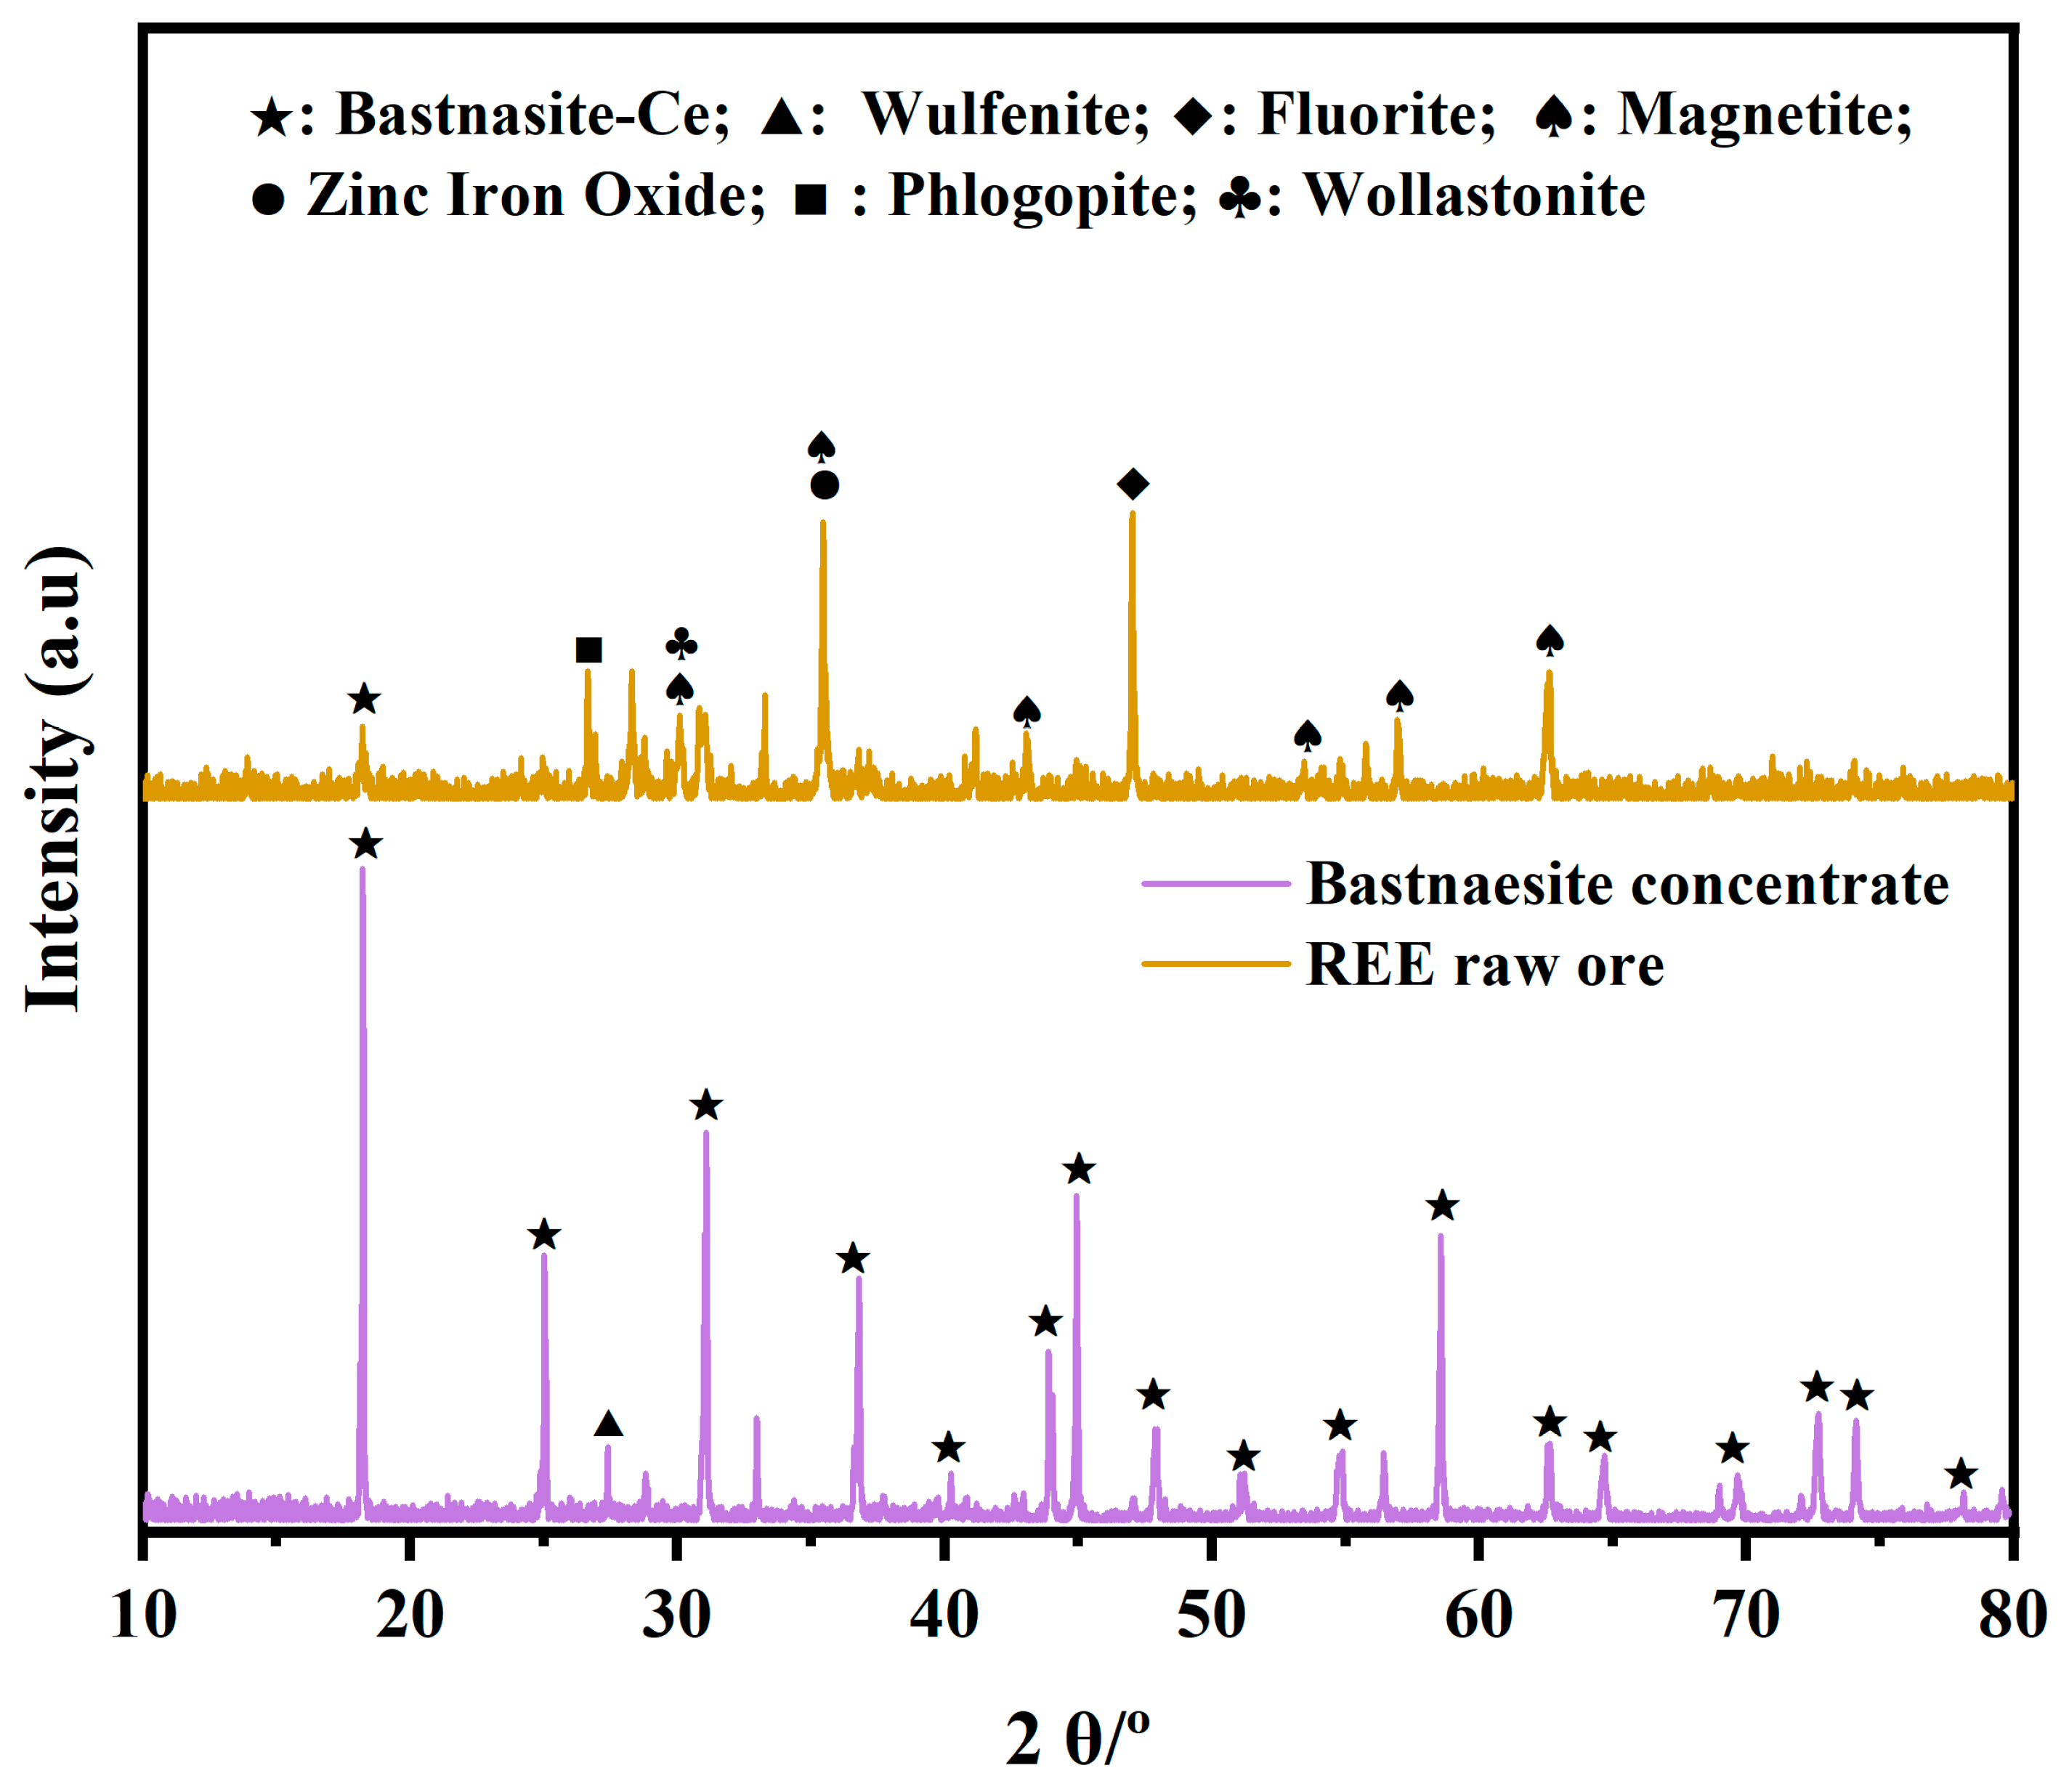
Figure 1. XRD patterns of the bastnaesite concentrate and REE raw ore.
Minerals 15 00866 g001
Figure 2. BSE-EDS analysis results. (A,D) B-ore and R-ore, respectively, ×500; (B,E) B-ore and R-ore, respectively, ×1000; (C,F) the element content of B-ore and R-ore (map spectrum).
Minerals 15 00866 g002
Figure 3. EDS Map analysis results. (A) B-ore; (B) R-ore.
Minerals 15 00866 g003
Figure 4. (A) The distribution proportion of different particle sizes; (B) XRD pattern; and (C) chemical compositions of the R−ore.
Minerals 15 00866 g004
Figure 5. The TG-DSC curves of the (A) B-ore and (B) R-ore.
Minerals 15 00866 g005
Figure 6. SEM images of B-ore before (A) and after (B) roasting (500 °C, 2 h) and the weight percentage of EDS results at corresponding sites.
Minerals 15 00866 g006
Figure 7. XRD spectra of the (A) bastnaesite concentrate and (B) REE raw ore after roasting.
Minerals 15 00866 g007
Figure 8. SEM images of R-ore before (A) and after roasting at 500 °C for 2 h (B) and at 750 °C for 2 h (C), as well as the weight percentage of EDS result at corresponding sites.
Minerals 15 00866 g008
Figure 9. FTIR spectra (400−4000 cm−1) of the (A) bastnaesite concentrate and (B) REE raw ore before and after roasting.
Minerals 15 00866 g009
Figure 10. XPS spectra of the bastnaesite concentrate before and after roasting, (A,C) Ce 3d5/2; (B,D) La 3d5/2.
Minerals 15 00866 g010
Table 1. Chemical compositions of the studied REE ore sample by XRF (wt.%).
B-OreR-Ore B-OreR-Ore B-OreR-Ore
O24.2330.62Ca0.4010.86Nb - 0.06
F9.137.68Ti0.120.27Mo0.86 -
Na0.291.28Mn - 0.44Ba2.42 -
Mg0.042.02Fe1.8834.51La18.051.08
Al0.430.49Co - 0.04Ce27.221.78
Si1.094.27Zn - 0.02Pr1.670.14
P0.100.91Sr0.08 - Nd6.580.71
S1.440.87Y0.07 - Pb3.510.04
K0.100.35Zr0.091.46Th0.210.03
Table 2. The main REE content of the studied REE ore samples by ICP-OES (ppm).
B-OreR-Ore
La218,233.57 ± 78.18801.15 ± 1.56
Ce281,005.70 ± 238.471771.01 ± 0.38
Pr27,800.43 ± 21.72254.86 ± 1.75
Nd65,439.73 ± 79.43749.55 ± 5.50
Table 3. The three parameters for the main elements.
ElementR-Ore (%)Crustal Average (ppm)CC
Ca10.864.15 × 1042.6
P0.9110508.7
Fe34.515.63 × 1046
Y0.02336
Nb0.062030
Ba1.4642534
Th0.039.633
F7.68625123
La1.0830361
Ce1.7860296
Pr0.148.2167
Nd0.7128254
Table 4. The enrichment status of main elements of R-ore.
Slight EnrichmentEnrichmentHigh EnrichmentAbnormal Enrichment
2 ≤ CC < 55 ≤ CC < 1010 ≤ CC < 100CC ≥ 100
CaP, Fe, YNb, Ba, ThF, La, Ce, Pr, Nd
Disclaimer/Publisher’s Note: The statements, opinions and data contained in all publications are solely those of the individual author(s) and contributor(s) and not of MDPI and/or the editor(s). MDPI and/or the editor(s) disclaim responsibility for any injury to people or property resulting from any ideas, methods, instructions or products referred to in the content.