Article

Phase and Composition Study of 18th Century Qallaline Tiles, Tunis

1
MONARIS UMR 8233, Sorbonne Université, CNRS, Campus P.-et-M. Curie, 4 Place Jussieu, 75005 Paris, France
2
Department of Materials Science and Nanotechnology Engineering, Faculty of Engineering, Istanbul Gedik University, Cumhuriyet Mah İlkbahar Sok. No:1 Kartal, 34876 Istanbul, Türkiye
3
UMR 7194—Histoire Naturelle des Humanités Préhistoriques (HNHP), Musée National d’Histoire Naturelle, CNRS, Université Perpignan Via Domitia, Musée de l‘Homme, 17 Place du Trocadéro, 75116 Paris, France
4
Ecole Supérieure des Sciences et Technologies du Design (ESSTED), Avenue de l‘indépendance, Denden 2011, Tunisia
5
Institut National des Sciences Appliquées et de Technologie (INSAT), BP 676, Tunis 1080, Tunisia
*
Author to whom correspondence should be addressed.
Deceased author.
Minerals 2025, 15(8), 865; https://doi.org/10.3390/min15080865
Submission received: 12 July 2025 / Revised: 12 August 2025 / Accepted: 14 August 2025 / Published: 15 August 2025

Abstract

The potters of Qallaline (or Kallaline, from qallāl, meaning “potters” in Arabic), a district of Tunis (Tunisia) near the now-vanished Bab Kartâjanna gate, produced tiles from the 16th century until the end of the 19th century, with peak activity in the 18th century. These tiles, made from local clay, feature decorations influenced by Hafsid art, the Castilian Renaissance, the Spanish Baroque of the Valencia region, and Ottoman styles. Their characteristic color palette combines green, blue, and ochre. Representative sherds from various 18th-century sites were analyzed using SEM-EDS, portable XRF (pXRF), and Raman microspectroscopy. The results were compared with tiles from earlier (16th-century Iznik, Türkiye), contemporary (18th-century Tekfur Palace, Istanbul, Türkiye), and later (19th-century Naples, Italy) productions used for similar purposes. The chemical signature of the different cobalt ores used appears to depend primarily on the production period. The pastes used in Iznik, Tekfur, and Qallaline ceramics exhibit different compositions. Qallaline potters employed three types of pastes, varying in calcium content, which were used either separately or together within the same tile. In some cases, tin was also present in association with lead. The cobalts used at Qallaline originate from different sources than those used contemporaneously in Meissen (Saxony), as well as from those used in the decoration of Iznik tiles one or two centuries earlier, which are themselves comparable to the cobalt used in Persian mīnā’ī. The As, Ni, and Mn contents are similar to those of the cobalt employed at the Royal Manufacture of Sèvres, believed to have come from the Giftain Valley in Catalonia.

1. Introduction

The expulsion of Muslim artisans from Spain in the mid-16th century led many to settle in Hafsid Ifriqiya, particularly in Tunis [1]. Moorish potters (Moriscos) established themselves near the now-vanished Bab Kartâjanna gate, an area rich in clay deposits. Their production became known as Qallaline, derived from qallāl, meaning “potters” in Arabic. The district was originally named Houmet el-Andlouss (“the neighborhood of Andalus”). Kilns were located in what is now known as ‘Place des potiers’, or Jamc J’did (“Potters’ Place”) in Arabic. The production of architectural ceramics flourished in the 17th and 18th centuries, supplying tiles for the decoration of homes and mosques [2,3]. In fact, it is reported that ceramic production has existed in this area since the 10th century [4].
The decoration of Qallaline tiles inspired by zellij (also spelled zillij or zellige), a mosaic tilework made from hand-chiseled pieces [5,6,7,8,9], primarily associated with Morocco [8,9], but also found in al-Andalus and Ifriqiya [7,10], featured mainly painted geometric and floral design. These were stylistically akin to Portuguese azulejos [10,11,12,13,14], Spanish azulejos [15], and Ottoman tiles from Iznik, Türkiye [16,17,18,19,20,21,22,23,24].
Qallaline tile decoration is characterized by a palette combining green, blue, and ochre—colors typical of Hafsid pottery [25]. Their designs were influenced by the Castilian Renaissance, the Spanish Baroque of Valencia, and Ottoman ceramic styles from Iznik and Kütahya [15,26,27].
To the best of our knowledge, the present work is the first comprehensive study of Qallaline production, with the exception of a preliminary Raman analysis of two utensil shards [25]. We compare the compositions, colorants, and opacifying phases of four representative Qallaline tiles with reference samples from earlier and later productions, including 16th-century Iznik tiles (Türkiye), 18th-century Ottoman tiles from Tekfur Palace (Istanbul, Türkiye), and a 19th-century or later tile from Naples (Italy). Non-invasive techniques such as Raman microspectroscopy and portable X-ray fluorescence (pXRF) were prioritized to allow for comparable in situ analysis of similarly tiled sites. In specific cases, small samples were extracted for SEM-EDS analysis to confirm and supplement the spectroscopic data.

2. Materials and Methods

2.1. Artifacts

Table 1 shows the labels of the sherds, as well as their provenance and dating.
Three sherds originate from the mausoleum (zâwiya ou zaouia) of Sidi Ali Azzuz in Zaghouan (AZ, P2, and P3), a town approximately 65 km from Nabeul, Tunisia’s main center for ceramic production. Another sample (P1) from a zaouia also dedicated to Sidi Ali Azzuz in Tunis is dated to around 1756. Sidi Ali Azzuz, born in Fez, Morocco, was one of Tunis’s revered patron saints. He lived during the second half of the 17th century, and his primary zaouia is located in Zaghouan, where he settled for spiritual contemplation. This venerable zaouia, constructed in 1680 by a Mouradite prince, features a dome of glazed tiles and walls covered with geometric tile patterns. It is located near the Great Mosque of Zaghouan. Stylistic analysis dates the tiles to approximately 1750–1760.
Documentation on the Qallaline workshops and their masters is scarce, with only limited records available from the National Archives of Tunis (A.N.T) and the French Consulate archives from the Protectorate period [30].
A tile marked “Naples” (labeled It hereafter) on its reverse side is characteristic of late 19th-century (or later) Italian production and was widely used in Tunisian buildings of that period.
A sherd from the Dyers’ Mosque (Jāmi’ Masjid ou Jamc J’did ou Mosquée des Teinturiers), built by Hussein I Bey-founder of the Husseinite dynasty and successor to the Mouradites, was also included. The mosque was inaugurated in April 1727 [28]. This sherd displays a typical Ottoman palette, with vivid blues and reds [17,39,40,41], and is attributed to the Tekfur Palace kilns, which were established in Edirnekapı, Istanbul, under the patronage of Nevşehirli Damat İbrahim Pasha. As tile production in Iznik had significantly declined by the early 18th century, the establishment of a new production center aimed at achieving a quality comparable to that of Iznik became necessary. Therefore, in 1718, two master tile makers were brought from Iznik to replicate Iznik-style ceramics. However, the tiles produced at Tekfur Palace failed to achieve the same level of technical and aesthetic success as their Iznik counterparts, and production ceased by the 1750s [17,39].
The ceramic bodies of Tekfur tiles (Tek) are frit-based, similar to those of Iznik tiles, but generally coarser in texture [35,41,42,43,44]. A distinctive feature is the presence of a thick quartz slip layer beneath the decoration, with a higher clay content than that typically found in Iznik slips. The transparent glazes applied over the decoration often exhibit a greyish or grey-green tint [43,44]. The color palette of Tekfur tiles includes pale red with a brownish hue, cobalt blue, navy blue, turquoise, green, and black outlining. Tile dimensions are comparable to those of Iznik tiles and generally larger than those produced in Kütahya [43,44].
For comparative purposes, two standard 16th-century Iznik tiles (Iz1C and Iz2Tr) with polychrome decoration—exhibiting visually distinct ceramic bodies—were also included in the study corpus [16,18,19,20,21,22,23,35,36,37,38,39,40,41,42,43].

2.2. Methods

2.2.1. Optical Microscopy

The sherds, including their surfaces and cross-sections, were observed without any preparation using an Olympus BX51 microscope equipped with 5× (NA: 0.15) and 10× (NA: 0.30) objectives, and AnalySIS 2006.V2 software (Olympus Soft Imaging Solution, Tokyo, Japan). Images of the cut sections were captured with an Epson scanner (Seiko Epson, Tokyo, Japan) at 600–1200 dpi resolution, ensuring optimal color balance.

2.2.2. Portable X-Ray Fluorescence Spectroscopy (pXRF)

The analytical protocol follows methods described in previous studies [45,46]. XRF analysis was performed using a portable Elio instrument (Milano, Italy) featuring a Rh-anode X-ray tube, a ~1 mm2 collimator, and a large-area Silicon Drift Detector (energy resolution < 140 eV for Mn Kα; detection range: 1.3–43 keV in air). The instrument was mounted on a dedicated frame for stability, and measurements were taken in point mode for 180 s at 50 kV and 80 μA, with no filter between tube and sample.
The analysis depth, estimated using the Beer–Lambert law (defined as the layer from which 90% of the fluorescence originates), was approximately 6 μm for Si Kα, 170 μm for Cu Kα, 300 μm for Au Lα—comparable to glaze thicknesses—but 3 mm for Sn Kα [47]. Accuracy was verified using reference glass and stone materials. Since the intensity of electronic transition peaks (Kα, Kβ, Mα, Mβ, Lα, Lβ, Lγ, etc.) depends on both elemental identity and concentration, peaks for trace elements like Pb and Rb can appear more intense than those for major components like Si. Due to topological variation in the 3D distribution of colorants, calculating a single “composition” is not meaningful. Instead, a clustering analysis method developed by our group was used. This involved plotting normalized peak areas (calculated with Artax 7.4.0.0, Bruker AXS GmbH, Karlsruhe, Germany) in ternary and biplot scatter diagrams. Normalization was performed relative to the Rh tube peak, and for blue-decorated samples, also to the Co or Si signal depending on the pXRF instrument used in the other studies for comparative purposes across chronologies and technologies.

2.2.3. Raman Microspectroscopy

Raman analysis was conducted using a Labram HR800 spectrometer (HORIBA Scientific Jobin-Yvon, Palaiseaur, France), with excitation provided by an Ar+ ion plasma laser (Innova I90C 6UV, Coherent Inc., Santa Clara, CA, USA). The 457.9 and 514.5 nm lines were used with laser powers ranging from ~0.3 mW (for colored enamels) to 8 mW (for paste) at the sample surface. Spectra were acquired using a 50× long working distance (LWD = 13 mm, NA = 0.45) objective (Olympus, Tokyo, Japan). Each analyzed spot measured ~5 × 5 µm2, consistent with expected pigment grain sizes. Penetration depth was uniform in colorless glazes but lower in dark-colored zones.
Spectral windows ranged from 50 to 4000 cm−1, with accumulation times ranging from a few minutes to tens of minutes. At least three accumulations were made per spot to suppress cosmic ray noise. Three measurements were made per area. Using a 600 lines/mm grating, the uncertainty in peak position was about ±2 cm−1.

2.2.4. Scanning Electron Microscopy–Electron-Dispersive Spectroscopy

Following Raman and pXRF analyses, only micro-samples (~1 mm3) were extracted from sherd edges to minimize damage. SEM-EDS analyses were carried out using a JEOL 5410 LV microscope at 20 kV accelerating voltage in SE imaging mode. Samples were mounted on a metal stub, partially covered with carbon-rich tape to reduce charging effects, leaving a small window for analysis. Because colored areas could not be precisely identified in SEM imaging, this window allowed correlation with Raman and optical microscopy data.
EDS spectra were recorded at 400× magnification, covering a ~300 × 250 µm2 area—larger than the typical pigment grain size—to ensure representative composition measurement.

3. Results

3.1. Microstructure and Composition Comparison

3.1.1. Paste

Figure 1 illustrates the diversity of glaze colors (turquoise, green, blue, red, yellow, eggplant, and black) and ceramic body hues (white and reddish-pink). Qallaline tiles typically exhibit a two-tone paste structure, with a white slip layer over a pink body beneath the glaze. In contrast, Ottoman tiles from Tekfur Palace and Iznik (see Table 1) feature either white or pale pink pastes. Enamel thickness varies between 300 and 500 µm.
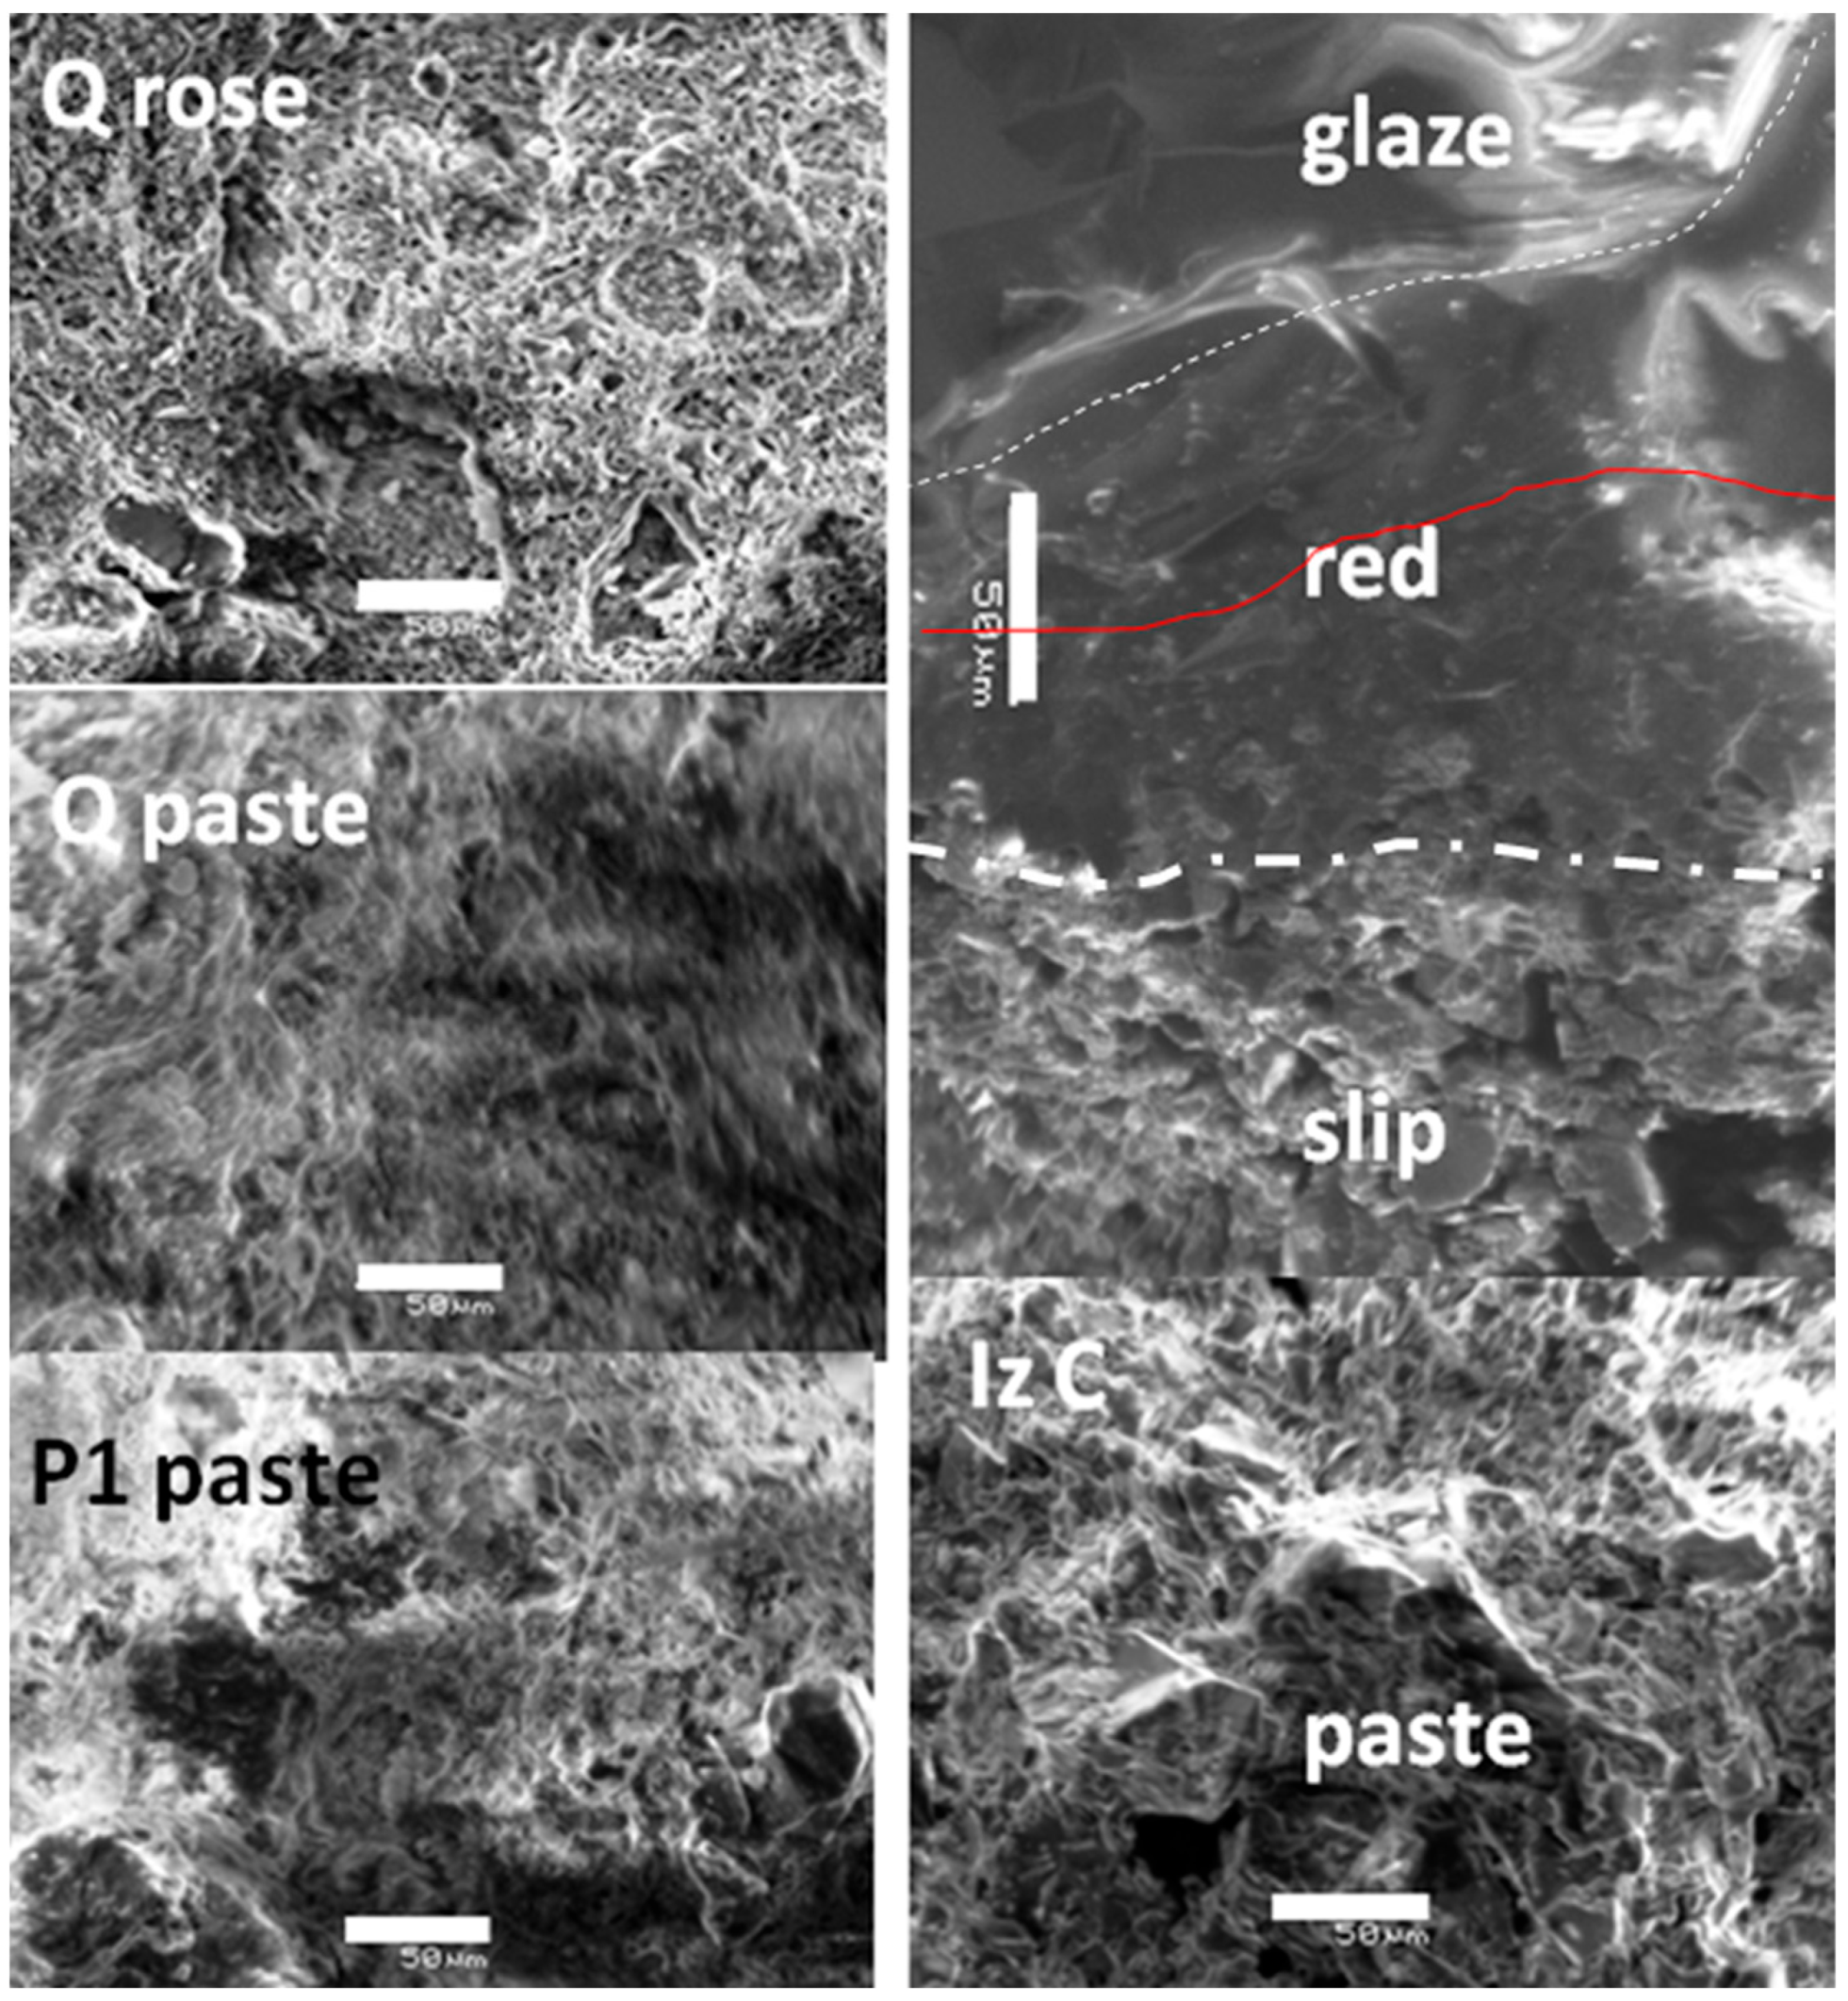
Examination of the Qallaline body sections under both an optical microscope (Figure 1b) and an electron microscope (Figure 2) reveals a very fine grain size, with the largest grains rarely exceeding 20 µm. This suggests that the paste is intermediate between typical terra cotta and earthenware.
The high clay content in the Qallaline-type tiles results in a texture that visually retains traces of the forming process, such as residual deformation patterns in the paste-clear indicators of a clay-based body. In contrast, the Iznik paste exhibits a more homogeneous structure with grain sizes ranging from 10 to 20 µm, as inferred from the voids left by grains on the fracture surface. Closer inspection of a red-decorated area reveals a superficial, transparent enamel layer approximately 50–100 µm thick, overlaying, for example, a red granular mixture applied on a siliceous slip, which is characteristic of Iznik production [16,26,35,36,37,38,39,40,41,42].
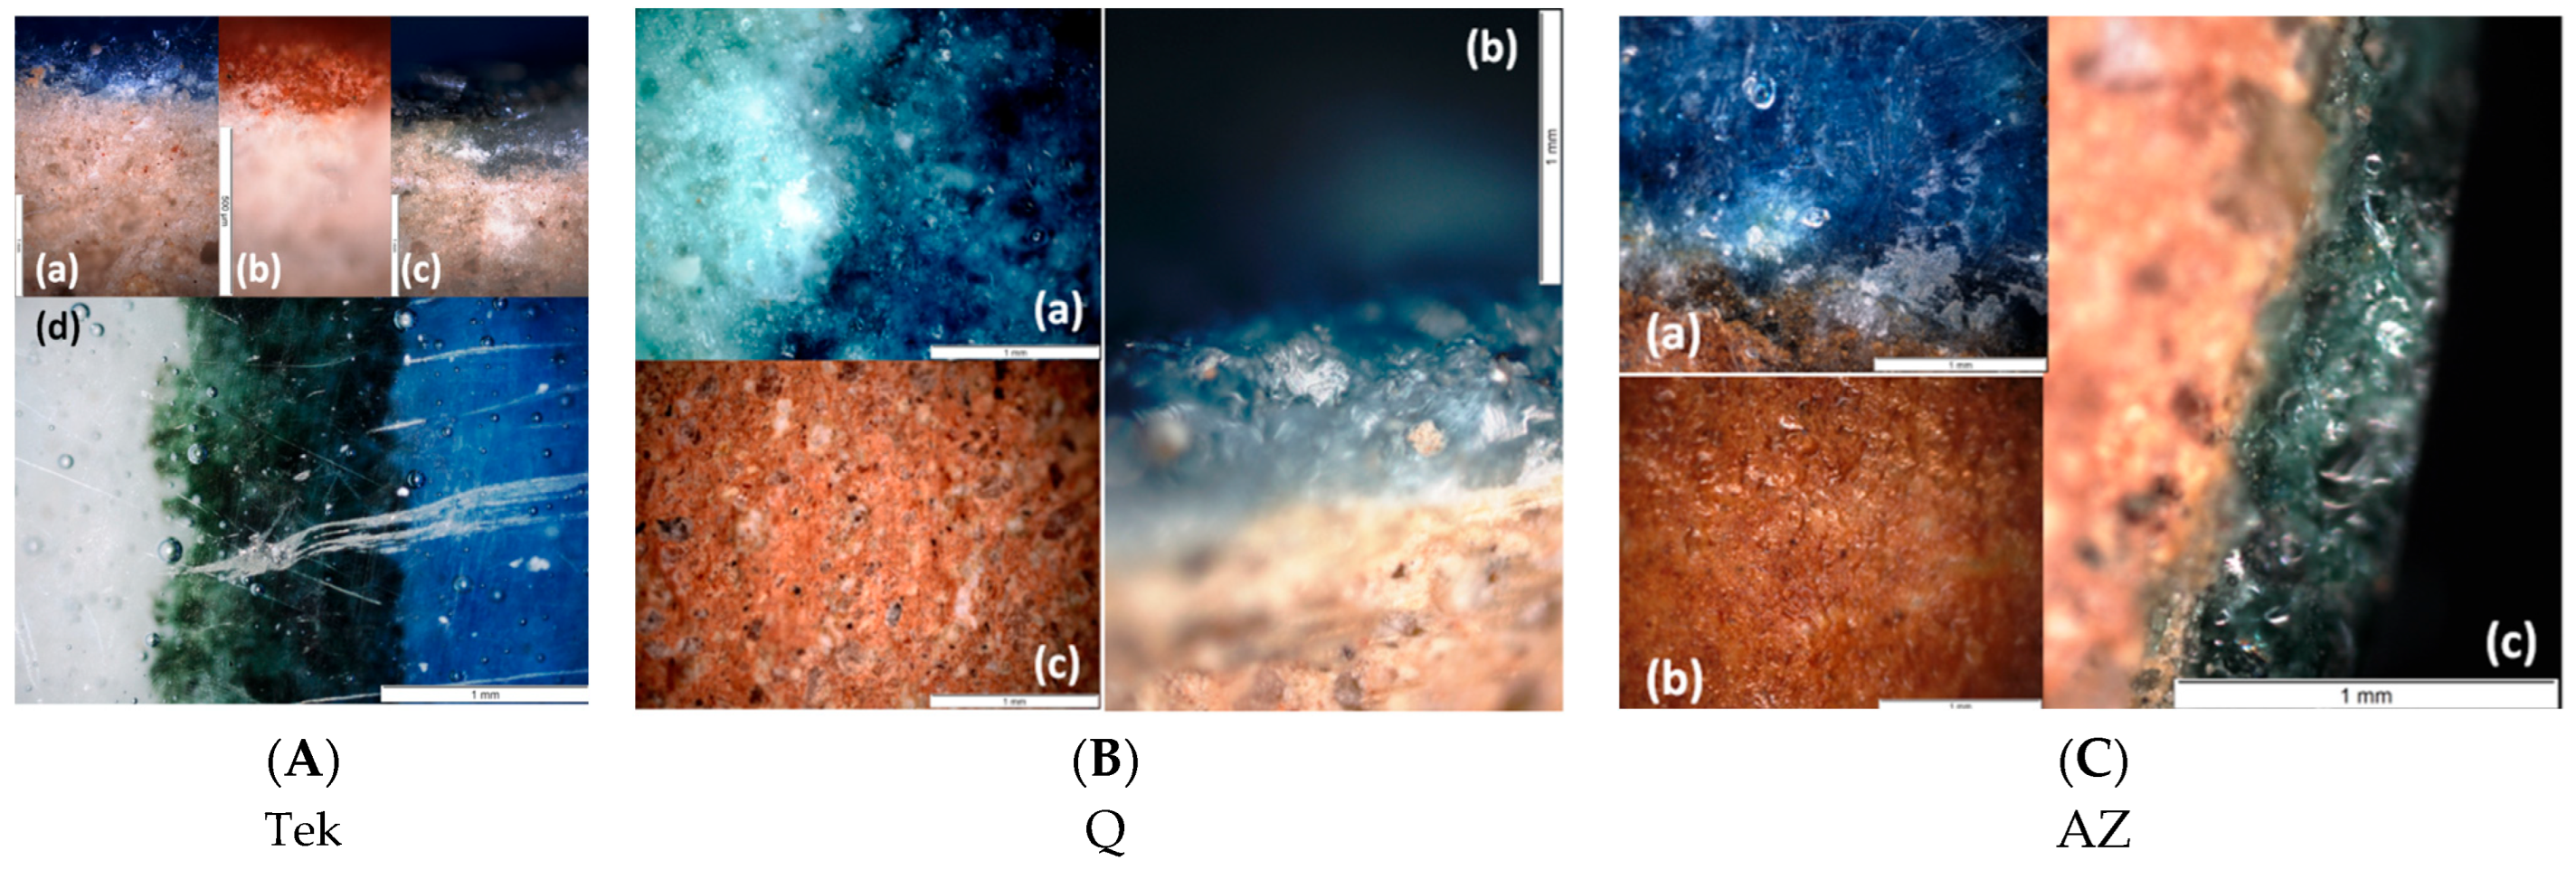
In the Qallaline tiles, this quartz-based slip is absent. A partial slip layer is observed in the Tekfur tile: it appears beneath the white areas and the raised red decoration, but not under the blue areas. High-magnification optical images of sherd sections and glazed surfaces are shown in Figure 3. The paste of tile AZ (Figure 3C) appears finer in grain size than that of tile Q (Figure 3B). Overall, the paste sections of sherds Q and AZ appear similar.
The pXRF and SEM-EDS techniques are complementary: EDS allows accurate local measurement of major elements, especially lighter ones, while XRF detects a broader range of minor and trace elements but over variable depths. Light elements (e.g., Si, Al) are analyzed at the very surface (a few µm layer); transition metals are detected at medium depths (up to 100–200 µm, that almost correspond to the glaze thickness), and heavy elements (e.g., Sn, Sb) are measured from deeper layers due to their high-energy peaks. Therefore, XRF data are primarily comparative, the contribution of the heavy elements from the glaze being decreased by the contribution of the substrate, almost free of heavy elements.
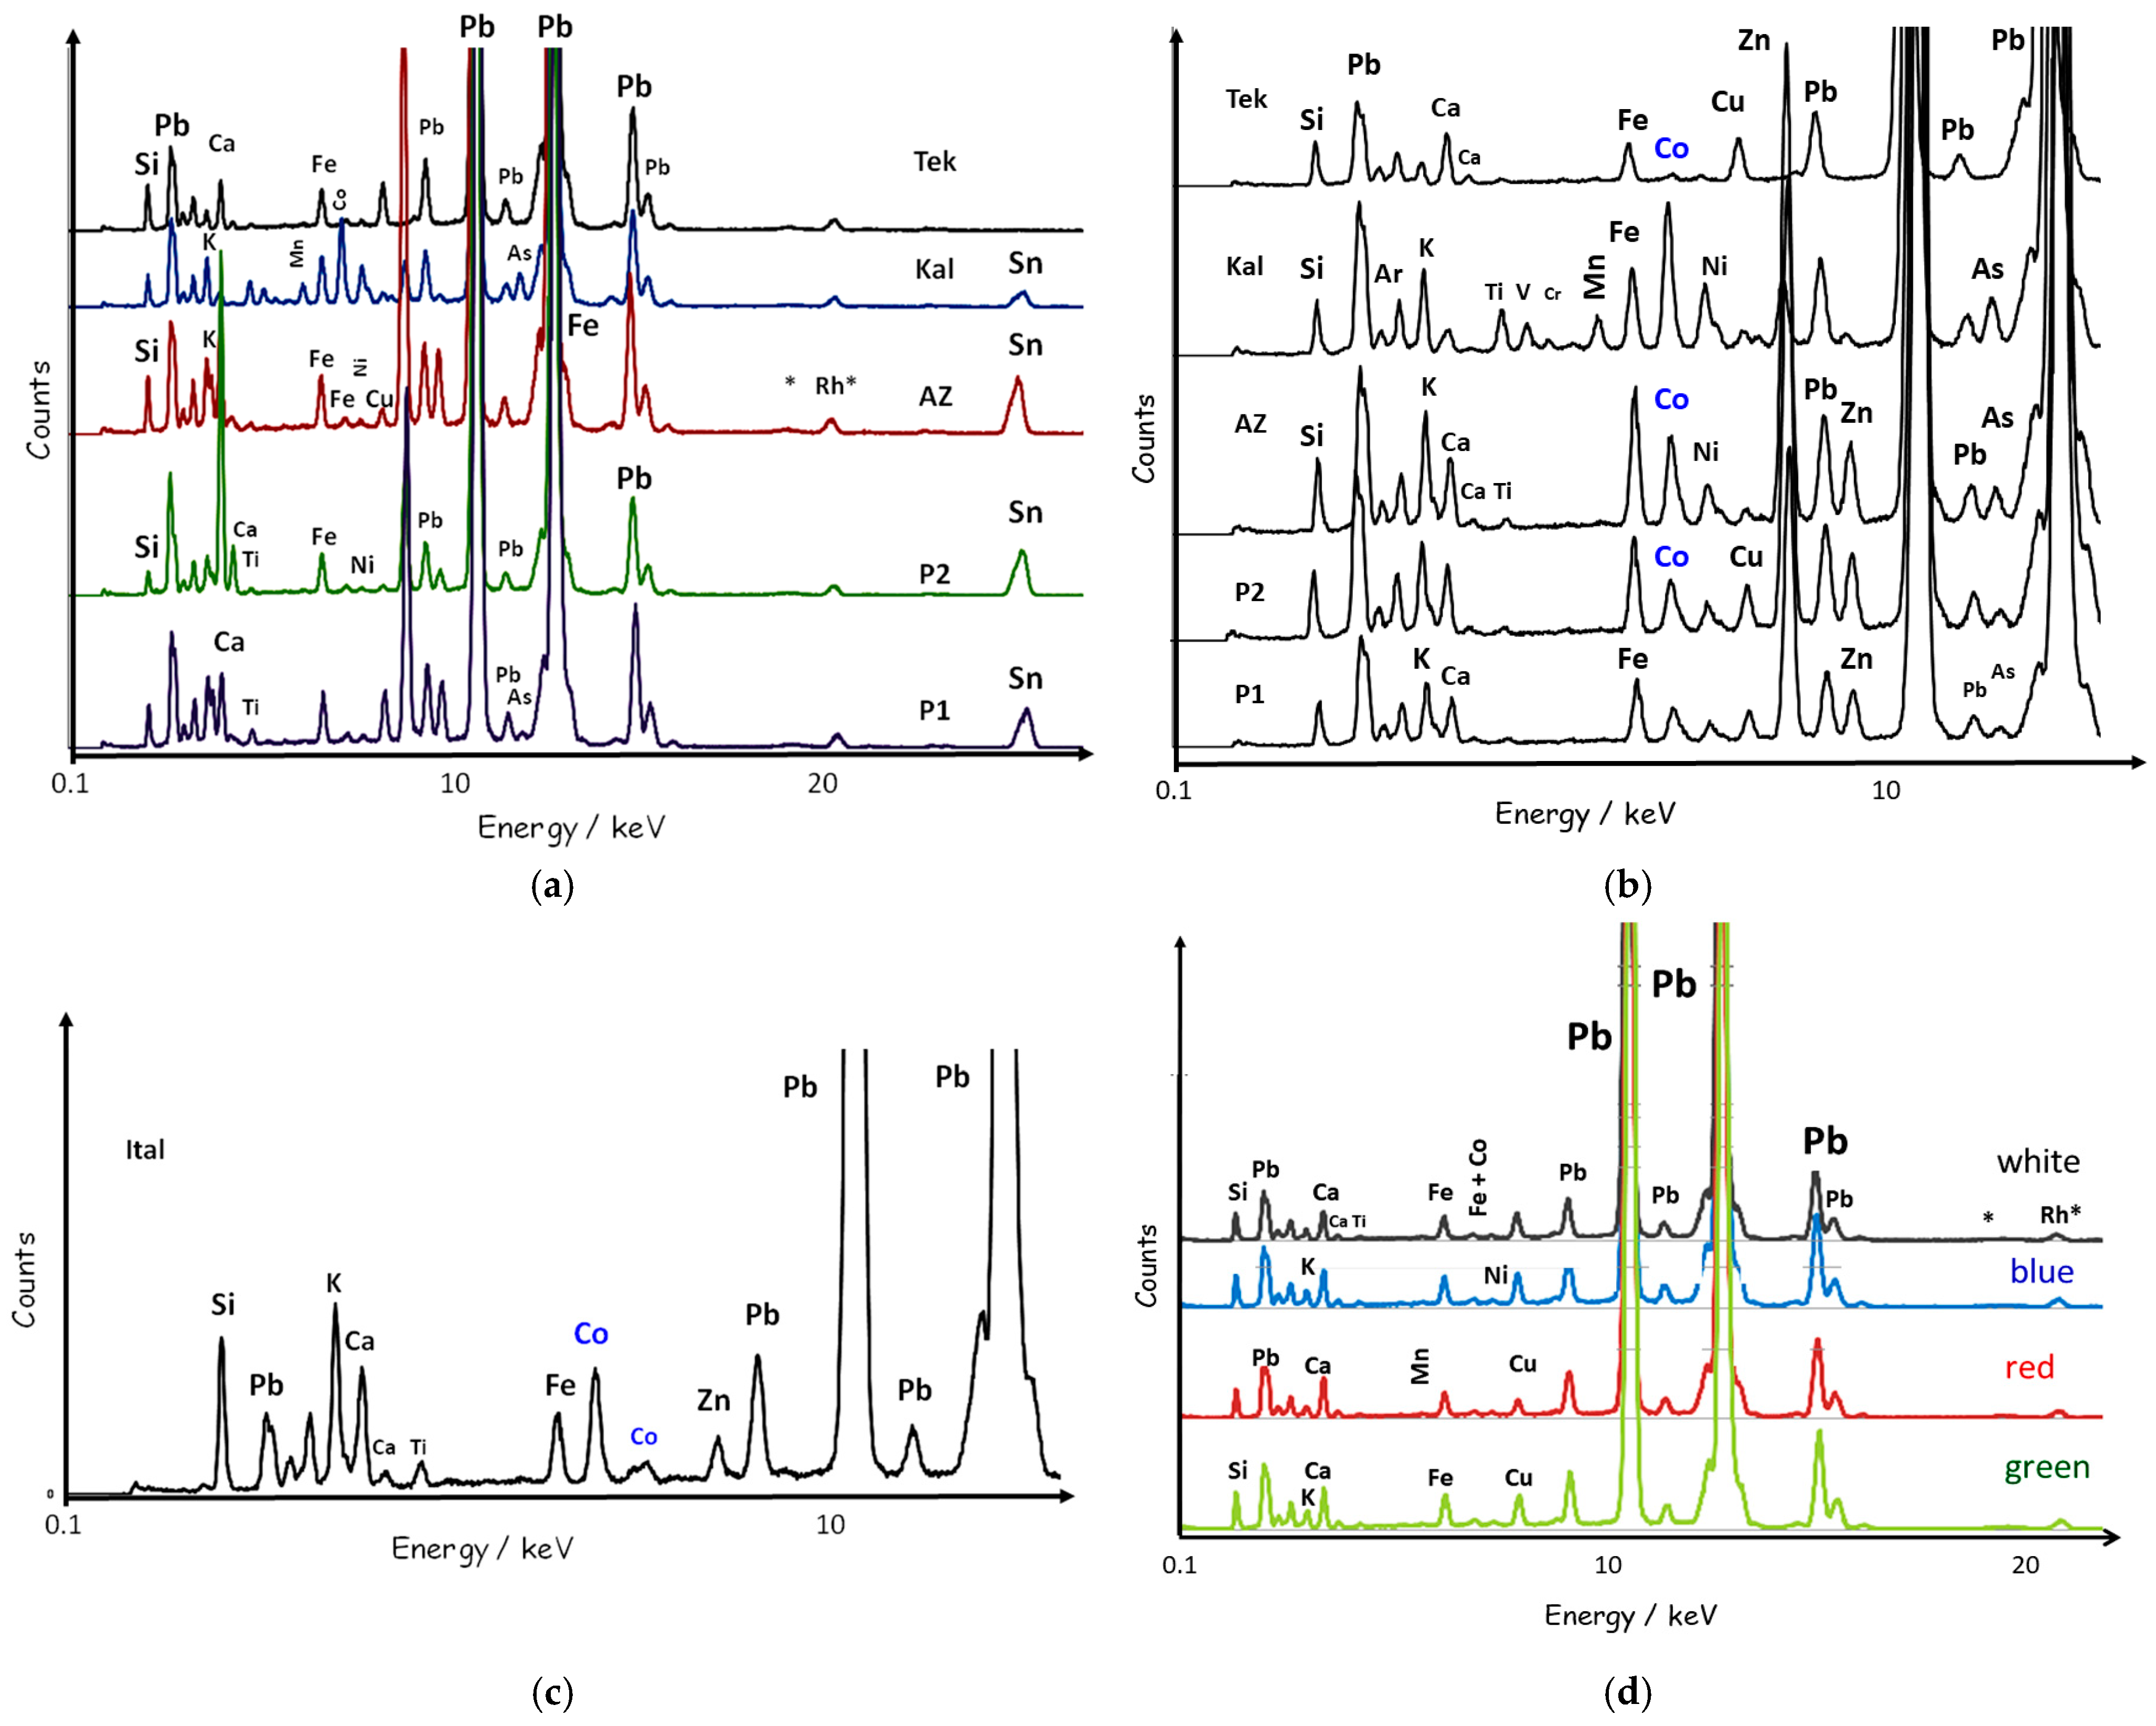
Figure 4 compares the XRF spectra acquired from the ceramic body sections. The Ottoman Iznik sample is notable for its strong lead signal (both M- and L-lines), indicating the use of a lead-rich frit in the body composition. The other bodies contain only a small amount of lead, with slightly higher levels in the P2 sherd and the pink slip of the Qallaline sherd. The similarity between the bodies of AZ and P1 is clear, while the spectra of the Qallaline and P2 sherds are also quite similar, with the slip layer showing a modestly elevated lead content, probably due to diffusion from the glazed surface. Surprisingly, a significant level of tin is observed for P1, and a lower level for P2 and P3. The addition of tin should be voluntary since the amount of lead is very low. However, tin may be associated with the lead ore or introduced through the use of metallurgical scrap as a raw material. A third hypothesis is the use of a Sn-containing glaze as a frit to aid in the sintering of the body. The measurements were taken a few millimeters away from areas where the body was contaminated by the molten glaze, which appears to have been excluded. The highest amount of tin is detected in the P1 sherd. Distribution appears rather homogeneous at the measurement scale.
Table 2 compares the main characteristics of the local paste compositions, including the Si/Al ratio, flux content (Na, K, Ca, and Pb compared separately), Ca/(Na + K) ratio, and concentrations of Fe and Ti, the main impurities in the raw materials. EDS measurements were performed at 400× magnification over areas of approximately 300 × 250 µm, with care taken to avoid large grains that could bias the results. Therefore, the reported compositions should not be considered fully representative of the entire paste but rather indicative of intra-sample variability.
The Si/Al ratio effectively differentiates siliceous pastes from clay-based ones. For comparison, the Iznik sherds exhibit Si/Al ratios ranging from 9.78 to 17.19, consistent with the known presence of quartz grains in the body volume analyzed [16]. The Tekfur sherd shows an even higher Si/Al ratio up to 19.48, confirming its silica-rich, fritware composition. In contrast, the AZ, Q, P1, and It sherds, which display Si/Al ratios between 2.20 and 4.36, confirm their clay-based nature. Interestingly, the P2 sherd—although visually similar to P1—has a Si/Al ratio of 14.21, indicating a more siliceous—or heterogeneous—paste than P1. This distinction, also observed in the XRF data, suggests that different types of tiles were used in the Sidi Ali Azzuz mausoleums at Zaghouan and Tunis, despite their similar construction periods.
The calcium-to-(Na + K) ratio further classifies the pastes into three distinct groups:
(i) high-calcium: 1.9–11.3 (Q, AZ, and P1);
(ii) low-calcium: 0.2–1.8 (Iznik and Tekfur);
(iii) intermediate-calcium pastes: 1.8–3.7 (It and P2).
This criterion again distinguishes P2 from the other tiles. Notably, small amounts of lead are present in the Iznik sherds, Tekfur paste, and certain areas of the AZ sherd, as evidenced by the XRF spectra (Figure 4).
Analysis of the iron and titanium contents—key contributors to the paste coloration—confirms these groupings. The Iznik, Tekfur, and P2 samples exhibit particularly low iron concentrations. In contrast, the pink coloration observed in the Qallaline slip appears to be primarily correlated with its higher calcium content. As a result, two distinct types of “Tunisian” pastes are identified: a clay-based paste used in Q, AZ, and P1 wares, and a more siliceous clay-based paste in the sample P2.

3.1.2. Glazed Decoration

Figure 5 presents representative XRF spectra recorded on the surface of the colored glaze areas. The spectra of the white glazes (Figure 5a) indicate the use of tin as an opacifier in Tunisian ceramics, consistent with previous analyses of utensil sherds attributed to the Qallaline kilns [25], and also reveal traces of barium. Cassiterite opacification of lead enamels has been practiced by potters in the Islamic world since the Abbasid Dynasty (9th century) [48]. The Qallaline sherd also displays arsenic, similar to the P1 sherd. These white areas are partially contaminated by adjacent colored zones (Figure 1), which may contribute to these additional elemental signals.
The spectra of the blue areas (Figure 5b) indicate the use of different cobalt-based chromophores. In the Tekfur sherd, the blue coloring is relatively weak due to a thick transparent overglaze. Cobalt is accompanied by copper, while iron is present (as usual) in the uncolored glaze.
The Qallaline sherd reveals the use of a cobalt-rich raw material that also contains iron, nickel (including contributions from cobalt Kβ lines), arsenic, and manganese, as well as traces of titanium, vanadium, and chromium—suggesting the use of a chemically European cobalt ore with limited purification [49]. The cobalt sources used in sherds P1 and P2 appear similar, containing minor amounts of nickel, copper, and zinc. The presence of zinc may suggest the formation of (Co,Zn)2SiO4, a known 19th-century blue pigment [50,51]. The AZ sherd spectrum exhibits lower copper levels; however, in other samples, some copper may have resulted from color bleeding. The spectrum of the more recent Italian sherd (Figure 5c) is relatively simple, reflecting the use of purified cobalt sources such as cobalt carbonate or cobalt oxide.
The green color observed in the Tekfur sherd (Figure 5d) is typically attributed to the use of copper. The brown-yellow areas of the Qallaline tile contain both Sn and Sb, consistent with the presence of Naples yellow, a lead antimonate pigment. The purple (eggplant-colored) zone is colored with manganese, as expected. The matte black area appears to be a firing defect resulting from localized overheating. Barium is detected in both the blue and brown regions of the P2 sample.
Table 3 summarizes the main characteristics of the glaze compositions, including the Si/Al ratio, total flux content (Na + K + Ca, and Pb), and the concentrations of Fe and Ti, which are interpreted as raw material impurities. It also lists colorant elements (Cu, Co, Zn, As, Mn, and Cr), along with rare earth elements such as Ce and Sc. All glazes except blue exhibit a visible Sn signal.
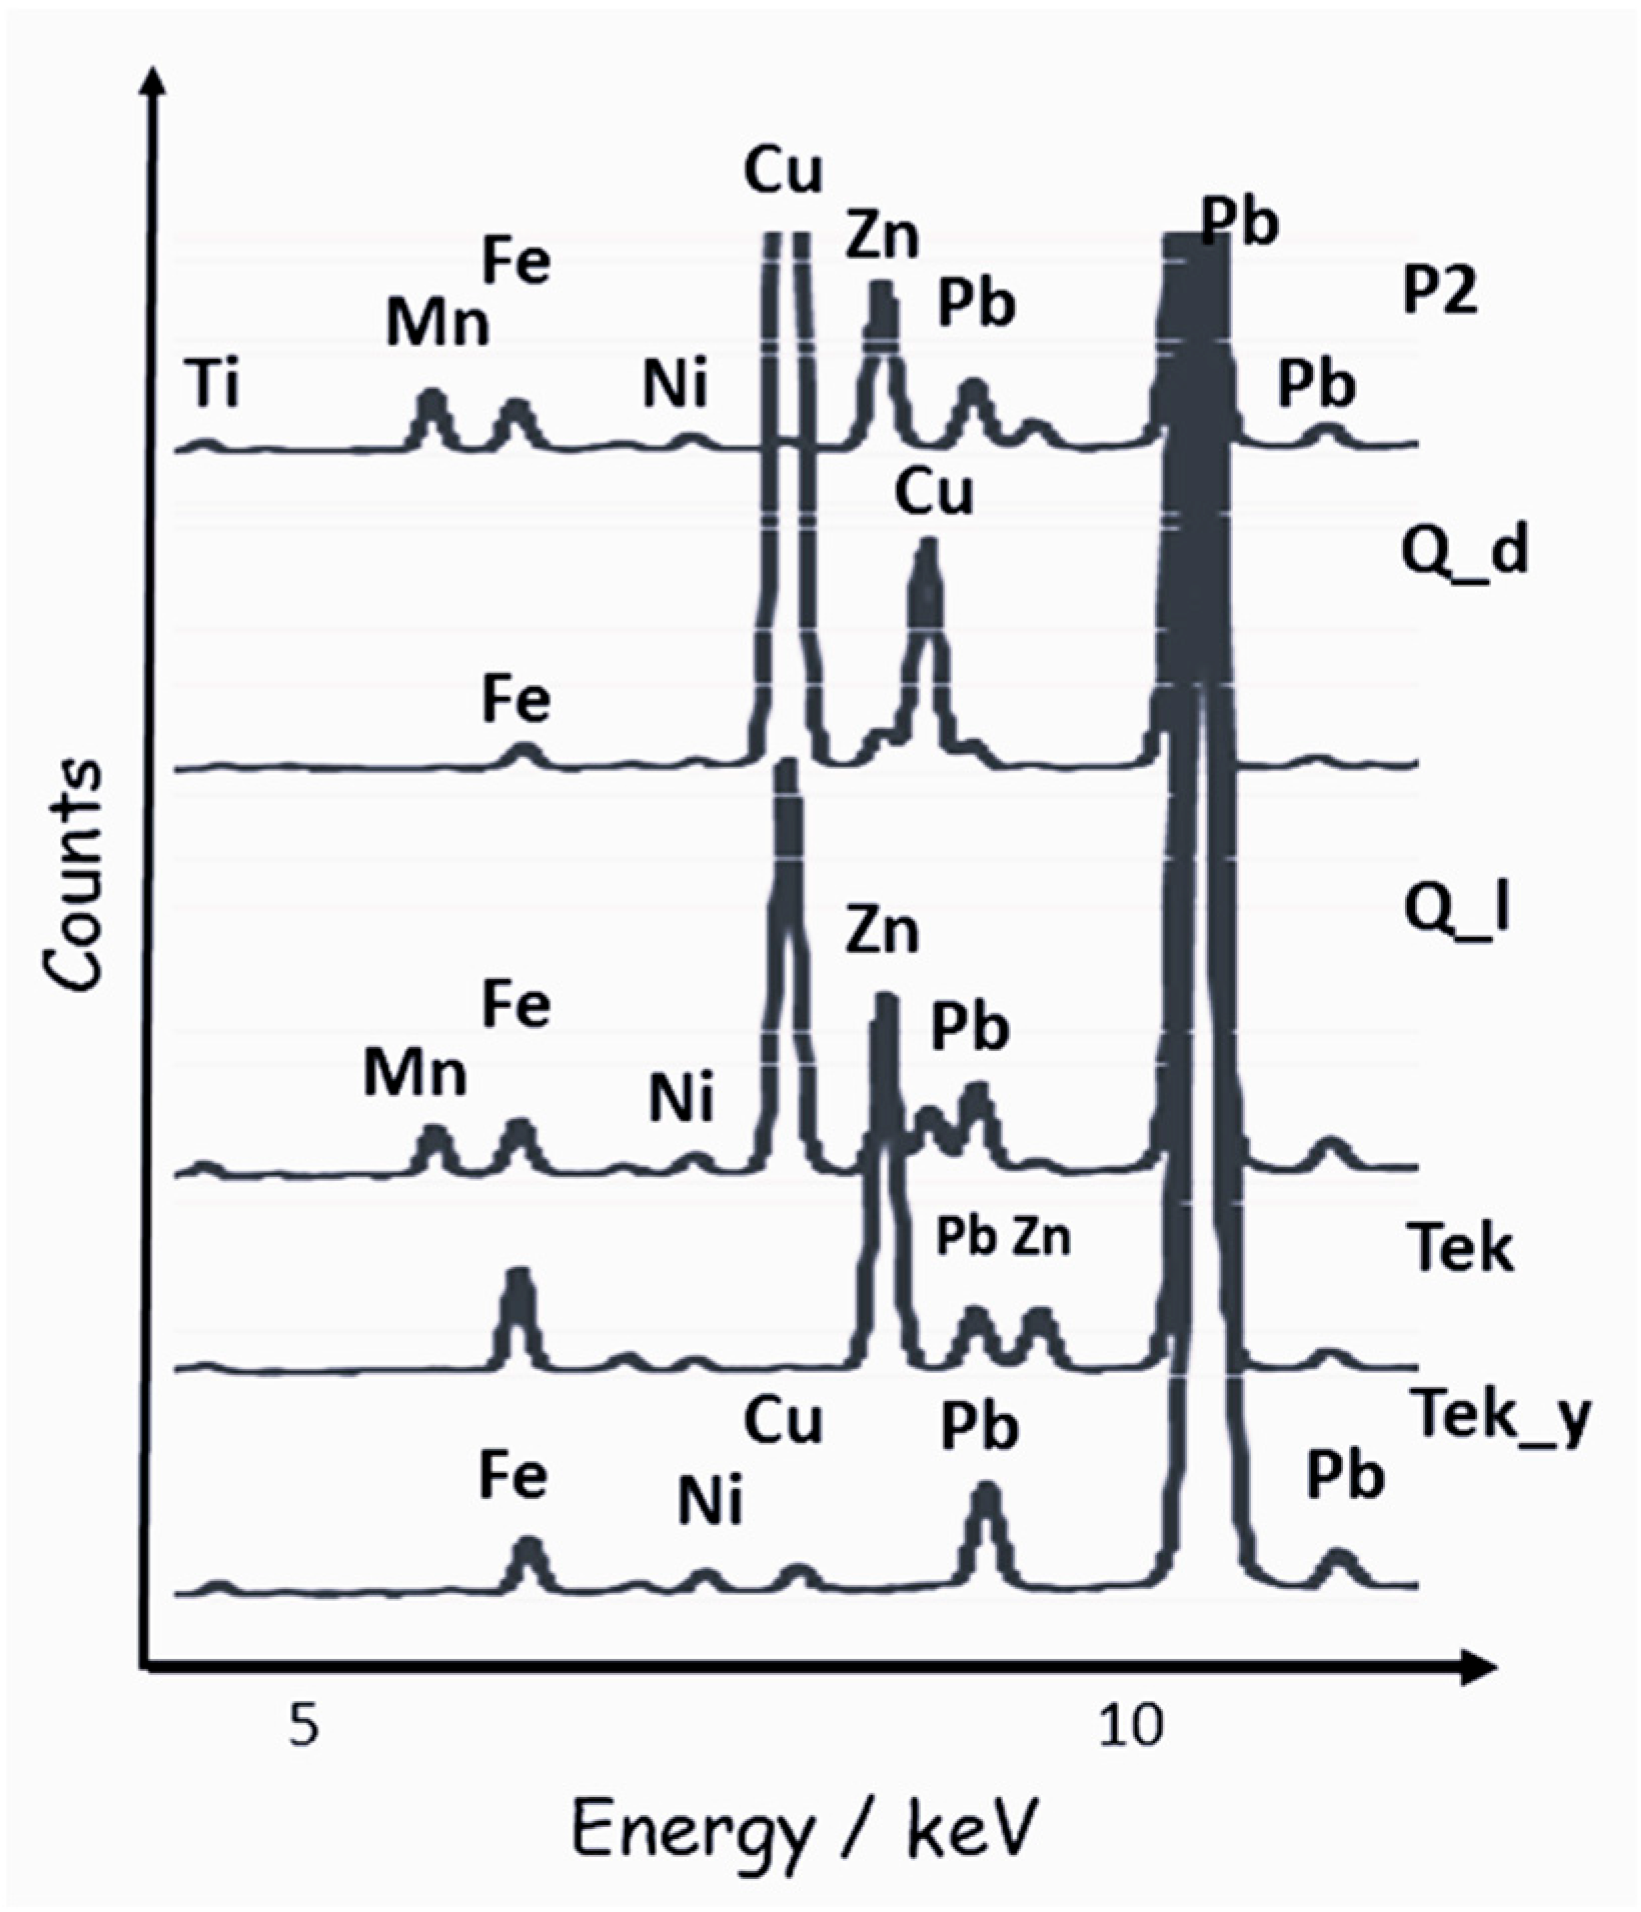
Except for the glaze of the Italian tile and certain red or black areas of the Iznik and Tekfur tiles, all glazes contain lead addition between 1.8 and 6.4 at%. The red and black regions exhibit lower lead levels. As in Iznik ceramics, the refractory black lines separating the colored zones act as diffusion barriers, preventing the migration (“burrs”) of coloring agents. Qallaline black is obtained with copper, iron, and manganese, although P2 (Sidi Ali Azzuz Zaghouan mausoleum) and Tekfur black lines are obtained without copper. The Italian glaze stands out with an exceptionally low lead content (0.45 at%), consistent with a later production technique. The total flux content (Na + K + Ca) remains relatively stable, ranging from ~4 to 8 at%, indicating consistent firing temperatures across samples. In the Tekfur sherd, the turquoise area shows heterogeneously high sodium content. While turquoise is traditionally achieved using Cu2+ ions, cobalt is also detected in the turquoise glaze of this sample (Figure 6).
Blue coloration is generally obtained using cobalt [50], though copper is also present in both Iznik and Tekfur samples, and arsenic is detected in the AZ, P1, and P2 tiles. Black lines contain traces of chromium (e.g., in Iznik and Q), reflecting the use of ferrite and/or chromite pigments typical of Iznik productions. Since the composition of the black lines in enameled decorations often varies from one point to another, a larger set of measurements is required to confirm this preliminary result. Notably, elevated trace levels of cerium are detected in the Q (brown-yellow) and P2 (blue) sherds. As a rare element in ceramic glazes, cerium likely contributes to the prominent peak in the Qallaline blue spectrum, which may be misidentified as vanadium (4.95 keV) (Figure 5b), due to the close energy of the Ce Lα (4.84 keV). This instrumental overlap supports the identification of cerium and strengthens the hypothesis that the P2 tile may have been produced by Qallaline potters, given the shared raw material sources.

3.1.3. Blue Zones

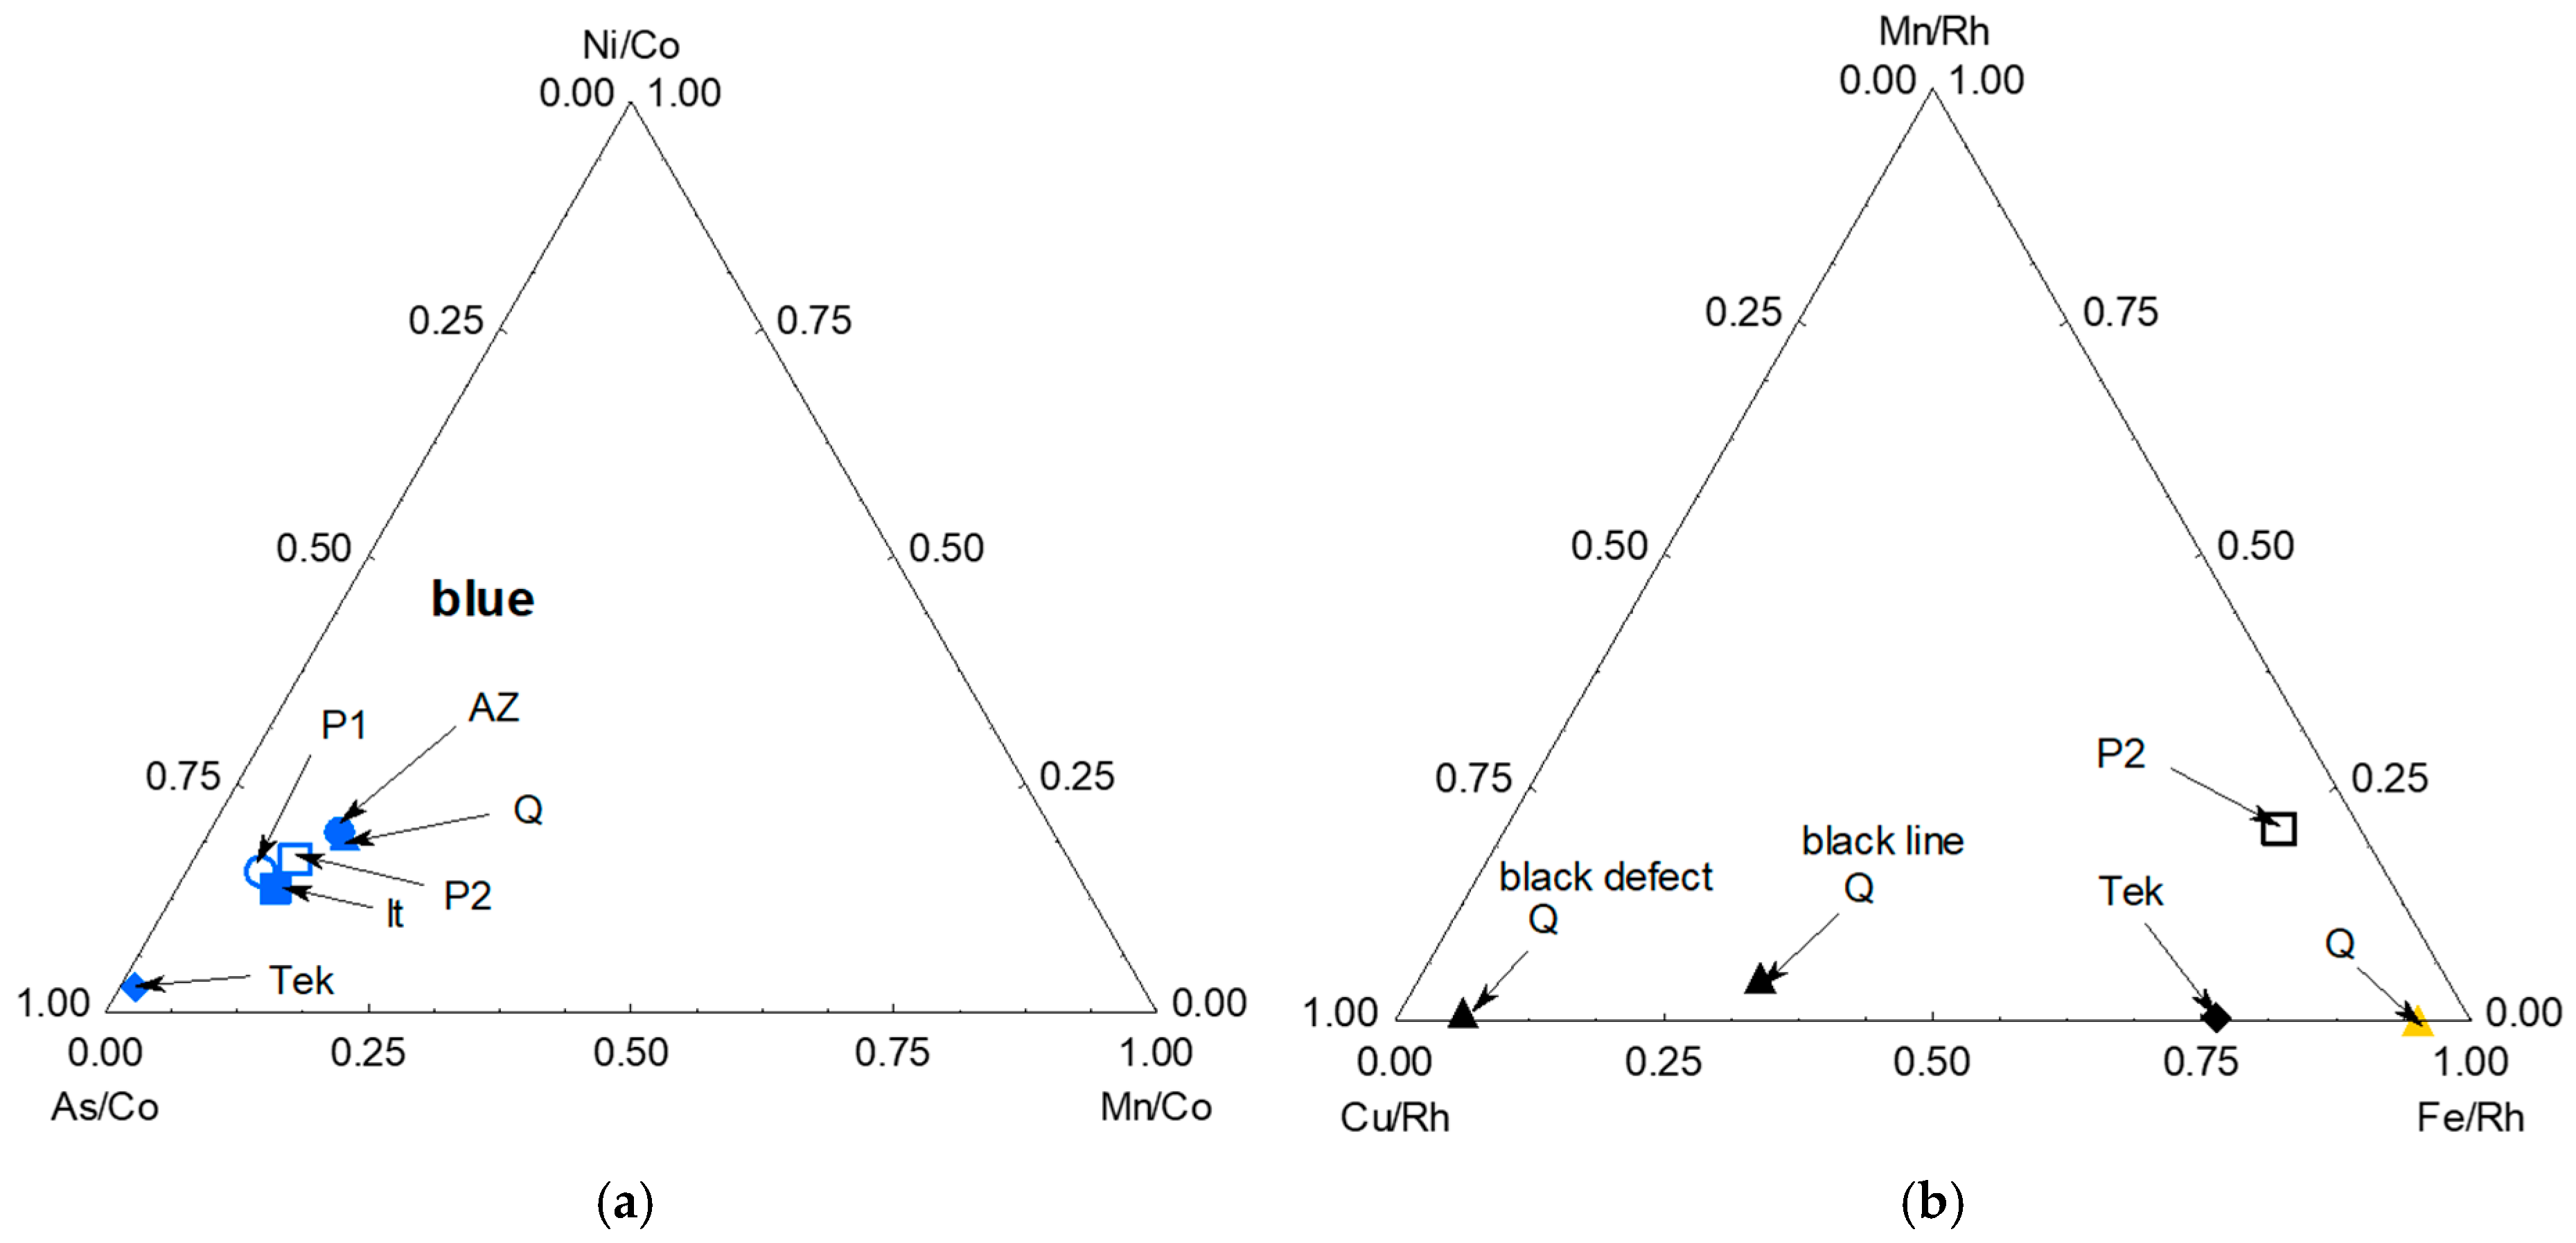
Comparison of the peak areas of the elements associated with cobalt [45,46,49,52] clearly shows that the cobalt of the Tekfur tile, ‘rich’ in arsenic, is different from that used by Tunisian potters, cobalt containing more manganese. The latter is more comparable to that used for Italian tiles, except for the higher purity of the latter. The differences between Tunisian tiles are small, but two groups can be identified: Az and Q for one part and the others. The Mn-Cu-Fe diagram of Figure 7 clearly visualizes the differences deduced from the observation of the spectra, black based on copper oxide or iron and manganese oxides.

3.2. Raman Signatures of Glazes

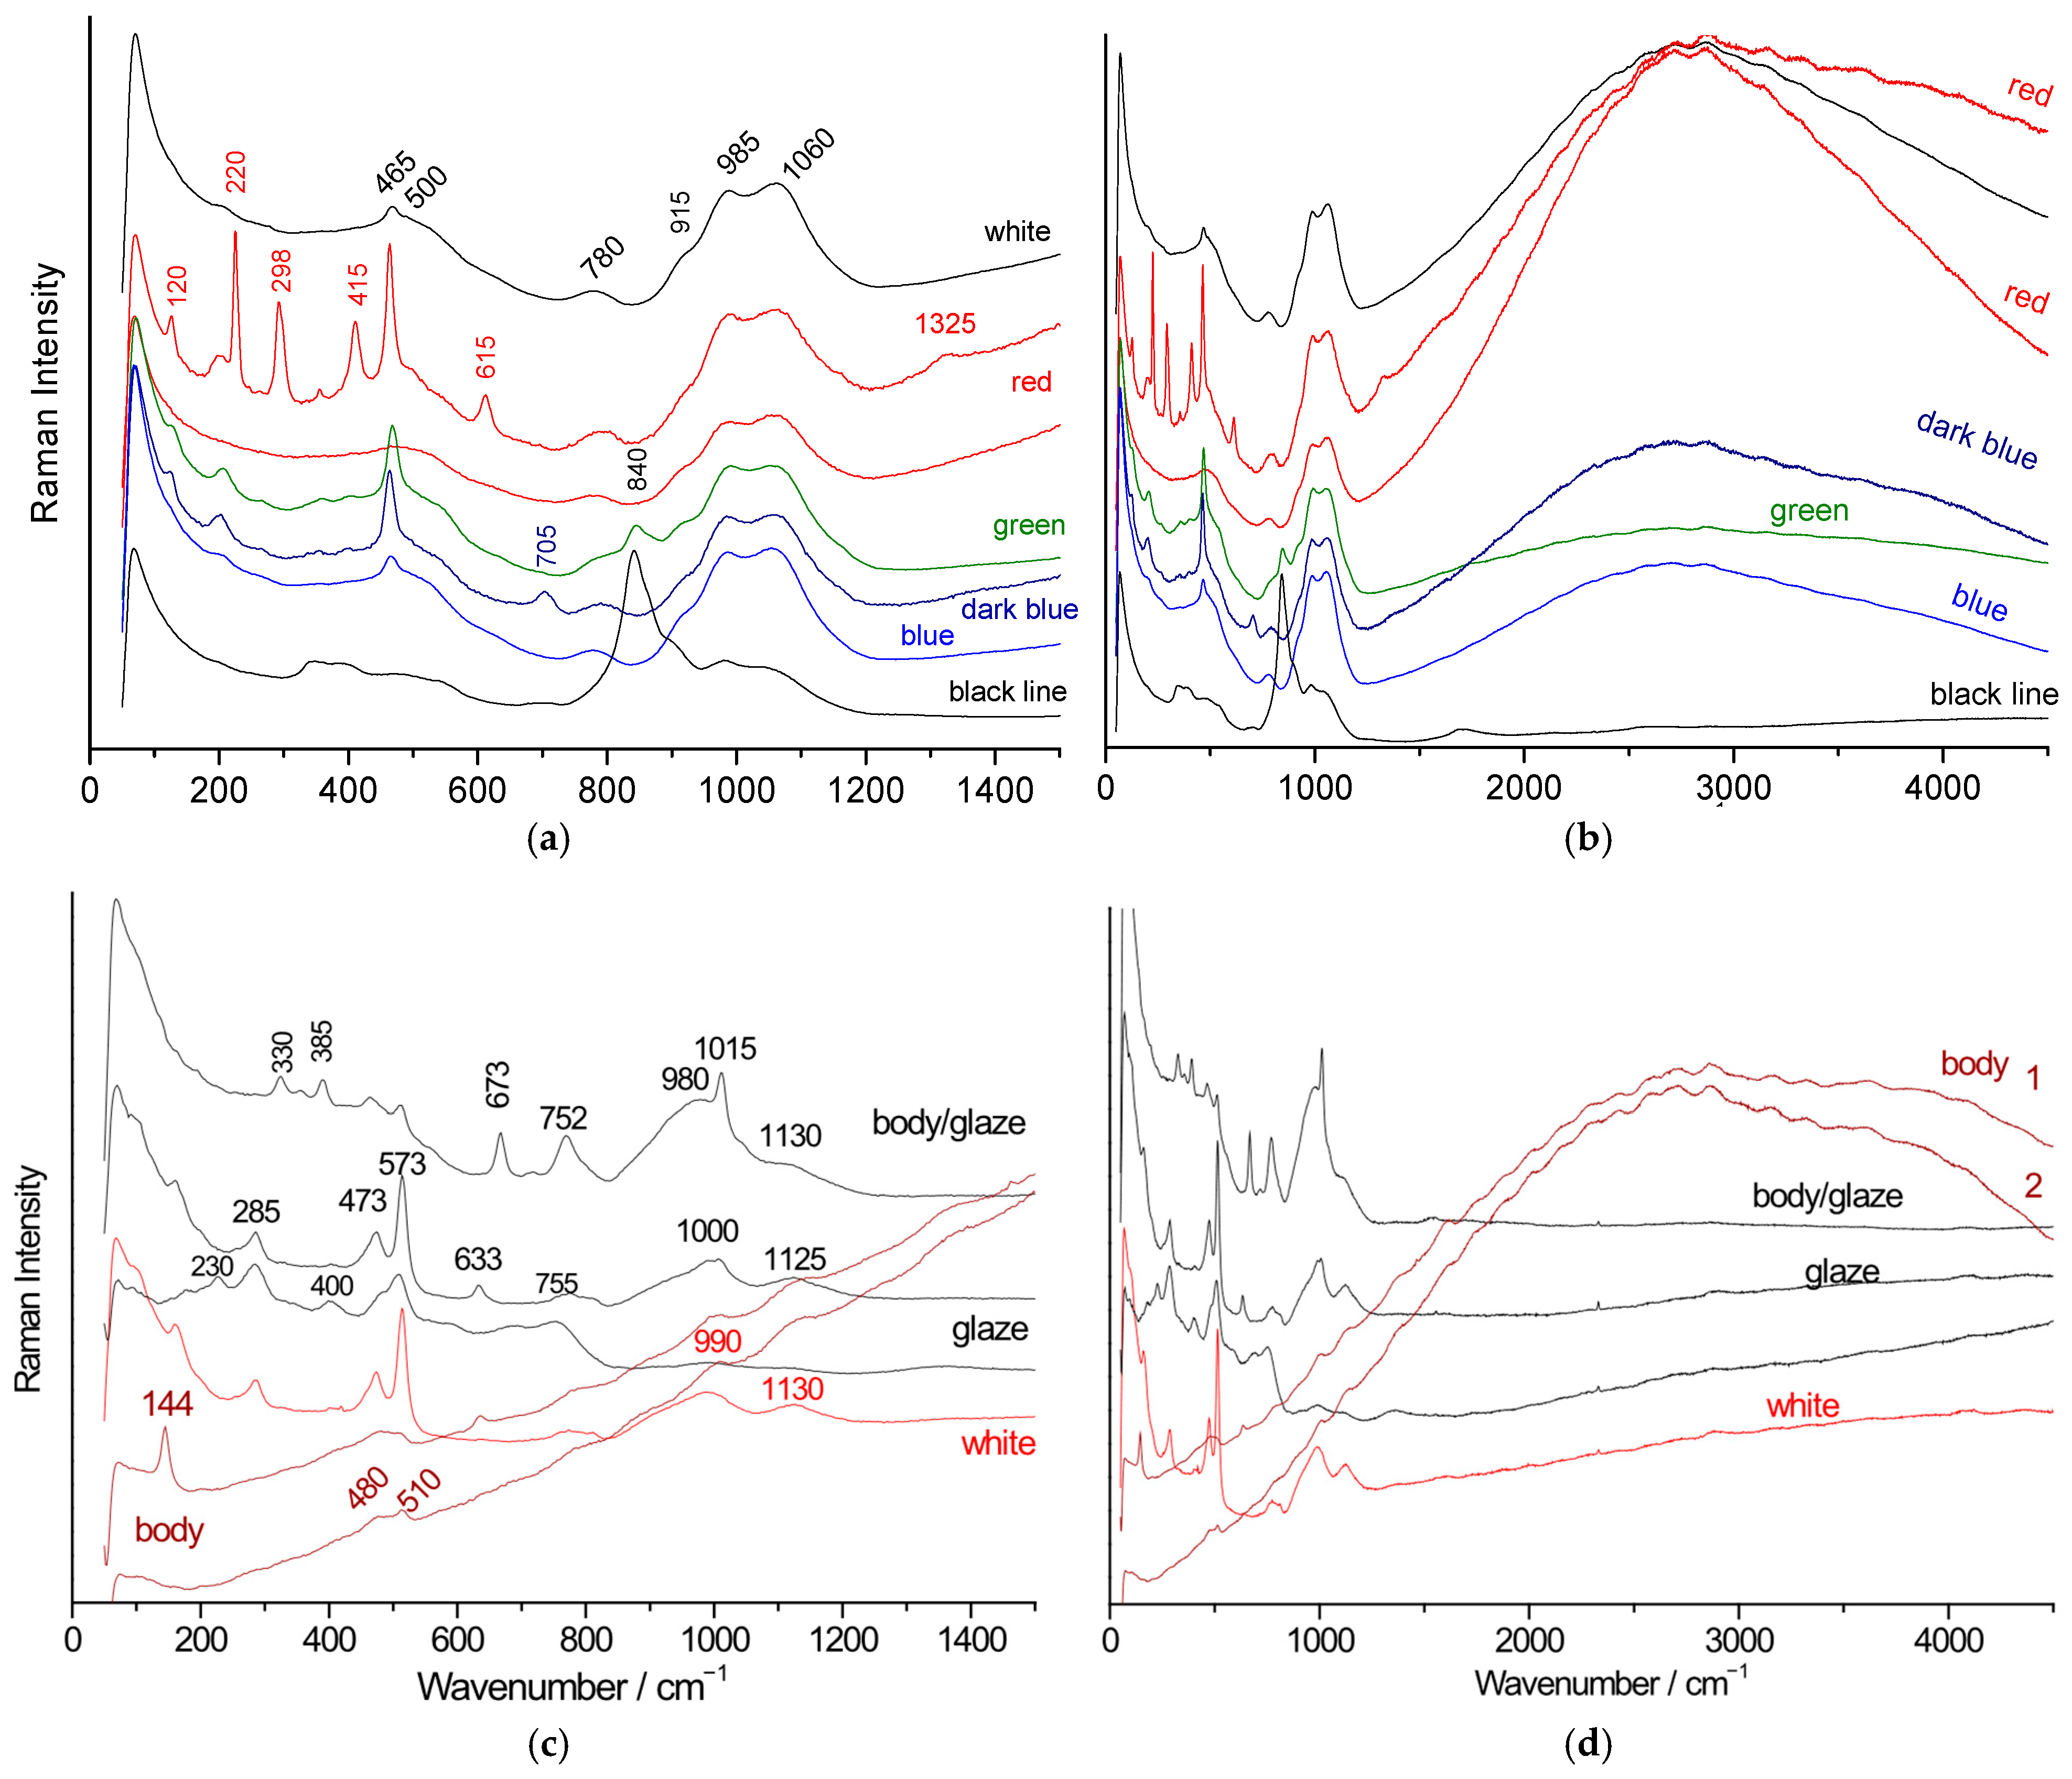
We begin by considering the Raman spectra of the Iz2Tr sherd (Figure 8a,b), which display the characteristic Iznik glaze signature: a doublet at ~985 and 1060 cm−1 with a shoulder near 915 cm−1 [20,21,52]. These bands correspond to different stretching modes of SiO4 tetrahedra in the silicate glass network [53]. The black line shows a strong band at 840 cm−1, attributed to chromates [26,27]. The Raman spectrum of the black line is dominated by the signature of chromate ions due to the very high intensity of the stretching modes of this ion. Red areas reveal hematite (220, 298, 415, 615, 1325 cm−1) and quartz (200, 465 cm−1) [54,55], confirming the use of an intimate mixture of quartz and iron oxides/hydroxides, usually called “Armenian bole”—a sandstone or wacke containing goethite between quartz grains—similar to “grès de Thiviers” used in France for the production of, e.g., Nevers faience decoration [56,57].
The white glaze shows a typical glass signature along with a quartz-based underlayer. Fluorescence appears peaking at ~2900 cm−1 under blue laser excitation.
By contrast, the Raman spectrum (Figure 8c,d) of the Italian sherd (It) is markedly different. Its glaze features a main SiO4 stretching component between 980 and 1000 cm−1, consistent with lead-based glass, and a second component at ~1125 cm−1 according to the content of alkalis. A doublet at 675–1015 cm−1 matches low-calcium pyroxene (enstatite) [55,58], in line with high calcium levels found in both body and glaze (Table 2 and Table 3). Anatase form of TiO2 (main peak at 144 cm−1) is also detected [59]. The body shows stoneware characteristics, including a broad SiO4 bending band around 480 cm−1 associated with a quasi-mullitic glassy phase [60,61], and a feldspar peak at 508 cm−1. Peaks at 285, 473, 573, and 633 cm−1 match substituted tin oxide [62], a 20th-century blue coloring pigment. The absence of fluorescence supports modern production, i.e., 20th century. The body can be qualified as stoneware, not terracotta.
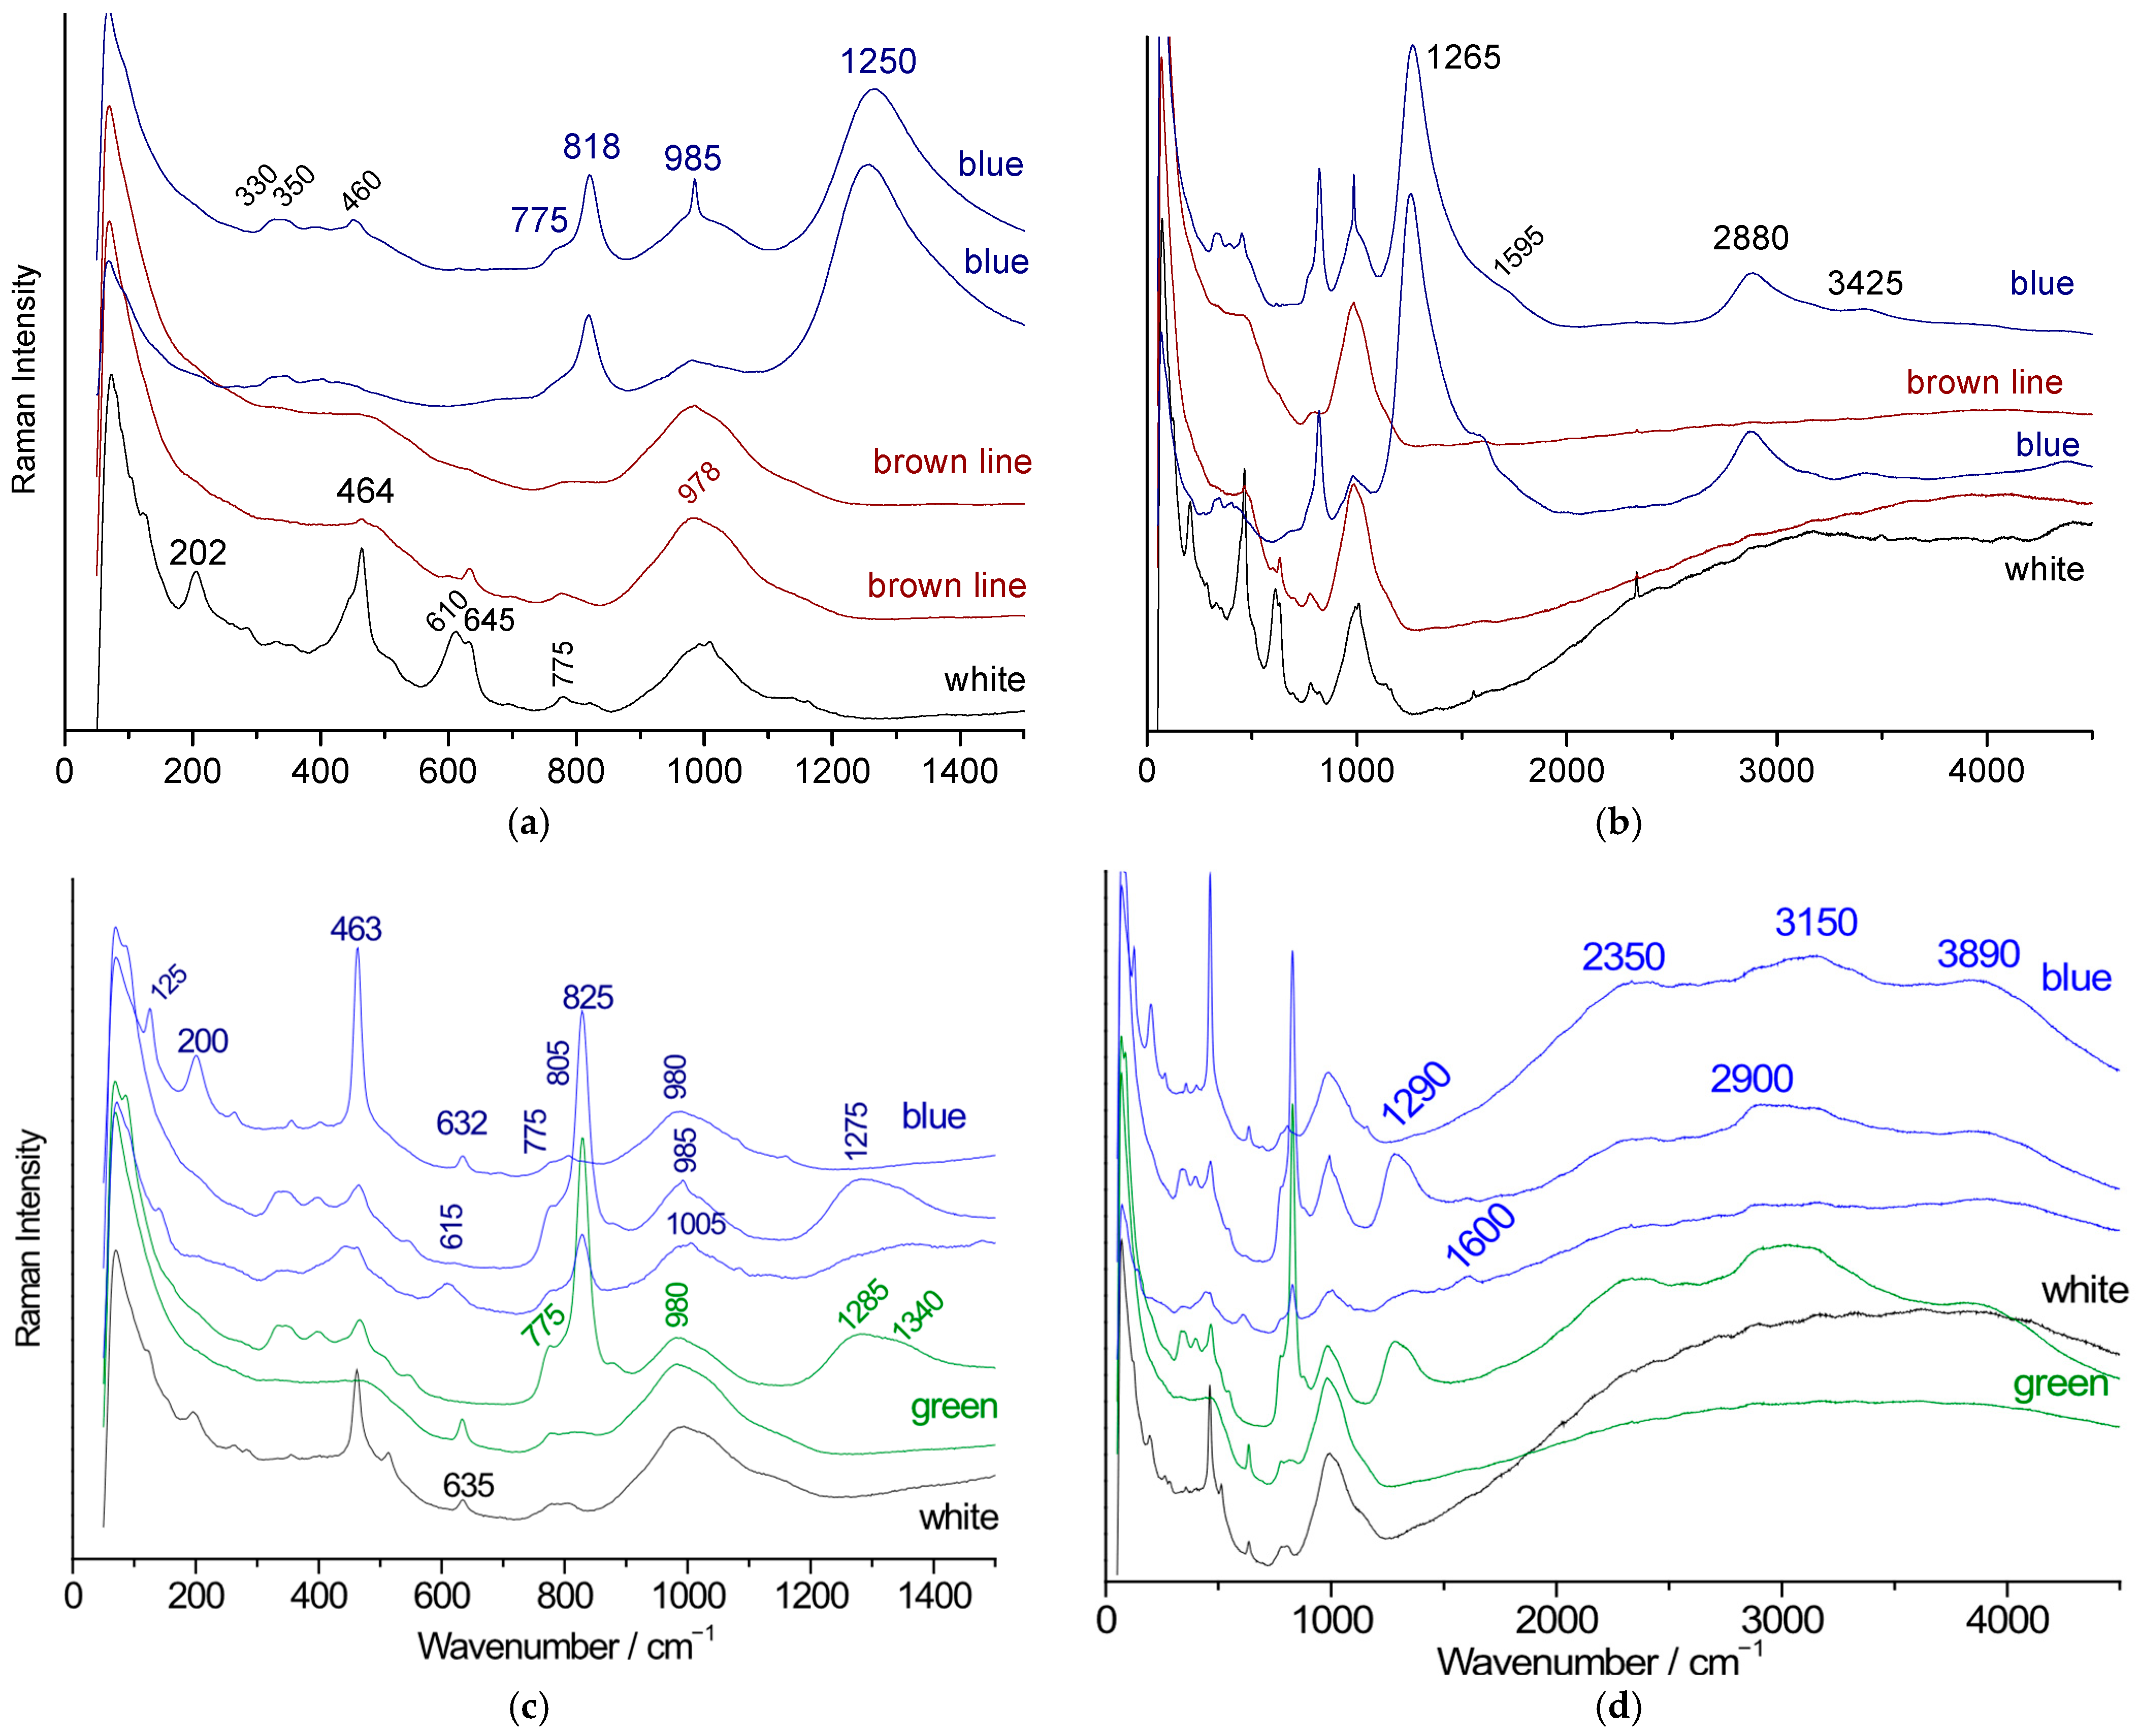
Figure 9 shows the spectra of the colored and white areas of the glaze on tiles P2 and P3. We observe an intense band around 1250 cm−1 in the blue zones, along with a secondary band near 2900 cm−1, in addition to a band at 818 cm−1 and a shoulder at 775 cm−1, which are characteristic of lead arsenate [63,64,65]. As expected for a lead-based glaze, the center of gravity of the SiO4 stretching mode is located around 980 cm−1 [53]. The band at ~1250 cm−1 has been observed in various overglazes based on lead with the addition of borax [66], suggesting that the blue color was produced using this combination of fluxes.
The white areas exhibit a spectrum showing the cassiterite doublet (630–775 cm−1) [25,26]; this opacifier, which forms the basis of the opacification of Islamic pottery and later of majolica and faience [48], is also detected in the green and blue zones. The fluorescence background is similar across all colors, indicating the use of the same primary raw materials in glaze preparation.
The Raman spectra of the sherd glaze attributed to the Qallaline kilns (Figure 10) share several common features:
(i) Firstly, the main component of SiO4 stretching band peaks at ~995 cm−1;
(ii) Secondly, the signature of lead–calcium/potassium/sodium arsenates, indicated by a strong As-O stretching mode at 820 to 830 cm−1 [63,64,65], accompanied by a broad band at 1265 to 1280 cm−1 attributed to borates [66,67,68,69,70] in the blue areas;
(iii) Thirdly, a weak doublet at 633–775 cm−1 characteristic of the cassiterite opacifier;
(iv) The signature of quartz.
Some specific features are also observed: a 625–995 cm−1 doublet characteristic of wollastonite (CaSiO3) [71,72,73], consistent with the high calcium content measured; the signature of calcite with its very narrow peak at 1085 cm−1 [74]; and a 292–342 cm−1 doublet probably corresponding to the Cu3SnS3 phase [75], found in some black lines.
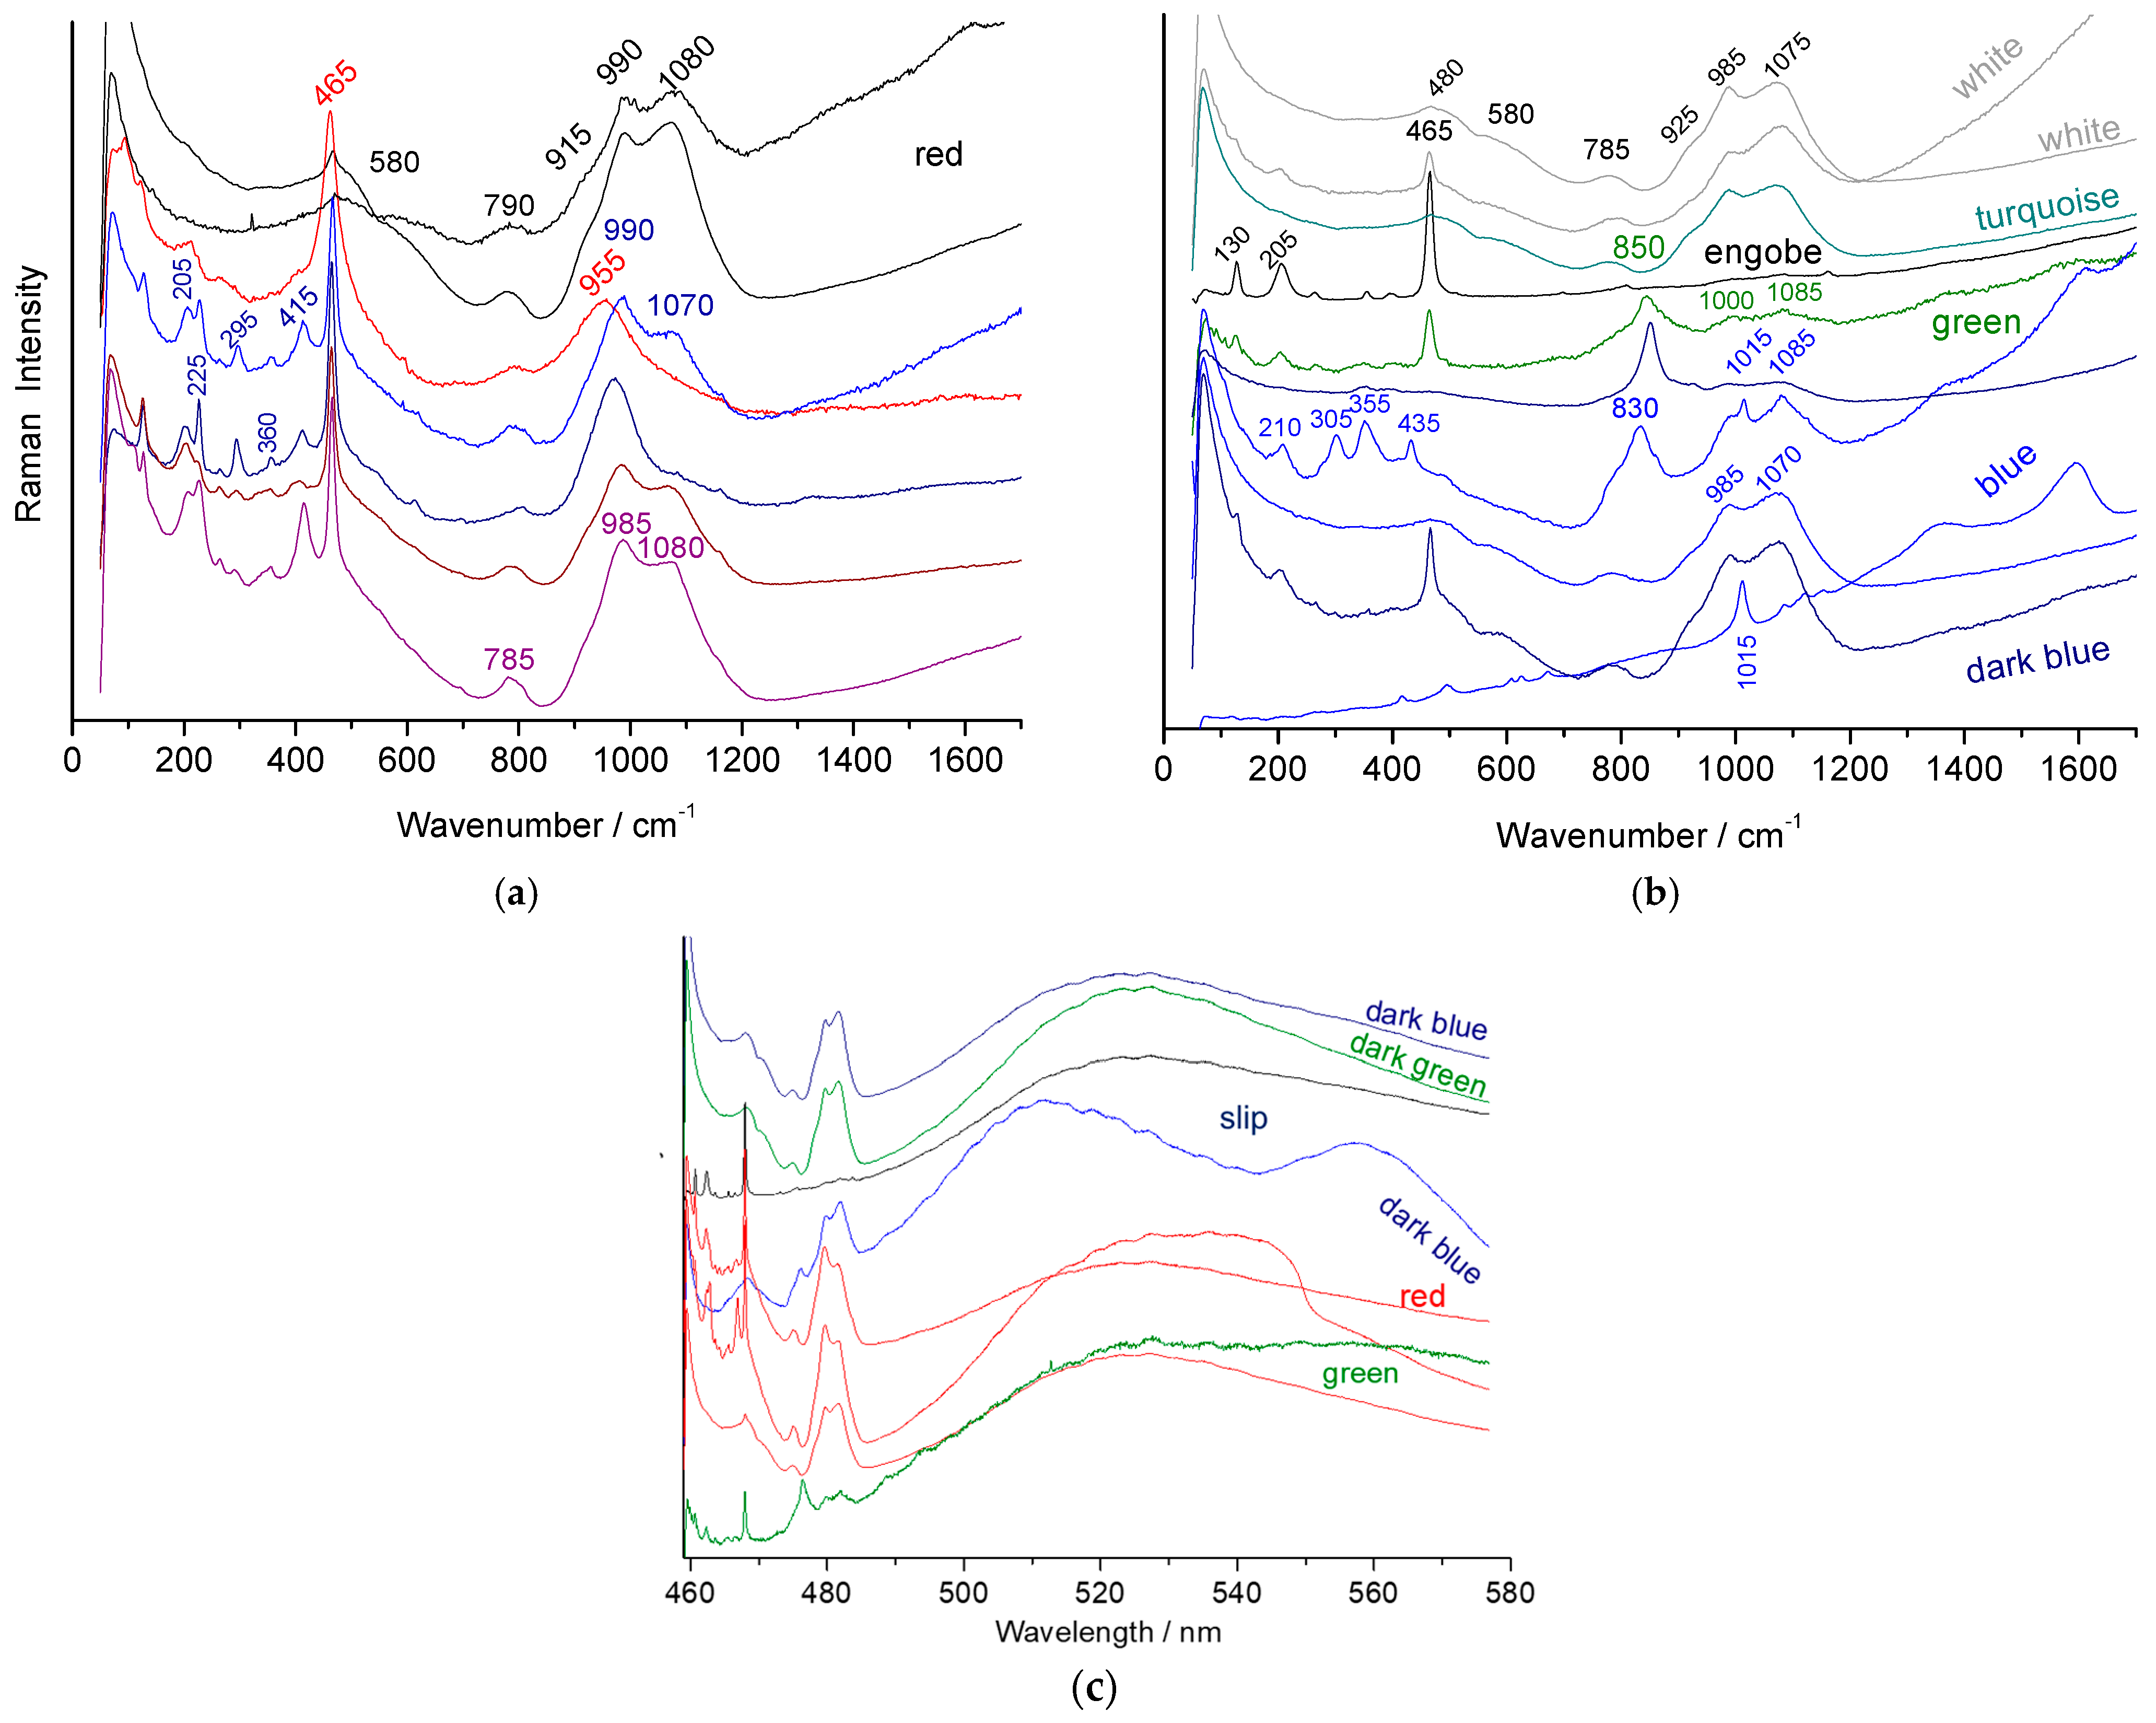
The Raman spectrum of the Tekfur tile from the Dyers’ Mosque (Figure 11) reveals an intermediate glaze profile, marked by a doublet at ~990 and 1080 cm−1, with a dominant low-energy component. This result is consistent with the higher Pb/(Na + K + Ca) ratio measured for this sample (Table 3).

4. Discussion on Raw Material Provenance

Table 4 summarizes the principal characteristics differentiating the studied tiles. However, the limited number of analyzed sherds and the lack of comparative data on local clay sources prevent a more detailed classification of the ceramic pastes. On the other hand, it is possible to discuss the types of cobalt used and their geological origins. Cobalt was typically obtained as a by-product of silver or bismuth mining [49], and the associated elemental signatures vary significantly depending on the mining site—sometimes with elements present in concentrations comparable to cobalt itself.
Despite these limitations, three important findings emerge:
(1)
The presence of tin in the body of some tiles attributed to the Qallaline kilns;
(2)
The presence of lead in the bodies of both Qallaline and Tekfur tiles;
(3)
The presence of tin in some Tekfur glazes.
The latter finding is consistent with recent results reported in the literature [76].
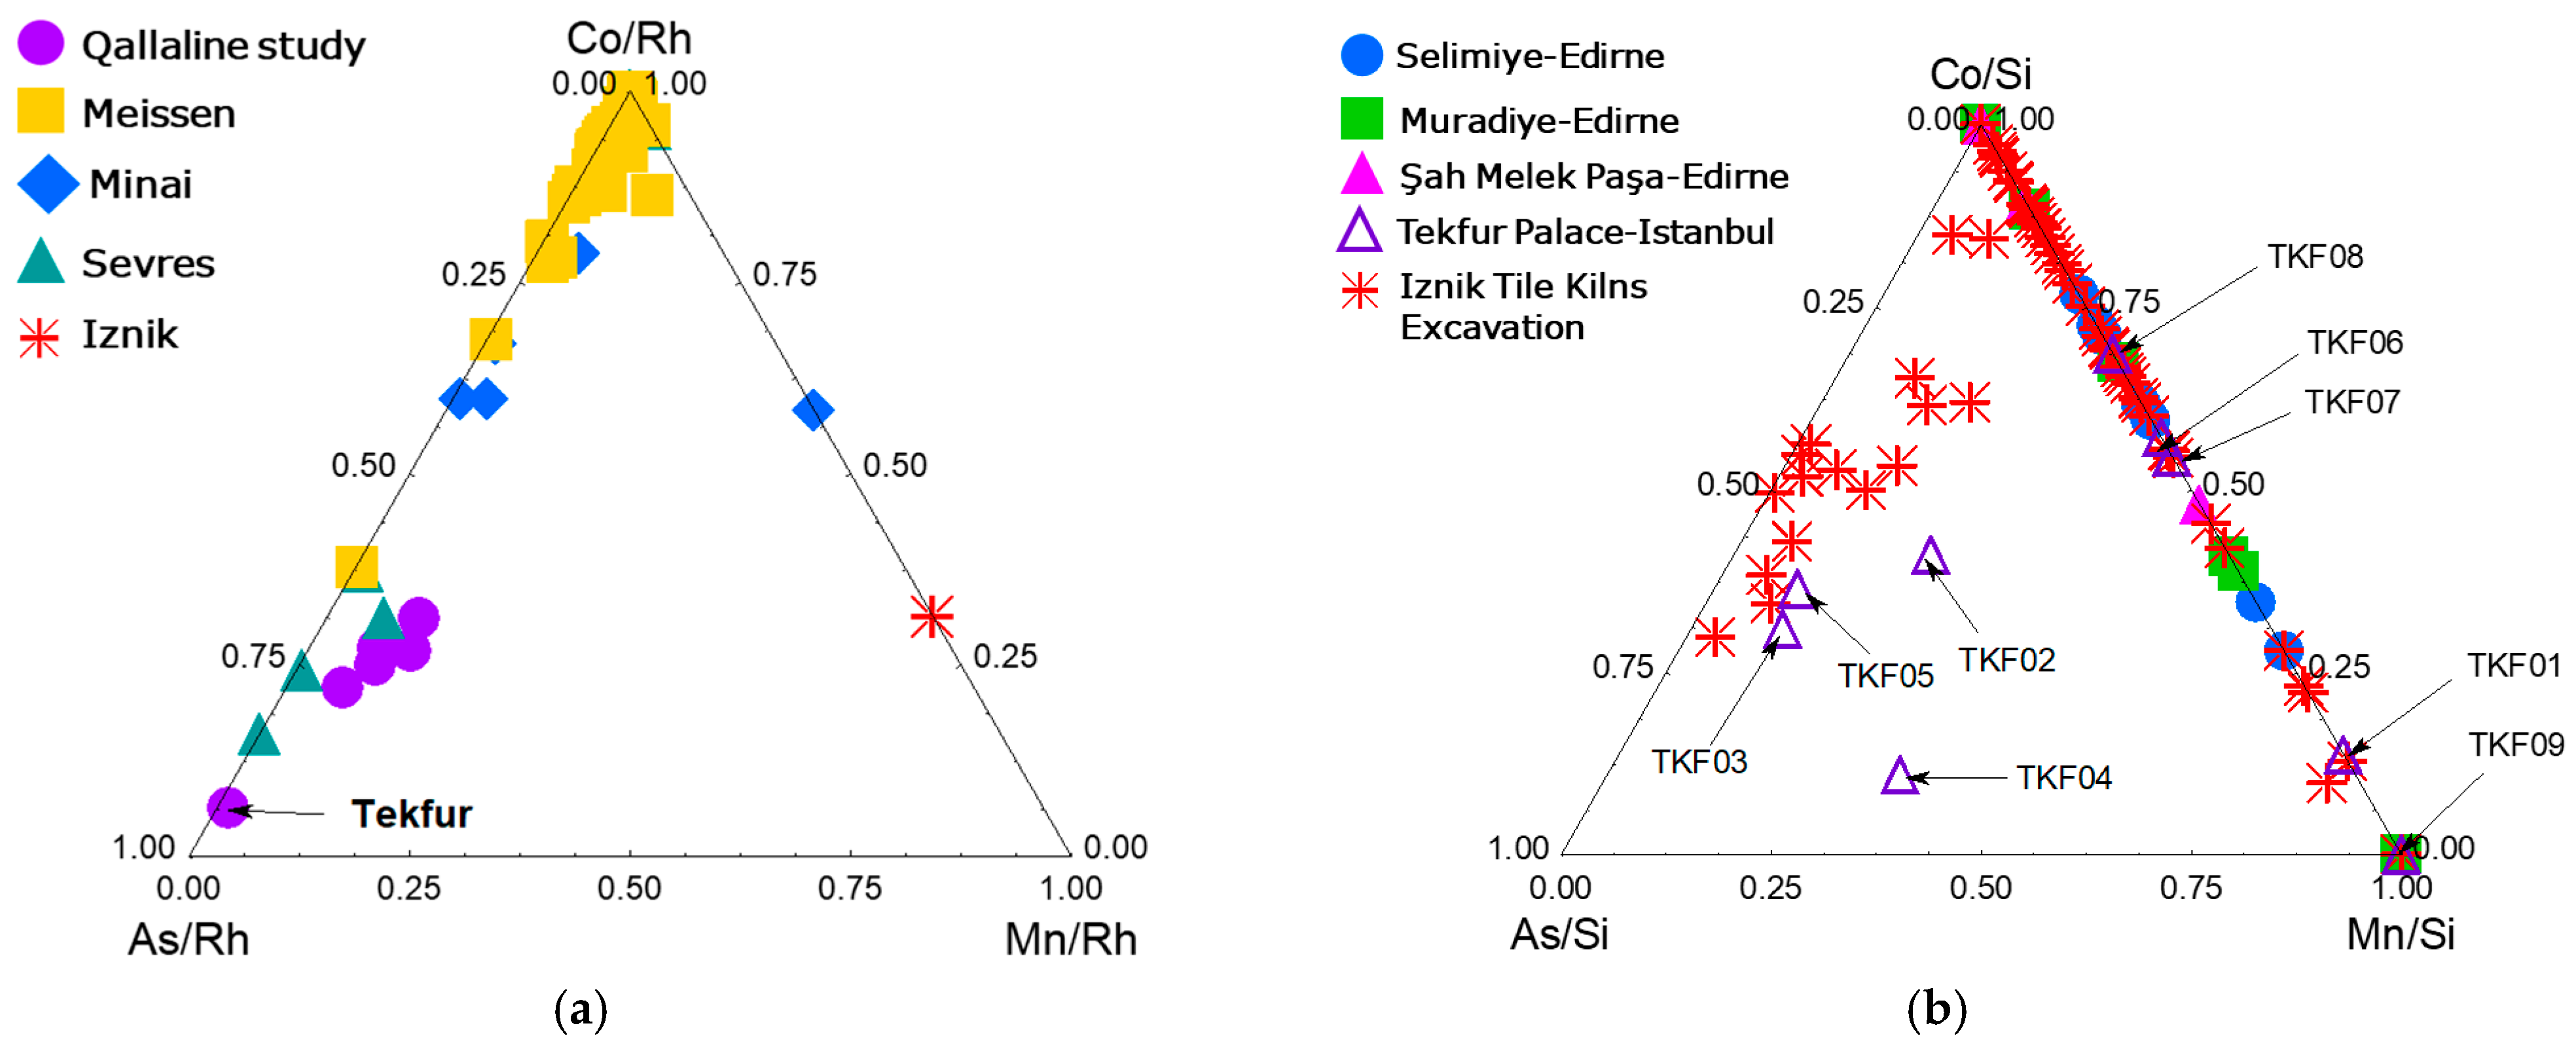
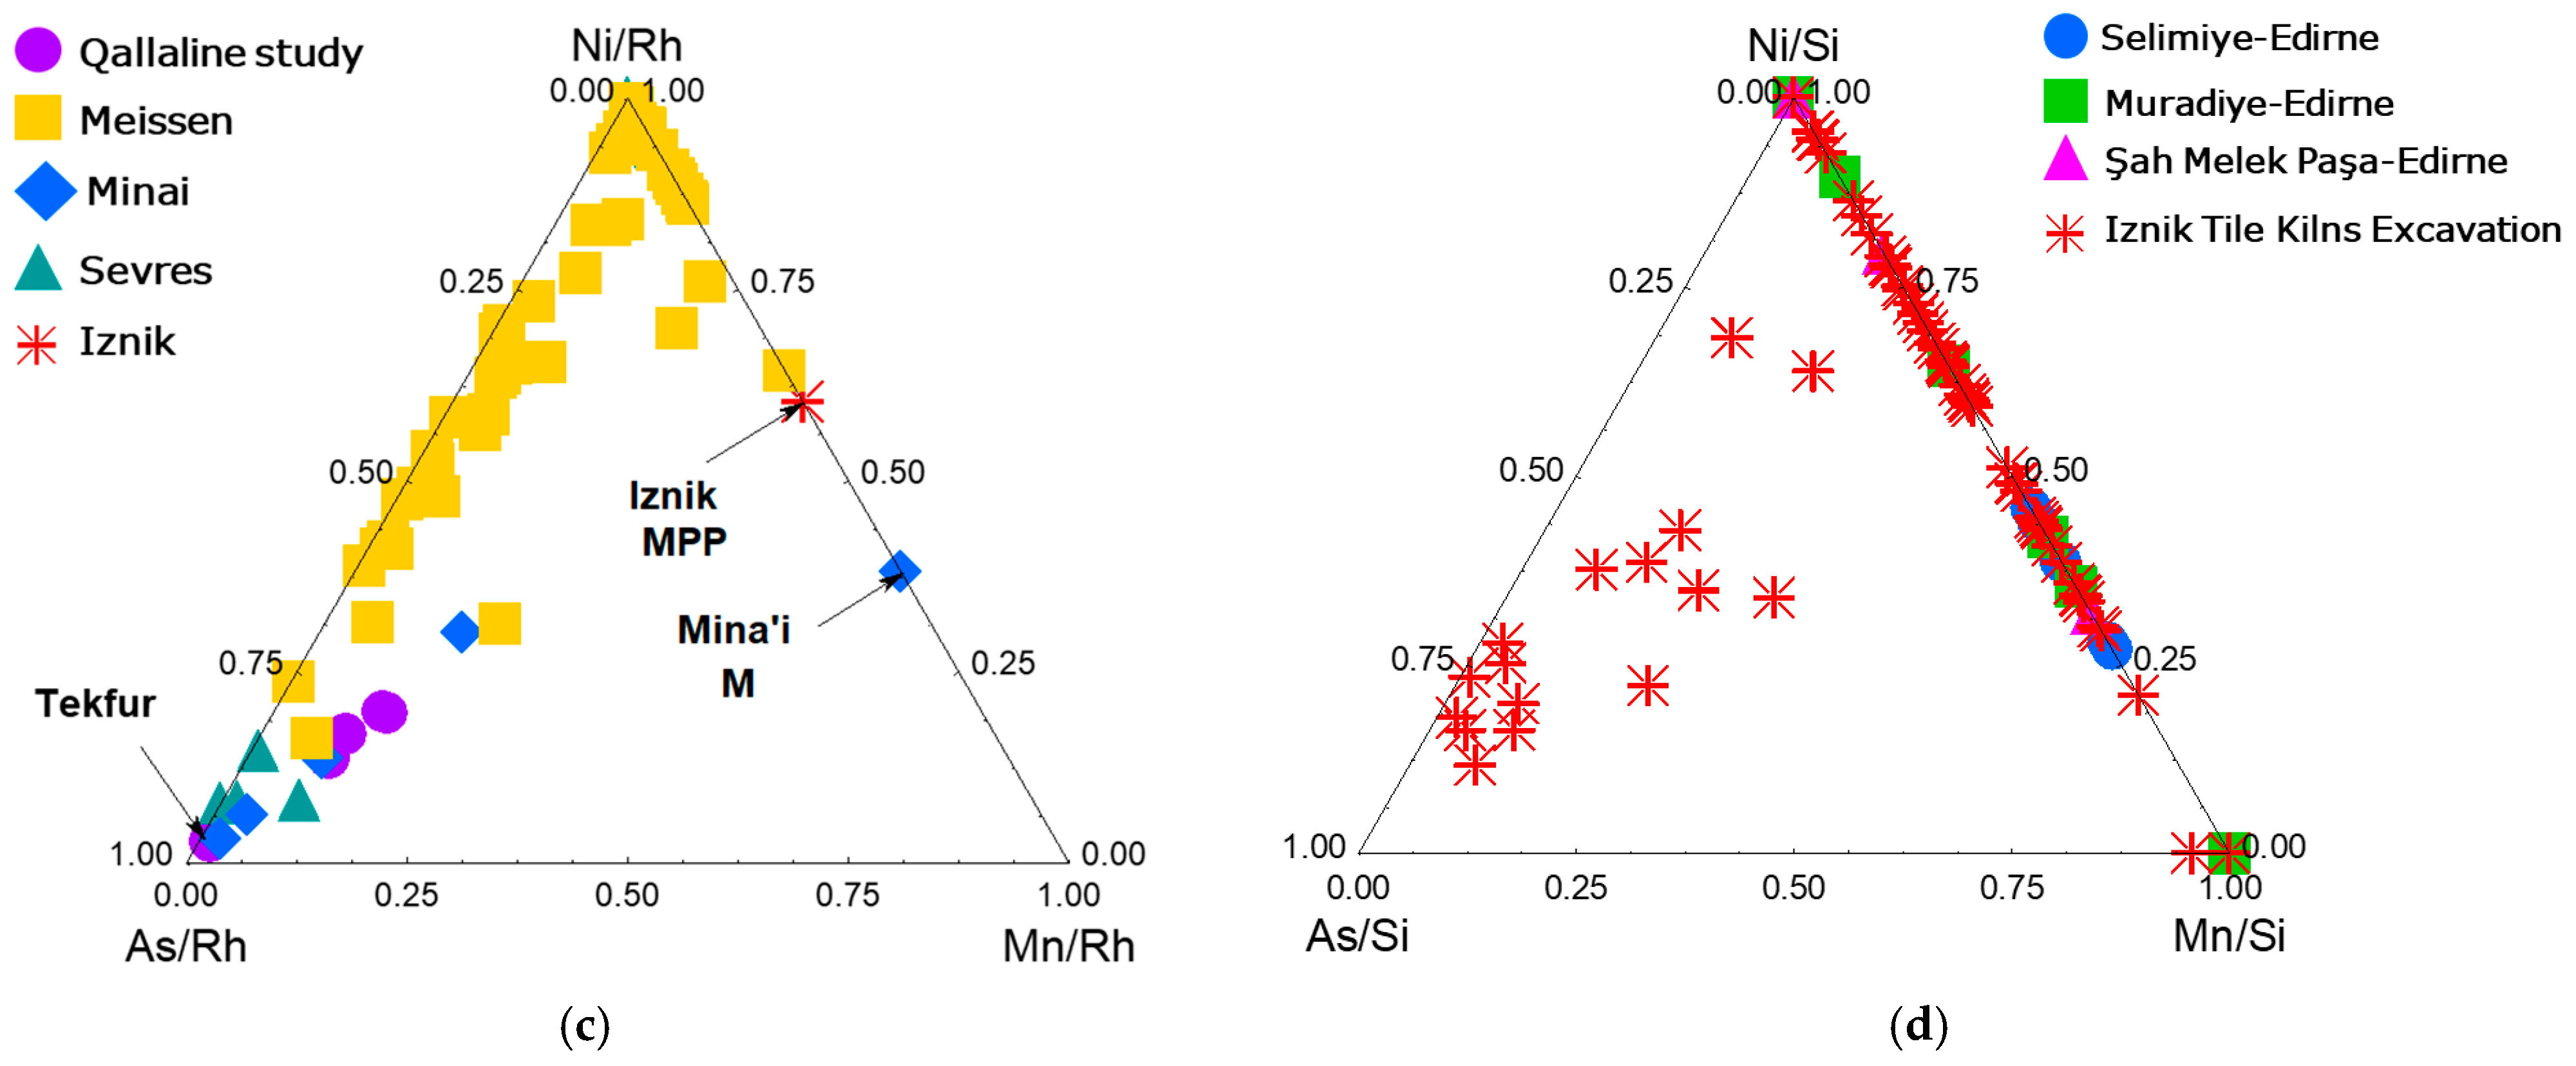
Figure 12 compares the results obtained in this study regarding elements associated with cobalt to those from other 18th century glazes (porcelain from Meissen, Saxony [61,77]; porcelain from Sèvres, France [78]; and fritware from Tekfur, Istanbul [39,76]), as well as to blue enamels from earlier periods (mīnā’ī, 12th–13th centuries, Persia [79]; Iznik ceramics, 15th–16th centuries [16]).
At least two distinct cobalt grades have been identified. The tile believed to originate from the dribad of the Bir Lahjar madrasa (ca. 1735–1756) contains cobalt derived from a more impure ore, characterized by the presence of significant amounts of Mn, Ni, and As. In contrast, the cobalt used in tiles from the Sidi Ali Azzuz mausoleum—both the Zaghouan example (ca. 1710) and the Tunis sample (ca. 1756)—is slightly purer, containing Co, Ni, As, Cu, and Zn in lower contents.
Zinc is consistently detected in blue enamels as well as other colored areas, confirmed through both pXRF and SEM-EDS analyses. However, Raman spectroscopy did not reveal the presence of (Co,Zn)2SiO4, a known zinc-bearing blue pigment. The blue color is thus obtained by the dissolution of Co2+ ions in the glassy network. This zinc may originate from the lead source, as these elements are often geologically associated. Recycling lead waste is also possible.
Instead, an unusual spectral profile is observed in blue areas, characterized by bands around ~1285 cm−1 and ~2880 cm−1. These features may indicate the use of borax, suggesting the formation of a borosilicate phase within the glaze matrix.
A comparison with the peak area ratios shown in Figure 12 indicates that the cobalt used at Qallaline differs from that used contemporaneously in Meissen (Saxony), as well as from that used in the decoration of Iznik tiles produced one or two centuries earlier, which themselves are comparable to the cobalt used in Persian mīnā’ī ware. The As, Ni, and Mn contents in the Qallaline samples are closer to those of the cobalt used at the Royal Manufacture of Sèvres, which is believed to have originated from the Giftain Valley in Catalonia. This is consistent with the ancient links with Spain. In fact, the presence of associated elements depends not only on the geological context but also on the separation and purification treatments applied [49,80].

5. Conclusions

Both pXRF analyses conducted on cut body sections and localized SEM-EDS measurements indicate the presence of small amounts of lead. This addition promotes the formation of a liquid phase at relatively low temperatures, thereby enhancing the vitrification process. Although minor differences are observed among samples visually attributed to Qallaline kilns, these variations are slight, and all sherds may have originated from Tunis. The compositions of Iznik, Tekfur, and Qallaline pastes, however, differ notably. Potters at Qallaline used three types of pastes containing varying amounts of calcium, sometimes combined with the same tile or used separately, occasionally with tin associated with lead. The pastes exhibit strong heterogeneity, in contrast to the relatively uniform production of Iznik ceramics, which was closely controlled by the Ottoman administration (nakkaşhane). This variability in Qallaline production suggests that multiple workshops likely contributed to manufacturing the tiles found in the buildings from which they were recovered.

Supplementary Materials

The following supporting information can be downloaded at https://www.mdpi.com/article/10.3390/min15080865/s1.

Author Contributions

Conceptualization, P.C. and N.A.; methodology, P.C. and G.S.-F.; investigation, P.C., A.-T.N., and X.G.; resources, P.C., W.M.-C., and N.A.; data curation, P.C. and G.S.-F.; writing—original draft preparation, P.C. and G.S.-F.; writing—review and editing, P.C., G.S.-F., X.G., A.-T.N., W.M.-C., and N.A. visualization, P.C. and G.S.-F. Author N.A. passed away prior to the publication of this manuscript. All authors have read and agreed to the published version of the manuscript.

Funding

Part of the study performed in Tekfur Palace, Istanbul, Türkiye, was supported by the Scientific and Technological Research Council of Turkey (TÜBİTAK) through the 1001-Scientific and Technological Research Projects Funding Program (Grant No: 123M874).

Data Availability Statement

All data included in the paper.

Acknowledgments

The authors gratefully acknowledge the Republic of Türkiye Ministry of Culture and Tourism, Vesile Belgin Demirsar Arlı, for granting permission to analyze the samples excavated from the Iznik Tile Kilns. Permission to analyze the reference tiles from the collection of the Turkish and Islamic Arts Museum, housed in the Tekfur Palace Museum, was kindly provided by the Istanbul Metropolitan Municipality, Department of Cultural Heritage, Library and Museums Branch; Ekrem Aytar, Director of the Turkish and Islamic Arts Museum; Sevda Atlisoy, museum staff member; and Necati Aksüt, Director of the Tekfur Palace Museum.

Conflicts of Interest

The authors declare no conflicts of interest.

References

  1. Zubizarreta Villanueva, O. The Moriscos in Tunisia. (ch. 14). In The Expulsion of the Moriscos from Spain—A Mediterranean Diaspora; Garcia-Arenal, M., Wiegers, G., Eds.; Lopez-Morillas, C.; Beagles, M., Translators; The Medieval and Early Modern Iberian World; Brill: Leiden, The Netherlands, 2014; Volume 56, pp. 357–388. [Google Scholar] [CrossRef]
  2. Binous, J.; Baklouti, N.; Tanfous, A.B.; Bouteraa, K.; Rammah, M.; Zouari, A. Ifriqiya: Thirteen Centuries of Art and Architecture in Tunisia; Museum With No Frontiers, MWNF (Museum Ohne Grenzen): Vienna, Austria, 2013. [Google Scholar]
  3. Kura, N. Tunisian Tiles: Ottoman Inspiration from the 16th to the 19th Centuries. Ph.D. Thesis, Bilkent Universitesi, Ankara, Turkey, 1995. [Google Scholar]
  4. Louhichi, A. De Raqqada à Qallaline; Neapolis Céram: Nabeul, Tunisia, 2000. [Google Scholar]
  5. Ben Amara, A.; Schvoerer, M.; Haddad, M.; Akerraz, A. Recherche d’indices sur les techniques de fabrication de Zelliges du XIVe siècle (Chellah, Maroc). Rev. Archéom. 2003, 27, 103–113. Available online: https://www.persee.fr/doc/arsci_0399-1237_2003_num_27_1_1046 (accessed on 10 July 2025). [CrossRef]
  6. El Amraoui, M.; Azzou, A.; Haddad, M.; Bejjit, L.; Ait Lyazidi, S.; El Amraoui, Y. Zelliges from Dar-El Beïda Palace in Meknes (Morocco): Optical Absorption and Raman Spectrometry. Spectrosc. Lett. 2007, 40, 777–783. [Google Scholar] [CrossRef]
  7. Ibtissem, H.; Khaldi, M. L’art du Zellige Dans L’architecture Musulmane. «Cas des Mosquées Zianides de Tlemcen». El Hiwar El Thakafi (Cult. Dialogue J.) 2018, 7, 17–26. Available online: https://asjp.cerist.dz/en/article/57558 (accessed on 13 August 2025).
  8. Zucchiatti, A.; Azzou, A.; El Amraoui, M.; Haddad, M.; Bejjit, L.; Ait Lyazidi, S. PIXE analysis of Moroccan architectural glazed ceramics of 14th–18th centuries. Int. J. PIXE 2009, 19, 175–187. [Google Scholar] [CrossRef]
  9. El Halim, M.; Daoudi, L.; El Alaoui El Fels, A.; Rebbouh, L.; El Ouahabi, M.; Fagel, N. Non-destructive portable X-ray Fluorescence (pXRF) method for the characterization of Islamic architectural ceramic: Example of Saadian tombs and El Badi palace ceramics (Marrakech, Morocco). J. Archaeol. Sci. Rep. 2020, 32, 102422. [Google Scholar] [CrossRef]
  10. Pereira, M.; de Lacerda-Aroso, T.; Gomes, M.J.M.; Mata, A.; Alves, L.C.; Colomban, P. Ancient Portuguese ceramic wall tiles (“Azulejos”): Characterization of the glaze and ceramic pigments. J. Nano Res. 2009, 8, 79–88. [Google Scholar] [CrossRef]
  11. Coentro, S.; Muralha, V.; Lima, A.; Pais, A.; Silva, A.; Mimoso, J. The colors and techniques of 17th century Portuguese Azulejos: A multi-analytical study. Microsc. Microanal. 2011, 17, 1782–1783. [Google Scholar] [CrossRef]
  12. Ferreira, L.V.; Casimiro, T.M.; Colomban, P. Portuguese tin-glazed earthenware from the 17th century. Part 1: Pigments and glazes characterization. Spectrochim. Acta Part A Mol. Biomol. Spectrosc. 2013, 104, 437–444. [Google Scholar] [CrossRef] [PubMed]
  13. Pereira, S.R.; Conte, G.; Esteves, L.; Pais, A.N.; Mimoso, J.M. Evolution of azulejo glaze technology in Portugal from the 16th to the onset of the 19th century. J. Eur. Ceram. Soc. 2023, 43, 3804–3815. [Google Scholar] [CrossRef]
  14. Ferreira, L.V.; Machado, I.F.; Pereira, M.F.C.; Mangucci, C. Archaeometry of tiles (azulejos) produced in the region of Lisbon–16th to 18th centuries. A comparison of Lisbon and Seville pastes for the cuerda seca and arista tiles. J. Archaeol. Sci. Rep. 2023, 49, 104041. [Google Scholar] [CrossRef]
  15. Coentro, S.; Alves, L.C.; Conesa, J.C.; Ferreira, T.; Mirão, J.; da Silva, R.C.; Trindade, R.; Muralha, V.S.F. White on blue: A study on underglaze-decorated ceramic tiles from 15th-16th-century Valencian and Sevillian productions. J. Archaeol. Sci. Rep. 2020, 30, 102254. [Google Scholar] [CrossRef]
  16. Simsek, G.; Unsalan, O.; Bayraktar, K.; Colomban, P. On-site pXRF analysis of glaze composition and colouring agents of “Iznik” tiles at Edirne Mosque (15th and 16th-centuries). Ceram. Int. 2019, 45, 595–605. [Google Scholar] [CrossRef]
  17. Allen, W.J. Tekfur Saray in Istanbul: An Architectural Study; The Johns Hopkins University: Baltimore, MD, USA, 1981. [Google Scholar]
  18. Simsek, G.; Demirsar Arli, B.; Kaya, S.; Colomban, P. On-site pXRF analysis of body, glaze and colouring agents of the tiles at excavation site of Iznik kilns. J. Eur. Ceram. Soc. 2019, 39, 2199–2209. [Google Scholar] [CrossRef]
  19. Necipoglu, G. From International Timurid to Ottoman: A Change of Taste in Sixteenth-Century Ceramic Tiles. Muqarnas 1990, 7, 136–170. [Google Scholar] [CrossRef]
  20. Sarıgüzel, M.; Yılmaz, Ş.; Günay, E. An Investigation of Nanoparticles in Contemporary Lustres on Modern Iznik Tiles. J. Austral. Ceram. Soc. 2015, 51, 34–39. [Google Scholar]
  21. Henderson, J.; Raby, J. The technology of fifteenth century Turkish tiles: An interim statement on the origins of the Iznik industry. World Archaeol. 1989, 21, 115–132. [Google Scholar] [CrossRef]
  22. Demirsar Arlı, B. Evaluation of Iznik Tiles Examples from Iznik Tile Excavation. J. Hist. Cult. Art Res. 2018, 7, 578–594. [Google Scholar] [CrossRef]
  23. İmer, C.; Günay, E.; Öveçoğlu, M.L. An investigation of thin lustre layers developed by ion-exchange mechanism on the surface of Iznik tiles. Ceram. Int. 2015, 41, 11489–11497. [Google Scholar] [CrossRef]
  24. Gokce, E. Iznik Ceramics: History and Present-Day. Athens J. Humanit. Arts 2018, 5, 225–242. [Google Scholar] [CrossRef]
  25. Colomban, P.; Sagon, G.; Louhichi, A.; Binous, H.; Ayed, N. Identification par microscopie Raman des tessons et pigments de glaçures de céramiques de l’Ifriqiya (Dougga, XI-XVIIIe siècles). Rev. Archéom. 2001, 25, 101–112. [Google Scholar] [CrossRef]
  26. Colomban, P.; Milande, V.; Le Bihan, L. On-site Raman analysis of Iznik pottery glazes and pigments. J. Raman Spectrosc. 2004, 35, 527–535. [Google Scholar] [CrossRef]
  27. Colomban, P.; de Laveaucoupet, R.; Milande, V. On Site Raman Analysis of Kütahya fritwares. J. Raman Spectrosc. 2005, 36, 857–863. [Google Scholar] [CrossRef]
  28. Ben Mami, B. Les Madrasa-s de la Médina de Tunis de l’époque hafside à l’époque Husaynite; XIIIe-XIXe siècles, مدارس مدينة تونس من العهد الحفصي الى العهد الحسيني; INP: Tunis, Tunisia, 2006; 396p. [Google Scholar]
  29. Alvarez-Dopico, C.-I. L’empreinte Mauresque et la Tradition Hispano-Arabe Dans la Céramique Architecturale Tunisoise des XVIe et XVIIe Siècles: L’exemple du Bardo, Mémoire de DEA: Hist. Art; Université Paris Sorbonne-Paris IV: Paris, France, 2002. [Google Scholar]
  30. Melliti-Chemi, W. La Céramique de Revêtement Mural Dans la Médina de Tunis, Qallaline et Céramique Importée: XVIe–XIXe Siècles. Ph.D. Thesis, Faculté des Sciences Humaines et Sociales, Université de Tunis, Tunis, Tunisia, 2009. [Google Scholar]
  31. Saadaoui, A. Naissance et essor de la faïence typiquement Tunisoise de Qallaline, les ateliers d’Abdewâhid al-Maghribî et de l’Usta Mascûd al-Sabac (Première moitié du XVIIIe). In Les Couleurs de la Ville, Faïences et Architecture à Tunis; Saadaoui, A., Ed.; Centre de Publication Universitaire, Laboratoire d’Archéologie et d’Architecture maghrébines: Tunis, Tunisia, 2021. [Google Scholar]
  32. Louhichi, A. Céramique Islamique de Tunisie, Ecole de Kairouan—Ecole de Tunis; Agence de Mise en Valeur du Patrimoine et de Promotion Culturelle: Tunis, Tunisia, 2010; p. 199. [Google Scholar]
  33. Ben Youssef, M.S. Mechrca el-Melki, Chronique Tunisienne 1705–1771; Serres, V.; Lasram, M., Translators; Impr. Rapide: Tunis, Tunisia, 1900; p. 15. [Google Scholar]
  34. Van Lemmen, H. 5000 Years of Tiles; Smithsonian Books: Washington, DC, USA, 2013. [Google Scholar]
  35. Geckinli, A.E.; Goektas, A.A.; Süer, A.; Yenisehirlioglu, F. Characterization studies of late Ottoman ceramics recovered from Istanbul Tekfur Palace excavation. Key Eng. Mater. 2002, 206–213, 909–912. [Google Scholar] [CrossRef]
  36. Yenişehirlioğlu, F. From Excavation to Exhibition: Tekfur Palace (Palace of Porphyrogenitus) Museum. J. Turk. Inst. Archaeol. Cult. Herit. 2023, 3, 103–134. [Google Scholar] [CrossRef]
  37. Dumlupınar, Z. The 17th Century Tile Revetments in Topkapi Palace Harem Section. J. Acad. Stud. 2015, 17, 1–12. [Google Scholar]
  38. Gündeş, S.; Oktuğ, M.; Özden, D. Tales of Tiles in Ottoman Empire. Colour Des. Creat. 2008, 9, 1–7. [Google Scholar]
  39. Demirsar Arli, B.; Şimsek Franci, G.; Kaya, Ş.; Arli, H. On-Site, Non-Destructive Studies at Iznik Tile Kilns Excavation, AIECM3, XIII Congreso Internacional Sobre Cerámica Medieval y Moderna en el Mediterráneo (AIECM3); García Porras, A., Busto Zapico, M., Martín Ramos, L., Peregrina Sánchez, M.J., Eds.; Ediciones de la Ergastula, S.L.: Madrid, Spain, 2024; pp. 727–732. [Google Scholar]
  40. Yenisehirlioglu, F. A Digital Database for Tiles at the Topkapi Palace Museum Storage Rooms. In 14th International Congress of Turkish Art; Republic of Turkey Ministry of Culture and Tourism: Ankara, Turkey, 2011; p. 12. [Google Scholar]
  41. Simsek, G.; Geckinli, A.E. An assessment study of tiles from Topkapı Palace Museum with energy-dispersive X-ray and Raman spectrometers. J. Raman Spectrosc. 2012, 43, 917–927. [Google Scholar] [CrossRef]
  42. Altun, A. (Ed.) The Story of Ottoman Tiles and Ceramics; Istanbul Stock Exchange: Istanbul, Turkey, 1997–1999. [Google Scholar]
  43. Geçkinli, A.E. Characterization of Ceramic Finds from Tekfur Palace. In Proceedings of the 22nd International Excavation, Research, and Archaeometry Symposium, İzmir, Turkey, 22–26 May 2000. [Google Scholar]
  44. Geçkinli, A.E. Conference on Technical Characteristics of Ottoman Tiles, Historical Environment, and Building Conservasionists Association. Available online: https://www.arkeolojikhaber.com/haber-prof-dr-a-emel-geckinli-osmanli-cinilerinin-teknik-ozelliklerini-anlatacak-24666/ (accessed on 13 August 2025).
  45. Colomban, P.; Simsek Franci, G.; Gironda, M.; d’Abrigeon, P.; Schumacher, A.-C. pXRF Data Evaluation Methodology for On-Site Analysis of Precious Artifacts: Cobalt Used in the Blue Decoration of Qing Dynasty Overglazed Porcelain Enameled at Customs District (Guangzhou), Jingdezhen and Zaobanchu (Beijing) Workshops. Heritage 2022, 5, 1752–1778. [Google Scholar] [CrossRef]
  46. Colomban, P.; Franci, G.S.; Gallet, X. Non-Invasive Mobile Raman and pXRF Analysis of Armorial Porcelain with the Coat of Arms of Louis XV and others Enamelled in Canton: Analytical Criteria for Authentication. Heritage 2024, 7, 4881–4913. [Google Scholar] [CrossRef]
  47. Bruker. Available online: https://xrfcheck.bruker.com/InfoDepth (accessed on 9 April 2025).
  48. Tite, M.; Watson, O.; Pradell, T.; Matin, M.; Molina, G.; Domoney, K.; Bouquillon, A. Revisiting the beginnings of tin-opacified Islamic glazes. J. Archaeol. Sci. 2015, 57, 80–91. [Google Scholar] [CrossRef]
  49. Colomban, P.; Kırmızı, B.; Simsek Franci, G. Cobalt and associated impurities in blue (and green) glass, glaze and enamel: Relationships between raw materials, processing, composition, phases and international trade. Minerals 2021, 11, 633. [Google Scholar] [CrossRef]
  50. Bouchard, M.; Gambardella, A. Raman microscopy study of synthetic cobalt blue spinels used in the field of art. J. Raman Spectrosc. 2010, 41, 1477–1485. [Google Scholar] [CrossRef]
  51. Beglaryan, H.; Isahakyan, A.; Terzyan, A.; Stepanyan, V.; Elovikov, D.; Gusarov, V.; Melikyan, S.; Zulumyan, N. Precipitation synthesis of Zn2-xCoxSiO4 blue ceramic pigments: Color performance and application. Ceram. Int. 2024, 50, 21386–21395. [Google Scholar] [CrossRef]
  52. Colomban, P.; Simsek Franci, G. Timurid, Ottoman, Safavid and Qajar ceramics: Raman and composition classification of the different types of glaze and pigments. Minerals 2023, 13, 977. [Google Scholar] [CrossRef]
  53. Colomban, P.; Tournié, A.; Bellot-Gurlet, L. Raman Identification of glassy silicates used in ceramic, glass and jewellry: A tentative differentiation guide. J. Raman Spectrosc. 2006, 37, 841–852. [Google Scholar] [CrossRef]
  54. Froment, F.; Tournié, A.; Colomban, P. Raman identification of natural red to yellow pigments: Ochre and iron-containing ores. J. Raman Spectrosc. 2008, 39, 560–568. [Google Scholar] [CrossRef]
  55. Bersani, D.; Lottici, P.P. Raman spectroscopy of minerals and mineral pigments in archaeometry. J. Raman Spectrosc. 2016, 47, 499–530. [Google Scholar] [CrossRef]
  56. Sempio, A.; Galtieri, A.F. Mineralogy of the Grès de Thiviers (northern Aquitaine, France). Per. Miner. 2002, 71, 65–84. [Google Scholar]
  57. Marco de Lucas, M.C.; Moncada, F.; Rosen, J. Micro-Raman study of red decorations in French faiences of the 18th and 19th centuries. J. Raman Spectrosc. 2006, 37, 1154–1159. [Google Scholar] [CrossRef]
  58. Stangarone, C.; Tribaudino, M.; Prencipe, M.; Lottici, P.P. Raman modes in Pbca enstatite (Mg2Si2O6): An assignment by quantum mechanical calculation to interpret experimental results. J. Raman Spectrosc. 2016, 47, 1247–1258. [Google Scholar] [CrossRef]
  59. Ohsaka, T.; Izumi, F.; Fujiki, Y. Raman spectrum of anatase, TiO2. J. Raman Spectrosc. 1978, 7, 321–324. [Google Scholar] [CrossRef]
  60. Colomban, P.; Treppoz, F. Identification and Differentiation of Ancient and Modern European Porcelains by Raman Macro- and Microspectroscopy. J. Raman Spectrosc. 2001, 32, 93–102. [Google Scholar] [CrossRef]
  61. Colomban, P.; Milande, V. On-site Raman analysis of the earliest known Meissen porcelain and stoneware. J. Raman Spectrosc. 2006, 37, 606–613. [Google Scholar] [CrossRef]
  62. Jayapandi, S.; Premkumar, S.; Lakshmi, D. Reinforced photocatalytic reduction of SnO2 nanoparticle by La incorporation for efficient photodegradation under visible light irradiation. J. Mater. Sci. Mater. Electron. 2019, 30, 8479–8492. [Google Scholar] [CrossRef]
  63. Burlot, J.; Vangu, D.; Bellot-Gurlet, L.; Colomban, P. Raman identification of pigments and opacifiers: Interest and limitation of multivariate analysis by comparison with solid state spectroscopical approach. II. Arsenic-based opacifiers and relation with cobalt ores. J. Raman Spectrosc. 2024, 55, 184–199. [Google Scholar] [CrossRef]
  64. Manoun, B.; Azdouz, M.; Azrour, M.; Essehli, R.; Benmokhtar, S.; El Ammari, L.; Ezzahi, A.; Ider, A.; Lazor, P. Synthesis, Rietveld refinements and Raman spectroscopic studies of tricationic lacunar apatites Na1-xKxPb4(AsO4)3 (0 < x < 1). J. Mol. Struct. 2011, 986, 1–9. [Google Scholar] [CrossRef]
  65. Van Pevenage, J.; Lauwers, D.; Herremans, D.; Verhaeven, E.; Vekemans, B.; De Clercq, W.; Vincze, L.; Moens, L.; Vandenabeele, P. A Combined Spectroscopic Study on Chinese Porcelain Containing Ruan-Cai Colours. Anal. Methods 2014, 6, 387–394. [Google Scholar] [CrossRef]
  66. Colomban, P.; Ngo, A.-T.; Fournery, N. Non-Invasive Raman Analysis of 18th Century Chinese Export/Armorial Overglazed Porcelain: Identification of the Different Enameling Techniques. Heritage 2022, 5, 233–259. [Google Scholar] [CrossRef]
  67. Hassan, H.K.; Torell, L.M.; Börjesson, L.; Doweidar, H. Structural changes of B2O3 through the liquid-glass transition range: A Raman-scattering study. Phys. Rev. B 1992, 45, 12797. [Google Scholar] [CrossRef] [PubMed]
  68. Ciceo-Lucatel, R.; Ardelean, R. FT-IR and Raman study of silver lead borate-based glasses. J. Non-Crystall. Solids 2007, 353, 2020–2024. [Google Scholar] [CrossRef]
  69. Satyanarayana, T.; Kityk, I.V.; Piasecki, M.; Bragiel, P.; Brik, M.G.; Gandhi, Y.; Veeraiah, N. Structural investigations on PbO–Sb2O3–B2O3: CoO glass ceramics by means of spectroscopic and dielectric studies. J. Phys. Condens. Matter 2009, 21, 245104. [Google Scholar] [CrossRef] [PubMed]
  70. Moshkina, E.; Gudim, I.; Temerov, V.; Krylov, A. Temperature-dependent absorption lines observation in Raman spectra of SmFe3(BO3)4 ferroborate. J. Raman Spectrosc. 2018, 49, 1732–1735. [Google Scholar] [CrossRef]
  71. Kamura, S.; Tani, T.; Matsuo, H.; Onaka, Y.; Fujisawa, T.; Unno, M. New probe for porcelain glazes y luminescence at Near-Infrared excitation. ACS Omega 2021, 6, 7829–7833. [Google Scholar] [CrossRef]
  72. Laakso, K.; Kangas, L.; Häkkänen, H.; Kaski, S.; Leveinen, J. Enhanced quantification of wollastonite and calcite in limestone using fluorescence correction based on continuous wavelet transformation for Raman. Appl. Spectrosc. Rev. 2021, 56, 67–84. [Google Scholar] [CrossRef]
  73. Böhme, N.; Hauke, K.; Neuroth, M.; Geisler, T. In situ Raman imaging of high-temperature solid-state reactions in the CaSO4–SiO2 system. Int. J. Coal Sci. Technol. 2019, 6, 247–259. [Google Scholar] [CrossRef]
  74. Sun, J.; Wu, Z.; Cheng, H.; Zhang, Z.; Frost, R.L. A Raman spectroscopic comparison of calcite and dolomite. Spectrochim. Acta Part A Mol. Biomol. Spectrosc. 2014, 117, 158–162. [Google Scholar] [CrossRef] [PubMed]
  75. De Wild, J.; Robert, E.V.C.; Adib, B.E.; Abou-Ras, D.; Dale, P.J. Secondary phase formation during monoclinic Cu2SnS3 growth for solar cell application. Sol. Energy Mater. Sol. Cell 2016, 157, 259–265. [Google Scholar] [CrossRef]
  76. Simsek Franci, G.; Demirsar Arli, V.B.; Kaya, S. Color Trials—Establishment of Characterization Methodology of Underglaze Decorated Iznik Tiles with Non-Destructive and Portable Spectroscopic Techniques (Raman Spectroscopy and Portable XRF); 2nd Development Report of 123M874; The Scientific and Technological Research Council of Türkiye (TÜBİTAK): Ankara, Türkiye, 2025. [Google Scholar]
  77. Colomban, P.; Simsek Franci, G.; Gerken, M.; Gironda, M.; Mesqui, V. Non-Invasive On-Site XRF and Raman Classification and Dating of Ancient Ceramics: Application to 18th and 19th Century Meissen Porcelain (Saxony) and Comparison with Chinese Porcelain. Ceramics 2023, 6, 2178–2212. [Google Scholar] [CrossRef]
  78. Colomban, P.; Franci, G.S.; Gerken, M.; Gironda, M.; Mesqui, V. Chemical and Vibrational Criteria for Identifying Early Sèvres Factory Porcelain Productions. Ceramics 2024, 7, 1905–1927. [Google Scholar] [CrossRef]
  79. Colomban, P.; Simsek Franci, G.; Gerken, M.; Gironda, M.; Mesqui, M. Non-invasive Raman and XRF study of mīnā’ī decoration, the first sophisticated painted enamels. Materials 2025, 18, 575. [Google Scholar] [CrossRef]
  80. Molera, J.; Climent-Font, A.; Garcia, G.; Pradell, T.; Vallcorba, O.; Zucchiatti, A. A study of historical processing of cobalt arsenides in XV–XVI century Europe. J. Archaeol. Sci. Rep. 2021, 36, 102797. [Google Scholar]
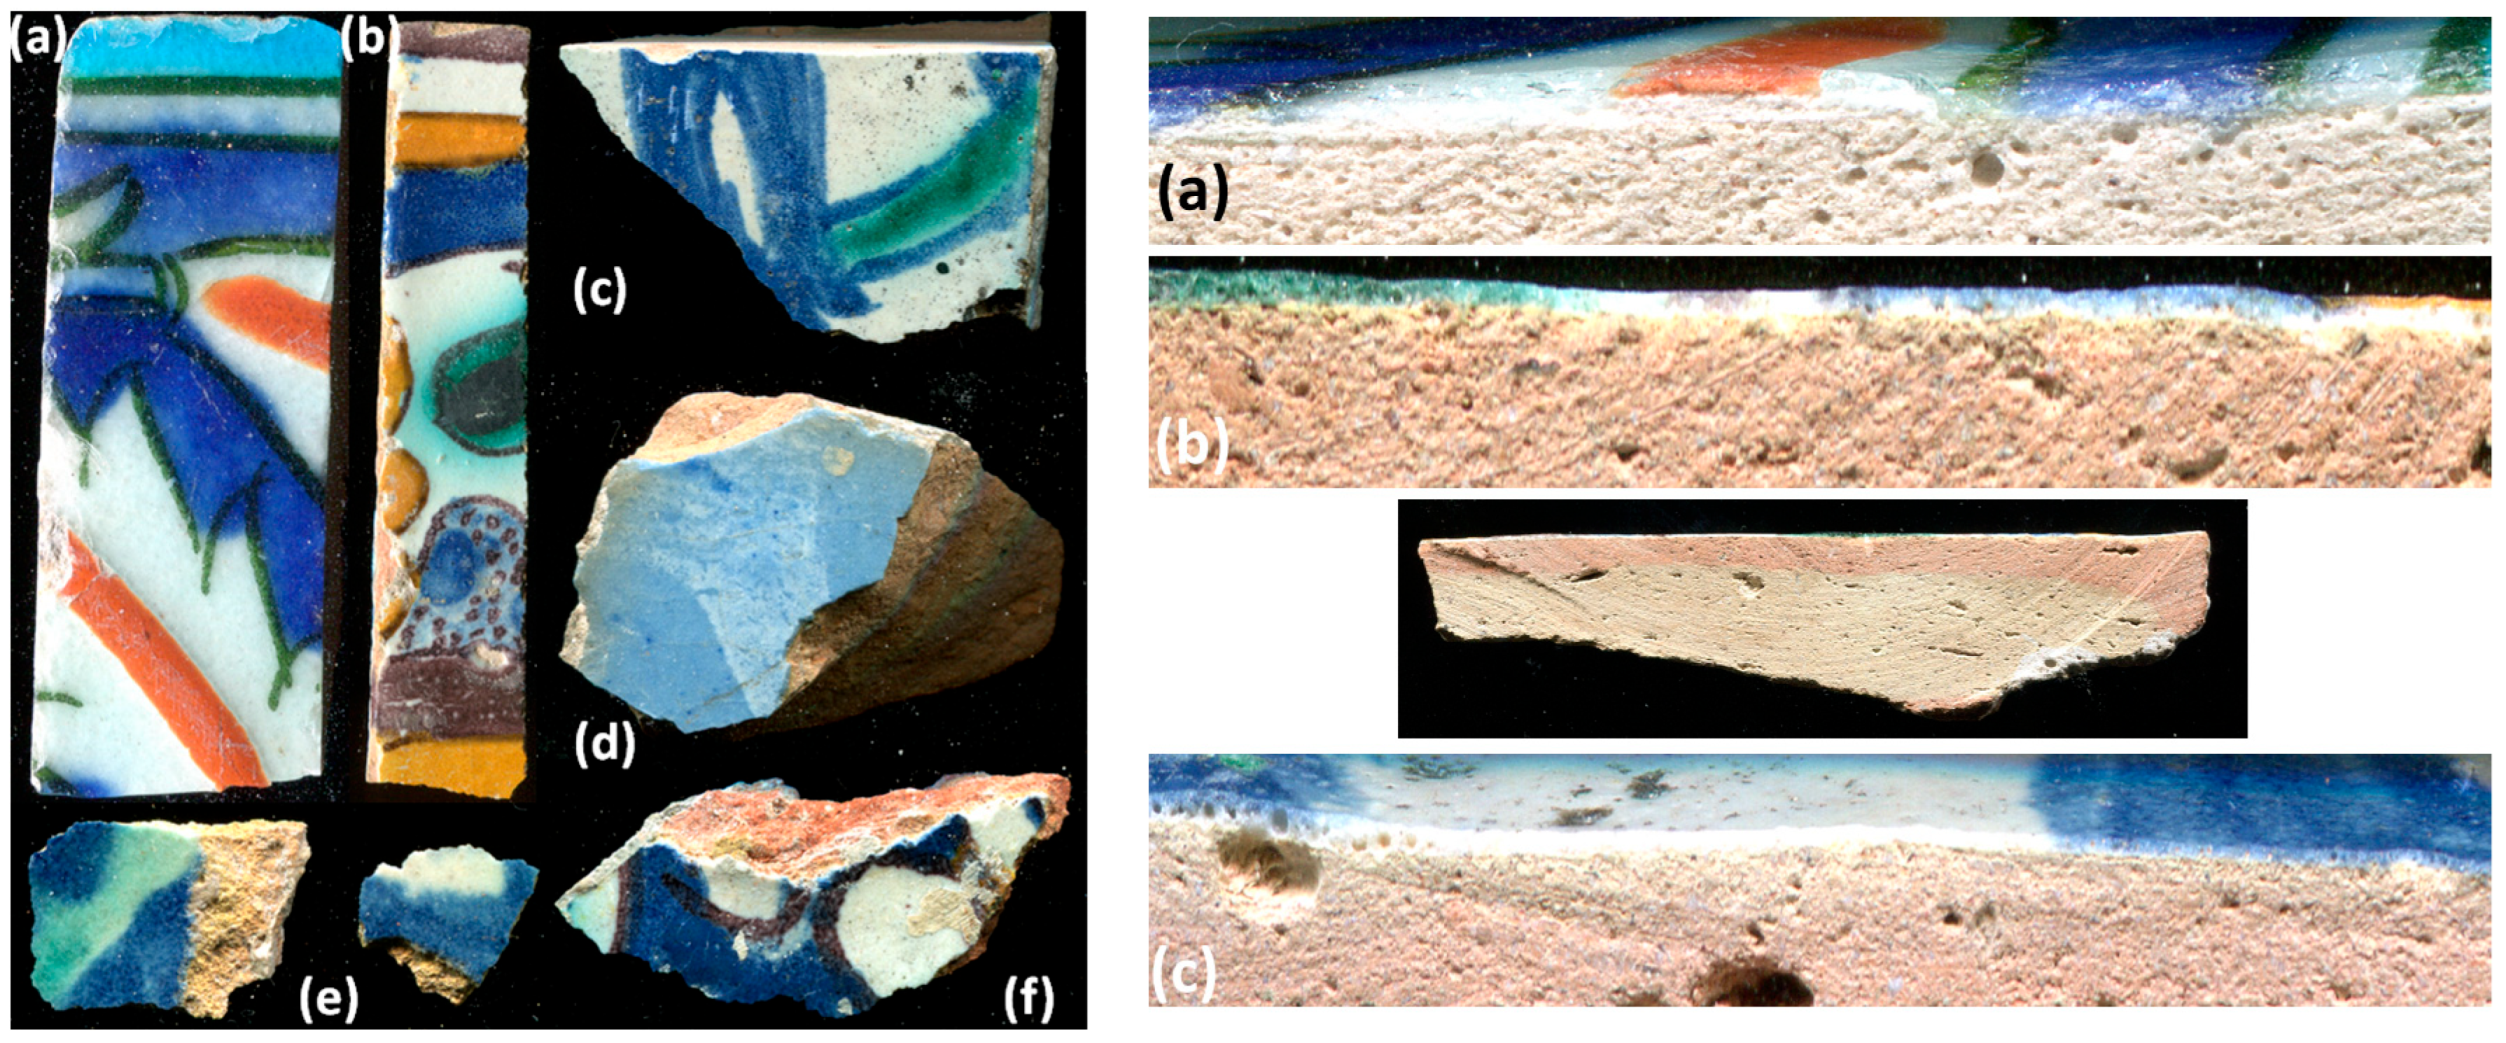
Figure 1. Top view (left) and sections (right) of the sherds: (a) Tekfur Palace tile fragment (Tek) and its section; (b) Qallaline tile rectangular fragment (Q) and its section (with full view of the sherd showing the pink and cream layers); (c) Sidi Ali Azzuz Zaghouan mausoleum fragment (AZ) and its section; (d) Italian sherd (It); (e) Sidi Ali Azzuz Tunis mausoleum fragments P1 and P3; and (f) fragment P2 (Sidi Ali Azzuz Zaghouan mausoleum).
Minerals 15 00865 g001
Figure 2. Electron microscopy images (SE imaging mode) of body paste fracture sections in tiles Q, P1, and IzC (scale bar = 50 µm). In the IzC section, the ceramic body, the white and red slips, and the overlying glaze layer are clearly visible (The continuous and dotted lines visualize the boundaries between the layers of enamel and the paste).
Minerals 15 00865 g002
Figure 3. Detailed view of the glazes of tiles Tek (A), Q (B), and AZ (C): sections of the zones colored in blue (Aa, Bb, and Ca), red (Ab), black (Ac), and green (Cc) and paste (Bc,Cb); Ad, Ba, and Ca show the surface of the colored areas. The scale bar corresponds to 1 mm, except for the image of Ab, where it corresponds to 500 µm.
Minerals 15 00865 g003
Figure 4. Comparison of representative XRF spectra recorded between 0.1 and 25 and between 25 and 35 keV on the body of Tekfur, Qallaline white (Body Kallaline) and rose (Slip Kallaline), Sidi Ali Azzuz mausoleum (Tunis, AZ and P1), and Sidi Ali Azzuz mausoleum (Zaghouan, P2, P3) sherds. Peaks marked with * are due to the Compton effect (broad) and those marked Rh* (narrow) the components of the rhodium anticathode.
Minerals 15 00865 g004
Figure 5. Comparison of representative XRF spectra recorded on Qallaline, Sidi Ali Azzuz mausoleum (Tunis, AZ and P1), and Sidi Ali Azzuz mausoleum (Zaghouan, P2) (a) white and (b) blue glazed areas; (c) blue Italian glaze; (d) various colored areas of Tekfur sherd. Peaks marked with * are due to the Compton effect (broad) and those marked Rh* (narrow) the components of the rhodium anticathode.
Minerals 15 00865 g005
Figure 6. Comparison of representative XRF spectra recorded on Qallaline (Q, d: black defect and l: dark line), Sidi Ali Azzuz mausoleum (Zaghouan, P2), Tekfur Palace (Tek) black zones; additionally, the spectrum of the yellow Tekfur zone (Tek_y) is shown.
Minerals 15 00865 g006
Figure 7. Comparison of XRF peak area of elements associated with cobalt in cobalt ores: (a) Ni, As, and Mn measured on blue zones of studied sherds; data were normalized by the cobalt signal. (b) Comparison of XRF peak area of elements Mn, Cu, and Fe measured on ‘black’ zones and lines; data were normalized by the rhodium anticathode signal.
Minerals 15 00865 g007
Figure 8. Representative Raman spectra of Iz (a,b) big triangle) and It (c,d) sherd glazes recorded using a blue laser; a zoomed-in view of the spectral range where the vibrational modes are observed is given in (a,c).
Minerals 15 00865 g008
Figure 9. Representative Raman spectra of P2 (a,b) and P3 (c,d) sherd glazes recorded using a blue laser on the glaze surface; a zoomed-in view of the spectral range where the vibrational modes are observed is given in (a,c).
Minerals 15 00865 g009
Figure 10. Representative Raman spectra of the glazes of Q (a,b) and AZ (cf) sherds recorded on the glaze surface (a,b,e,f) or on sherd section (c,d) using a blue (a,b,e,f) or green (c,d) laser; a zoomed-in view of the spectral range where the vibrational modes are observed is given in (a,c,e).
Minerals 15 00865 g010
Figure 11. Representative Raman spectra of Tek sherd glazes recorded using a blue laser: (a) red area, examination of the glazed section; (b) other colored areas, section analysis; (c) full spectral range expressed in absolute nm scale for the measurement of the maxima of fluorescence components.
Minerals 15 00865 g011
Figure 12. Comparison of XRF peak areas for blue-glazed regions: (a,b) Co, As, and Mn; (c,d) Ni, As, and Mn. Data are normalized to the Rhodium anticathode signal in (a,c) and to the Si signal in (b,d), depending on the pXRF instrument used. The provenance of the analyzed artifacts or sherds is indicated. For detailed data and provenance information, see data in references [76,77,78,79], including minai ceramics from 12th–13th century Persia, 18th-century productions from the Meissen and Sèvres factories, 15th–16th-century Iznik tiles (notably from Edirne mosques), 18th-century Tekfur tiles, and Qallaline tiles.
Minerals 15 00865 g012aMinerals 15 00865 g012b
Table 1. Provenance of the samples and their expected place and date of production. References related to the different types of decor are given [16,17,18,28,29,30,31,32,33,34,35,36,37,38,39,40,41].
ProvenanceProduction Place
(Expected)
Period (Colors) [Remarks]Tile ViewLabelRefs
Art market,
Tunis, Tunisia
Expected from the
dribad of BirLahjar
madrasa
Qallaline,
Tunisia
18th century? (circa 1735–1756)
(blue, green, eggplant, brown-orange, and milky white)
Minerals 15 00865 i001Q[28,29,30,31,32,33]
Sidi Ali Azzuz
mausoleum (zâwiya),
Zaghouan, Tunisia
Qallaline,
Tunis,
Tunisia
Second half of 18th century
[signature from Usta mascûdal-Sabac]
Minerals 15 00865 i002AZ[30,31,32]
Sidi Ali Azzuz mausoleum (zâwiya),
Tunis,
Tunisia
Qallaline,
Tunis,
Tunisia
Second half of 18th century (circa 1756)
(blue, green, brown, and milky white)
Minerals 15 00865 i003P1[30,31,32]
Sidi Ali Azzuz mausoleum (zâwiya),
Zaghouan,
Tunisia
Qallaline,
Tunis,
Tunisia
or
Türkiye?
First half of 18th century (circa 1710)
(blue, green, brown, and milky white)
Minerals 15 00865 i004P2
 
 
P3
[30,31,32,33]
Mosquée des Teinturiers (Jamc J’did, Dyers’ mosque),
Tunis,
Tunisia
Tekfur
Palace,
Türkiye
First half of 18th century (circa 1727)
(blue, turquoise, coral red, black line covered with optically clear colorless glaze)
Minerals 15 00865 i005Tek[30,34,35,36,37,38,39]
Art market
Tunis,
Tunisia
Italy,
Naples
mark
19th or 20th century (?)
(blue, white)
Minerals 15 00865 i006It
Art market
France
Iznik
Türkiye
16th centuryMinerals 15 00865 i007Iz1C[16,17,18,40,41]
Art market
France
Iznik
Türkiye
Middle 16th centuryMinerals 15 00865 i008Iz2Tr[16,17,18,40,41]
Table 2. Elemental composition (at. %) and atomic ratios of studied ceramic bodies, measured by SEM-EDS at 400× magnification. Full datasets are provided in the Supplementary Materials. (-: below the limit of detection).
SampleSi/AlNaKCaCa/Na + KPbFeTi
Q white2.765.931.0413.571.95-3.880.30
Q rose2.481.170.6214.478.08-3.310.32
AZ4.361.191.2514.625.99-2.30.79
2.830.811.2112.396.130.881.410.17
4.251.692.179.252.401.541.690.14
P12.201.060.6319.1411.32-3.530.31
P214.211.741.546.121.87-0.610.04
It2.331.032.076.993.74-2.720.33
Iz1C
 
grain
16.18
15.91
17.19
2.48
2.99
2.4
0.46
0.65
0.32
0.66
1.42
0.67
0.22
0.39
0.25
-
0.13
0.06
0.31
0.73
0.78
0.1
0.1
0.03
Iz2Tr24.31
9.78
1.95
1.47
0.28
0.62
1.3
3.89
0.58
1.86
0.02
-
0.16
0.04
0.06
-
Tek19.482.610.521.480.470.120.550.04
Table 3. Elemental composition (at. %) and atomic ratios of studied glazes measured by SEM-EDS at 400× magnification. Full datasets are provided in the Supplementary Materials. (?: not measured; -: below limit of detection).
SampleSi/AlNa + K + CaPbSnFeTiCuCoZnCe//ScAsMn//Cr
Qallaline
glaze (white)8.754.553.920.280.02-------
blue10.395.546.86?0.220.29-0.30-0.16//--0.07//-
brown-yellow7.414.285.28?0.20---0.12-//0.09--
eggplant4.504.293.020.120.08-0.07----0.21//-
green-black7.586.684.651.320.440.051.78-----//0.03
green7.676.795.421.110.420.092.1-----//0.03
green 210.126.637.113.360.42-4.86-----
black1.935.924.10.730.40-2.97-----
Sidi Azoug Azzuz AZ
glaze (white)5.184.191.830.560.04---0.05---
glaze (white) 25.725.92.951.010.09-------
blue5.444.672.57-0.14--0.030.12-0.06-
green8.259.635.170.730.460.060.61 1.65---
Sidi Azoug Azzuz P1
glaze (white)3.638.212.750.610.03-----0.03-
dark blue3.525.244.65?0.17-------
blue8.136.485.87?0.18--0.09----
Sidi Azoug Azzuz P2
glaze (white)5.775.485.750.390.09-----0.01-
blue9.196.656.41?0.561.14-0.44-0.54//-0.28-
black line13.137.698.66?0.530.28-0.210.2--0.7//-
Italian tile It
blue8.08.470.45-0.930.17------
white
Iznik Iz1C
blue 19.583.244.0-0.09-0.110.01----
blue 28.528.345.660.50.15-0.090.06----
blue 323.975.845.020.430.19-0.180.06----
blue 414.898.194.260.360.16-0.090.01----//0.11
blue 538.234.674.410.440.10-0.130.06----
red 114.326.822.690.161.08-------
red 2 150019.807.183.42-0.49-------
Iznik Iz2Tr
blue12.208.5540.421.24-0.230.01----//0.32
red25.573.860.1?1.61-------
Dyers’ mosque (Tek)
glaze (white)14.719.681.95-0.06-------
glaze (white) 27.2114.86--0.07-0.01-----
light blue174.634.86-0.14-0.22-----
blue3.422.251.8-0.03-0.060.01----
red51.216.760.93-2.94-------
turquoise 216.5316.224.5-0.10-0.11-----
turquoise 12.383.461.28-0.03-0.12-----
turquoise 35.7412.882.76-0.06-0.03-----
turquoise 47.755.092.4-0.08-0.16-----
black3.4611.881.39-1.350.151.86-----
black 24.5912.214.26-0.240.030.3-----
black 317.3215.53--0.26-0.12-----
Table 4. Main characteristics and conclusion.
Kiln.
(Previous
Assignment)
LocationSample
(Origin)
PasteGlazeBlueBlackRemarks
QallalineTunisQTwo layers
(red Si-rich
layer +
white
Pb-doped layer)
Pb-based
Ce traces
Low Ca
Low AsCu-based 
Association of Group 1 and Group 2′ Qallaline
Qallaline,ZaghouanAZPb tracesPb-basedLow As
Qallaline
 
TunisP1Pb addedPb-based  
 
Group 2 Qallaline


Group 2′ Qallaline
Qallaline
or Türkiye
 
ZaghouanP3Pb tracesPb-based
Qallaline
or Türkiye
ZaghouanP2Pb tracesPb-based
Ce traces
TekfurTunisTekPb-basedMixed Pb-alkalisHigh AsFe-based
ItalyTunisItNo PbNo Sn
Low Ca
IznikTürkiye Mixed Pb-alkalis CrO4
Disclaimer/Publisher’s Note: The statements, opinions and data contained in all publications are solely those of the individual author(s) and contributor(s) and not of MDPI and/or the editor(s). MDPI and/or the editor(s) disclaim responsibility for any injury to people or property resulting from any ideas, methods, instructions or products referred to in the content.