Abstract
Deep carbonate reservoirs have garnered significant attention and demonstrated great potential for oil and gas exploration in recent years. The Majiagou Formation in the Ordos Basin has received much attention for its deep oil and gas deposits recently. However, the issue of fluid evolution within the great depth has been overlooked, and the relationship between fluid flow and the gas accumulation process remains unclear. This paper aims to explore the fluid evolution and its relationship with the gas accumulation, which poses a challenge for further petroleum exploration. To achieve this, petrological studies on dolomite samples were carried out and four types of secondary cements were identified: early gypsum-moldic pore-filling calcite, late gypsum-moldic pore-filling calcite, dissolution pore-filling calcite and fracture-filling calcite. Subsequently, an interdisciplinary approach that integrates petrography observation, microthermometry, laser Raman analysis of fluid inclusions, and carbon and oxygen isotope tests on these types of cements is employed to elucidate the fluid flow evolution. These investigations revealed that four different stages of inorganic fluid activity were coeval with two stages of organic fluid activity. The two stages of organic fluid flows were significantly important for petroleum accumulation. In the late Triassic to early Jurassic, there was small-scale liquid oil accumulation, which was associated with the second stage of fluids. In the early Cretaceous, there was large-scale gas accumulation, which was associated with the fourth stage of fluids. This research is crucial for understanding the fluid flow process and its relationship with hydrocarbon accumulation in deeply buried carbonate formations.
1. Introduction
With the continuous advancement of oil and gas exploration, an increasing number of oil and gas reservoirs have been discovered in deep carbonate reservoirs [1,2,3]. Deep carbonate reservoirs have become a new field for future oil and gas exploration [2,4,5]. However, the prediction of deep carbonate reservoirs remains highly challenging because they typically undergo multiple episodes of fluid evolution and are much more reactive than siliciclastic reservoirs [1,6,7,8,9].
The Majiagou Formation in the Ordos Basin is a typical deep carbonate gas reservoir where abundant oil and gas have been discovered in recent years [10,11,12]. The Majiagou Formation is a multicycle marine sediment, where carbonate rocks, gypsum and salt rocks are interbedded and symbiotic [13,14]. Multiple layers of gypsum-salt rock sediments developed in the upper part of the fifth member of the Majiagou Formation [15,16]. The gypsum-salt intervals have excellent sealing properties and are very conducive to the gas accumulation and preservation in the pre-salt reservoir of the Majiagou Formation [10,11]. For gas sources, the Upper Paleozoic coal-measure source rock and the marine source rock provide the effective gas source for the pre-salt reservoirs of the Majiagou Formation [17,18,19,20,21]. However, due to the lack of karst weathering crust reservoirs, the overall properties of the reservoirs are poor [14,22]. Therefore, the formation mechanism of reservoirs has become the key issue, especially in the prediction of high-quality gas reservoirs and gas exploration in the pre-salt reservoirs of the Majiagou Formation.
Progress on the investigation of pre-salt reservoirs in the Ordos Basin has been made by previous researchers. The favorable distribution of the pre-salt reservoirs was predicted mainly by analyzing sedimentary facies and reservoir characteristics [22,23]. As for the mechanism of reservoir formation, the former researchers generally believed that the sedimentary facies are the main controlling factor. The original dolomite intracrystalline pores and intergranular pores are the most important reservoir space [24]. In general, deep carbonate reservoirs have undergone intense diagenesis, and deep fluid evolution plays an important role in reservoir formation [25,26,27,28]. However, the issue of fluid evolution within the deep depths has been overlooked, and the relationship between fluid flows and gas accumulation remains unclear.
Located in the central Ordos Basin, with promising prospects for natural gas exploration, the Majiagou Formation has a large burial depth and experienced intense fluid activity, which is an ideal geological target to study the relationship between fluid flows and the gas accumulation process. In this paper, based on thin section preparation, petrological study of reservoir, petrography observation, microthermometry, laser Raman analysis of fluid inclusions and carbon and oxygen isotopes tests of the calcite from nine well cores in the central Ordos Basin, (1) the types and sequence of paleofluids were determined; (2) the source and genesis of the paleofluids were analyzed; (3) the paleofluid evolution process was investigated on the temperature, paleopressure and time of the fluids; and (4) the relationships between fluid evolution and petroleum accumulation in the deep carbonate reservoirs were elucidated. On the basis of this, the paleofluid evolution over the long geological history was explored, providing a reference for the global assessment of petroleum exploration in ancient and deeply buried carbonate reservoirs.
2. Geological Setting
The Ordos Basin is an important petroliferous basin in central and western China, with an area of 37 × 104 km2, and is the second largest onshore basin in China [29,30]. The Ordos Basin is tectonically located on the western margin of the North China Craton. The Ordos Basin can be divided into six first-level tectonic units, namely, the Jinxi Flexural Belt, the Yishan slope, the Tianhuan Depression, the Yimeng uplift, the Weibei uplift and the western marginal thrust belt successively [31]. Our study area is located in the Jingbian county and Wuqi county in the central Ordos Basin (Figure 1a), which are the central and western parts of the Yishan slope tectonically. The average burial depth of carbonate reservoirs in the Majiagou Formation within the study area is over 3500 m.
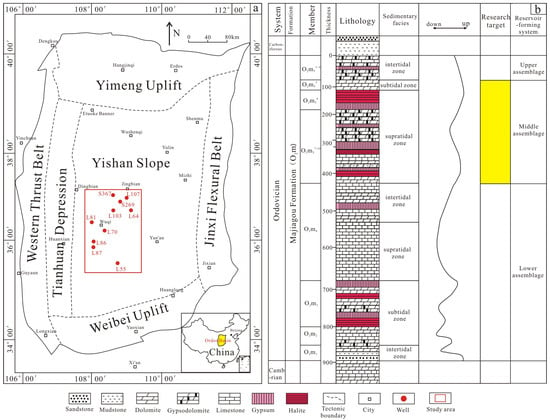
Figure 1.
(a) Division of tectonic units in Ordos Basin and the location of the study area (modified after [31]); (b) stratigraphic column of the Majiagou Formation (modified after [15]).
In the Paleozoic, the Ordos Basin mainly experienced two evolutionary stages: the early Paleozoic shallow sea carbonate platform environment and the late Paleozoic craton inland basin [31]. The Ordos Basin began the large-scale transgression and developed the shallow carbonate sediments during the sedimentation of the Majiagou Formation [13,14]. A large number of evaporites developed in the inner depression of the Basin, while thick carbonate sediments developed in the margin of the Basin in the open platform facies. The Majiagou Formation in the Ordos Basin can be divided into six lithological members from bottom to top, namely the first, second, third, fourth, fifth, and sixth members of the Majiagou Formation [32]. In particular, there was a regression because of the dry climate and the uplift of the basin during the sedimentation of the fifth member. The fifth member of the Majiagou Formation can be divided into 10 subsections based on the lithology characteristics. Because of the intense regression, multiple layers of gypsum-salt rocks developed during the sedimentation of the sixth subsection of the fifth member of the Majiagou Formation. The gypsum-salt intervals of the sixth subsection of the fifth member show a trend of gradually increasing evaporite from west to east.
Due to the regional tectonic uplift caused by the late Caledonian movement, the Ordos Basin suffered weathering and stratigraphic erosion from the Middle Ordovician to the Middle-Late Carboniferous from 130 to 150 Ma [31,33]. The upper Majiagou Formation suffered regional denudation, and strata above the sixth member of the Majiagou Formation were missing in most areas of the basin. The remaining first to fifth members formed the main marine carbonate gas reservoir in the Ordos Basin (Figure 1b).
3. Samples and Methods
A total of 19 samples in this study were collected from nine wells in the central Ordos Basin (Figure 1a), which were taken from different depths of the pre-salt strata of the Majiagou Formation, with sampling depths ranging from 3500 m to 4300 m. Samples, mainly comprising dolomite, were collected from fractures and dissolution pores filled with secondary calcite. All selected core samples were photographed, and their petrological characteristics were described (Table 1).

Table 1.
The depth and types of the samples.
The fluid inclusion tests of the samples mainly include the petrography observation, microthermometry and laser Raman testing. These tests were all completed in the Laboratory of Mineralization and Dynamics, Chang’an University. First, samples where secondary calcite developed were selected for thin section preparations. Second, the petrography observation was conducted by the German Leica transmission light microscope for the determination of the size, shape, distribution, phase and other characteristics of the fluid inclusions. Some samples were observed and photographed by the scanning electron microscope (Quanta 650 SEM, FEI Company, Hillsboro, OR, USA). Third, fluid inclusions with larger individual sizes (generally greater than 10 μm) were selected for the test of laser Raman spectroscopy in order to determine the components of the fluid inclusions. The RM-2000 micro-laser Raman spectroscopy produced by the Renishaw company (from Gloucestershire, UK) was used for the laser Raman probe measurement of the fluid inclusions. The test room temperature was 23 °C, and the humidity was 65%.
Finally, based on the fluid inclusion petrography, the transparent two-phase liquid–vapor aqueous inclusions with the vapor/liquid ratio of less than 10% were selected for the measurement of the homogenization temperature and ice melting temperature. A LinkamTHMS 600 cooling-heating stage-Leica DM RXP transmission optical microscope from Linkam Scientific Instruments LTD in London, UK was adopted for microthermometry of the fluid inclusions. The temperature measurement error was ±0.1 °C. The heating rate was 5 °C/min during the measurement of the homogenization temperature. The phase change should be noted once the temperature rises by 10 °C. The heating rate was reduced to 2 °C/min near the phase transformation point. After the fluid inclusions transformed into homogenization, the temperature was reduced to room temperature. When measuring the ice melting temperature, the cooling rate was 10 °C/min. The temperature was reduced to −90 °C and kept there for 5 min to ensure that the fluid inclusions were completely frozen. Then, the temperature was raised at a rate of 5 °C/min; meanwhile, the fluid inclusions were observed. The heating rate was reduced to 2 °C/min near the ice melting temperature. When the last piece of ice in the fluid inclusions was completely melted, the temperature measured was the ice melting temperature.
The carbon and oxygen isotope tests of the calcite samples were also completed in the Laboratory of Mineralization and Dynamics, Chang’an University. Samples with the fresh secondary calcite were selected, and the calcite was ground into 200 mesh for testing. One-hundred microgram samples were used to react with 100% anhydrous phosphoric acid to generate CO2 gas, which was determined by a MAT253 mass spectrometer with the GasBench II continuous flow method. The test accuracies of δ18O and δ13C were all higher than 0.1‰, and the test results were calibrated by the international standard sample NBS-18.
4. Results
4.1. Petrography Characteristics
The lithofacies in the pre-salt strata of the Majiagou Formation are dominated by dolo-mudstones and dolo-grainstones. Secondary calcite was well developed and divided into four categories in this study, including early gypsum-moldic pore-filling calcite, late gypsum-moldic pore-filling calcite, dissolution pore-filling calcite and fracture-filling calcite (Figure 2).
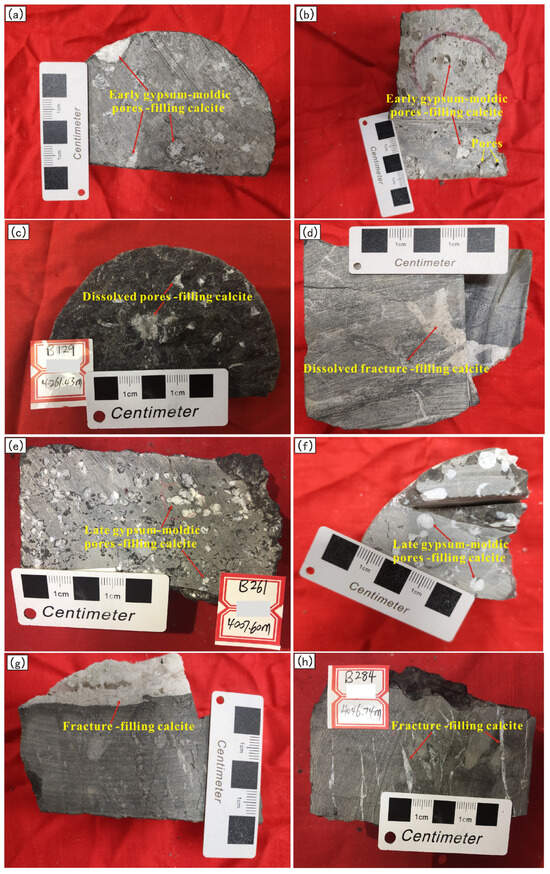
Figure 2.
Photos of representative samples of the Majiagou Formation in the study area. (a) The early gypsum-moldic pore-filling calcite (Sample B44, Well S367, 3903.8 m). (b) The early gypsum-moldic pore-filling calcite (Sample B45, Well S367, 3630.63 m). (c) The dissolution pore-filling calcite (Sample B129, Well L64, 4263.61 m). (d) The dissolution pore-filling calcite (Sample B123, Well L64, 4259.35 m). (e) The late gypsum-moldic pore-filling calcite (Sample B261, Well L107, 4007.60 m). (f) The late gypsum-moldic pore-filling calcite (Sample B262, Well L107, 4011.49). (g) The fracture-filling calcite (Sample B247, Well L103, 3686.93 m). (h) The fracture-filling calcite (Sample B284, Well L70, 4046.74 m).
The early gypsum-moldic pore-filling calcites are separately distributed and are not interconnected. The individual size of calcite is 2–10 mm with a relatively dark color (Figure 2a,b). Some calcites did not completely fill the gypsum-moldic pores, leaving some gypsum-moldic pores. Under microscopic observation, this type of calcite is characterized by crystalline structures with small grain sizes ranging from approximately 100 to 200 μm (Figure 3a,b).
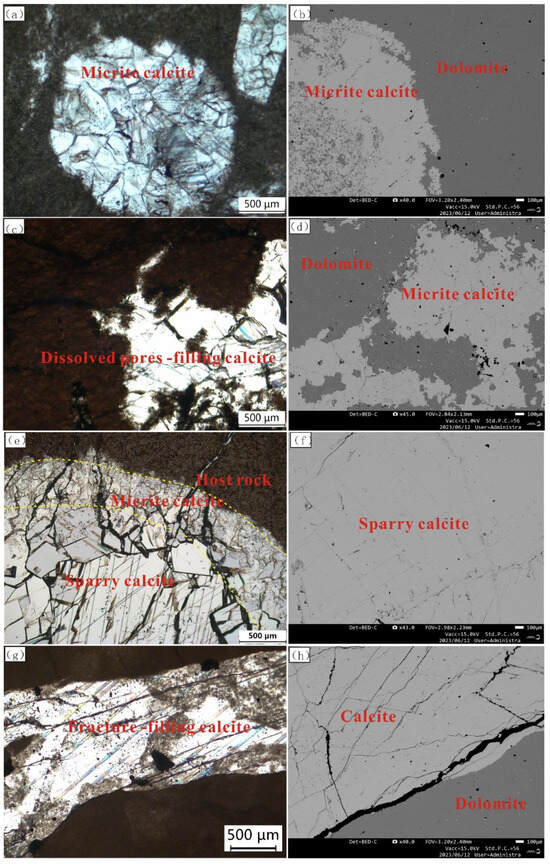
Figure 3.
Representative microscopy images of plane-polarized light (PPL) and scanning electron microscopy (SEM). (a) The early gypsum-moldic pore-filling calcite (Sample B44, Well S367, 3903.8 m, PPL). (b) The early gypsum-moldic pore-filling calcite (Sample B44, Well S367, 3903.8 m, SEM). (c) The dissolution pore-filling calcite (Sample B129, Well L64, 4261.43 m, PPL). (d) The dissolution pore-filling calcite (Sample B129, Well L64, 4261.43 m, SEM). (e) The late gypsum-moldic pore-filling calcite (Sample B262, Well L107, 4011.49, PPL). (f) The late gypsum-moldic pore-filling calcite (Sample B262, Well L107, 4011.49, SEM). (g) The fracture-filling calcite (Sample B284, Well L70, 4067.74 m, PPL). (h) The fracture-filling calcite (Sample B284, Well L70, 4067.74 m, SEM).
The late gypsum-moldic pore-filling calcites are also distributed in the gypsum-moldic pores. Their shape is mainly round, with a size of 2–10 mm, and the color is white (Figure 2c,d). The boundary between calcite and the host rock is clearly visible. There are two-stage calcites observed under the microscope. The early micrite calcites are filled in the edges of pores, while the late calcites are filled in the middle part of the pores. The late calcites are sparry calcite with larger sizes. It is pure calcite without other minerals that is observed under the scanning electron microscope (Figure 3c,d).
The dissolution pore-filling calcites generally have irregular shapes with large differences in individual sizes (Figure 2e,f). The fragments of the residual host rocks can be observed in the dissolution pore-filling calcites under the microscope, indicating that they are derived from the dissolution of the host rock. Some dissolution pores may originate from the dissolution of original fractures in the dolomite (Figure 3e,f).
The fracture-filling calcites feature short calcite veins in the dolomite. The boundary between the calcite veins and the host rock is clearly visible (Figure 2g,h). The width of different veins varies greatly, ranging from 1 mm to 20 mm. Additionally, the width of the same vein is variable, and multiple veins are nearly parallel. It can be observed that multi-group intersecting microcracks are developed in the calcite veins under the electron microscope (Figure 3g,h).
4.2. Fluid Inclusion Petrography
According to the petrographic characteristics, especially by the shape and occurrence of the fluid inclusions, the fluid inclusions in Majiagou Formation are all primary fluid inclusions, which can be divided into four categories, including two-phase liquid–vapor aqueous inclusions, oil inclusions, gas-bearing aqueous inclusions and pure gas inclusions (Figure 4).
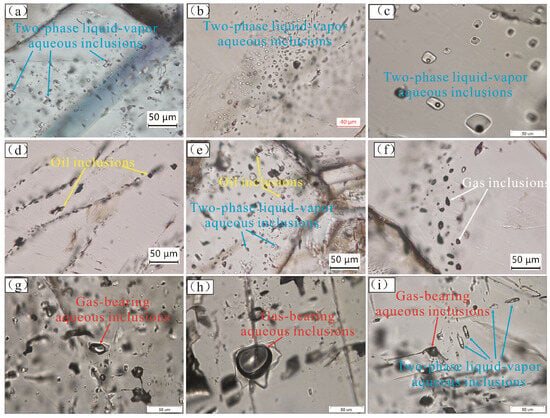
Figure 4.
Microscopic photos of fluid inclusions in the pre-salt reservoir of the Majiagou Formation. (a–c): Two-phase liquid–vapor aqueous inclusions are widely distributed in secondary calcites. (d): Oil inclusions develop in the gypsum-moldic pore-filling sparry calcites. (e): Two-phase liquid–vapor aqueous inclusions and oil inclusions develop in the gypsum-moldic pore-filling sparry calcites. (f): Pure gas inclusions develop in the fracture-filling calcites. (g,h): Gas-bearing aqueous inclusions develop in the fracture-filling calcite. (i) Gas-bearing aqueous inclusions and two-phase liquid–vapor aqueous inclusions develop in the fracture-filling calcite.
The two-phase liquid–vapor aqueous inclusions are widely found in the four types of secondary calcite. They are light and transparent in color and vary greatly in individual size from 5 to 50 μm (Figure 4a–c,e,i). The gas–liquid ratio of the two-phase liquid–vapor aqueous inclusions is relatively small, generally less than 10%. There are relatively few oil inclusions, which only develop in the gypsum-moldic pore-filling sparry calcites (Figure 4d,e). The gas–liquid ratios of oil inclusions are larger than two-phase liquid–vapor aqueous inclusions, ranging from 10% to 20%. The color of oil inclusions is light brown, and the individual size is between 10 and 30 μm. In addition, there are a large number of gas-bearing aqueous inclusions found, but they only develop in the fracture-filling calcite (Figure 4g–i). The gas–liquid ratio of gas-bearing aqueous inclusions is generally greater than 50%, their liquid phase is relatively transparent, the bubbles are gray, and they have a larger individual size of between 30 and 60 μm. The pure gas inclusions only develop in the fracture-filling calcites (Figure 4f). The overall color of pure gas inclusions is gray–black, and the individual sizes are between 10 and 30 μm.
4.3. Microthermometry
The homogenization temperature of the two-phase liquid–vapor aqueous inclusions in the early gypsum-moldic pore-filling calcite is between 86.9 °C and 128.6 °C, with most values between 110 °C and 130 °C, and an average value of 118.4 °C. The homogenization temperature of the two-phase liquid–vapor aqueous inclusions in the late gypsum-moldic pore-filling calcite is between 152 °C and 194 °C, mainly distributed between 160 °C and 180 °C, with an average value of 170.2 °C. For the dissolution pore-filling calcite, the homogenization temperature is between 141.1 °C and 168.9 °C, predominantly between 140 °C and 160 °C, with an average value of 155.1 °C. In the fracture-filling calcite, the homogenization temperature ranges from 171.3 °C to 210 °C, mainly between 180 °C and 200 °C, with an average value of 191.2 °C (Figure 5).
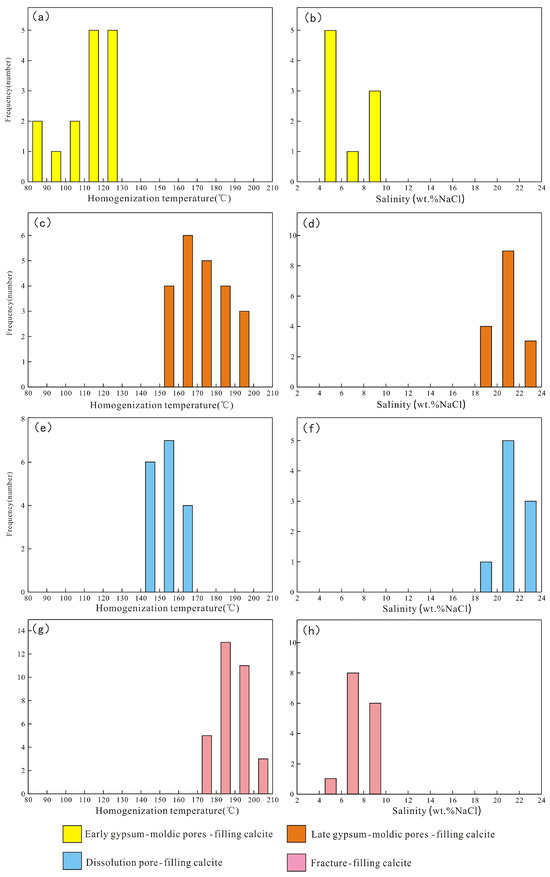
Figure 5.
The distribution of the homogenization temperature and ice melting temperature of the two-phase liquid–vapor aqueous inclusions in the pre-salt reservoir of the Majiagou Formation. (a) Homogenization temperature of early gypsum-moldic pore-filling calcite. (b) Salinity of early gypsum-moldic pore-filling calcite. (c) Homogenization temperature of late gypsum-moldic pore-filling calcite. (d) Salinity of late gypsum-moldic pore-filling calcite. (e) Homogenization temperature of dissolution pore-filling calcite. (f) Salinity of dissolution pore-filling calcite. (g) Homogenization temperature of fracture-filling calcite. (h) Salinity of fracture-filling calcite.
According to Bodnar’s [34] formula for converting the ice melting temperature to salinity of two-phase liquid–vapor aqueous inclusions, the salinity of two-phase liquid–vapor aqueous inclusions was calculated based on the measured ice melting temperature of aqueous inclusions. The results show that the salinity of the two-phase liquid–vapor aqueous inclusions in the early gypsum-moldic pore-filling calcite ranges from 4% to 10%, with an average value of 6.57. The late gypsum-moldic pore-filling calcite exhibits salinity values between 18% and 24%, with an average of 21.4. Similarly, the range of salinity of the two-phase liquid–vapor aqueous inclusions in the dissolution pore-filling calcite is between 18% and 24%, with an average of 21.7. In addition, the fracture-filling calcite shows a salinity range from 4% to 10%, with an average of 7.62% (Figure 5).
4.4. Raman Analysis of Fluid Inclusions
In this study, laser Raman spectroscopy test was carried out on different types of fluid inclusions classified by the petrography characteristics. The results show that H2O was detected in both the bubbles and the liquid phase of the fluid inclusions (Figure 6a), confirming the two-phase liquid–vapor aqueous inclusions. The saturated hydrocarbons were detected in both the bubbles and the liquid phase of the oil inclusions (Figure 6b), further confirming the liquid oil inclusions. In the gas-bearing aqueous inclusions, significant CH4 was detected in the bubbles, while H2O was also detected in the liquid phase (Figure 6c), indicating the CH4-containing aqueous inclusions. In addition, a small amount of bitumen was detected in the liquid phase of some gas-bearing aqueous inclusions (Figure 6d). Finally, only CH4 signals were detected in the pure gas inclusions (Figure 6e), confirming the pure CH4 inclusions.
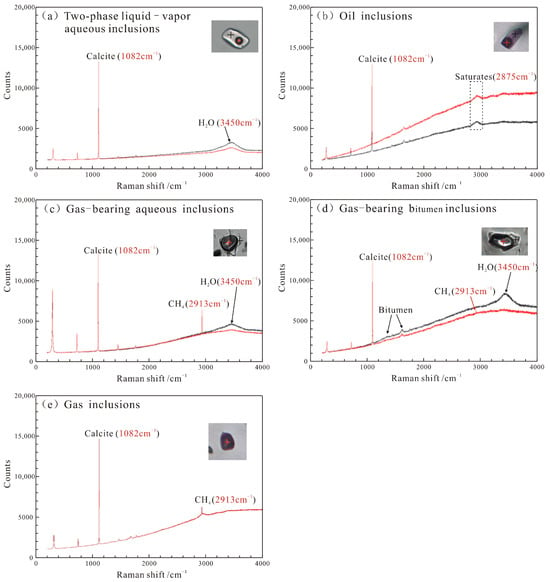
Figure 6.
The Raman spectrum of fluid inclusions in representative samples in the pre-salt reservoir of the Majiagou Formation. (a) The two-phase liquid–vapor aqueous inclusions (Sample B44, Well S367, 3903.8 m). (b) The liquid oil inclusions (Sample B129, Well L64, 4263.61 m). (c) The CH4-containing aqueous inclusions (Sample B247, Well L103, 3686.93 m). (d) The gas-bearing bitumen inclusions (Sample B261, Well L107, 4007.60 m). (e) The pure CH4 inclusions (Sample B284, Well L70, 4046.74 m).
4.5. Carbon and Oxygen Isotopes
Carbon and oxygen isotopes test covering all types of secondary calcites and their host rock was conducted. The results are shown in Table 2.

Table 2.
The calculation results of all types of secondary calcites and their host rock in the Majiagou Formation.
The 13C value of the early gypsum-moldic pore-filling calcite is from −3.25‰ to −3.41‰, with the average value of −3.34‰, and the 18O value is from −13.95‰ to −14.22‰, with the average value of −14.09‰. For the late gypsum-moldic pore-filling calcites, the 13C value is from −20.31‰ to −21.07‰, with the average value of −20.77‰, and the 18O value is from −11.97‰ to −12.22‰, with the average value of −12.12‰. The dissolution pore-filling calcite has a 13C value ranging from −3.01‰ to −3.12‰, with an average value of −3.06‰, and the 18O value ranges from −14.02‰ to −14.15‰, averaging −14.09‰. Moreover, the 13C value of the fracture-filling calcite is from −4.06‰ to −4.13‰, with an average value of −4.10‰, and the 18O value is from −14.34‰ to −14.47‰, with an average value of −14.41‰. Last, for the dolomite host rock, the 13C value ranges from −1.98‰ to −0.30‰, with an average value of −1.18‰, and the 18O value ranges from −8.84‰ to −7.00‰, with an average value of −7.72‰.
5. Discussions
5.1. Types and Phases of Paleofluids
There are many types of paleofluids in deep carbonate reservoirs, and their evolution processes are quite complex [34,35,36]. Based on the characteristics of fluid inclusions developed in different types of secondary calcite, the fluid evolution sequence of the pre-salt reservoirs in the Majiagou Formation was analyzed in this study.
Generally, two-phase liquid–vapor aqueous inclusions represent the activity of inorganic fluids in the strata, and hydrocarbon inclusions represent the activity of organic fluids in the strata [37,38,39,40]. According to the petrography and laser Raman spectroscopy test of the fluid inclusions, two-phase liquid–vapor aqueous inclusions are developed in all types of secondary calcite, indicating the existence of four stages of inorganic paleofluid activity. However, liquid oil inclusions only develop in the dissolution pore-filling calcite, and CH4-containing aqueous inclusions and pure CH4 inclusions only develop in fracture-filling calcite. This indicates the existence of two stages of organic fluid activity.
According to previous studies on the diagenetic sequence of the Majiagou Formation in the Ordos Basin [41,42,43], the secondary calcite of the Majiagou Formation developed during the burial stage of the strata, during which the temperature at this stage increased over time. Primary fluid inclusions in the minerals were formed simultaneously with the mineral [44,45], so the homogenization temperature of the primary two-phase liquid–vapor aqueous inclusions in the minerals can indicate the temperature when the minerals formed [45,46]. The homogenization temperatures of two-phase liquid–vapor aqueous inclusions in the early gypsum-moldic pore-filling calcite, dissolution pore-filling calcite, late gypsum-moldic pore-filling calcite and fracture-filling calcite are mainly distributed between 110 and 130 °C, 140 and 160 °C, 160 and 180 °C and 180 and 200 °C, respectively, indicating that the formation temperature gradually increased and the formation time became later. Thus, it can be concluded that these four types of cements sequentially represent four different stages of inorganic fluid activity. In addition, two stages of organic fluid activity are symbiotic with the second and fourth stages of inorganic fluid activity, respectively (Figure 7).
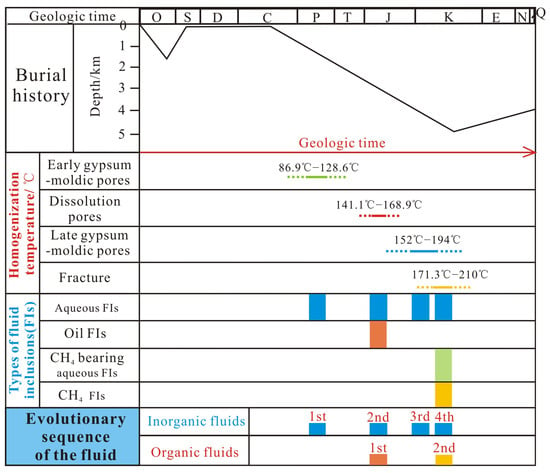
Figure 7.
The evolutionary sequence of the fluid and the periods of fluid inclusions in the Majiagou Formation (the burial history was modified after [41]).
5.2. Genesis of the Fluid
The carbon and oxygen isotopes of the secondary calcite and the salinity of fluid inclusion can be used to analyze the source and genesis of paleofluids [47,48,49,50,51,52]. The average salinity of the two-phase liquid–vapor aqueous inclusions in the early gypsum-moldic pore-filling calcite is 6.57%, which is slightly greater than the salinity of the Ordovician seawater (3.5%) [53,54], indicating that the fluid should be derived from the Ordovician seawater, slightly altered by the diagenesis in the later period. The average salinity of two-phase liquid–vapor aqueous inclusions in the dissolution pore-filling calcite is 21.7%, where a small number of oil inclusions also develop. It is speculated that the fluids should be derived from the acidic fluid associated with hydrocarbon generation. The average salinity of the two-phase liquid–vapor aqueous inclusions in the late gypsum-moldic pore-filling calcite is 21.4%, which is a high-salinity fluid. Moreover, the calcite is developed in relatively isolated pores, indicating that the fluids may be derived from the deep closed environment [49]. The average salinity of the two-phase liquid–vapor aqueous inclusions in the fracture-filling calcite is 7.62%, indicating that the fluids may be derived from low-salinity fluids along the fractures (Figure 8a).
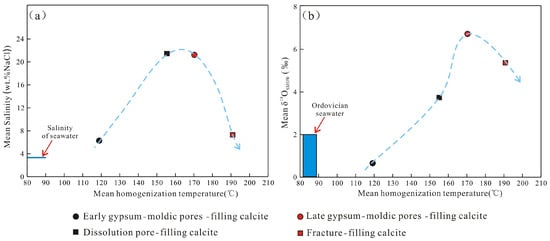
Figure 8.
(a): Cross-plot of the salinity vs. homogenization temperature. (b): Cross-plot of the oxygen isotopes vs. homogenization temperature (the δ18OSMOW of the Ordovician seawater was modified after [54]).
Carbon isotopes can hardly be fractionated during the crystallization and precipitation of the calcite [55], and calcite δ13C can be used to represent the carbon isotope value of the fluids. The average carbon isotope values of the early gypsum-moldic pore-filling calcite, dissolution pore-filling calcite and fracture-filling calcite are −3.34‰, −3.06‰ and −4.10‰, respectively. These values are relatively lower than the average carbon isotope value of the host rock (−1.18‰), indicating that the fluids in these three stages were diagenetic fluids slightly altered by organic fluids. However, the average 13C of the late gypsum-moldic pore-filling calcite is −20.77‰, which is significantly lower than that of the host rock. This suggests that the fluids may have derived from the degradation of deep organic acid salts or thermochemical sulfate reduction [56].
Oxygen isotopes can undergo significant fractionation during the precipitation of the calcite, resulting in significant differences in δ18O between the crystallized calcite and the fluids [57]. The homogeneous temperature of the two-phase liquid–vapor aqueous inclusions was used as the calcite crystallization temperature in this study. The oxygen isotope of the fluid was calculated based on the δ18O of the calcite and the homogenization temperature of the two-phase liquid–vapor aqueous inclusions by using the oxygen isotope balance equation of the CaCO3-H2O system proposed by Friedman and O’Neil [57], where δ18OPDB and δ18OSMOW are converted using the conversion formula given by Coplen [58] The calculation results are shown in Table 3 and Figure 8b. The results show that the δ18OSMOW of the fluid for the early gypsum-moldic pore-filling calcite is 0.67‰, which is consistent with the δ18OSMOW of the Ordovician seawater (−2.0‰ to +0.5‰) [53,54], indicating that the fluids are derived from the seawater retained in the strata. For the dissolution pore-filling calcite, late gypsum-moldic pore-filling calcite and fracture-filling calcite, the fluid δ18OSMOW during precipitation are 3.74‰, 6.81‰ and 5.74‰, respectively, indicating that the fluids were significantly altered by diagenesis [59] and had a significantly higher δ18OSMOW than the seawater.

Table 3.
The calculation results of the oxygen isotope of the fluid in the Majiagou Formation.
To summarize, the fluids in the first stage were derived from the Ordovician seawater weakly altered by diagenesis. The second stage of fluids originated from acidic diagenetic fluid. Moving to stage three, the fluids were considered to be associated with the degradation of organic acid salts or thermochemical sulfate reduction within a deep and closed environment. Finally, the fluids related to the low-salinity fluids that migrated along the fractures.
5.3. Timing Constraint and Paleopressure of Fluids
5.3.1. Timing Constraint of Fluid Evolution
The homogenization temperatures of inclusions combined with burial history are used to determine the age of fluid activity events [60,61]. In this study, the main ranges of homogenization temperature of two-phase liquid–vapor aqueous inclusions on different types of secondary calcites represent the temperature of the fluid evolution. The temperature of the fluid evolution in the first, second, third and fourth stages was 110–130 °C, 140–160 °C, 160–180 °C and 180–200 °C, respectively. By projecting the temperatures of these four stages of fluid evolution on the burial history and geothermal history in the study area [62], the approximate times of fluid activity for the first, second, third and fourth stage were obtained to be 228–222 Ma, 215–185 Ma, 185–130 Ma and 130–97 Ma, respectively (Figure 9).
5.3.2. Paleopressure of Fluid
The study of paleopressure is critical to understanding the evolution of paleofluids [63]. The homogenization temperature and salinity of two-phase liquid–vapor aqueous inclusions in calcites were used to obtain the paleopressure of fluid evolution in this paper. According to the isovolumetric formula of two-phase liquid–vapor aqueous inclusions from literatures [64,65], the capture pressure of two-phase liquid–vapor aqueous inclusions was calculated. While the capture temperature of two-phase liquid–vapor aqueous inclusions can be calculated according to the formula of capture temperature and homogenization temperature proposed by Ge Yunjin [66] and Zhang Nai [67]. Since the Majiagou Formation is carbonate strata, the H2O-CaCl2 system was used for the paleopressure calculation. The homogenization temperature and salinity are determined by the average values of the two-phase liquid–vapor aqueous inclusions in the early gypsum-moldic pore-filling calcite, late gypsum-moldic pore-filling calcite, dissolution pore-filling calcite and fracture-filling calcite. According to this method, the capture pressure is calculated as the paleofluid pressure during the four stages of the fluid evolution.
Combined with the research results of the paleogeothermal gradient in the Ordos Basin [62], the land surface temperature was 20 °C, and the geothermal gradients during the four stages of paleofluid evolution were 30 ± 2 °C/km, 35 ± 2 °C/km, 40 ± 2 °C/km and 40 ± 2 °C/km, respectively. Then, the paleopressure coefficient was calculated (Table 4). The results show that the fluid pressure coefficient in the first stage was 0.97 ± 0.1, reflecting the normal pressure environment. In the second and third stages, the fluid pressure coefficients were 1.24 ± 0.1 and 1.42 ± 0.1, indicating a continuous increase in pore-fluid pressure, with the third stage fluids developing in a significantly overpressured environment. The fluid pressure coefficient in the fourth stage was 1.28 ± 0.1, suggesting a decrease in paleopressure, likely due to the development of faults and fissures that released the overpressure in the deep strata.

Table 4.
The calculation results of the paleofluid pressure coefficient in the Majiagou Formation.
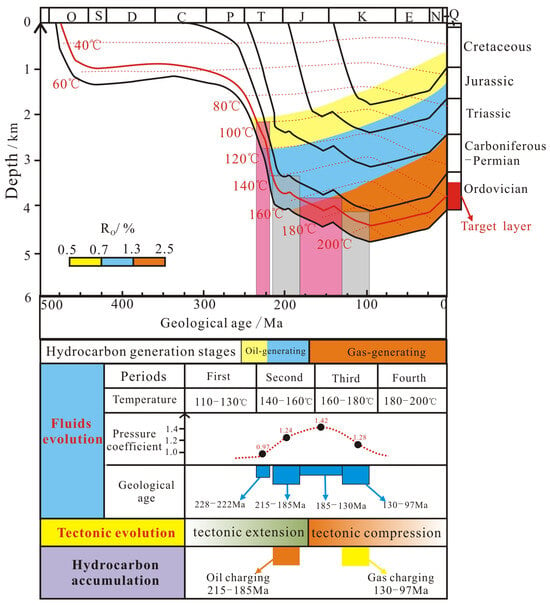
Figure 9.
The relationship between petroleum accumulation and fluid evolution in the Majiagou Formation (the burial history was modified after [68]).
Based on the combined analysis of timing and paleopressure results, it is concluded that the approximate time of the first fluid activity occurred during 228–222 Ma, when the strata depth was shallow and the environment was normal pressure. With the burial depth increased, the formation pressure coefficient continuously increased during the fluid evolution in the second and third stages, resulting in a closed environment with overpressure. By the fourth stage of fluid flows, the overpressure system in the deep basin was disrupted due to the development of faults and fractures, relieving the strata pressure at around 130–97 Ma.
5.4. Relationships Between Fluid Evolution and Petroleum Accumulation
Previous studies suggest that information on the petroleum accumulation period and time can be obtained by projecting the homogenization temperature of two-phase liquid–vapor aqueous inclusions coexisting with oil and gas inclusions in the graph of the basin burial history and geothermal history [68]. The development of a small amount of liquid oil inclusions in the dissolution pore-filling calcite represents a liquid oil accumulation event. In this study, the concentrated homogenization temperature between 140 and 160 °C for the two-phase liquid–vapor aqueous inclusions in the dissolution pore-filling calcite represents the temperature of liquid petroleum accumulation. When projected onto the graph of burial history and geothermal history in the study area, the results indicate that the rough time of the liquid oil accumulation is 215–170 Ma. This is consistent with the period from the late Triassic to early Jurassic in the tectonic extension stage (Figure 9). Additionally, the presence of numerous CH4 inclusions and CH4-bearing aqueous inclusions developed in the fracture-filling calcites represents a gas accumulation event. The concentrated homogenization temperature of the two-phase liquid–vapor aqueous inclusions developed in the fracture-filling calcites is 180–200 °C. When this is projected onto the graph of the burial history and geothermal history, the results indicate that the rough time of the gas accumulation is 130–97 Ma. This corresponds to the early Cretaceous in the tectonic compression stage (Figure 9).
6. Conclusions
- (1)
- The secondary calcite of the Majiagou Formation was divided into four categories, including early gypsum-moldic pore-filling calcite, late gypsum-moldic pore-filling calcite, dissolution pore-filling calcite and fracture-filling calcite.
- (2)
- There are four stages of fluid activity: the fluids in the first stage were derived from Ordovician seawater, weakly altered by diagenesis; the fluids in the second stage were derived from acidic diagenetic fluid associated with hydrocarbon generation; the fluids in the third stage were derived from the diagenetic fluid formed by the degradation of organic acid salts or thermochemical sulfate reduction; the fourth stage of fluids should be derived from the low-salinity fluids.
- (3)
- The approximate time of the first fluid activity with a normal formation pressure is at 228–222 Ma. Subsequently, the formation pressure was continuously increased during the fluid evolution in the second and third stages, resulting in the Majiagou Formation becoming a closed environment with overpressure. In the fourth stage of fluid, the overpressure system was disrupted due to the development of faults and fractures at 130–97 Ma.
- (4)
- There are two stages of petroleum accumulation. In the period from the late Triassic to early Jurassic in the tectonic extension stage, there was small-scale liquid oil accumulation at 215–185 Ma, corresponding to the second fluid activity. In the early Cretaceous in the tectonic compression stage, there was large-scale gas accumulation at 130–97 Ma, corresponding to the fourth fluid activity. This indicates that faults may be the main gas migration pathway in the Ordovician pre-salt reservoirs.
Author Contributions
Conceptualization, X.W.; methodology, X.W. and L.C.; software, D.W.; formal analysis, T.C.; investigation, X.W.; resources, P.W. and H.J.; data curation, J.C.; writing—original draft preparation, X.W.; writing—review and editing, H.H. and L.C.; supervision, L.C.; funding acquisition, X.W. All authors have read and agreed to the published version of the manuscript.
Funding
This work is supported by the Open Project Funds of Sinopec Key Laboratory of Petroleum Accumulation Mechanisms (33550007-22-ZC0613-0043), entitled “Study on the influence of thermochemical sulfate reduction of middle and lower Majiagou Formation on reservoirs in Ordos Basin”, the Natural Science Basic Research Program of Shaanxi (Program No. 2021JQ-229) and the Fundamental Research Funds for the Central Universities, Chang’an University (300102262903, 300102274902).
Data Availability Statement
The raw data supporting the conclusions of this article will be made available by the authors on request.
Acknowledgments
The authors are particularly grateful to Xinying Ren and Maosong Ye for their conscientious language polishing. And, I also thank the anonymous reviewers and editors for their professional advices and targeted questions of my paper.
Conflicts of Interest
The authors declare that this study received funding from the Open Project Funds of Sinopec Key Laboratory of Petroleum Accumulation Mechanisms. The funder was not involved in the study design, collection, analysis, interpretation of data, the writing of this article or the decision to submit it for publication. Tong Chen is an employee of Logging Company, PetroChina Greatwall Drilling Company. Dongxing Wang is an employee of the Geological Survey Academy of Inner Mongolia Autonomous Region. Junnian Chen is an employee of the Exploration & Development Research Institute of Liaohe Oilfield Company. This paper reflects the views of the scientists and not the company.
References
- Hao, F.; Zhang, Z.; Zou, H.; Zhang, Y.; Yang, Y. Origin and mechanism of the formation of the low-oil-saturation Moxizhuang field, Junggar Basin, China: Implication for petroleum exploration in basins having complex histories. AAPG Bull. 2011, 95, 983–1008. [Google Scholar] [CrossRef]
- Feng, J.L.; Cao, J.; Hu, K.; Peng, X.Q.; Chen, Y.; Wang, Y.F.; Wang, M. Dissolution and its impacts on reservoir formation in moderately to deeply buried strata of mixed siliciclastic–carbonate sediments, northwestern Qaidam Basin, northwest China. Mar. Pet. Geol. 2013, 39, 124–137. [Google Scholar] [CrossRef]
- Bagrintseva, K.I. Carbonate Reservoir Rocks; John Wiley & Sons: Hoboken, NJ, USA, 2015. [Google Scholar]
- Zhu, D.; Meng, Q.; Jin, Z.; Liu, Q.; Hu, W. Formation mechanism of deep Cambrian dolomite reservoirs in the Tarim basin, northwestern China. Mar. Pet. Geol. 2015, 59, 232–244. [Google Scholar] [CrossRef]
- Abdelkhalek, W.; Khouni, R.; Gaidi, S.; Salem, A.B.; Melki, F.; Radwan, A.E. Relationship Between Fault Systems and Fracturing in Complex Fractured Carbonate Reservoir in the Tunisian Pelagian Block Using Integrated Seismic and Petrophysical Analysis: Implications for Petroleum Exploration and Development. Geol. J. 2025. [Google Scholar] [CrossRef]
- Hao, F.; Guo, T.; Zhu, Y.; Cai, X.; Zou, H.; Li, P. Evidence for multiple stages of oil cracking and thermochemical sulfate reduction in the Puguang gas field, Sichuan Basin, China. AAPG Bull. 2008, 92, 611–637. [Google Scholar] [CrossRef]
- Ohm, S.E.; Karlsen, D.A.; Austin, T.J.F. Geochemically driven exploration models in uplifted area: Examples from the Norwegian Barents Sea. AAPG Bull. 2008, 92, 1191–1223. [Google Scholar] [CrossRef]
- Maliva, R.G.; Missimer, T.M.; Clayton, E.A.; Dickson, J.A.D. Diagenesis and porosity preservation in Eocene microporous limestones, South Florida, USA. Sediment. Geol. 2009, 217, 85–94. [Google Scholar] [CrossRef]
- Huang, H.; Li, R.; Chen, W.; Chen, L.; Jiang, Z.; Xiong, F.; Guan, W.; Zhang, S.; Tian, B. Revisiting movable fluid space in tight fine-grained reservoirs: A case study from Shahejie shale in the Bohai Bay Basin, NE China. J. Pet. Sci. Eng. 2021, 207, 109170. [Google Scholar] [CrossRef]
- Guo, Y.; Fu, J.; Wei, X.; Xu, W.; Sun, L.; Liu, J.; Zhao, Z.; Zhang, Y.; Gao, J.; Zhang, Y. Natural gas accumulation and models in Ordovician carbonates, Ordos Basin, NW China. Pet. Explor. Dev. 2014, 41, 437–448. [Google Scholar] [CrossRef]
- Xu, W.; Li, J.; Liu, X.; Li, N.; Zhang, C.; Zhang, Y.; Fu, L.; Bai, Y.; Huang, Z.; Gao, J.; et al. Accumulation conditions and exploration directions of Ordovician lower assemblage natural gas, Ordos Basin, NW China. Pet. Explor. Dev. 2021, 48, 641–654. [Google Scholar] [CrossRef]
- Huang, H.; Li, R.; Lyu, Z.; Cheng, Y.; Zhao, B.; Jiang, Z.; Zhang, Y.; Xiong, F. Comparative study of methane adsorption of Middle-Upper Ordovician marine shales in the western Ordos Basin, NW China: Insights into impacts of moisture on thermodynamics and kinetics of adsorption. Chem. Eng. J. 2022, 446, 137411. [Google Scholar] [CrossRef]
- Feng, Z.Z.; Zhang, Y.S.; Jin, Z.K. Type, origin, and reservoir characteristics of dolostones of the Ordovician Majiagou Group, Ordos, North China Platform. Sediment. Geol. 1998, 118, 127–140. [Google Scholar] [CrossRef]
- Chen, A.; Yang, S.; Xu, S.; Ogg, J.; Chen, H.; Zhong, Y. Sedimentary model of marine evaporites and implications for potash deposits exploration in China. Carbonates Evaporites 2019, 34, 83–99. [Google Scholar] [CrossRef]
- Liu, Q.; Chen, M.; Liu, W.; Li, J.; Han, P.; Guo, Y. Origin of natural gas from the Ordovician paleo-weathering crust and gas-filling model in Jingbian gas field, Ordos Basin, China. J. Asian Earth Sci. 2009, 35, 74–88. [Google Scholar] [CrossRef]
- Li, W.; Tu, J.; Zhang, J.; Zhang, B. Accumulation and potential analysis of self-sourced natural gas in the Majiagou Formation of Ordos Basin, NW China. Pet. Explor. Dev. 2017, 44, 552–562. [Google Scholar] [CrossRef]
- Wang, K.; Pang, X.; Zhao, Z.; Wang, S.; Hu, T.; Zhang, K.; Zheng, T. Geochemical characteristics and origin of natural gas in southern Jingbian gas field, Ordos Basin, China. J. Nat. Gas Sci. Eng. 2017, 46, 515–525. [Google Scholar] [CrossRef]
- Han, W.; Chang, X.; Tao, S.; Hou, L.; Ma, W.; Yao, J.; Meng, S. Geochemical characteristics and genesis of pre-salt gases in the Ordos Basin, China. J. Pet. Sci. Eng. 2019, 179, 92–103. [Google Scholar] [CrossRef]
- Han, W.; Ma, W.; Tao, S.; Huang, S.; Hou, L.; Yao, J. Carbon Isotope reversal and its relationship with natural gas origins in the Jingbian gas field, Ordos Basin, China. Int. J. Coal Geol. 2018, 196, 260–273. [Google Scholar] [CrossRef]
- Han, W.; Tao, S.; Hou, L.; Yao, J. Geochemical characteristics and genesis of oil-derived gas in the Jingbian gas field, Ordos Basin, China. Eng. Fuel. 2017, 31, 10432–10441. [Google Scholar] [CrossRef]
- Yu, W.; Wang, F.; Gong, L.; Wang, G.; Tian, J.; Ma, Z. Sedimentary environment characteristics and tectonic implications of Yanghugou Formation in the western margin of Ordos Basin. China. J. Chengdu Univ. Technol. (Sci. Technol. Ed.) 2021, 48, 691–704, (In Chinese with English Abstract). [Google Scholar]
- Lai, J.; Wang, S.; Wang, G.; Shi, Y.; Zhao, T.; Pang, X.; Fan, X.; Qin, Z.; Fan, X. Pore structure and fractal characteristics of Ordovician Majiagou carbonate reservoirs in Ordos basin, China. AAPG Bull. 2019, 103, 2573–2596. [Google Scholar] [CrossRef]
- Chen, A.; Xu, S.; Yang, S.; Chen, H.; Su, Z.; Zhong, Y.; Hu, S. Ordovician deep dolomite reservoirs in the intracratonic Ordos Basin, China: Depositional model and Diagenetic evolution. Energy Explor. Exploit. 2018, 36, 850–871. [Google Scholar] [CrossRef]
- Fu, S.Y.; Zhang, C.G.; Chen, H.D.; Chen, A.Q.; Zhao, J.X.; Su, Z.T.; Yang, S.; Wang, G.; Mi, W.T. Characteristics, formation and evolution of pre-salt dolomite reservoirs in the fifth member of the Majiagou Formation, mid-east Ordos Basin, NW China. Pet. Explor. Dev. 2019, 46, 1153–1164. [Google Scholar] [CrossRef]
- Ronchi, P.; Ortenzi, A.; Borromeo, O.; Claps, M.; Zempolich, W.G. Depositional setting and diagenetic processes and their impact on the reservoir quality in the late Visean–Bashkirian Kashagan carbonate platform (Pre-Caspian Basin, Kazakhstan). AAPG Bull. 2010, 94, 1313–1348. [Google Scholar] [CrossRef]
- Paganoni, M.; Al Harthi, A.; Morad, D.; Morad, S.; Ceriani, A.; Mansurbeg, H.; Al Suwaidi, A.; Al-Aasm, I.; Ehrenberg, S.N.; Sirat, M. Impact of stylolitization on diagenesis of a Lower Cretaceous carbonate reservoir from a giant oilfield, Abu Dhabi, United Arab Emirates. Sediment. Geol. 2016, 335, 70–92. [Google Scholar] [CrossRef]
- Khitab, U.; Umar, M.; Jamil, M. Microfacies, diagenesis and hydrocarbon potential of Eocene carbonate strata in Pakistan. Carbonates Evaporites 2020, 35, 70. [Google Scholar] [CrossRef]
- Rahim, H.U.; Ahmad, W.; Jamil, M.; Khalil, R. Sedimentary facies, diagenetic analysis, and sequence stratigraphic control on reservoir evaluation of eocene sakesar limestone, upper indus basin, NW himalayas. Carbonates Evaporites 2024, 39, 15. [Google Scholar] [CrossRef]
- Liu, Q.; Jin, Z.; Meng, Q.; Wu, X.; Jia, H. Genetic types of natural gas and filling patterns in Daniudi gas field, Ordos Basin, China. J. Asian Earth Sci. 2015, 107, 1–11. [Google Scholar] [CrossRef]
- Wu, X.; Ni, C.; Chen, Y.; Zhu, J.; Li, K.; Zeng, H. Source of the Upper Paleozoic natural gas in the Dingbei area, Ordos Basin, China. J. Nat. Gas Geosci. 2019, 4, 183–190. [Google Scholar] [CrossRef]
- Yang, Y.; Li, W.; Ma, L. Tectonic and stratigraphic controls of hydrocarbon systems in the Ordos basin: A multicycle cratonic basin in central China. AAPG Bull. 2005, 89, 255–269. [Google Scholar] [CrossRef]
- Xi, S.; Xiong, Y.; Liu, X.; Lei, J.; Liu, M.; Liu, L.; Liu, Y.; Wen, H.; Tan, X. Sedimentary environment and sea level change of the subsalt interval of member 5 of Majiagou Formation in Central Ordos Basin. J. Palaeogeogr. 2017, 19, 773–790, (In Chinese with English Abstract). [Google Scholar]
- Zhang, B.; Zhang, J.; Zhao, H.; Nie, F.; Wang, Y.; Zhang, Y. Tectonic evolution of the western Ordos Basin during the Palaezoic-Mesozoic times as constrained by detrital zircon ages. Int. Geol. Rev. 2018, 61, 461–480. [Google Scholar] [CrossRef]
- Bodnar, R.J. Revised equation and table for determining the freezing point depression of H2O-NaCl solutions. Geochim. Cosmochim. Acta 1993, 57, 683–684. [Google Scholar] [CrossRef]
- Li, R.; Chen, L.; Li, Y.; Song, N. The thermal history reconstruction and hydrocarbon accumulation period discrimination of Gaoyou depression in Subei Basin. Earth Sci. Front. 2010, 17, 151–159. [Google Scholar]
- Huang, Y.; He, S.; Guo, X.; Wu, Z.; Zhai, G.; Huang, Z.; Zhang, M.; Xiao, Q. Pressure–temperature–time–composition (P–T–t–x) of paleo–fluid in Permian organic–rich shale of Lower Yangtze Platform, China: Insights from fluid inclusions in fracture cements. Mar. Pet. Geol. 2021, 126, 104936. [Google Scholar] [CrossRef]
- Bourdet, J.; Pironon, J.; Levresse, G.; Tritlla, J. Petroleum accumulation and leakage in a deeply buried carbonate reservoir, Níspero field (Mexico). Mar. Pet. Geol. 2010, 27, 126–142. [Google Scholar] [CrossRef]
- Xiong, J.; Liu, X.; Liang, L. Adsorption model of shale to CH4 based on adsorption potential theory and its application. J. Chengdu Univ. Technol. Nat. Sci. Ed. 2014, 41, 604–611, (In Chinese with English Abstract). [Google Scholar]
- Dai, J.; Ni, Y.; Qin, S.; Huang, S. Geochemical characteristics of ultra-deep natural gas in the Sichuan Basin, SW China. Explor. Dev. 2018, 45, 619–628. [Google Scholar] [CrossRef]
- Su, A.; Chen, H.; Feng, Y.X.; Zhao, J.X.; Wang, Z. Paleo fluid system change from deep burial to exhumation of the Precambrian petroleum reservoirs in the Sichuan Basin, China: Evidence from PTX records. Mar. Pet. Geol. 2023, 155, 106404. [Google Scholar] [CrossRef]
- Lei, H.; Huang, W.; Yin, S.; Wang, Y. Dissolution characteristics of deep buried dolostone in the member 5 of Majiagou Formation in southern Ordos Basin. J. Palaeogeogr. 2020, 22, 1041–1052, (In Chinese with English Abstract). [Google Scholar]
- Liu, M.; Xiong, Y.; Xiong, C.; Liu, Y.; Liu, L.; Xiao, D.; Tan, X. Evolution of diagenetic system and its controls on the reservoir quality of pre-salt dolostone: The case of the Lower Majiagou Formation in the central Ordos Basin, China. Mar. Pet. Geol. 2020, 122, 104674. [Google Scholar] [CrossRef]
- Xiong, Y.; Tan, X.; Dong, G.; Wang, L.; Ji, H.; Liu, Y.; Wen, C. Diagenetic differentiation in the Majiagou Formation, Ordos Basin, China: Facies, geochemical and reservoir heterogeneity constraints. J. Pet. Sci. Eng. 2020, 191, 107179. [Google Scholar] [CrossRef]
- Roedder, E. Volume 12: Fluid inclusions. Rev. Mineral. 1984, 12, 644. [Google Scholar]
- Goldstein, R.H.; Reynolds, T.J. Systematics of Fluid Inclusions in Diagenetic Minerals: SEPM Short Course 31. Soc. Sediment. Geol. 1994, 31, 188. [Google Scholar]
- Goldstein, R.H. Fluid inclusions in sedimentary and diagenetic systems. Lithos 2001, 55, 159–193. [Google Scholar] [CrossRef]
- Irwin, H.; Curtis, C.; Coleman, M. Isotopic evidence for source of diagenetic carbonates formed during buried of organic-rich sediments. Nature 1977, 269, 64–78. [Google Scholar] [CrossRef]
- Bjørlykke, K.; Gran, K. Salinity variations in North Sea formation waters: Implications for large-scale fluid movements. Mar. Pet. Geol. 1994, 11, 5–9. [Google Scholar] [CrossRef]
- Bjørlykke, K.; Jahren, J. Open or closed geochemical systems during diagenesis in sedimentary basins: Constraints on mass transfer during diagenesis and the prediction of porosity in sandstone and carbonate reservoirs. AAPG Bull. 2012, 96, 2193–2214. [Google Scholar] [CrossRef]
- Sharp, Z. Principles of Stable Isotope Geochemistry; Pearson Prentice Hall: Upper Saddle River, NJ, USA, 2007. [Google Scholar]
- Brand, U.; Jiang, G.; Azmy, K.; Bishop, J.; Montañez, I.P. Diagenetic evaluation of a Pennsylvanian carbonate succession (Bird Spring Formation, Arrow Canyon, Nevada, USA)—1: Brachiopod and whole rock comparison. Chem. Geol. 2012, 308, 26–39. [Google Scholar] [CrossRef]
- Schobben, M.; Ullmann, V.; Leda, L.; Korn, D.; Struck, U.; Reimold, W.U.; Ghaderi, A.; Algeo, T.J.; Korte, C. Discerning primary versus diagenetic signals in carbonate carbon and oxygen isotope records: An example from the Permian–Triassic boundary of Iran. Chem. Geol. 2016, 422, 94–107. [Google Scholar] [CrossRef]
- Trotter, J.A.; Williams, I.S.; Barnes, C.R.; Lécuyer, C.; Nicoll, R.S. Did cooling oceans trigger Ordovician biodiversification? Evidence from conodont thermometry. Science 2008, 321, 550–554. [Google Scholar] [CrossRef]
- Veizer, J.; Ala, D.; Azmy, K.; Bruckschen, P.; Buhl, D.; Bruhn, F.; Carden, G.A.; Diener, A.; Ebneth, S.; Godderis, Y.; et al. 87Sr/86Sr, δ13C and δ18O evolution of Phanerozoic seawater. Chem. Geol. 1999, 161, 59–88. [Google Scholar] [CrossRef]
- Bottinga, Y. Calculated fractionation factors for carbon and hydrogen isotope exchange in the system calcite-carbon dioxide-graphite-methane-hydrogen-water vapor. Geochim. Cosmochim. Acta 1969, 33, 49–64. [Google Scholar] [CrossRef]
- Jiang, L.; Worden, R.H.; Cai, C. Generation of isotopically and compositionally distinct water during thermochemical sulfate reduction (TSR) in carbonate reservoirs:Triassic Feixianguan Formation, Sichuan Basin, China. Geochim. Cosmochim. Acta 2015, 165, 249–262. [Google Scholar] [CrossRef]
- Friedman, I.; O’Neil, J.R. Compilation of stable isotope fractionation factors of geochemical interest. Surv. Prof. Pap. K. 1977, 440, 12. [Google Scholar]
- Coplen, T.B.; Kendall, C.; Hopple, J. Comparison of stable isotope reference samples. Nature 1983, 302, 236–238. [Google Scholar] [CrossRef]
- Lima, B.E.M.; Tedeschi, L.R.; Pestilho, A.L.S.; Santos, R.V.; Vazquez, J.C.; Guzzo, J.V.P.; De Ros, L.F. Deep-burial hydrothermal alteration of the Pre-Salt carbonate reservoirs from northern Campos Basin, offshore Brazil: Evidence from petrography, fluid inclusions, Sr, C and O isotopes. Mar. Pet. Geol. 2020, 113, 104143. [Google Scholar] [CrossRef]
- Guo, X.; Chen, J.; Yuan, S. Constraint of in-situ calcite U-Pb dating by laser ablation on geochronology of hydrocarbon accumulation in petroliferous basins: A case study of Dongying sag in the Bohai Bay Basin. Acta Pet. Sin. 2020, 41, 284–291. [Google Scholar]
- Guo, X.; Liu, K.; Jia, C.; Song, Y.; Zhao, M.; Lu, X. Effects of early petroleum charge and overpressure on reservoir porosity preservation in the giant Kela-2 gas field, Kuqa depression, Tarim Basin, northwest China. AAPG Bull. 2016, 100, 191–212. [Google Scholar] [CrossRef]
- Ren, Z.; Zhang, S.; Gao, S.; Cui, J.; Xiao, Y.; Xiao, H. Tectonic thermal history and its significance on the formation of oil and gas accumulation and mineral deposit in Ordos Basin. Sci. China Ser. D Earth Sci. 2007, 50, 27–38. [Google Scholar] [CrossRef]
- English, J.M.; Finkbeiner, T.; English, K.L.; Cherif, R.Y. State of stress in exhumed basins and implications for fluid flow: Insights from the Illizi Basin, Algeria. Geol. Soc. Lond. Spec. Publ. 2017, 458, 89–112. [Google Scholar] [CrossRef]
- Zhang, Y.; Frantz, J. Determination of the Homogenization Temperature and Densities of Supercritical Fluids in the System NaCl-KCl-CaCl-H2O Using Synthetic Fluid inclusions. Chem. Geol. 1987, 64, 335–350. [Google Scholar] [CrossRef]
- Steele-MacInnis, M.; Lecumberri-Sanchez, P.; Bodnar, R.J. HokieFlincs_H2O-NaCl: A Microsoft Excel spreadsheet for interpreting microthermometric data from fluid inclusions based on the PVTX properties of H2O–NaCl. Comput. Geosci. 2012, 49, 334–337. [Google Scholar] [CrossRef]
- Ge, Y. Trapping Mechanism of Hydrocabon Inclusion in Carbonate and Its Response to Hydrocarbon Accumulation. Ph.D. Thesis, China University of Petroleum, Qingdao, China, 2010. (In Chinese with English Abstract). [Google Scholar]
- Zhang, N. Analysis Technology and Application of Fluid Inclusions in Petroliferous Basins; Petroleum Industry Press: Beijing, China, 2016; (In Chinese with English Abstract). [Google Scholar]
- Huang, Z.; Ren, Z.; Chen, Y.; Zheng, Q. The geochem ical characteristics and thermal evolution of Ordovician source rocks in the north of Tianhuan depression, Ordos basin. Acta Geol. Sin. 2022, 96, 3967–3976, (In Chinese with English Abstract). [Google Scholar]
Disclaimer/Publisher’s Note: The statements, opinions and data contained in all publications are solely those of the individual author(s) and contributor(s) and not of MDPI and/or the editor(s). MDPI and/or the editor(s) disclaim responsibility for any injury to people or property resulting from any ideas, methods, instructions or products referred to in the content. |
© 2025 by the authors. Licensee MDPI, Basel, Switzerland. This article is an open access article distributed under the terms and conditions of the Creative Commons Attribution (CC BY) license (https://creativecommons.org/licenses/by/4.0/).