Article

Traces of Cadmium Modulate the Morphology of Silver Crystals Produced from the Controlled Cooling of a Primary Lead Melt

by
Steven King
1,2,
Alberto Striolo
1,3,*,
Paul F. Wilson
4,
Geoff West
4,
Mark A. Williams
4 and
Michael Piller
5
1
Department of Chemical Engineering, University College London, Torrington Place, London WC1E 7JE, UK
2
Britannia Refined Metals, Botany Rd, Northfleet, Kent DA11 9BG, UK
3
School of Sustainable Chemical, Biological and Materials Engineering, University of Oklahoma, Norman, OK 73019, USA
4
International Manufacturing Centre, WMG, University of Warwick, Coventry CV4 7AL, UK
5
Research Centre Pharmaceutical Engineering GmbH, Inffeldgasse 13, 8010 Graz, Austria
*
Author to whom correspondence should be addressed.
Minerals 2025, 15(8), 853; https://doi.org/10.3390/min15080853
Submission received: 4 June 2025 / Revised: 4 August 2025 / Accepted: 4 August 2025 / Published: 12 August 2025

Abstract

This work probes the possibility of controlling the morphology of silver crystals through inoculation of trace-level metallic species, building on an industrial-scale cooling process. The obtained crystals are analyzed via X-ray tomography (XRT), dynamic picture analysis, and scanning electron microscopy (SEM). The results reveal assemblages composed of octahedral crystals and triangular platelets. X-ray tomography yields pore size distributions that correlate with Ag% composition. Out of several trace metals tested, cadmium was found to yield a greater number of octahedral morphologies with pronounced twinning, contributing to a fibrous structure. This behavior is consistent with the energetic preference of cadmium atoms to integrate on Ag (111) planes and the limitation of twinning to the (111) planes in FCC metals. Faceting of the interiors of the triangular facets of octahedral crystals is noted in all SEM images of acid-washed samples. These physical features are interpreted as a product of crystal growth and not selective acid etching. The generation of octahedral silver crystals from a molten melt and the presence of faceting are research firsts, such crystal morphologies being previously generated only from aqueous chemical reduction systems. Adding traces of cadmium to primary lead melts is promising for producing silver nanocrystals with desired morphologies.

1. Introduction

As a noble metal, silver resists many corrosive environments and possesses sufficient strength for structural applications [1]. Because of these properties, in addition to a strong demand as a coinage and investment metal, silver finds widespread use in industrial applications [2], which accounted for 45% of silver metal sales in 2022. Within this timeframe, direct investment sales were responsible for 28% of silver metal, and jewelry/silverware accounted for 26%. In 2022, 27.9% of silver produced was from primary silver mining, but most silver is characteristically recovered in association with other metals; explicitly, in 2022, silver production associated with lead/zinc mining was responsible for 30.7% of global production, copper mining 25.3%, and gold mining 15.1%.
Purity at >99% is required in industrial-scale silver production. As an illustration, the presence of only 100 ppm Bi increases the resistivity by 2.6% compared to the zero impurity case [1]. Considering recent applications, the antimicrobial effects of Ag nanocrystals progressed to commercial products in drug delivery and anti-bacterial use [3] with Ag nanoparticle sizes of 10–200 with a reported mean of 15 nm. Hence, there has been emphasis on precisely controlling Ag nanocrystal size and morphology, which enables tuning of optical properties, with Ag nanoparticle sizes of 40–100 nm and cubic, icosahedral, octahedral, and decahedral morphologies being examined [4,5]. As another example, controlling size (0.7–25 nm) and morphology (spherical and triangular crystals) of Ag nanoparticles is essential for delivering efficient and selective catalysts [6,7,8,9,10,11].
One common aspect of the approaches developed for the controlled fabrication of Ag nanocrystals is the need for extensive series of applied chemical and physical steps [11]. In this landscape, it would be advantageous to develop a molten synthesis approach to generate Ag nanoparticles/nanocrystals with controlled morphologies, as such an approach promises to be simpler and cheaper than the currently available alternatives.
This is the purpose of the present work, in which, as a first step, an industrial-scale process is leveraged to produce Ag particles of >100 microns in size. It is possible that nanoparticles are also produced, but recovering those from industrial-scale silver/lead melts is unlikely via the current approaches.
The production of silver nanoparticles by chemical or electrolytic reduction has been well explored in aqueous systems, leading to nanocrystals with controlled morphology presenting a range of physical, chemical, and optical properties [12,13,14]. The use of specific chemical additives enables the promotion of crystal growth along some well-defined crystal planes; of interest, the technology was originally developed in the electroplating industry to enable lamellar deposition under increased current densities [15,16,17]. However, commercial silver production occurs predominantly in large-scale systems, where silver is produced as the side product of, e.g., lead processing. While it would be desirable to generate large quantities of silver nanocrystalline products with controlled physical properties during the commercial production of silver from primary lead melts, without requiring post-processing operations, the system conditions, and in particular the high temperature and large-scale of the operations, have rendered the exploration of such systems problematic. Nevertheless, recently introduced changes in the industrial-scale refining of silver [18] enable the controlled cooling of lead/silver melts [19]. It was demonstrated that, starting from a 90:10 lead/silver melt, a heterogeneous variety of dendritic to acicular silver crystals with face-centered cubic crystalline lattice was produced.
Once the crystal structures are obtained, an additional hurdle comes due to the difficulty of imaging crystals in metallic systems that contain lead, a material that shields X-rays. In prior work, it was demonstrated that X-ray tomography can be applied to characterize the silver crystals produced from the lead/silver melt. This outcome was made possible by several original developments, extensively discussed elsewhere [19] including the following:
  • Optimized stirring: The Ag crystals produced during cooling showed a sensitive response to the stirring rpm and the stirrer type and position.
  • Vacuum sample impregnation: The as-solidified Ag crystal structure was found to be very fragile and difficult to handle for subsequent X-ray imaging. The as-solidified Ag crystal structure was preserved by prompt lead drainage followed by impregnation with acrylic resin under vacuum to in-fill the open pore structure of the sample.
Building on those prior advancements and inspired by the literature on Ag crystal production from aqueous systems, the present study seeks to control Ag crystal morphology via trace amounts of inoculant species in the molten Pb-Ag system. Towards maintaining a face-centered cubic (FCC) silver structure, the inoculant species have similar atomic radii to silver and are expected to show affinity to Ag, judged from the liquidus maxima of the Ag species phase diagram [20]. Based on prior literature observations [21,22], the inoculant species considered are cadmium, magnesium, aluminum, and lithium. These metals were added to the molten system at 100 ppm concentration prior to crystallization. Only cadmium was effective at controlling the morphology of the silver crystals. This is consistent with literature observations showing a pronounced tendency for cadmium to accumulate on the (111) Ag planes. Such preferential accumulation leads to effective control of the silver crystal growth rate along specific crystallographic planes [23].

2. Experimental Methods

In Appendix A, a schematic is provided to illustrate the process flowsheet that includes the commercial-scale production of Ag crystals, the extraction and treatment of the samples, and the sequence of experimental characterization steps undertaken. The following text provides the necessary details.

2.1. Synthesis of Silver Crystals

The lead/silver alloy (90%–10% composition) was heated to 500 °C. The inoculating species were submerged and stirred into the molten bath. The alloy was then cooled from 500 °C to 400 °C at a cooling rate of approximately 1.85 °C per minute. The commencement of silver crystal formation was observed at 474 °C, with 50% of the original silver content being crystalized once the temperature reached 400 °C. Pb remains in a molten state in the entire temperature range sampled during the process, consistent with the phase diagram of the binary mixture [24,25]. Full details of the experimental procedure are described elsewhere [19].
The silver crystals, being of a lower density than liquid Pb, float to the melt surface. They were recovered by passive drainage of the liquid bullion. Cooling was interrupted at 400 °C to ensure the recovery of a sufficient silver crystal mass for subsequent examination. This temperature enables an acceptable level of passive drainage of the liquid lead, due to the low viscosity and low surface tension of the molten Pb at this temperature.
The effect of minor alloying additions was examined by generating a series of 500 kg alloys to which additives were added to a target 100 ppm concentration of the inoculating species in the melt. The alloying species were cadmium (Cd), aluminum (Al), lithium (Li), and magnesium (Mg). A benchmark control was also run, with no additive added. Concerns over oxidative losses of magnesium during bath addition in the first set of experiments prompted a second set of experiments in which a master Pb-Mg alloy was prepared at a Mg content and temperature that ensured cooling within a single-phase region of the Mg-Pb phase diagram to minimize loss of Mg. Four samples were recovered from two separate experimental runs from two different positions from the molten bath, which allows for the quantification of heterogeneity within the molten metal bath.
The drainage of the molten lead at the common end point temperature for crystallization will limit the variables that define the final Ag content to particle size and morphology. As we operate to a common cooling rate and common drainage practice, only the particle size and morphology will influence the final Ag% achieved. As such if the inoculant species influences the particle size and or morphology, we should expect a correlation between inoculant species and Ag%
The recovered mass consists of individual silver crystals weakly bonded by retained lead. The Ag crystals produced during cooling showed sensitivity to the stirring rpm and stirring type and position. These observations led us to identify a proprietary stirrer type and rpm that maximized Ag crystal size. To preserve the as-recovered crystal structure for subsequent imaging, silver crystal aggregates were stabilized in an acrylic resin under a vacuum to ensure complete infilling of the internal open pore spaces. In addition to the resin-encapsulated samples, crystal aggregate samples from each test run were also retained. Simple shaking of the crystal aggregates was found from previous work [19] to enable non-destructive separation of individual silver crystals for subsequent assay analysis and particle/shape characterization including particle size distribution (PSD) and aspect ratio.
The starting molten alloy composition was 10% Ag/90% Pb. The cooling, crystallization of Ag, and removal of molten Pb by drainage results in the increase in the Ag content of the recovered crystal samples to around 75%. While the drainage process was the same for all prepared samples, the silver crystal particle size and morphology change, and these parameters have a strong influence on the ability of drainage to remove the molten lead and thus define variations in the final Ag content of the samples. The system composition was tested by assay, described below. All samples studied in this work are listed in Table 1.

2.2. Assay of Impurities and Silver Content

Assaying of the silver content of the recovered crystals was performed by cupellation [26,27,28]. This method is the gold standard for determination of silver content, and it finds application in precious metals assaying over several centuries. Cupellation involves the furnace oxidation of a weighed sample of Ag crystals with the oxides of components other than noble metals being removed into a bone ash crucible. The resultant noble metal pellet is weighed to define the noble metal content (i.e., Ag content). It is expected that the generation of Ag crystals from a cooling lead/silver alloy in a commercial process will contain impurities, which might influence crystal morphology in both aqueous and molten systems. The metals chosen for assay in the recovered silver crystal samples were Ag and Pb, the primary components of the melt, initially at 10% and 90%, respectively. The industrially derived samples also contain impurities, which were confirmed by assay (As, Bi, Cu, Ni, Sb, Sn, and Zn). The inoculant species were also assayed to confirm solvation into the bath. However, no Al solvation was detected, and laboratory problems prevented the assay of Li. The major impurity species present, beside the trace metals added intentionally, are shown in Table 2. These data are from assays performed on bath samples extracted from the molten system at temperatures above crystallization, cooled, and drained of lead. This check on impurities constitutes a larger mass sample assay of the control or benchmark samples recovered in this study. The determination of the content of impurities as pre-existing species as detailed in Table 2 and those present as controlled inoculants was determined through ICP-OES (Induction-Coupled Plasma–Optical Emission Spectroscopy) on a nitric acid digest of Ag specimens.

2.3. XRT Characterization

In prior work [19], it was demonstrated that X-ray tomography could be used to investigate the properties of silver crystals, provided thin samples are sampled while supported by a resin. The procedure is implemented here. The instruments used in the present work for X-ray tomography characterization are more powerful than those we used previously. Care was needed in handling the metal samples. The as-solidified Ag crystal structure was found to be very fragile and difficult to handle for subsequent X-ray imaging. The preservation of the Ag crystal structure was achieved by prompt lead drainage of the recovered crystal mass followed by impregnation with acrylic resin under vacuum to in-fill the open pore structure of the sample. Then, the 3D morphologies were investigated using a Zeiss Metrotom 1500 (Carl Zeiss X-ray Microscopy Inc., Pleasanton, CA, USA) at the Centre for Imaging, Metrology, and Additive Technologies (CiMAT) at the University of Warwick. Each aggregate sample was scanned using the following settings: primarily an exposure voltage of 225 kV, an exposure power of 17.3 W, and an exposure time of 4 s. The X-ray beam was pre-filtered using 3 mm of copper while the source–detector distance (SDD) was static (1448 mm), with a final voxel size of 15 µm. A total of 3000 projections were collected, with no frame averaging. Each dataset was reconstructed individually using MetrotomOS (Carl Zeiss X-ray Microscopy Inc., Pleasanton, CA, USA), using a standard FDK algorithm [29].
Datasets, once collected for each material sample tested, were imported into Avizo version 2021.2 (Thermo Fisher Scientific, Waltham, MA, USA) image processing software [30] for image segmentation and label analysis. First, each sample was thresholded to remove the air space from the region of interest. This was achieved using the Interactive Thresholding module, a different threshold needing to be selected for each sample according to the overview provided in Table 3. Automated threshold methods did not produce an acceptable result. To select the air space within the sample, a Closing module using a 20 pm disc-shaped structuring element was applied to the crystal mesh, filling in the remaining space and not extending outside of the whole sample. This data was then used to extract information of sample volume fraction of both crystal and pore space phases. The label field for the crystal material was analyzed using the Thickness Map module, producing images of local thicknesses of the crystal masses within the sample. Finally, a random sample of 30 measurements of individual crystals from each sample was manually segmented from each volume to determine key crystal morphologies. This sample size was considered a compromise to achieve statistical significance with manageable time. A Label Analysis module was then applied to analyze the crystal shape, size, and volume using the following characterization parameters:
  • Length3d: The maximum Feret diameter of the crystal in mm.
  • Breadth3d: The minimum Feret diameter of the crystal in mm.
  • Aspect Ratio: Breadth3d divided by Length3d.
  • ShapeVA_3D: Value describing shape. Values of 1 indicate a perfect sphere while higher values indicate less compact, complex volumes.
  • Volume: Volume of the crystal in mm3.
All these characterization parameters, which are described in Appendix B, were used to fully characterize the proportions and geometries of the Ag crystal aggregates.
As XRT characterization requires the extensive procedures just described, out of the numerous samples produced, we could only conduct extensive analysis for a few samples (see Table 1). The samples with highest Ag content were selected for this analysis, considering each of the metals added to the melt. Further, one control sample was also characterized.
Portions of unconsolidated pristine crystals were also examined, with the purpose of characterizing the facet length of individual crystals within the samples. This was performed at CiMAT, using a Zeiss Versa 620 (Carl Zeiss X-ray Microscopy Inc., Pleasanton, CA, USA), capable of much higher spatial resolution compared to the Zeiss Metrotom 1500 instrument. For these experiments, a sample of pristine silver powder was placed in a small plastic vessel and mounted within the scanning chamber. Each sample was scanned at 140 kV and 21 W using a HE6 filter. A total of 3201 projections were acquired with no averaging and an exposure time of 5 s each, with a source-to-detector distance of 24.03 mm. This produced a dataset for each sample with a voxel size of 1.6089 µm.
This data was processed using the software package Avizo 2021.2 with the facet length measurements requiring threshold-based manual segmentation to extract individual crystals. Facet lengths were then extracted, one from each crystal, using the measurement tool. A total of 30 facet lengths were acquired for each sample.

2.4. Particle Size Distribution via Dynamic Picture Analysis

To independently determine the particle size of silver crystals, 50 g portions of unconsolidated silver crystals produced from the test runs used to generate the samples imaged via XRT were directed to Research Centre Pharmaceutical Engineering (RCPE) in Graz, Austria. The four samples selected were representative portions of samples selected for XRT examination (see Table 1). These samples were selected from the processed material as unconsolidated portions to enable individual particle examination in contrast to the coherent silver crystal assemblages selected for vacuum resin impregnation as part of sample preparation for XRT tests. Examination of the unconsolidated crystal samples showed some residual aggregation of silver crystals. As the presence of a significant portion of the Ag crystals joined to other crystals by retained lead had the potential to significantly compromise the particle size distribution, methods for removing the retained lead were investigated. Inspired by the corrosion literature [31,32], sessile exposure of the aggregated crystals to a dilute solution of acetic acid was expected to selectively remove the lead responsible for binding individual crystals but preserve the almost pure Ag crystals without compromise. Assaying of the acetic acid at the end of the experiment noted the presence of lead with minimal silver confirming the selectivity of the cleaning and de-agglomeration process.
These treated crystal samples were dispersed in an aerosol jet, and the suspended particle silhouettes were obtained by high-speed imaging. Particle sizes and shapes were measured and quantified in terms of the following:
  • Particle size standard distribution;
  • Aspect ratio;
  • Sphericity;
  • Convexity.
These terms are defined in previous work [19] and summarized in Appendix B.
The equipment used for these experiments was a Sympatec QICPIC\L06 equipped with a RODOS\L Dry dispersing system from Sympatec (Pulverhaus, Germany) (https://www.sympatec.com/en/particle-measurement/sensors/dynamic-image-analysis/qicpic, accessed on 3 June 2025). The measurement parameters were as follows:
  • Dispersing pressure: 0.5 bar;
  • Dispersing Nozzle: 4 mm;
  • Measurement Range M9 (17–4000 µm);
  • Frame Rate: 175 Hz (FPS);
  • Approx. sample mass = 500 mg per measurement;
  • 30,000 + particles examined (1 measurement);
  • Data treatment: The used diameter definition was the EQPC (equivalent diameter of a circle with the same projected area) with no data filter treatment applied. As a volume model (Q3), a sphere was applied.
For each measurement, a report was generated with PAQXOS Software 4.3.

2.5. Scanning Electron Microscopy

Portions of the acetic acid-treated samples obtained as described in Section 2.4 were directed from RCPE to the University of Warwick to conduct SEM examination of the crystal morphologies. Samples were prepared by sprinkling the coarse powder onto standard SEM stubs with aluminum backed sticky pads. SEM analysis was undertaken at low magnifications using a Scios (Thermo Fisher Scientific, Hillsboro, OR, USA) Field Emission Gun (FEG) SEM. Images were collected at 10 kV from in-lens backscattered electron, in-lens secondary electron, and the directional Everhart Thornley detector simultaneously.

3. Results and Discussion

3.1. Assay Impurities and Inoculant Species

The assay results for the inoculant samples are presented in Table 4. The benchmark samples contain traces of As, Bi, Cu, and Zn, which are also present in the inoculated samples. Surprisingly, the Al-inoculated samples show no evidence of Al presence. The solvation of aluminum into lead presents challenges on the basis of its alloying behavior with lead, and the assay outcomes with respect to aluminum were not unexpected. The Li-inoculated samples could not be analyzed for Li content. The Mg- and Cd-inoculated samples showed an increase in the content of inoculant species, as evidenced in the assays.
The presence of Mg in the Al samples is considered to be a result of the carryover of Mg-rich dross from the Mg studies into the Al studies. The significant amount of assayed Mg reflects the presence of a small but concentrated Mg residue being retained.
The inoculant experiments were all conducted in a 500 kg cooling/crystallization retort that required decanting and cleaning between trials with different species.
As it was not possible to achieve aluminum inoculation of samples and no other trials demonstrated contamination issues, the contamination of the aluminum samples was not considered as an issue that contributed experimental outcomes.
Overall, the results show that the Ag% content achieved does not correlate with the inoculant species; actually, the benchmark presents the highest Ag% content out of all the samples tested. These results indicate that none of the inoculant species tested was able to produce large silver crystals with better Pb drainage and a higher final Ag%. Nevertheless, it was noted via visual inspection that adding Cd to the melt produced a profound macroscopic morphology change in the recovered silver crystals, which were observed to be longer rather than larger compared to the benchmark.

3.2. Dimension and Shape Characterization of Silver Crystals

The characteristic dimensions of the resin-encapsulated samples were determined using XRT, as described in Section 2.3. The samples chosen for these tests are highlighted in Table 1. The results are summarized in Table 5. The assayed Ag% composition of crystals from the initial inoculant work and the subsequent revised Pb-Mg master alloy work demonstrated a strong shared correlation with the XRT pore space measurements, as presented in graphical form in Figure 1. The positive correlation between pore size and Ag% is consistent with the expectations of the parameters controlling drainage [33,34,35]. The expected equivalent correlation between the Ag% and particle size (SEM facet length, XRT crystal breadth) was less statistically significant (p < 0.1 and not p < 0.05). This discrepancy is likely due to the crystal size relative to the voxel size used, resulting in measurement error from each crystal being represented by too few voxels.
The correlation just described, statistically significant, was confirmed over two sets of experiments. The single outlier belongs to the Mg 1 sample, which exhibited higher Mg and much lower Ag%. This sample also exhibits a much higher Pb% assay result. These deviations are interpreted as due to oxidation of the Mg inoculant. In fact, the first set of experiments was conducted using Mg metal as inoculant. When a Pb-Mg master alloy was used to introduce the Mg trace inoculants, the experimental results fit the trends observed with other inoculants. Hence, all subsequent experiments were conducted using Pb-Mg alloys to add Mg inoculants.
The XRT-derived length and breadth also show correlations with the characteristic dimension determined by crystal volume measurement. For the sake of brevity, the graphs of these results are not included but are available on request. The correlations may be interpreted as aspect ratios for the silver crystals of 0.564 (length/diameter) and 0.8511 (breadth/diameter), respectively. Similarly, the XRT-derived length is linearly correlated with the XRT-derived breadth. The slope of the line of best fit (i.e., 0.662) is interpreted as the aspect ratio of the Ag crystals. It is significant that all the mean aspect ratio results obtained from the initial and recent samples align with these correlations.

3.3. Silver Crystals Aspect Ratios

The comparison of XRT and dynamic picture analysis dimensions was used to define aspect ratios for the particles in each sample. The aspect ratios as determined by XRT on resin-impregnated samples and those determined from dynamic picture analysis and shape characterization of unconsolidated samples are presented in Table 6, where it may be seen that the two datasets compare well, within a standard deviation.
The correlation between aspect ratio data obtained from XRT and PSD analysis vs. Ag wt% content is presented in Figure 2. In the top panel, the outlier data points at Ag% content = 40.2% are clearly visible. In the bottom panel, those outliers are removed. The latter data define a statistical correlation significant to p < 0.05. As with pore size considered previously, the particle aspect ratio is a parameter that influences the effectiveness of lead bullion drainage and thus is expected to correlate with the Ag% content of the Ag assemblages. The aspect ratio influences the drainage through two mechanisms: in contributing to the packing factor achieved in drainage, and the drainage from the Ag-Pb slurry. In the dynamic motion of the drainage of lead bullion from the Ag-Pb slurry, higher Ag crystal aspect ratios are expected to impede the relative motion of Ag crystals, yielding a more porous drained solid. These expectations are supported by the settling character and angle of repose of solids, which are influenced by the particle aspect ratio [36]. Prior research indicates that as the aspect ratio—defined as the ferret min/ferret max [19]—decreases, representing a greater departure from sphericity, the hydraulic conductivity should reduce, yielding lower Ag% content [37]. It should however be pointed out that a positive correlation has been reported between intrinsic permeability and particle angularity [35]. The sensitivity of hydraulic conductivity and permeability to several particles variables [33,35] likely contributes to different outcomes. The sensitivity of the packing factor to the particle shape and the method of assemblage are also likely to affect the experimental outcomes [38].
As the purpose of this work is to control the morphology of the silver crystals, a possible correlation between aspect ratio and morphology was investigated. It is noted that the aspect ratio of the acid washed unconsolidated Ag crystals as measured by dynamic picture analysis represents the average of the particle silhouettes. Similarly, the aspect ratios for the resin-encapsulated specimens were determined from the length and breadth values of the 30 individual crystals examined under XRT. The results, presented in Table 6, show favorable correspondence between the aspect ratios determined by the two methods. The ratios of the aspect values show a mean of 1.003 with a standard deviation of 0.039. These observations are consistent with the preservation of aspect ratio during acid washing of the unconsolidated samples, in which the lead removed from the external coating and contact points between crystals does not affect the aspect ratio. Similarly, the removal of lead from internal voids does not affect the aspect ratio either. The XRT image of unconsolidated unwashed sample S5 (see Table 1 for sample details), presented in Figure 3, supports these expectations. In Figure 3, the lead retained is shown as white against the grey silver matrix. The black areas represent void space.
The physical structure of the unwashed, consolidated sample as shown in Figure 3 is that of silver crystals with internal porosity filled with lead and external porosity between the grains that is filled mostly with air and some retained lead.
The external pores define the void space interrogated and characterized by the XRT examination of the resin impregnated samples.
The internal porosity is evidenced in the concave recesses of connected crystals and individual crystal voidage as evidenced in surface faceting and recesses.

3.4. Dynamic Picture Analysis of Unconsolidated Crystals and Shape Characterization

The particle size distributions (PSDs) obtained for the various samples are shown in Figure 4. The samples examined are detailed in Table 1 and their assays are shown in Table 4. The results demonstrate incomplete removal of retained lead; the samples were immersed in dilute acetic acid for an extended period to selectively remove lead and generate unconsolidated silver crystals (see Section 2.4 for details). The second series of Pb-Mg inoculant samples had resin-encapsulated samples generated for XRT imaging, but the corresponding set of unconsolidated samples was damaged, hence the absence of data for these samples in Table 6.
Visual analysis reveals that the samples obtained using metallic Mg as inoculant yield smaller Ag crystals, with a characteristic dimension of 90 microns. On the other hand, the samples produced using metallic Cd as inoculant, as well as the benchmark samples, were larger, with a characteristic dimension of 300 microns.
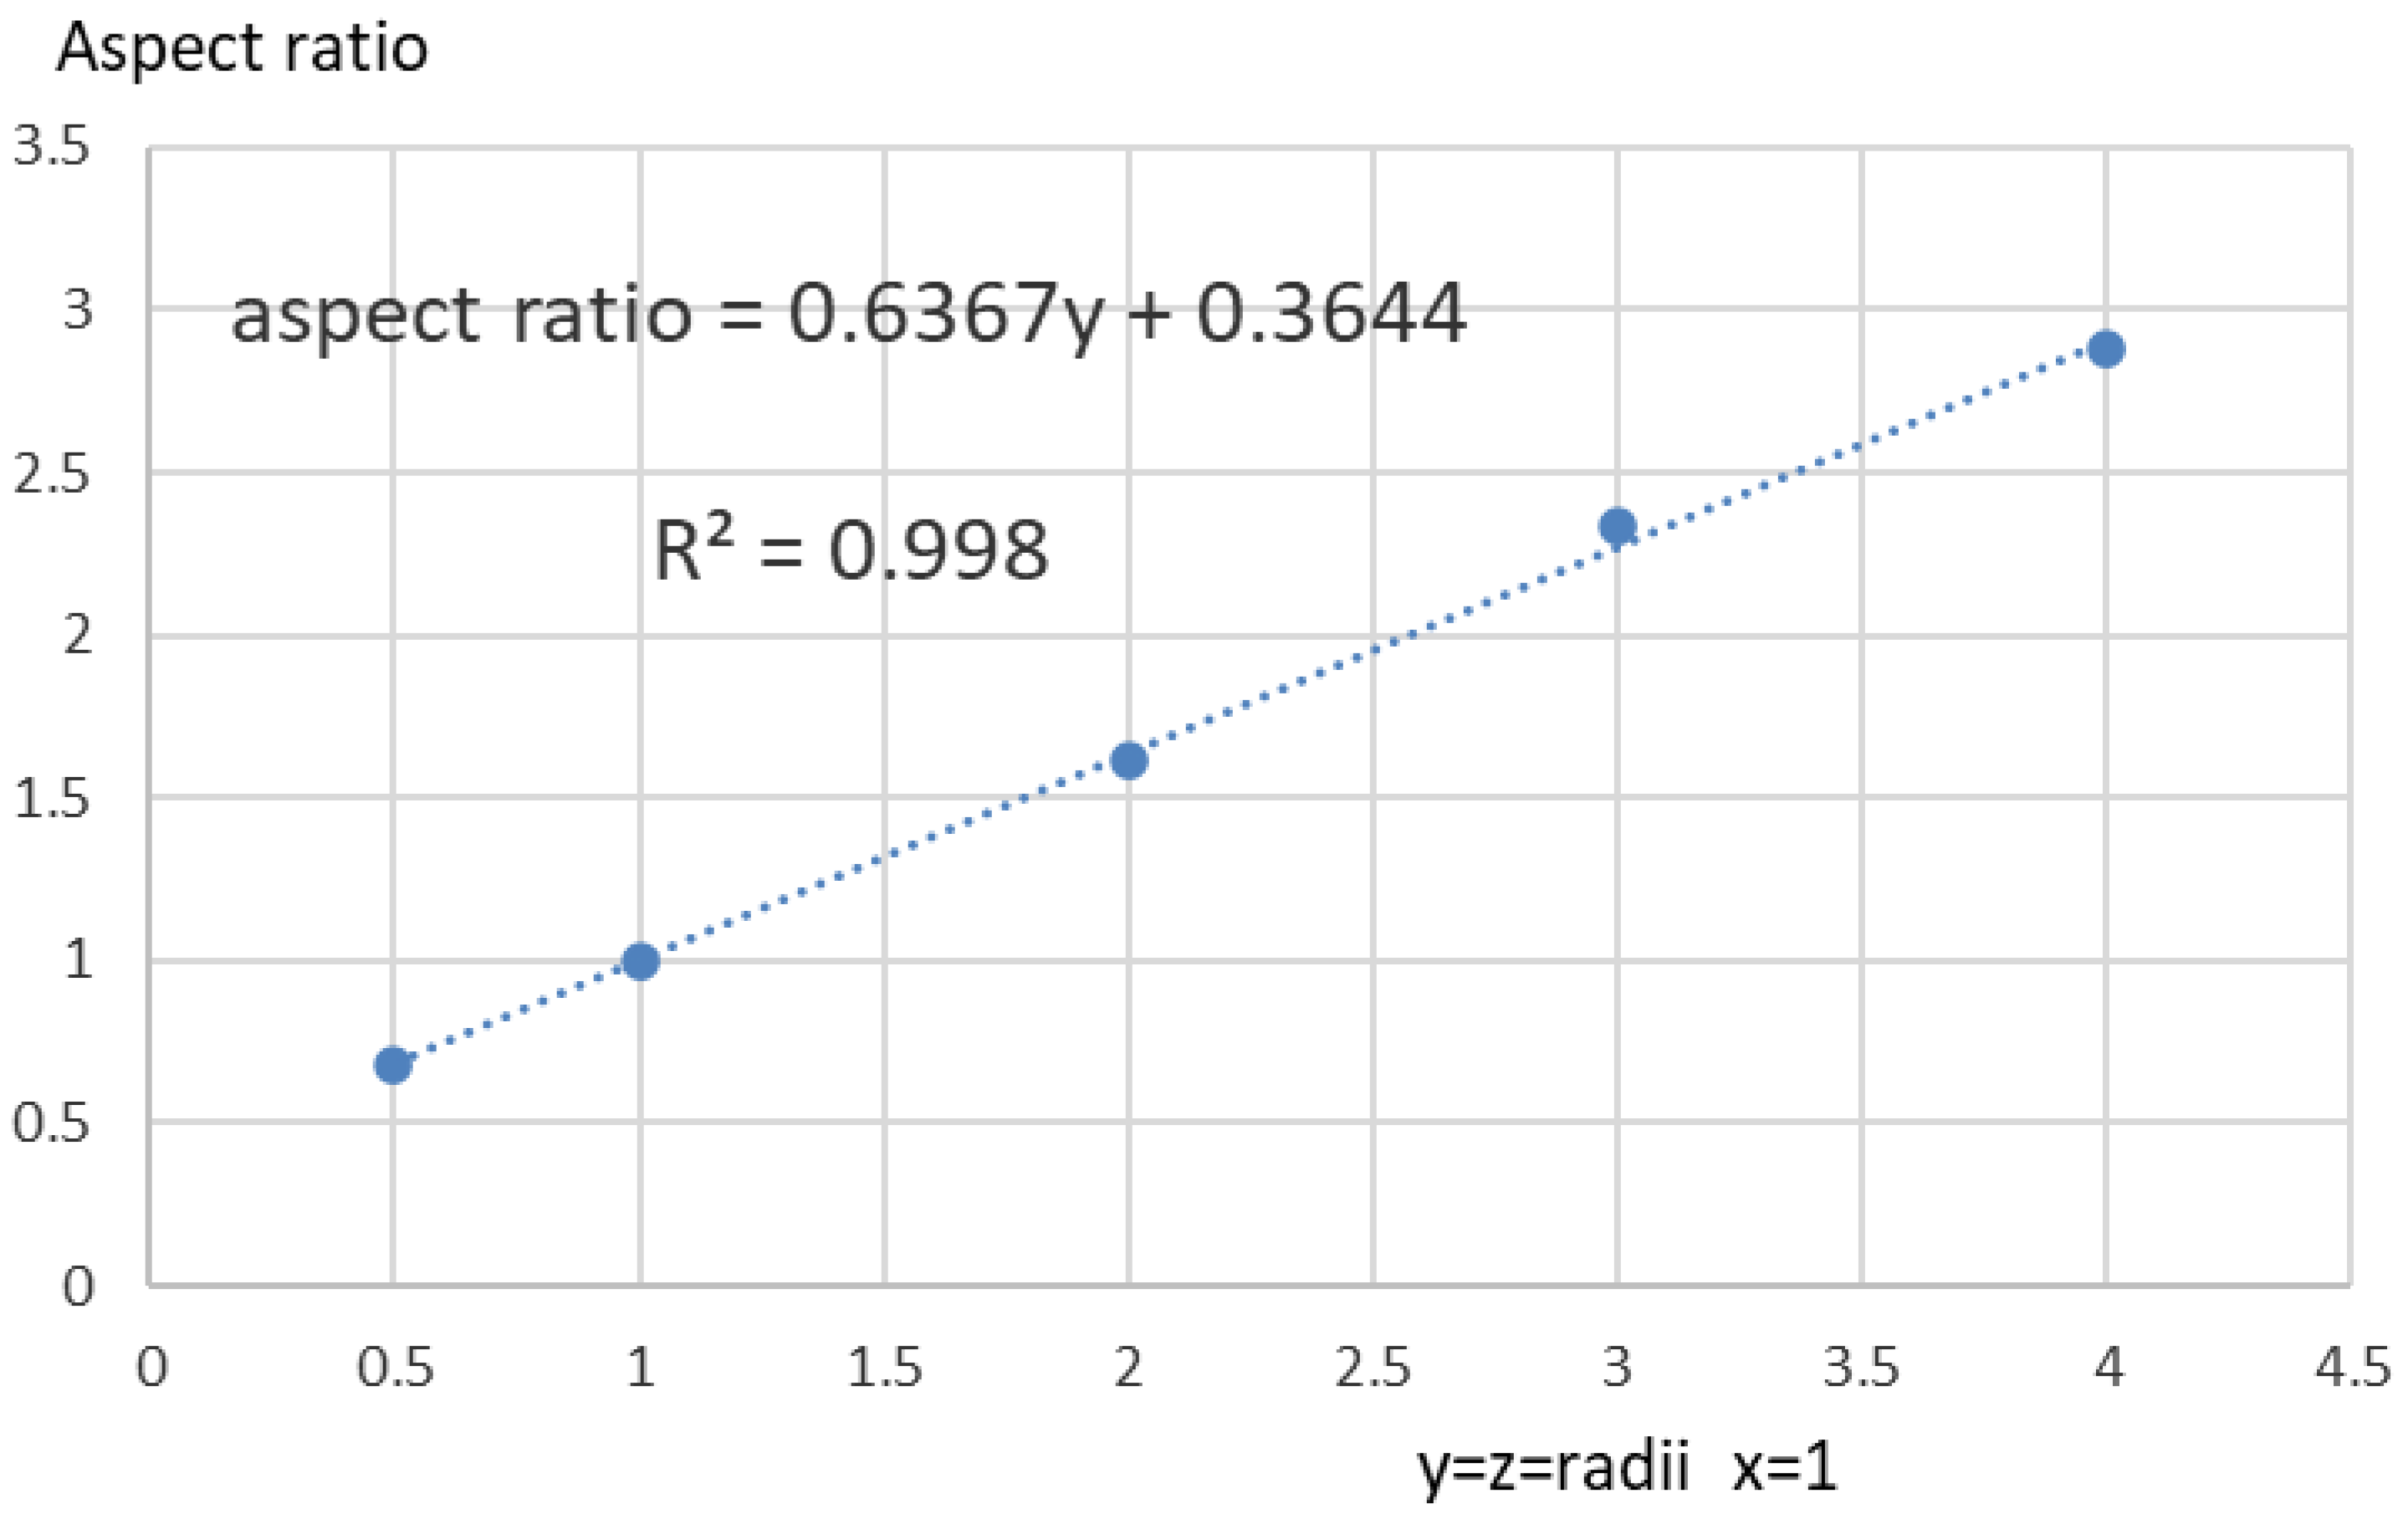
The correlation between aspect ratio and particle equivalent diameter is presented in Figure 5, where results for all samples are presented. These results are useful because the examination of aspect ratio of particles in size classes enables a more detailed understanding of the morphology and size character of the different sample populations than the earlier bulk averaged treatment. Specifically, while it is apparent that the samples examined present similar aspect ratio versus size curves, the cadmium samples depart from the general trend. In comparing the PSD and aspect ratio curves for the Cad A2 samples, it appears that the particle size maxima at 300-micron-equivalent diameter corresponds to closely to the lowest aspect ratio value at around 200 microns. As the aspect ratio, S, for each particle is defined as the ratio of the minimum ferret diameter over the largest, the low aspect ratio defines the most extreme departure from spherical (S = 1). Using the correlation from Figure 6, it is concluded that the Ag crystals with aspect ratio 0.55 have dimensions of 1:0.29:0.29. Compared to the dimensions of octahedral crystals encountered in our previous work [19], these results define an extension only in the x direction by an average factor of 2.42. This analysis supports the presence of twinned or needle-like growth of Ag crystals in one predominant direction. Further examination of the aspect ratio versus particle size graphs for cadmium shows a maximum at 70 microns. The aspect ratio indicates Ag crystals of 1:0.5:0.5 proportions, which are interpreted as singular untwinned octahedral crystals. The broad aspect ratio peaks in cadmium and other samples are interpreted as clumping of smaller particles to yield larger agglomerations with a more spherical form. This effect is responsible for the secondary maxima in the cadmium samples at 800–900 microns.
Examination of the variation in the aspect ratios of cadmium samples with equivalent particle diameter showed very similar results with aspects ratios around 0.55, the values being lower than that associated with singular octahedrons and supporting the observations of twinned octahedrons as a feature of the morphologies observed in the SEM images. The averaging effect of the equivalent diameter calculation on the axis lengths means that a particle with an equivalent diameter of 800 micron and an aspect ratio of 0.55 will have major and minor axis that differ by a factor of 3.43. This averaging effect should be taken into consideration when attempting to compare equivalent particle diameters to those presented in SEM images (Section 3.5).
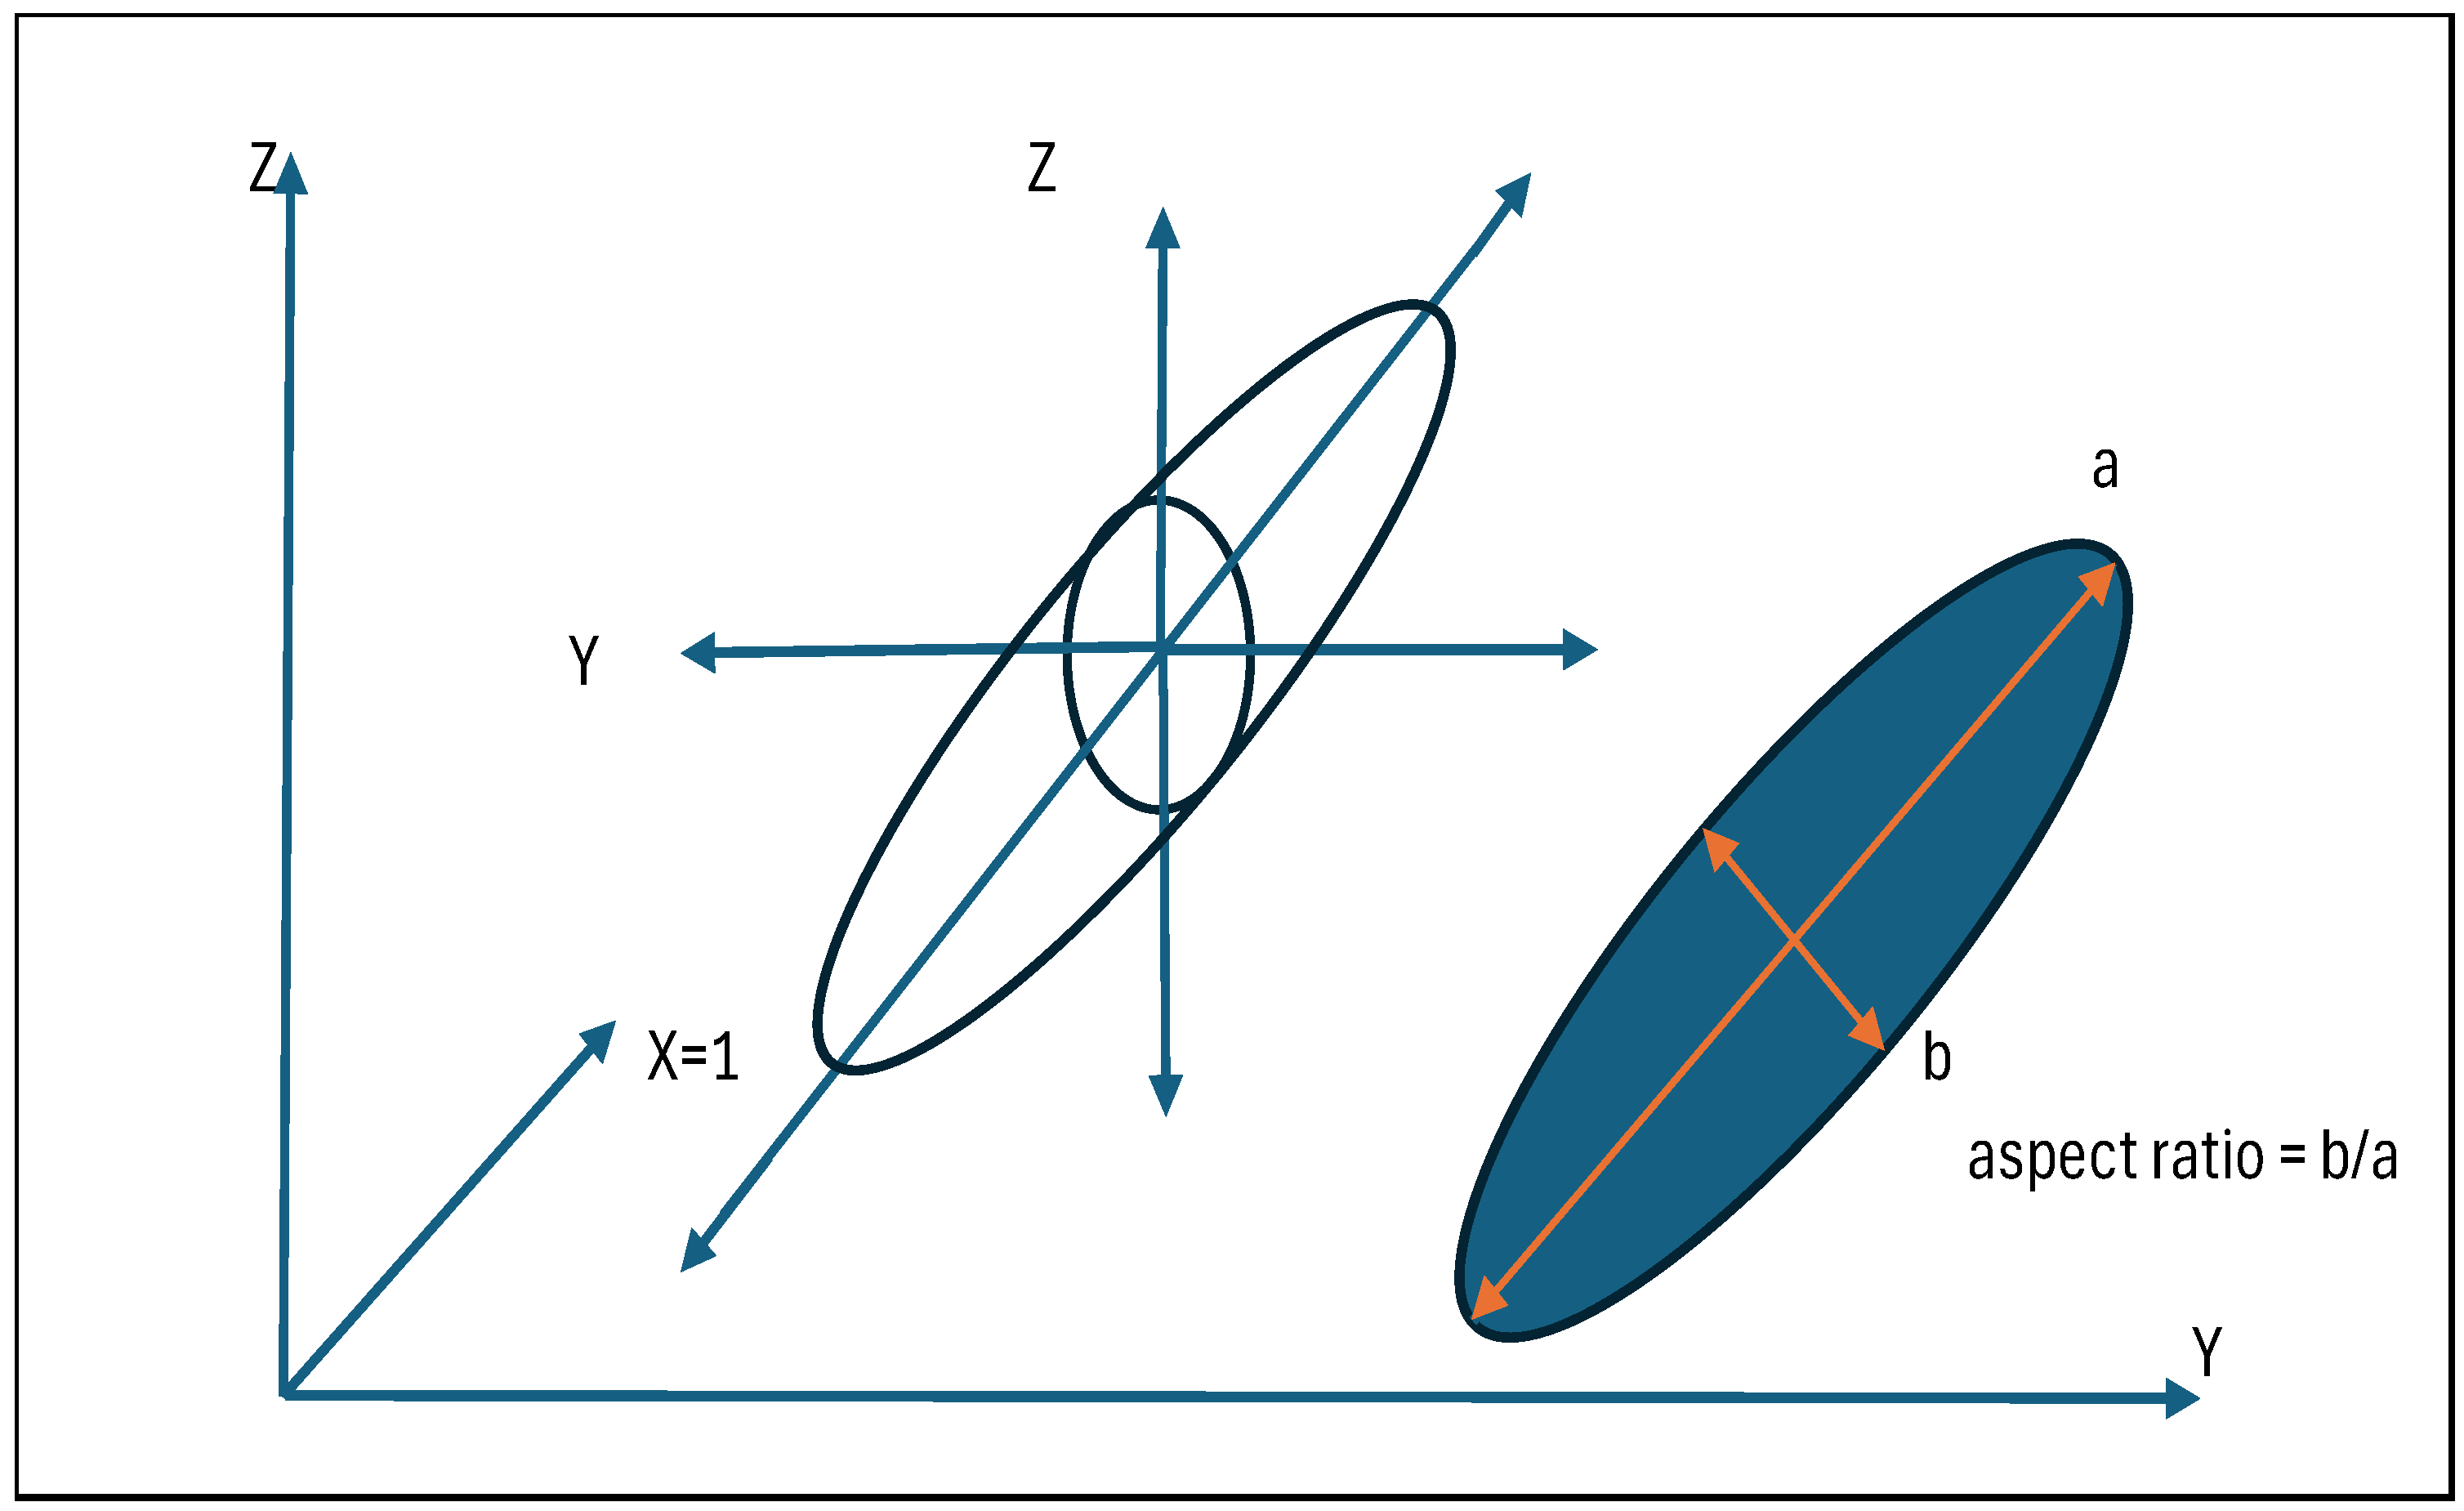
The presence of individual octahedral crystals in the SEM images of silver crystals produced in earlier work [19] raises the question as to what aspect ratio such crystals would present in the data from random silhouette imaging in the dynamic picture analysis assessment. To answer this question, the expected aspect ratio was estimated by considering a triaxial ellipsoid, which enabled determination of the silhouette area. Modelling of the average aspect ratio for a randomly orientated triaxial ellipsoid where the x-axis radii is constrained to 1 and the y- and z-axis radii are varied was performed using a stochastic Monte Carlo technique. In our approach, the effect of twinning would result in a preferred direction (x) while the z and y dimensions remain fixed. The results for a range of y = z values are presented in Figure 6, where values less than one represent prolate spheroids, and values greater than one represent oblate spheroids. The octahedron being constrained in a prolate spheroid of x = 1 and y = z = 1/√2 defines an expected aspect ratio of 0.8146. Validation of the model was performed by comparing the average silhouette area from random orientations to that predicted by the Average Projected Area Theorem (Cauchy) [39] in which the average projected area of a convex solid is ¼ of the surface area of the illuminated convex solid. Using the 1:1/√2:1/√2 ellipsoid dimensions as above, the predicted projected surface area from the Monte Carlo model is 1.988 + −0.162, which, compared to the value from the Average projected Area Theorem [39] of 2.019, is within 1.016%.

3.5. SEM Analysis

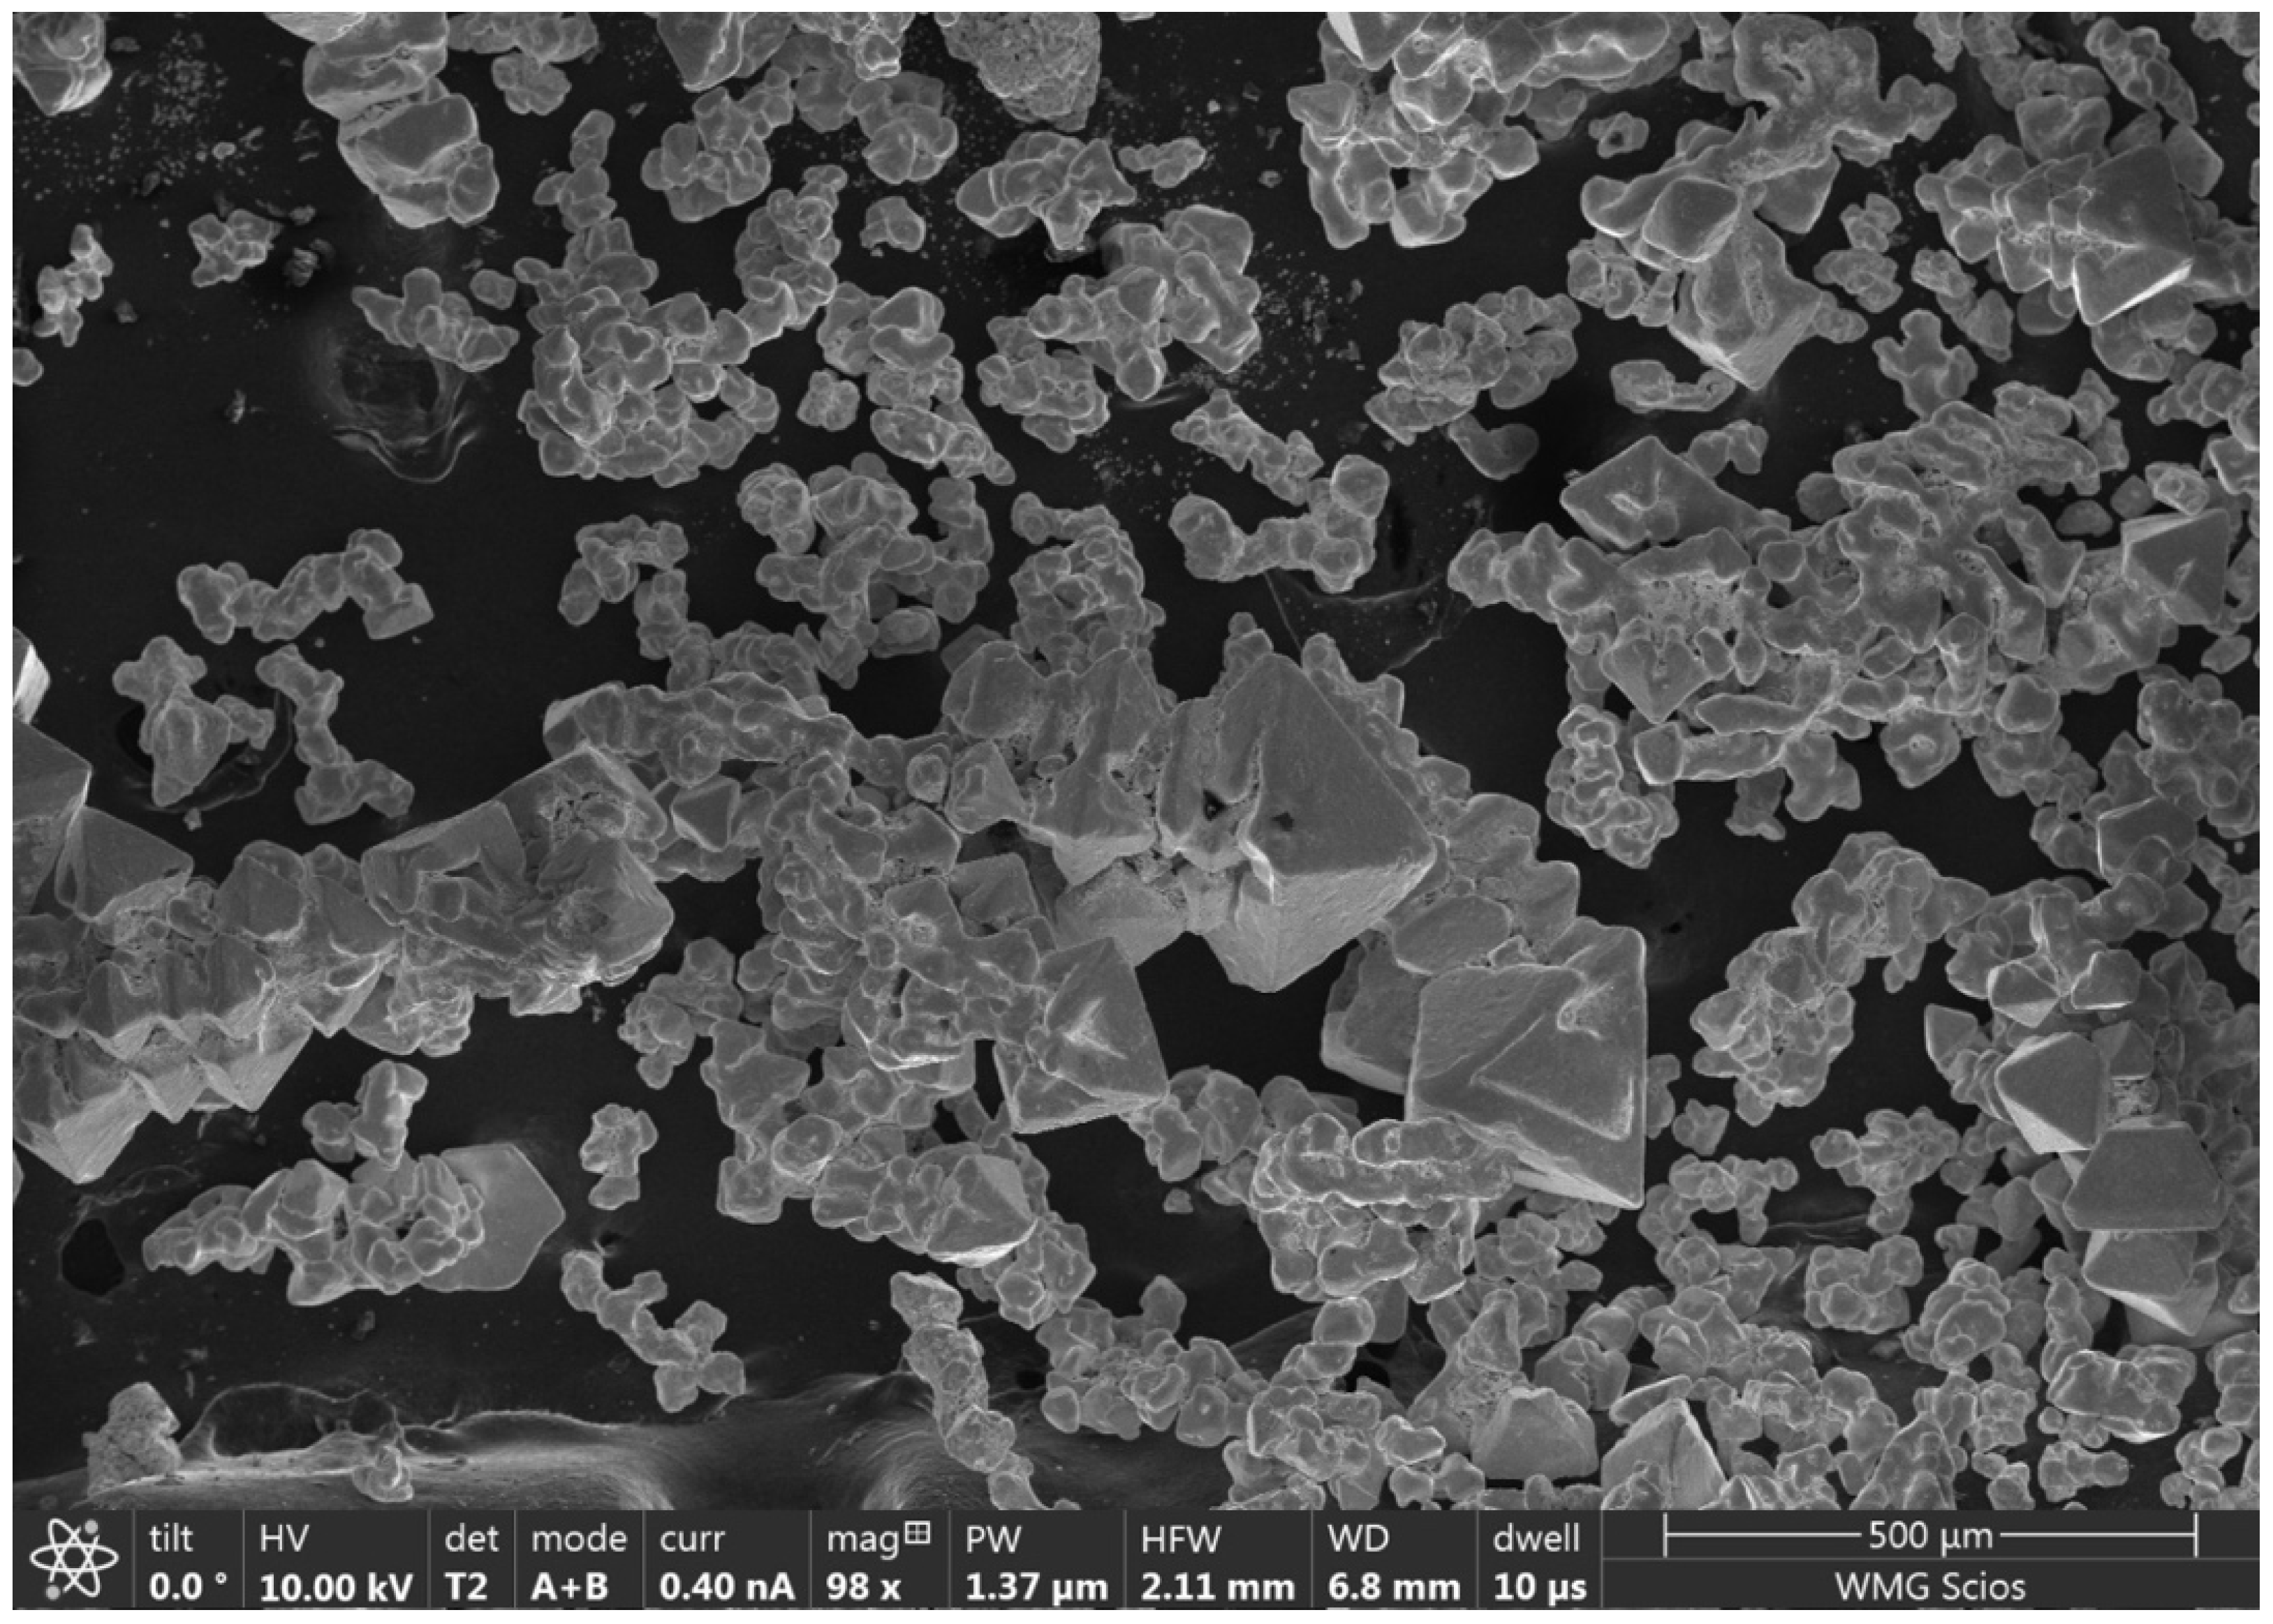
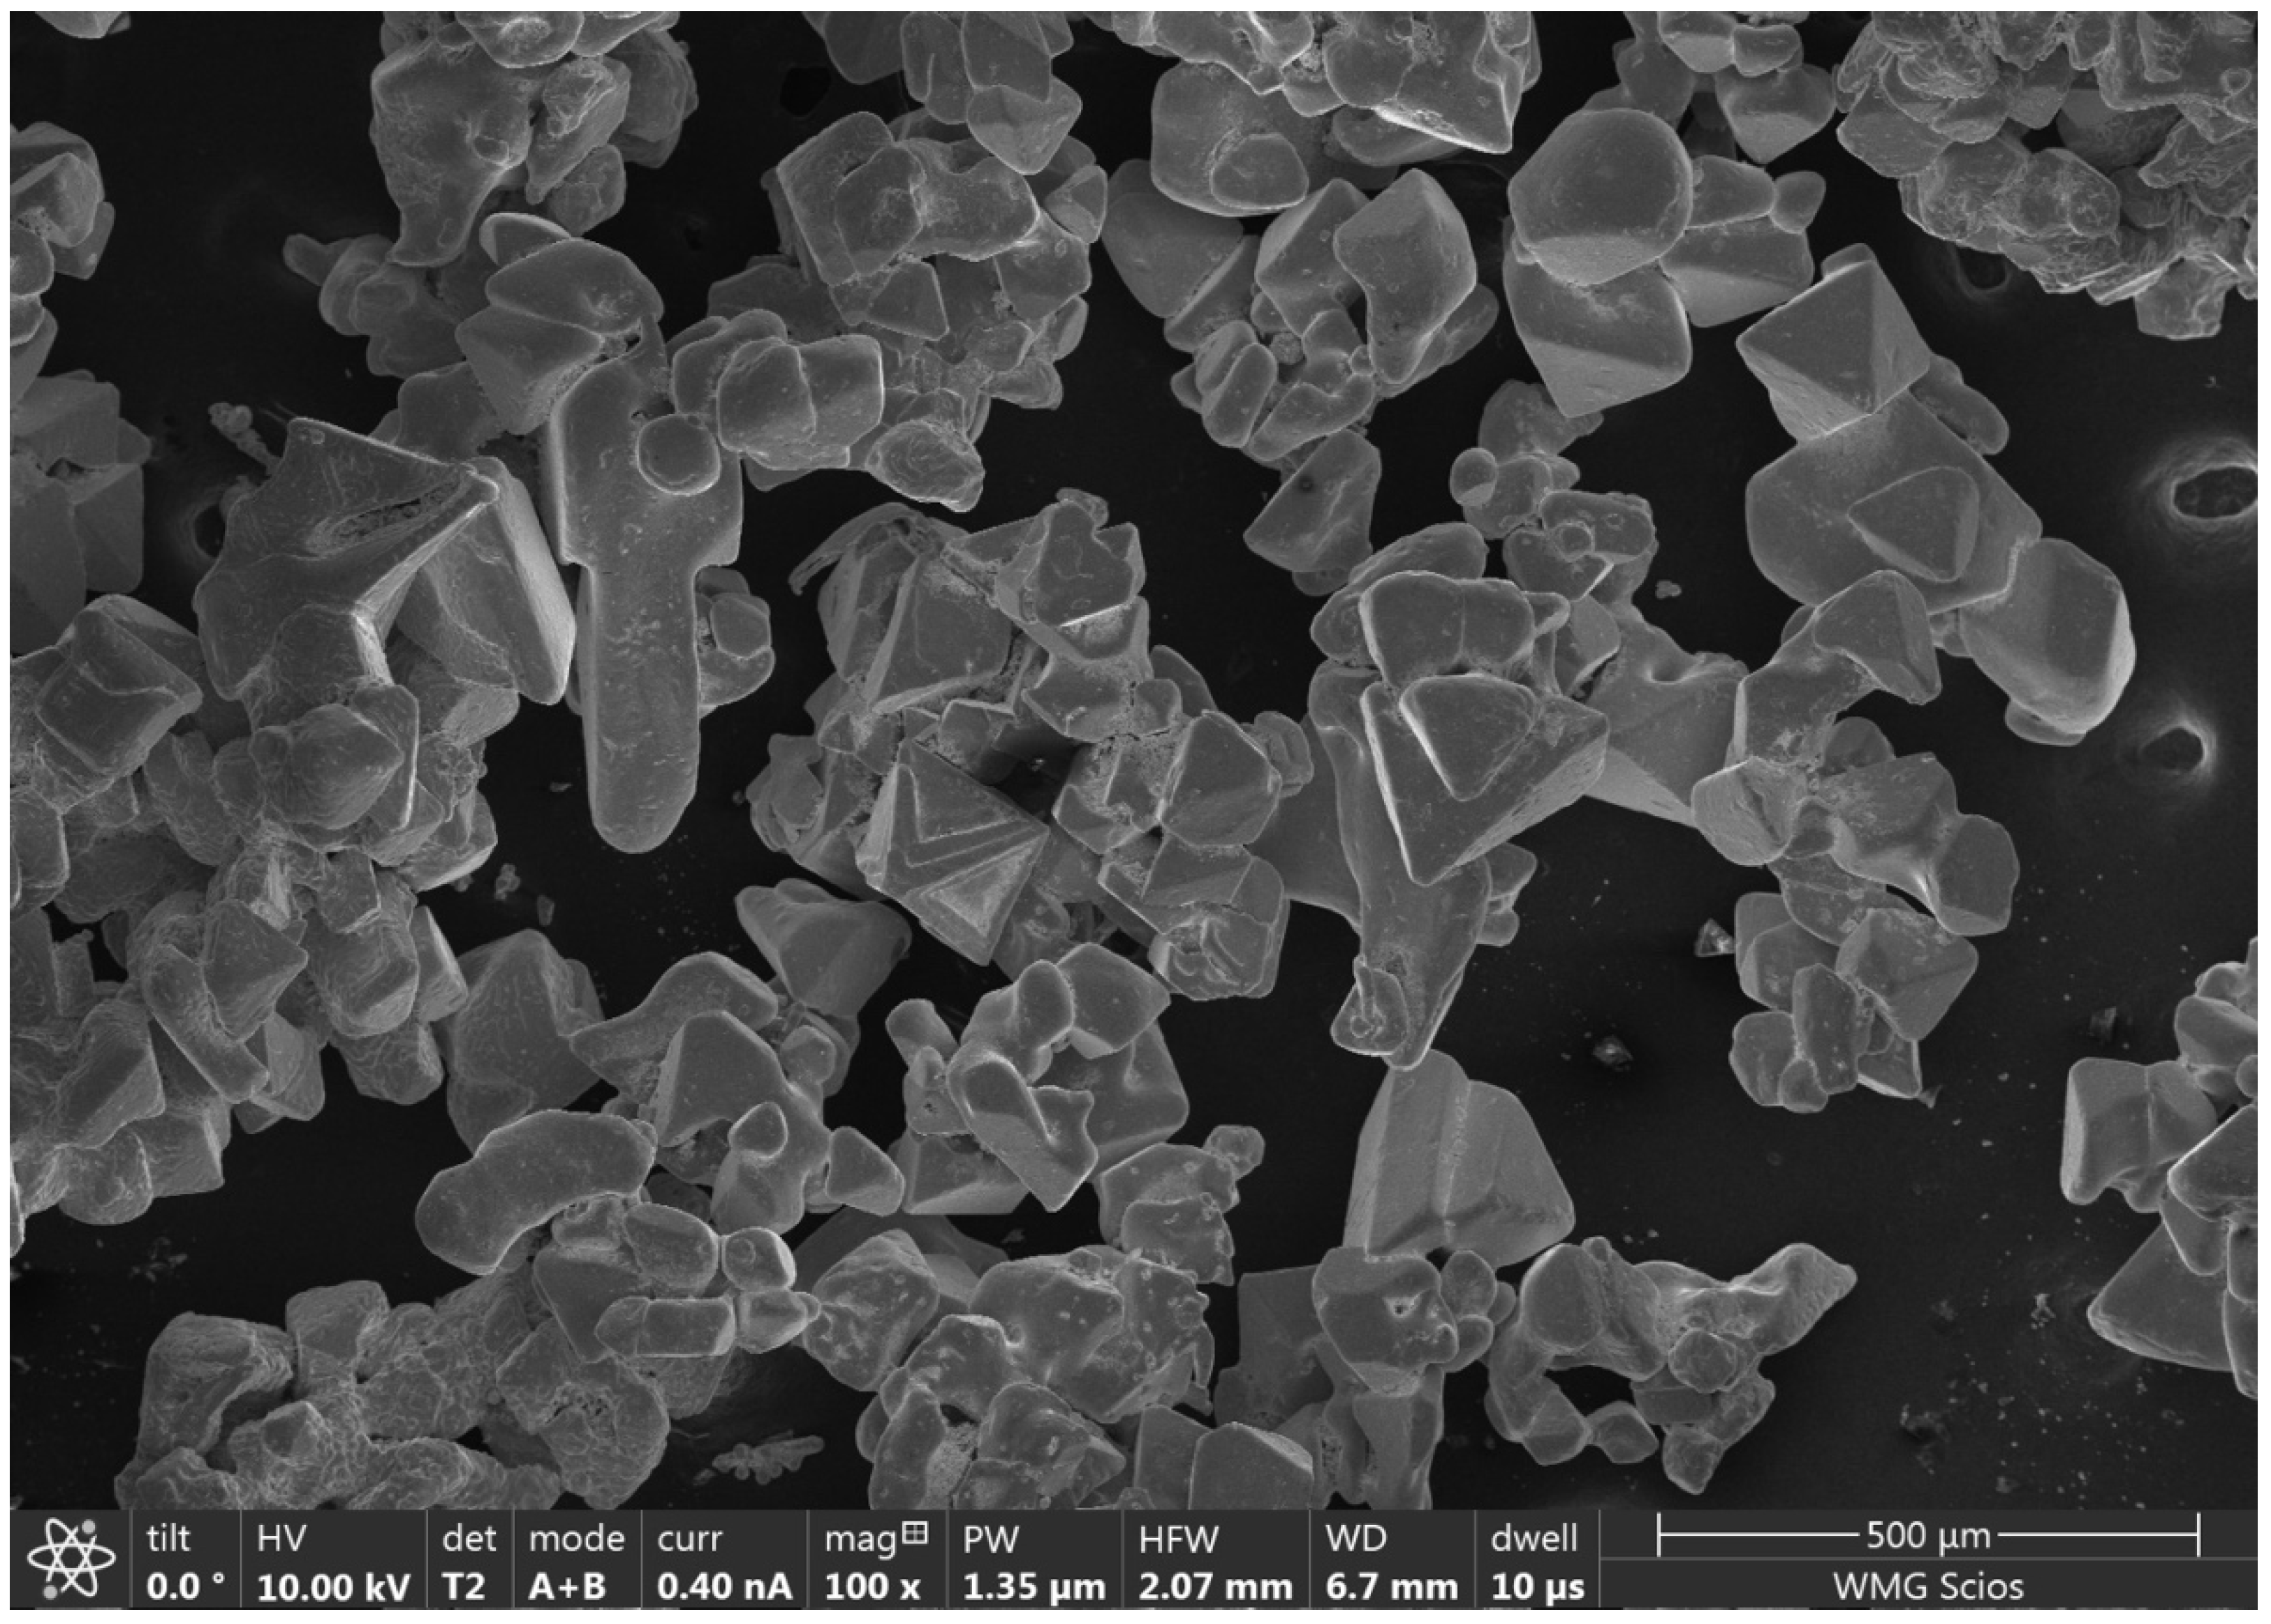
SEM images of acid-washed samples are presented in Figure 7, Figure 8, Figure 9, Figure 10 and Figure 11. The length, breadth, volume, and effective diameter as determined from XRT on the resin-encapsulated samples are tabulated in Table 5 along with the median particle diameter as determined from dynamic picture analysis on acid-washed unconsolidated equivalent samples. The characterization of particle size metrics has been defined in previous work [19] and is summarized in Appendix B. SEM examination of the unconsolidated samples S3, S4, S5, and S6 in Table 1 demonstrates that the benchmark and Mg samples (samples identified as Mg in Table 1 are prepared with a Mg metal as inoculant) present a significant number of well-defined octahedron Ag crystals against a population of smaller more spherical crystals. The benchmark sample also presented some evidence of triangular platelets, consistent with results presented previously [19]. It is worth pointing out that prior to the body of research presented here, the ability to generate discrete octahedral Ag crystals was confined to chemical reduction studies in aqueous environments [12,13,14].
The most significant correspondence between inoculant species and morphology was encountered in the samples inoculated with cadmium, in which all the octahedron crystals developed significant twinning. Twins were observed on all the exposed tips of the parent octahedron crystal, but there was a clear preference towards the development of twins in one direction to produce Ag needles, as shown in Figure 9. The successive development of a series of twins in one direction is likely due to the growth being encouraged in the direction of cooling, with the twinned needles being an interesting morphological variant on dendrites. Although twinning of nanoparticles is detailed in the literature [40], the twinning of octahedrons as encountered in the cadmium inoculant case has not been reported previously in the aqueous crystallization dominant literature.
Pronounced twinning was observed exclusively for Cd-inoculated samples. This is significant because atomic cadmium shows strong energetic preference for the Ag (111) surface [21]. As the exterior planar faces of the Ag octahedrons are all (111) planes [12], these results suggest that Cd, used as inoculant, functions as a capping agent on the (111) planes of the Ag crystals. Examination of the literature dealing with the energetics of the interaction of Ag crystals and deposited Cd, supports this inoculant as being responsible for the observed linear twinning. The exposed character of the contact point between the four (111) planes would also predispose this location as a preferred site for growth twinning. It is also worth mentioning that during growth, the generation of a twinning plane by physical damage is a possible initiating mechanism [41], being assisted under conditions of high growth [42,43]. This mechanism is consistent with growth normal to the direction of heat loss.
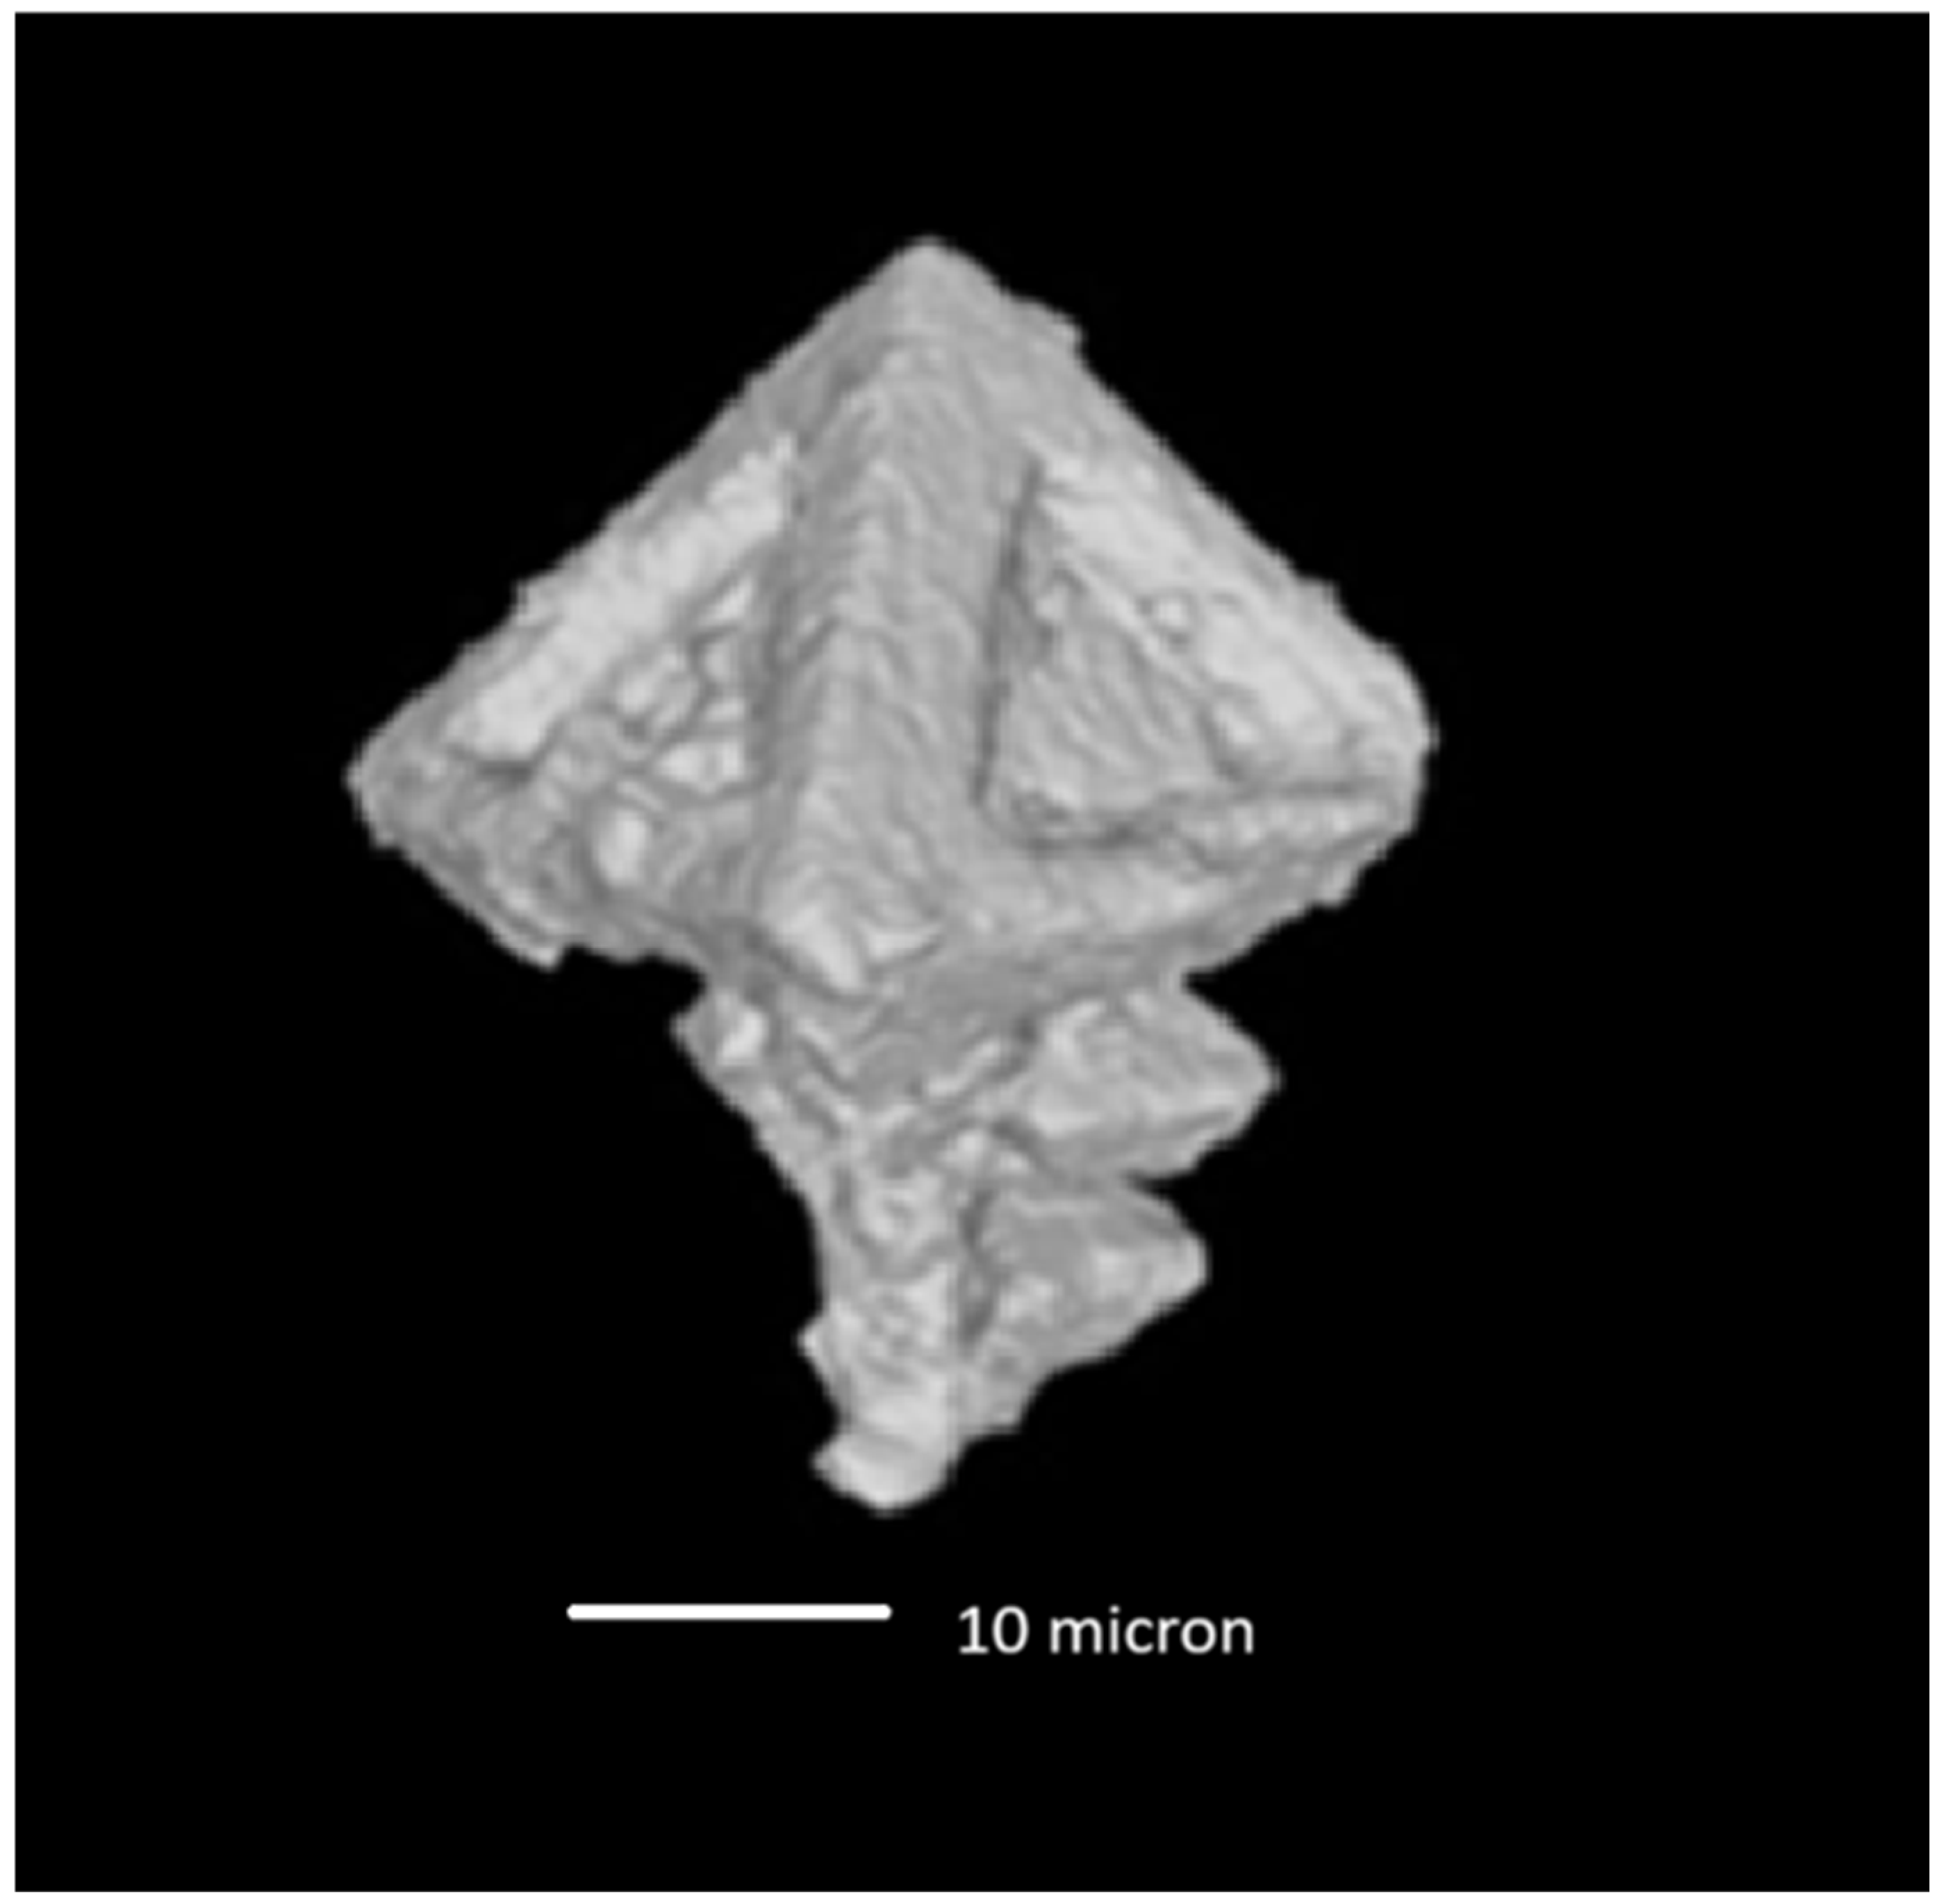
Faceting of the interiors of the triangular faces of octahedral crystals is noted in all the SEM images of acid-washed samples. The confirmation of similar features in the single-crystal images from the XRT examination of resin-encapsulated samples confirms that these physical features are a product of crystal growth and not selective acid etching. Figure 10 and Figure 11 detail SEM (unconsolidated washed Mg 2 sample) and XRT Mg 2 sample images, respectively, clearly showing faceting of the triangular faces. It is worth pointing out that this feature is also detailed in the literature describing different morphologies of Ag and precious metal crystals [13,14] in aqueous-mediated synthesis. The generation of hollow shells suggested on some of the SEM images (Figure 9 and Figure 10) is also a morphology already reported in the literature [12], confirming the reliability of our protocols.
While the unconsolidated samples do not show external pores, the acid washing enables the internal porosity to be evidenced as faceting and concave depressions.
The mapping of the external pore sizes in the XRT imaging of resin-impregnated samples showed a clearly fibrous structure in the Mg-inoculated samples; nevertheless, the most pronounced evidence of a fibrous structure as defined by pore alignment was noted in the Cd-inoculated samples, this outcome being consistent with the extensive twinning observed in larger Ag crystals.

4. Conclusions

Silver crystals were produced from the controlled cooling of molten lead/silver alloys in a commercial-size process. This investigation quantified the effects that inoculant species have on the morphology of silver crystals. Silver crystals were recovered after drainage of molten lead. Confirmation of the silver crystal elemental composition was achieved by chemical analysis of pristine samples. The as-produced crystal mass was encapsulated in resin under vacuum to preserve the as-recovered silver crystal matrix structure. Unconsolidated samples of individual crystals from the same experimental samples were produced by acetic acid washing to selectively remove residual lead. The resin-encapsulated samples were examined by XRT, while the unconsolidated samples were examined by dynamic picture imaging. Experimental XRT characterization showed a statistically significant correlation between pore size and silver content, supporting the interpretation that increased pore size enables superior lead bullion removal. A correlation was also demonstrated, but less strongly, for silver crystal breadth and silver content. This discrepancy is likely due to limitations in resolution, as each crystal was represented by too few voxels. The correlations identified where statistically significant for samples produced with all trace elements considered, except metal Mg. In the latter case, oxidation of the material likely caused changes in morphology and other material properties.
All samples tested demonstrated silver crystals with octahedral morphologies; however, only the samples inoculated with cadmium demonstrated extensive twinning of octahedrons in one growth direction. This extended twinning behavior is consistent with the energetics of adsorption of Cd preferentially onto (111) Ag crystal planes. The enhanced aspect ratio of the silver crystal produced is likely connected with improved ability of removing entrained lead. This conclusion is strengthened by the fibrous character in XRT images interpreted as being due to crystal alignment. The generation of this morphology and the extended twinning encountered with Cd are significant as research firsts for Ag crystal generation in a molten metallic system. An additional feature noted with the silver octahedral crystals was the faceting of triangular faces and hollowing of some octahedra. The ability to produce faceted octahedral structures with deep coring is a research first for Ag crystals extracted under controlled conditions from a molten alloy melt.
While nanocrystals could not be detected due to the industrial scale of the approach demonstrated, the possibility of producing silver crystals with controlled geometries in commercial process could open up several opportunities.

Author Contributions

Conceptualization, S.K. and A.S.; Methodology, S.K.; Formal analysis, S.K. and G.W.; Investigation, S.K., P.F.W., M.A.W. and M.P.; Writing—original draft, S.K.; Writing—review & editing, A.S., P.F.W., G.W., M.A.W. and M.P.; Visualization, P.F.W.; Supervision, A.S. All authors have read and agreed to the published version of the manuscript.

Funding

Funding for this research was kindly provided by Glencore. AS acknowledges financial support from the Asahi Glass Foundation via the Asahi Glass Chair in Chemical Engineering at the University of Oklahoma, Norman, OK, USA. The X-Ray Computed Tomography (XCT) data used in this article was acquired using the Free-at-Point-of-Access scheme at the National Facility for X-Ray Computed Tomography (NXCT) and carried out at the Centre for Imaging, Metrology, and Additive Technologies (CiMAT) at the University of Warwick under EPRSC Project Number (EP/T02593X/1).

Data Availability Statement

The original contributions presented in this study are included in the article. Further inquiries can be directed to the corresponding author.

Conflicts of Interest

Author Steven King was employed by the company Britannia Refined Metals. Author Michael Piller was employed by the company Research Centre Pharmaceutical Engineering GmbH. It is however noted that Steven King is a principal metallurgist with the Glencore group. The remaining authors declare that the research was conducted in the absence of any commercial or financial relationships that could be construed as a potential conflict of interest.

Appendix A. Process Flowsheet for Sample Preparation and Characterization

Figure A1 provides a schematic flowchart to summarize the commercial-scale production process, the sample extraction and treatment, and the sequence of experimental characterization steps undertaken to generate the data discussed in the narrative above.
Figure A1. Flowchart.
Minerals 15 00853 g0a1

Appendix B. Definition of Characteristic Dimensions for Ag Crystals

The material in this section is adapted from what is presented at length in our prior manuscript [19]. A summary of the dimension and shape parameters is provided here to help the interpretation of the results presented in the main text in terms of the characterization of the silver crystals obtained in the present work.
XRT Dimension and Shape Characterization
Feret Diameter
The distance of two tangents to the particle in a well-defined orientation. These dimensions could be equivalently measured by application of a slide gauge to the particle. Measurement of the Feret diameters over a range of angles enables selection of maximum and minimum values [44].
Length: The maximum of the Feret diameters.
Width: The minimum Feret diameters.
Breadth: The largest distance between two parallel lines contacting the object at tangents, without intersecting the object, and lying in a plane orthogonal to the maximum Feret diameter. The above definition is also termed the max Feret 90°.
Thickness: The largest segment that touches the object by its end points and lying in a plane orthogonal to the maximum Feret diameter and orthogonal to the breadth diameter.
Sphericity: The sphericity of a particle is defined as the ratio of surface area of a sphere of the same volume as the particle to the measured actual surface area of the particle. The sphericity of a sphere equals one, while all other shapes have sphericity of less than one.
Sphericity (ψ) = = π 1/3 × (6V)2/3/A.
Shape Factor: Another particle index based on area-to-volume ratio:
Shape factor = A3/36πV2.
Shape factor and sphericity are related as follows:
Sphericity (ψ) = (1/shape factor)1/3.
In the above set of shape parameter definitions, length, breadth, and thickness define the smallest rectangular prism that that the particle could be packed into. The mutual orthogonality of the length, breadth, and thickness measurements defines them as the major and minor (2) diameters of a triaxial ellipsoid.
Laser Sizing Dimension and Shape Characterization
In the case of dynamic laser size and shape characterization, the dataset consists of a series of projected areas of the particle in random orientations. The dimensional parameters measured with laser sizing are consistent with those utilized with optical microscopy [40,41] and are detailed below.
Breadth: The minimal distance between two parallel lines tangential to the projected outline of the particle when placed in the most stable position; resting on a flat surface under observation.
Length: Distance between two tangents to the projected outline of the particle drawn perpendicularly to the tangents defining the breadth.
Thickness: Distance between two planes tangential to the surface of the particle and parallel to the plane of the projected image.
In this definition, the mutual orthogonality of breadth, length, and thickness measurements establishes them as equivalent to those obtained with X-ray tomography, and the ability to examine the particle dimensions from all orientations.
Diameter of a Circle of Equal Projection Area/EQPC: This is the diameter of a circle that has the same area (A) as the mean projection area of the particle.
Aspect Ratio: The ratio of the minimum to the maximum Feret diameters:
Aspect ratio = XFeret Min/XFeret Max.

References

  1. Butts, A.; Coxe, C. Silver Economics Metallurgy and Use; Van Nostrand: Princeton, NJ, USA, 1967. [Google Scholar]
  2. 2024 Interim Silver Marker Review; The Silver Institute: Washington, DC, USA, 2024.
  3. Bruna, T.; Maldonado-Bravo, F.; Jara, P.; Caro, N. Silver nanoparticles and their antibacterial applications. Int. J. Mol. Sci. 2021, 22, 7202. [Google Scholar] [CrossRef]
  4. Evanoff, D.D., Jr.; Chumanov, G. Synthesis and Optical Properties of Silver Nanoparticles and Arrays. Chemphyschem 2005, 6, 1221–1231. [Google Scholar] [CrossRef]
  5. González, A.L.; Noguez, C. Optical properties of silver nanoparticles. Phys. Status Solidi. C 2007, 4, 4118–4126. [Google Scholar] [CrossRef]
  6. Jiang, Z.-J.; Liu, C.-Y.; Sun, L.-W. Catalytic Properties of Silver Nanoparticles Supported on Silica Spheres. J. Phys. Chem. B 2005, 109, 1730–1735. [Google Scholar] [CrossRef] [PubMed]
  7. Shaker Ardakani, L.; Surendar, A.; Thangavelu, L.; Mandal, T. Silver nanoparticles (Ag NPs) as catalyst in chemical reactions. Synth. Commun. 2021, 51, 1516–1536. [Google Scholar] [CrossRef]
  8. Natsuki, J.; Natsuki, T.; Hashimoto, Y. A Review of Silver Nanoparticles: Synthesis Methods, Properties and Applications. Int. J. Mater. Sci. Appl. 2015, 4, 325–332. [Google Scholar] [CrossRef]
  9. Pagliaro, M.; Della Pina, C.; Mauriello, F.; Ciriminna, R. Catalysis with silver: From complexes and nanoparticles to morals and single-atom catalysts. Catalysts 2020, 10, 1343. [Google Scholar] [CrossRef]
  10. Dong, X.-Y.; Gao, Z.-W.; Yang, K.-F.; Zhang, W.-Q.; Xu, L.-W. Nanosilver as a new generation of silver catalysts in organic transformations for efficient synthesis of fine chemicals. Catal. Sci. Technol. 2015, 5, 2554–2574. [Google Scholar] [CrossRef]
  11. Duman, H.; Eker, F.; Akdaşçi, E.; Witkowska, A.M.; Bechelany, M.; Karav, S. Silver Nanoparticles: A Comprehensive Review of Synthesis Methods and Chemical and Physical Properties. Nanomaterials 2024, 14, 1527. [Google Scholar] [CrossRef]
  12. Wang, Y.; Wan, D.; Xie, S.; Xia, X.; Huang, C.Z.; Xia, Y. Synthesis of Silver Octahedra with Controlled Sizes and Optical Properties via Seed-Mediated Growth. ACS Nano 2013, 7, 4586–4594. [Google Scholar] [CrossRef]
  13. Kim, D.Y.; Li, W.; Ma, Y.; Yu, T.; Li, Z.-Y.; Park, O.O.; Xia, Y. Seed-Mediated Synthesis of Gold Octahedra in High Purity and with Well-Controlled Sizes and Optical Properties. Chem. A Eur. J. 2011, 17, 4759–4764. [Google Scholar] [CrossRef]
  14. Chiang, C.; Huang, M.H. Synthesis of Small Au-Ag Core-Shell Cubes, Cuboctahedra, and Octahedra with Size Tunability and Their Optical and Photothermal Properties. Small 2015, 11, 6018–6025. [Google Scholar] [CrossRef] [PubMed]
  15. Gugua, E.C.; Ujah, C.O.; Asadu, C.O.; Von Kallon, D.V.; Ekwueme, B.N. Electroplating in the modern era, improvements and challenges: A review. Hybrid Adv. 2024, 7, 100286. [Google Scholar] [CrossRef]
  16. Zhou, J.; Hao, B.; Meng, Y.; Yang, H.; Chen, W.; Zhang, L.; Liu, J.; Yan, C.; Qian, T. Levelling the Zn Anode by Crystallographic Orientation Manipulation. Nano Lett. 2023, 23, 10148–10156. [Google Scholar] [CrossRef] [PubMed]
  17. Ashiru, O.A. Influence of bath additives on the composition of electrodeposited silver coatings. Surf. Interface Anal. 1995, 23, 618–622. [Google Scholar] [CrossRef]
  18. King, S.; Striolo, A. Correction: Performance Metrics of the Newly Introduced Britannia Silver Process: Significant Reductions in Operating Costs, Energy Usage, and Scope 1 Carbon Emissions in the Industrial-Scale Refining of Silver. J. Sustain. Metall. 2024, 10, 2115. [Google Scholar] [CrossRef]
  19. King, S.; Rajoo, D.; Norori-McCormac, A.; Striolo, A. Characterization of Kinetics-Controlled Morphologies in the Growth of Silver Crystals from a Primary Lead Melt. Minerals 2024, 14, 56. [Google Scholar] [CrossRef]
  20. Bale, C.W.; Bélisle, E.; Chartrand, P.; Decterov, S.A.; Eriksson, G.; Gheribi, A.E.; Hack, K.; Jung, I.H.; Kang, Y.B.; Melançon, J.; et al. FactSage Thermochemical Software and Databases, 2010–2016. Calphad 2016, 54, 35–53. [Google Scholar] [CrossRef]
  21. Ambrusi, R.E.; García, S.G.; Pronsato, M.E. DFT study of the formation of Cd–Ag surface alloys on Ag surfaces. Comput. Mater. Sci. 2016, 118, 316–324. [Google Scholar] [CrossRef]
  22. Kozlov, S.A.; Potolokov, N.A.; Gusev, A.V.; Fedorov, V.A. Effect of Impurities on Crystal Growth of Gallium. Inorg. Mater. 2003, 39, 1267–1270. [Google Scholar] [CrossRef]
  23. Tiller, W.A. Preferred growth direction of metals. JOM 1957, 9, 847–855. [Google Scholar] [CrossRef]
  24. Karakaya, I.; Thompson, W.T. The Ag-Pb (Silver-Lead) system. Bull. Alloy Phase Diagr. 1987, 8, 326–334. [Google Scholar] [CrossRef]
  25. NIST: Phase Diagram and Computational Thermodynamics Ag-Pb System. Available online: https://www.metallurgy.nist.gov/phase/solder/agpb.html (accessed on 15 January 2024).
  26. Kallmann, S.; Hobart, E.W. Determination of silver, gold and palladium by a combined fire-assay atomic-absorption procedure. Talanta 1970, 17, 845–850. [Google Scholar] [CrossRef] [PubMed]
  27. Sheng, J.; Sun, Y.; Zhu, W.; Zeng, Z.; Ma, G.; He, H.; He, M. Determination of Silver by Fire Assay Gravimetry Combined with Mathematic Correction. Int. J. Miner. Process. Extr. Metall. 2018, 3, 65–75. [Google Scholar] [CrossRef]
  28. Marie-Pierre, G.; Téreygeol, F.; Peyrat, F. Initial experiments on silver refining: How does a cupellation furnace work in the 16th century? Hist. Metall. 2010, 44, 126–135. [Google Scholar]
  29. Feldkamp, L.A.; Davis, L.C.; Kress, J.W. Practical cone-beam algorithm. J. Opt. Soc. Am. A 1984, 1, 612–619. [Google Scholar] [CrossRef]
  30. Avizo Software User’s Guide 2019 Thermo-Fisher Scientific. Available online: https://assets.thermofisher.com/TFS-Assets/MSD/Product-Guides/users-guide-avizo-software-2019.pdf (accessed on 29 March 2024).
  31. Holmes, J.F. LEAD AND LEAD ALLOYS: Corrosion Resistance—Part 3. Anti-Corros. Methods Mater. 1963, 10, 69–71. [Google Scholar] [CrossRef]
  32. Coles, E.L.; Gibson, J.G.; Hinde, R.M. The corrosion of lead by dilute aqueous organic acids. J. Appl. Chem. 1958, 8, 341–348. [Google Scholar] [CrossRef]
  33. Arya, L.M.; Heitman, J.L.; Thapa, B.B.; Bowman, D.C. Predicting Saturated Hydraulic Conductivity of Golf Course Sands from Particle-Size Distribution. Soil Sci. Soc. Am. J. 2010, 74, 33–37. [Google Scholar] [CrossRef]
  34. Wang, J.-P.; Francois, B.; Lambert, P. Equations for hydraulic conductivity estimation from particle size distribution—A dimensional analysis. Water Resour. Res. 2017, 53, 8127–8134. [Google Scholar] [CrossRef]
  35. Xiong, Y.; Dong, L.; Long, X.; Chen, M.; Huang, G. Pore-network model to quantify internal structure and hydraulic characteristics of randomly packed grains with different morphologies. Granul. Matter. 2022, 24, 10. [Google Scholar] [CrossRef]
  36. Robinson, D.A.; Friedman, S.P. Observations of the effects of particle shape and particle size distribution on avalanching of granular media. Phys. A 2002, 311, 97–110. [Google Scholar] [CrossRef]
  37. Peng, J.; Shen, Z.; Zhang, J. Measuring the Effect of Pack Shape on Gravel’s Pore Characteristics and Permeability Using X-ray Diffraction Computed Tomography. Materials 2022, 15, 6173. [Google Scholar] [CrossRef] [PubMed]
  38. Baker, J.; Kudrolli, A. Maximum and minimum stable random packings of Platonic solids. Phys. Rev. E Stat. Nonlinear Soft Matter Phys. 2010, 82 Pt 1, 061304. [Google Scholar] [CrossRef]
  39. Slepian, Z. The Average Projected Area Theorem—Generalization to Higher Dimensions. arXiv 2011, arXiv:1109.0595. [Google Scholar] [CrossRef]
  40. Marks, L.D.; Peng, L. Nanoparticle shape, thermodynamics and kinetics. J. Phys. Condens. Matter 2016, 28, 053001. [Google Scholar] [CrossRef]
  41. Nelson, S.A. Twinning, Polymorphism, Polytypism, Pseudomorphism; Tulane University: New Orleans, LA, USA, 2013. [Google Scholar]
  42. Nesse, W.D. Introduction to Mineralogy; Oxford University Press: New York, NY, USA, 2000; pp. 87–91. ISBN 9780195106916. [Google Scholar]
  43. Yasnikov, I.S.; Tsybuskina, I.I. Morphology of silver single crystals obtained by electrodeposition. Tech. Phys. 2008, 53, 1515–1518. [Google Scholar] [CrossRef]
  44. Sympatec Particle Measurement Glossary 2021. Available online: https://www.sympatec.com/en/particle-measurement/glossary/ (accessed on 29 March 2024).
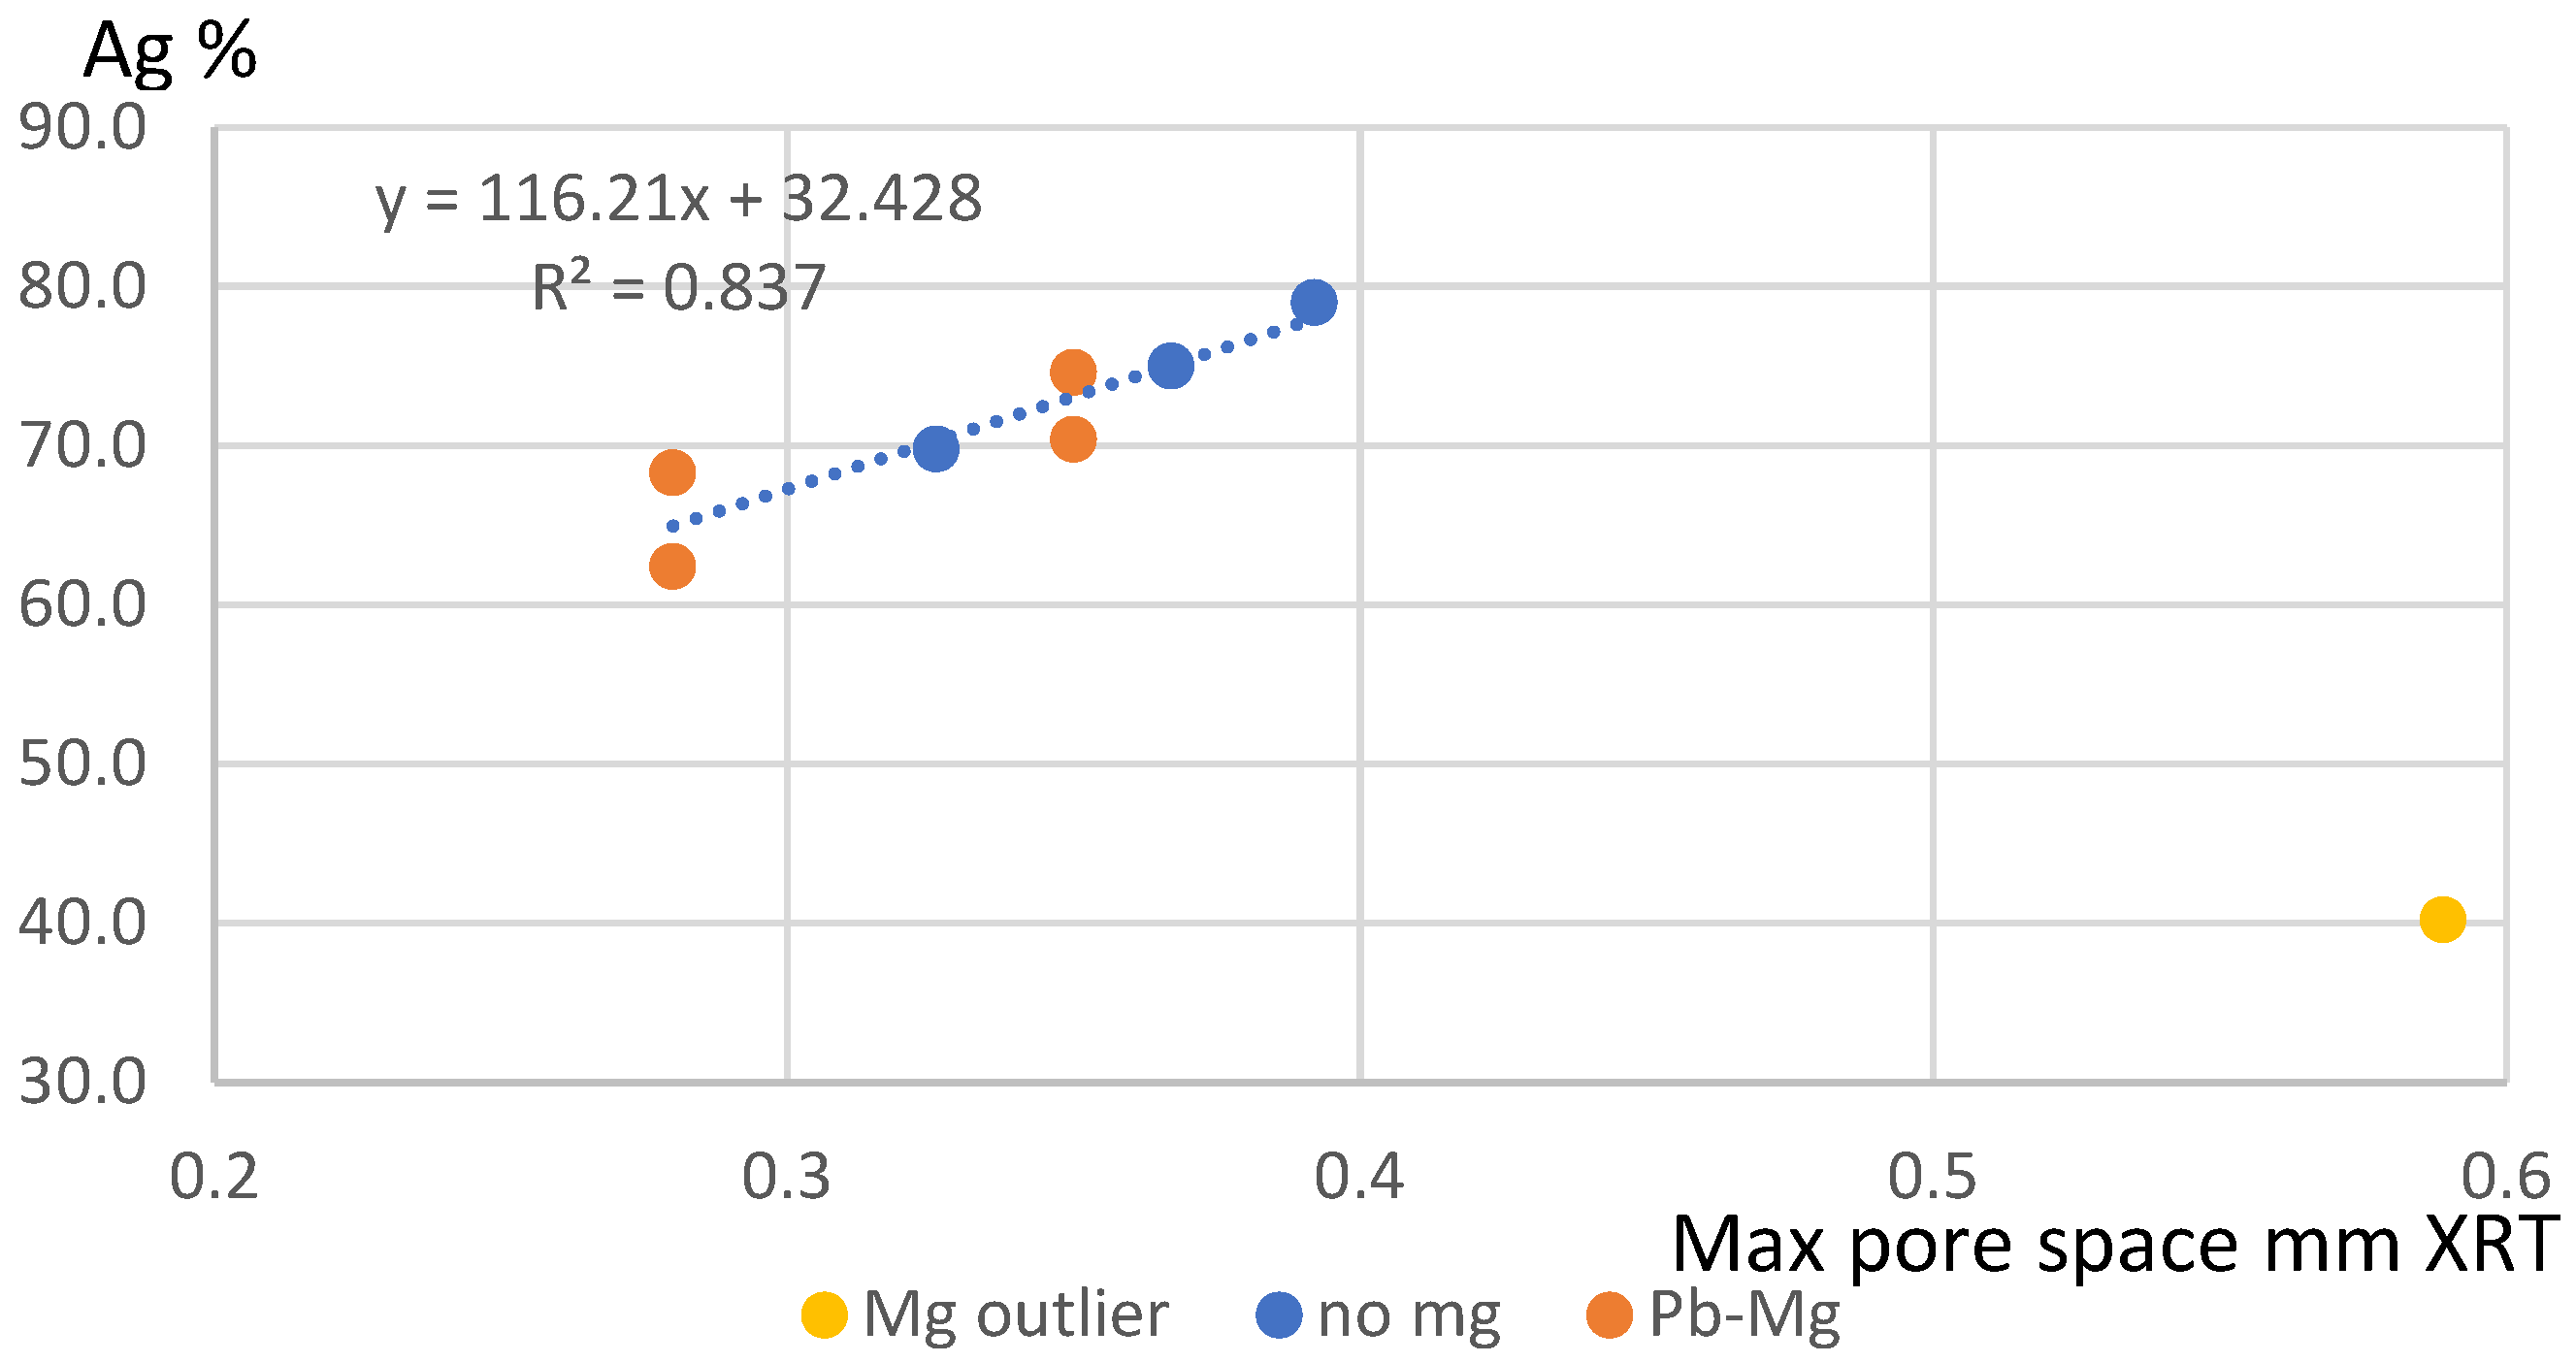
Figure 1. Ag% versus maximum pore space, measure in mm from XRT data. Correlation between Ag% content, as determined by assay, and max pore size, as determined by XRT. One outlier is identified by the grey symbol. As discussed in the main text, the oxidation of Mg metal used as inoculant likely caused different structure and composition of the resultant nanocrystals in the outlier. The dotted line represents the line of best fit of the data (excluding the outlier). Statistical accuracy is confirmed by p < 0.05.
Minerals 15 00853 g001
Figure 2. XRT (grey) and PSD (yellow) aspect ratios versus Ag% content. The top panel includes the outlier data points, which are removed from the bottom panel. The correlation improves significantly when the outlier data is excluded, as expected, as shown in the bottom panel.
Minerals 15 00853 g002
Figure 3. XRT visualization of sample Cd B2 unwashed and unconsolidated (see Table 1 for details). XRT section showing external voids as air-filled pores, which present as black; silver metal as grey; and retained lead as white. Discussion presented in p4–5 Section 3.3. 1 mm scale marker included.
Minerals 15 00853 g003
Figure 4. Summary of experimental data for particle size distribution results. Sample data and assays presented in Table 1 and Table 4, respectively. All samples were sieved < 1 mm after acid washing to remove any residual agglomerated particles.
Minerals 15 00853 g004
Figure 5. Aspect ratio versus particle diameter for the particle samples MgA2, MgA1, MgB1, CadA2, CadB2, BenchmarkB2, and Benchmark B3 (see Table 1 for details). Results obtained for all samples are shown.
Minerals 15 00853 g005
Figure 6. (Top): silhouette mean aspect ratio for triaxial ellipsoid versus x = 1 (fixed) y = z = radii. (Bottom): schematic illustrating the relationship between the triaxial ellipsoid with x fixed at 1 and y = z. The aspect ratio is defined based on min and max Feret dimensions of the mean silhouette.
Minerals 15 00853 g006aMinerals 15 00853 g006b
Figure 7. Sample Mg A1 (75.0% Ag); rounded smaller particles (~50 micron) with clear octahedron particles (~150 micron). Sample composition detailed in Table 1 and Table 4. The size bar represents 500 microns.
Minerals 15 00853 g007
Figure 8. Sample Benchmark B3 (79% Ag); small, rounded particles and octahedrons with side lengths of around 300 microns; large numbers of small, rounded octahedra show some evidence of triangular platelets. Sample composition detailed in Table 1 and Table 4. The 500-micron scale marker is included.
Minerals 15 00853 g008
Figure 9. Sample Cad B2 (69.8%Ag) (Cd); octahedra as twinned fibers, length/width aspect ratio of at least 5:1. Sample composition detailed in Table 1 and Table 4. The 500-micron scale marker is included.
Minerals 15 00853 g009
Figure 10. Sample Mg A2 (40.2% Ag) (Mg); smaller octahedra than sample 1 with some smaller rounded particles (typical particle size < 50 microns). Sample composition detailed in Table 1 and Table 4. The 200-micron scale marker is included for clarity.
Minerals 15 00853 g010
Figure 11. XRT crystal image reconstruction. Sample Mg A1. Facet length = 20 microns. Image of crystal not subject to acid washing. Because faceting is observed, this image suggests that faceting is as a crystallization feature and not a product of the acid treatment. The 10-micron scale marker is included for clarity.
Minerals 15 00853 g011
Table 1. Samples investigated, final Ag% recovered, and experiments conducted in each sample. Note P: SEM examination of pristine (not washed with acetic acid) sample. All other SEM samples were acetic acid-washed. Unconsolidated: PSD and SEM work on acetic acid-washed samples. A and B in sample names refer to multiple samples recovered from each numbered experimental run.
Sample Name Ag%Inoculant Species XRT
Resin
PSD
Unconsolidated
SEM Unconsolidated
CAD A162.2Cd
CAD B173.0Cd
CAD A269.6Cd
CAD B269.8Cd✓ S5
CAD A362.6Cd
CAD B361.8Cd
AL A168.4Al
AL B167.2Al
AL A269.2Al
AL B266.2Al
AL A363.4Al
AL B369.0Al
MG A175.0Mg✓ S4
MG B174.2Mg
MG A240.2Mg✓ S3✓ ✓ P
MG B247.0Mg
MG A349.2Mg
MG B373.0Mg
LI A170.6Li
LI B172.0Li
LI A266.6Li
LI B272.4Li
LI A369.2Li
LI B371.2Li
Benchmark A175.0None
Benchmark B168.8None
Benchmark A277.8None
Benchmark B277.6None
Benchmark A375.2None
Benchmark B379.0None✓ S6
Pb-Mg 1 A68.3Mg
Pb-Mg 1 B 70.4Mg
Pb-Mg 2 A62.4Mg
Pb-Mg 2 B74.6Mg
Table 2. Impurity and silver content of Ag crystal based on mass balance of cooling crystallization system used to produce the Ag crystals studied here. The assay represents the Ag crystal composition achieved from bulk cooling and lead removal with no inoculant species present and can be considered as a common basis for the samples, which had inoculant species added in separate trials.
SpeciesMass%
Ag77.80
Zn0.04
Pb21.14
Cu0.08
Sum100.00
Table 3. Threshold values used for image segmentation of Ag crystal aggregate samples.
SampleThreshold Value Used
Mg 2a (S3)28,000
Mg 1a (S4)24,123
Cd 2b(S5)27,033
Benchmark 3b (S6)27,400
Table 4. Assay results as mass% for selected silver samples (see Table 1 for samples description). Columns identified by ‘A’ and ‘B’ represent silver weight% content in the different samples identified in Table 1.
Metals Analysed by ICP-Ms (%) AB
SampleAlAsBiCdMgNiPbSbSnZnSum100-SumAgAg
Benchmark 1 <0.010.010.01<0.010.01<0.0122.54<0.01<0.010.0522.7677.2475.068.8
Benchmark 2 <0.01<0.01<0.01<0.01<0.01<0.0121.14<0.01<0.010.0421.3478.6677.877.6
Mg 10.03<0.01<0.01<0.010.49<0.0153.05<0.01<0.010.0553.6946.3140.047.0
Mg 20.01<0.01<0.01<0.010.43<0.0135.84<0.01<0.010.0436.3963.6975.074.2
Al 1<0.01<0.01<0.010.010.16<0.0131.57<0.01<0.010.0131.8268.1868.467.2
Al 2<0.01<0.01<0.010.010.17<0.0133.50<0.01<0.010.0433.7966.2169.266.2
Cd 1<0.01<0.01<0.010.57<0.01<0.0129.04<0.01<0.010.0129.7270.2862.273.0
Cd 2<0.01<0.01<0.010.55<0.01<0.0129.25<0.01<0.010.0229.9270.0869.669.8
Li 1<0.01<0.01<0.01<0.010.02<0.0129.62<0.01<0.010.0226.7473.2670.672.0
Li 20.01<0.01<0.01<0.010.01<0.0125.03<0.01<0.010.0125.1374.8766.672.4
Table 5. Inoculant particle samples Ag%, XRT measured length, breadth, volume, max pore space, and diameter determined from volume as well as median PSD diameter from dynamic picture analysis.
SeriesSample NoSampleAg%Length 3d mmBreadth 3d mmvol mm3Max Pore Space mmDiam From Vol mmPSD RCPE MM
initial4mg A240.20.28120.18490.0022060.5890.16180.132
1mg A175.00.23580.14480.0013860.3670.13860.112
3cad B269.80.2570.1590.0015490.3260.14380.294
2benchmark B379.00.26670.18450.0023630.3920.16560.308
recentpb mg A2Pb-Mg A262.40.31490.21810.00310.280.1812
pb mg B2Pb-Mg B274.60.41720.27870.00520.350.2153
recentpb mg A1Pb-Mg A168.30.31490.21810.00310.280.1812
pb mg B1Pb-Mg B170.40.41720.27870.00520.350.2153
Table 6. Characterization data obtained for samples obtained from two sets of production runs (identified as ‘Initial’ and ‘Recent’). The experimental samples are identified in Table 1. SD stands for standard deviation.
SeriesSample NoSampleAg%Length 3d mmBreadth 3d mmXRT AspectPSD Aspect
initial4mg A240.20.280.180.660.67
1mg A175.00.240.140.610.65
3cad B269.80.260.160.620.59
2benchmark B379.00.270.180.690.66
recentpb mg in 2Pb-Mg A262.40.310.220.69
pb mg out 2Pb-Mg B274.60.420.280.67
recentpb mg in 1Pb-Mg A168.30.310.220.69
pb mg out 1Pb-Mg B170.40.420.280.67
mean0.660.64
SD0.030.03
Disclaimer/Publisher’s Note: The statements, opinions and data contained in all publications are solely those of the individual author(s) and contributor(s) and not of MDPI and/or the editor(s). MDPI and/or the editor(s) disclaim responsibility for any injury to people or property resulting from any ideas, methods, instructions or products referred to in the content.