Article

Computational Approaches to Assess Flow Rate Efficiency During In Situ Recovery of Uranium: From Reactive Transport to Streamline- and Trajectory-Based Methods

by
Maksat Kurmanseiit
1,
Nurlan Shayakhmetov
1,*,
Daniar Aizhulov
2,*,
Banu Abdullayeva
3 and
Madina Tungatarova
1
1
Department of Mechanical Engineering, Satbayev University, Almaty 050013, Kazakhstan
2
Department of Software Engineering, Satbayev University, Almaty 050013, Kazakhstan
3
Department of Mechanics, Al-Farabi Kazakh National University, Almaty 050040, Kazakhstan
*
Authors to whom correspondence should be addressed.
Minerals 2025, 15(8), 835; https://doi.org/10.3390/min15080835
Submission received: 2 July 2025 / Revised: 25 July 2025 / Accepted: 5 August 2025 / Published: 6 August 2025
(This article belongs to the Section Mineral Processing and Extractive Metallurgy)

Abstract

This study presents a comprehensive computational analysis of flow rate efficiency during uranium extraction via the In Situ Recovery method. Using field data from a deposit located in Southern Kazakhstan, a series of mathematical models were developed to evaluate the distribution and balance of leaching solution. A reactive transport model incorporating uranium dissolution kinetics and acid–rock interactions were utilized to assess the accuracy of both traditional and proposed methods. The results reveal a significant spatial imbalance in sulfuric acid distribution, with up to 239.1 tons of acid migrating beyond the block boundaries. To reduce computational demands while maintaining predictive accuracy, two alternative methods, a streamline-based and a trajectory-based approach were proposed and verified. The streamline method showed close agreement with reactive transport modeling and was able to effectively identify the presence of intra-block reagent imbalance. The trajectory-based method provided detailed insight into flow dynamics but tended to overestimate acid overflow outside the block. Both alternative methods outperformed the conventional approach in terms of accuracy by accounting for geological heterogeneity and well spacing. The proposed methods have significantly lower computational costs, as they do not require solving complex systems of partial differential equations involved in reactive transport simulations. The proposed approaches can be used to analyze the efficiency of mineral In Situ Recovery at both the design and operational stages, as well as to determine optimal production regimes for reducing economic expenditures in a timely manner.

1. Introduction

The In Situ Recovery (ISR) method (also known as In Situ Leaching, ISL) has gained a widespread adoption for the extraction of minerals from low-concentration mineral deposits in permeable rock formations [1,2,3,4]. This technique currently represents the dominant approach for uranium extraction, accounting for as much as 55% of global uranium production in 2023 [5]. The ISR process for uranium extraction (Figure 1) involves the injection of a leaching solution through a network of injection wells into the target formation. As the solution permeates the rock matrix, the leaching agent chemically reacts with uranium-bearing minerals facilitating the dissolution of uranium from solid phases into the aqueous solution, which is subsequently recovered through production wells. The selection of leaching chemical compounds depends on the geochemical characteristics of the host rock, with either acidic or alkaline solutions employed. The majority of economically viable uranium reserves worldwide can be exploited with an acidic solution, while sulfuric acid is the most common choice [5,6].
Common well arrangement patterns for uranium ISR are hexagonal (Figure 2a) and linear (Figure 2b) configurations [2,3,6,7]. In Kazakhstan, sulfuric acid solution is typically employed as the injected reagent to dissolve the mineralogical composition of deposits. When the reagent interacts with uranium-bearing minerals that contain complex compounds of tetravalent and hexavalent uranium oxides, dissolution occurs through chemical reactions, resulting in the formation of a pregnant solution containing uranium sulfate. The resulting solution is subsequently extracted to the surface through a network of production wells. Wells are typically grouped into cells (for hexagonal arrangement—six injection wells with a production well at the center). A technological block consists of multiple cells. Individual deposits are exploited using numerous technological blocks.
The determining factor in production efficiency is the uniformity of the distribution of leaching solution within the formation, which depends on both the geological structure of the subsoil and the geotechnological parameters of the process such as well flow rates. The uneven distribution of the leaching reagent in the formation, caused by ineffective choice of well flow rates, leads to the occurrence of dilution and spreading zones. This, in turn, causes variations in the operation time of individual cells. Consequently, the operational duration of the technological block is determined by the extraction time of the cell with the longest leaching process duration, resulting in increased operating costs.
During deposit development, information on geological structure and mineralogical composition is available only at well locations; constructing a geological model using various algorithms provide an ambiguous representation. In this regard, accurate information can be utilized when conducting laboratory experiments in columns, while an alternative solution would be to average or reconstruct data using various geostatistical methods [8]. Hydrodynamic and chemical processes during leaching occur underground and are not directly observable. The only means of observation is through monitoring wells or based on data obtained from technological wells. Feasible analysis of the efficiency of different extraction scenarios at full-scale is only possible through numerical modeling studies. Results of geological modeling serve as input parameters for subsequent reactive transport simulation, which provides visual representation of hydrochemical leaching processes to identify stagnant (unleached) zones as well as acid migration outside the technological block. The recovery rate over time determined by these simulations is the primary basis for analyzing the process efficiency of the block [9].
Currently, various software tools are available for these purposes. Some researchers utilize packages for modeling reactive transport in porous media, such as GMS [10,11,12] and TOUGHREACT [13,14], to study extraction processes. Concurrently, French, Russian, and Kazakhstani researchers have developed proprietary software tools for modeling and studying extraction processes. French researchers employ the HYTEC RT software package to conduct numerical studies and modeling of processes occurring in uranium deposits [15,16,17,18]. The Russian software product “Sevmur” developed at the Seversk Technological Institute of the National Research Nuclear University MEPhI, has also been applied in numerous studies, as demonstrated by the works of Ushakov and Noskov [19,20]. Similar studies have been conducted in Kazakhstan [9,21,22,23]. Employing AI modeling such as neural networks to simulate various stages of ISR has been a promising approach in terms of reducing computational costs [24,25,26,27,28,29]. In addition, several published studies demonstrate successful applications of bioleaching for various minerals and metals, which may also provide a useful basis for extending such approaches to uranium leaching processes [30,31,32]. These examples confirm the high applicability of mathematical modeling for solving problems related to uranium extraction using the ISR method.
In the conventional flow distribution approach, injection well flow rates are determined on the basis of the number of production wells they work with. For example, in Figure 2a, which illustrates a hexagonal well pattern, well In 1 is a source of incoming flow to one production well (Pr1), while well In 2 is partnered with wells Pr 1 and Pr 4, at the same time well In 3 provides a leaching solution to wells Pr 1, Pr 2, and Pr 3. A similar methodology is applied to linear well arrangements. According to drilling standards and inclinometry data, at a 400 m drilling depth, the well deviation can reach 4.6 m [33]. Such deviations alter the actual interwell spacing, resulting in uneven distribution of the leaching reagent, which is not accounted for in the conventional approach. Consequently, two critical questions arise before or during the production stage, as follows:
  • How to determine the distribution of concentration of the leaching agent inside the technological block?
  • How to distribute the flow rates of the wells accounting for the effective distance between the wells to improve the efficiency of production?
A key factor in determining the efficiency of flow rates is the so-called solution balance—which conveys hydrodynamic equilibrium or uniformity of aciditification during the period of active leaching and must be ensured both for individual operational cells and for the block as a whole. In the traditional method, solution balance is manually calculated in Excel by inputting injection and production data for each well within a well layout. Injection volumes per cell are estimated using formulas that distribute each injection well’s capacity proportionally among the associated production wells [7].
Given that the distances between wells are specified at the design stage of the technological block and are determined based on inclinometry data, they remain fixed during operation. The concentration (acidity) of the injected solution also cannot be adjusted individually for each well, since a single distribution unit serves the entire technological block. It should be noted that reagent concentration may vary over time, but this does not affect its spatial distribution. Thus, the only controllable variable to achieve uniform solution spread is the distribution of well flow rates; therefore, the efficiency of the leaching process can be enhanced only through optimal flow rate selection among wells. The application of modern mathematical modeling methods in combination with historical data on the well flow rates and acidity of injected solutions enables the identification of solution imbalance zones, i.e., variations in reagent concentration among cells within the considered domain [7]. The identification of such zones forms is an important step.
In this article, the following three approaches are considered to address the first question: reactive transport modeling, as well as the proposed streamline-based and trajectory-based methods for evaluating the efficiency of ISR under specified flow rates and well configurations by calculating the solution balance.

2. Materials and Methods

The study was based on data from the technological block of the Budenovskoye deposit (located in the Turkestan Region, Kazakhstan), presented in [9,34,35]. The area of the studied site was 23,700 m2, with an average specific uranium productivity of 15.25 kg/m2. The technological block was accessed through a well system organized in four hexagonal cells, where the inter-well distance ranged from 40 to 45 m (Figure 3). In this study, groundwater flow was excluded from the simulations based on the assumption that its velocity is significantly lower than the flow induced by well operations.
Figure 4 shows the acidity data of the leaching solution in the injection wells for the specified block, as well as the flow rates of the leaching and productive solution during the 478-day development period [34,35]. As shown in the figure, during the initial two months of operation, leaching is intensified due to increased sulfuric acid concentration in the leaching solution. Additionally, the flow rate of production wells exceeds that of injection wells by 0.69%, which was implemented to reduce the likelihood of leaching solution migration into groundwater. The main lithological and hydrodynamic characteristics of the Budenovskoye deposit rock are presented in Table 1. For modeling purposes, it was assumed that the uranium content in the ore is c U = 0.077 % , with an equal ratio of uranium compounds U ( I V ) and U ( V I ) .

2.1. The Model of the Hydrodynamic Process

To determine the solution imbalance in the block, i.e., to identify zones of deficiency or surplus of solution caused by the non-optimal distribution of injection well flow rates, a numerical study of the ISR process was conducted in the technological block shown in Figure 3. The propagation of solution in porous rock is described by the elliptic Equation (1), derived from the law of mass conservation, and Darcy’s law (2) as follows:
. v = i = 1 N P r Q P r i δ ( x x P r i , y y P r i ) + j = 1 N I n Q I n j δ ( x x I n j , y y I n j )
v = u ϕ = K p μ p
where v [ m.day 1 ] —real velocity vector; N P r , N I n —number of production and injection wells, respectively; Q P r i [m3 .day 1 ] —flow rate of the i-th production well; x P r i and y P r i [m]—coordinates of the i-th production well; Q I n j [m3 .day 1 ] —flow rate of the j-th injection well; x I n j and y I n j [m]—coordinates of the j-th injection well; u [ m.day 1 ] —Darcy’s velocity vector; ϕ [m3 .m 3 ] —rock porosity K p [ m 2 ] —rock permeability; and p [Pa]—pressure.
In practice, due to the low concentration of the reagent in the leaching solution and the relatively small fraction of rock components involved in the reaction, the densities of both the leaching and production solutions are comparable to that of groundwater. Therefore, it is reasonable to assume constant density ( ρ = c o n s t ). Considering the relationship between pressure and hydraulic head ( p = ρ g h ), this allows the following relationship to be established between permeability and hydraulic conductivity.
K f = K p ρ g μ
where K f [ m.day 1 ] —hydraulic conductivity; ρ [ kg.m 3 ] —fluid density; g [ m.s 2 ] —gravitational acceleration; and μ [Pa.day]—dynamic viscosity of fluid.
Then Equation (2) takes the following form:
v = u ϕ = K f h
where h [m]—hydraulic head.
Equation (1), which describes the change in hydraulic head, is an elliptic equation and is solved by iterative methods [36,37,38,39]. For equations of this type, a zero initial approximation (5) and boundary Conditions (6), corresponding to the remote boundaries conditions, are used. The essence of this approach lies in a significant distance of the boundaries from the area under consideration, which allows minimizing their influence on the simulation results in the inter-well and near-well space. In this regard, as shown in Figure 3, an additional indent of 120 m is provided in the computational domain. However, for clarity, in the future, the simulation results will be presented only for the region of interest.
Initial approximation :   h t = 0 = 0
Boundary   conditions :   h n Ω = 0 .

2.2. The Reactive Transport Model

To analyze acid consumption and compare the study results with empirical data, a simulation of uranium extraction with sulfuric acid solution was performed. Due to the lack of precise data on the ratio of U ( I V ) and U ( V I ) compounds in the rock and their different reaction rates with sulfuric acid, in simplified manner, the uranium dissolution process can be described by two main chemical-kinetic reactions (7) and (8) as follows:
U O 3 ( s ) + H 2 S O 4 ( l ) k U ( V I ) U O 2 S O 4 ( l ) + H 2 O ( l )
U O 2 ( s ) + H 2 S O 4 ( l ) + O x i d a n t ( l ) k U ( I V ) U O 2 S O 4 ( l ) + 2 H ( l ) + + R e d u c t a n t ( s )
where k U ( V I ) and k U ( I V ) [L.mol−1 .day 1 ] —the reaction rate constants for the dissolution of uranium trioxide and uranium dioxide, respectively.
During leaching solution flow through porous media, along with uranium compound dissolution, chemical interaction of sulfuric acid with rock components occurs. These side reactions must also be considered in modeling, as they significantly affect reagent consumption. According to [40], the majority of sulfuric acid in the leaching process is consumed through interaction with impurities, despite the fact that the proportion of these substances actually entering solution does not exceed 1%. In the mathematical model, the effect of oxidizers on uranium mineral solubility is not considered. Designating non-uranium compounds dissolved in sulfuric acid as M i n e r a l s ( s ) , the reaction of leaching solution interaction with rock can be represented in a general form as follows:
M i n e r a l s ( s ) + H 2 S O 4 ( l ) k M i n e r a l s S o l u t i o n ( l )
where M i n e r a l s ( s ) [ mol.L 1 ] —the concentration is calculated based on a solid rock, a molar mass of which corresponds to the average molar mass of the components that are dissolved by leaching solution; k M i n e r a l s [L.mol−1 .day 1 ] —reaction rate constant for dissolution of minerals.
Thus, based on the proposed chemical model of reactions (7)–(9) and considering experimental data on uranium compound solubility [7], a numerical study of uranium extraction processes by the ISR method was conducted. The corresponding differential equations reflecting the dynamics of solid phase dissolution under leaching solution action can be represented in the following form [36,37,38,41]:
t ( 1 ϕ ) c U O 3 = ω 1
t ( 1 ϕ ) c UO 2 = ω 2
t ( 1 ϕ ) c Minerals = ω 3
where c U O 3 , c U O 2 and c m i n e r a l s [ mol.L 1 ] —molar concentrations of uranium trioxide, uranium dioxide, and other minerals, respectively; t [day]—time; and ω i [mol.L−1 .day 1 ] —rate of change of concentration of the i-th component.
As a result of chemical reactions (7)–(9), described by the Law of Mass Action, the reaction rates can be expressed as follows:
ω 1 = k U ( V I ) c U O 3 c H 2 S O 4 , ω 2 = k U ( I V ) c U O 2 c H 2 S O 4 , ω 3 = k Minerals c Minerals c H 2 S O 4 .
where k U ( V I ) = 4.4 ± 0.1 , k U ( I V ) = 0.6 ± 0.1 and k Minerals = 0.5 ± 0.1 in L.mol−1.day−1 [9]
The transport of injected solution in porous media is governed by the combined action of convective transport, molecular and mechanical dispersion, and chemical reactions with rock components. These processes are described by the following equations:
t ϕ c H 2 S O 4 + . ϕ c H 2 S O 4 u = . ϕ D c H 2 S O 4 ω 1 + ω 2 + ω 3 + + i = 1 N P r c H 2 S O 4 Q P r i Δ V δ ( x x P r i , y y P r i ) + j = 1 N I n c H 2 S O 4 0 Q I n j Δ V δ ( x x I n j , y y I n j )
t ϕ c U O 2 S O 4 + . ϕ c U O 2 S O 4 u = . ϕ D c U O 2 S O 4 ω 1 + ω 2 + + i = 1 N P r c U O 2 S O 4 Q P r i Δ V δ ( x x P r i , y y P r i )
where c H 2 S O 4 [ mol.L 1 ] —molar concentration of sulfuric acid in leaching solution; D [m2 .day 1 ] —dispersion coefficient; c H 2 S O 4 0 —initial concentration of sulfuric acid in injection wells; and c U O 2 S O 4 [ mol.L 1 ] —molar concentration of uranyl sulfate in pregnant solution.
The temporal variations in acidity and flow rates of injection and production wells in the block (Figure 4) were used as initial data for modeling the uranium extraction process from the block. The modeling was carried out using software developed by the authors, which has been tested and applied at several uranium production sites operated by JSC NAC Kazatomprom. The distributions of hydraulic head (Figure 5), leaching agent (Figure 6), dissolved useful component (Figure 7), and mineral in solid form (Figure 8) on the 478th day of operation are shown. As illustrated in Figure 6, the reagent extends beyond the block boundaries. The comparison shows that the normalized root mean square deviation (NRMSD) between the experimental and numerical values of uranium concentration in the leach solution does not exceed 1.7% [9].
Table 2 shows the mass of chemical components and the mass-to-cell volume ratio in each individual cell of the block, calculated from the three-dimensional modeling results of the uranium leaching process.
According to the data in Table 2, the sulfuric acid concentration in the second and third well cells significantly exceeds the values observed in the first and fourth cells. This indicate the disturbance of solution balance between the cells. Meanwhile, 239.12 tons of acid out of 5805 total tons used over 478 days can be observed escaping beyond the block.

3. Results and Discussion

Maintaining a balance between injection and production of solutions allows for the effective localization of circulation within the well cell, preventing both dilution of the productive solution and leakage of the leaching agent beyond the domain. However, during parallel operation of adjacent cells, maintaining such balance is complicated by potential uneven flows between them due to geological and filtration heterogeneity of rocks.
Consider the solution balance calculation method used at JSC NAC Kazatomprom enterprises using the example shown in Figure 9. The total integral flow rate of injection and production wells for the entire block development period approaches zero (16), indicating general compliance with mass balance by liquid.
time i = 1 N P r Q P r i ( t ) + j = 1 N I n Q I n j ( t ) 0
Maintaining the overall solution balance for the entire block does not guarantee equilibrium in each individual cell. To assess the local balance, the total injection volume for each cell should be calculated separately. As an example, consider a cell that includes production well P r 1 and calculate the balance between the flow rates of the injection and production wells.
Q s u m 1 = Q P r 1 + λ 1 , 1 Q I n 1 + λ 1 , 2 Q I n 2 + λ 1 , 3 Q I n 3 + λ 1 , 16 Q I n 16 λ 1 , 17 Q I n 17 + λ 1 , 18 Q I n 18
For the remaining cells a similar approach can be applied, as follows:
Q s u m 2 = Q P r 2 + λ 2 , 3 Q I n 3 + λ 2 , 4 Q I n 4 + λ 2 , 5 Q I n 5 + λ 2 , 14 Q I n 14 λ 2 , 15 Q I n 15 + λ 2 , 16 Q I n 16
Q s u m 3 = Q P r 3 + λ 3 , 5 Q I n 5 + λ 3 , 6 Q I n 6 + λ 3 , 7 Q I n 7 + λ 3 , 12 Q I n 12 λ 3 , 13 Q I n 13 + λ 3 , 14 Q I n 14
Q s u m 4 = Q P r 4 + λ 4 , 7 Q I n 7 + λ 4 , 8 Q I n 8 + λ 4 , 9 Q I n 9 + λ 4 , 10 Q I n 10 λ 4 , 11 Q I n 11 + λ 4 , 12 Q I n 12
where λ i , j —weighting factor distributing the flow rate of the j-th injection well to the i-th production well; and Q s u m i [m3 .day 1 ] —balance between the flow rates of injection wells and production wells in the i-th cell. The weighting factor for each injection well is determined based on the number of production wells it influences.

3.1. Traditional Method for Determining the Balance of Solutions

In the traditional method, the weighting factor is determined only by the well flow rates. For example, for injection well In 1, which operates exclusively for production well Pr 1, the weighting factor would be equal to one as follows: λ 1 , 1 = Q P r 1 / Q P r 1 = 1 (Figure 10). At the same time, for injection well In 3, connected to two production wells—Pr 1 and Pr 2—the weighting factor will be as fp;;pws: λ 1 , 3 = Q P r 1 / ( Q P r 1 + Q P r 2 ) = 1 / 2 .
Therefore, it is possible to calculate the solution balance for each cell with the corresponding production wells. Formula (18) is used to determine the solution volume, and Formula (19) is used to calculate the mass. The results are given in Table 3, where the solution volumes and masses in all cells are equal. This is fundamentally different from the results of mathematical modeling, where the solution spreads beyond the block. This discrepancy is explained by the fact that the formula used does not account for the distance between wells, which leads to identical results for all cells.
V i = Q s u m i d t
M i = Q s u m i C i d t
One of the disadvantages of this method is the difficulty of application to linear well configuration (Figure 2). For example, for injection well In 3, it remains unclear how it is connected to three production wells. Thus, the distribution of flows in such schemes largely depends on the subjective choice of a specialist, which reduces the objectivity and reproducibility of the results.

3.2. Streamline-Based Method for Determining the Balance of Solutions

Based on the calculated hydrodynamic head distribution obtained from Equation (1), the velocity field is calculated using Equation (2), which is then used to construct streamline distribution utilizing the Pollock’s method.
The Pollock method is one of the most widely used algorithms for tracing streamlines based on a predetermined velocity field specified at the nodes of a regular or irregular three-dimensional Cartesian grid. A schematic illustration of this method is shown in Figure 11. The algorithm for constructing streamlines according to Pollock [21,42,43] consists of step-by-step calculation of incoming and outgoing flows in each cell of the computational domain using the previously obtained velocity field (Figure 11a).
The real (pore) velocity values ( v = u . ϕ [ m . s 1 ] used in the calculations enable the determination of the particle exit coordinate from the computational cell based on their entry point, using Formulas (23)–(27). Due to the use of a staggered grid, the velocity components within cell ( i , j ) are specified on its edges, and inside the cell the velocity distribution v x is approximated by a linear dependence described by the corresponding expression given in [42].
v x = v x i 1 / 2 + g x i x x i 1 / 2 = d x / d t
g x i = v x i + 1 / 2 v x i 1 / 2 / Δ x
where v x i 1 / 2 and v x i + 1 / 2 —velocity components along the axis x; g x i —a velocity gradient in the direction of x; and Δ x = x i + 1 / 2 x i 1 / 2 . Meanwhile, in the directions of the y and z axes, similar expressions can be written for the projections of velocities and velocity gradients.
To obtain a universal expression applicable to all coordinate directions, we introduce the notation ξ ( x , y , z ) , corresponding to the coordinate axes x, y, and z. Then, for an arbitrary entry point of the streamline ξ i ( x i , y i , z i ) , the exit time Δ t ξ through the corresponding cell edge is determined by integrating the velocity component v ξ i along the direction ξ as follows (see Figure 11a):
Δ t ξ = 1 g ξ l n v ξ 0 + g ξ ( ξ e ξ 0 ) v ξ 0 + g ξ ( ξ i ξ 0 ) , ξ ( x , y , z )
where ξ e = ( x e , y e , z e ) —outlet, which is an unknown exit coordinate.
The streamline leaves the cell through the edge with the minimal exit time:
Δ t i = min ξ { x , y , z } ( Δ t ξ )
Accordingly, the coordinates of the outlet ξ e = ( x e , y e , z e ) are determined based on Equation (23), using the found minimum exit time Δ t i as follows (Figure 11b):
ξ e = 1 g ξ l n v ξ i e x p ( g ξ Δ t i ) v ξ 0 + ξ 0 , ξ { x , y , z }
When a streamline enters cell ( i , j ) with a given velocity v ξ i = u ξ i . ϕ , the minimum residence time in the cell Δ t m is calculated from its projections, based on which the exit coordinate ξ e is determined. Thus, the streamline is constructed step by step from one cell to another. As a result, the obtained streamlines will differ both in spatial length (Figure 11b) and in traveled time through the computational domain (Figure 11c).
As an example, let us consider one cell with a hexagonal well configuration for constructing streamlines (Figure 12a). For calculations, the hydrodynamic Equation (1) is used with initial conditions (5) and remote boundary conditions (6). Hydraulic head distribution is determined by solving Equation (1) iteratively (Figure 12a). Then, according to Equation (2), the velocity field is calculated, which is then used in order to construct streamlines utilizing Equations (23)–(27).
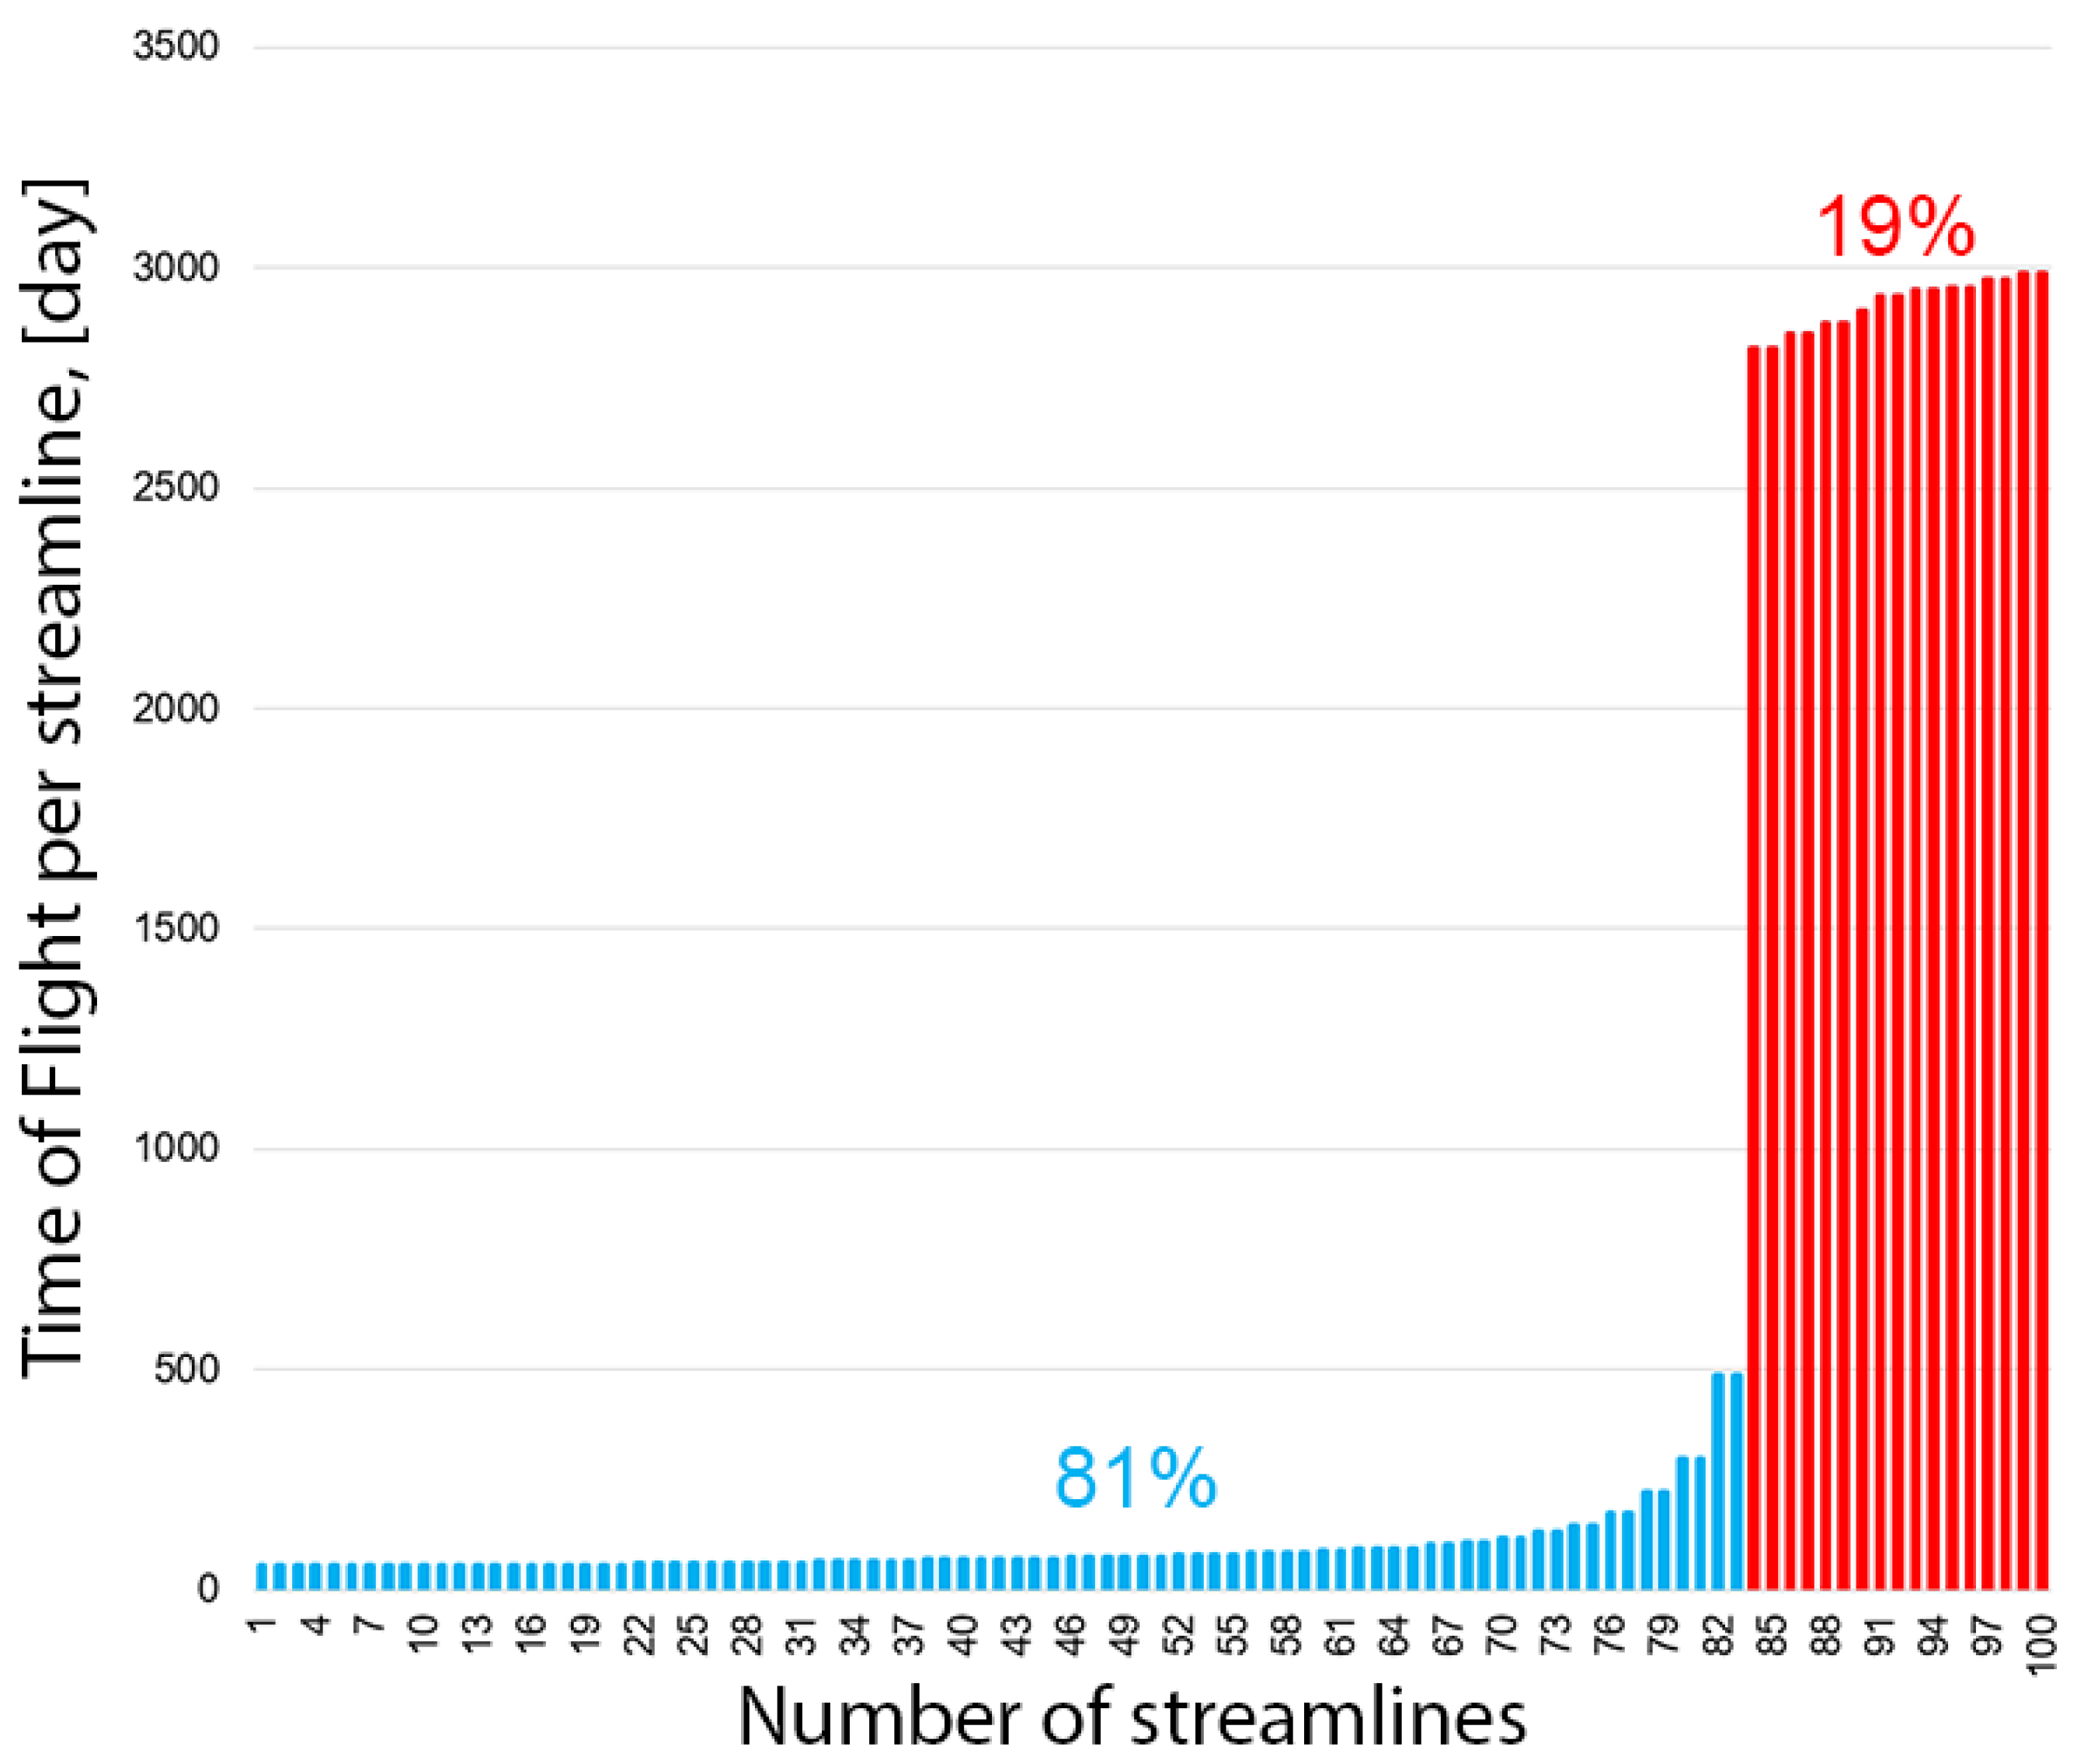
For each injection well, 100 streamlines were constructed with the streamline outlet having an equal angular interval. Figure 12b illustrates the diagram of their spatial distribution. Figure 13 shows the distribution of the time of flight along the streamlines ( τ ) exiting from the injection well In 1.
A total of 19% of all streamlines do not reach the production well within 478 days with travel time being too high. Let us recall that the Budenovskoye deposit operational time was exactly 478 days. Therefore, further calculations are conducted with maximum travel time ( τ e n d ) capped at 478 days to reflect the complete dynamics, with the number of streamlines always being 100.
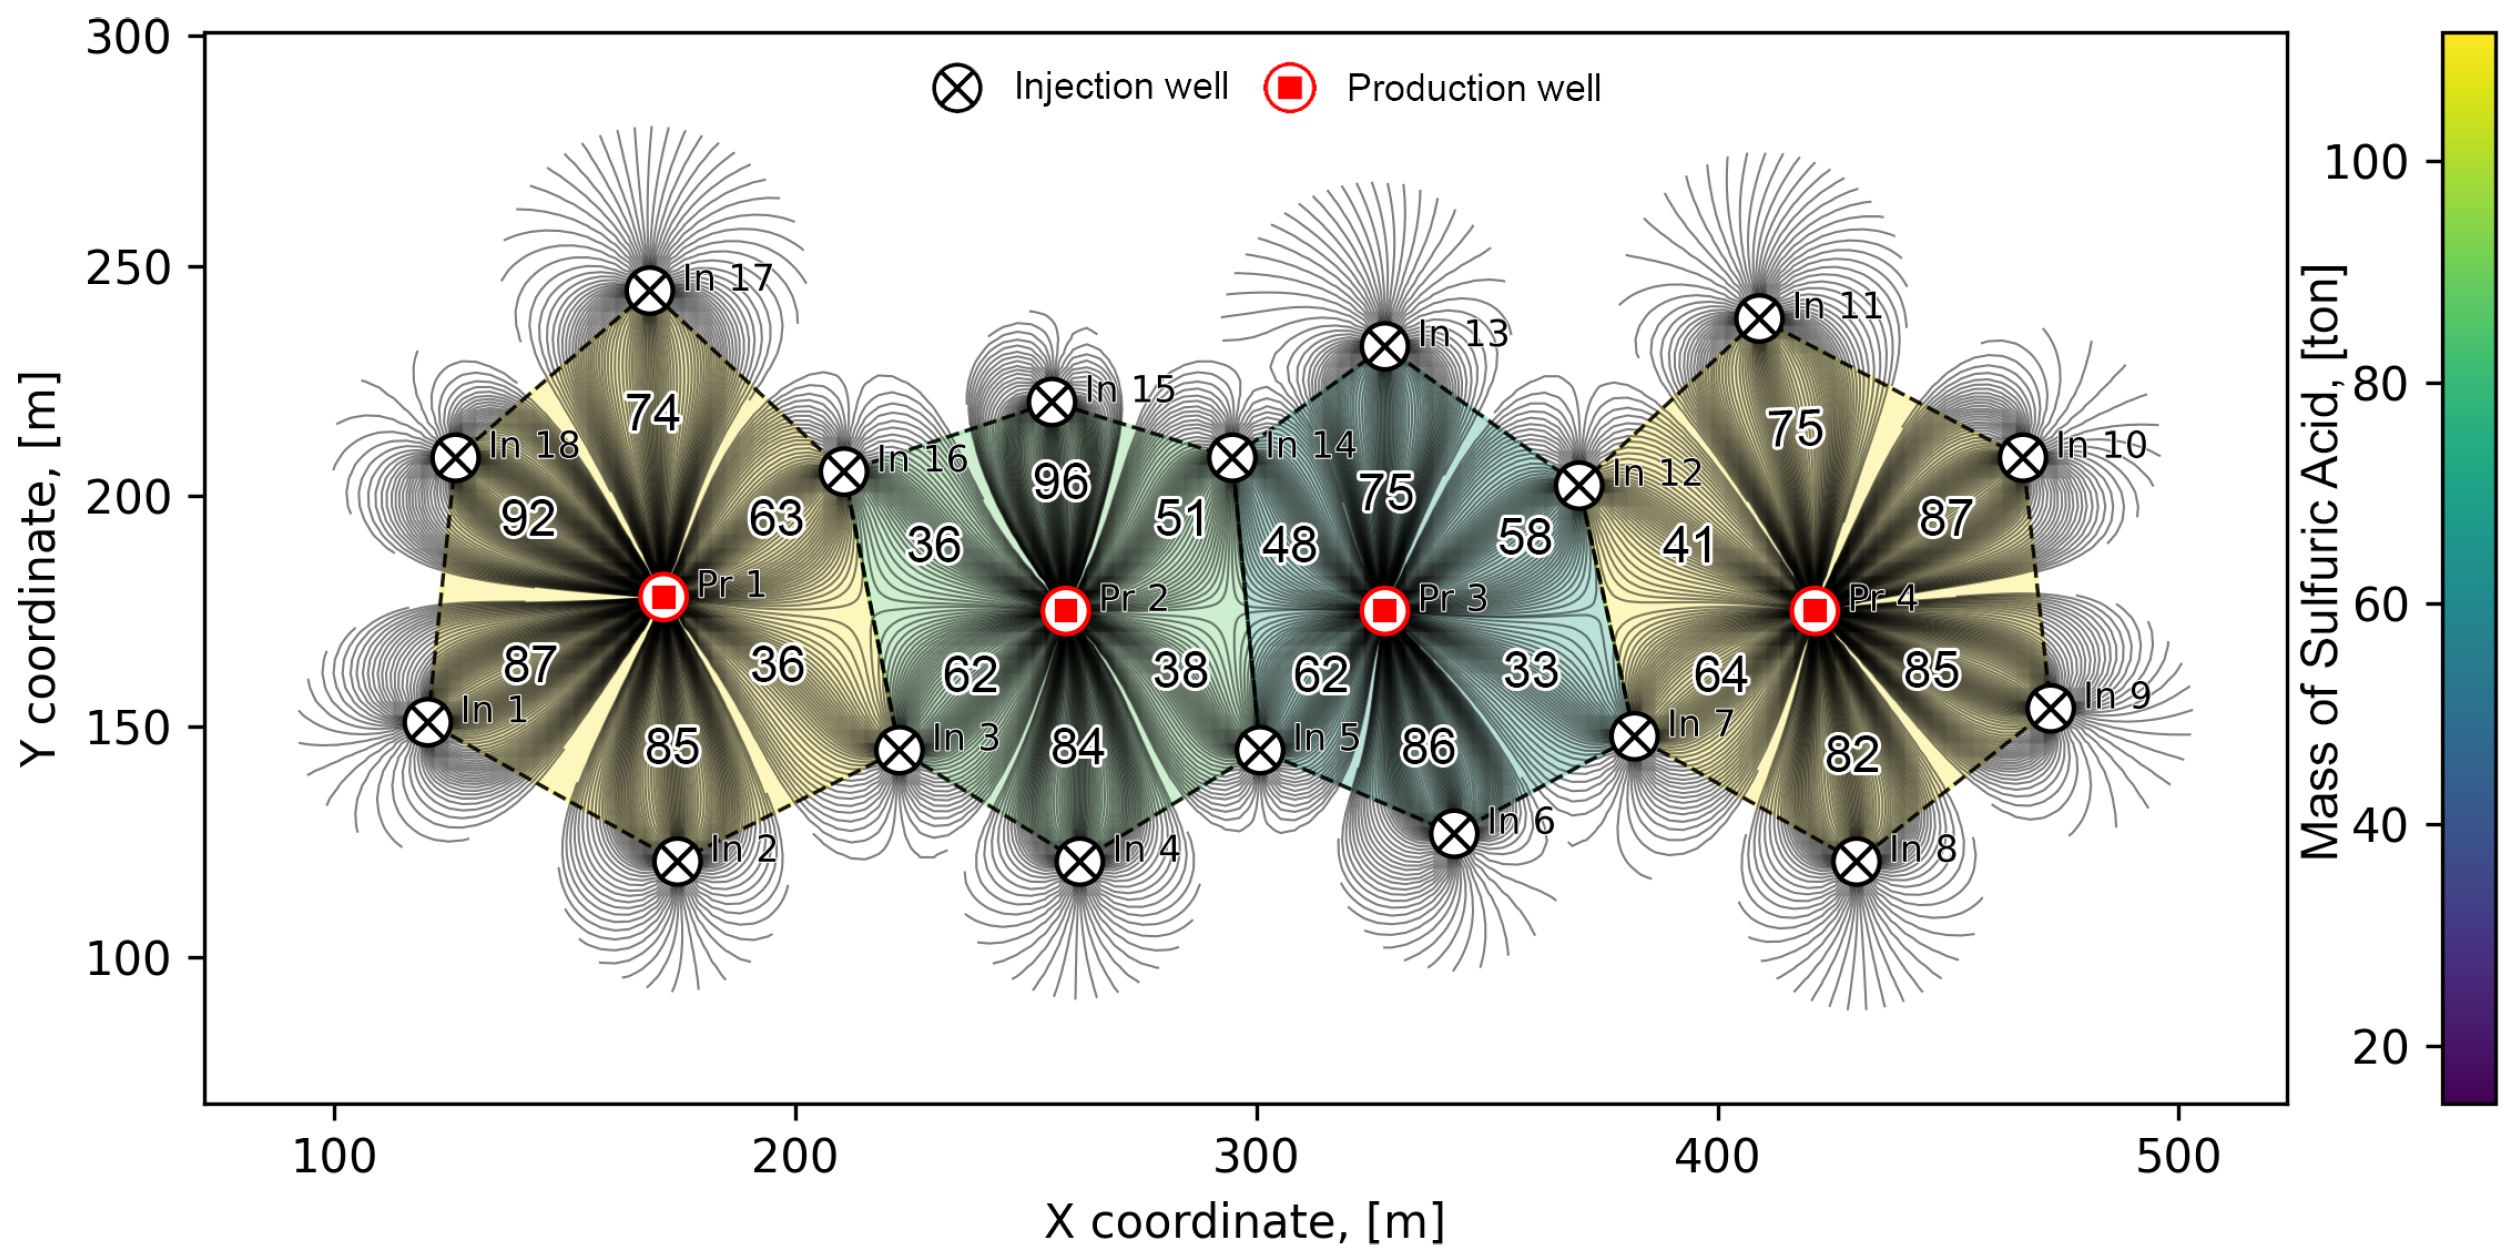
Furthermore, the streamlines are plotted for the Budenovskoye deposit on the last, 478th day of production. This allows for clear visualization of the solution flows at the final stage of block operation. On Figure 14 the numbers placed between the injection and production wells indicate the number of streamlines that have passed from a specific injection well to the corresponding production well.
Based on the resulting spatial distribution of streamlines, the balance of flow rates between the injection and production wells is determined as a weighting factor ( λ i , j ) as a ratio of the number of streamlines n running from a particular injection well j to the corresponding production well i and the total number of streamlines N launched from the injection well j, as follows:
λ i , j = n N
For example, in Figure 14, 35 and 65 streamlines go from injection well In 3 to production wells Pr 1 and Pr 2, respectively. Thus, the weighting factor for the first cell with production well Pr 1 is λ 1 , 3 = 35 / 100 , and for the second cell with production well Pr 2 is λ 2 , 3 = 65 / 100 .
It should be noted that not all streamlines necessarily end in production wells. This may be due either to insufficient duration of production or to the spreading of the solution beyond the block. For example, from injection well In 1 only 95 streamlines (out of 100) reach production well Pr 1. In this case, the weighting factor is λ 1 , 1 = 95 / 100 . The remaining five streamlines are considered to have spread and are included in the calculation of the mass of reagent that has left the block.
Table 4 shows the results of calculations using Equations (17)–(19), where the proportion of streamlines is taken as a weighting factor for calculating the balance. As can be seen in Figure 14, part of the solution goes beyond the block, which indicates the presence of spreading. The total volume of leakage is 258.22 tons of sulfuric acid, according to the data in Table 4. Meanwhile, according to the results of reactive transport modeling, the spreading amounted for 239.11 tons (Table 2). Thus, the streamline method demonstrates close agreement with the model, with a difference of 7.9%. The total imbalance for the entire computational domain was 59.32 tons, which is due to the excess of the total flow rate of production wells over injection wells by 0.69%.
However, when analyzing the distribution in individual cells of the block, discrepancies in the mass of sulfuric acid are observed compared to the results of numerical modeling. Additionally, the value of τ e n d is the main parameter directly affecting the results of solution balance/imbalance. Considering that τ e n d varies depending on the characteristics of the block (distance between wells, permeability, position of well screens, etc.), the selection of this parameter is a complex task requiring additional research. Accordingly, to eliminate this drawback of the streamline method, the trajectory method was further developed.

3.3. Trajectory-Based Method for Determining the Balance of Solutions

The dynamics of the field development includes the change in well flow rates over time ( t c h a n g e ) as shown in Figure 4. The trajectory method is based on the construction of streamlines taking into account the change in well flow rates over time. The most important difference between the trajectory method and the streamline method is the determination of the shortest exit time by comparing the exit time from the cell ( Δ t ξ ) and the time interval between changes in well flow rates ( Δ t c h a n g e ), as follows:
Δ t i = min ξ { x , y , z } ( Δ t ξ , ( Δ t c h a n g e )
An analysis of the results presented in Table 5, obtained based on Equations (23)–(25), (3), and (29), showed that when using the trajectory method with weighting factors determined by the proportion of trajectories, significant spreading of the leaching solution beyond the block contour is observed. The visualization in Figure 15 confirms the fact that flow goes beyond the contour of the well cells. According to calculations, the sulfuric acid leakage beyond the contour was 348.24 tons (Table 5).
For comparison, the results obtained during the full simulation of chemical processes (Table 2) indicate a significantly smaller spreading volume—239.11 tons. Thus, the discrepancy between the two approaches is 45.63%, which indicates an overestimation of the leakage volume in the trajectory method. This overestimation is justified by the fact that well pressures gradually increase since the operation commencement. The trajectory-based method traces flow from the initial moment of development, resulting in a broader spread, since the mutual influence of wells is weaker at early stages. A disadvantage of a trajectory method is that any change in flow rates is not reflected on the follow-up trajectories. A more accurate representation could be achieved by reducing the time step used in trajectory construction; however, this significantly increases the total computation time, approaching that of a full reactive flow simulation. Such an approach contradicts the primary objective of using this simplified method, specifically, to reduce computational cost while maintaining acceptable accuracy. On the other hand, the streamline-based method does not have this disadvantage.
Additionally, the calculations showed the presence of a general imbalance of solutions within the entire simulated area, the value of which was 59.32 tons. The main reason for this imbalance is the discrepancy between the total flow rates of production and injection wells, which exceeds 0.69%.

4. Conclusions

As part of this study, mathematical modeling of the uranium extraction process using the In Situ Recovery method was performed using the Budenovskoye deposit as an example. The modeling included calculating the hydraulic head distribution, which was used to obtain a velocity field. Subsequently, using the obtained velocity field, simulation of chemical processes occurring in the ore-bearing rock was performed. The results of numerical modeling showed the presence of zones of leaching solution spreading beyond the designated contour of the block. The total mass of sulfuric acid that migrated beyond the site boundaries was 239.12 tons. Additionally, solution imbalance is observed in all cells as follows: in cells 1 and 4, the sulfuric acid concentration relative to cell volume is significantly higher than in cells 2 and 3. This indicates uneven reagent distribution within the block.
Simulation of chemical processes is a resource-intensive task, as it requires calculation of reactive transport considering chemical equations and detailed geochemical description of the deposit. Furthermore, the accuracy of obtained results largely depends on chemical reaction rate coefficients, determined only through field experiments and numerous numerical calculations. In this regard, the authors proposed a simplified method for determining solution imbalance based on streamline and flow trajectory analysis, with subsequent comparison of these methods with the traditional approach.
Calculation of imbalance using the traditional method showed the same acid deficit of 14.73 tons in each cell, with a total shortage of 58.93 tons. This result is due to the excess of total production well flow rate over injection wells by 0.69%. The main disadvantage of this method is the lack of consideration of solution spreading beyond the contour, distances between wells, and filtration-capacitive characteristics of rocks.
The proposed method based on streamline analysis uses a velocity field calculated using Darcy’s law considering actual permeability values, well locations, and flow rates. According to calculations, the mass of acid that left the block was 258.22 tons, which differs by 7.9% from results obtained using full chemical process simulation. The imbalance distribution also showed compliance with simulation data: the deficit in cells 1 and 4 was higher than in cells 2 and 3. However, the streamline method revealed a smaller acid deficit in cell 3 compared to cell 2, in contrast to simulation results, where such a trend was not observed.
Additionally, an alternative method based on solution flow trajectory construction was developed. Its key feature is the construction of continuous flow paths from the beginning to the end of block operation, considering the flow history of each well. The imbalance distribution obtained using this method also showed good agreement with chemical modeling results inside the cells. Unlike the streamline method, the trajectory method did not reveal any deviations in solution distribution between cells 2 and 3. However, the mass of spread acid was significantly overestimated—348.24 tons, which is 45.6% higher than the value obtained with full chemical simulation. This recalculation reflects the gradual increase in well pressure at the start of block development. The trajectory method, starting from the initial time, overestimates spreading due to limited early well interaction, and while reducing the time step could improve accuracy, it would significantly increase computation time, undermining the method’s main advantage of reduced computational cost.
Thus, despite high accuracy, chemical process modeling requires significant computing resources and time. The traditional method, with minimal time costs, is inferior in accuracy due to ignoring geological and technological parameters. The streamline method, in turn, provides acceptable accuracy with significantly lower resource costs and can be fully automated. The trajectory method demonstrates the best results inside the design contour, but it is less accurate in predicting spreading outside it.
For the block under consideration, which includes 22 wells and a production period of 478 days, the hydrodynamic simulation required approximately 1 h and 2 min, while the reactive transport simulation took about 1 h and 5 min. This results in a total computation time of 2 h and 7 min for the full model. In contrast, the use of the streamline and trajectory methods with a precomputed velocity field (calculated by hydrodynamic simulation) required only 3 min. When combined with the hydrodynamic simulation, the total time was reduced to 1 h and 8 min, representing time savings of approximately 54%. Furthermore, the computational efficiency of these simplified methods can be enhanced with reduced frequency of flow rate updates ( Δ t c h a n g e ), as well as in cases involving multiple reactive components, which would have significantly increased the computational cost of reactive transport modeling.

Author Contributions

Conceptualization, M.K. and M.T.; methodology, M.K.; software, D.A. and B.A.; validation, B.A. and M.K.; formal analysis, N.S. and M.T.; investigation, M.K.; resources, M.T.; data curation, B.A.; writing—original draft preparation, D.A., N.S. and M.T.; writing—review and editing, D.A.; visualization, B.A. and M.K.; supervision, M.T.; project administration, M.T.; funding acquisition, M.T. All authors have read and agreed to the published version of the manuscript.

Funding

This research was funded by the Ministry of Science and Higher Education of Kazakhstan, grant number AP19676743.

Data Availability Statement

The original contributions presented in this study are included in the article. Further inquiries can be directed to the corresponding author.

Conflicts of Interest

The authors declare no conflicts of interest.

References

  1. Abzalov, M.Z. Sandstone-Hosted Uranium Deposits Amenable for Exploitation by In Situ Leaching Technologies. Appl. Earth Sci. 2012, 121, 55–64. [Google Scholar] [CrossRef]
  2. Seredkin, M.; Zabolotsky, A.; Jeffress, G. In Situ Recovery, an Alternative to Conventional Methods of Mining: Exploration, Resource Estimation, Environmental Issues, Project Evaluation and Economics. Ore Geol. Rev. 2016, 79, 500–514. [Google Scholar] [CrossRef]
  3. Li, G.; Yao, J. A Review of In Situ Leaching (ISL) for Uranium Mining. Mining 2024, 4, 120–148. [Google Scholar] [CrossRef]
  4. Bhargava, S.K.; Ram, R.; Pownceby, M.; Grocott, S.; Ring, B.; Tardio, J.; Jones, L. A Review of Acid Leaching of Uraninite. Hydrometallurgy 2015, 151, 10–24. [Google Scholar] [CrossRef]
  5. Nuclear Energy Agency. Uranium 2024: Resources, Production and Demand; OECD Publishing: Paris, France, 2025; pp. 12–14. Available online: http://oecd-nea.org/upload/docs/application/pdf/2025-04/7683_uranium_2024_-_resources_production_and_demand_2025-04-22_14-29-2_928.pdf (accessed on 25 July 2025).
  6. Bruneton, P.; Cuney, M. Geology of Uranium Deposits. Uranium Nucl. Power 2016, 2, 11–52. [Google Scholar] [CrossRef]
  7. Poezhaev, I.P.; Polynovsky, K.D.; Gorbatenko, O.A.; Panova, E.N.; Bulenova, K.Z.; Karmanov, E.M.; Blynsky, P.A.; Bitovt, O.A. Geotechnology of Uranium [Geotehnologiya Urana]; Kazakh Universitety: Almaty, Kazakhstan, 2017; p. 319. (In Russian) [Google Scholar]
  8. Aizhulov, D.; Tungatarova, M.; Kaltayev, A. Streamlines Based Stochastic Methods and Reactive Transport Simulation Applied to Resource Estimation of Roll-Front Uranium Deposits Exploited by In-Situ Leaching. Minerals 2022, 12, 1209. [Google Scholar] [CrossRef]
  9. Kurmanseiit, M.B.; Tungatarova, M.S.; Kaltayev, A.; Royer, J.-J. Reactive Transport Modeling during Uranium In Situ Leaching (ISL): The Effects of Ore Composition on Mining Recovery. Minerals 2022, 12, 1340. [Google Scholar] [CrossRef]
  10. Zhang, C.; Xie, T.T.; Tan, K.X.; Yao, Y.X.; Wang, Y.A.; Li, C.G.; Li, Y.M.; Zhang, Y.; Wang, H. Hydrodynamic Simulation of the Influence of Injection Flowrate Regulation on In-Situ Leaching Range. Minerals 2022, 12, 787. [Google Scholar] [CrossRef]
  11. Zhang, C.; Tan, K.; Xie, T.; Tan, Y.; Fu, L.; Gan, N.; Kong, L. Flow Microbalance Simulation of Pumping and Injection Unit in In Situ Leaching Uranium Mining Area. Processes 2021, 9, 1288. [Google Scholar] [CrossRef]
  12. Zhang, C.; Li, Y.; Niu, Y.; Tan, K.; Xie, T.; Yao, Y.; Li, C.; Liu, Z. Quantitative determination of the leaching range of in situ leaching mining area by stagnation point. Nucl. Eng. Technol. 2024, 103204. [Google Scholar] [CrossRef]
  13. Li, H.; Tang, Z.; Xiang, D. Study on Numerical Simulation of Reactive-Transport of Groundwater Pollutants Caused by Acid Leaching of Uranium: A Case Study in Bayan-Uul Area, Northern China. Water 2024, 16, 500. [Google Scholar] [CrossRef]
  14. Zhou, Y.; Li, G.; Xu, L.; Liu, J.; Sun, Z.; Shi, W. Uranium recovery from sandstone-type uranium deposit by acid in situ leaching—An example from the Kujieertai. Hydrometallurgy 2019, 191, 105209. [Google Scholar] [CrossRef]
  15. Collet, A.; Regnault, O.; Ozhogin, A.; Imantayeva, A.; Garnier, L. Three-Dimensional Reactive Transport Simulation of Uranium In Situ Recovery: Large-Scale well Field Applications in Shu Saryssu Bassin, Tortkuduk Deposit (Kazakhstan). Hydrometallurgy 2022, 211, 105873. [Google Scholar] [CrossRef]
  16. Escario, S.; Seigneur, N.; Collet, A.; Regnault, O.; de Boissezon, H.; Lagneau, V.; Descostes, M. A reactive transport model designed to predict the environmental footprint of an ’in situ recovery’ uranium exploitation. J. Contam. Hydrol. 2023, 254, 104106. [Google Scholar] [CrossRef] [PubMed]
  17. De Boissezon, H.; Levy, L.; Jakymiw, C.; Distinguin, M.; Guerin, F.; Descostes, M. Modeling uranium and 226Ra mobility during and after an acidic in situ recovery test (Dulaan Uul, Mongolia). J. Contam. Hydrol. 2020, 103711. [Google Scholar] [CrossRef] [PubMed]
  18. Seigneur, N.; Grozeva, N.; Purevsan, B.; Descostes, M. Reactive transport modelling as a toolbox to compare remediation strategies for aquifers impacted by uranium in situ recovery. J. Contam. Hydrol. 2024, 265, 104392. [Google Scholar] [CrossRef]
  19. Ushakov, A.O.; Zherin, I.I.; Muslimova, A.V.; Noskov, M.D. Research of the influence of the feed solution flow rate on the uranium refining in an extraction column cascade. At. Energy 2023, 135, 40–46. [Google Scholar] [CrossRef]
  20. Noskov, M.D.; Mikhailov, A.N.; Narushkin, R.S.; Rusin, R.S. “Smart field” of in situ leach uranium mining. Gorn. Zh. 2022, 4, 39–45. [Google Scholar] [CrossRef]
  21. Kurmanseiit, M.B.; Tungatarova, M.S.; Royer, J.-J.; Aizhulov, D.Y.; Shayakhmetov, N.M.; Kaltayev, A. Streamline-based reactive transport modeling of uranium mining during in situ leaching: Advantages and drawbacks. Hydrometallurgy 2023, 220, 106107. [Google Scholar] [CrossRef]
  22. Shayakhmetov, N.M.; Alibayeva, K.A.; Kaltayev, A.; Panfilov, I. Enhancing uranium in situ leaching efficiency through the well reverse technique: A study of the effects of reversal time on production efficiency and cost. Hydrometallurgy 2023, 219, 106086. [Google Scholar] [CrossRef]
  23. Imankulov, T.; Lebedev, D.; Matkerim, B.; Daribayev, B.; Kassymbek, N. Numerical Simulation of Multiphase Multicomponent Flow in Porous Media: Efficiency Analysis of Newton–Based Method. Fluids 2021, 6, 355. [Google Scholar] [CrossRef]
  24. Mukhamediev, R.I.; Kuchin, Y.; Amirgaliyev, Y.; Yunicheva, N.; Muhamedijeva, E. Estimation of Filtration Properties of Host Rocks in Sandstone-Type Uranium Deposits Using Machine Learning Methods. IEEE Access 2022, 10, 18855–18872. [Google Scholar] [CrossRef]
  25. Wang, B.; Luo, Y.; Qian, J.; Liu, J.; Li, X.; Zhang, Y.; Chen, Q.; Li, L.; Liang, D.; Huang, J. Machine learning–based optimal design of the in situ leaching process parameter (ISLPP) for the acid in situ leaching of uranium. J. Hydrol. 2023, 626, 130234. [Google Scholar] [CrossRef]
  26. Daribayev, B.; Akhmed-Zaki, D.; Imankulov, T.; Nurakhov, Y.; Kenzhebek, Y. Using machine learning methods for oil recovery prediction. In Proceedings of the 17th European Conference on the Mathematics of Oil Recovery, Virtual-Online, 14–17 September 2020; p. 166287. [Google Scholar] [CrossRef]
  27. Aizhulov, D.; Tungatarova, M.; Kurmanseiit, M.; Shayakhmetov, N. Artificial Neural Networks for Mineral Production Forecasting in the In Situ Leaching Process: Uranium Case Study. Processes 2024, 12, 2285. [Google Scholar] [CrossRef]
  28. Kurmanseiit, M.B.; Tungatarova, M.S.; Abdullayeva, B.Z.; Aizhulov, D.Y.; Shayakhmetov, N.M. Acceleration of Numerical Modeling of Uranium In Situ Leaching: Application of IDW Interpolation and Neural Networks for Solving the Hydraulic Head Equation. Minerals 2024, 14, 1043. [Google Scholar] [CrossRef]
  29. Qiu, W.; Yang, Y.; Song, J.; Que, W.; Liu, Z.; Weng, H.; Wu, J.; Wu, J. A deep-learning-based multiobjective optimization for the design of in situ uranium leaching system under multiple uncertainties. J. Hydrol. 2025, 651, 132576. [Google Scholar] [CrossRef]
  30. Kiskira, K.; Lymperopoulou, T.; Lourentzatos, I.; Tsakanika, L.-A.; Pavlopoulos, C.; Papadopoulou, K.; Ochsenkühn, K.-M.; Tsopelas, F.; Chatzitheodoridis, E.; Lyberatos, G.; et al. Bioleaching of Scandium from Bauxite Residue using Fungus Aspergillus Niger. Waste Biomass Valor. 2023, 14, 3377–3390. [Google Scholar] [CrossRef]
  31. Laurent, G.; Izart, C.; Lechenard, B.; Fabrice, G.; Philippe, M.; Pauline, C.; Truche, L.; Royer, J.-J.; Fillipov, L. Numerical modelling of column experiments to investigate in situ bioleaching as an alternative mining technology. Hydrometallurgy 2019, 188, 272–290. [Google Scholar] [CrossRef]
  32. Abhilash; Mehta, K.D.; Kumar, V.; Pandey, B.D.; Tamrakar, P.K. Bioleaching—An Alternate Uranium Ore Processing Technology for India. Energy Procedia 2011, 7, 158–162. [Google Scholar] [CrossRef]
  33. DePonty Jersy, D.; Shane, R.G.; DePinto, P.; Grant Kornrumph, S.; Marvin, F.; Glotfelty, R.G. Plumbness and Alignment Standards—Analysis and Recommendations for Operational Applicability. pp. 1–7. Available online: https://inspectapedia.com/water/Water-well-plumbness-alignment-standards-DePonty.pdf (accessed on 24 June 2025).
  34. Patrin, A.P.; Zabaznov, V.L.; Chistilin, P.E. The main results of a full-scale field experiment on the ISL of Uranium at site №2 of the Budenovskoye deposit. In Proceedings of the V International Conference, “Actual Problems of the Uranium Industry”, Almaty, Kazakhstan, 19–20 September 2008; pp. 198–204. [Google Scholar]
  35. Podrezov, D.R. Development and Identification of Models for the Reserves Estimating of the URANIUM In-Situ Leaching Mine. Master’s Thesis, National Research Technological University “MISIS”, Moscow, Russia, 2021. [Google Scholar]
  36. Bear, J. Dynamics of Fluids in Porous Media; Dover Publications Inc.: New York, NY, USA, 2014; p. 757. [Google Scholar]
  37. Acosta, J.L.; Camacho, A.F. Porous Media: Heat and Mass Transfer, Transport and Mechanics; Nova Science Publishers Inc.: New York, NY, USA, 2009; p. 255. [Google Scholar]
  38. Zheng, C.; Wang, P.P. MT3DMS: A Modular Three-Dimensional Multispecies Transport Model for Simulation of Advection, Dispersion, and Chemical Reactions of Contaminants in Groundwater Systems; Engineer Research and Development Center: Vicksburg, MS, USA, 1999; p. 24. [Google Scholar]
  39. Danayev, N.T.; Korsakova, N.K.; Penkovskiy, V.I. Mass Transfer in the Near-Wellbore Zone and Electromagnetic Formation Logging [Massoperenos vs. Priskvazhinnoy Zone i Elektromagnitnyy Karotazh Plasta]; Qazaq universiteti: Almaty, Kazakhstan, 2005; p. 180. (In Russian) [Google Scholar]
  40. Gromov, B.V. Introduction to Chemical Technology of Uranium [VVedenie vs. Himicheskuyu Tehnologiyu Urana]; Atomizdat: Moscow, Russia, 1978; p. 326. (In Russian) [Google Scholar]
  41. Steefel, C.I.; DePaolo, D.J.; Lichtner, P.C. Reactive transport modeling: An essential tool and a new research approach for the Earth sciences. Earth Planet. Sci. Lett. 2005, 240, 539–558. [Google Scholar] [CrossRef]
  42. Pollock, D.W. Semi-analytical Computation of Path Line for Finite Difference Models. Ground Water 1988, 6, 743–750. [Google Scholar] [CrossRef]
  43. Kuljabekov, A. Model of Chemical Leaching with Gypsum Sedimentation in Porous Media. Ph.D. Thesis, University of Lorraine, Nancy, France, Almaty, Kazakhstan, 2014; p. 99. [Google Scholar]
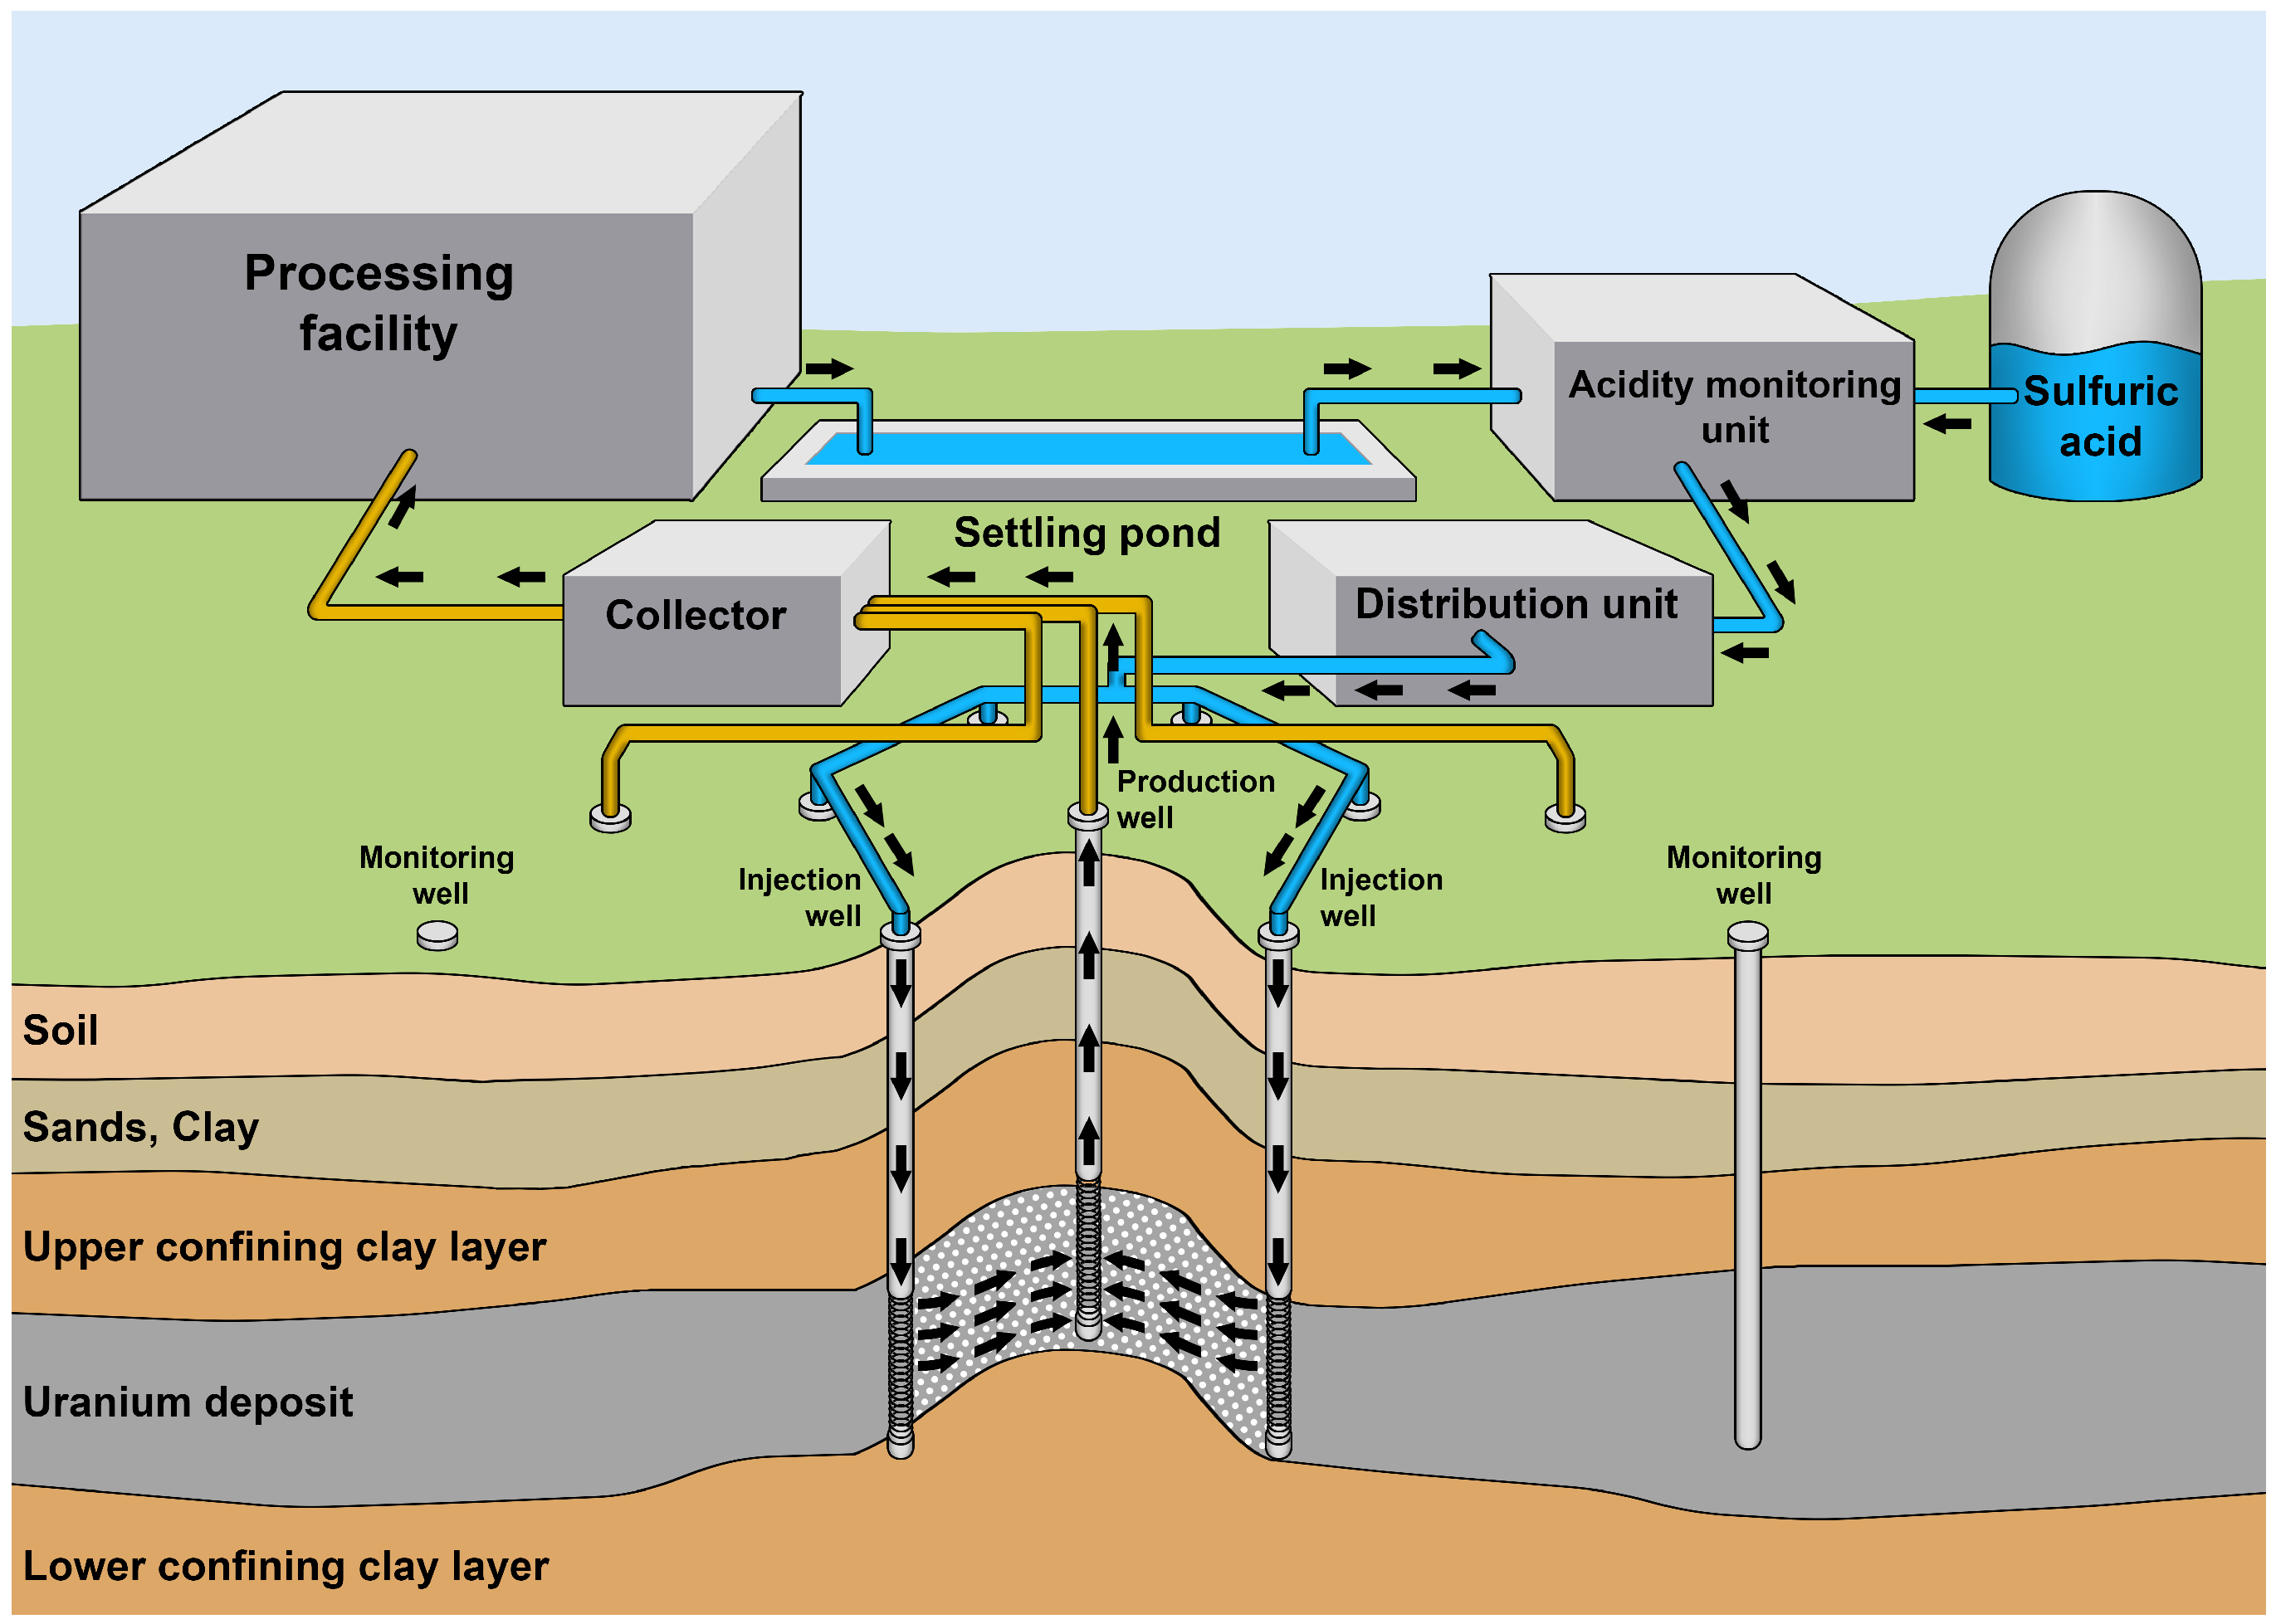
Figure 1. ISR process schematic representation.
Minerals 15 00835 g001
Figure 2. Schematic representation of commonly employed well configurations during the ISR of uranium: hexagonal (a) and linear (b). The arrows indicate the anticipated flow direction from injection wells toward production wells.
Minerals 15 00835 g002
Figure 3. Scheme of well layout of the considered technological block of the Budenovskoye deposit.
Minerals 15 00835 g003
Figure 4. Changes in flow rates of injection and production, as well as leaching solution acidity in injection wells over the block’s operation time.
Minerals 15 00835 g004
Figure 5. Distribution of the hydraulic head in the stratum at t = 478 [day].
Minerals 15 00835 g005
Figure 6. Distribution of the sulfuric acid concentration in leaching solution in the stratum at t = 478 [day].
Minerals 15 00835 g006
Figure 7. Distribution of the dissolved uranium in pregnant solution in the stratum at t = 478 [day].
Minerals 15 00835 g007
Figure 8. Distribution of the concentration of the remaining solid mineral in the stratum at t = 478 [day].
Minerals 15 00835 g008
Figure 9. Well operation scheme for the technological block of the Budenovskoye field. The arrows indicate the anticipated flow direction from injection wells toward production wells.
Minerals 15 00835 g009
Figure 10. Results of the distribution of the mass of sulfuric acid in well cells calculated by the traditional method.
Minerals 15 00835 g010
Figure 11. Schematic illustration of Pollock’s method on a regular 2D grid. Where: (a) the process of constructing streamlines within a single cell; (b) the process of constructing streamlines within the entire computational domain; and (c) the transformation from a multidimensional space to a one-dimensional space, where the coordinate corresponds to the time of flight.
Minerals 15 00835 g011
Figure 12. Distribution of hydraulic head (a) and streamlines (b).
Minerals 15 00835 g012
Figure 13. Travel time for each streamline exiting from injection well In 1.
Minerals 15 00835 g013
Figure 14. Streamline field in the stratum under the influence of a well network.
Minerals 15 00835 g014
Figure 15. Solution flow trajectories in the stratum under the influence of a well network.
Minerals 15 00835 g015
Table 1. Characteristics of the Budyonovskoye deposit site.
ParameterSymbolUnitValue
Deposit average thicknessHm11.28
Average uranium mass fraction y U kg.kg−10.00077
Uranium meter-percent 1 a U m%0.8686
Hydraulic conductivity K f m.day−17.0
Rock density ρ s kg.m−31700
Rock porosity ϕ m3.m−30.22
1 Defined as the product of the ore thickness and the average uranium mass fraction ( a U = H c U ).
Table 2. Component masses and mass-to-cell volume ratios in individual well cells, calculated using reactive transport modeling.
ParameterCell 1Cell 2Cell 3Cell 4Outside of Cells
Well cell volume
V, [ m 3 ]95,796.6774,178.3972,539.0990,981.22
Mass of individual components
M H 2 S O 4 , [t]108.87130.91128.96109.40239.12
M U O 2 S O 4 , [t]10.927.397.4610.110.33
M U , [t]76.9539.3537.6370.460.00
Mass of components per unit volume
M H 2 S O 4 . V 1 , [ kg.m 3 ]1.141.761.781.20
M U O 2 S O 4 . V 1 , [ kg.m 3 ]0.110.100.100.11
M U . V 1 , [ kg.m 3 ]0.800.530.520.77
Table 3. Results of solution balance estimation based on the traditional method.
ParameterCell 1Cell 2Cell 3Cell 4Total
V I n V P r V P r ,   [ % ]−0.69−0.69−0.69−0.69
V I n V P r , [ m 3 ]−1199.56−1199.56−1199.56−1199.56
M H 2 S O 4 , [t]−14.73−14.73−14.73−14.73−58.93
Table 4. Results of solution balance estimation based on streamline simulation ( τ e n d = 478 days).
ParameterCell 1Cell 2Cell 3Cell 4Outside of CellsTotal
V I n V P r V P r ,   [ % ]−6.90−4.57−2.56−5.97
V I n V P r , [ m 3 ]−11928.34−7895.88−4420.70−10,318.96
M H 2 S O 4 , [t]−108.33−72.91−42.53−93.78258.22−59.32
Table 5. Results of solution balance estimation based on streamline simulation ( τ e n d = 478 days).
ParameterCell 1Cell 2Cell 3Cell 4Outside of CellsTotal
V I n V P r V P r ,   [ % ]−8.31−5.65−4.49−8.14
V I n V P r , [ m 3 ]−14,368.15−9777.74−7772.34−14,081.44
M H 2 S O 4 , [t]−126.16−87.31−70.36−123.73348.24−59.32
Disclaimer/Publisher’s Note: The statements, opinions and data contained in all publications are solely those of the individual author(s) and contributor(s) and not of MDPI and/or the editor(s). MDPI and/or the editor(s) disclaim responsibility for any injury to people or property resulting from any ideas, methods, instructions or products referred to in the content.