Article

Mineralogical and Geochemical Characterization of the Benavila (Portugal) Bentonites

by
Javier García-Rivas
1,*,
Maria Isabel Dias
2,3,
Isabel Paiva
2,3,
Paula G. Fernandes
2,
Rosa Marques
2,3,
Emilia García-Romero
1,4 and
Mercedes Suárez
5
1
Department of Mineralogy and Petrology, Complutense University of Madrid, 28040 Madrid, Spain
2
Center for Nuclear Sciences and Technologies (C2TN), Instituto Superior Técnico, University of Lisbon, Estrada Nacional 10, km 139.7, 2695-066 Bobadela, Portugal
3
Department of Nuclear Sciences and Engineering (DECN), Instituto Superior Técnico, University of Lisbon, Estrada Nacional 10, km 139.7, 2695-066 Bobadela, Portugal
4
Institute of Geosciences (IGEO), Complutense University of Madrid–Consejo Superior de Investigaciones Científicas, 28040 Madrid, Spain
5
Department of Geology, University of Salamanca, 37008 Salamanca, Spain
*
Author to whom correspondence should be addressed.
Minerals 2025, 15(8), 836; https://doi.org/10.3390/min15080836
Submission received: 27 May 2025 / Revised: 30 July 2025 / Accepted: 5 August 2025 / Published: 7 August 2025

Abstract

This work aims to perform a detailed mineralogical, crystal-chemical, and geochemical characterization of bentonites from the Benavila outcrop, the largest known deposit of bentonites in continental Portugal. Bulk samples and different size fractions were characterized through X-Ray Diffraction (XRD). Structural formulae of the smectites were fitted from point analyses acquired by analytical electron microscopy (AEM) with transmission electron microscopy (TEM). Smectites are the major component with variable amounts of calcite and minor amounts of quartz, feldspar, illite, and chlorite. Occasionally, amphiboles and dolomite have also been identified. The high content of carbonates in different parts of the sampling area is related to the circulation of carbonate-rich fluids. The smectites present high-layer charge, are intermediate terms of the montmorillonite–beidellite series, and also show an intermediate cisvacant–transvacant configuration. Major and trace elements concentrations were determined by ICP-MS. The geochemical analysis of the samples indicates an enrichment in SiO2 and Al2O3 and a depletion of the more clayey materials in REE, HFSE, and Y, among others. The calculation of the PIA and CIA alteration indices, along with other parameters observed, shows the possible alteration pathways of the Benavila deposit. Research to evaluate the ability of these bentonites to be used as engineering barrier systems (EBS) and sealing materials for radioactive waste repositories is ongoing.

1. Introduction

Bentonites are clayey industrial rocks of great economic interest whose main component is smectites. The most important physical–chemical properties of these minerals are their high specific surface area and cation exchange capacity, which are deeply related [1,2,3,4], along with their variable layer charge, allowing them to react with inorganic and organic reagents. Hence, they have swelling and rheological properties and high plasticity, which play a very important role in the industrial field [5,6]. Their applications are diverse, contingent on the aforementioned properties. While their most prominent use is as ad-absorbents, their significance in other domains cannot be overstated. For instance, they are used in civil engineering, as binding agents, as additives in animal nutrition, as catalysts or support for catalysts [5,6,7], which also have to be highlighted. Apart from the typical fields in which these materials have been traditionally used, in recent years there has been a spike in the use of bentonites in the fields of nanocomposites [8,9,10], pharmaceutics [11,12], medicine [13,14,15], among many others. The study of bentonites as engineering barrier systems (EBS) and sealing materials in radioactive waste repositories has to be highlighted, since this research field has been one of the most prominent ones in the last four decades regarding these materials [16,17,18,19,20,21,22].
The largest known deposit of bentonites in continental Portugal is located in Benavila (in the Alentejo region) (Figure 1). This deposit was formed due to the weathering of granitoids from the Benavila igneous massif [23,24], mainly composed of quartz, plagioclase, and amphibole, along with other accessory minerals [24]. The composition of these plutonic rocks will affect the resulting weathering products, which are the bentonites.
The Benavila deposit reserves were estimated at around 5 M.t. of bentonite, with the highest purity levels reaching 2.0–2.5 Mt [28,29]. The mineralogy and applications of these bentonites have been studied by different authors, determining their mineralogy as being primarily constituted by dioctahedral smectites [29,30,31,32,33,34]. However, there are slight differences regarding their classification within the group of dioctahedral smectites, because some authors classify them as Tatatila-type montmorillonites [29] and others just as montmorillonites [31].
This work aims to attain a detailed mineralogical, crystal-chemical, and geochemical characterization of a representative outcrop of bentonites from the Benavila deposit. This work will serve as a basis for further research regarding the applications of these bentonites, mainly towards their use as lining barriers of disposed radioactive waste.

2. Geological Setting

The area under study, corresponding to the Benavila igneous massif, is located close to the Avis area, more precisely in Benavila, Portalegre District (Portugal). It is approximately 7 km long (E-W) and 4 km wide, occupying an area of about 40 km2 (Figure 1). This area exemplifies the typical morphology of Alto Alentejo: a high plateau with scattered reliefs. The petrographic characteristics of the Benavila rocks lead them to be considered similar to those of the neighboring Ervedal, Fronteira, and Stª Eulália massifs. However, the rocks of this region, like those of Stª Eulália, are more diverse than those of the first two massifs mentioned, as the presence of gabbros is referred [35].
The Benavila igneous massif was formed during the Lower Silurian [26,27], and it is characterized by the diversity of petrologic types: granites, granodiorites, monzonites, quartz diorites, and, exceptionally, olivine gabbros. Granitoids, quartz diorites, and gabbros have a common characteristic: the presence of green-colored hornblende amphiboles. The massif is cut by numerous veins, running NW-SE, which are mostly constituted of granite. In addition to the aforementioned veins, there are also many enclaves of felsic nature, namely monzonites, always more basic than the surrounding granitoids. The entire massif is also affected by carbonated alterations of Paleogene–Quaternary age, due to the high content of carbonates in the groundwater [24]. Chemically, the global composition of these rocks located at the Benavila igneous massif is mainly constituted by SiO2, Al2O3, Fe2O3, and CaO, representing at least 75% of the total oxide content [24].
The subject of study is bentonites of Miocene age, which have been previously described in the literature as “clayey and marly sandstones with a greenish hue, of continental facies, probably Miocene” [26]. These bentonites originated from the weathering of the preexisting granodiorites located within the massif, all of which present the same type of alteration that partially covers the massif, which seems to be favored by fractures in the NNE–SSW direction [26,27] and is dated in the Paleogene–Quaternary. The Geological and Mining Institute of Portugal refers to these clayey materials of residual origin as “very pure bentonites with relevant technological characteristics and difficult exposure and exploitation conditions” [36].

3. Materials and Methods

3.1. Samples

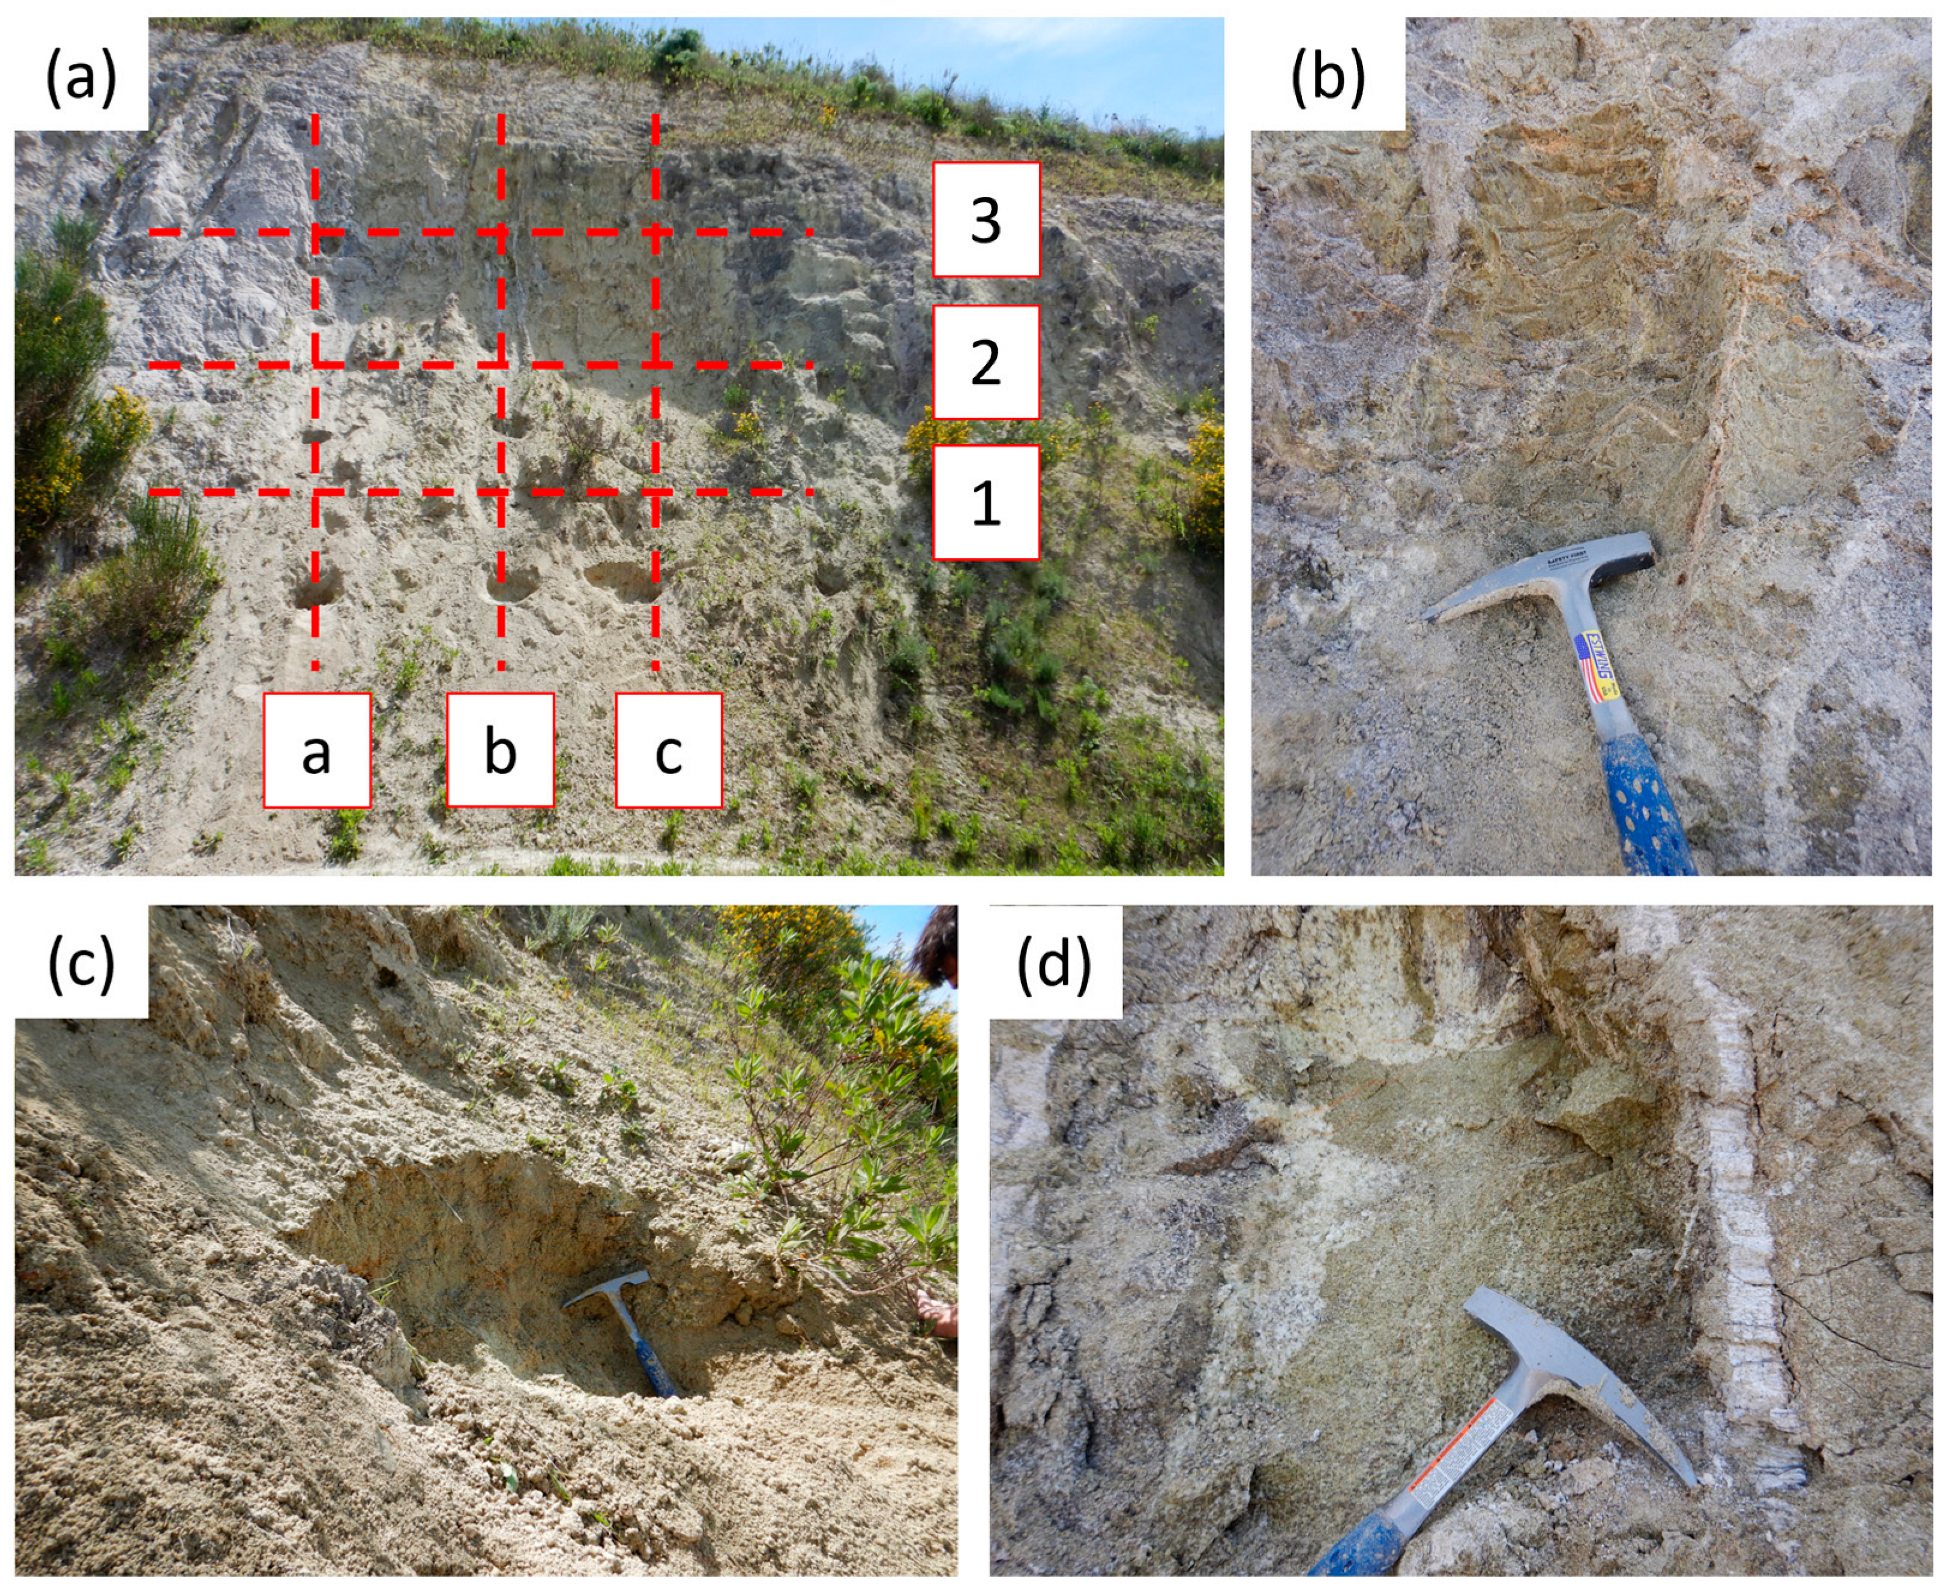
A bentonite outcrop (Universal Transverse Mercator coordinates: 29S 598,193.02 m E 4,330,882.19 m N) with a thickness of approximately 7 m and a NE–SW direction in the proximity of the locality of Benavila (Portalegre, Portugal) (Figure 1) was sampled. The outcrop is characterized by the greenish colors of the bentonites, as well as by the presence of sub-vertical carbonate-rich veins of whitish color (Figure 2a,d). The presence of these veins is the main difference that can be observed in the horizontal axis. In addition, it is possible to observe a higher degree of compaction of the bentonites towards the top of the outcrop, while the bottom shows more disaggregated materials.
As shown in Figure 2a, nine samples from the most representative and accessible parts of the deposit were collected in a grid, with the A profile located towards the NE and the C profile towards the SW. In order to obtain non-contaminated samples, the surface of the outcrop was cleaned at the places where these samples were collected. The samples from the top horizontal profile (BEN3) were interpreted in the field as the samples with the higher content of smectites. They are characterized by their high compaction, and, in some cases, they even preserve their original textures (especially towards the C profile) (Figure 2b), although they have been transformed almost entirely to clay minerals. According to the expected evolution of the weathering profile, which gave place to the formation of the deposit, the lower levels (BEN1 and BEN2) present a lower degree of compaction and higher disaggregation, not preserving the original textures (Figure 2c). Specially along the B line, the presence of veins of carbonates (Figure 2d) is usual.

3.2. Methodology

Different granulometric fractions of all the samples were obtained. Silt fractions (θ < 63 μm and θ < 38 µm) were separated from the bulk rock samples by wet sieving, while the clay size fraction (θ < 2 µm) was separated by decantation following Stokes’ law. The granulometric separation was performed not only to identify the variation in the relative proportion of the minerals within them, but also with a view to their possible future use in radionuclide sorption experiments to assess their applicability as lining barriers at radioactive waste disposal sites.
The mineralogical characterization of the samples was carried out by X-ray diffraction (XRD) using a Bruker D8 Advance and Cu kα radiation. All the granulometric fractions were powdered prior to their characterization, and, in addition, the clay fraction (θ < 2 µm) was also prepared as oriented air-dried aggregates (OA), solvated with ethylene glycol (OA + EG), and heated at 550 °C for 2 h (OA + TT). Powdered samples were scanned from 2° to 65° 2θ, and air-dried aggregates from 2° to 45° 2θ, using a speed of 0.05° 2θ/s. The clay size fraction was also measured from 59° to 63° 2θ at a speed of 0.03° 2θ/s to obtain a detailed diffractogram of the (060) reflection of clay minerals, to know the trioctahedral or dioctahedral character of the phyllosilicates present within the samples. Semi-quantification of the mineral phases observed at the diffractograms was performed through the reflecting powers method (RPM) [37], which is a standard in the study of clays, focusing on the ratio of peak areas to semi-quantify the minerals within the samples.
Structural formulae of the smectites were fitted from point analyses acquired by analytical electron microscopy (AEM) with transmission electron microscopy (TEM) at the National Electron Microscopy Center (Madrid, Spain) using a JEOL JEM-1400 microscope (JEOL Ltd., Tokyo, Japan), with an acceleration voltage of 100 kV. The microscope incorporates an OXFORD ISIS EDX spectrometer (Oxford Instruments, Oxfordshire, UK, 136 eV resolution at 5.39 keV), equipped with its own software for quantitative analysis. The TEM samples were prepared by depositing a drop of diluted suspension on a microscopic grid with collodion (cellulose acetate butyrate) and coated with Au. Homoionization was performed on the samples to obtain more accurate structural formulae that allow a more reliable classification of the smectites [38].
Thermogravimetric analysis (TGA) routine was performed using an SDT-Q600 from T.A. Instruments (T.A. Instruments, New Castle, DE, USA). Homoionized fractions < 2 µm were analyzed in an air atmosphere, with a heating rate of 10 °C/min, from room temperature up to 985 °C.
Geochemical analyses of major and trace elements were performed at Activation Laboratories Ltd. (ACTLABS, Ancaster, ON, Canada). For these analyses, 2 g of powdered sample was digested with aqua regia, along with appropriate international reference materials for the metals of interest, and diluted to 250 mL volumetrically. Major elements, along with Sc, Be, V, Sr, Zr, and Ba, were analyzed by lithium metaborate/tetraborate fusion inductively coupled plasma (ICP) and trace elements were analyzed by ICP-mass spectrometry (ICP-MS).
The chemical index of alteration (CIA) and plagioclase index of alteration (PIA) were calculated to elucidate the alteration rock degree [39,40,41,42,43,44]. These indices incorporate major bulk element oxide chemistry from the samples, giving information on the leaching of elements on each of the samples originating from homogeneous parent materials and indicating their relative degree of alteration.
Software package IBM SPSS version 29.0 was used for the statistical analyses.

4. Results

4.1. Mineralogical Characterization

4.1.1. XRD

Powdered samples from all the granulometric fractions were characterized by XRD, as well as the air-dried aggregates of <2 microns fractions, which allowed identifying the mineral assemblages within them (Figure 3). Powdered samples allow the identification of phyllosilicates, carbonates (mainly calcite, along with minor amounts of dolomite), and scarce quantities of tectosilicates (quartz, K-feldspar, and plagioclase) (Table 1). The rest of the minerals identified are always present, just at trace levels. These results agree with previous references [29,30]. Amphiboles were also identified, but only in samples belonging to the C vertical profile (Figure 2). The diffractograms corresponding to the finer granulometries (<63, <38, and <2 µm) show that the relative intensities of phyllosilicates increase compared with the other minerals identified, indicating a preferential concentration of phyllosilicates in the fine-grained fraction, as expected. The oriented aggregates (OA) and their treatments grant the capacity of studying clay minerals in more detail, being able to identify smectite as the main component along with traces of illite, chlorite, and possible kaolinite. Small amounts of a mixed-layer of chlorite and smectite (C/S) have also been identified due to the presence of a reflection at 12.4 Å that does not collapse in the AD + TT [45]. Also, in the OAs, there are small inflections at 12.3 Å (Figure 3b), which indicate a possible mixture of smectites with different predominant interlayer cations, ratified by their swelling in the OA + EG treatment. The dioctahedral character of the smectites was identified due to the d-spacings of the (060) reflections, whose values range between 1.499 and 1.507 Å, and in all the samples studied (Figure 3c).
The X-Ray diffractograms not only allow identifying minerals, but also semi-quantifying them (Table 1). In all the granulometric fractions, the main components are phyllosilicates (smectite plus quantities below 2% of illite, chlorite/smectite mixed-layers, and chlorite), followed by carbonates (calcite plus traces of dolomite) and scarce quantities of quartz and feldspars. In the bulk rock samples, phyllosilicates range from 97% (BEN3A) to 52% (BEN3C), with smectite being the main component (95% and 51%, respectively). Calcite is the major impurity and ranges from 0% (BEN3A) to 38% (BEN3C) with a mean content of 22%. It has to be pointed out that sample BEN3A is the richest sample in smectite because it is the only one that does not contain calcite, and a negative correlation between these two minerals can be observed. The <63 µm fraction shows percentages of phyllosilicates ranging from 99% (BEN3A) and 73% (BEN3B), with smectite being the major mineral, and of calcite ranging from 0% (BEN3A) and 27% (BEN3B). This tendency previously described is also seen in the <38 µm fraction, being the maximum content of phyllosilicates (mainly smectite) 98% (BEN3A) and the minimum, 72% (BEN3B), coinciding with the maximum and minimum contents in calcite (28% and 0% at samples BEN3B and BEN3A, respectively). Finally, in the <2 µm fraction, most of the minerals identified and quantified are essentially smectite with a minimum content of 95% and scarce impurities of chlorite, illite, and mixed-layer chlorite/smectite that can be identified but are difficult to quantify.

4.1.2. TEM-AEM

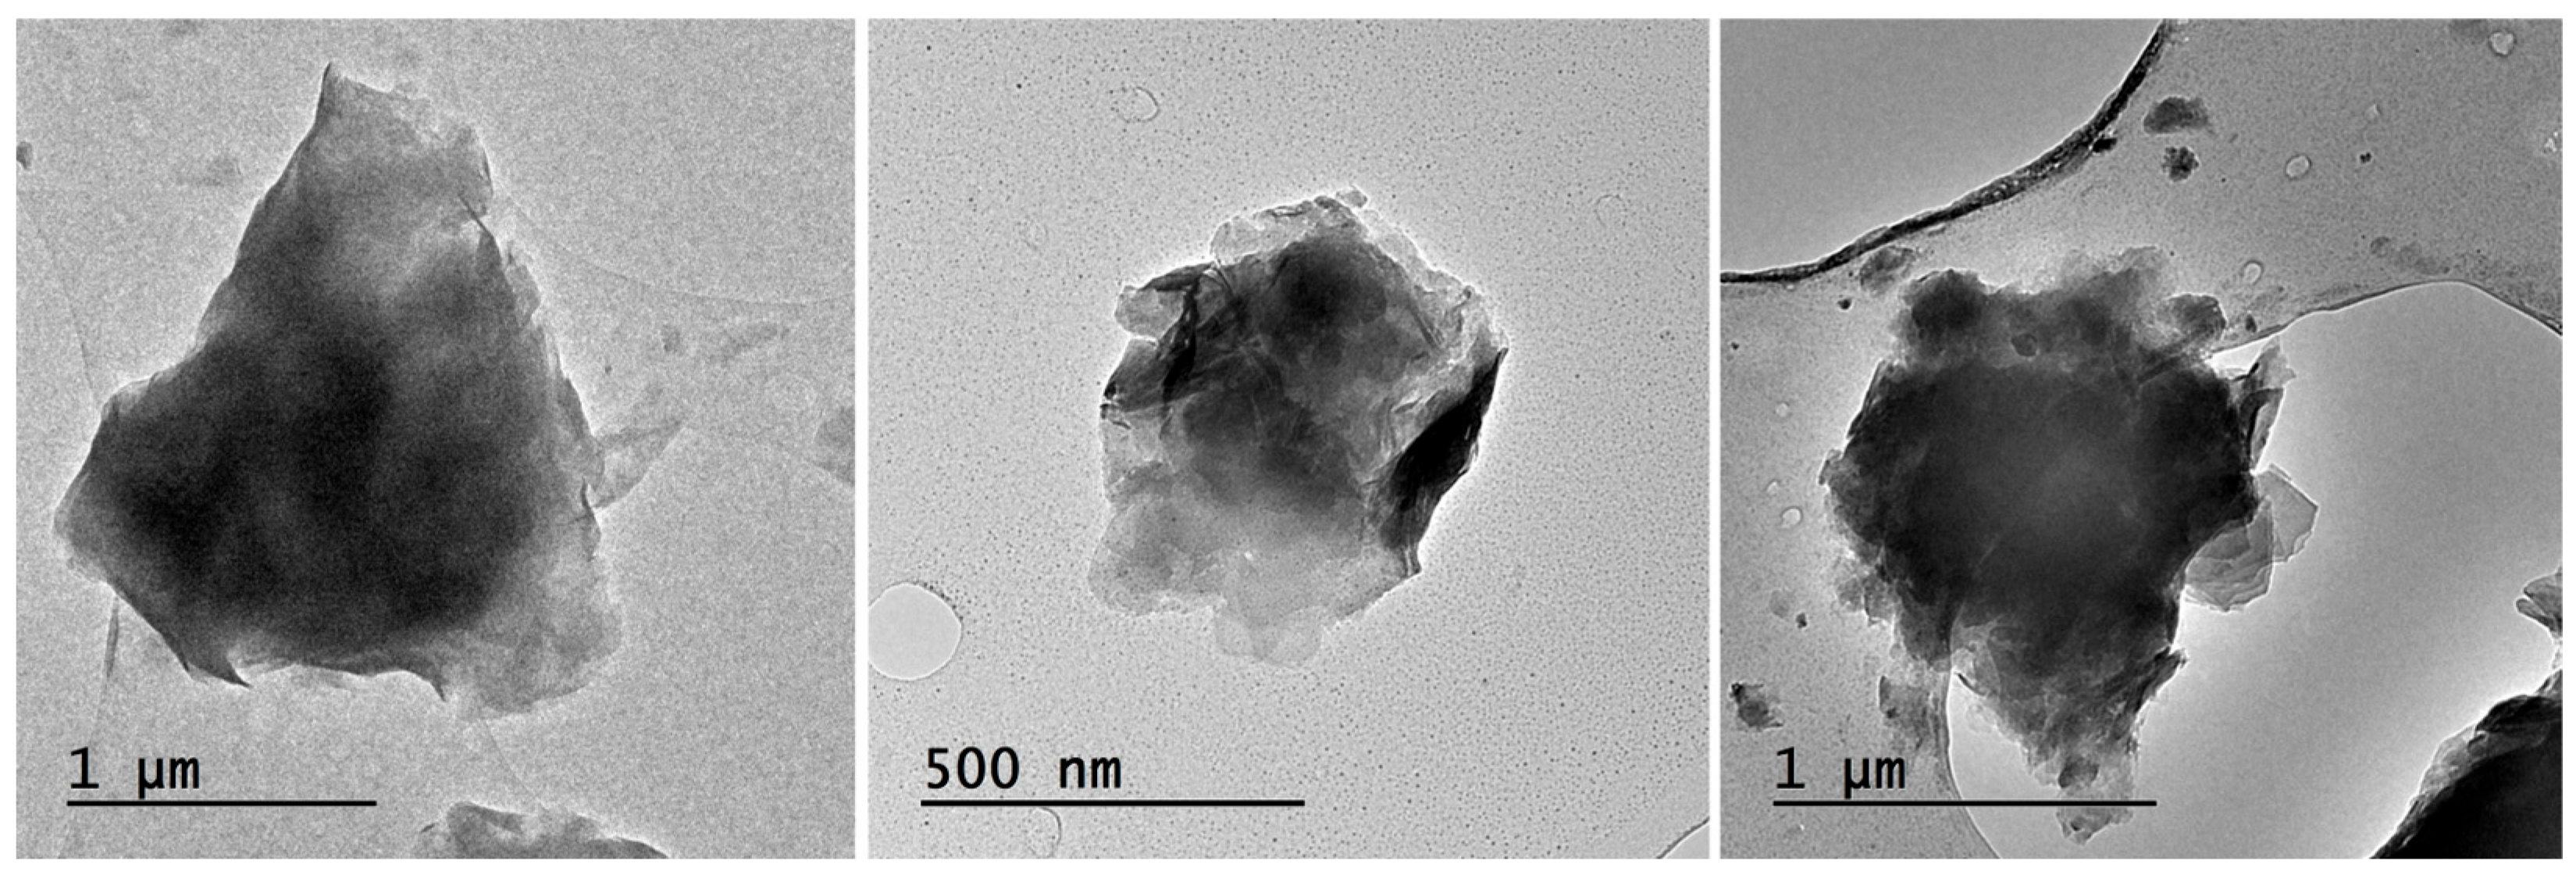
The top samples (BEN3A, BEN3B, and BEN3C) were used for the crystal-chemical study through TEM-AEM analyses. The TEM representative photographs (Figure 4) show platy particles with subhedral morphologies, which present some straight faces together with wavy and pointy ends (as usual in smectites) on the same particles. This resembles typical morphologies of micaceous materials (euhedral particles with straight faces), which, most likely, are the precursor phases whose alteration gave place to the smectites. The wavy and pointy ends indicate the transformation process and/or growth of smectites from these micaceous particles [46,47,48,49]. The photographs evidence an increase in the wavy and pointy-ended faces towards the A profile (Figure 4).
The point chemical data obtained by AEM analyses (Table 2) of isolated particles of smectite of the natural samples show that the main oxide (considering the mean values) is SiO2, ranging from 63.98% (BEN3A) and 56.49% (BEN3B). Regarding the second most abundant oxide, there are two cases: sample BEN3A has more content in Al2O3 than Fe2O3 (19.90 and 7.89%), while samples BEN3B and BEN3C have higher contents in Fe2O3 (18.43 and 20.07%) than in Al2O3 (15.20 and 13.35%). Finally, the rest of the oxides analyzed follow the same trend in all the samples studied: MgO > CaO > K2O > TiO2 > NaO. It is also noteworthy that they show a broad compositional variability, as indicated by the differences between the maximum and minimum values, as well as the standard deviation, which is related to the continuous compositional variations in all the studied samples.
The structural formulae were calculated from the mean oxide contents of the point chemical analyses (Table 2). The resulting formulae from the natural samples correspond to dioctahedral smectites. Their average number of octahedral cations ranges from 4.42 to 4.66. These formulae exhibit positive octahedral charge ranging from 0.05 to 0.48 and a very low interlayer charge ranging from 0.30 to 0.61, indicating that the results are unreliable. To properly fit the smectite structural formulae, the samples were homoionized with Ca2+ [38]. The homoionized analyses show similar distributions as in non-homoionized samples (also considering the mean values): SiO2 is the main oxide, ranging from 61.53% (BEN3ACa) and 57.10% (BEN3CCa). The second most abundant oxide is always Al2O3 (in opposition to the non-homoionized samples), which ranges from 19.19% (BEN3ACa) and 14.73% (BEN3CCa), while Fe2O3 is the third, ranging from 14.75% (BEN3B) and 7.64% (BEN3A). Samples BEN3BCa and BEN3CCa show MgO as the fourth oxide in terms of abundance (6.54 and 8.99% respectively) and CaO as the fifth (3.67 and 3.74% respectively), while this trend is inverted in sample BEN3ACa (5.49% of CaO and 4.71% of MgO). The rest of the oxides analyzed follow the same trend in all the samples studied: K2O > TiO2 > NaO. The structural formulae also correspond to dioctahedral smectites. The mean octahedral charges vary, being −1.66 (BEN3ACa), −0.46 (BEN3BCa), and −0.50 (BEN3CCa), and an increase in the interlayer charge. It is possible to see that the main difference between non-homoionized and homoionized samples is their content in Fe2O3, which suggests that iron was most likely adsorbed on the non-homoionized samples and removed during their homoionization. The K2O content did not decrease in the homoionic analyses, indicating the presence of interestratified micaceous layers in the smectite particles, which supports their detrital origin.
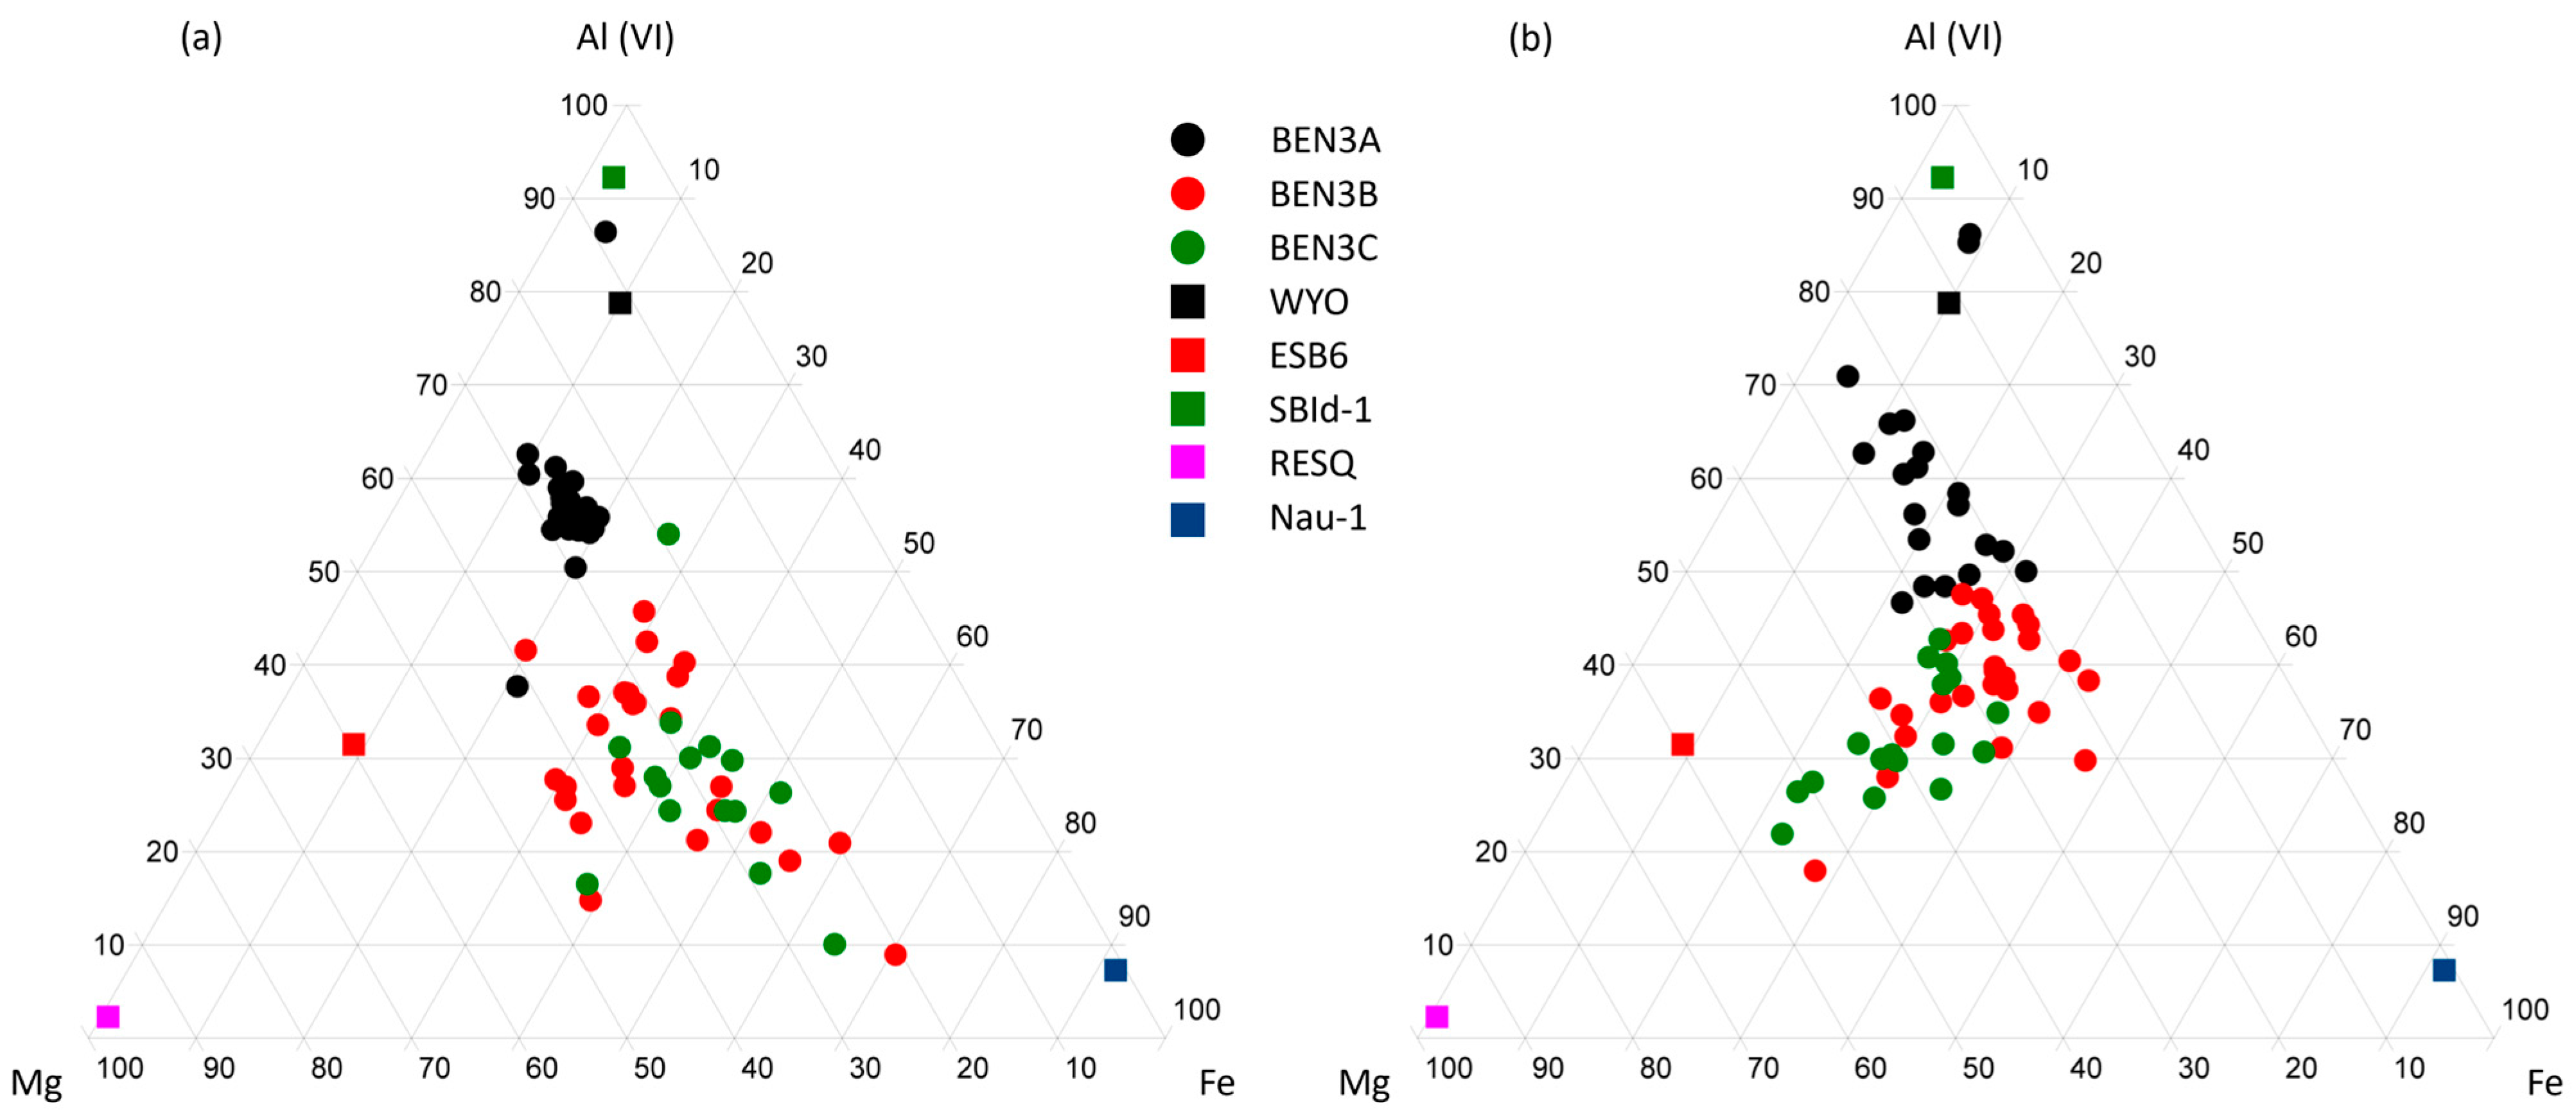
The structural formula obtained from both the non-homoionized and homoionized samples was used to obtain a ternary plot of the octahedral content (Mg, Fe, Al) of all the analyses, along with the octahedral content of different smectite samples from the literature [38,50,51] (Figure 5). The ternary plot of the octahedral content of non-homoionized samples shows different tendencies for Benavila samples. BEN3A is the most enriched in aluminum, therefore, being the closest to both beidellite and montmorillonite. Samples BEN3B and BEN3C display higher compositional dispersion and show higher contents of iron, which in some cases bring them close to the nontronite octahedral content. However, when the homoionized octahedral content is plotted, it is easily observed that no analyses fall near the notronite octahedral content but rather fall in intermediate fields. There is also an evident trend that can be observed in both ternary plots, which is a progressive transformation towards purest dioctahedral smectites from the BEN3C to the BEN3A sample, due to the progressive loss of magnesium and iron.
The smectites from Benavila had already been classified as Tatatila type montmorillonites [29], meaning they have 15–50% of the charge originating from tetrahedral substitutions and a layer charge > 0.85 [45]. Other studies have simply classified them as montmorillonites, without defining their type [31]. However, recent classifications of dioctahedral smectites [52,53], which consider more variables, such as the layer charge, the octahedral structure, the iron content, and the charge location, allow for giving more descriptive names of the subjects of study. For such purpose, the structural formulae obtained from the homoionized samples were used.
Sample BEN3ACa has a layer charge (LC) of 1.66, a Fe3+ content (IC) that represents 18% of the octahedral cations, and a tetrahedral charge (TC) that accounts for 28% of the total charge, and is therefore classified as a high-charged ferrian beidellitic montmorillonite [52]. Sample BEN3BCa has an LC of 1.10, an IC of 33%, a TC of 58% and is classified as a high-charged ferrian montmorillonitic beidellite. Sample BEN3CCa has an LC of 1.30, an IC of 29%, and a TC that is 62% of the total charge, being classified as a high-charged ferrian montmorillonitic beidellite. Therefore, it can be summarized that there are two types of samples: sample BEN3A is a ferrian beidellitic montmorillonite, while BEN3B and BEN3C are ferrian montmorillonitic beidellites. All the samples show high layer charges.

4.1.3. TGA

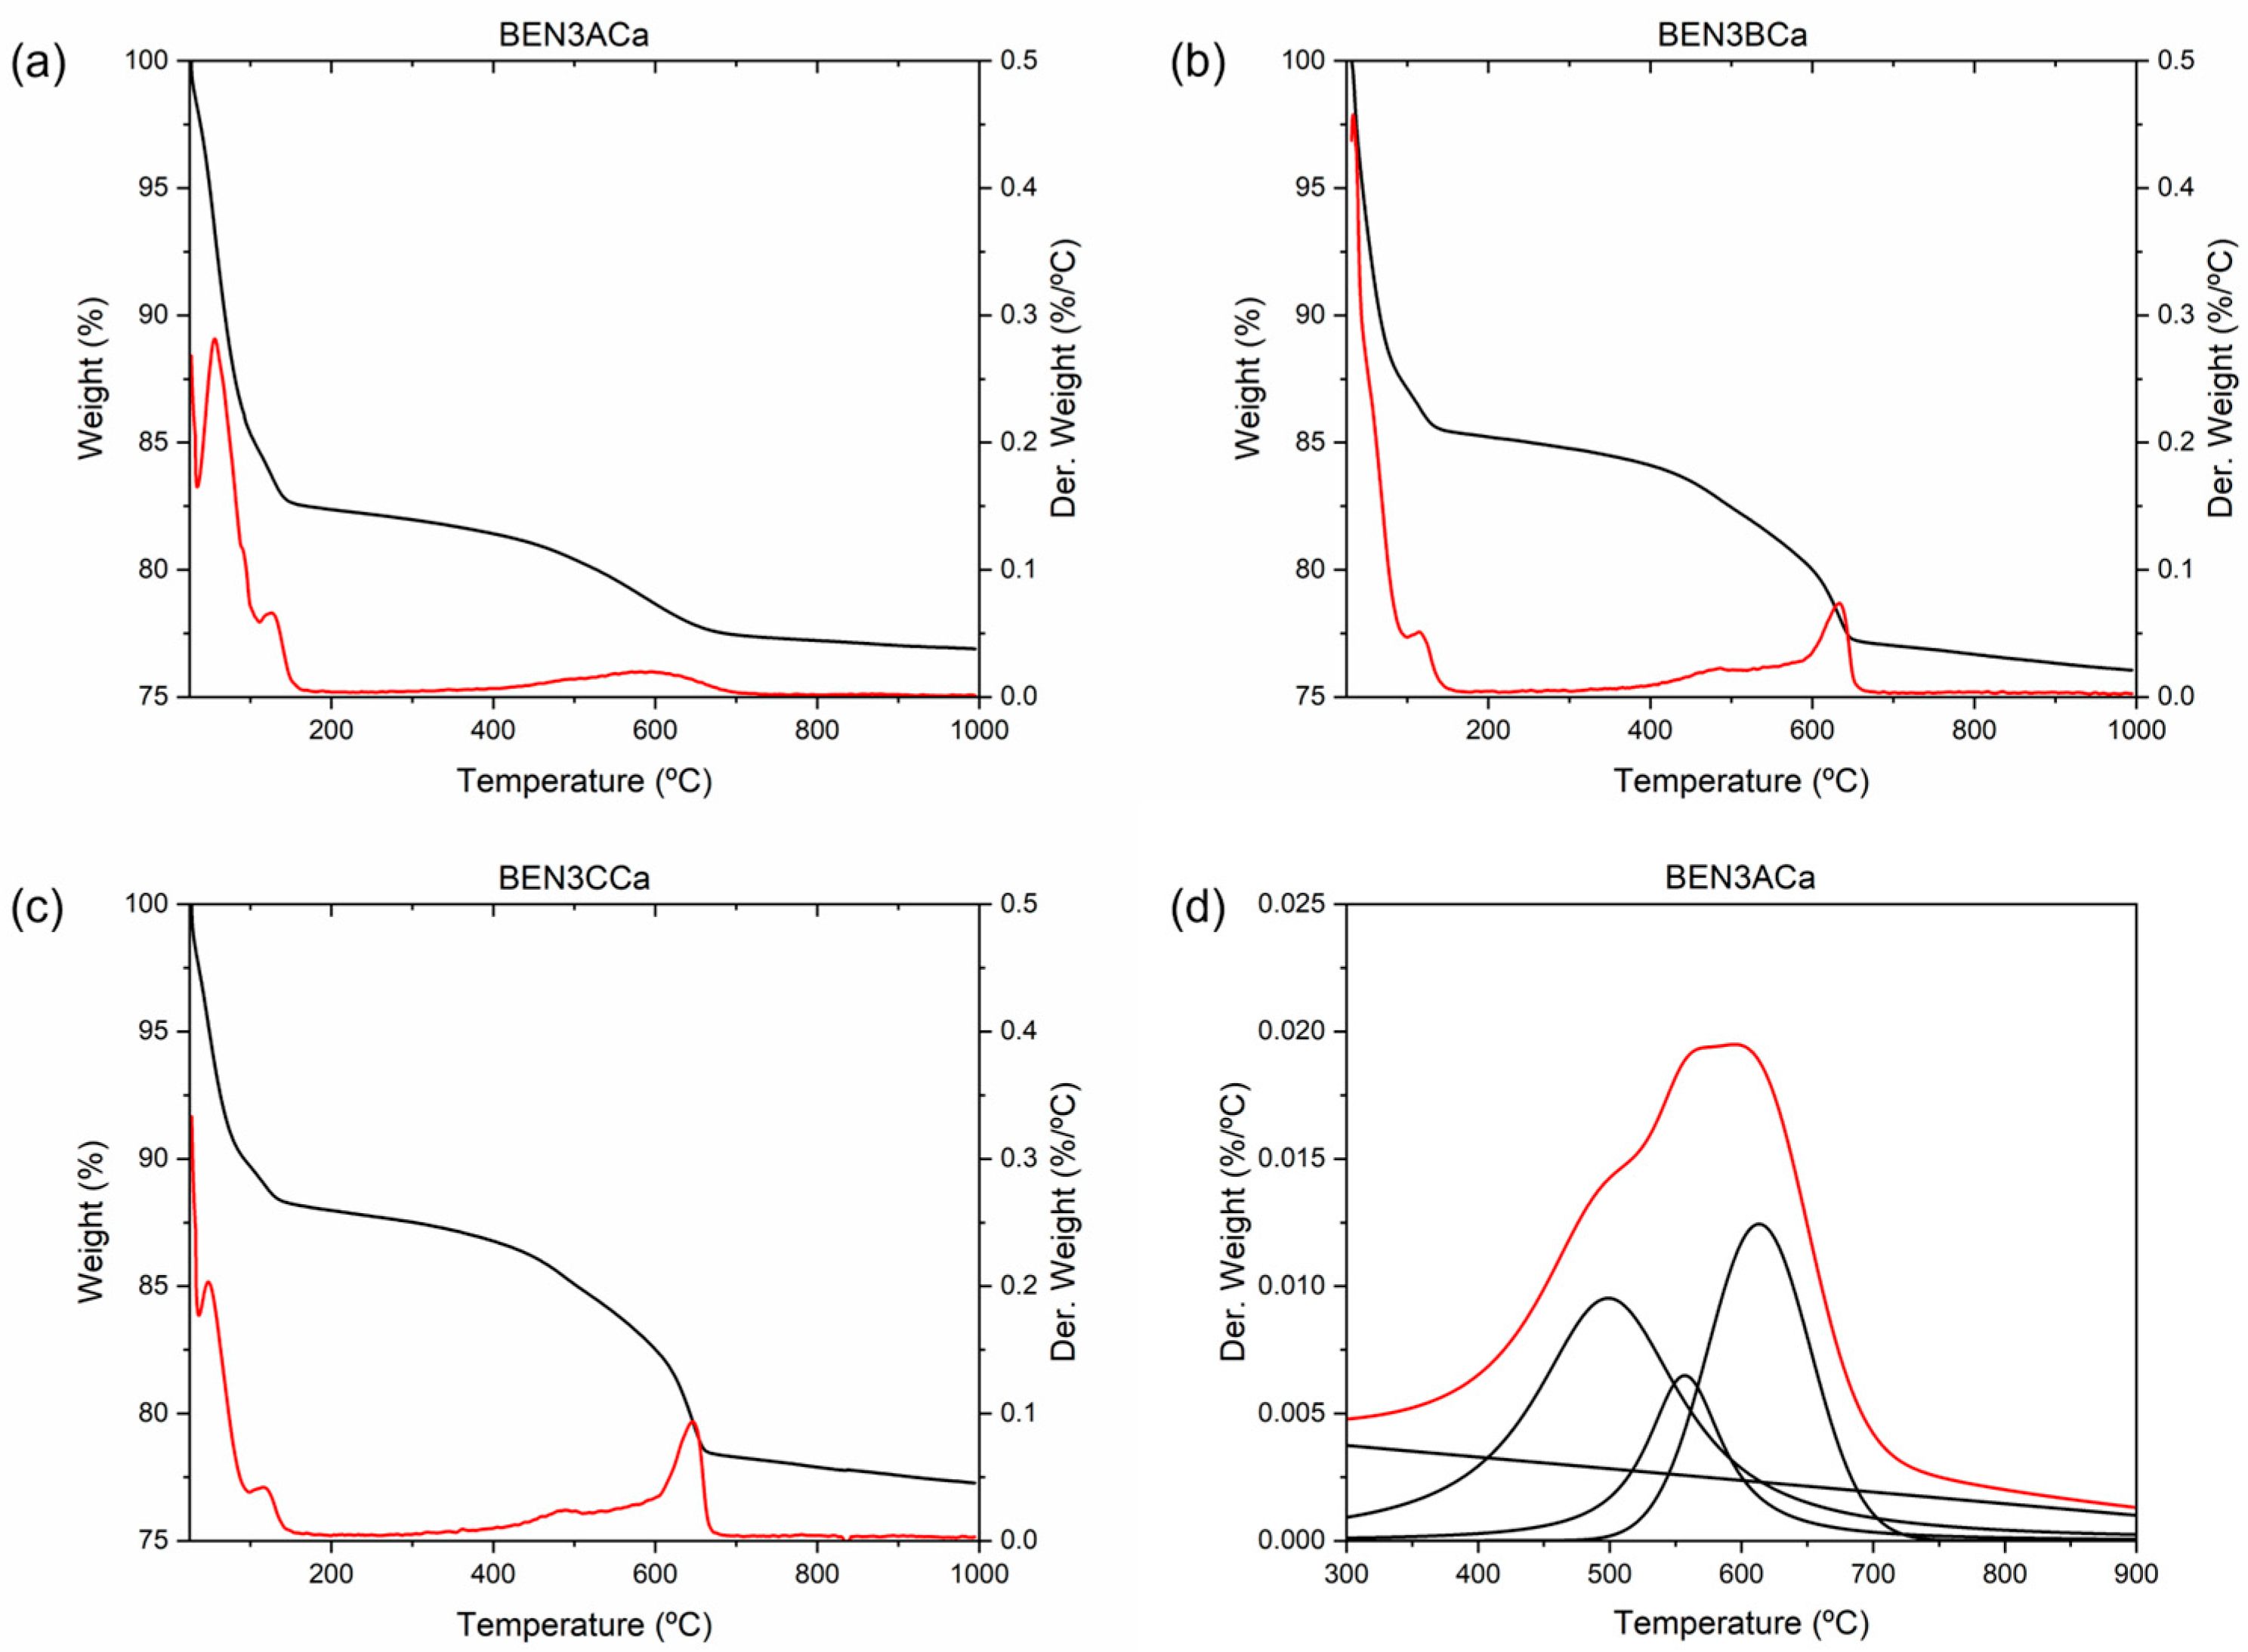
The thermal behavior of Benavila bentonite samples, essential for their possible use in radioactive storage, was determined through thermogravimetric analysis. These analyses also enable an in-depth characterization of the octahedral sheet of the smectites. For that purpose, the homoionized < 2 µm fraction of the three samples from the top level (BEN3A, BEN3B, and BEN3C) was selected. The TGA analyses (Figure 6a–c) show that all the samples present the same tendencies: the most important weight loss (around 15% of their masses) takes place from room temperature up to ~175 °C, due to the dehydration of the absorbed and interlayer water of the smectites. They keep losing small percentages of weight until the range comprised between 550 and 650 °C, where they lose approximately 5% of their mass due to the dehydroxilation of smectites. DTG analyses (Figure 6a–c) give more detailed information. The dehydration of the interlayer water occurs in two peaks due to the presence of different interlayer cations [54], and the dehydroxilation events are marked by defined peaks, although they can be broader or narrower peaks, depending on the samples.
The peaks related to the dehydroxilation of the smectites in the DTG curve (derivative of the thermal analyses) are used to calculate the percentage of cis-vacant (cv) and trans-vacant (tv) configurations of the octahedral sheet [55]. The two configurations can be differentiated due to their dehydroxylation temperatures. The cv varieties dehydroxylate at temperatures between 650 and 700 °C, while tv varieties dehydroxylate at temperatures of about 500–550 °C, being the boundary temperature between the two configurations at around 600 °C [55,56,57]. These percentages were obtained by performing the deconvolution of the DTG curve between 300 and 800 °C using the software package Fityk (v. 1.3.1) [58] (Figure 6d), where it can be seen that a curve is deconvoluted into three curves plus a straight line (the latter is used to subtract the background). Considering the center of the curves obtained from the deconvolution, it is determined whether the dehydroxilation takes place at temperatures below or over 600 °C, and using their respective areas, it is possible to calculate the percentage that cv (peaks > 600 °C) and tv (peaks < 600 °C) varieties represent (Table S1) [57,59]. All the samples are classified as tv/cv, with a progressive decrease in the cv character towards sample BEN3A.
Considering the previous classification from the TEM-AEM analysis of the samples according to recent references [52,53] and focusing on the octahedral configuration, we can conclude that sample BEN3A is a high-charged tv/cv ferrian beidellitic montmorillonite, while BEN3B and BEN3C are high-charged tv/cv ferrian montmorillonitic beidellites.

4.2. Geochemistry

The major (Table S2) and trace elements (Table S3) contents were obtained by means of ICP-MS for bulk samples and different size fractions. Table 3 and Table 4 show the maximum, minimum, and mean values of the chemical analyses of all the granulometric fractions, along with their standard deviation. The trace elements considered were the high field strength elements (HFSE), transition trace elements (TTE), large-ion lithophile elements (LILE) and rare earth elements (REE), as well as other trace elements such as Be, Ga, Ge, As, Y, Mo, Ag, In, Sn, Sb, W and Bi.
The major elements concentrations are in accordance with the mineralogical characterization. Samples with a higher content in phyllosilicates present higher percentages of SiO2 and Al2O3, consistent with their identification as being mainly constituted by dioctahedral smectites, and samples with a higher content in calcite have more CaO (Table S2). This is observed in Figure 7, where the contents of SiO2, Al2O3, and CaO are plotted, and it is possible to observe an enrichment in SiO2 and Al2O3 and a depletion in CaO towards the finer grained fractions (higher content in phyllosilicates, Table 3). The trends observed are corroborated by the high correlation coefficients among SiO2, Al2O3, and CaO shown in Table S4 and by Figure 8, which shows the contents of these elements in the finer grain size fractions normalized with respect to the contents in the bulk rock samples.
Focusing on the HFSE, there are no clear differences according to the mineralogy of the samples, as shown by the correlation matrices performed (Table S5). Nb, Tl, Th, and U are significantly correlated with quartz, and it also appears that samples with higher contents in phyllosilicates also have lower total contents in HFSE, showing a progressive depletion towards finer granulometries (Table 4, Figure 8). This is explained by their relative immobility and their association with heavier and more resistant minerals present in the coarser fractions [60,61,62,63,64].
The TTE shows different correlation coefficients between phyllosilicates and carbonates, being negative in the first case and positive in the latter, considering the total TTE content as well as the content in certain elements within the group (Co, Ni, Cu) (Table S6). However, when observing Figure 8, it is possible to observe that the trend is not as clear as expected, even having an enrichment in TTE in sample (BEN3C), which is almost entirely formed by smectite (98%) and small quantities of calcite (2%). This points to an unclear linkage between TTE and mineralogy.
LILE appear to be less concentrated in samples with higher phyllosilicate contents, shown by their depletion in finer granulometries in comparison to the bulk rock fraction (Table 4, Figure 8), except in the case of the finest fraction (<2 µm). However, the correlation matrix (Table S7) only shows a negative significant correlation of phyllosilicates and Sr, because this element shows higher concentrations in calcite-rich samples due to its similarity to Ca [65,66,67]. As with the TTE, it is not possible to identify a clear link between LILE and mineralogy, with the exception of Sr and carbonates.
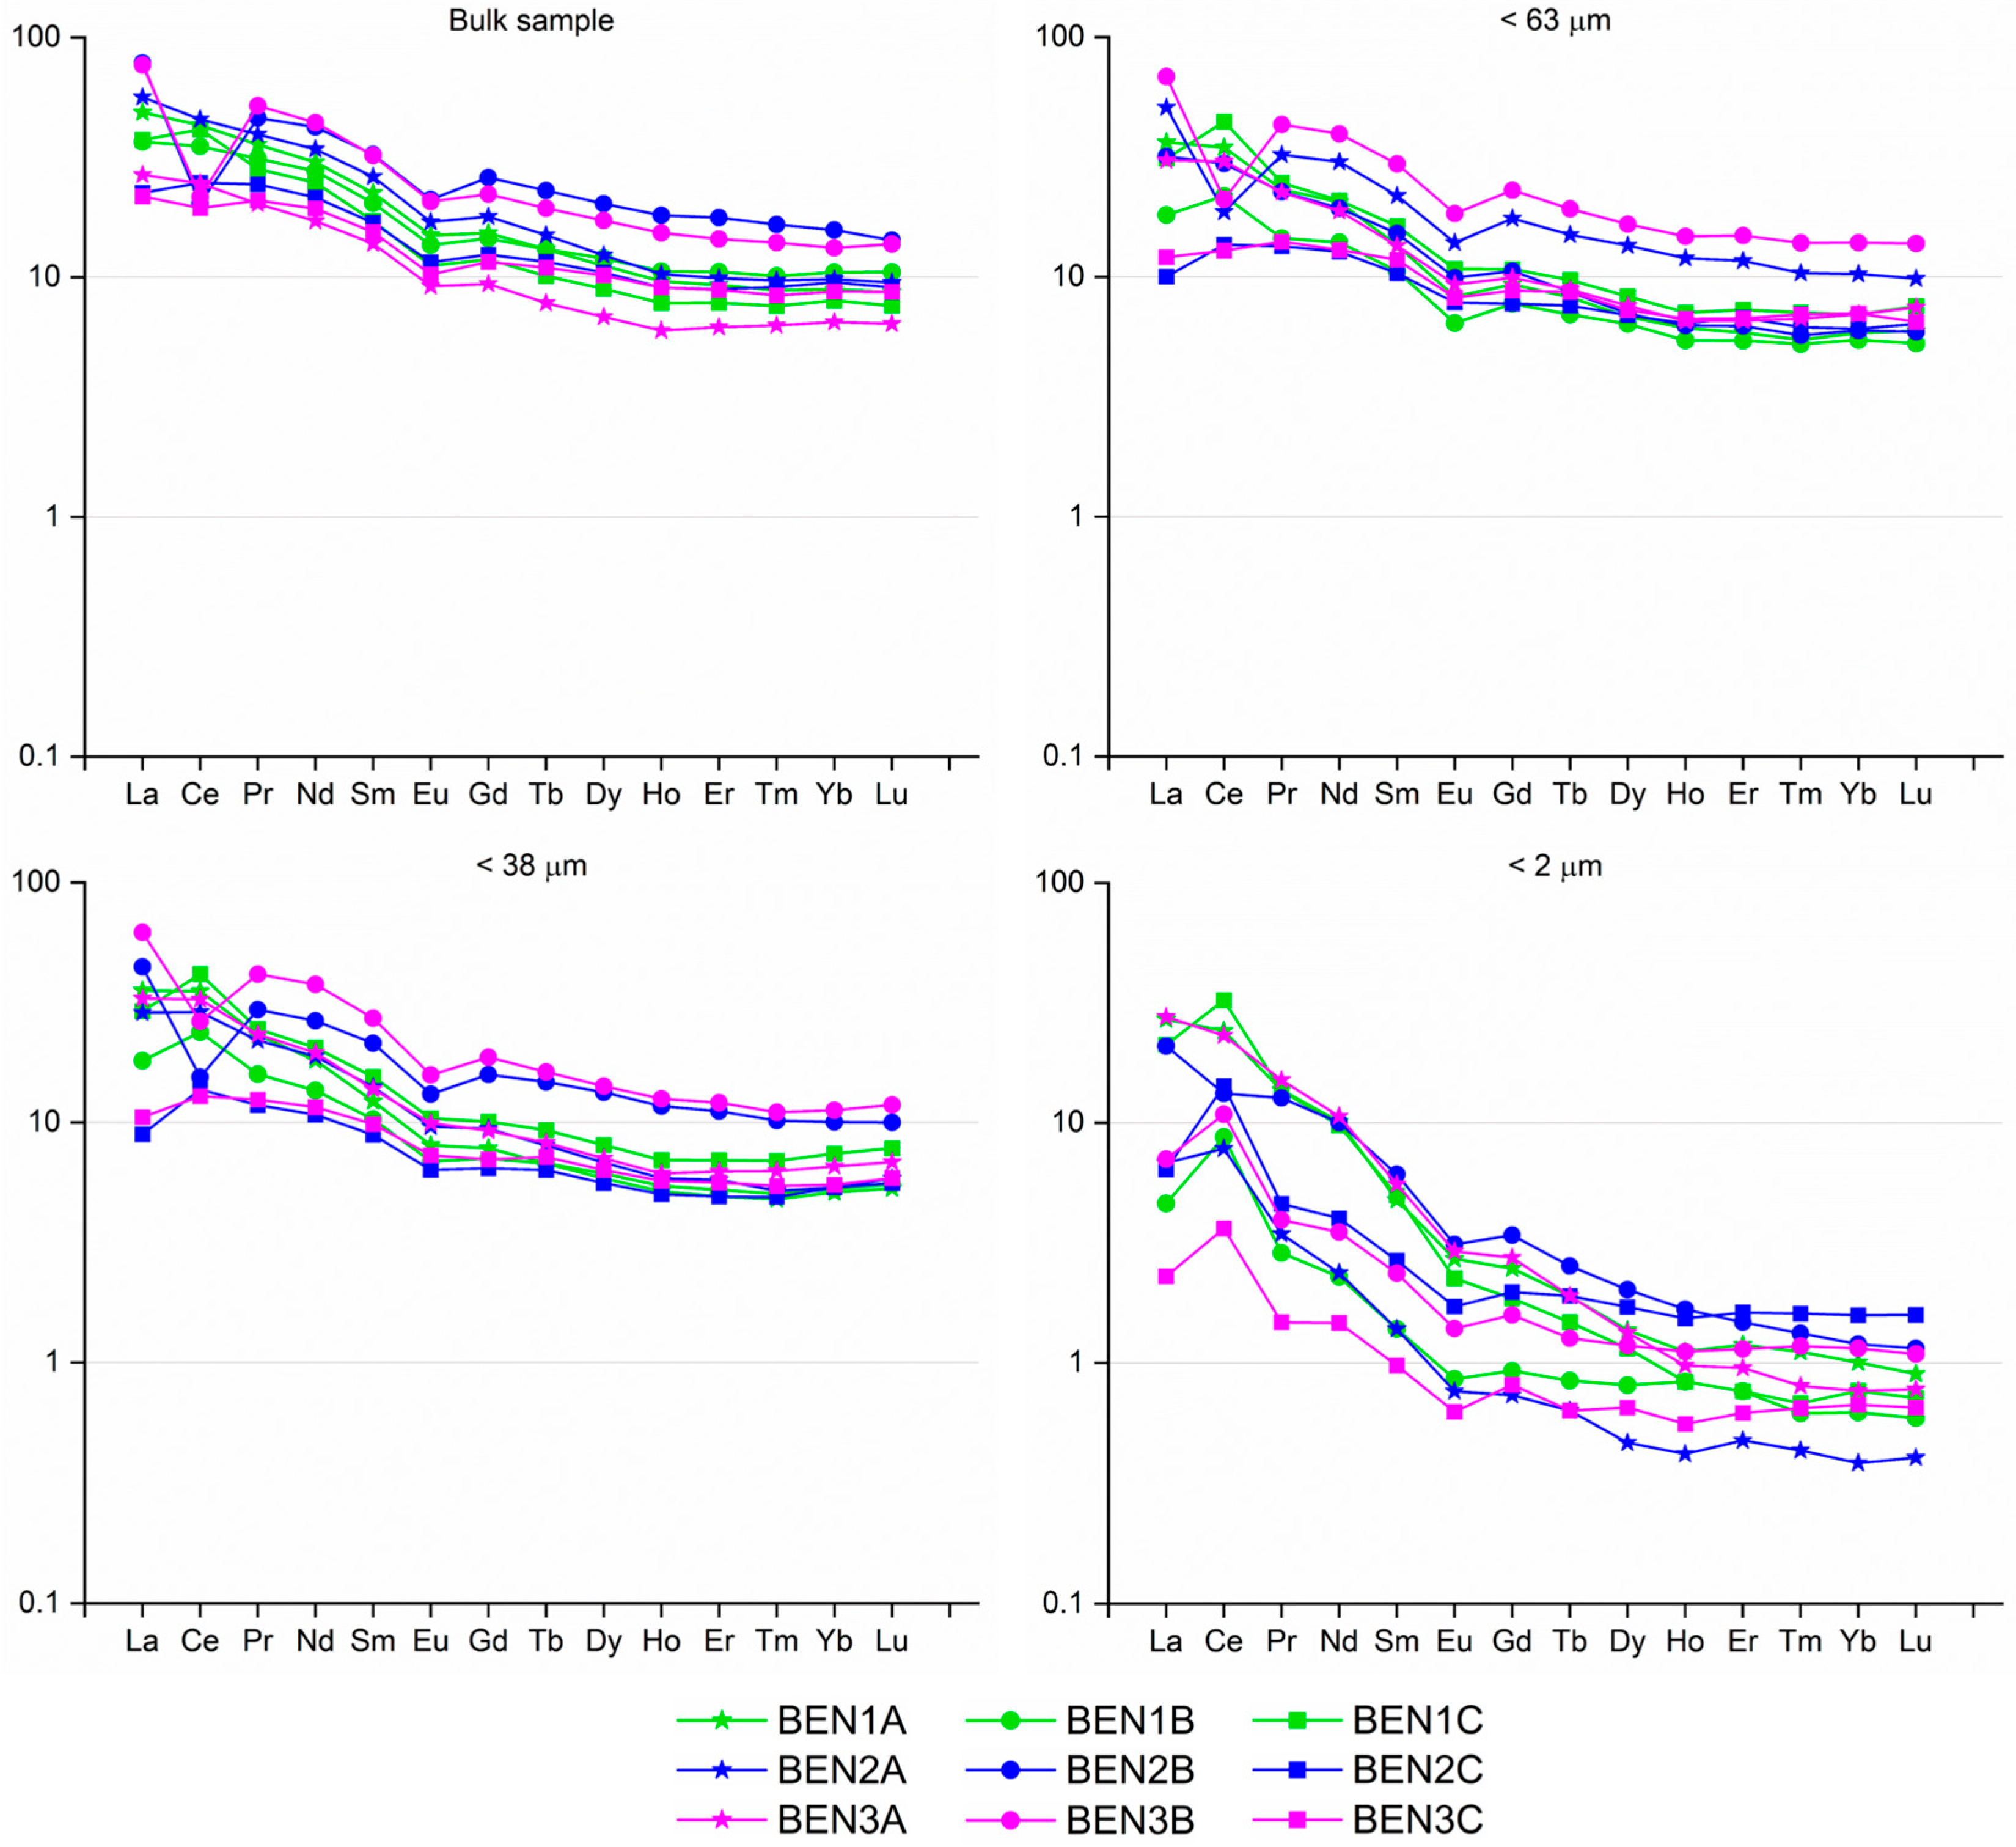
The REE present lower concentrations in the samples with higher contents in phyllosilicates (Figure 8, Table 4 and Table S8), something that can be attributed to their low solubility and their preferential accumulation in the coarser fractions in trace minerals as zircons [68]. However, there is another mechanism that can potentially affect the REE content: their complexation due to the action of carbonate-rich fluids and possible precipitation within calcite veins [69,70,71]. After chondrite normalization [72] (Figure 9), all samples are enriched both in light REE (LREE) and heavy REE (HREE). The fact that, in the majority of the clay size (<2 µm) fractions, the HREE are much lower than in the other fractions may partially explain the negative correlation between REE and smectite. All the samples studied show negative Eu anomalies. Two samples from the B profile have significant negative Ce anomalies in bulk and silt size fractions. In the clay size fractions, a tendency for positive anomalies was found.
The other trace elements analyzed show that most of them are below detection limits in most samples. Therefore, it is important to focus on the elements above the aforementioned detection limits. Yttrium shows high affinity with the REE and therefore has the same tendency as them (Table S9), with its content being lower within more clay-rich samples (Table S3). On the other hand, Ga is apparently more concentrated in samples with higher contents of phyllosilicates (Figure 8, Table 4 and Table S9), because it can substitute Al3+ in the octahedral layer of these minerals [73,74]. In the case of the rest of the other elements analyzed, it is not possible to identify clear links between their content and the mineralogy.

5. Discussion

The mineralogical characterization allows observing a variation in the horizontal direction, suggesting that the alteration process that formed the bentonites followed specific pathways. The presence of amphiboles within the igneous rocks whose alteration gave place to the formation of the clay minerals is cited in the literature [23,24]. Therefore, the presence of those minerals is interpreted as an indicator of a lower degree of weathering of the C profile in comparison with the other vertical profiles. The high content of carbonates in different parts of the sampling grid is related to the circulation of carbonate-rich fluids and the resulting carbonated crusts during the Paleogene–Quaternary [24], events that happened after the weathering that gave place to the bentonite deposit. It can be concluded that the mineral composition of the samples reflects an almost complete weathering of the primary minerals (amphiboles, quartz, feldspars, and micas), as these are present in relatively small proportions. Even if their content was recalculated, obviating the presence of carbonates (deposited after the weathering event), they still represent minor quantities, corroborating their almost complete transformation.
The TEM photographs show an apparent increase in the wavy and pointy-ended faces towards the A profile, therefore evidencing an increase in the development of smectites [46,47,48,49]. The TEM-AEM analyses show an increment of the Al2O3 and SiO2 (more abundant within dioctahedral smectites) content from the C profile towards the A profile, as well as a clear decrease in Fe2O3 and TiO2 (less abundant within dioctahedral smectites and more abundant within illite and amphiboles). Additionally, the presence of Fe2O3, TiO2, and K2O together with the particle morphology is a clear indicator that the precursor phases of the smectites were micas. The results of the smectite crystal-chemical characterization reveal interesting interrelated facts. The first one is that there is a progressive increase in the percentage of cv configurations of the octahedral sheet towards sample BEN3C (Table S1). The TEM-AEM study of the samples also enables observing a shift from beidellitic montmorillonite in the A profile to montmorillonitic beidellites in the B and C profiles. In agreement with the interpretations from the XRD characterization of the bulk samples (lower degree of alteration of the C vertical profile deduced from the identification of amphiboles in XRD), it is possible to suggest that lower percentages of tv configurations and beidellitic montmorillonites are characteristic of less weathered samples, while higher percentages of tv configurations and montmorillonitic beidellites are characteristic of samples which underwent a higher degree of weathering.
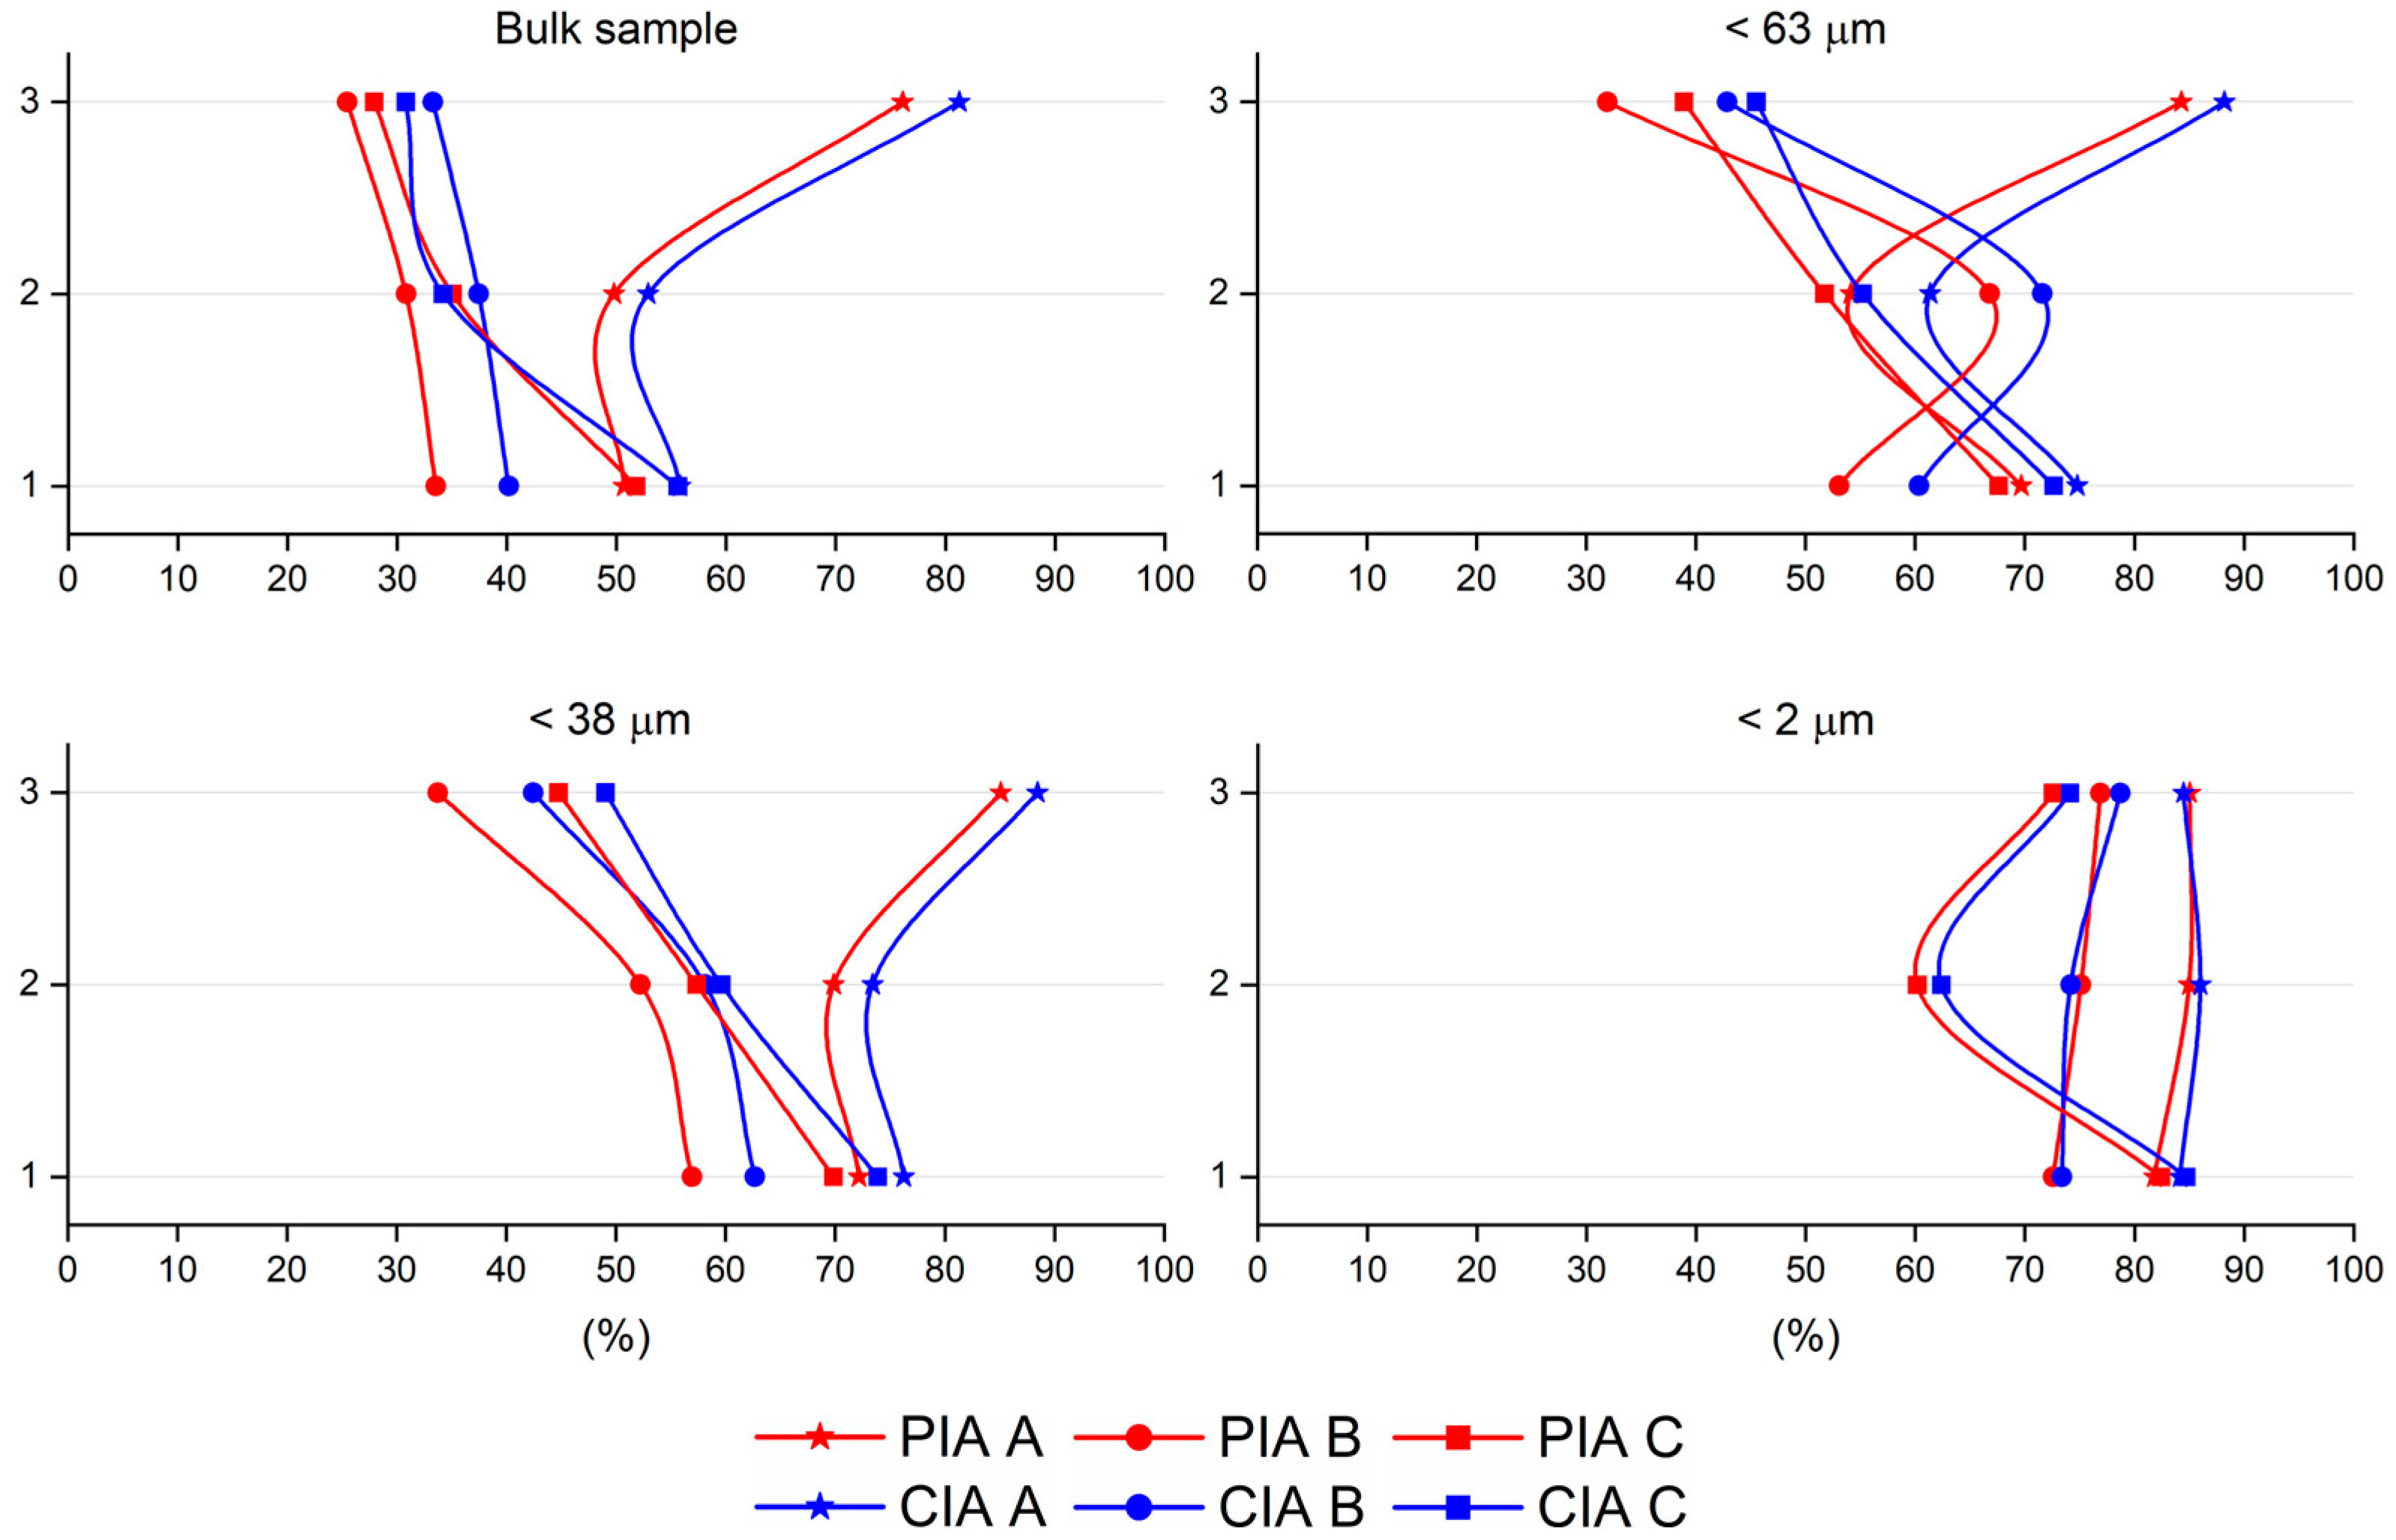
Major elements match the expected distribution, in accordance with the mineralogical characterization of the samples. These data were used to calculate two chemical indices, which are adequate for silicate-rich materials [39,40,42,44] and indicate the degree of alteration of the samples (Table 5, Figure 10). These indices are the plagioclase index of alteration (PIA), which considers the content in Al2O3, CaO, Na2O and K2O [41]; and the chemical index of alteration (CIA), which considers the molecular percentages of Al2O3, Na2O, K2O and the CaO (CaO*) that is solely contained within the silicates [41,43]. The CaO* was also used in the calculation of the PIA index to avoid the influence of carbonates. Both chemical indices show a positive correlation between higher values and a higher alteration degree, with the highest values indicating higher clay mineral contents. A correlation matrix analysis (Table S10) reveals strong positive and significant correlations (0.896 and 0.917) with phyllosilicates and negative and significant coefficients with calcite and amphiboles, validating their calculation.
Despite the expected decline in the PIA and the CIA values from the top to the bottom of the vertical profile due to the field interpretation, it is possible to observe an increase in the values of the indices from top to bottom, indicating more weathered materials at the base of the deposit. However, there is an exception, the A profile, which shows higher values at the top. This can be related to the fracture system running in the NNE–SSW direction that seems to have favored the weathering [26], since it is possible that those fluids came from the NNE and affected the A profile in a slightly different manner. A clear link between the alteration indices and the amount of primary minerals (tectosilicates and amphiboles) is observed. The variation along the horizontal levels shows values that are typically higher towards the A profile, although the B and C profiles have higher variability in their values. The circulation of the carbonated fluids, especially in the B profile, affects the resulting CIA and PIA indices (even after the neglection of the Ca contained within carbonates by the use of the CaO* for their calculation), obscuring their true values and making it challenging to determine the weathering pathways of the deposit (Table 5, Figure 10). When calculating these indices for the finer granulometries, it is possible to observe how the influence of the carbonated fluids is progressively less important (as indicated by their higher values), especially at the <2 µm fraction, which is essentially formed of phyllosilicates. However, these fluids still have some influence on the calculated indices.
To completely avoid the influence of these carbonated fluids on the calculation of the indices and only focus on pure silicates, for which these indices were thought, the results from the TEM-AEM point analyses of the non-homoionized samples were used (Table 5), to avoid the additional input of Ca during the homoionization procedure. The indices calculated this way have slightly higher values than the ones calculated using the ICP-MS analyses of all the granulometric fractions. This is due to the presence of non-silicate minerals (carbonates) within the samples analyzed by ICP-MS, indicating that the corrections performed to completely neglect carbonates to calculate the indices are not 100% efficient. The resulting CIA indices are the most consistent with the previous data (from the mineralogical and crystal-chemical characterizations), showing a higher degree of alteration of the A profile, followed by the B profile, and ending with the C profile. It is especially interesting considering that there is a fracture system which seems to have favored the weathering of the samples running in NNE–SSW direction [26] and that the A profile is located towards the NE and the C profile towards the SW, which can point to a northern origin of the fluids that weathered the samples.
Although clay minerals can adsorb REE or even incorporate them in octahedral positions [75], providing excellent recipients for REE-rich deposits, the richest fractions in phyllosilicates are found to be depleted in such elements. This can be explained by a preferential accumulation of REE in the area within coarser minerals, such as zircons, as well as by their complexation and mobilization by the carbonate-rich fluids and their precipitation within calcite veins [68,69,70,71]. This would explain the significant correlation coefficients that REE have both with quartz and with calcite (Table S8). The Ce and Eu anomalies shown in Figure 9 and detailed in Table 6 were calculated as detailed by previous authors [76]. All the samples present negative Eu anomalies. The origin of this anomaly is due to the dissolution of Eu-rich minerals (plagioclase) present on the parent rock by weathering processes [77,78]. On the other hand, there are samples with positive Ce anomalies and others with negative Ce anomalies, indicating the first ones have more oxidizing environments than the second ones [79,80]. In Table S11, a correlation matrix between the values of these anomalies is displayed. It is possible to observe that the Eu anomaly is not correlated with any mineral, probably because there are no major differences within its values. However, the Ce anomaly shows significant positive correlations with the phyllosilicates and a highly significant negative correlation with calcite. This indicates that the weathering that originated phyllosilicates took place in more oxidizing environments, while the negative anomalies are probably caused by more reducing conditions during the precipitation of calcite due to the circulation of carbonate-rich fluids. This corroborates the important role these fluids play in the chemistry of the preexisting materials and how they can impact the indices calculated as well as their interpretations.

6. Concluding Remarks

The Benavila deposit is mainly formed by dioctahedral smectites, followed by carbonates (Paleogene–Quaternary carbonated crusts due to the circulation of carbonate-rich fluids) and minor amounts of tectosilicates and other phyllosilicates. The almost complete transformation of primary minerals (as tectosilicates, amphiboles, and micas) suggests an intense weathering of the parent rock. In addition, the presence of amphibole within the C vertical profile is interpreted as indicative of a lower degree of alteration due to the primary character of that mineral.
The crystal-chemical characterization reinforces the importance of performing a homoionization of the samples prior to their analysis. The smectites studied are classified as ferrian montmorillonitic beidellites and beidellitic montmorillonites. Smectites with octahedral configurations with lower percentages of tv sites and classified as montmorillonitic beidellites could also indicate a lower degree of weathering within the deposit.
The geochemical analysis of the samples indicates a preferential depletion of the more clayey materials in HFSE, REE, and Y, among other heavy elements. In addition, it also points towards the pathway of weathering along which the bentonite deposit originated. However, the presence of carbonated crusts of Paleogene–Quaternary age due to the circulation of carbonated fluids overprints the deposit in certain parts and hardens the task of obtaining useful weathering indices.
The values of the CIA index are consistent with the aforementioned mineralogical and crystal-chemical criteria regarding the weathering of the parent rocks that originated the Benavila deposit. This study reveals the alteration pathways of the Benavila deposit (NE-SW direction, with the most weathered materials towards the NE) as well as the smectite variability within it. The variations of smectite mainly originate from lower degrees of weathering and the circulation of carbonated fluids that changed the already weathered bentonitic deposit, possibly affecting the properties of the bentonite.

Supplementary Materials

The following supporting information can be downloaded at: https://www.mdpi.com/article/10.3390/min15080836/s1, Table S1: Peak centers and percentages of the areas of the deconvoluted peaks at the DTG between 300 and 800 °C; Table S2: Weight percentage (wt %) of major elements; Table S3: Trace element content (µg/g); Table S4: Correlation matrix of mineralogy and major elements; Table S5: Correlation matrix of mineralogy and HFSE; Table S6: Correlation matrix of mineralogy and TTE; Table S7: Correlation matrix of mineralogy and LILE; Table S8: Correlation matrix of mineralogy and REE; Table S9: Correlation matrix of mineralogy and other trace elements analyzed; Table S10: Correlation matrix of mineralogy and the CIA and PIA indices; Table S11: Correlation matrix of mineralogy and the Ce and Eu anomalies.

Author Contributions

Conceptualization, M.I.D. and I.P.; methodology, J.G.-R., R.M., P.G.F. and E.G.-R.; formal analysis, J.G.-R.; investigation, J.G.-R., E.G.-R., M.S., I.P., P.G.F., R.M. and M.I.D.; data curation, J.G.-R.; writing—original draft preparation, J.G.-R.; writing—review and editing, J.G.-R., E.G.-R., M.S., I.P., P.G.F., R.M. and M.I.D.; supervision, M.I.D. and I.P.; project administration, M.I.D. and M.S.; funding acquisition, M.I.D., I.P. and M.S. All authors have read and agreed to the published version of the manuscript.

Funding

The authors acknowledge financial support of the SA0107P20 (Junta de Castilla y León, Spain, and Fondo Europeo de Desarrollo Regional, FEDER), UID/Multi/04349/2019 (FCT, Portugal) and Work Package ROUTES of EURAD (European Joint Programme on Radioactive Waste Management of the European Union, EC grant agreement nº 847593) projects. Javier García-Rivas thanks the FCT for a postdoctoral fellowship BL233/2019_IST-ID at the C2TN.

Data Availability Statement

The data presented in this study are available on request from the corresponding author.

Conflicts of Interest

The authors declare no conflicts of interest.

References

  1. Newman, A.C.D. The Specific Surface of Soils Determined by Water Sorption. J. Soil Sci. 1983, 34, 23–32. [Google Scholar] [CrossRef]
  2. Środoń, J.; MaCarty, D.K. Surface Area and Layer Charge of Smectite from CEC and EGME/H2O-Retention Measurements. Clays Clay Miner. 2008, 56, 155–174. [Google Scholar] [CrossRef]
  3. Woodruff, W.F.; Revil, A. CEC-Normalized Clay-Water Sorption Isotherm. Water Resour. Res. 2011, 47, W11502. [Google Scholar] [CrossRef]
  4. Suárez, M.; Lorenzo, A.; García-Vicente, A.; Morales, J.; García-Rivas, J.; García-Romero, E. New Data on the Microporosity of Bentonites. Eng. Geol. 2022, 296, 106439. [Google Scholar] [CrossRef]
  5. Murray, H.H. Bentonite Applications. In Applied Clay Mineralogy Occurrences, Processing and Application of Kaolins, Bentonites, Palygorskite-Sepiolite, and Common Clays. Developments in Clay Science; Murray, H.H., Ed.; Elsevier: Amsterdam, The Netherlands, 2006; Volume 2, pp. 111–130. ISBN 978-0-444-51701-2. [Google Scholar]
  6. Harvey, C.C.; Lagaly, G. Industrial Applications. In Developments in Clay Science; Elsevier: Amsterdam, The Netherlands, 2013; Volume 5, pp. 451–490. ISBN 978-0-08-099364-5. [Google Scholar]
  7. Eisenhour, D.D.; Brown, R.K. Bentonite and Its Impact on Modern Life. Elements 2009, 5, 83–88. [Google Scholar] [CrossRef]
  8. Babu Valapa, R.; Loganathan, S.; Pugazhenthi, G.; Thomas, S.; Varghese, T.O. An Overview of Polymer–Clay Nanocomposites. In Clay-Polymer Nanocomposites; Elsevier: Amsterdam, The Netherlands, 2017; pp. 29–81. ISBN 978-0-323-46153-5. [Google Scholar]
  9. Ishimaru, S.; Yamauchi, M.; Ikeda, R. A New Semiconducting Organic–Inorganic Nanocomposite, 1,5-Diaminonphthalene–Saponite Intercalation Compound. Solid State Commun. 2003, 127, 57–59. [Google Scholar] [CrossRef]
  10. Yang, Q.; Saito, T.; Isogai, A. Transparent, Flexible, and High-Strength Regenerated Cellulose/Saponite Nanocomposite Films with High Gas Barrier Properties. J. Appl. Polym. Sci. 2013, 130, 3168–3174. [Google Scholar] [CrossRef]
  11. Carretero, M.I.; Pozo, M. Clay and Non-Clay Minerals in the Pharmaceutical Industry. Appl. Clay Sci. 2009, 46, 73–80. [Google Scholar] [CrossRef]
  12. Khurana, I.S.; Kaur, S.; Kaur, H.; Khurana, R.K. Multifaceted Role of Clay Minerals in Pharmaceuticals. Future Sci. OA 2015, 1. [Google Scholar] [CrossRef] [PubMed]
  13. Gopinath, S.; Sugunan, S. Enzymes Immobilized on Montmorillonite K 10: Effect of Adsorption and Grafting on the Surface Properties and the Enzyme Activity. Appl. Clay Sci. 2007, 35, 67–75. [Google Scholar] [CrossRef]
  14. Long, L.-H.; Zhang, Y.-T.; Wang, X.-F.; Cao, Y.-X. Montmorillonite Adsorbs Urea and Accelerates Urea Excretion from the Intestine. Appl. Clay Sci. 2009, 46, 57–62. [Google Scholar] [CrossRef]
  15. Müller, H.-J.; Dobler, D.; Schmidts, T.; Rusch, V. Smectite for Medical Use and Their Toxin Binding Capacity. J. Food Nutr. Popul. Health 2019, 03. [Google Scholar] [CrossRef]
  16. Ali Khan, S.; Riaz-ur-Rehman; Ali Khan, M. Sorption of Cesium on Bentonite. Waste Manag. 1994, 14, 629–642. [Google Scholar] [CrossRef]
  17. Bradbury, M.H.; Baeyens, B. A Generalised Sorption Model for the Concentration Dependent Uptake of Caesium by Argillaceous Rocks. J. Contam. Hydrol. 2000, 42, 141–163. [Google Scholar] [CrossRef]
  18. Durrant, C.B.; Begg, J.D.; Kersting, A.B.; Zavarin, M. Cesium Sorption Reversibility and Kinetics on Illite, Montmorillonite, and Kaolinite. Sci. Total Environ. 2018, 610–611, 511–520. [Google Scholar] [CrossRef] [PubMed]
  19. Galamboš, M.; Magula, M.; Daňo, M.; Osacký, M.; Rosskopfová, O.; Rajec, P. Comparative Study of Cesium Adsorption on Dioctahedral and Trioctahedral Smectites. J. Radioanal. Nucl. Chem. 2012, 293, 829–837. [Google Scholar] [CrossRef]
  20. Missana, T.; Benedicto, A.; García-Gutiérrez, M.; Alonso, U. Modeling Cesium Retention onto Na-, K- and Ca-Smectite: Effects of Ionic Strength, Exchange and Competing Cations on the Determination of Selectivity Coefficients. Geochim. Cosmochim. Acta 2014, 128, 266–277. [Google Scholar] [CrossRef]
  21. Cuevas, J.; Ruiz, A.I.; Fernández, R.; Torres, E.; Escribano, A.; Regadío, M.; Turrero, M.J. Lime Mortar-Compacted Bentonite–Magnetite Interfaces: An Experimental Study Focused on the Understanding of the EBS Long-Term Performance for High-Level Nuclear Waste Isolation DGR Concept. Appl. Clay Sci. 2016, 124–125, 79–93. [Google Scholar] [CrossRef]
  22. Park, S.-M.; Alessi, D.S.; Baek, K. Selective Adsorption and Irreversible Fixation Behavior of Cesium onto 2:1 Layered Clay Mineral: A Mini Review. J. Hazard Mater. 2019, 369, 569–576. [Google Scholar] [CrossRef]
  23. Galopim de Carvalho, A.M.; Carvalhosa, A.B. Carta Geológica de Portugal Na Escala de 1 / 50.000. Notícia Explicativa Da Folha 32-A. Ponte de Sor; Serviços Geológicos de Portugal: Lisboa, Portugal, 1982. [Google Scholar]
  24. Piçarra, J.M.; Dias, R.P.; Ribeiro, M.L.; Solá, R.; Barbosa, B.; Pais, J.; Vivar, V.; Baltuille Martín, J.M. Carta Geológica de Portugal Na Escala de 1 / 50.000. Notícia Explicativa Da Folha 32-C. Avis; LNEG: Lisboa, Portugal, 2009. [Google Scholar]
  25. Pinto Henriques, S. Ensaios de Beneficiação de “Bentonite” de Avis (Portugal) Para Aplicação Em Geologia Médica. Master’s Thesis, Universidade de Aveiro, Aveiro, Portugal, 2014. [Google Scholar]
  26. Galopim de Carvalho, A.M.; Alegria, M.F.; Mira Azevedo, M.T. Aspectos de Alteração Em Rochas Dioríticas de Benavila (Avis). Comun. Geológicas 1980, 66, 67–70. [Google Scholar]
  27. Canilho, M.H. Contribuição Para o Conhecimento Petrográfico e Geoquímico Do Maciço Ígneo de Benavila (Avis). Ciênc. Terra 1992, 11, 255–273. [Google Scholar]
  28. de Gomes, C.S.F. Industrial minerals: Present situation in Portugal of the commercial clays. In A Geologia de Engenharia e os Recursos Geológicos. Volume 2: Recursos Geológicos e Formação; Imprensa da Universidade de Coimbra: Coimbra, Portugal, 2003; pp. 349–366. ISBN 978-989-26-0322-3. [Google Scholar]
  29. Dias, M.I.; Suárez Barrios, M.; Prates, S. Las Bentonitas de Benavila (Portugal). Caracterización Mineralógica y Propiedades. [Bentonites from Benavila (Portugal). Mineralogical Characterisation and Properties]. Geogactea 2004, 35, 99–102. [Google Scholar]
  30. Dias, M.I. Caracterização Mineralógica e Tecnológica de Argilas Especiais de Bacias Terciárias Portuguesas. Ph.D. Thesis, University of Lisbon, Lisbon, Portugal, 1998. [Google Scholar]
  31. Rebelo, M.; Viseras, C.; López-Galindo, A.; Rocha, F.; da Silva, E.F. Characterization of Portuguese Geological Materials to Be Used in Medical Hydrology. Appl. Clay Sci. 2011, 51, 258–266. [Google Scholar] [CrossRef]
  32. Guimarães, V.; Bobos, I.; Rocha, F. Acid-Base Properties of Ca-Montmorillonite from Benavila Region (Portugal). Comun. Geológicas 2014, 101, 791–794. [Google Scholar]
  33. Dziadkowiec, J.; Mansa, R.; Quintela, A.; Rocha, F.; Detellier, C. Preparation, Characterization and Application in Controlled Release of Ibuprofen-Loaded Guar Gum/Montmorillonite Bionanocomposites. Appl. Clay Sci. 2017, 135, 52–63. [Google Scholar] [CrossRef]
  34. Bastos, C.M.; Rocha, F.; Patinha, C.; Marinho-Reis, P. Bioaccessibility by Perspiration Uptake of Minerals from Two Different Sulfurous Peloids. Environ. Geochem. Health 2023, 45, 6621–6641. [Google Scholar] [CrossRef]
  35. Gonçalves, F. Estado Actual Do Conhecimento Geológico Do Nordeste Alentejano. In Proceedings of the IV Curso de Extensão Universitária de Ciências Geológicas; Faculdade Ciências de Lisboa: Lisbon, Portugal, 1978; pp. 193–213. [Google Scholar]
  36. Pereira, V.B. Prospecção de Bentonites. Referência Aos Trabalhos Realizados e Resultados Obtidos. Estud. Notas E Trab. 1993, 35, 35–54. [Google Scholar]
  37. Martín Pozas, J.M. Analisis Cuantitativo de Fases Cristalinas Por DRX. In Método de Debye-Scherrer; Saja, J., Ed.; ICE Universidad de Valladolid: Valladolid, Spain, 1975. [Google Scholar]
  38. García-Romero, E.; Lorenzo, A.; García-Vicente, A.; García-Rivas, J.; Morales, J.; Suárez, M. On the Structural Formula of Smectites: A Review and New Data on the Influence of the Exchangeable Cations. J. Appl. Crystallogr. 2021, 54, 251–262. [Google Scholar] [CrossRef]
  39. Bahlburg, H.; Dobrzinski, N. A Review of the Chemical Index of Alteration (CIA) and Its Application to the Study of Neoproterozoic Glacial Deposits and Climate Transitions. Geol. Soc. Lond. Mem. 2011, 36, 81–92. [Google Scholar] [CrossRef]
  40. Buggle, B.; Glaser, B.; Hambach, U.; Gerasimenko, N.; Marković, S. An Evaluation of Geochemical Weathering Indices in Loess–Paleosol Studies. Quat. Int. 2011, 240, 12–21. [Google Scholar] [CrossRef]
  41. Fedo, C.M.; Nesbitt, H.W.; Young, G.M. Unraveling the Effects of Potassium Metasomatism in Sedimentary Rocks and Paleosols, with Implications for Paleoweathering Conditions and Provenance. Geology 1995, 23, 921–924. [Google Scholar] [CrossRef]
  42. Meunier, A.; Caner, L.; Hubert, F.; El Albani, A.; Pret, D. The Weathering Intensity Scale (WIS): An Alternative Approach of the Chemical Index of Alteration (CIA). Am. J. Sci. 2013, 313, 113–143. [Google Scholar] [CrossRef]
  43. Nesbitt, H.W.; Young, G.M. Early Proterozoic Climates and Plate Motions Inferred from Major Element Chemistry of Lutites. Nature 1982, 299, 715–717. [Google Scholar] [CrossRef]
  44. Price, J.R.; Velbel, M.A. Chemical Weathering Indices Applied to Weathering Profiles Developed on Heterogeneous Felsic Metamorphic Parent Rocks. Chem. Geol. 2003, 202, 397–416. [Google Scholar] [CrossRef]
  45. Newman, A.C.D.; Brown, G. The Chemical Constitution of Clays. In Chemistry of Clays and Clay Minerals; Newman, A.C.D., Ed.; Monograph No. 6; Mineralogical Society and Longman: London, UK, 1987; pp. 1–128. [Google Scholar]
  46. Fesharaki, O.; García-Romero, E.; Cuevas-González, J.; López-Martínez, N. Clay Mineral Genesis and Chemical Evolution in the Miocene Sediments of Somosaguas, Madrid Basin, Spain. Clay Miner. 2007, 42, 187–201. [Google Scholar] [CrossRef]
  47. de Santiago Buey, C.; Suárez Barrios, M.; García-Romero, E.; Domínguez Diaz, M.C.; Doval Montoya, M. Electron Microscopic Study of the Illite-Smectite Transformation in the Bentonites from Cerro Del Aguila (Toledo, Spain). Clay Miner. 1998, 33, 501–510. [Google Scholar] [CrossRef]
  48. Pelayo, M.; Schmid, T.; Díaz-Puente, F.J.; López-Martínez, J. Characterization and Distribution of Clay Minerals in the Soils of Fildes Peninsula and Ardley Island (King George Island, Maritime Antarctica). Clay Miner. 2022, 57, 264–284. [Google Scholar] [CrossRef]
  49. García-Romero, E.; Suárez, M. A Structure-Based Argument for Non-Classical Crystal Growth in Natural Clay Minerals. Mineral. Mag. 2018, 82, 171–180. [Google Scholar] [CrossRef]
  50. Post, J.L.; Cupp, B.L.; Madsen, F.T. Beidellite and Associated Clays from the Delamar Mine and Florida Mountain Area, Idaho. Clays Clay Miner. 1997, 45, 240–250. [Google Scholar] [CrossRef]
  51. Keeling, J.L.; Raven, M.D.; Gates, W.P. Geology and Characterization of Two Hydrothermal Nontronites from Weathered Metamorphic Rocks at the Uley Graphite Mine, South Australia. Clays Clay Miner. 2000, 48, 537–548. [Google Scholar] [CrossRef]
  52. Emmerich, K. Full Characterization of Smectites. In Developments in Clay Science; Bergaya, F., Lagaly, G., Eds.; Elsevier: Amsterdam, The Netherlands, 2013; Volume 5, pp. 381–404. ISBN 978-0-08-099364-5. [Google Scholar]
  53. Emmerich, K.; Wolters, F.; Kahr, G.; Lagaly, G. Clay Profiling: The Classification of Montmorillonites. Clays Clay Miner. 2009, 57, 104–114. [Google Scholar] [CrossRef]
  54. El-Barawy, K.A.; Girgis, B.S.; Felix, N.S. Thermal Treatment of Some Pure Smectites. Thermochim. Acta 1986, 98, 181–189. [Google Scholar] [CrossRef]
  55. Drits, V.A.; Lindgreen, H.; Salyn, A.L.; Ylagan, R.; McCarty, D.K. Semiquantitative Determination of Trans-Vacant and Cis-Vacant 2:1 Layers in Illites and Illite-Smectites by Thermal Analysis and X-Ray Diffraction. Am. Miner. 1998, 83, 1188–1198. [Google Scholar] [CrossRef]
  56. Drits, V.A. An Improved Model for Structural Transformations of Heat-Treated Aluminous Dioctahedral 2:1 Layer Silicates. Clays Clay Miner. 1995, 43, 718–731. [Google Scholar] [CrossRef]
  57. Wolters, F.; Emmerich, K. Thermal Reactions of Smectites—Relation of Dehydroxylation Temperature to Octahedral Structure. Thermochim. Acta 2007, 462, 80–88. [Google Scholar] [CrossRef]
  58. Wojdyr, M. Fityk: A General-Purpose Peak Fitting Program. J. Appl. Crystallogr. 2010, 43, 1126–1128. [Google Scholar] [CrossRef]
  59. Wang, X.; Li, Y.; Wang, H. Structural Characterization of Octahedral Sheet in Dioctahedral Smectites by Thermal Analysis. Minerals 2020, 10, 347. [Google Scholar] [CrossRef]
  60. Deer, W.A.; Howie, R.A.; Zussman, J. An Introduction to the Rock-Forming Minerals; Longman: London, UK, 1966. [Google Scholar]
  61. González López, J.M.; Bauluz, B.; Fernández-Nieto, C.; Oliete, A.Y. Factors Controlling the Trace-Element Distribution in Fine-Grained Rocks: The Albian Kaolinite-Rich Deposits of the Oliete Basin (NE Spain). Chem. Geol. 2005, 214, 1–19. [Google Scholar] [CrossRef]
  62. Middelburg, J.; Vanderweijden, C.; Woittiez, J. Chemical Processes Affecting the Mobility of Major, Minor and Trace Elements during Weathering of Granitic Rocks. Chem. Geol. 1988, 68, 253–273. [Google Scholar] [CrossRef]
  63. Mosser, C.; Brillanceau, A.; Besnus, Y. Relationship between Sediments and Their Igneous Source Rocks Using Clay Mineral Multi-Element Chemistry: The Cenozoic Lacustrine Anloua Basin (Adamaoua, Cameroon). Chem. Geol. 1991, 90, 319–342. [Google Scholar] [CrossRef]
  64. Smith, J.V. Feldspar Minerals 2: Chemical and Textural Properties; Springer: Berlin/Heidelberg, Germany, 1974. [Google Scholar]
  65. Baker, P.A.; Gieskes, J.M.; Elderfield, H. Diagenesis of Carbonates in Deep-Sea Sediments—Evidence from Sr/Ca Ratios and Interstitial Dissolved Sr2+ Data. J. Sediment. Petrol. 1982, 52, 71–82. [Google Scholar]
  66. Gabitov, R.I.; Watson, E.B. Partitioning of Strontium between Calcite and Fluid. Geochem. Geophys. Geosystems 2006, 7, 2005GC001216. [Google Scholar] [CrossRef]
  67. García-Rivas, J.; Suárez, M.; Torres, T.; Sánchez-Palencia, Y.; García-Romero, E.; Ortiz, J.E. Geochemistry and Biomarker Analysis of the Bentonites from Esquivias (Toledo, Spain). Minerals 2018, 8, 291. [Google Scholar] [CrossRef]
  68. McLennan, S.M.; Nance, W.B.; Taylor, S.R. Rare Earth Element-Thorium Correlations in Sedimentary Rocks, and the Composition of the Continental Crust. Geochim. Cosmochim. Acta 1980, 44, 1833–1839. [Google Scholar] [CrossRef]
  69. Louvel, M.; Etschmann, B.; Guan, Q.; Testemale, D.; Brugger, J. Carbonate Complexation Enhances Hydrothermal Transport of Rare Earth Elements in Alkaline Fluids. Nat. Commun. 2022, 13, 1456. [Google Scholar] [CrossRef] [PubMed]
  70. Reece, M.E.; Migdisov, A.A.; Williams-Jones, A.E.; Strzelecki, A.C.; Waters, L.; Boukhalfa, H.; Guo, X. Stability of Aqueous Neodymium Complexes in Carbonate-Bearing Solutions from 100–600 °C. Commun. Earth Environ. 2025, 6, 353. [Google Scholar] [CrossRef]
  71. Di, J.; Ding, X. Complexation of REE in Hydrothermal Fluids and Its Significance on REE Mineralization. Minerals 2024, 14, 531. [Google Scholar] [CrossRef]
  72. Boynton, W.V. Cosmochemistry of the Rare Earth Elements: Meteorite Studies. In Developments in Geochemistry; Henderson, P., Ed.; Elsevier: Amsterdam, The Netherlands, 1984; Volume 2, pp. 63–114. ISBN 978-0-444-42148-7. [Google Scholar]
  73. Foley, N.K.; Jaskula, B.W.; Kimball, B.E.; Schulte, R.F. Critical Mineral Resources of the United States—Economic and Environmental Geology and Prospects for Future Supply. Chapter H: Gallium.; Professional Paper; U.S. Geological Survey: Reston, VA, USA, 2017; p. 862.
  74. Eliopoulos, I.-P.D.; Eliopoulos, G.D. Factors Controlling the Gallium Preference in High-Al Chromitites. Minerals 2019, 9, 623. [Google Scholar] [CrossRef]
  75. Lorenzo, A.; Sánchez-Santos, J.M.; Rivas, M.J.; García-Romero, E.; Suárez, M. Geochemistry of Bentonites: A Statistical Analysis of Trace Element Distribution in Smectites. Appl. Clay Sci. 2024, 257, 107449. [Google Scholar] [CrossRef]
  76. Shields, G.; Stille, P. Diagenetic Constraints on the Use of Cerium Anomalies as Palaeoseawater Redox Proxies: An Isotopic and REE Study of Cambrian Phosphorites. Chem. Geol. 2001, 175, 29–48. [Google Scholar] [CrossRef]
  77. Lewis, A.J.; Palmer, M.R.; Sturchio, N.C.; Kemp, A.J. The Rare Earth Element Geochemistry of Acid-Sulphate and Acid-Sulphate-Chloride Geothermal Systems from Yellowstone National Park, Wyoming, USA. Geochim. Cosmochim. Acta 1997, 61, 695–706. [Google Scholar] [CrossRef]
  78. Karakaya, M.Ç.; Karakaya, N.; Kupeli, S. Mineralogical and Geochemical Properties of the Na- And Ca-Bentonites of Ordu (Ne Turkey). Clays Clay Miner. 2011, 59, 75–94. [Google Scholar] [CrossRef]
  79. Class, C.; le Roex, A.P. Ce Anomalies in Gough Island Lavas—Trace Element Characteristics of a Recycled Sediment Component. Earth Planet. Sci. Lett. 2008, 265, 475–486. [Google Scholar] [CrossRef]
  80. Braun, J.-J.; Pagel, M.; Muller, J.-P.; Bilong, P.; Michard, A.; Guillet, B. Cerium Anomalies in Lateritic Profiles. Geochim. Cosmochim. Acta 1990, 54, 781–795. [Google Scholar] [CrossRef]
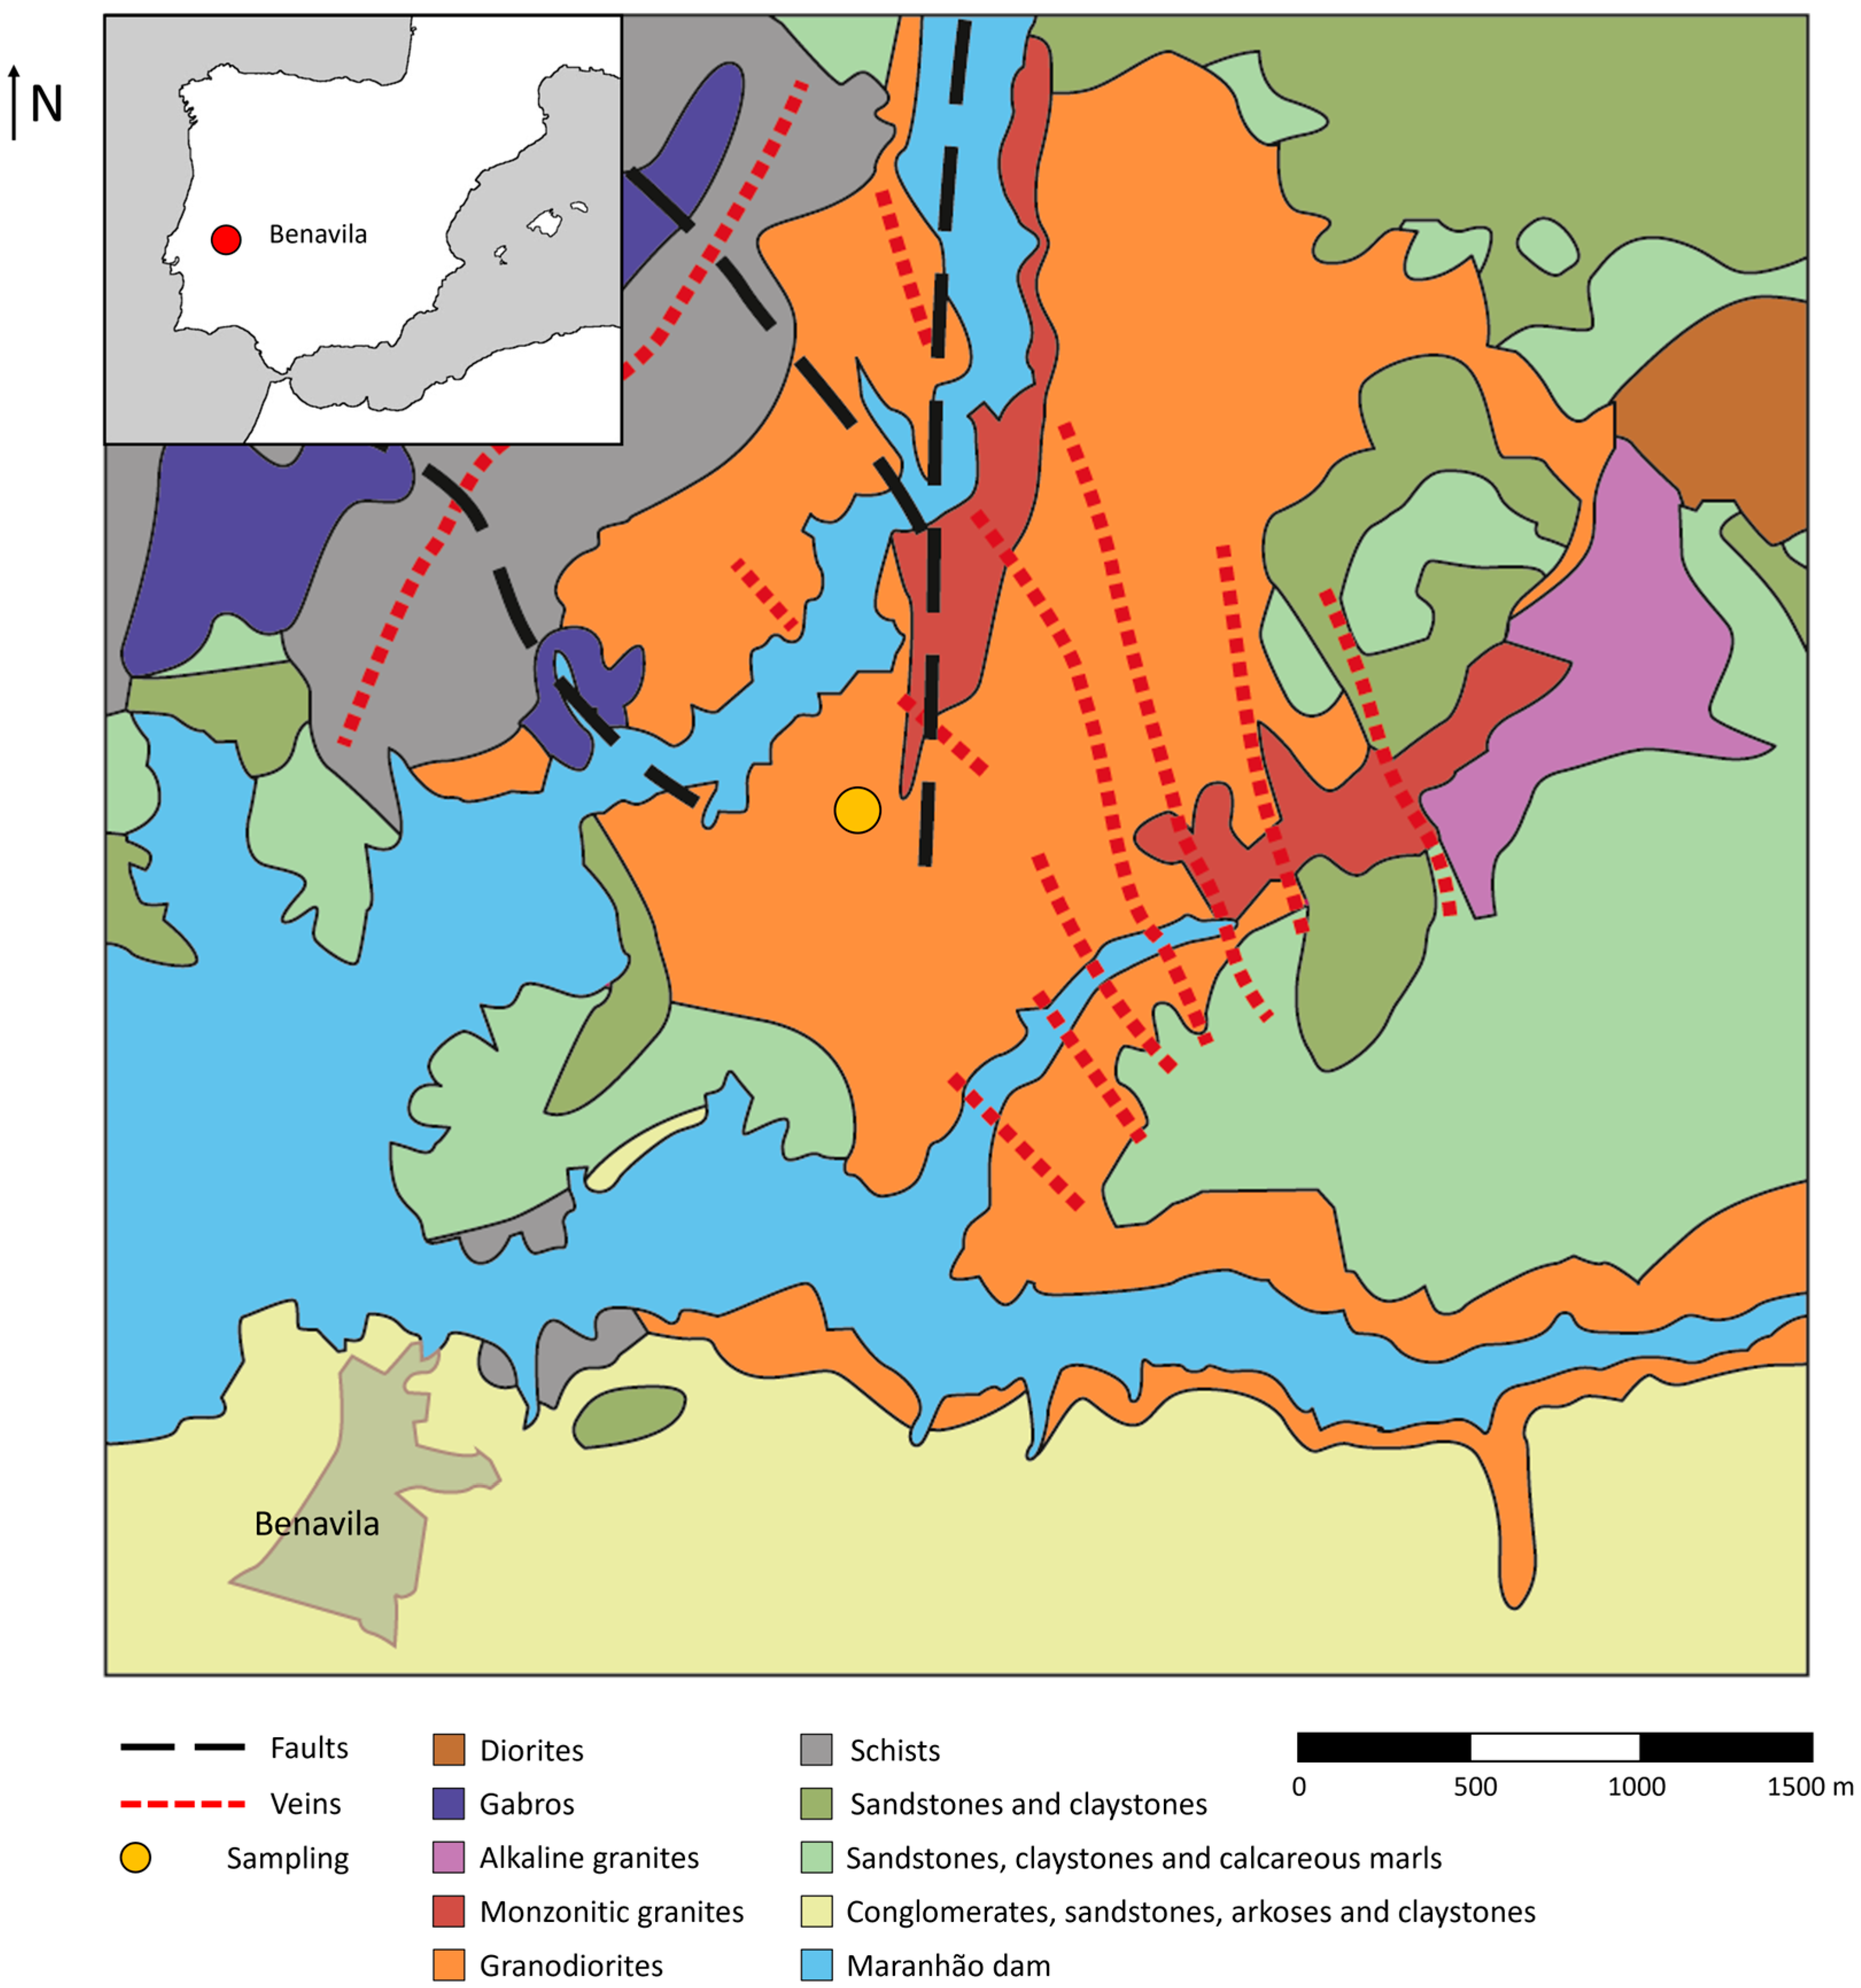
Figure 1. Geographical location of the samples and geological mapping of the area. Modified from [25]. All the plutonic and metamorphic rocks are dated as Silurian, while the sedimentary rocks are dated as Miocene [26,27].
Minerals 15 00836 g001
Figure 2. (a) General photograph of the outcrop and sampling grid, showing the horizontal profiles (1, 2, 3) and the vertical profiles (a, b, c). (b) Bentonite sample with part of the original texture preserved. (c) Bentonite sample without preserved original texture. (d) Carbonate vein.
Minerals 15 00836 g002
Figure 3. (a) Powder X-Ray diffractograms of sample BEN2C. (b) Air-dried oriented aggregates of sample BEN2C. (AD): air-dried oriented aggregate; (AD + EG): air-dried oriented aggregate solvated with ethylene glycol; (AD + TT): air-dried oriented aggregate calcinated at 550 °C. (c) Comparison of the (060) reflection of the fractions < 2 µm of all the samples. Amphibole (Amp), Calcite (Cal), chlorite (Chl), illite (Ilt), phyllosilicates (Phyllo), plagioclase (Pl), potassium feldspar (Kfs), smectite (Sme), and quartz (Qz).
Minerals 15 00836 g003
Figure 4. TEM representative photographs of smectie particles from samples BEN3A (left), BEN3B (middle), and BEN3C (right).
Minerals 15 00836 g004
Figure 5. Ternary plot of the octahedral content of the non-homoionized samples (a) and the homoionized samples (b) and reference samples of montmorillonite (WYO), beidellite (SBId-1), saponite (ESB6), stevensite (RESQ), and nontronite (NAu-1).
Minerals 15 00836 g005
Figure 6. (a) TGA (%) (black) and DTA (%/°C) (red) of sample BEN3ACa; (b) TGA (%) (black) and DTA (%/°C) (red) of sample BEN3BCa; (c) TGA (%) (black) and DTA (%/°C) (red) of sample BEN3CCa; (d) Deconvolution of the DTG curve between 300 and 900 °C of sample BEN3ACa, showing the different functions considered (black) and the resulting model (red).
Minerals 15 00836 g006
Figure 7. Ternary plot representing the values of SiO2, Al2O3, and CaO. Black: bulk rock samples; Red: <63 µm fraction; Green: <38 µm fraction; Blank: <2 µm fraction.
Minerals 15 00836 g007
Figure 8. (a) Enrichment in the <63 µm fraction respect the bulk rock sample of the represented oxides and elements; (b) Enrichment in the <38 µm fraction respect the bulk rock sample of the represented oxides and elements; (c) Enrichment in the <2 µm fraction respect the bulk rock sample of the represented oxides and elements.
Minerals 15 00836 g008
Figure 9. Chondrite normalized REE patterns.
Minerals 15 00836 g009
Figure 10. Graphical plot of the PIA (red) and CIA (blue) indices of samples from Benavila.
Minerals 15 00836 g010
Table 1. Semi-quantification of the mineral content of the samples from X-ray diffraction (XRD). (-): present at trace levels. Amphibole (Amp), calcite (Cal), chlorite (Chl), dolomite (Dol), phyllosilicates (Phyllo), plagioclase (Pl), potassium feldspar (Kfs), and quartz (Qz).
SampleAmpCalDolKfsPlQzChlIltSmeC/S
BEN1A 1224-6--74-
BEN1A < 63 µm 5---2--90-
BEN1A < 38 µm 2------96-
BEN1A < 2 µm 2 --97-
BEN1B 252-----70-
BEN1B < 63 µm 11-----186-
BEN1B <3 8 µm 9 ----189-
BEN1B < 2 µm 4 --95-
BEN1C-16 -----82-
BEN1C < 63 µm-4 -----94-
BEN1C < 38 µm-5 -----92-
BEN1C < 2 µm 2 --97-
BEN2A 17------81
BEN2A < 63 µm 12 4----83
BEN2A < 38 µm 5 -----93
BEN2A < 2 µm - --99
BEN2B 27 -----71-
BEN2B < 63 µm 9 3----86-
BEN2B < 38 µm 15 4----80-
BEN2B < 2 µm 2 --97-
BEN2C926 27---55
BEN2C < 63 µm413 --82
BEN2C < 38 µm35 -----90
BEN2C < 2 µm 2 --96
BEN3A ---2 -951
BEN3A < 63 µm - - -971
BEN3A < 38 µm --- -961
BEN3A < 2 µm -981
BEN3B 34 --641
BEN3B < 63 µm 27 ---711
BEN3B < 38 µm 28 --701
BEN3B < 2 µm 1 --962
BEN3C438 4-2--51
BEN3C < 63 µm-16 -----82
BEN3C < 38 µm211 -----86
BEN3C < 2 µm 2 --97
Table 2. Chemical analysis of major oxides (wt%) and structural formulae of the smectites obtained from point analyses by HRTEM–AEM. Max: maximum value; Min: minimum value; Mean: mean value; SD: standard deviation; ƩTC: sum of tetrahedral cations; ƩOC: sum of octahedral cations; TCh: tetrahedral charge; OCh: octahedral charge; LC: layer charge; n: number of analyses.
SamplesChemical analysis of major oxidesMean structural formulae
SiO2Al2O3Fe2O3MgOCaONaOK2OTiO2TetrahedralOctaheralInterlayer
SiAlΣTCAlMgFeTiΣOCCaNaKTChOChLC
BEN3AMax66.3332.6411.028.219.150.106.870.26
Min54.8118.330.002.570.250.000.000.00
Mean63.9819.907.896.840.920.000.400.067.670.338.002.481.220.710.014.420.12 0.06−0.330.050.28
n = 26SD1.972.582.280.901.600.021.260.09
BEN3BMax62.4619.5633.0011.942.750.001.431.14
Min48.0711.5810.404.600.460.000.000.00
Mean56.4915.2018.438.031.200.000.540.117.120.888.001.391.511.750.014.660.16 0.09−0.880.480.40
n = 29SD3.851.725.042.060.600.000.400.29
BEN3CMax63.1816.9529.5711.952.931.830.700.74
Min49.7411.8511.774.201.410.000.000.00
Mean56.8013.3520.077.081.890.120.380.127.220.788.001.231.341.920.014.500.260.030.06−0.780.170..61
n = 18SD3.371.244.101.790.410.470.240.23
BEN3ACaMax66.6529.5713.246.8516.030.009.760.57
Min54.1015.682.041.132.220.000.040.00
Mean61.5319.197.644.715.490.001.400.067.540.468.002.310.860.700.013.880.72 0.22−0.46−1.201.66
n = 20SD3.423.743.171.412.680.002.880.20
BEN3BCaMax63.1917.8019.7313.666.480.002.771.38
Min49.2812.8411.674.031.770.000.000.00
Mean58.8015.1314.756.543.670.000.700.427.360.648.001.591.221.390.044.240.49 0.11−0.64−0.461.10
n = 26SD3.361.051.982.171.050.000.810.33
BEN3CCaMax62.6016.7516.3913.308.250.007.101.03
Min53.7412.8610.976.042.180.000.310.02
Mean57.1014.7313.278.993.740.001.670.507.200.808.001.381.691.260.054.380.48 0.34−0.80−0.501.30
n = 17SD2.491.111.772.301.390.001.940.25
Table 3. Maximum (Max), minimum (Min), and mean values of major elements in weight percentage (wt%) of all the granulometric fractions, along with their standard deviation (SD).
Bulk Sample<63 µm<38 µm<2 µm
MaxMinMeanSDMaxMinMeanSDMaxMinMeanSDMaxMinMeanSD
SiO251.8629.7639.276.9648.7632.9642.364.5749.3334.2043.314.2250.2345.2748.141.50
Al2O313.588.2611.372.0014.398.7212.022.2414.488.5512.142.3216.0810.3813.471.89
Fe2O37.816.106.960.6210.605.277.561.5011.525.308.101.8110.534.857.632.02
MnO0.130.060.100.020.090.040.060.020.090.040.070.020.070.020.050.02
MgO6.184.304.930.545.423.994.610.435.443.964.670.475.574.665.140.28
CaO21.651.6713.806.3217.321.328.154.4215.841.387.313.944.471.272.640.93
Na2O1.200.040.340.380.270.050.120.080.240.020.080.071.080.220.550.28
K2O1.490.500.870.310.560.290.430.100.520.230.390.090.590.250.350.10
TiO21.020.400.650.150.750.390.610.120.770.350.610.130.340.120.190.07
P2O50.210.090.150.040.230.030.130.060.260.030.130.070.020.010.010.00
LOI26.2016.1920.883.3228.3422.1124.201.7926.7220.8722.941.6223.7819.0021.351.26
Total100.0098.4399.310.60100.8099.18100.240.52100.8098.5999.750.72100.9098.7099.530.81
Table 4. Maximum (Max), minimum (Min), and mean values of trace elements (µm) of all the granulometric fractions, along with their standard deviation (SD).
Bulk Sample<63 µm<38 µm<2 µm
MaxMinMeanSDMaxMinMeanSDMaxMinMeanSDMaxMinMeanSD
Zr119.0035.0072.4423.22122.0049.0069.6722.23127.0044.0065.0024.0956.0031.0040.338.16
Nb6.603.404.760.966.102.004.211.266.102.104.241.211.300.200.760.28
Hf2.701.301.890.403.201.702.190.503.401.602.120.552.200.901.490.36
Ta0.740.230.350.150.710.090.300.171.250.520.780.200.150.010.080.04
Tl0.380.160.260.080.210.080.110.040.140.050.090.030.070.050.050.01
Th5.220.792.861.834.780.772.541.595.210.872.701.703.270.401.591.17
U1.220.430.800.301.210.550.710.211.190.500.710.220.240.090.150.04
Sc33.0018.0027.334.5240.0020.0030.895.2640.0021.0031.225.6542.0020.0031.005.93
V265.0053.00111.6761.02194.0045.0089.2247.79208.0046.0093.8952.20171.0027.0081.4448.44
Cr810.0020.00400.00256.95850.0030.00443.33282.131080.0040.00528.89372.48890.0060.00442.22302.65
Co34.0010.0021.896.3517.0011.0014.331.8922.0010.0017.443.7217.006.0011.443.59
Ni120.0030.0068.8934.78100.0020.0051.2530.18130.0020.0061.2540.45120.0030.0055.7132.89
Cu40.0020.0025.007.0730.0010.0017.506.6130.0010.0020.005.0020.0010.0015.005.00
Zn80.0050.0064.448.3180.0040.0048.8912.8690.0040.0055.5614.9960.0030.0043.3310.54
Rb68.0019.0043.4417.6847.0015.0024.789.5944.0013.0023.678.7316.007.0010.892.51
Sr175.0081.00122.5626.5898.0080.0090.445.8996.0080.0088.566.45133.0093.00108.7812.73
Cs3.700.702.420.952.300.801.510.482.200.601.430.481.500.601.080.27
Ba604.00176.00348.56145.07363.00106.00225.3371.50327.0098.00208.6767.81556.00111.00277.89153.05
Pb11.005.008.252.1727.006.0013.679.468.005.006.001.2212.005.008.503.50
La24.306.7313.976.3521.203.119.985.4519.202.779.304.898.570.714.272.99
Ce36.8015.7024.778.0635.9010.4020.397.9133.6010.4020.697.7026.202.9312.407.09
Pr6.342.474.051.285.271.642.851.115.061.442.771.051.840.180.970.65
Nd26.5010.3017.425.4623.707.6512.594.9722.606.4611.814.726.390.883.612.25
Sm6.342.694.271.295.772.023.091.145.301.732.881.101.190.190.650.37
Eu1.550.671.060.301.350.470.760.261.160.470.710.220.230.050.130.07
Gd6.752.434.061.335.962.003.031.264.841.672.641.040.880.190.470.23
Tb1.090.370.650.210.910.330.490.180.770.300.440.160.120.030.070.03
Dy6.522.203.921.265.342.052.871.094.561.802.620.990.650.150.380.15
Ho1.300.430.760.261.060.390.570.220.900.360.510.190.120.030.070.03
Er3.721.302.180.703.121.141.670.632.541.031.470.540.340.100.210.08
Tm0.540.200.330.100.450.170.240.090.360.160.210.070.050.010.030.01
Yb3.291.362.110.552.901.141.590.542.351.071.440.450.330.080.190.07
Lu0.460.210.320.080.440.170.250.080.380.170.230.070.050.010.030.01
Be3.001.001.890.573.001.001.670.672.001.001.330.472.001.001.500.50
Ga15.0010.0012.441.7715.0011.0012.781.4715.0012.0013.111.1014.0012.0013.220.63
Ge1.400.700.940.230.900.500.700.140.900.500.690.140.700.600.650.05
Y39.5012.3021.917.8632.9011.8016.096.9426.6010.0014.465.713.000.801.820.69
Sn5.001.002.331.056.002.002.891.376.002.003.221.405.002.002.781.13
Sb0.300.200.230.043.500.201.541.020.400.200.270.09135.000.5038.0346.11
W4.000.601.431.032.700.501.260.688.000.902.382.221.900.601.050.42
Table 5. Plagioclase index of alteration (PIA) and chemical index of alteration (CIA) of all the samples and granulometric fractions, along with the indices obtained through TEM-AEM.
Whole Rock<63 µm<38 µm<2 µmTEM-AEM
PIACIAPIACIAPIACIAPIACIAPIACIA
BEN1A50.6855.8069.6974.7972.1676.2581.8184.14
BEN1B33.5340.1853.0760.3656.9562.6872.5773.37
BEN1C51.8155.5967.6172.6369.8373.8782.4084.69
BEN2A49.7852.8954.1361.3869.8573.4284.9986.00
BEN2B30.8037.4466.8171.6152.2358.1375.0974.16
BEN2C35.0334.1851.7455.2357.3659.6260.1762.38
BEN3A76.0981.2784.2788.2085.0988.4685.0284.4791.9090.41
BEN3B25.4633.2731.9342.8633.7742.4776.8978.7386.5784.61
BEN3C27.8930.7938.9245.5144.7549.0572.5674.1188.7376.77
Table 6. Ce and Eu anomalies of all the samples and granulometric fractions.
Whole Rock<63 µm<38 µm<2 µm
Ce/Ce*Eu/Eu*Ce/Ce*Eu/Eu*Ce/Ce*Eu/Eu*Ce/Ce*Eu/Eu*
BEN1A1.010.811.110.741.190.821.130.79
BEN1B1.040.791.300.711.430.812.270.76
BEN1C1.240.781.600.811.590.831.870.74
BEN2A0.930.780.420.711.140.841.460.76
BEN2B0.310.721.070.780.400.710.770.68
BEN2C1.120.801.240.871.440.842.550.75
BEN3A1.050.811.140.801.140.881.050.75
BEN3B0.330.770.360.700.490.701.850.72
BEN3C0.930.771.040.811.180.881.800.70
Disclaimer/Publisher’s Note: The statements, opinions and data contained in all publications are solely those of the individual author(s) and contributor(s) and not of MDPI and/or the editor(s). MDPI and/or the editor(s) disclaim responsibility for any injury to people or property resulting from any ideas, methods, instructions or products referred to in the content.