Abstract
Colloidal silica acts as a multifunctional reagent in the froth flotation process of semi-soluble salt-type minerals, enabling the selective depression of calcite. This study investigates its effect on four key minerals—calcite, scheelite, apatite, and fluorite—using a comprehensive suite of techniques to identify the flotation subprocesses modulated by colloidal silica. This work also aims to determine the specific flotation zones affected by colloidal silica, assessing the influence of its dosage, surface modification, and specific surface area on metallurgical outcomes. Atomic force microscopy revealed mineral-specific surface responses to colloidal silica conditioning: calcite exhibited localized nanoparticle adsorption, whereas apatite underwent a dissolution–reprecipitation mechanism. Scheelite and fluorite, in contrast, showed minimal surface modifications. These differences are attributed to variations in surface reactivity, hydration behavior, and crystallographic structure, with calcite offering a uniquely favorable environment for colloidal silica attachment. Mechanistic insights show that colloidal silica—especially the aluminate-modified type with high specific surface area—influences both the pulp and froth zones by producing small, stable bubbles, enhancing fine scheelite recovery, stabilizing froth, and effectively depressing calcite. In contrast, non-functionalized colloidal silica resulted in poor bubble control and unstable froth. These findings elucidate the subprocess-specific mechanisms by which colloidal silica operates and highlight its potential as a tunable, multifunctional reagent for improving selectivity in the flotation of semi-soluble salt-type minerals.
1. Introduction
Flotation is a surface- and interface-governed separation technique that exploits differences in mineral hydrophobicity, typically modified by chemical reagents [1,2]. Hydrophobic particles attach to air bubbles and rise to the surface, where they accumulate in the froth phase, while hydrophilic particles remain in the pulp and are removed as tailings [2]. The overall efficiency of flotation is governed by a series of interrelated subprocesses, including particle–bubble collisions, attachment efficiency, aggregate stability, and froth transport [2]. In the froth phase, key mechanisms such as bubble coalescence, liquid drainage, and froth collapse strongly influence separation performance. Coalescence increases bubble size and reduces the surface area available for attached particles, while drainage thins the liquid films between bubbles. Maintaining froth stability is therefore essential to ensure both selectivity and recovery [3]. As mineral systems become finer and more complex, achieving this balance requires reagent strategies capable of simultaneously manipulating surface interactions in the pulp and froth dynamics.
Froth flotation is widely applied for the beneficiation of semi-soluble salt type minerals (SSSMs), including fluorite (), scheelite (), calcite (), and apatite [4,5,6,7]. These minerals occupy an intermediate position between fully soluble salts and sparingly soluble oxides or sulfides in terms of solubility and surface reactivity [8]. Their flotation behavior is governed not only by surface hydrophobicity but also by complex interfacial processes such as surface dissolution, re-precipitation, and competitive adsorption of ions and reagents [7,9,10]. Owing to shared cationic constituents (e.g., ), these minerals often exhibit similar surface chemistries, which complicates their selective separation. The widespread industrial applications of these minerals necessitate efficient separation strategies. However, achieving selectivity among these chemically similar phases continues to pose a major challenge [7]. Scheelite is the primary source of tungsten, a critical element in hard metals and high-temperature alloys [5,11]. Apatite serves as the main phosphate mineral for fertilizer production, with direct implications for global agriculture and food security [12]. Fluorite is essential in the production of hydrofluoric acid and finds widespread use in aluminum smelting, etching silicon wafers, ceramics, and glassmaking [13]. While typically regarded as a gangue phase, calcite is itself a valuable commodity, widely used in the paper, plastics, paints, and construction industries [14]. Their overlapping floatability, particularly in fine-grained or complex ores, often renders conventional reagent schemes inadequate. A key objective is the development of selective depressants that can depress calcite flotation without compromising the recovery of valuable minerals such as scheelite, fluorite, and apatite. Recent research has increasingly focused on advanced reagents and process strategies to address these limitations.
Among recent advances, nanoparticles have emerged as a promising class of flotation reagents [15]. Multiple studies have demonstrated their ability to either enhance hydrophobicity or selectively depress specific minerals. For example, polystyrene nanoparticles have been shown to improve the recovery of model glass beads at low surface coverage [16] and to increase combustible recovery in high-ash coal fines while preserving product quality [17]. Naturally hydrophobic talc nanoparticles have been used to enhance quartz flotation, enabling high recoveries with significantly reduced collector dosages [18]. Functionalized vinylimidazole nanoparticles have also demonstrated mineral selectivity, particularly for pentlandite in ultramafic nickel ores [19].
Colloidal silica was introduced in 2020 as a novel nanoparticle-based depressant for calcite in scheelite flotation [20]. Subsequent studies confirmed its technical feasibility through microflotation and batch-scale flotation experiments [21]. It has been demonstrated that the dosage of colloidal silica, its specific surface area (SSA), and surface functionalization all critically influence flotation performance. Under optimized conditions of dosage and pH, colloidal silica selectively depressed calcite without impairing the recovery of scheelite, fluorite, or apatite. Batch flotation tests, particularly with high-SSA aluminate-modified colloidal silica, have shown improved scheelite–calcite selectivity. Mechanistic observations further indicate that the non-functionalized colloidal silica tends to coagulate, promoting bubble coalescence and froth instability, whereas aluminate-modified colloidal silica forms gel-like interfacial networks that suppress bubble coalescence producing fine bubbles and a stable froth. These stability and aggregation behaviors are supported by previously reported zeta potential measurements [21]. Silane-modified colloidal silica exhibited relatively weaker surface charges (−20 mV to −25 mV at pH 8–10) but achieved moderate colloidal stability through steric hindrance provided by the silane layer, which effectively hindered aggregation. Non-functionalized colloidal silica showed similar zeta potential values but lacked steric stabilization, resulting in pronounced coagulation under flotation conditions. In contrast, aluminate-modified colloidal silica maintained a strong negative surface charge (−50 mV to −60 mV) across the same pH range, which ensured high dispersion stability and promoted the formation of cohesive, gel-like interfacial structures in the presence of dissolved multivalent cations.
The working hypothesis arising from these observations is that colloidal silica exerts its effect not only via mineral surface interactions, hypothesized to be due to the high surface roughness of calcite, but also through modification of froth properties, likely driven by differences in nanoparticle stability and aggregation.
Supported by design of experiments (DoE) and numerical optimization, the usage of colloidal silica as calcite depressant has also been optimized and scaled up to industrial scale [22].
The present study advances these applications by shifting from empirical optimization to fundamental mechanistic investigation. Our objective is to elucidate the mechanisms by which colloidal silica modulates the flotation process, identifying the specific subprocesses involved in both the pulp and froth zones, clarifying how these are affected by key parameters, and providing a comprehensive understanding of how colloidal silica controls mineral selectivity and flotation efficiency at both interfacial and macroscopic levels.
2. Materials and Methods
2.1. Reagents
Sodium oleate (NaOl, , purity 90%) from Carl Roth was used as collector. Hydrochloric acid () and sodium hydroxide (), also obtained from Carl Roth GmbH (Karlsruhe, Germany), were employed as pH modifiers. The frother used was 4-methyl-2-pentanol (methyl isobutyl carbinol, ), supplied by Alfa Aesar GmbH & Co. KG (Karlsruhe, Germany). Seven types of Levasil® colloidal silica (CS) from Nouryon® (Göteborg, Sweden) were tested, differing in surface functionalization and specific surface area (SSA)/particle size characteristics. All reagents were at least of technical grade and used as received. Detailed properties of the colloidal silica variants are provided in Table 1.

Table 1.
Summary of colloidal silica dispersions and their specifications.
2.2. Atomic Force Microscopy (AFM)
Atomic force microscopy was employed to characterize the surface roughness of calcite, scheelite, apatite, and fluorite, and to evaluate surface modifications induced by colloidal silica treatment. All measurements were conducted using a Park Systems NX12 AFM (Park Systems Corp., Suwon, Republic of Korea) under ambient laboratory conditions.
Measurements were performed on mineral sample mounts, which were prepared by polishing with diamond suspensions down to 1 µm particle size, followed by rinsing with deionized water and ethanol, and subsequent drying in air. AFM measurements were performed in non-contact mode using standard NCHR cantilevers from NanoAndMore GmbH (Wetzlar, Germany) with a nominal resonance frequency of 330 kHz and a nominal spring constant of 0.42 N/m. Topographic scans were acquired at a scan size of 10 µm × 10 µm with a resolution of 512 × 512 pixels.
Before imaging, the polished mineral specimens were conditioned at selected pH values (2, 4, 6, 8, and 10) for 5 min under gentle stirring. After pH conditioning, samples were rinsed with milli-Q water and air-dried before analysis.
A second set of samples was treated with colloidal silica—specifically Al_CS_500 and Al_CS_1100—at the same pH values for 5 min after pH conditioning. The samples were then rinsed and air-dried before AFM analysis. Height and phase images were collected to evaluate localized surface alterations.
Image processing and roughness analysis were carried out using the Park Systems XEI software (version 4.3.4). Quantitative surface roughness parameters [23] included:
- (arithmetic mean height): average of the absolute deviations from the mean plane; commonly used to describe general surface texture.
- (root mean square roughness): standard deviation of surface heights; reflects variability in topography.
- (maximum height difference): vertical distance between the highest peak and lowest valley within the scan area.
- (Skewness): quantifies the asymmetry of the surface height distribution. Positive values indicate surfaces dominated by peaks, while negative values reflect valley-dominated topographies.
- (Kurtosis): describes the sharpness of the surface height distribution. Values greater than 3 suggest the presence of sharp features or outliers; values smaller than 3 indicate a flatter, plateau-like surface.
For each mineral and treatment condition, at least three regions of interest were analyzed to ensure statistical robustness and reproducibility
2.3. Microflotation
Microflotation tests were conducted to investigate the influence of colloidal silica on mineral flotation performance, with each test series tailored to specific objectives. The procedures were adapted accordingly to evaluate the following:
- (i)
- the effect of CS dosage, modification, and specific surface area on the recovery of calcite
- (ii)
- and the effect of CS dosage and modification on the recovery of scheelite, apatite, and fluorite, using CS variants with a fixed SSA of 500 m2/g.
All microflotation tests were performed using 1 g of mineral sample suspended in 160 mL of solution.
Table 2
summarizes the minerals used in microflotation, including origin, purity, and size fraction.
Table 2.
Minerals used in microflotation, settling velocities calculated following Stoke’s law for the middle size of the fraction.
Conditioning was carried out under magnetic stirring at 400 min−1 using a 1 cm stir bar. The conditioning procedure was identical for all minerals: the suspension was first conditioned at pH 8 for 5 min, followed by the addition of CS and further conditioning for 3 min. Sodium oleate was then added as a collector at a concentration of mol/L, and the suspension was conditioned for an additional 3 min. The conditioning scheme is illustrated in Figure 1.
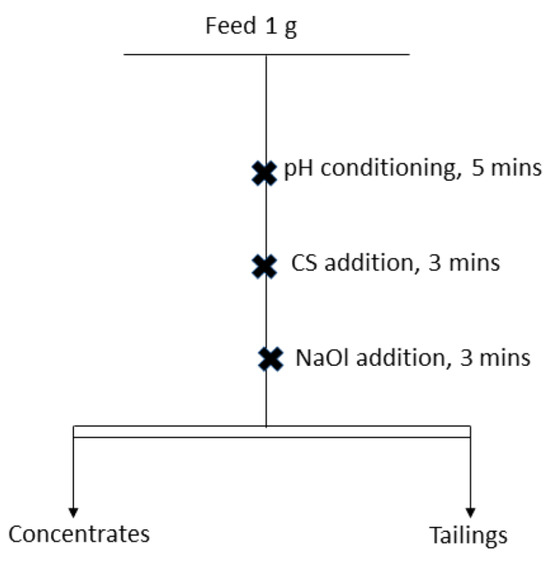
Figure 1.
Conditioning scheme of microflotation tests of calcite, scheelite, apatite, and fluorite at pH 8.
Following conditioning, the pulp was transferred to a Hallimond tube, and microflotation was conducted for 2 min using an air flow rate of 20 cm3/min and agitation at 800 rpm. The floated product was collected on pre-weighed filter paper, dried overnight at 60 °C, and subsequently weighed to determine mineral recovery. Each test was performed at least in triplicate to ensure reproducibility.
2.4. Batch Flotation Procedure
Batch flotation experiments, used for the SOPAT measurements (Section 2.5) and MLA analysis (Section 2.6), were carried out using a 1.5 L Magotteaux® bottom-driven flotation cell (Magotteaux International S.A., Chaudfontaine, Belgium). A 500 g sample of low-grade scheelite ore, containing 0.5% (m/m) scheelite and 1.1% (m/m) calcite, was used. The main gangue minerals—hornblende, plagioclase, and quartz—collectively accounted for 77.5% (m/m) of the ore as illustrated in Figure 2.
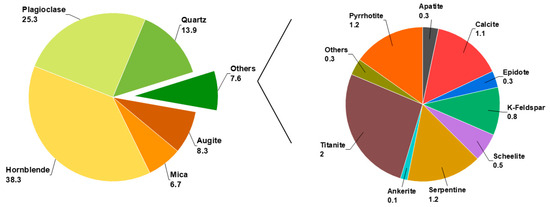
Figure 2.
Mineralogical composition of the ore in % (w/w) obtained by mineral liberation analyzer (MLA) and validated by X-ray diffraction (XRD) [21].
The sample was first ground in a laboratory rod mill (MTI Corporation, Richmond, CA, USA) equipped with a stainless steel chamber (140 mm internal diameter, 240 mm internal length) and 10 stainless steel rods (24 mm diameter, 238 mm length) in 300 g of tap water to reactivate particle surfaces before flotation. Tap water was selected for all experiments to provide controlled yet industrially relevant conditions, ensuring reproducibility and practical applicability. Based on official water quality reports [24,25], the tap water is classified as soft to moderately soft, with a total hardness ranging from 3.8 to 4.2 °dH, indicating a low-to-moderate ionic strength. Grinding was performed for 3 min at 96 rpm, corresponding to 79% of the critical speed. The slurry, with approximately 33% (m/m) solids, was transferred to the flotation cell and agitated at 450 min−1 (rotor tip velocity = 3.30 m/s). After pH adjustment using 0.1 M or , the pulp was conditioned for 5 min. Flotation reagents were then added sequentially: CS as depressant, as a collector, and finally as a frother. Each reagent addition was followed by a 3 min conditioning interval. Air was introduced at a constant flow rate of 5 L/min. Time-resolved concentrate fractions were collected after 1, 3, and 7 min of flotation.
2.5. In Situ Bubble Size Measurements (SOPAT)
In situ bubble size distributions close to the pulp–froth interface during flotation were characterized using the Smart Online Particle Analysis Technology (SOPAT) system, developed by SOPAT GmbH (Berlin, Germany). The depressant system included three types of colloidal silica: non-functionalized, silane-modified, and aluminate-modified, each with a specific surface area of 500 m2/g. An additional aluminate-modified CS with an SSA of 1100 m2/g was also tested. All colloidal silica variants were evaluated at two dosages (50 g/t and 550 g/t) and two pH values (8 and 10), as summarized in Table 3.
Table 3.
Experimental parameters for the in situ bubble size measurements.
The SOPAT probe was inserted into the centre of the pulp suspension at an angle of approximately 60° to the vertical axis, in order to minimize wall effects and enable real-time imaging of bubble populations under operating conditions as illustrated in Figure 3. Imaging parameters are summarized in Table 4. Each measurement consisted of 10 triggers capturing 150 frames each, corresponding to ~75 s of image acquisition at 20 fps. Captured frames were analyzed using SOPAT’s proprietary software Result-Analyzer, which automatically detected and processed all bubbles to calculate the Sauter mean diameter (d3,2), distribution width (span3), and other relevant bubble size parameters.
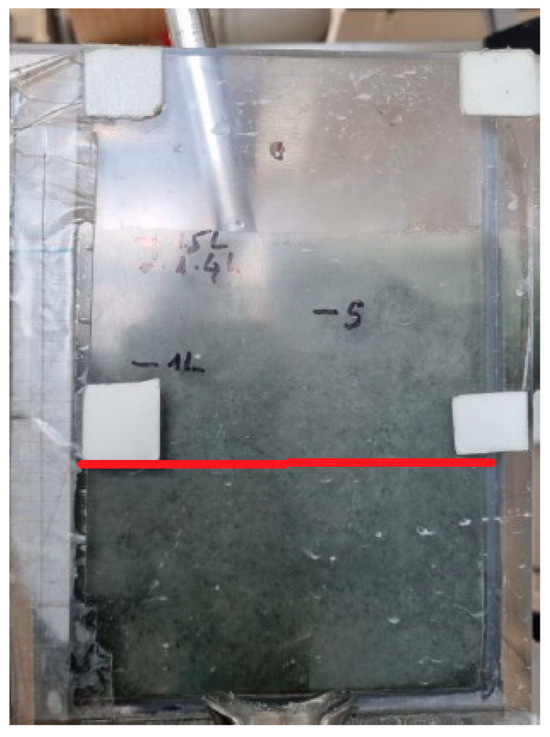
Figure 3.
SOPAT probe positioning during flotation tests in the flotation cell. The red line indicates the position of the probe tip in the pulp phase.
Table 4.
In situ bubble size measurements parameters.
2.6. Mineral Liberation Analyzer and Particle-Based Modeling
Mineralogical analysis was conducted by means of mineral liberation analysis (MLA), a Scanning Electron Microscopy-based imaging technique often referred to as Automated Mineralogy [26]. MLA was used to characterize particle properties, including mineral composition, particle size distribution, and liberation. Samples were collected from the batch flotation tests described in Section 2.4. For each condition, the concentrates collected in duplicate flotation tests were mixed and subsequently riffle-split to obtain representative subsamples of 1–2 g for MLA analysis. The specific flotation parameters used for MLA analysis are summarized in Table 5.
Table 5.
Experimental conditions used in the batch flotation tests from which samples were collected for Mineral Liberation Analyzer (MLA) analysis.
The focus minerals in this study, scheelite and calcite, are structurally and chemically distinct, and thus readily distinguishable by backscattered electron contrast and EDX spectra. The MLA protocol used in this study was validated in previous work [21], confirming accurate identification and quantification of these phases. MLA data were collected in GXMAP mode with a step size time and probe current sufficient to ensure high EDX counts and reliable elemental identification. Image segmentation was not post-processed using deagglomeration or grain-boundary correction tools. To minimize artefacts, a strict sample preparation protocol [27] was followed to avoid particle coating and agglomeration.
The samples were mixed with graphite, embedded in epoxy resin, ground and polished, and carbon-coated with a ≈8 nm conductive layer using a LEICA EM coater (Leica Microsystems Inc., Buffalo Grove, IL, USA). In total, 36 samples were prepared for MLA analysis. Measurements were performed using a FEI Quanta 650 scanning electron microscope (SEM, FEI Company, Hillsboro, OR, USA) equipped with energy-dispersive X-ray spectroscopy (XFlash 5030, Bruker Nano GmbH, Berlin, Germany) detectors and operated via the MLA Suite software (version 3.1.4). The analyses were conducted in grain-based X-ray mapping (GXMAP) mode. The SEM was operated at an accelerating voltage of 25 kV with a probe current of 10 nA. The pixel size was set to 1 µm, and the step size for EDX scanning was 8 µm. Copper was used as the calibration standard.
A particle-based flotation model was trained using MLA data to quantify the recovery and flotation rate constant of individual particles. The modeling approach was based on a particle-level separation framework proposed by Pereira et al. [28], which uses MLA-derived particle descriptors to estimate the recovery probability of individual particles in each of the concentrate fractions. Then, the modeling approach used the classical first-order flotation model to compute the flotation rate constant k of each particle based on their recovery time series. To provide a single parameter that reflects both flotation kinetics and metallurgical performance, the modified rate constant was calculated as the product of the first-order rate constant and the maximum recovery , thus integrating the rate of flotation with the ultimate achievable recovery. MLA data from flotation concentrates and tailings served as the input for model development. The dataset included particle-level attributes such as mineral composition, degree of liberation, aspect ratio, solidity, and equivalent circular diameter (ECD). Among various shape and size descriptors, ECD was selected based on its reproducibility and broad use in MLA-based flotation studies. As demonstrated in Pereira et al. [28], ECD provides a standardized metric that enables consistent relative size comparisons across irregularly shaped particles, which is the main requirement in particle-based flotation modeling. Model training was carried out using a multinomial logistic regression framework with LASSO (Least Absolute Shrinkage and Selection Operator) regularization. This method automatically selects the most informative particle features by penalizing non-contributory variables. The resulting model estimates the probability of recovery for each particle based on its physical and compositional characteristic. An intercept correction was applied post-training to satisfy overall mass balance constraints. Model performance was evaluated by applying the trained model to the feed dataset and comparing predicted versus actual mineral recoveries in the flotation products. Model results were evaluated to understand the recovery behavior of scheelite and calcite particles under specific process parameters. This methodology has already been used to investigate the flotation mechanisms of different SSSM-bearing ores, albeit for variations in comminution properties [29].
2.7. Dynamic Froth Analysis (DFA)
The dynamic froth properties of colloidal silica dispersions were characterized using a Dynamic Foam Analyzer (DFA100; Krüss GmbH, Hamburg, Germany). The instrument measured frothability and froth stability based on reproducible froth generation and froth height detection.
For each measurement, 60 mL of the prepared dispersion was introduced into a prism glass column (height: 240 mm; inner diameter: 40 mm) fitted with a sintered glass frit (0.4 µm porosity) at the base. Compressed air was sparged through the frit at a flow rate of 0.5 L/min to generate froth. A camera, positioned between 120 mm and 160 mm height, recorded the froth development. The foaming time was set to 50 s, and the measurement continued until 140 s. Foaming was automatically stopped once the froth reached 220 mm to prevent overflow.
After each run, the column and all wetted components were cleaned with hot deionized water and isopropanol, then dried before the next experiment to avoid contamination. The experimental design followed a fractional factorial approach (Resolution V) [30], systematically varying key parameters such as colloidal silica type, dosage, and pH, as summarized in Table 6. The selected concentrations of NaOl, MIBC, and colloidal silica were chosen to reflect the reagent dosages used in the previous batch flotation experiments.
Table 6.
Investigated parameters and their levels for dynamic froth analysis.
Froth properties—including froth height, drainage half-time, froth life half-time, and liquid content—were continuously monitored using the DFA’s integrated optical imaging system. The drainage half-time refers to the time required for half of the liquid initially present in the froth to drain, while the froth life half-time is the time required for the froth height to decrease to half of its initial value. Data were recorded over a total measurement duration of 720 s or until complete froth collapse, whichever occurred first.
2.8. Dynamic Surface Tension Measurements
Dynamic surface tension (DST) of colloidal silica dispersions was measured using a Bubble Pressure Tensiometer (BP100, Krüss GmbH, Hamburg, Germany). All measurements were performed using a capillary with an inner diameter of 0.376 mm. The instrument was calibrated before each measurement series using deionized water, assuming a reference surface tension of 72 mN/m at room temperature [31]. Fresh dispersions of 70 mL were prepared immediately before each measurement. Four types of colloidal silica were tested: non-functionalized, silane-modified, and aluminate-modified with a specific surface area of 500 m2/g, as well as aluminate-modified CS with an SSA of 1100 m2/g.
For all tests, the solution was first conditioned at pH 10 for 5 min. Colloidal silica was then added at concentrations of (25, 50, or 100) mg/L and conditioned for an additional 3 min before the measurement. In tests involving , colloidal silica was used only at a fixed concentration of 100 mg/L. After pH and CS conditioning, was added at a final concentration of mol/L.
The prepared solution was then introduced into the measurement vessel. The instrument generated air bubbles at varying frequencies, resulting in surface ages ranging from 10 ms to 25,000 ms. Surface tension was recorded automatically as a function of surface age, enabling the assessment of interfacial adsorption kinetics under dynamic conditions.
3. Results
3.1. AFM Characterization
Atomic force microscopy (AFM) was used to assess the surface topography and roughness of fluorite, scheelite, apatite, and calcite after pH conditioning (pH 2–10), both in the absence and after exposure to colloidal silica. Qualitative features from height and phase contrast images, along with quantitative roughness parameters, were analyzed to evaluate mineral-specific surface responses to pH variation and CS treatment.
The surface roughness parameters , , and are presented in Figure 4, while Ssk and Sku are shown in Figure 5 for calcite, scheelite, apatite, and fluorite as a function of pH, both before colloidal silica treatment (No CS) and after exposure to Al_CS_500 and Al_CS_1100. For improved comparability, part (a) displays data for calcite, fluorite, and scheelite, whereas part (b) focuses on calcite and apatite.
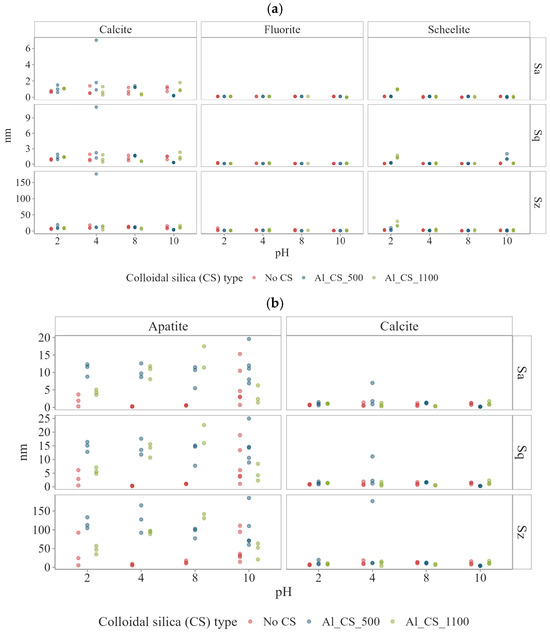
Figure 4.
Surface roughness parameters , , and of (a) calcite, fluorite, and scheelite and (b) apatite and calcite as a function of pH, both before colloidal silica treatment (No CS) and after exposure to Al_CS_500 and Al_CS_1100. Before CS treatment: Fluorite and scheelite remained smooth ( < 0.1–0.2; ≤ 3–4 nm). Calcite showed moderate roughness ( 0.9 nm to 1.6 nm; 6 nm to 21 nm). Apatite was rougher, with up to 5 nm and 34 nm at extreme pH. After CS treatment: Fluorite and scheelite remained largely unchanged, except scheelite at pH 2 with Al_CS_1100 (~1.3 nm; ~16 nm). Calcite showed slight variations ( 0.5 nm to 1.6 nm; 7 nm to 11 nm). Apatite roughness increased strongly, up to 19 nm for and 136 nm for .
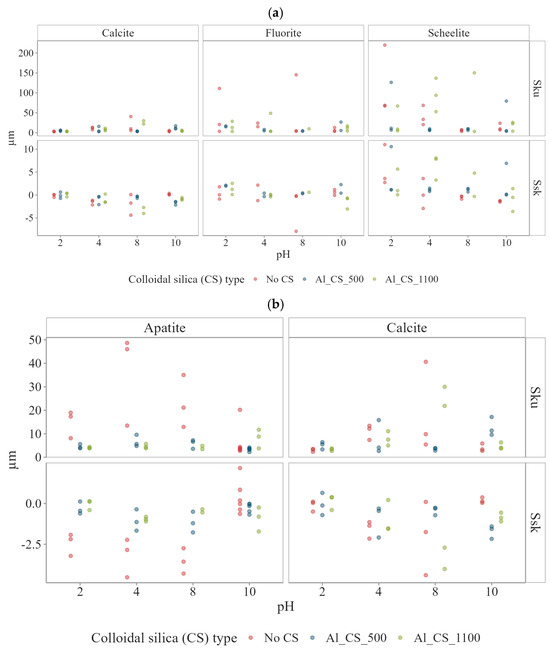
Figure 5.
Surface roughness parameters Ssk and Sku of (a) calcite, fluorite, and scheelite and (b) apatite, and calcite as a function of pH, both before C treatment (No CS) and after exposure to Al_CS_500 and Al_CS_1100. Before CS treatment: Fluorite and scheelite smooth at high pH (Sku~5–6) but sharper at low pH (Sku up to ~89, ~69). Calcite near-symmetric to valley-dominated at mid pH (Ssk~−1.5; Sku~9). Apatite strongly valley-dominated (Ssk −2 to −4; Sku 17–35). After CS treatment: Fluorite and scheelite showed no significant change. Calcite more symmetric with Al_CS_500 (Ssk~−0.3; Sku~4) but strongly valley-dominated with Al_CS_1100 (Ssk~−3.4; Sku~26). Apatite slightly peak-dominated with Al_CS_1100 at high pH (Ssk~0.8; Sku~4).
3.1.1. Baseline Surface Topography and Roughness Before Colloidal Silica Treatment
Fluorite had low surface roughness under all pH conditions (Figure 4a). Localized sharp features and minor heterogeneity were observed between pH 2 and 6, reflected in high median Sku values between 10.92 and 89.42 (Figure 5a), indicating the presence of narrow surface structures. In contrast, a lower Sku value of around 4.80 was observed at a pH between 8 and 10, suggesting a smoother, less textured surface. At pH 8, the height and phase images (Figure A1a, Appendix A) were smooth and uniform, with no indication of etching or strong contrast variation. This visual homogeneity is supported by the reduced Sku value, while the slightly positive asymmetry (Ssk = 0.59) indicates a slightly peak-dominated profile, suggesting the presence of narrow features not visible in the AFM images.
Scheelite, as fluorite, maintained a smooth surface profile at all pH values (Figure 4a). Notably, at pH 2–4, the surface displayed sharp cutting features, as indicated by high median Sku values between 33.49 and 68.81 (Figure 5a). With increasing pH, this trend was attenuated, with the median Sku falling to 9.76 at pH 10, indicating a reduction in feature sharpness. At pH 8, AFM imaging (Figure A1b, Appendix A) revealed a smooth surface in both height and phase contrast images, with no significant heterogeneities. This apparent homogeneity corresponds to the low value, while the roughness parameters (Ssk = 0.37; Sku = 6.37) indicate a slightly peak-dominated surface with narrow features that are statistically detectable but not visually dominant.
On the other hand, calcite exhibits higher surface roughness than fluorite and scheelite at all pH values investigated (Figure 4a). Morphologically, the calcite has evolved from a surface profile statistically close to symmetry at pH 2 (Ssk = 0.033; Sku = 3.38), to a sharper, strongly valley-dominated surface at pH 6 (Ssk = −1.54; Sku = 8.60), and finally to a broader, slightly peak-dominated texture at pH 10 (Ssk = 0.12; Sku = 3.36) (Figure 5a). These transitions are clearly reflected in the AFM height and phase images (Figure A2, Appendix A).
Over the entire pH range, apatite surfaces were consistently rougher than those of scheelite and fluorite. Compared with calcite, roughness values at intermediate pH were similar, while roughness peaked at pH 2 and 10 (Figure 4b). AFM height and phase images (Figure A3, Appendix A) revealed deeply textured and irregular surfaces at extreme pH values and smoother morphologies at near-neutral conditions. Morphologically, apatite evolved from a strongly valley-dominated surface at pH 2 (Ssk = −2.18; Sku = 17.36) to an even more valley-dominated profile at pH 6 (Ssk = −3.74; Sku = 34.53) before shifting to a peak-dominated profile (Ssk = 0.83; Sku = 3.66) at pH 10.
3.1.2. Surface Topography and Roughness After Colloidal Silica Treatment
Fluorite showed low surface roughness under all conditions tested after treatment with Al-modified colloidal silica (Figure 4a). After exposure to Al_CS_500 or Al_CS_1100 at all pH levels, roughness parameters remained comparable to those observed in the absence of colloidal silica. Surface features remained shallow and uniformly distributed over the scanned area. In terms of surface morphology, Ssk and Sku values were also comparable to those measured in the absence of colloidal silica, indicating that there was no change in surface symmetry or feature sharpness (Figure 5a). This is illustrated in Figure 6a, where the AFM height and phase contrast images of fluorite at pH 8 treated with Al_CS_1100 show a smooth surface with low-relief structuring and minimal lateral contrast.
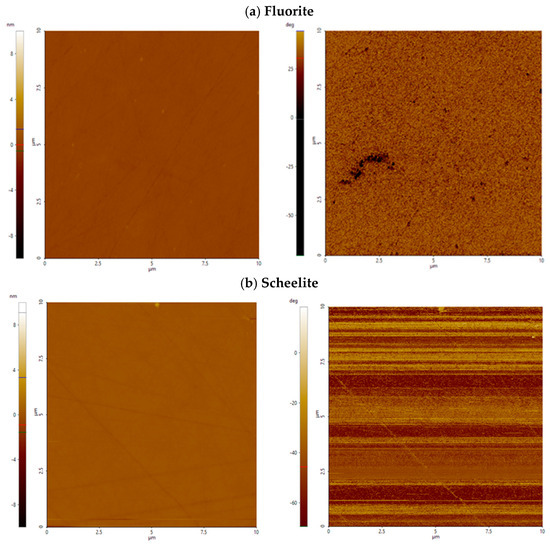
Figure 6.
AFM height (left) and phase contrast (right) images of fluorite (a) and scheelite (b) treated with Al_CS_1100 at pH 8. The scanned area is 10 µm × 10 µm; height is expressed in nanometers (nm), and phase contrast is labeled in deg (°).
Similar to fluorite, scheelite showed minimal surface modification after treatment with Al-modified colloidal silica. After exposure to Al_CS_500 and Al_CS_1100 from pH 4 to 10, roughness parameters remained comparable to the untreated condition (Figure 4a and Figure 5a). A moderate increase in surface roughness was only observed at pH 2 after treatment with Al_CS_1100 (median = 1.3 nm; median = 16.2 nm). Height and phase contrast images at pH 8 after treatment with Al_CS_1100 are shown in Figure 6b and display gentle surface modulation and weak lateral contrast, consistent with the overall observation of limited morphological change under these conditions.
Across the examined pH range, neither Al_CS_500 nor Al_CS_1100 induced a significant increase in overall calcite surface roughness (Figure 4b). The median and values remained comparable to the untreated surfaces at most pH levels. Instead, both treatments primarily affected the shape descriptors Ssk and Sku, indicating distinct changes in surface morphology (Figure 5b).
At pH 8, untreated surface shows a valley-dominated profile, with a median Ssk of around −1.75 and Sku of 9.85, as well as moderate roughness ( = 1.1 nm, = 12.8 nm). Treatment with Al_CS_500 shifts the surface to a nearly symmetrical height distribution (Ssk = −0.31; Sku = 3.76), slightly increasing to 1.6 nm while reducing to 10.8 nm. In contrast, Al_CS_1100 enhances valley asymmetry (Ssk = −3.36) and strongly increases kurtosis (Sku = 25.94) but reduces overall height ( = 0.55 nm; = 7.45 nm).
These statistical differences are clearly reflected in AFM height and phase-contrast images at pH 8 (Figure 7), with Al_CS_500 producing gently undulating surfaces with finely flecked phase contrast, suggesting uniform but slight morphological restructuring. Al_CS_1100, on the other hand, produces an almost flat topography punctuated by a few deep and features strongly anisotropic diagonal phase domains, indicative of localized interacting zones. Overall, although roughness parameters remain low, both treatments significantly modify surface morphology.
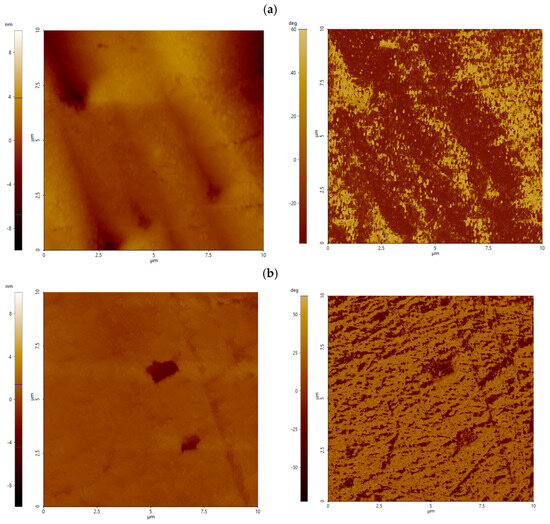
Figure 7.
AFM height and phase contrast image of calcite treated with Al_CS_500 (a) and Al_CS_1100 (b) at pH 8. The scanned area is 10 µm × 10 µm; height is expressed in nanometers (nm), and phase contrast is labeled in deg (°).
For apatite, across the entire pH range, colloidal silica treatment significantly increases surface roughness compared to the untreated surfaces, with aluminate-modified CS amplifying vertical relief by more than an order of magnitude (Figure 4b). Surfaces treated with Al_CS_500 show median values of 13.5–15.1 nm (vs. 0.3–1.1 nm without CS) and values of around 99–113 nm (vs. 5–13 nm without CS). Surfaces treated with Al_CS_1100 also show high roughness, with median values ranging from 4.2 to 19.3 nm and from 52 to 136 nm. Despite these comparable amplitude increases, the two treatments produce distinct surface morphologies (Figure 5b). As shown in Figure 8a, Al_CS_500 produces a moderately valley-dominated texture (median Ssk = −1.21; Sku = 6.64), characterized by broad, rounded peaks and troughs. In contrast, Al_CS_1100 (Figure 8b) produces a more symmetrical height distribution (median Ssk = −0.45; Sku = 4.15), forming an area composed of broad peaks and shallow valleys. Thus, while both treatments significantly improve vertical relief, Al_CS_500 retains a tendency toward deeper valleys, while Al_CS_1100 produces a more symmetrical topography.
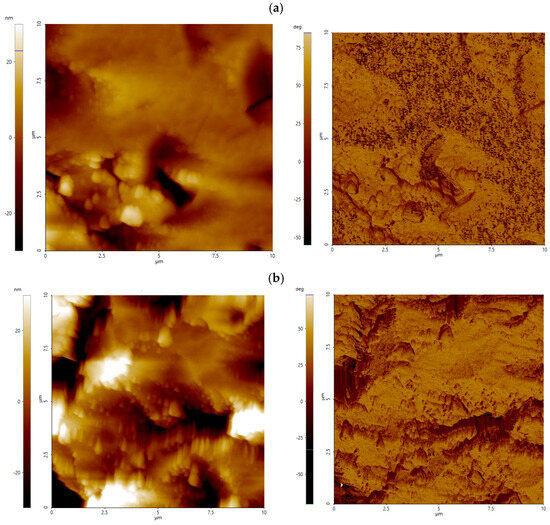
Figure 8.
AFM height (left) and phase contrast (right) images of apatite treated with Al_CS_500 (a) and Al_CS_1100 (b) at pH 8. The scanned area is 10 µm × 10 µm; height is expressed in nanometers (nm), and phase contrast is labeled in deg (°).
A comparison between calcite and apatite at pH 8 shows that CS treatment only modifies the surface morphology of calcite, leaving the overall roughness almost unchanged, while in the case of apatite it amplifies both roughness and morphology. Calcite shifts from smooth to either gently undulating or sharply pitted surfaces, depending on CS type, while apatite develops a coarse and heterogeneous texture with pronounced vertical and lateral variations under both treatments.
3.2. Microflotation
Figure 9 illustrates the direct relationship between the SSA of colloidal silica and the depression of calcite. An increase in SSA resulted in a clear decrease in calcite recovery across all three CS types. Among them, S_CS_500 and Al_CS_1100 showed the strongest depressive effects.
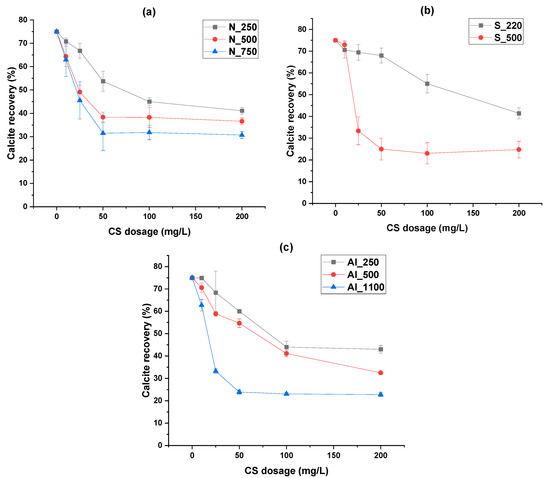
Figure 9.
Single-mineral flotation recoveries of calcite depending on colloidal silica dosage for (a) non-functionalized, (b) silane-, and (c) aluminate-modified colloidal silica (at pH = 8, collector = M sodium oleate) [21].
In contrast, microflotation tests conducted on scheelite, apatite, and fluorite (Figure 10) showed that CS treatment did not result in significant depression, regardless of CS type. For N_CS_500, S_CS_500, and Al_CS_500, recoveries for all three minerals remained consistent across all tested dosages. These results indicate limited interaction between CS and the surfaces of scheelite, apatite, and fluorite under the conditions studied.
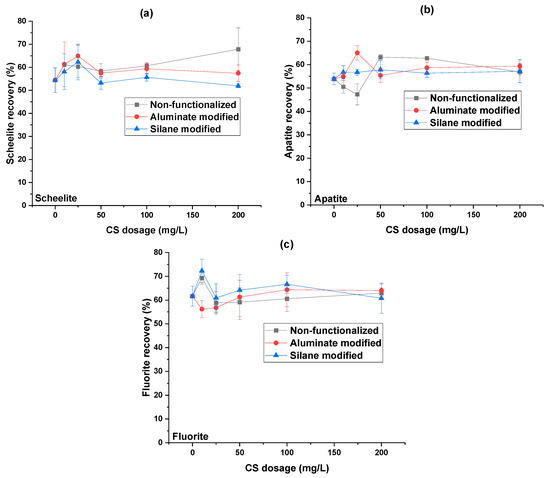
Figure 10.
Single-mineral flotation recoveries of (a) scheelite, (b) apatite, and (c) fluorite depending on colloidal silica dosage (at pH = 8, collector = M sodium oleate, specific surface area 500 m2/g) [21].
An interesting trend was observed for scheelite, apatite, and fluorite at low CS dosages (10 mg/L and 25 mg/L). Depending on the mineral and CS type, the flotation recovery either increased or decreased at these low dosages, but then showed an unexpected reversal at 50 mg/L; recovery decreased for some systems and increased for others, before increasing or stabilizing again at higher dosages. This behavior was consistently reproduced across replicate tests, indicating that it is not due to experimental variability.
3.3. In-Situ Bubble Size Measurements (SOPAT)
The influence of colloidal silica type, specific surface area, pH, and dosage on in situ bubble size was evaluated using SOPAT imaging during a batch flotation experiment.
Figure 11 shows the measured Sauter mean diameters and the distribution widths under all tested conditions.
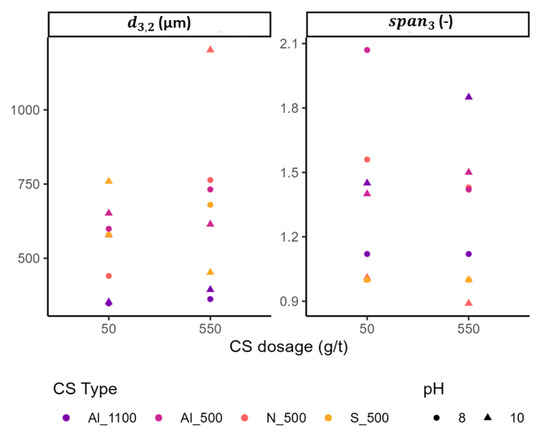
Figure 11.
Sauter mean bubble diameters (left) and distribution widths (span3) (right) measured in the pulp using SOPAT imaging under varying colloidal silica type, specific surface area (SSA), dosage, and pH.
For N_CS_500, bubble sizes increased significantly with increasing depressant dosage, particularly at pH 10. At pH 8, rose from 440 µm at 50 g/t to 763 µm at 550 g/t, accompanied by a slight narrowing of the size distribution ( decreasing from 1.56 to 1.43). At pH 10, pronounced bubble coarsening was observed, with increasing from 578 µm to 1202 µm and decreasing from 1.01 to 0.89.
S_CS_500 produced smaller and more stable bubble sizes across all conditions. At pH 8, increased moderately from 579 µm to 680 µm as dosage increased, while remained constant at 1.00. In contrast, at pH 10, increasing the dosage resulted in a decrease in bubble size from 759 µm to 452 µm, with the distribution width again remaining stable.
Al_CS_500 generated bubbles smaller than those formed with the non-functionalized variant. At pH 8, increased from 599 µm to 732 µm, while decreased from 2.07 to 1.42. At pH 10, remained relatively stable (from 651 µm to 614 µm) as dosage increased, with values of 1.4 and 1.5, respectively.
The smallest bubbles overall were obtained with Al_CS_1100. At pH 8, was 348 µm at 50 g/t and 362 µm at 550 g/t, with a constant of 1.12. At pH 10, ranged from 352 µm to 394 µm, while increased slightly from 1.45 to 1.85, indicating a moderate broadening of the bubble size distribution.
3.4. MLA Measurements and Particle-Based Kinetic Flotation Model
The total recovery and the flotation rate constants and as a function of particle size (ECD) are shown in Figure 12 for scheelite and calcite under five reagent conditions: N_CS_500, S_CS_500, Al_CS_500, Al_CS_1100, and a blank condition without colloidal silica (none). Each treatment was tested at two dosages: 50 and 550 g/t.
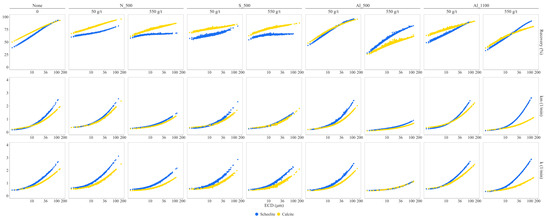
Figure 12.
Total recovery, flotation rate constant (k), and modified flotation rate constant (kₘ) as a function of particle size (equivalent circular diameter, ECD) for scheelite and calcite under different CS treatments. Results are presented for non-functionalized, silane-modified, and aluminate-modified CS with specific surface areas of 500 and 1100 m2/g, each tested at two dosages 50 and 550 g/t.
For particles smaller than 36 µm, recovery of both minerals is higher with non-functionalized and silane-modified CS than with aluminate-modified CS at a CS dosage of 550 g/t. Calcite recovery decreases with increasing dosage of aluminate-modified CS, particularly for SSA 500 m2/g. In contrast, silane- and non-functionalized CS result in only minor differences in calcite recovery between dosages.
The kinetics of scheelite under non-functionalized and silane-modified CS remain below those of the blank at a CS dosage of 550 g/t. In contrast, both Al_CS_500 at 50 g/t and AL_CS_1100 at both dosages render scheelite performance comparable to the blank. For calcite, non-functionalized and silane-modified CS show minimal deviation from blank behavior, while aluminate-modified CS at a dosage of 550 g/t consistently depress calcite recovery and flotation rate.
The highest kₘ values were observed for scheelite treated with Al_CS_1100 at 550 g/t. For calcite, flotation rates overlapped with scheelite under non-functionalized and silane-modified CS, especially in the fine particle range, indicating low kinetic selectivity.
Under aluminate-modified CS, calcite flotation rates remained consistently lower than those of scheelite. This trend was most pronounced at 550 g/t for both SSA 500 and 1100 m2/g, where calcite kₘ values plateaued or only slightly increased above 60 µm. This behavior led to a particle-size-dependent separation between scheelite and calcite under Al_CS_1100, with the kₘ gap widening above 36 µm, demonstrating enhanced kinetic selectivity. In contrast, blank tests, to a lesser extent, and treatments with non-functionalized and silane-modified CS lacked consistent differentiation between the minerals, reducing selectivity.
3.5. Dynamic Froth Analysis
The effects of the investigated parameters (Section 2.7, Table 6) on the dynamic froth properties of colloidal silica-containing suspensions, in comparison to blank tests, are presented in Figure 13, where the bars represent the main effects of single variables on the studied responses.
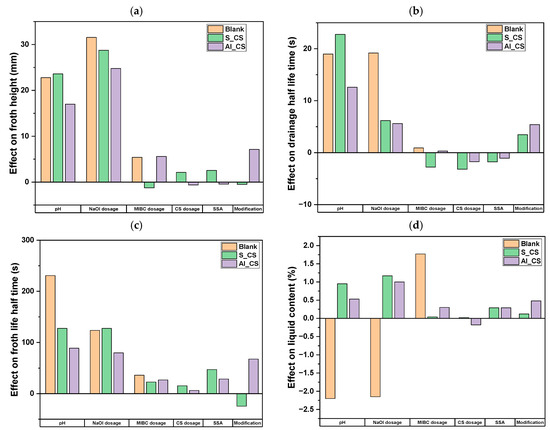
Figure 13.
Standardized effects of pH, NaOl dosage, MIBC dosage, CS dosage, SSA, and CS modification on dynamic foam properties: foam height (a), drainage half-time (b), froth life half-time (c), and liquid content (d).
In terms of froth height (Figure 13a), the impact of CS dosage varied depending on the surface modification. For silane-modified CS, increasing the dosage led to a moderate increase in froth height, indicating enhanced froth formation. In contrast, for aluminate-modified CS, higher dosage reduced froth height, suggesting an inhibitory effect. The influence of CS modification itself was minimal in the silane case but moderately positive for the aluminate-modified CS, resulting in increased froth formation relative to silane-modified CS.
The effects of colloidal silica on drainage half-time and froth life half-time exhibited contrasting trends, underscoring the complexity of froth stabilization mechanisms. For the drainage half-time (Figure 13b), increasing CS dosage and SSA led to faster liquid drainage—indicating a destabilizing effect—while surface modification itself had a stabilizing influence. In contrast, for froth life half-time (Figure 13c), both CS dosage and SSA contributed positively to froth stability in both systems. Notably, the impact of surface modification diverged: it slightly reduced froth lifetime in the silane-modified CS but enhanced it under aluminate modification.
For liquid content (Figure 13d), overall effects were relatively minor. CS dosage had a slight positive effect under silane-modified CS and a small negative effect under aluminate-modified CS. The influence of CS modification and SSA on liquid content was limited in both systems but the modification effect was more pronounced for aluminate-modified CS where it modestly enhanced liquid retention.
Additional parameters such as pH and dosage showed broadly positive effects across most froth metrics, contributing to improved froth formation and stability. In contrast, dosage rendered inconsistent trends under the tested conditions.
3.6. Dynamic Surface Tension Measurements
The results of the dynamic surface tension measurements are presented in Figure 14 and Figure 15, showing surface tension as a function of surface age for different colloidal silica types and dosages, all tested at pH 10.
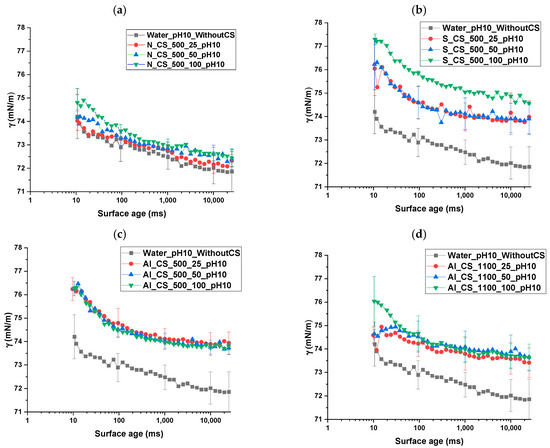
Figure 14.
Dynamic surface tension as a function of surface age for water and different colloidal silica (CS) types and dosages, without sodium oleate (NaOl), measured at pH 10 for (a) N_CS_500, (b) S_CS_500, (c) Al_CS_500, and (d) Al_CS_1100. Legend nomenclature: Water_pH10_WithoutCS = water at pH 10 without CS; Al_CS_1100_25_pH10 = aluminate-modified CS (SSA = 1100 m2/g) at 25 mg/L; Al_CS_1100_50_pH10 = aluminate-modified CS (SSA = 1100 m2/g) at 50 mg/L; Al_CS_1100_100_pH10 = aluminate-modified CS (SSA = 1100 m2/g) at 100 mg/L.
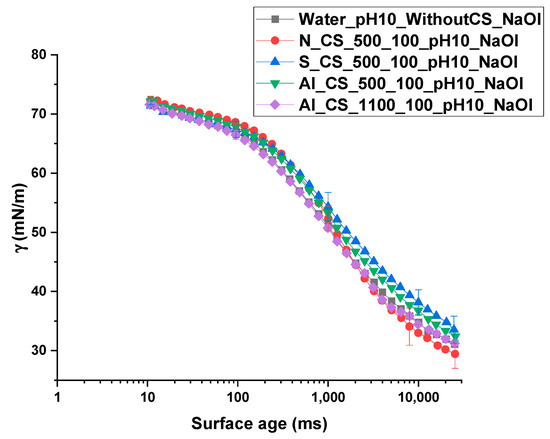
Figure 15.
Dynamic surface tension as a function of surface age for water and different colloidal silica (CS) types at a dosage of 100 mg/L, with sodium oleate (NaOl), measured at pH 10. Legend nomenclature: Water_pH10_WithoutCS_NaOl = water at pH 10 with NaOl, without CS; N_CS_500_100_pH10_NaOl = non-functionalized CS (SSA = 500 m2/g) at 100 mg/L, pH 10, with NaOl; S_CS_500_100_pH10_NaOl = silane-modified CS (SSA = 500 m2/g) under the same conditions; Al_CS_500_100_pH10_NaOl = aluminate-modified CS (SSA = 500 m2/g); Al_CS_1100_100_pH10_NaOl = aluminate-modified CS (SSA = 1100 m2/g).
In the absence of , pure water exhibited a stable surface tension of approximately 72 mN/m across all surface ages. N_CS_500, under all tested dosages (25, 50, and 100 mg/L), yielded closely grouped surface tension curves with only minor differences. Surface tension values decreased gradually over time, remaining slightly above the water reference throughout.
S_CS_500 consistently exhibited higher surface tension values than both pure water and non-functionalized CS across all surface ages. A clear dosage-dependent trend was observed, with surface tension increasing progressively from 25 mg/L to 50 mg/L and reaching the highest values at 100 mg/L. Despite these differences, all curves followed a similar decreasing trend as surface age increased.
For Al_CS_500, surface tension values were significantly higher than pure water, with curves tightly grouped across dosages and minimal variation among them. Al_CS_1100 showed a moderately decreasing trend in surface tension over time. Curves were slightly more dispersed compared to Al_CS_500, but all dosages remained clearly above the water baseline, with a subtle dosage effect: 100 mg/L displayed marginally higher surface tension than 25 mg/L and 50 mg/L.
Upon addition of at a concentration of 10−3 mol/L, water exhibited a pronounced and continuous decrease in surface tension, reaching values below 35 mN/m at longer surface ages. Under these conditions, all CS–NaOl mixtures produced tightly grouped surface tension curves, with only subtle differences among CS types. S_CS_500 and Al_CS_500 dispersions exhibited slightly higher surface tension values than in pure water. N_CS_500 resulted in surface tension values slightly below the water–NaOl reference. The Al_CS_1100 system closely followed the water–NaOl curve, showing minimal deviation across surface ages. These results indicate that while effectively reduces surface tension, the presence of colloidal silica—regardless of modification—moderates this effect.
4. Discussion
The main hypothesis regarding the depression mechanisms rendered by colloidal silica to calcite indicated that nanoscale surface roughness is a critical factor controlling the attachment of colloidal silica to calcite [21]. To closer investigate this hypothesis, surface topography of calcite, scheelite, apatite, and fluorite was investigated with AFM (Park Systems Corp., Suwon, Republic of Korea), which indeed confirmed pronounced differences in surface topography among the studied minerals.
In the absence of CS, scheelite and fluorite showed low surface roughness after polishing and lacked significant nanoscale features across the tested pH range. Calcite exhibited higher roughness than scheelite and fluorite, with a stable topographic profile across the entire pH range studied. Apatite, on the other hand, revealed pH-dependent surface roughness, particularly high at pH 2 and pH 10, suggesting localized etching or dissolution–reprecipitation processes.
The influence of pH on mineral surface roughness is primarily controlled by dissolution dynamics and crystallographic control of the surface topography. For calcite, low pH accelerates anisotropic dissolution, increasing the formation of reactive sites such as step edges and etch pits, while undersaturation promotes irregular surface renewal [32,33]. Fluorite and scheelite respond differently, with surface charge anisotropy playing a key role. At higher pH, preferential hydroxide adsorption on specific crystallographic planes modifies the surface potential and stabilizes certain facets, leading to smoother surfaces [34,35]. In contrast, apatite undergoes stronger pH-driven restructuring. The acidic conditions promote etching and roughening, whereas alkaline pH promotes precipitation and surface modification through hydroxyl and carbonate adsorption [36,37].
After CS treatment, the surfaces of fluorite and scheelite remained relatively smooth, with no significant changes in roughness or morphology apart from slight vertical or lateral texturing. This suggests that colloidal silica interacts only weakly or uniformly with these minerals and does not cause major structural changes. This is in contrast with calcite and apatite, which showed significant differences between the baseline and CS-treated surfaces. Furthermore, a difference in their surface evolution was observed: AFM height and phase images of apatite showed clear lateral heterogeneity and coarse vertical features, indicating widespread and unconfined surface restructuring. However, calcite underwent more subtle but well-organized alterations, especially with Al_CS_1100. AFM height and phase images showed anisotropic phase contrast domains and localized high kurtosis features, suggesting spatially confined changes driven by site-specific adsorption.
Two key observations emerge from the AFM analysis: (1) minerals with initially higher roughness, especially apatite and, to a lesser extent, calcite, undergo the most pronounced structural changes upon CS treatment, suggesting a link between intrinsic surface reactivity and CS interaction intensity; and (2) the nature of these changes is mineral-specific: calcite develops confined, discrete features, whereas apatite shows extensive morphological disorder. This difference emphasizes the importance of surface chemistry and microstructural context in explaining how colloidal silica may interact with mineral surfaces.
While surface roughness can enhance nanoparticle attachment, it alone cannot fully explain the selective affinity of colloidal silica for calcite. Roughness contributes by increasing the density of high-energy sites (e.g., kinks, step edges) and is known to affect wettability, dissolution kinetics, and surface energy [38,39,40]. Selective interaction of colloidal silica is likely governed by the interplay between nanoscale roughness, mineral-specific dissolution behavior, interfacial hydration structure, and crystallographic orientation. Together, these parameters shape how nanoparticles approach, anchor to, and stabilize on mineral surfaces, and determine both the extent and nature of surface transformations.
Fluorite crystallizes in a cubic lattice (), characterized by symmetric ionic arrangements and cleavage along the {111} and {100} planes [41,42]. These planes expose chemically equivalent, low-energy surfaces that are topographically smooth and lack heterogeneity, conditions unfavorable for nanoparticle entrapment or selective interaction. Furthermore, the fluorite–water interface is dominated by molecular water adsorption (adsorption energy ~−55 kJ·mol−1) [43], while dissociative adsorption is energetically unfavorable. This results in the formation of a chemically inert hydration shell, stabilized by non-directional hydrogen bonding. Molecular dynamics simulations confirm that this hydration layer remains stable under ambient conditions [43].
Scheelite (CaWO4) crystallizes in a tetragonal system (I41/a), with isolated WO42−-tetrahedron coordinated by Ca2+ cations. Cleavage occurs primarily along {112} and {001} planes, exposing Ca-rich but topographically smooth surfaces due to the rupture of weaker Ca–O bonds (130 kJ·mol−1) [7,42], while the strong W–O bonds (610 kJ·mol−1) remain intact [44]. Both AFM imaging and theoretical simulations show that scheelite surfaces are chemically homogeneous, even under mild chemical or mechanical perturbation [42]. The interfacial hydration layer is defined by weakly adsorbed OH− ions and lacks evidence for bridging species such as CaOH+ [7]. Despite being slightly soluble ( = 10−9), scheelite dissolves slowly under flotation conditions [45], and its surfaces remain structurally stable. Mechanically, its low fracture toughness and anisotropic hardness result in frequent exposure of the compliant (001) plane during processing [46].
Apatite presents a more complex case. Before CS treatment, its surface roughness increased significantly in both acidic and alkaline environments and was comparable to that of calcite at intermediate pH (4–8). Microflotation tests performed at pH 8 revealed that apatite flotation is unaffected by the presence of CS, suggesting little or no CS adsorption. However, height and phase contrast images after CS exposure showed relevant surface changes with blurred boundaries and heterogeneous topography, suggesting recrystallization or the formation of a secondary phase. This response is likely not due to direct CS attachment but rather to surface restructuring through dissolution–reprecipitation processes. Chemically, apatite, which crystallizes in the hexagonal system (space group P63/m), exposes phosphate-rich surfaces that promote the formation of structured hydration layers through strong electrostatic interactions with Ca2+ and PO43− ions [47]. These ordered hydration layers limit the adsorption of external species, such as nanoparticles, and decrease water mobility. Instead of functioning as an adsorbate, CS likely serves as a transformation catalyst. This idea is supported by evidence from the bioactive glass literature. Andersson et al. [48] showed that silica can facilitate the release of Ca2+ and PO43− in solution, resulting in the formation of secondary apatite in a silica-rich gel and promoting apatite reprecipitation.
On the other hand, following CS treatment, calcite, whose flotation was hindered by CS as shown in microflotation tests, exhibited distinct and spatially confined domains in AFM height and phase contrast images. These well-defined, high-contrast regions suggest strong and site-specific adsorption of colloidal silica, consistent with a surface-mediated depression mechanism.
Calcite crystallizes in the trigonal (rhombohedral) system (space group R3¯c) and cleaves preferentially along the () plane, exposing atomically flat terraces composed of alternating Ca2+ and CO32− groups [49]. This periodic atomic arrangement generates long-range electrostatic fields that facilitate templated adsorption of silica nanoparticles and promote the formation of stable surface layers [50]. Because of its chemically active hydration shell, the calcite–water interface further facilitates silica binding. This interface is rich in hydrated CaOH+ and CO3H− species, which can create ionic bridges and hydrogen bonds with colloidal silica, according to experimental and molecular dynamics investigations [39,51]. The robustness of the interfacial chemistry is demonstrated by the stability of these hydration complexes even at extremely high vacuums [51].
Furthermore, environmental factors can intensify this dissolution behavior by lowering the effective rupture energy of Ca–O bonds. Surface hydration distorts Ca–O octahedra, promoting structural relaxation and localized bond rupture [52]. The adsorption of H+ ions further contributes by forming CaOH+ and CO3H− complexes, which weaken Ca–O bonding and enhance anisotropic dissolution, particularly under neutral to slightly alkaline conditions [53].
As a result, under slightly undersaturated conditions, calcite dissolves anisotropically, creating etch pits and step edges along the () plane. This produces reactive site density and nanoscale curvature, ideal for colloidal silica anchoring. Calcite dissolves in a controlled and periodic manner, maintaining structural coherence while permitting dynamic surface renewal [51], in contrast to the disordered transformation of apatite. This supports lattice-guided silica deposition, as demonstrated by Liesegang et al. [50], who showed that silica precipitated during calcite replacement retained crystallographic orientation. Taken together, calcite’s combination of surface roughness, active hydration layer, crystallographic symmetry, and anisotropic dissolution create a uniquely favorable environment for colloidal silica adsorption.
Beyond its primary function as a calcite depressant, colloidal silica was found to affect several interdependent flotation subprocesses. Among these, its effects on bubble size control and froth structure, two factors critical to flotation selectivity, were particularly pronounced. Of the tested CS types, Al_CS_1100 lead to the finest bubbles close to the pulp-froth interface, with Sauter mean diameters between 350 µm and 390 µm. This fine bubble regime was preserved in the froth phase, as illustrated in Figure 16, where median froth bubble sizes remained consistently low, indicating minimal coalescence during bubble rise and in the froth phase.
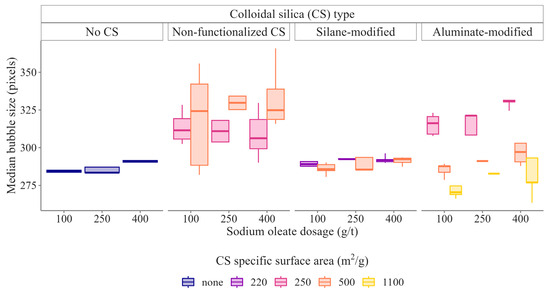
Figure 16.
Boxplots of median froth bubble size for batch flotation tests with the different colloidal silica suspensions at different colloidal silica dosages [21].
An intermediate behavior was observed for S_CS_500, which generated pulp bubbles in the 450 µm–760 µm range and slightly bigger froth bubble than Al_S_1100. In contrast, N_CS_500 produced substantially larger bubbles in the pulp phase, especially at higher dosages, reaching up to 1200 µm. Corresponding coarse froth bubbles resulted, indicating extensive coalescence and a lack of stabilization during froth formation. This mismatch between pulp and froth bubble sizes reflects poor interfacial activity and ineffective bubble stabilization.
This hierarchy in bubble control was mirrored in flotation performance. Al_CS_1100 delivered the highest scheelite recovery in both the 20 µm–50 µm particle size range and at coarser sizes, consistent with its production of small, stable bubbles that maximize fine- and mid-size particle collision and attachment. It also produced similar or slightly smaller froth bubbles than the blank tests, suggesting why scheelite recovery under Al_CS_1100 usage matches or slightly outperforms the system without colloidal silica. These results are in line with classical flotation theory: smaller bubbles promote the recovery of fine particles through increased collision probability and reduced detachment forces [54,55,56,57].
The contrasting trends in d3,2 and span3 with increasing CS dosage are largely controlled by pH-dependent colloidal stability and aggregation mechanisms, which were visually confirmed and proposed as the main drivers of the differing flotation responses [21]. At pH 8, most CS dispersions remain relatively stable due to stronger electrostatic repulsion. N_CS_500 shows only moderate stability, allowing partial coagulation that promotes bubble coalescence, resulting in larger d3,2 values and a narrower span3. S_CS_500 is highly stable due to steric hindrance, keeping both d3,2 and span3 essentially unchanged. Al_CS_500 exhibits reduced stability, forming loose floc-like aggregates that moderately increase d3,2 and narrow span3. At pH 10, the stability of N_CS_500 decreases markedly due to the charge screening, which promotes dense coagulation and extensive bubble coalescence, producing larger d3,2 values and a strongly narrowed span3. In contrast, aluminate-modified CS behaves differently: Al_CS_500 becomes more interfacially stable as gel-like networks form, suppressing bubble coalescence and keeping d3,2 nearly constant, while span3 broadens slightly due to local variations in network density where stable fine bubbles coexist with occasional larger ones. Al_CS_1100 exhibits a similar mechanism, but its gelation is weaker and more uniform, resulting in slightly larger d3,2 and a moderate span3 increase. This gelling process can lead to a reduction in scheelite recovery by increasing pulp viscosity, but this effect was less pronounced for Al_CS_1100 [21], allowing for high scheelite recovery even at increased dosages, as shown in Figure 12. The remarkable decrease in scheelite recovery for Al_CS_500 at high dosage is likely related to its extensive gelling.
Although N_CS_500 had a lower surface tension than Al_CS_1100, the latter consistently produced smaller and more stable bubbles. This observation indicates that surface tension alone does not govern bubble behavior in these colloidal systems. Rather, the interfacial activity of the particles appears to play a dominant role. Surface-modified colloidal silica likely forms cohesive interfacial films or introduces steric barriers that suppress coalescence. In contrast, non-functionalized colloidal silica lacks the surface modifications necessary to prevent coalescence, resulting in froth instability and larger bubbles.
Interestingly, the differences seen in DST measurements without NaOl almost disappeared when NaOl was present, as the surface tension curves became closely grouped. This suggests that NaOl adsorption at the air–water interface may mask or reduce the effects of CS, possibly through competitive adsorption. While this explanation is consistent with the reduced separation of the DST curves, it cannot yet be confirmed. Future studies should systematically vary NaOl and CS concentrations across a wider range and include pH-dependent DST measurements to better separate the individual and combined effects of NaOl and CS.
DFA measurements confirmed the interfacial effects of CS. Aluminate-modified CS significantly increased froth drainage resistance, liquid retention, and froth lifetime, while silane-modified CS showed moderate improvements compared to non-functionalized CS. In particular, the effect of CS and SSA dosage diverged across metrics: they reduced the drainage half-life but increased the froth lifetime. This divergence supports the well-established understanding that froth drainage and froth collapse are governed by different mechanisms. While fast drainage reflects thinning lamellae and interfacial crowding, a long froth lifetime suggests the formation of a coherent interfacial network of particles. In the aluminate system, this decoupling was particularly notable. Al_CS_1100 maintained froth stability even under fast drainage. This suggests that Al_CS_1100 forms strong interfacial networks that prevent froth collapse regardless of drainage dynamics. Therefore, it improves flotation selectivity by stabilizing the froth long enough to recover target minerals to recover target minerals while minimizing the entrainment of unwanted particles such as calcite.
These findings are consistent with broader principles from colloidal interface science. Prior studies by Brown et al. [58] and Hunter et al. [59] have shown that foam and emulsion stability depends critically on particle size, concentration, and wettability. Smaller particles form dense interfacial layers that act as steric barriers to coalescence, while higher concentrations promote robust interfacial networks. Stability is maximized when particles exhibit intermediate wettability, which promotes preferential adsorption at the gas–liquid interface. Beyond Pickering stabilization, recent work by Eftekhari et al. [60] provides further mechanistic insights through the concept of interfacial immobilization via nanoparticle–surfactant complexes (NPSCs). These complexes can transition a bubble interface from liquid-like to solid-like, suppressing interfacial flow, reducing coalescence, and altering hydrodynamic behavior. This dual effect, bubble stabilization and improved drainage, helps explain why Al_CS_1100 outperforms the blank and both non-functionalized and silane-modified CS in the froth phase, in addition to its advantages in the pulp. In contrast, silane modification, which reduces froth stability, fails to capitalize on drainage improvements and therefore does not achieve the same performance.
The reproducible trend in microflotation tests for scheelite, apatite, and fluorite recoveries at low CS dosages (10–50 mg/L), as described in Section 3.2, could not be mechanistically resolved within the scope of this study and requires dedicated experimental investigation.
Our findings complement previous work on silicate-based depressants. Kupka et al. [61,62] showed that acidified water glass enhances selectivity by depressing silicates and calcium-bearing minerals at lower dosages than alkaline sodium silicate, attributing its action primarily to Si–O monomers formed by depolymerization. While confirming this improved selectivity, our study extends the concept from polymeric silicate species to discrete colloidal silica nanoparticles. We show that the mechanism is not limited to chemical adsorption but also involves physical–chemical nanoparticle attachment, froth stabilization, and interfacial bubble dynamics. Our work further builds on earlier studies introducing colloidal silica as a calcite depressant in scheelite flotation [63] by broadening the mineral scope and providing a detailed mechanistic interpretation, demonstrating subprocess-specific effects in both pulp and froth zones. Moreover, Fuerstenau et al. [64] propose that sodium silicate depresses calcite by forming colloidal silica layers via hydrolysis and subsequent adsorption, thereby blocking collector attachment. Our findings support and refine this hypothesis, indicating that adsorption is not simply a passive surface coating but is guided by calcite’s lattice structure and further promoted by its dynamic hydration layer and anisotropic etch-pit formation, confirming that hydration and surface texture both play a key role in colloidal silica nanoparticle adsorption.
In summary, these results demonstrate that colloidal silica, particularly high-SSA aluminate-modified silica, is a multifunctional flotation reagent. Its ability to stabilize froth, control bubble size, improve fine scheelite recovery, and uniquely decouple froth drainage from froth collapse makes it much more than just a selective calcite depressant. Rather, high-SSA aluminate-modified colloidal silica appears to be a versatile, process-integrated reagent capable of tuning multiple froth flotation subprocesses.
Despite the beneficial effects associated with colloidal silica, several challenges must be addressed before widespread implementation becomes feasible. A major limitation is its relatively low surface activity per unit mass, meaning that large volumes are often required to achieve effective surface coverage and froth stability. This raises questions about cost-effectiveness and reagent consumption. Furthermore, in industrial circuits where process water is recycled, high ionic strength can promote nanoparticle aggregation, significantly reducing dispersion stability and limiting reagent performance. Environmental considerations are also crucial such as bioaccumulation or ecotoxic effects. Innovative approaches are needed to address these concerns, including combining nanoparticles with conventional flotation agents. Surface functionalization approaches can further enhance both interfacial selectivity and dispersion robustness, while biodegradable nanomaterials offer routes toward more sustainable implementation. Integration with nanobubble or microbubble technologies may also unlock synergistic improvements in bubble–particle interactions and froth structure. Ultimately, the success of nanoparticle reagents as a next-generation flotation reagent depends on system-specific optimization, tuning its interfacial properties to match the mineralogy, process water chemistry, and flotation conditions.
5. Conclusions
This study demonstrates that colloidal silica, particularly in surface-modified and high-specific-surface-area forms, acts as a multifunctional reagent capable of selectively depressing calcite while enhancing bubble control and froth stability in the flotation of semi-soluble salt-type minerals. The mineral-specific responses observed—localized nanoparticle adsorption on calcite, forming stable surface layers that hinder collector adsorption and dissolution-driven restructuring of apatite rather than direct adsorption—highlight the importance of surface chemistry, crystal structure, and hydration behavior in governing CS interaction. Mechanistic analysis across multiple subprocesses confirmed that interfacial activity plays the dominant role. Nanoparticle interactions enhance flotation performance by stabilizing bubbles in the pulp, improving particle bubble collision and attachment, and thereby the recovery of fine and mid-size scheelite while maintaining an effective calcite depression. The aluminate-modified colloidal silica with high SSA showed superior performance by forming cohesive particle networks at bubble surfaces that suppress bubble coalescence, promote stable fine-bubble regimes, and decouple froth stability from drainage. This decoupling improves target mineral recovery while minimizing gangue entrainment. These insights provide a mechanistic basis for tailoring nanoparticle reagents and offer a promising path toward their implementation as design next-generation, multifunctional flotation reagents. However, future work must address water chemistry effects, including ion-specific interactions and viscosity-related changes influencing colloidal silica aggregation and adsorption, as well as challenges related to reagent dosage, long-term colloidal stability in process water, and environmental sustainability to ensure practical large-scale implementation. Additionally, controlled mineral mixtures, even within the microflotation context, should be investigated to better understand interaction effects and improve the transferability of single-mineral findings to complex ore systems.
Author Contributions
Conceptualization, B.B.S.; methodology, B.B.S.; validation, B.B.S., S.P., M.R. and L.P.; investigation, B.B.S. and S.P.; data curation, B.B.S., S.P., M.R. and L.P.; writing—original draft preparation, B.B.S.; writing—review and editing, B.B.S., S.P., M.R. and L.P.; supervision, M.R., D.G. and L.P.; project administration, M.R.; funding acquisition, M.R. All authors have read and agreed to the published version of the manuscript.
Funding
This paper was written thanks to the financial support of the CoSilFlot project (03THWSN006) financed by the “WIPANO—Knowledge and Technology Transfer through Patents and Standards” program.
Data Availability Statement
Data will be made available on request.
Acknowledgments
The authors thank colleagues at Nouryon (formerly AkzoNobel Surface Chemistry, Sweden) for providing flotation reagents and meaningful discussions. The authors thank many colleagues for their support with this project: Roland Würkert for sample preparation and Bradley Martin Guy for conducting the MLA analyses.
Conflicts of Interest
The authors declare that they have no known competing financial interests or personal relationships that could have appeared to influence the work reported in this paper.
Appendix A

Figure A1.
AFM height (left) and phase contrast (right) images of fluorite (a) and scheelite (b) at pH 8. Surface features are shallow and uniformly distributed over the scanned area with no significant heterogeneities. The scanned area is 10 µm × 10 µm; height is expressed in nanometers (nm), and phase contrast is labeled in deg (°).

Figure A2.
AFM height (left) and phase contrast (right) images of calcite at pH 2 (a), pH 6 (b), and pH 10 (c). At pH 2, the surface showed moderate topographic variation with shallow, uniformly distributed surface features, corresponding to a nearly symmetrical profile. The phase image shows uniform contrast and fine-scale texture. At pH 6, elongated features and increased heterogeneity became apparent in both the height and phase images, indicating increased surface heterogeneity. At pH 10, the surface appeared coarser and more granular in the height image, while the phase image showed a pronounced variation in lateral contrast and the appearance of well-defined domains. The scanned area is 10 µm × 10 µm; height is expressed in nanometers (nm), and phase contrast is labeled in deg (°).

Figure A3.
AFM height (left) and phase contrast (right) images of apatite at pH 2 (a), pH 6 (b), and pH 10 (c). At pH 2, the surface shows in the height image an intensively undulating topography with granular dips, and in the phase image a high contrast domain. At pH 6, the surface indicates the presence of deep, narrow surface dips. These features were rare and had minimal amplitude resulting in a surface that appeared visually smooth on the height image. The phase image showed minimal contrast variation, suggesting little lateral heterogeneity. At pH 10, the surface is characterized by pronounced elevation changes in the height image and strong, localized phase contrast in well-defined domains. The scanned area is 10 µm × 10 µm; height is expressed in nanometers (nm), and phase contrast is labeled in deg (°).

Figure A4.
Boxplots of median bubble size for SOPAT measurements with the different colloidal silica suspensions at different colloidal silica dosages.
References
- Urbina, R.H. Recent developments and advances in formulations and applications of chemical reagents used in froth flotation. Miner. Process. Extr. Metall. Rev. 2003, 24, 139–182. [Google Scholar] [CrossRef]
- Kawatra, S.K. Froth Flotation–Fundamental Principles; Michigan Technological University: Houghton, MI, USA, 2009; p. 30. [Google Scholar]
- Farrokhpay, S. The significance of froth stability in mineral flotation—A review. Adv. Colloid Interface Sci. 2011, 166, 1–7. [Google Scholar] [CrossRef] [PubMed]
- Bulatovic, S. Chapter 26-Flotation of Phosphate Ore. In Handbook of Flotation Reagents: Chemistry, Theory and Practice; Elsevier: Amsterdam, The Netherlands, 2015; pp. 1–19. [Google Scholar]
- Foucaud, Y.; Filippov, L.; Filippova, I.; Badawi, M. The Challenge of Tungsten Skarn Processing by Froth Flotation: A Review. Front. Chem. 2020, 8, 230. [Google Scholar] [CrossRef]
- Bulatovic, S. Chapter 29-Beneficiation of Florite Ores. In Handbook of Flotation Reagents: Chemistry, Theory and Practice; Elsevier: Amsterdam, The Netherlands, 2015; pp. 57–76. [Google Scholar]
- Hu, Y.; Gao, Z.; Sun, W.; Liu, X. Anisotropic surface energies and adsorption behaviors of scheelite crystal. Colloids Surf. A Physicochem. Eng. Asp. 2012, 415, 439–448. [Google Scholar] [CrossRef]
- Miller, J.D.; Khalek, N.A.; Basllio, C.; El-Shall, H.; Fa, K.; Forssberg, K.S.E.; Fuerstenau, M.C.; Mathur, S.; Nalaskowski, J.; Rao, K.H.; et al. Flotation Chemistry and Technology of Nonsulfide Minerals. In Froth Flotation: A Century of Innovation; Fuerstenau, M.C., Jameson, G.J., Yoon, R.-H., Eds.; SME: Littleton, CO, USA, 2007; pp. 465–555. ISBN 978-0-87335-252-9. [Google Scholar]
- Hancer, M.; Celik, M.S.; Miller, J.D. The Significance of Interfacial Water Structure in Soluble Salt Flotation Systems. J. Colloid Interface Sci. 2001, 235, 150–161. [Google Scholar] [CrossRef]
- Qian, Y.; Qiu, X.; Shen, T.; Huai, Y.; Chen, B.; Wang, Z. Effect of Calcium Ion on the Flotation of Fluorite and Calcite Using Sodium Oleate as Collector and Tannic Acid as Depressant. Minerals 2022, 12, 996. [Google Scholar] [CrossRef]
- Li, X.; Jiang, H.; Peng, Z.; Duan, A.; Zhang, T.; Gong, Z. Leaching of Scheelite Concentrate for Tungsten Extraction. Minerals 2025, 15, 475. [Google Scholar] [CrossRef]
- Hughes, J.M.; Rakovan, J. The Crystal Structure of Apatite, Ca5(PO4)3(F,OH,Cl). Rev. Mineral. Geochem. 2002, 48, 1–12. [Google Scholar] [CrossRef]
- Aigueperse, J.; Mollard, P.; Devilliers, D.; Chemla, M.; Faron, R.; Romano, R.; Cuer, J.P. Fluorine Compounds, Inorganic. In Ullmann’s Encyclopedia of Industrial Chemistry; John Wiley & Sons, Inc.: Hoboken, NJ, USA, 2000. [Google Scholar]
- Chang, R.; Choi, D.; Kim, M.H.; Park, Y. Tuning Crystal Polymorphisms and Structural Investigation of Precipitated Calcium Carbonates for CO2 Mineralization. ACS Sustain. Chem. Eng. 2017, 5, 1659–1667. [Google Scholar] [CrossRef]
- Legawiec, K.; Polowczyk, I. Evolution of ideas towards the implementation of nanoparticles as flotation reagents. Physicochem. Probl. Miner. Process. 2020, 56, 280–289. [Google Scholar] [CrossRef]
- Yang, S.; Pelton, R.; Raegen, A.; Montgomery, M.; Dalnoki-Veress, K. Nanoparticle flotation collectors: Mechanisms behind a new technology. Langmuir 2011, 27, 10438–10446. [Google Scholar] [CrossRef]
- An, M.; Yinfei, L.; Xiahui, G.; Yifan, Z.; Yucheng, H.; Zechen, L.; Lai, Q. An investigation of coal flotation using nanoparticles as a collector. Int. J. Coal Prep. Util. 2020, 40, 679–690. [Google Scholar] [CrossRef]
- Hajati, A.; Shafaei, S.Z.; Noaparast, M.; Farrokhpay, S.; Aslani, S. Novel application of talc nanoparticles as collector in flotation. RSC Adv. 2016, 6, 98096–98103. [Google Scholar] [CrossRef]
- Yang, S.; Pelton, R.; Abarca, C.; Dai, Z.; Montgomery, M.; Xu, M.; Bos, J.-A. Towards nanoparticle flotation collectors for pentlandite separation. Int. J. Miner. Process. 2013, 123, 137–144. [Google Scholar] [CrossRef]
- Kupka, N.; Babel, B.; Rudolph, M. Potential Role of Colloidal Silica as a Calcite Depressant in Scheelite Flotation, in Flotation ‘19; MEI: Cape Town, South Africa, 2019. [Google Scholar]
- Ben Said, B.; Rudolph, M.; Ebert, D.; Goldmann, D.; Pereira, L. Nanoparticle depressants in froth flotation–The effect of colloidal silica with different size and surface modifications on the selective separation of semi-soluble salt type minerals. Colloids Surf. A Physicochem. Eng. Asp. 2024, 690, 133697. [Google Scholar] [CrossRef]
- Ben Said, B.; Rudolph, M.; Goldmann, D.; Pereira, L. Upscaling and optimization of reagents systems in froth flotation: A DoE and numerical-optimization-based methodology. Miner. Eng. 2025, 228, 109308. [Google Scholar] [CrossRef]
- Dong, W.P.; Sullivan, P.J.; Stout, K.J. Comprehensive study of parameters for characterising three- dimensional surface topography: III: Parameters for characterising amplitude and some functional properties. Wear 1994, 178, 29–43. [Google Scholar] [CrossRef]
- Sächsisches Staatsministerium für Soziales und Gesellschaftlichen Zusammenhalt. EU-Trinkwasserversorgungsgebiet MW Freiberg–Daten. 16 May 2023, 23 July 2023, 2025, 2020. Available online: https://apps.gesunde.sachsen.de/trinkwasser/trinkwasser-detail-WSZ_DESN_1170-de.html (accessed on 23 July 2025).
- Hochland, Z.W.M. Official Gazette No. 06/2023–Water Quality Data for Käbschütztal and Nossen; Weckverband Wasserversorgung Meissner Hochland: Nossen, Germany, 2023. [Google Scholar]
- Fandrich, R.; Gu, Y.; Burrows, D.; Moeller, K. Modern SEM-based mineral liberation analysis. Int. J. Miner. Process. 2007, 84, 310–320. [Google Scholar] [CrossRef]
- Heinig, T.; Bachmann, K.; Tolosana-Delgado, R.; Van den Boogaart, K.G.; Gutzmer, J. Monitoring gravitational and particle shape settling effects on MLA sample preparation. In Proceedings of the IAMG Conference 2015, Freiberg, Germany, 5–13 September 2015. [Google Scholar]
- Pereira, L.; Frenzel, M.; Hoang, D.H.; Tolosana-Delgado, R.; Rudolph, M.; Gutzmer, J. Computing single-particle flotation kinetics using automated mineralogy data and machine learning. Miner. Eng. 2021, 170, 107054. [Google Scholar] [CrossRef]
- Pereira, L.; Kupka, N.; Huu Hoang, D.; Michaux, B.; Saquran, S.; Ebert, D.; Rudolph, M. On the impact of grinding conditions in the flotation of semi-soluble salt-type mineral-containing ores driven by surface or particle geometry effects? Int. J. Min. Sci. Technol. 2023, 33, 855–872. [Google Scholar] [CrossRef]
- Gunst, R.F.; Mason, R.L. Fractional factorial design. WIREs Comput. Stat. 2009, 1, 234–244. [Google Scholar] [CrossRef]
- Hauner, I.M.; Deblais, A.; Beattie, J.K.; Kellay, H.; Bonn, D. The Dynamic Surface Tension of Water. J. Phys. Chem. Lett. 2017, 8, 1599–1603. [Google Scholar] [CrossRef]
- De Giudici, G. Surface control vs. diffusion control during calcite dissolution: Dependence of step-edge velocity upon solution pH. Am. Miner. 2002, 87, 1279–1285. [Google Scholar] [CrossRef]
- Stigliano, L.; Ackerer, P.; Benzerara, K.; Daval, D. Linking calcite surface roughness resulting from dissolution to the saturation state of the bulk solution. Chem. Geol. 2023, 637, 121680. [Google Scholar] [CrossRef]
- Gao, Z.; Xie, L.; Cui, X.; Hu, Y.; Sun, W.; Zeng, H. Probing Anisotropic Surface Properties and Surface Forces of Fluorite Crystals. Langmuir 2018, 34, 2511–2521. [Google Scholar] [CrossRef]
- Gao, Z.; Hu, Y.; Sun, W.; Drelich, J.W. Surface-charge anisotropy of scheelite crystals. Langmuir 2016, 32, 6282–6288. [Google Scholar] [CrossRef]
- Welch, S.A.; Taunton, A.E.; Banfield, J.F. Effect of Microorganisms and Microbial Metabolites on Apatite Dissolution. Geomicrobiol. J. 2002, 19, 343–367. [Google Scholar] [CrossRef]
- Shimoda, S.; Aoba, T.; Moreno, E.C.; Miake, Y. Effect of Solution Composition on Morphological and Structural Features of Carbonated Calcium Apatites. J. Dent. Res. 1990, 69, 1731–1740. [Google Scholar] [CrossRef]
- Guren, M.G.; Renard, F.; Noiriel, C. Dissolution rate variability at carbonate surfaces: 4D X-ray micro-tomography and stochastic modeling investigations. Front. Water 2023, 5, 1185608. [Google Scholar] [CrossRef]
- de Leeuw, N.H.; Parker, S.C. Surface Structure and Morphology of Calcium Carbonate Polymorphs Calcite, Aragonite, and Vaterite: An Atomistic Approach. J. Phys. Chem. B 1998, 102, 2914–2922. [Google Scholar] [CrossRef]
- de Assis, T.A.; Aarão Reis, F.D.A. Dissolution of minerals with rough surfaces. Geochim. Cosmochim. Acta 2018, 228, 27–41. [Google Scholar] [CrossRef]
- Kowalczuk, P.; Akkaya, C.; Ergun, M.; Janicki, M.J.; Sahbaz, O.; Drzymała, J. Water contact angle on corresponding surfaces of freshly fractured fluorite, calcite and mica. Physicochem. Probl. Miner. Process. 2016, 53, 192–201. [Google Scholar] [CrossRef]
- Gao, Z.; Sun, W.; Hu, Y.; Liu, X. Surface energies and appearances of commonly exposed surfaces of scheelite crystal. Trans. Nonferrous Met. Soc. China 2013, 23, 2147–2152. [Google Scholar] [CrossRef]
- Foucaud, Y.; Badawi, M.; Filippov, L.O.; Filippova, I.V.; Lebegue, S. Surface Properties of Fluorite in Presence of Water: An Atomistic Investigation. J. Phys. Chem. B 2018, 122, 6829–6836. [Google Scholar] [CrossRef] [PubMed]
- Neiman, A.Y. Cooperative transport in oxides: Diffusion and migration processes involving Mo(VI), W(VI), V(V) and Nb(V). Solid State Ion. 1996, 83, 263–273. [Google Scholar] [CrossRef]
- Marinakis, K.I.; Kelsall, G.H. The surface chemical properties of scheelite (CaWO4) I. The scheelite/water interface and CaWO4 solubility. Colloids Surf. 1987, 25, 369–385. [Google Scholar] [CrossRef]
- Mogilevsky, P.; Parthasarathy, T.A.; Petry, M.D. Anisotropy in room temperature microhardness and fracture of CaWO4 scheelite. Acta Mater. 2004, 52, 5529–5537. [Google Scholar] [CrossRef]
- Zahn, D.; Hochrein, O. Computational study of interfaces between hydroxyapatite and water. Phys. Chem. Chem. Phys. 2003, 5, 4004–4007. [Google Scholar] [CrossRef]
- Andersson, O.H.; Kangasniemi, I. Calcium phosphate formation at the surface of bioactive glass in vitro. J. Biomed. Mater. Res. 1991, 25, 1019–1030. [Google Scholar] [CrossRef]
- Araki, Y.; Tsukamoto, K.; Oyabu, N.; Kobayashi, K.; Yamada, H. Atomic-Resolution Imaging of Aragonite (001) Surface in Water by Frequency Modulation Atomic Force Microscopy. Jpn. J. Appl. Phys. 2012, 51, 08KB09. [Google Scholar] [CrossRef]
- Liesegang, M.; Milke, R.; Kranz, C.; Neusser, G. Silica nanoparticle aggregation in calcite replacement reactions. Sci. Rep. 2017, 7, 14550. [Google Scholar] [CrossRef]
- Stipp, S.; Eggleston, C.; Nielsen, B.S. Calcite surface structure observed at microtopographic and molecular scales with atomic force microscopy (AFM). Geochim. Cosmochim. Acta 1994, 58, 3023–3033. [Google Scholar] [CrossRef]
- Villegas-Jimenez, A.; Mucci, A.; Whitehead, M.A. Theoretical insights into the hydrated (10.4) calcite surface: Structure, energetics, and bonding relationships. Langmuir 2009, 25, 6813–6824. [Google Scholar] [CrossRef]
- Kim, K.T.; Henkelman, G.; Katz, L.E.; Werth, C.J. New Insights into Calcite Dissolution Mechanisms under Water, Proton, or Carbonic Acid-Dominated Conditions. Environ. Sci. Technol. 2024, 58, 11331–11341. [Google Scholar] [CrossRef] [PubMed]
- Tao, D. Role of Bubble Size in Flotation of Coarse and Fine Particles—A Review. Sep. Sci. Technol. 2005, 39, 741–760. [Google Scholar] [CrossRef]
- Reis, A.S.; Mendes, T.F.; Petri Júnior, I.; Barrozo, M.A.S. Influence of bubble size on performance of apatite flotation of different particle sizes. Part. Sci. Technol. 2023, 41, 1044–1052. [Google Scholar] [CrossRef]
- Farrokhpay, S.; Filippov, L.; Fornasiero, D. Flotation of Fine Particles: A Review. Miner. Process. Extr. Metall. Rev. 2020, 42, 473–483. [Google Scholar] [CrossRef]
- Fornasiero, D.; Filippov, L. Innovations in the flotation of fine and coarse particles. J. Phys. Conf. Ser. 2017, 879, 12002. [Google Scholar] [CrossRef]
- Brown, N.; de la Pena, A.; Razavi, S. Interfacial rheology insights: Particle texture and Pickering foam stability. J. Phys. Condens. Matter 2023, 35, 384002. [Google Scholar] [CrossRef] [PubMed]
- Hunter, T.N.; Pugh, R.J.; Franks, G.V.; Jameson, G.J. The role of particles in stabilising foams and emulsions. Adv. Colloid Interface Sci. 2008, 137, 57–81. [Google Scholar] [CrossRef] [PubMed]
- Eftekhari, M.; Schwarzenberger, K.; Heitkam, S.; Javadi, A.; Bashkatov, A.; Ata, S.; Eckert, K. Interfacial Behavior of Particle-Laden Bubbles under Asymmetric Shear Flow. Langmuir 2021, 37, 13244–13254. [Google Scholar] [CrossRef]
- Kupka, N.; Möckel, R.; Rudolph, M. Acidified water glass in the selective flotation of scheelite from calcite, Part I: Performance and impact of the acid type. Physicochem. Probl. Miner. Process. 2020, 56, 238–251. [Google Scholar] [CrossRef]
- Kupka, N.; Kaden, P.; Jantschke, A.; Schach, E.; Rudolph, M. Acidified water glass in the selective flotation of scheelite from calcite, Part II: Species in solution and related mechanism of the depressant. Physicochem. Probl. Miner. Process. 2020, 56, 797–817. [Google Scholar] [CrossRef]
- Kupka, N.; Babel, B.; Rudolph, M. The potential role of colloidal silica as a depressant in scheelite flotation. Minerals 2020, 10, 144. [Google Scholar] [CrossRef]
- Fuerstenau, M.; Gutierrez, G.; Elgillani, D.A. The influence of sodium silicate in nonmetallic flotation systems. Transactions 1968, 241, 319–323. [Google Scholar]
Disclaimer/Publisher’s Note: The statements, opinions and data contained in all publications are solely those of the individual author(s) and contributor(s) and not of MDPI and/or the editor(s). MDPI and/or the editor(s) disclaim responsibility for any injury to people or property resulting from any ideas, methods, instructions or products referred to in the content. |
© 2025 by the authors. Licensee MDPI, Basel, Switzerland. This article is an open access article distributed under the terms and conditions of the Creative Commons Attribution (CC BY) license (https://creativecommons.org/licenses/by/4.0/).