Article

Forces During the Film Drainage and Detachment of NMC and Spherical Graphite in Particle–Bubble Interactions Quantified by CP-AFM and Modeling to Understand the Salt Flotation of Battery Black Mass

Institute of Mechanical Process Engineering and Mineral Processing, Technische Universität Bergakademie Freiberg, Agricolastraße 1, 09599 Freiberg, Germany
*
Authors to whom correspondence should be addressed.
Minerals 2025, 15(8), 809; https://doi.org/10.3390/min15080809
Submission received: 23 June 2025 / Revised: 20 July 2025 / Accepted: 24 July 2025 / Published: 30 July 2025
(This article belongs to the Special Issue Particle–Bubble Interactions in the Flotation Process)

Abstract

The salt flotation of graphite in the presence of lithium nickel manganese cobalt oxide (NMC) was assessed by performing colloidal probe atomic force microscopy (CP-AFM) on sessile gas bubbles and conducting batch flotation tests with model lithium-ion-battery black mass. The modeling of film drainage and detachment during particle–bubble interactions provides insight into the fundamental microprocesses during salt flotation, a special variant of froth flotation. The interfacial properties of particles and gas bubbles were tailored with salt solutions containing sodium chloride and sodium acetate buffer. Graphite particles can attach to gas bubbles under all tested conditions in the range pH 3 to pH 10. The attractive forces for spherical graphite are strongest at high salt concentrations and pH 3. The conditions for the attachment of NMC to gas bubbles were evaluated with simulations using the Stokes–Reynolds–Young–Laplace model for film drainage, under consideration of DLVO forces and a hydrodynamic slip to account for irregularities of the particle surface. CP-AFM measurements in the capillary force regime provide additional parameters for the modeling of salt flotation, such as the force and work of detachment. The contact angles of graphite and NMC particles during retraction and detachment from gas bubbles were obtained from a quasi-equilibrium model using CP-AFM data as input. All CP-AFM experiments and theoretical results suggest that pristine NMC particles do not attach to gas bubbles during flotation, which is confirmed by the low rate of NMC recovery in batch flotation tests.

1. Introduction

Black mass is the fine particle fraction that is produced in the (thermos-)mechanical recycling of end-of-life lithium-ion batteries (LIB) [1]. The liberated cathode and anode particles in the black mass can be separated by froth flotation [2,3] to create a feedstock for the hydrometallurgical extraction of Ni, Co, Li, and Mn. The purity, i.e., the grade of the products in the flotation process is determined by the likeliness of particle attachment to gas bubbles after collision [4], and by the three-phase contact angle of particles within the froth [5], both of which can be tailored by the chemistry of the process water. The attachment of a particle to a gas bubble requires the complete drainage of the liquid film between the particle and bubble. This first phase of particle–bubble interactions is governed by a combination of surface forces and hydrodynamic forces [6]. After the successful attachment of the particle to the gas bubble, the interaction is governed by capillary forces [7,8] that act at the three-phase contact between the particle and the bubble’s gas–liquid interface. The thermo-mechanical process route for the preparation of the flotation feedstock from LIB, and secondary resources in general, is continuously optimized and often still under development at the time when the design of the flotation process begins. This can result in the limited availability of sample material for the design of the flotation process. The interactions between individual particles and gas bubbles can be characterized by colloidal probe atomic force microscopy (CP-AFM) [9]. In combination with models for film drainage [6,10,11] and capillary interactions [7,12], it is possible to identify and quantify some of the key parameters for the simulation of flotation processes, including the hydrodynamic slip [13,14], the disjoining pressure [15], pull-off forces [16], and the dynamic three-phase contact angle of particles [17].
Lithium-intercalating mixed transition metal oxides, such as nickel manganese cobalt oxide (NMC) with variable stoichiometry, are one group of cathode active materials of modern LIB [18] that must be recovered from the black mass for economic, environmental, and legislative reasons. High-purity graphite is the most common anode material in LIB, and spheroidized graphite, also referred to as spherical graphite, is frequently used in the production of graphite anodes [19]. Pyrolysis is common for the removal of residual binder and electrolyte from the liberated electrode particles [20,21]. Black mass can be separated by froth flotation into a graphite-rich top product and a NMC-rich bottom product. For now, the froth flotation of battery black mass requires the combination of hydrocarbon frothers and collectors, e.g., methyl isobutyl carbinol (MIBC), together with non-polar oil [20]. In an agitated flotation cell, the aqueous black mass suspension is aerated by gas bubbles under strong turbulence [22], which causes collisions of black mass particles and gas bubbles. During collision, gas bubbles with surface tension γ can deform. The liquid film between particle and bubble drains with a rate that is determined by the interplay of hydrodynamic forces and surface forces, the relative velocity v , and the interaction geometry, including the shape and roughness of the particles. The surface forces are accounted for by the disjoining pressure Π , which can be calculated from DLVO theory and additional forces, such as hydrophobic forces, are considered for some systems.
A particle snaps into contact (snap-in) with a gas bubble when the local film height h r becomes zero, h r 0 nm, for attractive forces between bubble and particle. Alternatively, the rupture of the gas–liquid interface is possible when the Laplace pressure is exceeded considerably by a strongly repulsive pressure in the film. Tabor et al. [23] suggested that the bubble interface deforms and wraps around the particle without the transition into the capillary force regime at the snap-in, when the disjoining pressure equals the Laplace pressure Δ P L = Π . However, particles that successfully attach to the gas bubbles are then held in their wettability-dependent equilibrium position by capillary forces and if these are not exceeded, the particles are floated up to the top of the flotation cell, where they are integrated into the froth phase on top [24].
The enrichment of graphite particles is the goal in black mass flotation, yet often both particle types are present in the froth due to unselective particle–bubble attachment in the pulp and the entrainment of fine NMC particles [20]. The froth acts as an additional separation unit, given that the mobility of the NMC particles in the froth is higher than that of the graphite particles. Particles with high mobility within the froth interact only weakly with the gas–liquid interface of the particle-laden bubbles that form the froth, and they therefore can be detached from the interface and drain back into the pulp.
Black mass flotation is essentially a problem analogous to graphite flotation, but the presence of lithium bearing material is novel, and just started to gain attention in the context of LIB recycling [20,25]. In an aqueous environment, lithium ions deintercalate to a certain extent from lithium-containing transition metal oxides, such as NMC, upon contact with water [26].
Li intercalated +   H 2 O     Li + +   OH + 0.5   H 2
According to Equation (1), the NMC particles release lithium ions Li+ into the slurry, which leads to the formation of an equal amount of hydroxide ions OH, leading to an increase in the pH value in the first few minutes of flotation, which stabilizes at alkaline pH values above pH 10 [25,27], unless acid [28] or a pH-buffer are added to maintain a lower pH value.

1.1. Salt Flotation

Salt flotation is the froth flotation of naturally hydrophobic materials such as graphite or coal in concentrated salt solutions [29], without the use of flotation reagents like frothers or collectors. The products from salt flotation are free of hydrocarbon contaminations, which is favorable for hydrometallurgical downstream processes. Many inorganic salts increase the surface tension γ . It is therefore assumed that the coalescence of bubbles in the pulp and in the froth is inhibited by the increased surface tension γ that comes with high concentrations of structure-building salts. Sodium chloride (NaCl) is a weakly structure-building salt within the Hofmeister series and the increase in surface tension with rising NaCl concentration follows the linear trend ∆γ/∆c = 1.73 ± 0.17 mN / m mol / L [30].
Upon contact with electrolyte solutions, most particles will form a surface charge, of which the sign and value depend on the pH value and the particle material. At the point of zero charge, the surface charge becomes zero, and it is equal to the isoelectric point (IEP) for indifferent electrolytes, for which no specific adsorption of ions or molecules from the solution occurs [31]. In electrolyte solutions, the ions of the dissociated salts are arranged in electric double layers around bubbles and particles to compensate for the surface charges. The overlapping of these electric double layers results in the electric double layer forces, which can be tailored in their range and their magnitude by the choice of salt, concentration, and pH value. It was suggested that the best flotation results were obtained close to the IEP [29], which can be explained by the weaker electric double layer interactions at small values of the zeta potential   ζ . Particle surfaces are predominantly negatively charged in aqueous environments, and therefore cations determine the surface potential, whereas the type of anion has less influence on the recovery, e.g., of coal in salt flotation [29]. Another aspect in salt flotation is the solubility of gasses in aqueous salt solutions, which can be characterized by the salt-effect parameter k s c c , also referred to as Sechenov coefficient [32]. A decrease in gas solubility is referred to as ‘salting out’ ( k s c c > 0), and an increase in gas solubility is referred to as ‘salting in’ ( k s c c < 0) [32]. The solubility of nitrogen in water decreases by k s c c (T = 25 °C) = 0.134 L/mol upon NaCl addition, and by k s c c (T = 30 °C) = 0.105 L/mol for LiCl addition [32,33]. It is hypothesized that the reduced gas solubility enhances the flotation of graphite [34]. Gas supersaturation at hydrophobic particle surfaces can lead to the formation of nanobubbles associated with strongly attractive forces [35,36].
The economic and environmental feasibility of salt flotation is sensitive to the location of the flotation plant, the adjacent facilities at the site, and the purity requirements for the flotation products. The governing factors are availability and chemical composition of the process water for flotation, as well as the local options for reuse or disposal of the process water. Salt flotation will be particularly attractive for facilities in which aqueous salt solutions are used or produced in other processes, for example through brine purification [37], solution mining [38], or leaching processes as these are used for the purification of battery-grade graphite [39]. At these sites, the equipment for the process water treatment, such as tanks for precipitation of multivalent ions [37,40], is already in place. If the saline process water is not reused, it must be disposed of in compliance with environmental standards. Economic feasibility likely requires that the flotation site be therefore located in close proximity to reservoirs suitable for saline water, such as salt caverns. Alternatively, the saline waste water must be desalinated by either membrane technology or thermal processing [40,41]. The decreasing access to freshwater resources has also sparked interest in the combined effects of salt flotation and reagent-based flotation [42,43], which has the potential to save fresh water resources at reduced cost for flotation reagents.

1.2. Scope

Salt flotation has not yet been considered for NMC containing black mass. In the present study the forces between gas bubbles and NMC particles or spherical graphite particles in aqueous sodium chloride solutions with optional pH-buffer addition are quantified by CP-AFM. The technical focus of this study is the floatability assessment by colloidal probe atomic force microscopy on sessile gas bubbles, in combination with the associated models for the film drainage regime and the capillary interaction regime. This study aims to address current topics that are relevant not only for the colloidal science of flotation but also for circular economy and the sustainability of flotation processes. Interaction models are used to assess the floatability of graphite and NMC in salt solutions. The microprocesses of particle attachment (Section 3.3 and Section 3.4) and particle detachment (Section 3.5) are considered in separate experiments and models. The results on the microscale are compared to batch flotation tests (Section 3.6), using model black mass that is a mixture of the same particles used for CP-AFM, while particle–bubble hetero-coagulates that are formed during flotation are observed with an in-line camera probe. The successful application of salt flotation for the separation of NMC and graphite from LIB black mass would allow for the use of sustainable freshwater alternatives, such as industrial waste water.

2. Materials and Methods

2.1. Particles for CP-AFM

2.1.1. NMC

Lithium nickel manganese cobalt oxide LiNi(0.6)Mn(0.2)Co(0.2)O2 (HEDTM NCM-622 ET011; BASF SE, Ludwigshafen, Germany) is used to study the particle–bubble interactions of cathode active material particles in black mass by CP-AFM. In a froth flotation process, these NMC particles would be collected in the underflow product. The NMC batch of particles with a median diameter of x 50 , 3 = 9 µm contains some highly spherical particles (Figure 1a), while the smaller NMC particles are more potato-shaped. The detail scan of the surface of a spherical NMC particle in Figure 1b reveals areas that are 10–30 nm elevated from the median height level of the particle surface, with spikes of up to 300 nm. These surface irregularities presumably arise from the integration of primary particles into the surface of individual NMC particles during production.

2.1.2. Spherical Graphite

Spherical graphite particles are the desired top product in black mass flotation. High-purity spherical graphite (Pro-Graphite GmbH, Untergriesbach, Germany) with a carbon content of 99.95 % and a median particle diameter of x 50 , 3 = 17 µm was used to study the particle–bubble interactions of the anode material in black mass. Topography scans of spherical graphite in Figure 1c show mostly potato-shaped particles, some of which are close to spherical, making them suitable for use as a colloidal probe in CP-AFM. The detail scan of a spherical graphite surface in Figure 1d reveals the flake-like structure that is typical for graphite. Given the height of 100 nm to 200 nm of these flakes, they are macroscopic stacks of multilayered graphite, not the single graphite layers that can be detected via scanning of freshly cleaved highly ordered pyrolytic graphite (HOPG). Notably, the spherical graphite surface in Figure 1d is rugged, with over 500 nm deviation from the median height of the particle surface.

2.2. Salt Solutions and Surface Tension

All solutions used in zeta potential (Section 2.3) and AFM measurements (Section 2.4) were prepared using ultrapure water (Milli-Q RefA+, Merck, Darmstadt, Germany) with a conductivity value below 0.055 µS/cm and TOC   2 ppb total organic carbon. For the AFM measurements, three sodium chloride (≥99.5%, p.a., ACS, ISO, Carl Roth, Karlsruhe, Germany) solutions were prepared with concentrations of 1 mmol/L and 0.75 mol/L, as was a mixture of 0.75 mol/L with 0.01 mol/L sodium acetate buffer. The pH value of solutions without a buffer was adjusted to either pH 3, using hydrochloric acid (1 mol/L, prepared from 37% fuming hydrochloric acid, p.a., ISO, max. 0.005 ppm Hg, Carl Roth, Germany), or pH 10, using sodium hydroxide solution (1 mol/L, prepared from sodium hydroxide ≥98%, p.a., ISO, Carl Roth, Germany), before bubbles were generated for the AFM measurements (Section 2.4). The sodium acetate buffer solution was prepared by mixing solutions with 0.01 mol/L acetic acid (100%, Ph. Eur., extra pure, Carl Roth, Germany) and 0.01 mol/L sodium acetate (sodium acetate trihydrate ≥ 99%, p.a., ACS, ISO, Carl Roth, Germany) in a 5 to 1 ratio, resulting in a 0.75 mol/L NaCl + 0.01 mol/L NaOAc buffer solution with pH 3.5, while the pure buffer solution without sodium chloride had a pH value of pH 3.7.
The surface tension γ of gas bubbles in the solutions for AFM measurements (Table 1) was determined with a BP100 bubble pressure tensiometer (KRÜSS GmbH, Hamburg, Germany).

2.3. Zeta Potential

The zeta potentials of NMC particles ζ N M C and spherical graphite ζ S G in 1 mmol/L sodium chloride solution were determined from electrophoretic mobility measurements with a Zetasizer Nano ZS (Malvern Panalytical GmbH, Kassel, Germany) at 25 °C and a voltage of 40 V. Before the measurement, 0.04 wt.% particles were dispersed in the electrolyte solution by ultrasound using a sonotrode (SONOPULS HD 200, BANDELIN electronic GmbH & Co. KG, Berlin, Germany). The pH value of the measurements in the range of pH 3 to pH 10 was adjusted by titration with hydrochloric acid or sodium hydroxide solution with a concentration of 0.1 mol/L. Additionally, the zeta potentials at pH 3.7 were measured in the pure sodium acetate buffer solution with a concentration of 10 mmol/L. The zeta potential of gas bubbles in an aqueous sodium chloride solution was taken from Li et al. [44].

2.4. Atomic Force Microscope

The force between particles and sessile gas bubbles was measured by colloidal probe atomic force microscopy (CP-AFM), using a XE-100 AFM (Park Systems Corporation, Suwon, Republic of Korea) in combination with a long-range scan head with a 25 µm piezo scan range. Colloidal probes (CP) were prepared by gluing a particle of interest to cantilevers using water insoluble epoxy resin (UHU Endfest, UHU GmbH, Bühl/Baden, Germany). For the measurement of the force before and during attachment to the gas bubbles, ‘HQ:CSC38/tipless/No Al-B’ (MikroMasch Europe, Wetzlar, Germany) cantilevers with low spring constant in the range of k c = 0.048 0.067 N/m were used to resolve the forces during film drainage. Full–force position curves were measured with ‘TL-NCL’ (NANOSENSORS™, NanoWorld AG, Neuchâtel, Switzerland) cantilevers with a high spring constant of k c = 39.2 N/m, enabling force measurement during particle detachment from sessile gas bubbles. Values for k c and the AB-sensitivity were determined with the procedure described in [7]. Sessile gas bubbles for CP-AFM measurements were generated by the immersion of a silanized Si-wafer (10 mm × 10 mm, 105° equilibrium wetting angle) into the AFM sample dish filled with electrolyte solution using thoroughly cleaned tweezers. The sudden wetting of the hydrophobic wafer upon immersion leads to the formation of sessile gas bubbles where the advancing gas–liquid interfaces from different directions meet. The liquid level was reduced with a syringe and the bubble sample transferred to the AFM. The bubble sample and the colloidal probe for each measurement were then concentrically aligned (Figure 2) using the AFM’s top view light microscope and the micrometer screws of the xy-tray for position control. The CP was positioned approximately 1 µm above the sessile bubble using the AFM’s stepper motor. The CP-cantilever was then driven towards the bubble with a constant piezo displacement rate v = d X t d t = 30 µm/s and then retracted once either the maximal piezo displacement Δ X m a x or the specified force limit was reached. The number of data points that can be recorded with the XE-100 is 4096 for both trace curve (approach) and retrace curve (retraction). The maximum piezo displacement was set to Δ X m a x 2 µm for the film drainage measurements to ensure a high number of data points at close contact between gas bubbles and particles. The properties of the CP-cantilever and the bubble for each measurement, together with the number of measurements that were used for the calculation of median force–position curves and their 80% confidence intervals from the raw data, are listed in Supplementary Material S2.1.

2.5. Modeling of Particle–Bubble Interactions

2.5.1. Stokes–Reynolds–Young–Laplace Model

The drainage of the liquid film during a particle–bubble interaction in the AFM geometry (Figure 2) up to the moment of particle attachment to the gas–liquid interface can be simulated with the Stokes–Reynolds–Young–Laplace model (SRYL) [23]. The model yields force–position curves that can be compared with experimental CP-AFM measurements for interactions involving deformable bubbles [45,46,47] or drops [48]. Gas compressibility only has a small effect on the calculated force response and it is therefore not considered [6]. The SRYL-model assumes rotational symmetry, concentric alignment of the colloidal probe particle with the gas bubble, and, in case of particle–bubble interactions, a perfectly spherical particle.
The position of the cantilever tip relative to the substrate in Figure 2 is given by D t   =   S t + X t , where X t is the mounting point of the cantilever on the AFM’s piezo. The cantilever deflection S t follows Hooke’s law S t = F t / k c , and accordingly S t is proportional to the force F t that is applied to the tip of the cantilever with spring constant k c . The force acting on a colloidal probe particle during film drainage Equation (2) is the integral over the total pressure ( p + Π ) in the interaction zone r r m a x in cylinder coordinates, where the height of the film is the lowest. The pressure outside of the interaction zone for r > r m a x is insignificant for particle–bubble interactions involving small particles with a radius below 20 µm.
F t = 2 π 0 r m a x p r , t + Π r , t r   d r
The film height h r , t between particle and gas bubble depends on the hydrodynamic pressure p r , t and the disjoining pressure Π r , t in the film. Under external stress, gas bubbles can deform, resulting in a change in the local film height h r , t , and the out- or in-flow of liquid to the film. In the SRYL, the model’s film height h r , t is calculated using the Stokes–Reynolds Equation under consideration of the lubrication approximation [48,49,50], which implies a pressure-driven flow in the radial direction and a constant pressure over the height of the thin film. If the flow velocity is zero on both the bubble and the particle surface ( v s , h = v s , 0 = 0 ), the interfaces are considered to be fully immobile, and Equation (3) can be used for the change in the local film height h r , t t in the SRYL-model.
h t = 1 12 η r   r r h 3 p r
h t = 1 12 η r   r r h 3 p r + 1 4 η r   r r b 0 + b h h 3 + 4 b 0 b h h 2 h + b 0 + b h p r
At partially immobile interfaces, the tangential slip velocity v s , i at the interface has a non-zero value v s , i = b i v B z , with the slip length b i [51]. The slip velocity is assumed to be proportional to the bulk shear stress [51], which is defined by the flow velocity in the bulk v B (Figure 2). The change in the film height for such partially immobile interfaces is modeled by an additional term to account for the hydrodynamic slip lengths b 0 at the bubble interface and b h at the particle interface in Equation (4). The parameters b 0 and b h can be considered as virtual end points of the flow profile, located at a distance b 0 below the bubble interface and a distance b h above the particle interface (Figure 2). For b 0 = b h = 0 , Equation (4) reduces back to Equation (3). If either slip length is b 0 = 0 or b h = 0 , the second term in Equation (4) becomes 1 4 η r   r r b 0 + b h h 3 h + b 0 + b h p r . This results in the simplified Equation (5) for h r , t t [47,52], which contains only a single slip length parameter b .
h t = 1 12 η r   r r h 3 p r + 1 4 η r   r r b h 3 h + b p r
Under the influence of external pressure ( p + Π ) , the bubble interface can be displaced with surface tension γ , which changes the local film height h r , t . This is accounted for by the Augmented Young–Laplace Equation, Equation (6), in linearized form, in which the height of the bubble interface profile z b r , t is substituted by the film height h r , t [6]. The term ‘Augmented’ refers to the consideration of the disjoining pressure due to surface forces in the Young–Laplace Equation [53]. It further implies the additivity of the hydrodynamic pressure p r , t and disjoining pressure Π r , t . Equation (6) accounts for the bubble interface profile, determining the film height h r , t for a given radial pressure profile p r , t + Π r , t . The first term on the right-hand side is linked to the Laplace pressure, but it is not exactly the Laplace pressure of the bubble, since R n given by Equation (7) is the effective radius of the interaction. This comes from the substitution of z b r , t by h r , t [6], using the geometrical relationship S t + X t = z b r , t + h r , t + z p r in Figure 2.
γ r r r h r = 2 γ R n Π p
R n = 1 R b + 1 R C P 1
The Augmented Young–Laplace Equation, Equation (6), and the Stokes–Reynolds Equation, Equation (4), are coupled through the hydrodynamic pressure p r , t . The boundary condition Equation (8) accounts for the change in the film height at the end of the interaction zone at r = r m a x [6]. In Equation (8), d X t d t = v is the displacement rate of the AFM’s piezo, defining the approach velocity v , and 1 k c accounts for the spring-like cantilever.
h r m a x , t t = d X t d t + 1 k c 1 2 π γ l o g r m a x 2 R b + B θ 0 d F t d t
r p r m a x r + 4 p = 0
The influence of the bubbles three-phase contact line with the substrate is accounted for by B θ 0 in Equation (8), which depends on the initial three-phase contact angle at the substrate. Two different functions for B θ 0 are available to account for either a pinned contact line, or a sliding contact line [6]. In the present study, the three-phase contact line is considered to be pinned, described by B θ b = 1 + 1 2 log 1 + cos θ 0 1 cos θ 0 . The pressure boundary condition Equation (9) at r = r m a x implies that the pressure outside of the interaction zone decays rapidly as r 4 for r [6,45]. The remaining boundary conditions Equations (10) and (11) come from axial symmetry.
h r = 0 r = 0
p r = 0 r = 0
The initial film profile in the interaction zone is approximated by Equation (12), in which h 0 is the initial separation of the interfaces is r = 0 [6].
h r , t 0 = h 0 + r 2 2 R n
The equations of the model are scaled with the capillary number Equation (13) to ease the numerical solution [6]. The time ( t ) is scaled with s t = C a 1 2   R n / v , the force ( F ) is scaled with s F = C a 1 2   R n γ , the pressures (p, Π ) are scaled with s P =   γ / R n , and all variables and parameter in length units ( r , h , b ) are scaled with the factor s L = C a 1 4   R n .
C a = η v γ
Equations (4) and (6), in combination with the boundary conditions Equations (8)–(11) and the initial condition Equation (12), were discretized with the finite difference method, using central differences after scaling. The force integral Equation (2) is evaluated by the Simpson rule [6]. The resulting differential algebraic equation system was then solved in MATLAB R2022b using the ODE15s solver, as outlined in [6], with a total of 500 equidistant grid points on r i 0 , r m a x .

2.5.2. Disjoining Pressure

The disjoining pressure Π h (Equation (14)) is the change in the interaction energy per unit area d E h associated with a change in the film height d h for two surfaces that are separated by a thin liquid film of height h . Within the DLVO theory Π is the sum Π h = Π E D L h + Π v d W h of the disjoining pressures for electric double layer forces Π E D L h and van der Waals forces Π v d W h . Additional forces, such as hydrophobic forces, are frequently considered [54,55,56].
Π h = d E h d h = Π j h

2.5.3. Electric Double Layer

Electric double layer interactions play a dominant role in aqueous salt solutions. The Hogg–Healy–Fuerstenau equation (HHF) [56,57,58] for the interaction of dissimilar surfaces with weakly overlapping electric double layers Equation (15) is suitable to calculate Π E D L for particle–bubble interactions. This expression gives the disjoining pressure Π E D L between two dissimilar flat surface elements with surface potentials ψ 1 and ψ 2 , which are separated by a flat electrolyte film of thickness h . Equation (15) assumes constant surface potential [57], meaning that charge regulation can occur at close separations in order to maintain a constant surface potential [58]. The inverse Debye length κ for dissolved electrolytes with ionic strength z i and a concentration of c i in Equation (15) can be calculated from Equation (16). The Debye length κ 1 is the characteristic decay length for the potential [59] of the diffuse electric double layer that forms around bubbles and particles in the presence of electrolytes. The other parameters in Equation (16) are the dielectric permittivity of vacuum ε 0 , the dielectric permittivity of water ε , the Avogadro constant N A , the Boltzmann constant k b , and the temperature T in K .
Π E D L = ε 0 ε κ 2 2 2 ψ 1 ψ 2 cosh κ h ψ 1 2 ψ 2 2 sinh 2 κ h
κ = F 2 z i 2 c i ε 0 ε N A k b T
Neither Equation (15) nor Equation (16) account for specific adsorption of ions or the non-electrostatic size effects that are associated with the ion specific Hofmeister effects [60]. For black mass particles, no specific adsorption or Hofmeister effects are expected in the 1:1 electrolyte solutions that contain only sodium chloride and trace amounts of lithium from NMC colloidal probes. An increase in the electrolyte concentration c i compresses the electric double layer, and the zeta potential decreases, while the true surface potential ψ i is unaffected by the electrolyte concentration c i . Since ψ i is not accessible by experiments, the zeta potential ζ i from experiments at low electrolyte concentration c i 0.01 mol/L is used to approximate the surface potential using ψ i ζ i in Equation (15) for the calculation of Π E D L , similarly to [61,62,63,64,65].

2.5.4. Van der Waals Interactions

The second contribution to the total disjoining pressure Π in the DLVO-theory comes from van der Waals (vdW) forces, which are the sum of London, Keesom, and Debye interactions [59]. The vdW forces for the interaction of material 1 with material 2, separated by a third medium 3, are accounted for by a Hamaker coefficient A 132 . The Hamaker coefficient is either taken as constant A 132 , or if available a distance dependent Hamaker function A 132 h is used, that considers the rapid decay of the interaction energy at larger separations [66] above ~15 nm [67] due to retardation. For a known Hamaker coefficient, the disjoining pressure between two plates can be calculated by Equation (17) [56].
Π vdW h = A 132 6 π h 3
The Hamaker coefficient A 132 h describes the strength and sign of the vdW forces between interacting surfaces at small distances of ~10 nm and below. For chemically identical half spaces (material 1 and material 2 are the same), the vdW forces are generally attractive ( A 132 h > 0 ), whereas for two unlike surfaces the interaction can be either attractive ( A 132 h > 0 ) or repulsive ( A 132 h < 0 ), depending on the material chemistry and the dielectric medium (material 3) separating the two half spaces. The Lifshitz theory [68,69,70,71] is the preferred method for the calculation of accurate Hamaker coefficients and requires dielectric information about the interacting materials. In Lifshitz calculations, the imaginary dielectric response function ε i ξ n is evaluated at the dimensionless Matsubara frequencies ξ n along the imaginary frequency axis. ε i ξ n can be obtained directly from Kramers–Kroning analysis if the dielectric data is known over a wide frequency range [72]. Alternatively, the Ninham–Parsegian representation can be used for modeling of ε i ξ n [68].
Currently, no detailed dielectric data is available for modern cathode active materials, including the NMC used in the present study. An approximation of the Hamaker constant for NMC from the dielectric data for the individual metal oxides, such as NiO, CoO2 or MnO2, is inappropriate since NMC is a complex oxide material and can have a wide range of dielectric properties. Another aspect is the intercalation of lithium into cathode active materials because the amount of intercalated lithium determines the charge density of the active material, strongly influencing the optical properties of the materials LixNi1-xO and LixCoO2 [73]. Therefore, a wide range of Hamaker coefficients has to be expected for the cathode active material particles from recycled LIB, due to varying amounts of intercalated Lithium.
Graphite has a two-dimensional anisotropic dielectric permittivity because of its 2D-layer structure, which must be accounted for in Lifshitz calculations for the Hamaker coefficient of interactions involving graphite. Dagastine et al. [72] calculated the Hamaker functions A 131 h between two graphite half spaces separated by a third medium under consideration of the optical anisotropy by using the modal analysis approach [72]. This formulation of the Lifshitz theory is unsuitable to account for interactions between dissimilar half spaces, meaning it cannot be used to calculate A 132 h for the interaction between graphite and a gas bubble relevant for flotation. However, with the dielectric permittivities of graphite in the direction of the ordinary axis ε o and the extraordinary axis ε e from [72], it is possible to model the spherical graphite as turbostratic graphite with an effective dielectric permittivity ε e f f , which can be calculated by the Maxwell Garnett Theory [74,75]. The approximated Hamaker function A 132 h for the interaction [graphite−H2O−air], the details of its calculation, and the corresponding disjoining pressure from Equation (17) are provided in the Supplementary Material S1. The corresponding Hamaker constant evaluated at h = 0.157 nm is A 132 = 6.6 × 10 20 J for the interaction between the gas phase and graphite in water.
High electrolyte concentrations reduce the strength of vdW forces through the screening of the zero-frequency term in the Hamaker function by the factor 1 + 2 κ h e 2 κ h , since it is of electrostatic nature [76]. However, the screening only becomes relevant at small distances h < 1 nm, and it does not need further consideration for the highest salt concentration of 0.75 mol/L 1:1 electrolyte ( κ 1 = 0.35 nm) in this study.

2.5.5. Capillary Interactions

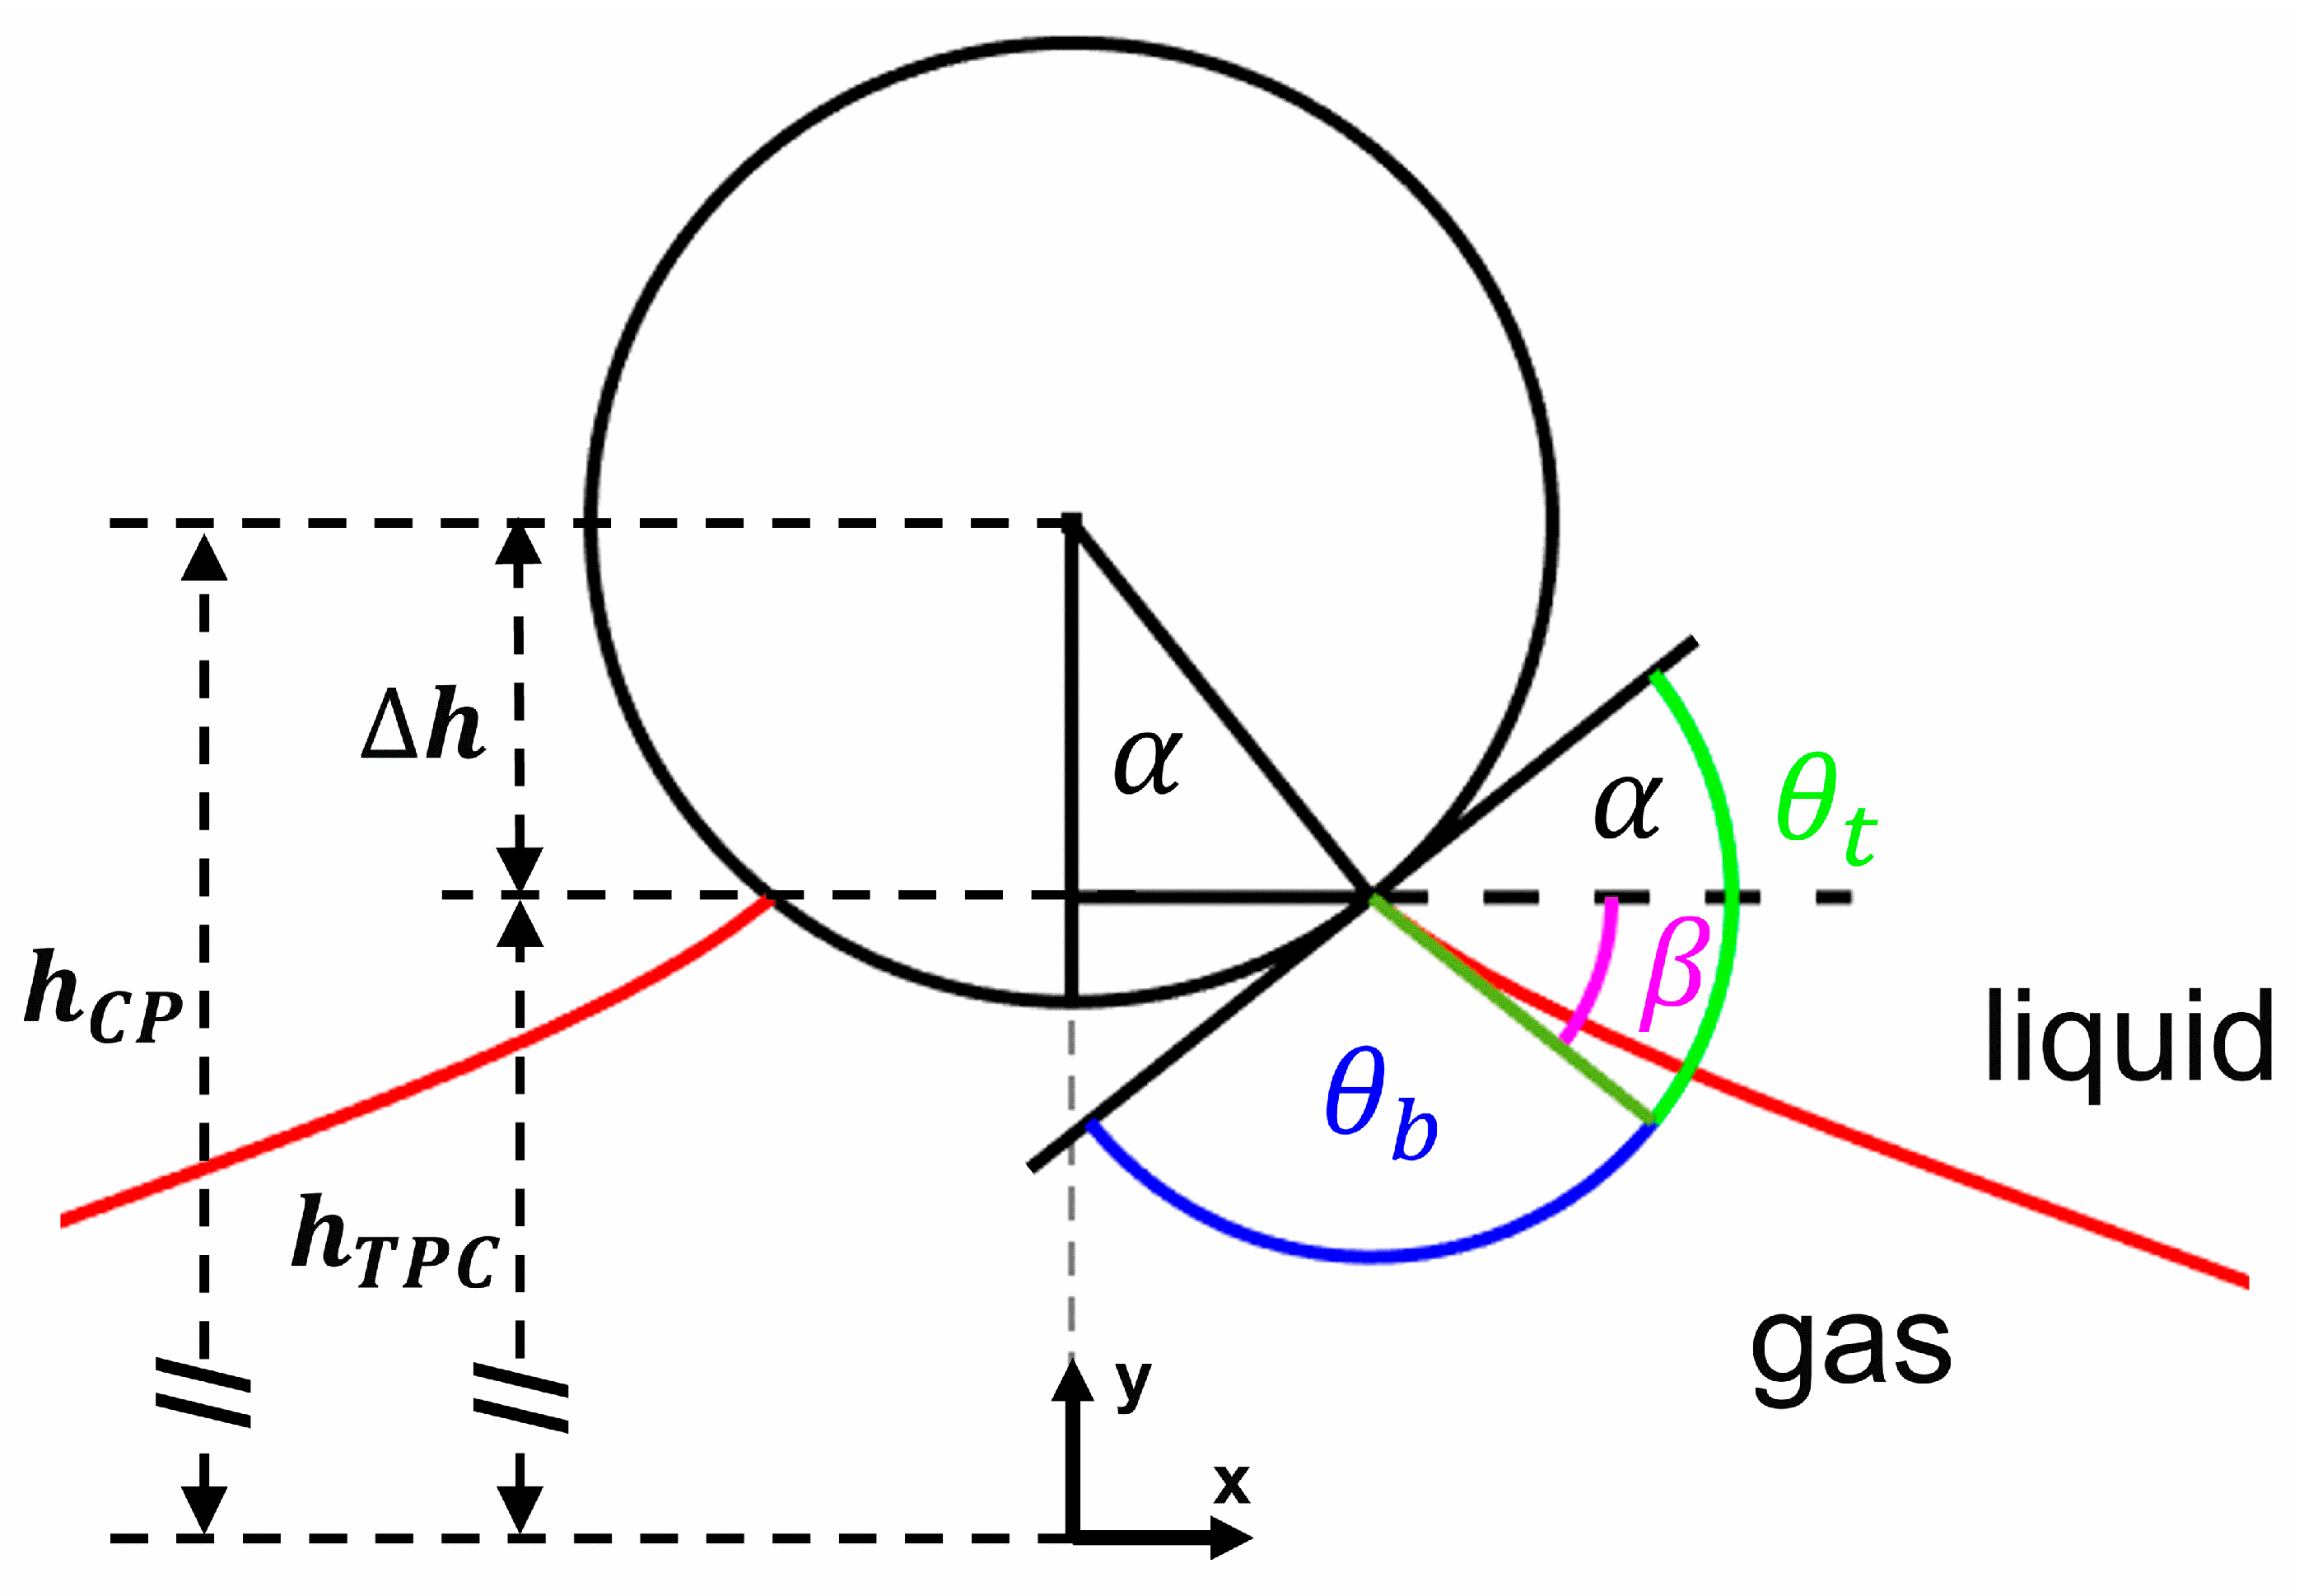
The particle attachment to the gas–liquid interface is characterized by the formation of a three-phase contact line (TPCL), and the interaction is then governed by the capillary force that arises from the surface tension γ . The position of the TPCL on the surface of a colloidal probe particle (Figure 3) was calculated from AFM force–position curves using the quasi-equilibrium model from [7]. The model is based on the approach of Sherman et al. [77] to link the force balance at the TPCL to the bubble interface profile via the Lagrange multiplier λ that has a value close to the Laplace pressure, Equation (18) of the bubble Δ P L . Gravitational effects are not considered in the quasi-equilibrium model [7] since both the bubble and particle are significantly smaller than the capillary length l c a p = γ / g Δ ρ in CP-AFM experiments.
Δ P L = 2 γ R b
The opening angle α and the inclination of the meniscus at the TPCL β in Figure 3 define both the force at the TPCL Equation (19) and the upper phase contact angle θ t in Equation (20). The first term in Equation (19) accounts for the capillary force, and the second term is the additional pressure force caused by the pressure difference λ Δ P L over the curved interface. θ t is related to the three-phase contact angle with respect to the bottom phase θ b by θ t + θ b = 180 ° .
F j α ,   β = 2 π γ R C P sin α sin β + π R C P 2 sin 2 α λ
θ t = α + β
The distance Δ h between the TPCL and the particle center in Figure 3 is defined by Equation (21) and is linked to the opening angle α by the geometric relationship Equation (22).
Δ h =   h C P h T P C   with   Δ h R C P , R C P
α = cos 1 Δ h R C P
The angles α , β , and θ t at the TPCL for the CP-AFM measurements on sessile gas bubbles were calculated with the quasi-equilibrium model from [7], utilizing the combination of force, work, and h C P data from CP-AFM as input. The model assumes a smooth spherical particle, axial symmetry, and a circular TPCL. With Equations (21) and (22), the force at the TPCL F j α ,   β can be expressed as a function of Δ h and θ t . The moment just before the dewetting of the particle corresponds to Δ h = R C P and θ t = 0 °. The integration of F j Δ h , θ t results in an expression for the work Δ E Δ h , θ t that is required to move the TPCL into a certain Δ h - θ t -configuration [7]. The equations for the force and work are expressed in terms of the scaled depth of particle immersion X =   Δ h R C P in the range 1 , 1 and the scaled contact angle Y   =   θ t π in the range 0 , 1 in place of Δ h and θ t .
F ext X , Y = 2 π γ R C P 1 X 2 sin π Y cos 1 X + π R C P 2 sin 2 cos 1 X λ
Δ E X , Y = 2 3 π γ R C P 2 X X 2 3 sin π Y + 1 X 2 3 / 2 cos π Y λ π R C P 3 2 3 X + X 3 3
The combined set of equations Equations (23) and (24) for the force and work is solved for X and Y with the MATLAB R2022b function vpasolve, using F e x t and Δ E from full AFM force–position curves (trace and retrace including particle detachment) as the input on the left-hand side. The calculation of Δ E from AFM data and further details of the model are discussed in [7,8]. With the known values of α and β it is now possible to calculate the bubble interface profile with the modified Young–Laplace Equation in the parametric representation, shown in Equations (25)–(27).
d x d s = cos ɸ
d y d s = sin ɸ
d ɸ d s = y + λ γ g Δ ρ sin ɸ x
In this representation, x = r / l c a p and y = y / l c a p are the radial coordinate and the height of the bubble interface scaled by the capillary length l c a p . ɸ is defined by the local inclination of the bubble interface profile d h d r = tan ɸ . Equations (25)–(27) are solved by the approximation of the boundary value problem as an initial value problem and λ is optimized in order to fulfill the constant volume constraint [7,77]. The initial values at the TPCL are x T P C L , y T P C L , and ɸ T P C L =   π β .

2.6. Flotation Tests

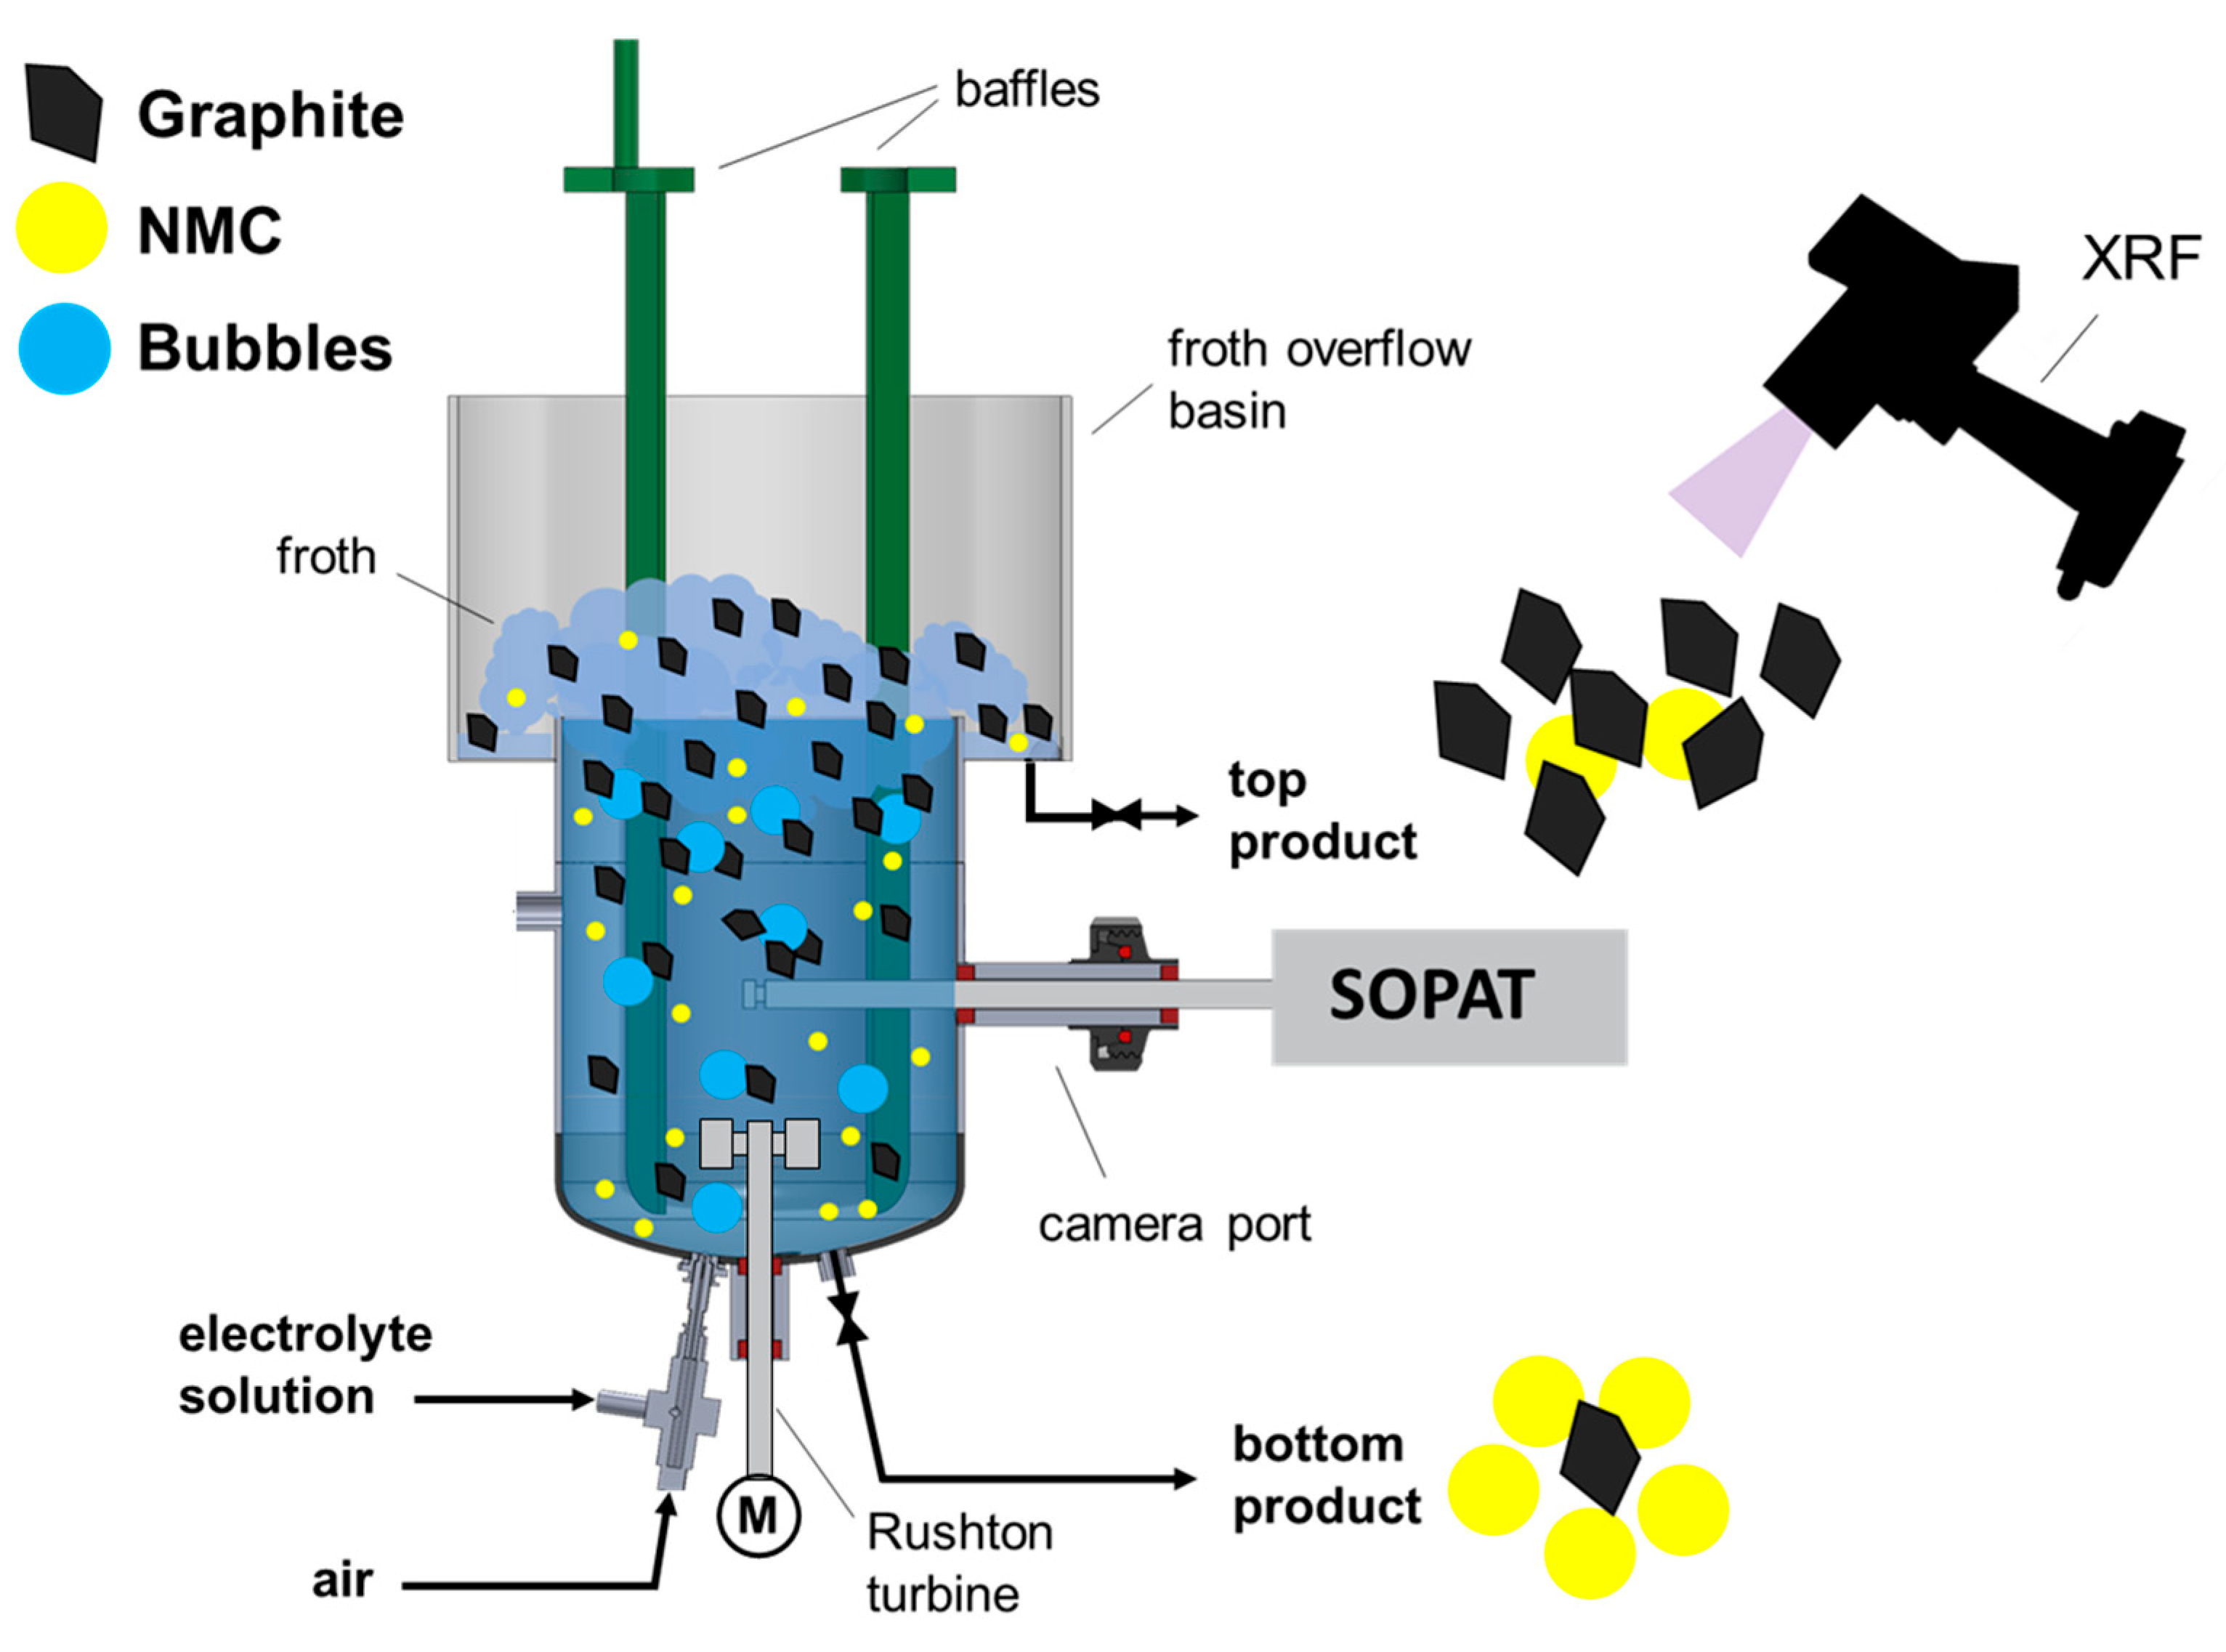
Single-stage batch flotation tests in 1:1 electrolyte solution were carried out in the aerated stirred tank with an overflow basin for froth flotation, as shown in Figure 4. A 1:1 model black mass mixture by weight, containing 12 g spherical graphite and 12 g NMC, was used as particle feed. The stirred tank with 5 L volume and a diameter of 160 mm is equipped with 4 removable baffles and a Rushton turbine (5 mm diameter). Gas bubbles are introduced into the stirred tank from the bottom by a two-phase jet nozzle. The nozzle from [8] is fed with pressurized air (5 bar) and electrolyte solution from a reservoir tank via a gear pump. The in-line camera probe SOPAT Pl (SOPAT GmbH, Berlin, Germany) is introduced into the stirred tank through a port at half height of the tank to capture images of the particle–bubble hetero-coagulates that are formed during flotation, which is the reason for the diluted flotation system with initial solid content of 0.48 wt.%.
Three sets of flotation tests were performed, with the first at pH 3, the second at pH 10, and the third with addition of 0.01 mol/L NaOAc buffer. Salt solutions were prepared for the flotation tests by the dissolution of sodium chloride in deionized water in a stirred reservoir tank. The pH value of the electrolyte solution was then adjusted to pH 3 or pH 10 for experiments in pure 0.75 mol/L sodium chloride solution. For experiments with the buffer solution at pH 3.5, the addition of 0.0016 mol/L acetic acid and 0.0083 mol/L sodium acetate takes the place of the pH adjustment.
The model black mass feed was then dispersed in the flotation tank, filled with 4.65 L of the salt solution, at 1200 rpm for 3 min. For experiments at acidic pH, the process water was adjusted again to pH 3 after addition of the feed. The baffles were then mounted in the stirred tank, and the remaining 0.350 L salt solution was added. The flotation tests, at a stirring rate of 1200 rpm, are started immediately after by activating the two-phase jet nozzle for bubble generation, which also feeds fresh electrolyte solution into the stirred tank. No additional water needs to be added in order to keep the pulp level constant during batch flotation experiments. The top product was collected in five concentrates (C1–C5) at t 1 = 2 min, t 2 = 4 min, t 3 = 6 min, t 4 = 8 min, and t 5 = 12 min.

Product Analysis

The products of the flotation tests were analyzed with the X-ray fluorescence spectrometer (XRF) Niton XL5 plus (Thermo Fisher Scientific, Waltham, MA, USA, purchased via analyticon instruments GmbH, Rosbach v. d. Höhe, Germany) to determine the content in terms of NMC and graphite. The flotation products were washed three times with ultrapure water in a centrifuge ( 10 4 × g , 2 min) in order to remove the sodium chloride from the products. The samples were dried in an oven at 90 °C, and subsequently evaluated by a combined gravimetric and XRF analysis, for which the samples were homogenized with a mortar. The main components of pure NMC are 57.8 wt.% Nickel, 18.7 wt.% Manganese and 20.0 wt.% Cobalt. These elements can be identified directly from the measurements by the XRF-software (NitonConnect version 2.5.0.1433 with material database version 9.10, Thermo Fisher Scientific, Waltham, MA, USA). Carbonous materials such as graphite are not directly detectable by XRF, but enter the mass balance as an inert component. The graphite content in the mixtures corresponds to the inert component that is provided in the XRF-software, since the model black mass is a binary graphite–NMC mixture.
The recovery of particles into the concentrate is defined by R t = C 0 C t C 0 , and C 0 is the initial particle concentration in the pulp [78]. For a constant height of the pulp, the recovery of material i can be calculated from the mass of recovered particles m i t by R i t = m i , 0 m i t m i , 0 . The kinetics of particle recovery by true flotation are described by the first-order flotation kinetics [78], Equation (28), with rate constant k i , and the ultimate recovery that is defined by R i , = R i t 5 .
R i t = R i , 1 exp k i t
Particles that are recovered by hydraulic entrainment reach the flotation product without attachment to gas bubbles. The recovery of particles by entrainment is a function of the recovered process water [78].

3. Results and Discussion

3.1. Zeta Potential of NMC and Graphite

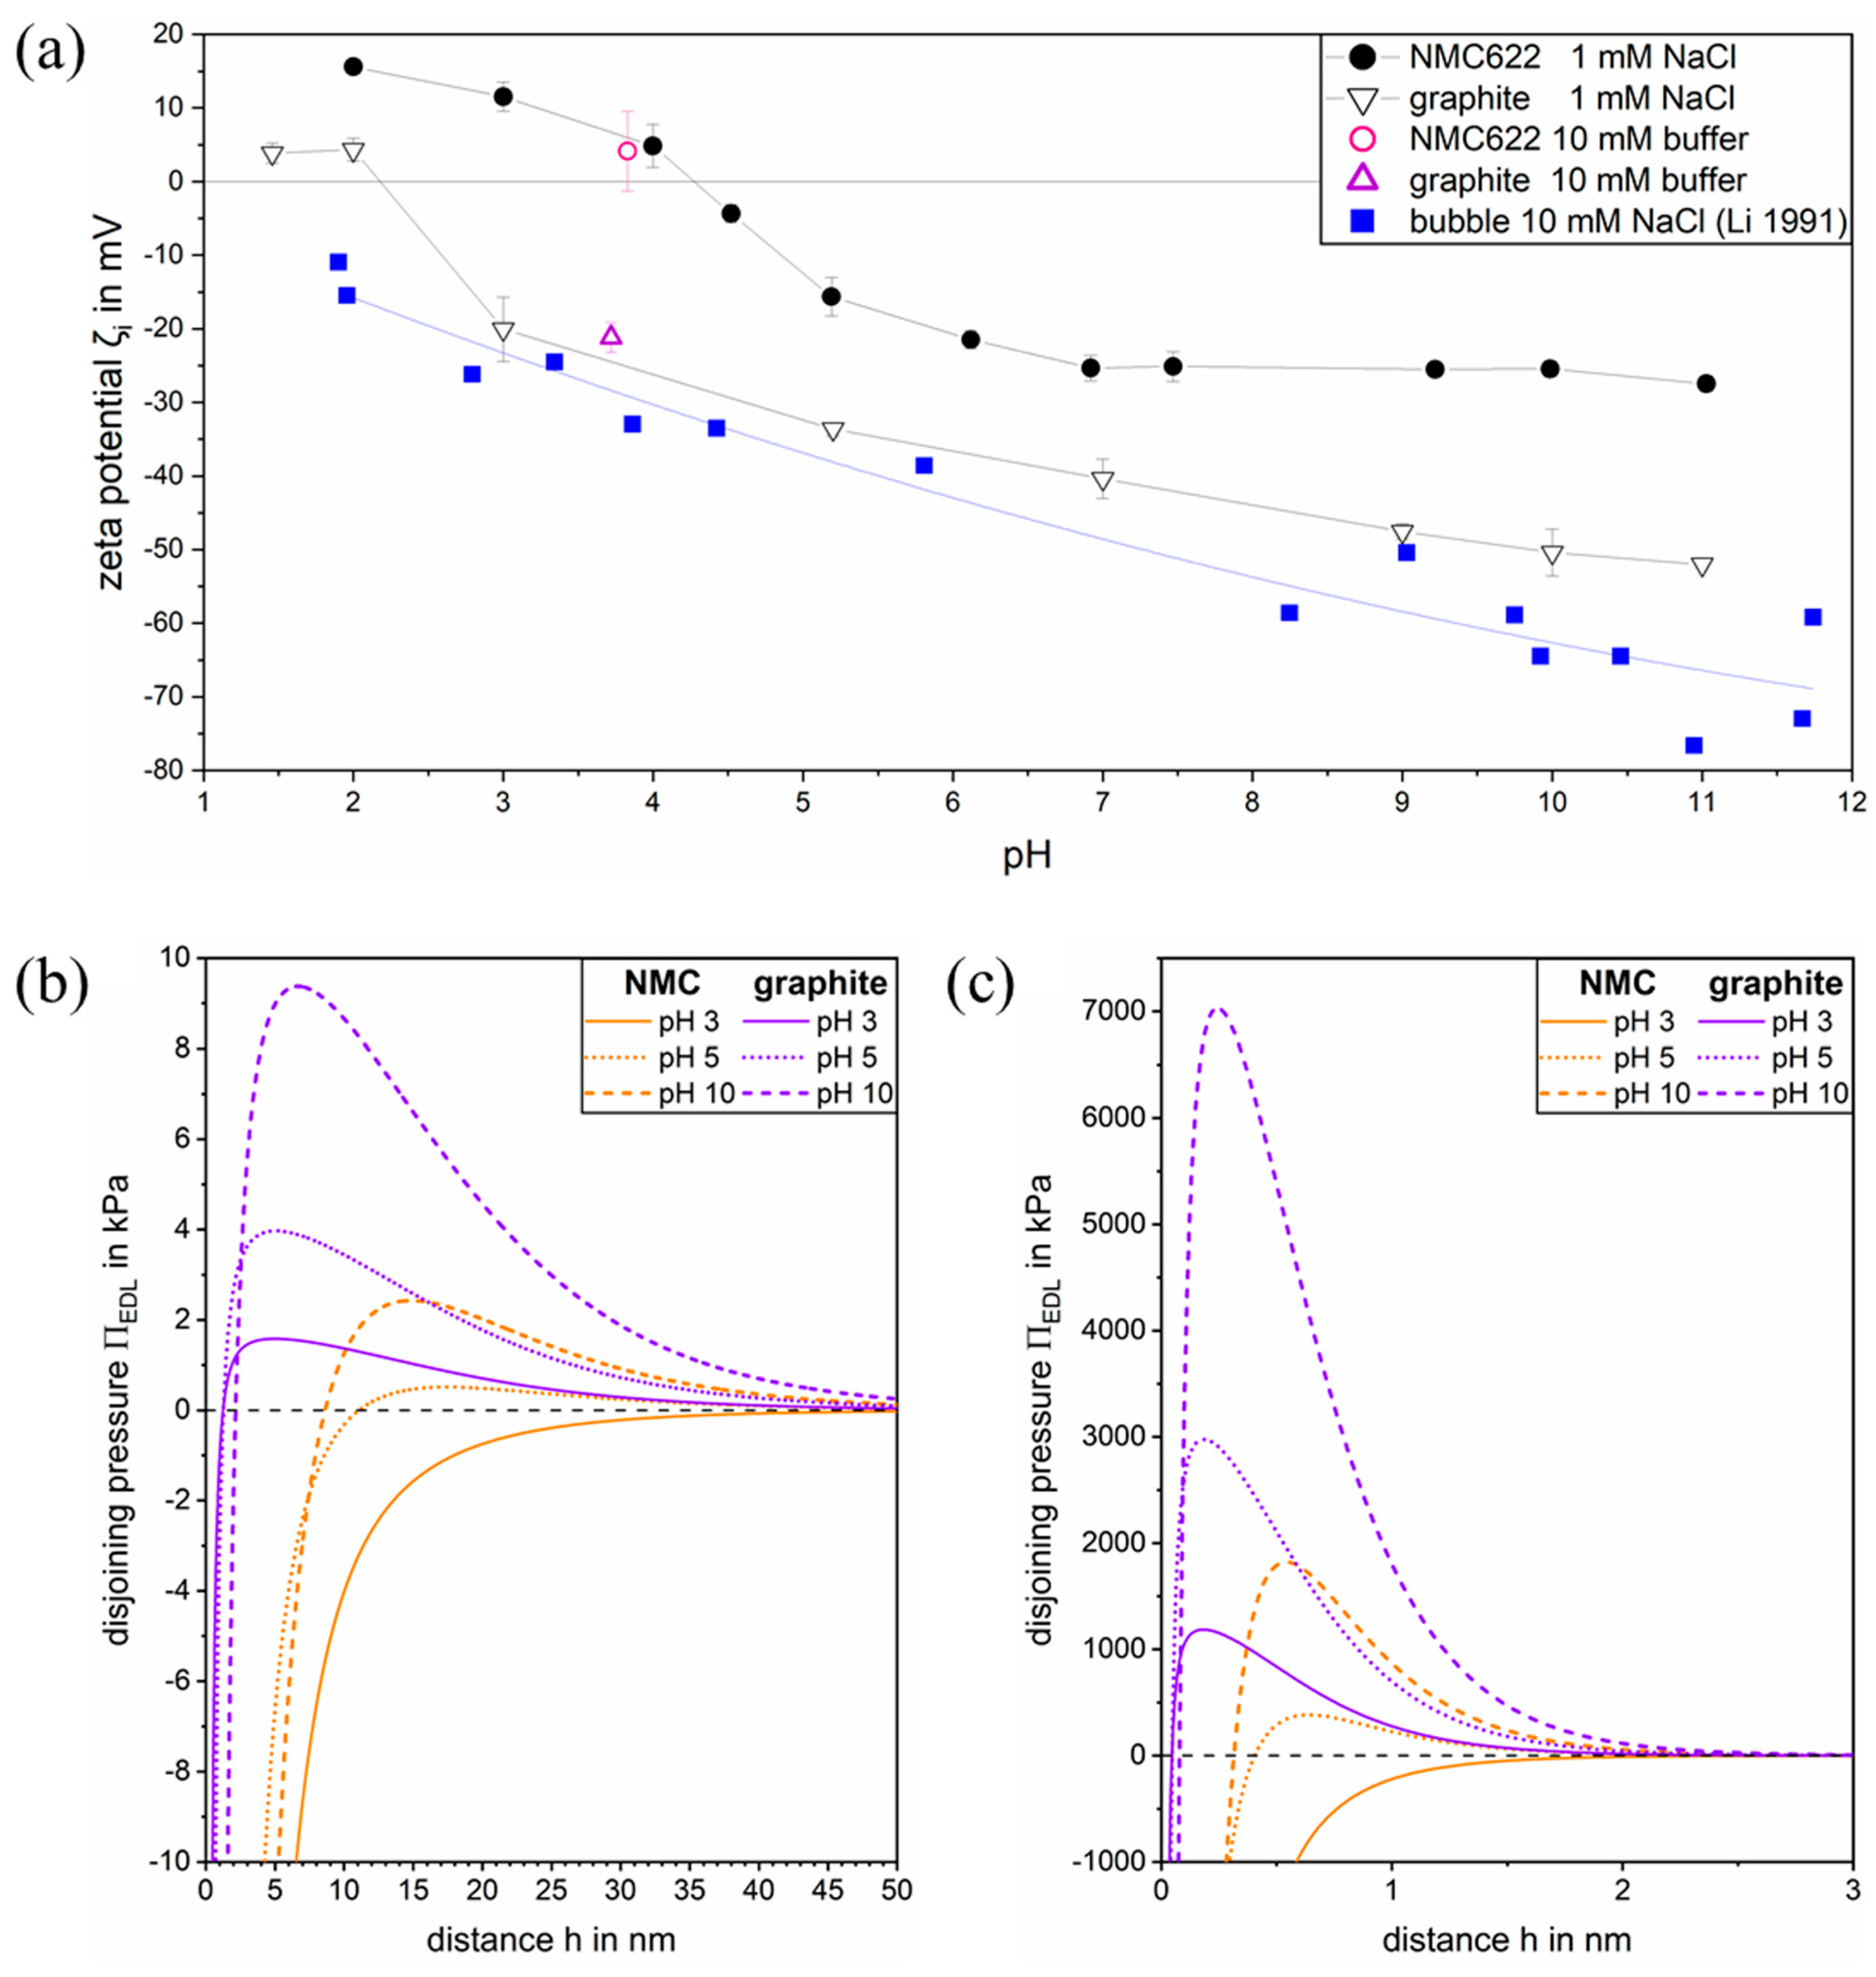
The zeta potentials of the model black mass particles NMC and spherical graphite in sodium chloride solution are compared with the zeta potential of gas bubbles for different pH values in Figure 5a. NMC has the highest zeta-potentials ζ N M C pH for all pH values, followed by spherical graphite ζ S G pH . The gas bubbles have the most negative zeta potential ζ b u b b l e pH in the 1:1 electrolyte solution, and no specific adsorption effects are present. Notably the zeta potential–pH-titration curves do not intercept, thus ζ N M C > ζ S G > ζ b u b b l e at all pH values.
The isoelectric point (IEP) of the NMC particles in a 1 mmol/L sodium chloride solution is at pH 4.3. At a pH value above the IEP, the zeta-potential of NMC is negative and plateaus at ζ N M C = −25 mV for pH ≥ pH 7. For pH < IEP, the zeta potential of NMC rises to ζ N M C = 11 mV at pH 3.
The spherical graphite has its isoelectric point between pH 2 and pH 3. Below pH 2, the zeta potential plateaus at ζ S G = 4 mV. For a pH above the IEP of spherical graphite, the zeta potential becomes strongly negative and decreases to ζ S G = −50 mV at pH 10.
For gas bubbles the isoelectric point is located below pH 2. With increasing pH values, the gas bubble zeta potential becomes strongly negative, reaching ζ b u b b l e ≈ −60 mV at pH 10.
Zeta potentials measured for NMC and spherical graphite in a 10 mmol/L sodium acetate buffer solution at pH 3.7 (Section 2.2) lie directly on the data for sodium chloride solution in Figure 5a, suggesting that the ions of the buffer do not specifically adsorb on graphite or NMC. The ions of the sodium acetate buffer can therefore be seen as simple 1:1 electrolytes despite the asymmetric ion pair in sodium acetate.

3.2. Electric Double Layer Disjoining Pressure in 1:1 Electrolyte Solution

The electric double layer contributions of the disjoining pressure Π E D L h for encounters of gas bubbles with NMC and spherical graphite for pH 3 to pH 10 are shown in Figure 5b,c. It is assumed that the surface potentials ψ i are unaffected by the salt concentration c i and approximately equal to the zeta potential at a low concentration c i 0.01 mol/L (Section 2.5.3), and therefore Π E D L h was calculated by Equation (15) with ψ i ζ i , using the ζ i (pH) from Figure 5a. The electric double layer repulsion in Figure 5b,c is the strongest at pH 10 for all encounters. Raising the pH value increases the repulsive disjoining pressure even further since the absolute values of zeta potentials for bubbles and spherical graphite in Figure 5a do not plateau at high pH values. Figure 5b shows interactions at a concentration of 1 mmol/L for which the Debye length is κ 1 = 9.6 nm. At pH 3, the disjoining pressure Π E D L h for NMC (Figure 5b) is attractive for separations below h = 50 nm. At pH 5 the disjoining pressure for NMC is weakly repulsive > 11 nm. At pH 10 the maximum repulsive disjoining pressure is Π E D L = 2.43 kPa, and the electric double layer disjoining pressure only becomes attractive for separations below h = 8.6 nm.
The interaction of spherical graphite with gas bubbles at a concentration of 1 mmol/L in Figure 5b is characterized by a higher repulsive disjoining pressure Π E D L compared to the interactions involving NMC. At pH 3, the maximum repulsive disjoining pressure for spherical graphite is Π E D L = 1.58 kPa and Π E D L is attractive only for very small separations h < 1.3 nm. For pH 5, the maximum repulsive disjoining pressure is Π E D L = 3.97 kPa and Π E D L also becomes attractive for h < 1.3 nm. At pH 10, the repulsive maximum of Π E D L = 9.38 kPa for the interaction with spherical graphite is strongly increased, but Π E D L turns attractive for separations of h < 2.1 nm.
At a higher salt concentration of 0.75 mol/L, comparable to the situation in salt flotation, the electric double layer disjoining pressure Π E D L h was calculated with the same zeta potentials ( ψ i ζ i ) at c i 0.01 mol/L, as seen in Figure 5a. The increased salt concentration of 0.75 mol/L reduces the expansion of the electric double layer around both bubble and particle surfaces resulting in a Debye length of κ 1 = 0.35 nm. The trend of Π E D L h for pH 3 to pH 10 in Figure 5c is similar to that in Figure 5b, but with strongly increased repulsive disjoining pressure maxima as a result of the electric double layer compression. This results in an attractive disjoining pressure for the interaction of the NMC particle and gas bubble (Figure 5c) at pH 3 for separations below h < 2 nm. At pH 10, a repulsive maximum of Π E D L = 1821 kPa is predicted by Equation (15). For bubble interactions with spherical graphite, in Figure 5c, the maximum of Π E D L h is Π E D L = 1187 kPa at pH 3 and Π E D L = 7030 kPa for pH 10. The interactions with spherical graphite only become attractive at h = 0.08 nm, which is a separation that is too small to be of practical relevance.

3.3. Film Drainage and Attachment to Gas Bubbles

3.3.1. NMC Attachment

Figure 6 shows CP-AFM measurements, i.e., force–position curves, which describe the film drainage between NMC particles and sessile gas bubbles for pH 3 and pH 10 in 1 mmol/L sodium chloride solution at a piezo displacement rate of v = 30 µm/s. The median force over all experiments at each colloidal probe position is indicated by the solid lines for trace curves (red) in Figure 6 and for the retrace curve (blue) in Figure 6b. The 80% confidence intervals (CI) of the measurements are indicated by the shaded areas around the median force curves. The force acting on the NMC particle during approach to a gas bubble in Figure 6 is repulsive for both pH 3 and pH 10.
At pH 3, the repulsive force increases non-linearly with the particle displacement until the small force barrier of up to F / R C P   = 0.024 mN/m is measured before the interaction becomes unstable and the NMC particle snaps into contact with the gas bubble (Figure 6a). At higher pH values, the force barrier for particle attachment increases because the strength of the electric double layer repulsion (Figure 5a) increases with the rising absolute value of the two negative zeta potentials of NMC and the gas bubble (Figure 4).
At pH 10, the force increases non-linearly up to F / R C P   0.03 mN/m (Figure 6b), before a quasilinear force–position regime is entered. The non-linearity is a deviation from the constant-compliance regime known for gas bubbles and droplets [6,48], and it is attributed to the deformation of the bubble’s gas–liquid interface. No attachment of NMC to the bubble occurs at pH 10 (Figure 6b) for a moderate piezo displacement of Δ X = 10   n m relative to the position of the undisturbed bubble interface, since the deformation of the bubble and the deflection of the cantilever result in a minimum film height of h r = 0   =   26.7 nm according to the SRYL model. At pH 10, the NMC particle experiences an attractive median force of F / R C P   = −0.016 mN/m during retraction from the bubble. The attractive forces are so small because the liquid film between the NMC and the bubble is still intact and no attachment has occurred. The simulation results of the SRYL model (black lines in Figure 6) for the NMC–bubble interaction at pH 3 in Figure 6a (SRYL 1) and at pH 10 in Figure 6b (SRYL 2) were calculated with the parameters in Table 2, which best describe the NMC–bubble interaction in 1 mmol/L 1:1 electrolyte solution.
The only unknown parameters in the SRYL calculations for interactions involving NMC were the contribution of the van der Waals forces Π v d W and the hydrodynamic slip length b . The disjoining pressure Π enters the SRYL model via the force integral Equation (2) and the Augmented Young–Laplace-Equation, Equation (6). It therefore directly influences the force-distance relationship between bubble and particle. Since the flow profile in the film is not known from CP-AFM measurements, it is not possible to unambiguously distinguish between the hydrodynamic slip on the bubble side b 0 and the slip on the particle side b h of the film in Equation (4). Therefore, a hydrodynamic slip can only be considered in the simple form with Equation (5) to calculate h t , using b as the effective slip length. In SRYL calculations with immobile interfaces ( b = 0 nm) the force during approach of the NMC particle to the bubble is overestimated for all pH values, and therefore the interaction has to be modeled with non-zero slip length b 0 . The tangential mobility of bubble interfaces in aqueous solutions is still discussed controversially, likely because of the extreme sensitivity of the gas-water interface to trace contaminations. The consensus appears to be the following: Freshly generated gas bubbles in ultrapure water have fully mobile interfaces [79]. According to fluid mechanics, such interfaces when free of surface-active agents cannot withstand any shear stresses [80]. Trace amounts of surface-active agents can lead to partially mobile or completely immobile bubble interfaces. A reduction of the bubble interface mobility has also been observed in electrolyte solutions [81], for which Shi et al. [79] suggested that the reduction in the surface tension by 0.1 mN/m through surface-active agents in electrolyte solutions is sufficient to cause a complete arrest of the mobility of the interface. Liu et al. [80] suggested the transition from mobile to immobile bubble interfaces at this concentration of surface-active agents originates from the balance between sheer stress and Marangoni stress. Macromolecular surface-active agents may result in a more complex interface-rheology. An effective hydrodynamic slip has also been suggested as a boundary condition for the modeling of CP-AFM measurements of film drainage between rough particles and smooth surfaces [82,83]. For the modeling of particle–bubble interactions the effective slip for irregular particles has not yet been considered. The definition of the slip-length for rough surfaces [84] and for the interfaces in the SRYL-model [6] are identical, because the concept of the Navier-slip for a pressure-driven Stokes flow in the lubrication approximation is applicable in either case. The slip length parameter for rough and unstructured surfaces must be interpreted as an effective slip length parameter, because the exact relationship between surface roughness parameters, such as RMS or the peak-to-valley roughness, is not fully understood. Guriyanova et al. [83] associated the different length scales of surface roughness with an additional slippage and reported the transition between slight and heavy slippage for sinusoidal surface features with a radius of curvature between 50 nm and 400 nm. It is reasonable to assume that the bubble interface is immobile ( b 0 = 0 nm) since this condition is commonly found in experiments involving gas bubbles in aqueous solutions [79,80,81], meaning the entire hydrodynamic slip corresponds to the particle interface, i.e., b 0 = b .
The best agreement between model and experiments in a 1 mmol/L sodium chloride solution for both pH 3 (Figure 6a) and pH 10 (Figure 6b) is obtained for a hydrodynamic slip length of b = 300 nm in combination with the effective Hamaker constant A e f f = 5 × 10 20 J. The interaction between bubble and NMC was modeled with an effective Hamaker constant A e f f , because as of yet no Hamaker coefficient A 132 is available for interactions involving NMC. The effective Hamaker constant A e f f = 5 × 10 20 J for [NMC−H2O−air] is more repulsive than A 132 = 1.83 × 10 20 J for the system [crystalline silica−H2O−air] [68], but it compares well to Hamaker constants for interactions with some other simple oxide materials such as A 132 = 4.43 × 10 20 J for [titanium dioxide−H2O−air] [85] and A 132 = 3.78 × 10 20 J for [sapphire−H2O−air] [68]. A e f f was adjusted in the SRYL calculations to best match the experiments with NMC at pH 3 and pH 10 in Figure 6.
The conditions that lead to the snap-in of the NMC particle into contact with the gas bubble at pH 3 were analyzed from the radial pressure profiles in Figure 7 that were obtained from the SRYL calculations. The total pressure in the film between the NMC particle and the bubble p + Π at points A–D in Figure 6a is shown in Figure 7a–d as a function of the radius r , alongside the total disjoining pressure Π = Π E D L + Π v d W , and the hydrodynamic pressure p . Point A corresponds to a central film height of h r = 0   =   63.9   nm, and the film pressure at the center ( r = 0 ) is only p + Π = 0.035 kPa (Figure 7a). Overall, 86.5% of the total pressure at the center is caused by the hydrodynamic pressure p , which governs the interaction at larger distances around 50 nm.
The highest repulsive force F / R C P = 0.023 mN/m is reached at point B in Figure 6a and the central film height is h r = 0   =   24.9 nm. The corresponding pressure profiles are shown in Figure 7b. In the inner zone ( r < 0.2 µm), the total pressure in the film is attractive because of an attractive disjoining pressure Π that counteracts the repulsive hydrodynamic pressure p . Outside of the inner zone ( r > 0.2 µm), the total pressure is repulsive and reaches its highest value 0.047 kPa at r =   473 nm.
In the SRYL model, calculations at point C in Figure 6a show that the overall force F / R C P in the interaction zone is lower than at point B, because the disjoining pressure Π compensates the hydrodynamic pressure p more strongly, despite the lower central film height of h r = 0 = 8.2 nm at C. The resulting profile of the total pressure in Figure 7c has two repulsive maxima of ( p + Π ) = 0.309 kPa at the center r =   0 nm and ( p + Π ) = 0.059 kPa at r =   609 nm, which are located beside an attractive minimum of ( p + Π ) = 0.301 kPa at r = 208 nm. The contribution of the hydrodynamic pressure p at point C starts to exceed the bubbles’ Laplace pressure Δ P L = 1.76 kPa, and the collapse of the gas–liquid interface is only prevented by the disjoining pressure Π . At Point D in Figure 6a, the pressure in the film exceeds the Laplace pressure Δ P L = 1.76 kPa which causes the inward collapse of the bubble’s gas–liquid interface leading to a snap-in. According to the SRYL calculation the central film height is h r = 0 = 6.5 nm when the interaction becomes unstable at point D. The radial pressure profile in Figure 7d shows a strong increase in the total pressure above Δ P L at the center of the film ( r = 0 ). The depth of the attractive minimum of ( p + Π ) = 0.402 kPa at r =   240 nm increases, and the height of the local repulsive maximum ( p + Π ) = 0.053 kPa at D remains close to the pressure in C. The strong radial pressure differences promote the collapse of the bubble’s gas–liquid interface because a stronger deformation of the interface can be expected. Yet no dimpling or wimpling of the bubble interface occurs in the calculated film profiles before the interaction becomes instable, which is attributed to the high surface tension γ in surfactant-free sodium chloride solution.
The condition Δ P L p + Π for the snap in is not met for the interaction at pH 10 in Figure 6b, where the Laplace pressure of Δ P L = 1.32 kPa is not exceeded by the local pressure in the film at any point. Also, the smallest film height in Figure 6b is h r = 0   =   26.7 nm; thus, no attachment is possible at pH 10. Therefore, entrainment should be the major recovery mechanism for NMC at caustic pH in place of true flotation. The bubble radius R b differs between the individual experiments, but can be excluded as the origin of the different stabilities for the interactions at pH 3 and pH 10, because the larger bubble in the experiment at pH 10 has a Laplace pressure of Δ P L = 1.32 kPa, which is lower than Δ P L = 1.76 kPa for the experiment with the smaller bubble at pH 3. This comparison of experiment and model shows that the NMC–bubble interaction in the 1 mmol/L sodium chloride solution is governed by electric double layer forces between the bubble and the NMC particle. Accordingly, the difference between the AFM-CP measurements for NMC at pH 3 and pH 10 in Figure 6 is rooted in the different strength and sign of the electric double layer disjoining pressure Π E D L .
CP-AFM measurements for a NMC particle approaching sessile bubbles with radius R b at the high sodium chloride concentration of 0.75 mol/L, relevant for salt flotation, are shown in Figure 8. At pH 3 (Figure 8a), no repulsion is measured before the force becomes strongly attractive. This derives from the strong compression of the electric double layer ( κ 1 = 0.35 nm) and the attractive electric double layer disjoining pressure Π E D L < 0 for pH 3. At pH 10 with a salt concentration of 0.75 mol/L, the NMC particle experiences a weak repulsive force of 0.02 mN/m before the snap-in, comparable to the strength of the repulsive force in the diluted 1 mmol/L salt solution at pH 3 in Figure 6a. It is not possible to accurately model the interaction in 0.75 mol/L 1:1 electrolyte solution at pH 3, since essentially no non-zero force is measured until the particle snaps into contact with the gas bubble, while the model predicts a repulsive force. Yet the force is accurately predicted by the SRYL model at pH 10 in a 0.75 mol/L 1:1 electrolyte solution for z > 25 nm, since the simulated force curve is within the 80% confidence interval in Figure 8b.
The decreased range of DLVO forces gives the topography (shape and roughness) of the particle (Figure 1b) a more prominent role: for long range forces of 10 nm to 100 nm, the bubble interacts with a bigger fraction of the curved particle at a close approach and therefore the influence of peaks in the NMC particle topography is somewhat smoothed out. For more short-range interactions, as they are encountered at the 0.75 mol/L 1:1 electrolyte, the effective particle radius of the interaction with the gas bubble is defined by the highest point in the particle topography in Figure 1b. The SRYL model implies the radial symmetry of the particle and bubble; however, in most real particle systems, including black mass (Figure 1), particles cannot be seen as completely symmetric. It therefore can be difficult to associate the chemistry in the CP-AFM measurements with the surface forces via contact models, especially for systems in which weak or short-range repulsive forces are present. This is also a possible explanation for the film rupture when the Laplace pressure is reached, instead of wrapping and the formation of a stable thin film in Figure 6a. The experimental results for the film drainage of NMC have demonstrated that the SRYL model can successfully predict the film drainage and possible attachment for close-to-spherical particles under the influence of long-range forces. For short range or attractive surface forces, however, deviations from an ideal smooth particle shape remain unaccounted for in the SRYL model. Accordingly, the model is useful to predict the energy barrier for attachment E a t t in flotation for smooth and spherical particles, for which accurate interaction parameters (Table 2) are available.
The slope of the force curves Δ F / R C P Δ z at the snap-in is used to compare the affinity of particles to gas bubbles in systems with different chemistries. The SRYL calculation for 1 mmol/L sodium chloride in Figure 6a suggests that the liquid film between bubble and particle ruptures at point D, shortly after the measured force F / R C P reaches its highest value at point B, i.e., when it becomes more attractive. For CP-AFM measurements, it is not possible to distinguish between the final stage of the film drainage (just before the rupture of the liquid film) and the three-phase contact line formation, unless the film height h r is measured directly or the interaction is simulated with the SRYL model. Therefore, the slope of the force curve Δ F / R C P Δ z between the highest and the smallest force is used to compare the affinity for particle attachment to the gas bubble In Table 3 for the different salt concentrations and pH values.
The film drainage in the AFM configuration compares well with the collision process [86] during turbulent particle–bubble collision in flotation. The kinetic energy E k i n = 1 2 m C P v 2 of a particle during collision decides if the particle attaches during its first collision event with the deformable bubble ( E k i n > E a t t ), or if the particle bounces off from the bubble ( E k i n < E a t t ). The energy barrier for attachment by E a t t is the integral over the trace curves before attachment in Figure 6 and Figure 8, which was calculated as E a t t = a b F z c d z . For comparability between the measurements, the integration was carried out in the range a   =   10 6 m to b   =   z F = 0 , with the offset correction factor c   =   F a . The different values of E a t t / R C P 2 for NMC–bubble interactions are compared in Table 3 and they show that the energy barrier for the attachment of NMC at pH 3 is lower than at pH 10. Further, the values of E a t t / R C P 2 confirm that a high concentration of salt aids particle–bubble attachment. However, even the lowest value of E a t t / R C P 2 that corresponds to E a t t = 5.59 × 10 19 J at pH 3 and a salt concentration of 0.75 mol/L is high compared to the kinetic energy E k i n of single particles with radii similar to that of the NCM colloidal probes, which is 10 21 J to 10 20 J for v   =   30 µm/s.

3.3.2. Spherical Graphite Attachment

Force measurements for spherical graphite colloidal probes interacting with gas bubbles in 1 mmol/L sodium chloride solution are shown in Figure 9a,b. For the interaction of the bubble with spherical graphite, no repulsive force is measured before the snap-in at both pH 3 (Figure 9a) and pH 10 (Figure 9b). Figure 9a shows the attractive median force measured between spherical graphite particles and sessile gas bubbles with radii R b = 61–78 µm. The force steeply decreases when particles and bubbles are only separated by a liquid film of a few nanometers in height.
The slope of the attractive median force curves at pH 3 in Figure 9a is in the range from 35 mN / m nm to 104 mN / m nm . For measurements at pH 10 and a concentration of 1 mmol/L in Figure 9b, this value ranges from 18 mN / m nm to 38 mN / m nm . The insets in Figure 9 show the force during the last phase of film drainage. A comparison of Figure 9a–d shows that the force at a concentration of 1 mmol/L is weakly attractive for separations below ~5 nm for both pH 3 and pH 10, before the slope of the force curve steeply increases around z = 0 nm in Figure 9a,b. The weak attraction below ~5 nm is not present in measurements with a concentration of 0.75 mol/L for pH 3 in Figure 9c and for pH 10 in Figure 9d. The slopes of the attractive median force curves for pH 3 at the high salt concentration are in the range from 95 mN / m nm to 140 mN / m nm , and for the more caustic conditions at pH 10 the slope decreases to values between 43 mN / m nm to 51 mN / m nm . The AFM measurements in Figure 9 show that the bubble radius R b in the AFM experiments is not correlated with the slope Δ F / R C P Δ z for R b 50 120   µm. The comparison of the mean Δ F / R C P Δ z values in Table 3 from the three experiments for each system in Figure 9 reveals that Δ F / R C P Δ z for spherical graphite is proportional to the salt concentration for a given pH value of the solution. Yet the pH appears to have an even stronger effect on Δ F / R C P Δ z , and the slope is the steepest for the measurements at pH 3. This is attributed to the pH dependence of the maximum repulsive electric double layer disjoining pressure Π E D L (Figure 5). It was not possible to model the purely attractive force-curves in Figure 9 with the SRYL model which predicts a repulsive force; thus, we cannot fully disclose the role of Π v d W in the interaction. Interestingly, both Π E D L and Π v d W are repulsive for the interaction between gas bubbles and graphite, raising the question of additional hydrophobic forces. However, we were not able to find any nanobubbles on the immersed graphite surfaces with the technique from [35] for nanobubble detection by phase-contrast AFM. The height of the force barrier for attachment E a t t was not evaluated for the spherical graphite colloidal probes because of the lower quality of AFM data generated with these less ideal particles. The absence of any repulsive force results in a vanishing force barrier E a t t 0 for graphite in sodium chloride solutions, making salt flotation possible for both pH 3 and pH 10, while the addition of salt increases the chances of attachment. The difference of 67 mN / m nm between Δ F / R C P Δ z at pH 3 and pH 10 at high salt concentration suggests that particle–bubble attachment, and therefore flotation, is more likely at pH 3 than at pH 10.

3.3.3. Interactions in 0.75 mol/L NaCl + 0.01 mol/L NaOAc Buffer Solution

The measurement of NMC in 0.75 mol/L NaCl + 0.01 mol/L sodium acetate (NaOAc) buffer solution (Section 2.2) at pH 3.5 (Supplementary Material S2.2) shows no repulsion before the snap-in, similar to the measurements at a sodium chloride concentration of 0.75 mol/L. This is because the additional buffer has no significant effect on the expansion of the electric double layers, since the Debye length remains at κ 1 = 0.35 nm (Section 3.2). The electric double layer disjoining pressure Π E D L at pH 3.5 for the interaction with the air–water interface is only slightly more positive than at pH 3 for both NMC and spherical graphite, as the absolute value of the zeta potentials is only ~5 mV lower at pH 3.5 (Section 3.1). The slope of Δ F / R C P Δ z = 26.5   mN / m nm at the snap-in for NCM in the 0.75 mol/L NaCl + 0.01 mol/L NaOAc buffer solution is comparable to the slope of the other measurements with the NMC colloidal probe in Table 3, while the energy for attachment E a t t is Δ E a t t =   0.97 × 10 19 J higher than for the pure 0.75 mol/L NaCl solution.
For spherical graphite in the presence of the sodium acetate buffer, the slope of Δ F / R C P Δ z = 76.3   mN / m nm is 37 mN / m nm less steep than the steepest slope that was measured for 0.75 mol/L NaCl at pH 3 (Table 3).

3.4. Snap-In Force and Forced Dewetting

After the rupture of the film (Section 3.3), the attractive force on approach becomes the strongest at the snap-in. Trace curves for the snap-in and forced dewetting of NMC and spherical graphite colloidal probes are shown in Figure 10 (pH 3, 0.75 mol/L). After the rupture of the film at z = 0 µm, the particle is pulled into the gas–liquid interface, and at the same time the bubble interface jumps into contact ( z b r = x T P C L = y T P C L , see Section 2.5.5) as the TPCL is established [7]. At this point, the snap-in force F s n a p i n = min F t r a c e is measured. When the particle is pressed deeper into the bubble, it reaches its first pseudo-equilibrium position at F e q , 1 = 0 nN, and further displacement causes a repulsive force to emerge. At the end points of the trace curves in Figure 10, the particle is retracted from the bubble; this phase, including the particle detachment, is discussed in Section 3.4. The scaled snap-in force F s n a p i n / R C P for spherical graphite is about 5 times stronger than for NMC in Figure 10, which is also evident from the higher z -distance between z ( F e q , 1 ) and the film rupture at z = 0 µm. The snap-in forces for the various salt solutions are compared in Table 3 and the corresponding full force–position curves are found in the Supplementary Material S2.3.

3.5. Particle Detachment from Gas Bubbles

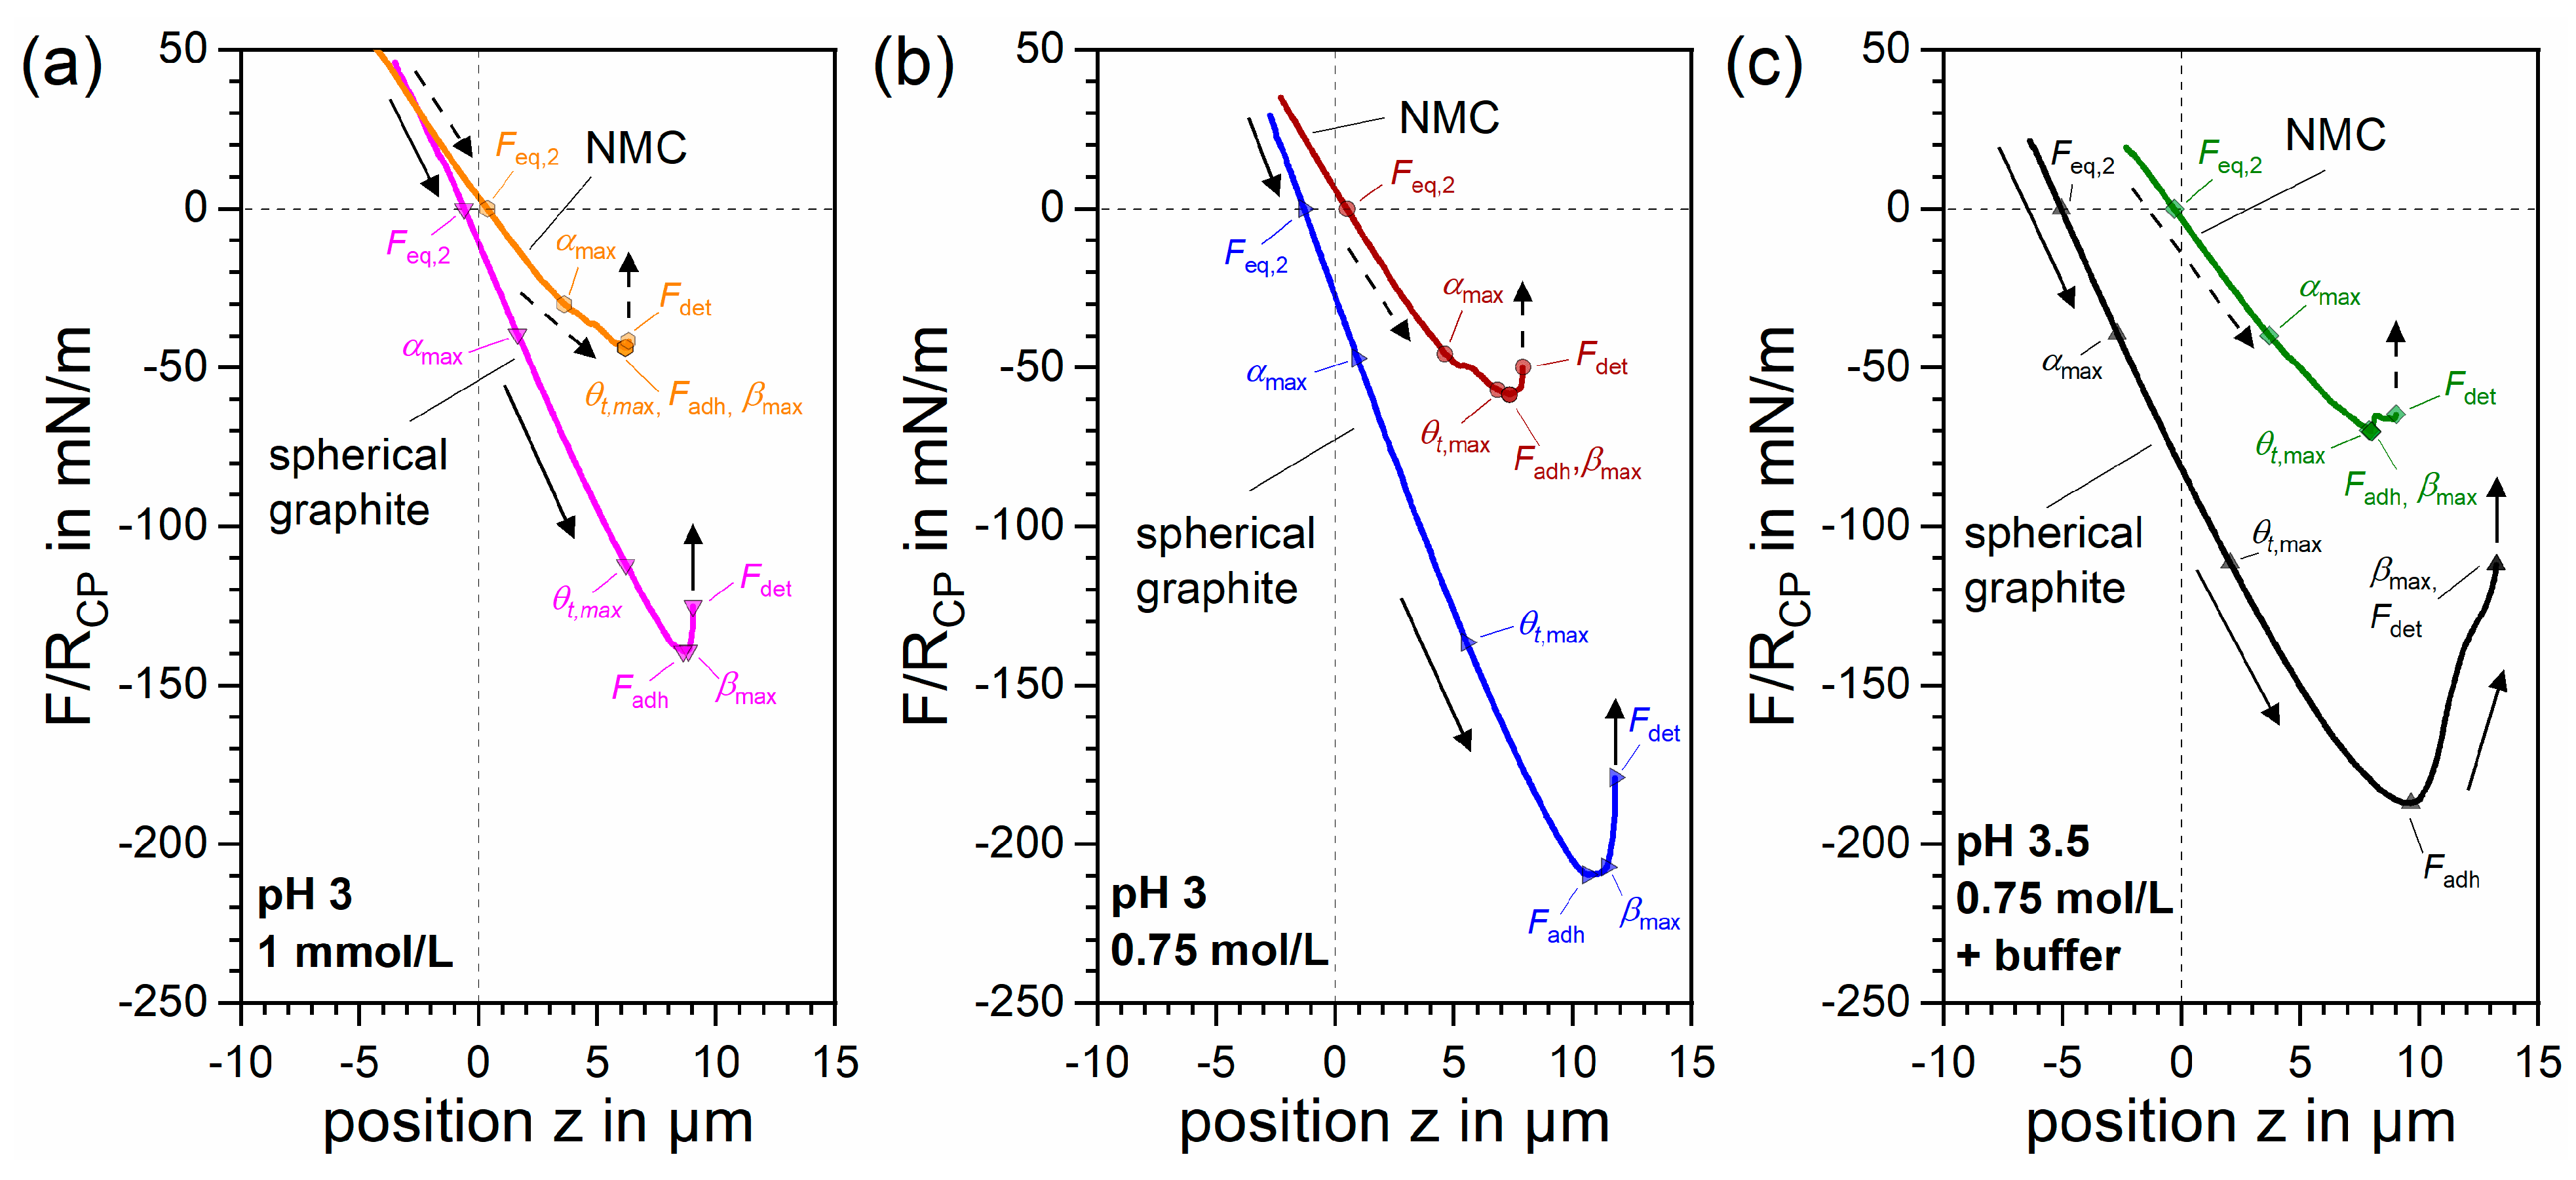
The median retrace curves for the detachment of black mass particles from sessile gas bubbles are shown in Figure 11 for acidic 1:1 electrolyte solutions (Section 2.2) at pH 3. The radius of the colloidal probes in Figure 11 is R C P = 14 µm for NMC and R C P = 7 µm for spherical graphite, while the sessile gas bubbles had radii between R b =   62 µm and R b = 120 µm (Supplementary Material S2.1). The force minimum in the retrace curves in Figure 11 is the scaled pull-off force F a d h / R C P and the values for NMC and spherical graphite in salt solutions are compared in Table 4. The particles must be displaced by a distance of z I (Table 4) away from the second pseudo-equilibrium position at F e q , 2 in Figure 11 for the particles to detach from the gas–liquid interface at F d e t . During this displacement, the scaled work Δ E m a x R C P 2 (Table 4) that corresponds to the integral over the scaled force curves in Figure 11 must be overcome. The pH value had a smaller effect on the detachment of black mass particles, and therefore the results are discussed for acidic salt solutions with pH 3 to pH 3.5.
The conditions at the pulp–froth boundary in flotation are critical for the process because in this zone the particle-laden bubbles from the pulp are compacted into a froth, increasing the local particle concentration in the remaining liquid phase. Particle-laden gas bubbles are pressed against each other, which can lead to the contact of a single particle with two gas bubbles. Such a particle can only maintain contact with both bubbles if the opening angle α is less than 90 °; otherwise, the two bubbles coalesce. On the other hand, a particle in contact with two gas bubbles can experience sudden changes of the acting force in direction and magnitude due to turbulence and the reorganization of the spatially constrained particle-laden bubbles. These events are associated with big spatial displacements and high energy transfer, which can lead to particle redispersion into the pulp. While redispersion is desired for NMC, the spherical graphite must remain immobilized in the gas–liquid interface for successful recovery into the top product. Accordingly, high values of z I and Δ E m a x R C P 2 in AFM measurements suggest strong stability against detachment.
The measurements with the NMC colloidal probe in Figure 11a–c result in a relatively low pull-off force, ranging from F a d h / R C P = 43.8 mN/m at pH 3 in 1 mmol/L NaCl (Figure 11a) up to F a d h / R C P = 70.0 mN/m for the 0.75 mol/L NaCl + 0.01 mol/L NaOAc buffer solution at pH 3.5 (Figure 11c). The pull-off force F a d h / R C P increases notably with the salt concentration in Figure 11a,b for both particle types, because the force in Equation (23) is proportional to the surface tension γ , which increases with the sodium chloride concentration by Δ γ = 2 mN/m (Section 2.2).
For spherical graphite, the pull-off force at acidic pH in Figure 11 ranges from F a d h / R C P = 139.3 mN/m at 1 mmol/L to F a d h / R C P = 209.7 mN/m at 0.75 mol/L. The presence of the sodium acetate buffer (Figure 11c) reduces the pull-off force for spherical graphite to F a d h / R C P = 187.0 mN/m, which agrees with the reduction in the surface tension by Δ γ = 0.6 mN/m upon buffer addition (Section 2.2).
The interaction distance and the work for detachment Δ E m a x R C P 2 increases from Figure 11a–c for both NMC and spherical graphite. The increase in the salt concentration to 0.75 mol/L doubles Δ E m a x R C P 2 and for the 0.75 mol/L NaCl + 0.01 mol/L NaOAc buffer solution Δ E m a x R C P 2 is 2.7 times higher than seen at a concentration of 1 mmol/L. In identical acidic solutions, the scaled work Δ E m a x R C P 2 for spherical graphite is ~10 times higher than for NMC (Table 4). The pull-off forces at pH 10 (Table 4) slightly exceed those measured at pH 3; however, the influence of the pH value on the pull-off force F a d h is small compared to that of Δ γ .
The angles θ t , β and α (Section 2.5.5) that define the three-phase contact line on the model black mass particles during retraction from gas bubbles in the acidic salt solutions are shown in Figure 12 (for pH 10 see Supplementary Material S2.5), in which the scaled force on the x-axis corresponds to F / R C P on the y-axis of the retrace curves in Figure 11. At the beginning of the retrace curves in Figure 11 and Figure 12, the force F / R C P > 0 is repulsive, because the particles were forced into the gas bubble past their equilibrium position ( F e q , 1 / R C P = 0 mN/m) on approach. When the particle is first retracted, F / R C P decreases, and when the force becomes zero at F e q , 2 / R C P = 0 mN/m, the particle has reached its pseudo equilibrium position ( Δ E 0 ).
The three-phase contact angle θ t in Figure 12a increases as the NMC particle is retracted from the bubble, and the highest contact angle θ t for NMC is calculated just before the pull-off force F a d h / R C P is reached for all salt solutions. For pure sodium chloride solutions at pH 3, the maximum contact angle of NMC is θ t , m a x 102 °, with the addition of the sodium acetate buffer increasing the maximum contact angle by 2°. The inclination of the bubble interface at the TPCL line β (Figure 12b) increases linearly with the measured force for NMC, and remains linear until the particle detaches at F d e t . The pull-off force F a d h / R C P is measured when the maximum inclination of the interface β m a x is reached. All three angles, θ t , β and α , become smaller during the final stage of the detachment, during which the TPCL slides down on the surface of the NMC colloidal probe until the final detachment at F d e t < F a d h . The NMC particles detach at an opening angle α 86 ° (Figure 12c), for which the TPCL is close to the particle center, i.e., the NMC particle cannot maintain prolonged contact with the gas bubble during retraction. This indicates that the NMC particle only interacts weakly with the gas–liquid interface of the bubble.
The angles θ t , β and α that characterize the TPCL for the retraction of the spherical graphite particle from gas bubbles are shown in Figure 12d–f. At the pseudo-equilibrium position F e q , 2 , a contact angle of θ t , e q , 2 92.5 ° was calculated for the pure sodium chloride solutions (Figure 12d), and one of θ t , e q , 2 = 95.5 ° was calculated for the 0.75 mol/L NaCl + 0.01 mol/L NaOAc buffer solution. The inclination of the bubble interface β in Figure 12e follows a linear trend until the maximum contact angle θ t , m a x is reached. For the two acidic solutions with 0.75 mol/L sodium chloride, θ t , m a x = 106.2 ° is the highest contact angle between spherical graphite and the sessile gas bubbles at acidic conditions. The opening angle α changes only by a few degrees for the first part of the retrace curve F / R C P > 50 mN/m before it reaches a maximum value of α m a x for all three salt solutions in Figure 12f. From this point on, the TPCL starts to slide down the surface of the spherical graphite particle. The maximum inclination of the bubble interface β m a x is measured shortly after the maximum pull-off force F a d h / R C P is reached for the pure sodium chloride solutions at pH 3. From β m a x on, the bubbles move back into their undisturbed equilibrium shape, leading to the particle detachment at F d e t (Figure 12e). Both β m a x (Table 4) and β at the point of detachment increase with the salt concentration, the latter being β d e t = 21° at 1 mmol/L and β d e t = 32.5 ° at 0.75 mol/L.
For spherical graphite in 0.75 mol/L NaCl + 0.01 mol/L NaOAc buffer solution the increased interaction length z I (Figure 11c) results in a higher work Δ E m a x R C P 2 on the capillary system, i.e., on the left-hand side of Equation (24). This causes a low opening angle α d e t = 54.3° at the last point of contact F d e t , and a strongly inclined bubble interface with β d e t = 60.6° at the TPCL (Figure 12e). Using the Young–Laplace Equation, expressed in Equation (25) to Equation (27), with the available values of α d e t , θ t , d e t and β d e t , the visualization of the bubble interface profile in Figure 13a shows that the combination of low α and high β corresponds to a pronounced meniscus close to the TPCL (Figure 13b). The onset of neck formation indicates strong contact between gas bubbles and spherical graphite in the 0.75 mol/L NaCl + 0.01 mol/L NaOAc buffer solution, while the bubble interface is less inclined for the detachment in sodium chloride solutions at pH 3.
The ability of salt solutions to form a stable flotation froth in the presence of the spherical graphite particles is estimated from the maximum depth of particle immersion α m a x on retraction. A particle that supports the froth in flotation has to be able to maintain contact with at least two gas bubbles without the coalescence of the two bubbles, which requires that α m a x < 90 °. Checking this criterion for the spherical graphite particles (Table 3) shows that the maximum depth of particle immersion for F < 0 is α m a x < 90 ° for measurements at pH 3 in pure sodium chloride solution. In an NaOAc buffer containing solution, the maximum opening angle is α m a x = 90 °, and for measurements at pH 10 it is α m a x > 90 ° . This suggests that the froth stability at pH 3 is better than at pH 10.

3.6. Flotation Test Results

The results of the flotation tests are summarized in Figure 14. The salt flotation of graphite in sodium chloride solution with a concentration of 0.75 mol/L was possible at all tested pH values. The strongest formation of graphite-stabilized froth was observed at acidic pH values, at pH 3, and in the buffer solution at pH 3.5, shown in Figure 14a. The froth formation was less pronounced at pH 10. The recovery of graphite and NMC as a function of time is shown in Figure 14b for flotation tests in pure sodium chloride solution.
Graphite is floated the fastest at acidic pH, close to the IEP of gas bubbles and graphite. The comparison of the first-order rate constants for experiments in pure sodium chloride solutions in Table 5 shows that the rate constant k g r a p h i t e is 1.5 times higher at pH 3 than k g r a p h i t e   at pH 10. The rate of NMC recovery in Figure 14b is independent of the pH value, and the rate constants k N M C for NMC in Table 5 are significantly lower than the ones of graphite. This suggests that the NMC particles in the fully liberated model black mass are predominantly recovered by entrainment.
The selectivity in the Fuerstenau II plot in Figure 14c is the highest for small values of the NMC recovery combined with a high graphite recovery, and thus for values in the upper-left corner of the graph. The representation indicates the selectivity of flotation tests independently of the operating conditions. The overlap of the interpolated data curves in Figure 14c suggests that the selectivity of the flotation process, and therefore the particle–bubble attachment, is unaffected by the addition of the NaOAc buffer. The lower rate of graphite recovery—assessed by true flotation at pH 10 combined with the pH-independent NMC recovery rate—results in an overall lower selectivity of the flotation process at pH 10 that is evident from Figure 14c.
Particle–bubble hetero-coagulates formed in the pulp during the flotation tests are shown in Figure 14d–f. The black graphite particles are clearly visible in the circumference of the gas bubble at pH 3 in Figure 14d, and are highlighted by the arrow. Such graphite–bubble hetero-coagulates are also observed at pH 10, but are less numerous. Gas bubbles with high surface coverage, such as the one shown in Figure 14f, are observed at pH 3.5 with the addition NaOAc buffer.

4. Conclusions

CP-AFM and batch flotation tests of a graphite–NMC mixture show that graphite can be enriched in the top product by salt flotation in acidic 1:1 electrolyte solutions, making salt flotation a sustainable process option for the separation of lithium-ion battery black mass. Direct force measurements with graphite and NMC colloidal probes on sessile gas bubbles in sodium chloride solution show that graphite particles are more likely to attach to the gas–liquid interface of gas bubbles than NMC under all tested conditions in the range pH 3 to pH 10. The highest attachment efficiencies of spherical graphite to gas bubbles can be expected at pH 3, close to the IEP of bubbles and graphite at high sodium chloride concentrations.
The comparison of CP-AFM measurements with the SRYL model shows that the film drainage between a NMC particle and a gas bubble in diluted salt solutions is well described with an effective Hamaker constant of A e f f = 5 × 10 20 J in combination with a hydrodynamic slip length of b   =   300 nm, which compares well to the height of the NMC surface topography. The electric double layer disjoining pressure is accurately accounted for by the Hogg–Healy–Fuerstenau equation. It is known that contaminations of battery electrolytes on black mass particles from spent LIB can negatively impact selectivity in black mass flotation. Although this aspect was not addressed in this study, the effective Hamaker constant for NMC–bubble interactions can be useful for the modeling of interactions involving such contaminated NMC particles.
Graphite attachment to bubbles is possible over a wide range of pH values and salt concentrations, because no repulsive forces are measured during film drainage on approach to gas bubbles. The likeliness of film rupture and attachment was evaluated by the slope of the force curves at the snap-in Δ F / R C P Δ z , because the simulation of the attractive force curves for spherical-graphite with the SRYL model was not possible without consideration of additional hydrophobic forces. Flotation at acidic pH values resulted in stronger development of graphite-stabilized froth, while flotation at pH 10 showed poor froth formation and slower flotation kinetics, albeit with no significant difference in selectivity. A comparison of the flotation kinetics for spherical graphite and NMC reveals that NMC is recovered predominantly by mechanical entrainment and not by true flotation, thereby confirming the floatability assessment by CP-AFM. The use of buffer solution can help to stabilize the pH of the process water close to the IEP of graphite and gas bubbles, maximizing the rate of graphite recovery. Both CP-AFM measurements in the capillary force regime and the TPCL-position from the quasistatic model confirm a high stability of graphite in the gas–liquid interface for added sodium acetate buffer, but suggest that the particle contact angle is slightly higher than the optimum for salt flotation.
The comparison of CP-AFM measurements and batch flotation tests shows that colloidal probe AFM is a valuable tool for the floatability assessment of novel flotation feedstocks, for which the effective parameters of particle–bubble interactions are unknown. The difficulty of CP-AFM measurements in the capillary force regime is significantly lower than for CP-AFM experiments during film drainage, yet both regimes can be used to access the potential for hetero-coagulation and thereby true flotation.

Supplementary Materials

The following supporting information can be downloaded at: https://www.mdpi.com/article/10.3390/min15080809/s1, Table S1. Properties of colloidal probe cantilevers and gas bubbles for Section 3.3; Table S2. Properties of colloidal probe cantilevers and gas bubbles for Section 3.4 and Section 3.5; Table S3. TPCL position, force and work during particle retraction in acidic solutions; Table S4. TPCL position, force and work during particle retraction in sodium chloride solutions at pH 10 for NMC and spherical graphite (SG); Figure S1. (a) Hamaker functions A131(l) for [graphite-H2O-graphite] and [graphite-air-graphite] from the anisotropic Lifshitz formulation (data from Dagastine et. al [72]) compared with results from the isotropic Lifshitz formulation using εeff(,f) from the Maxwell–Garnett theory with f = 0.71. (b) Hamaker function A132(l) for [graphite-H2O-air], and the corresponding disjoining pressures ΠvdW using a Hamaker function A132(l) or constant A132 = −6.6 × 10⁻²⁰) J; Figure S2. AFM force position curves for the particle–bubble interaction of NMC (a) and spherical graphite (b) in 0.75 mol/L NaCl + 0.01 mol/L NaOAc solution; Figure S3. Median trace (red) and retrace (blue) curves for particle–bubble interactions with NMC; Figure S4. Median trace (red) and retrace (blue) curves for particle–bubble interactions with spherical graphite; Figure S5. Three-phase contact line (TPCL) of NMC (a-c) and spherical graphite (d-f) during detachment from gas bubbles at pH 10: θt three-phase contact angle (a,d), β inclination of the bubble interface at the TPCL (b,e), α opening angle (c,f).

Author Contributions

Conceptualization, J.N.; methodology, J.N.; software, J.N.; validation, J.N.; formal analysis, J.N.; investigation, J.N. and C.H.; resources, U.A.P.; data curation, J.N.; writing—original draft preparation, J.N.; writing—review and editing, J.N., C.H., L.D. and U.A.P.; visualization, J.N.; supervision, L.D. and U.A.P.; project administration, U.A.P.; funding acquisition, U.A.P. All authors have read and agreed to the published version of the manuscript.

Funding

The authors gratefully acknowledge the German Research Foundation (DFG) for supporting the Collaborative Research Center CRC 920 (Project ID 169148856–subproject B04) and the Priority Programme SPP 2045, (Project ID 382122817).

Data Availability Statement

The original data presented in the study are openly available in OPARA at https://doi.org/10.25532/OPARA-693.

Acknowledgments

We are grateful to the Helmholtz Institute Freiberg for Resource Technology (HIF) for the introduction to the bubble pressure method and for supplying the spherical graphite. We are also grateful to Gert Schmidt from IKFVW at TU Bergakademie Freiberg for the SEM images of the particles that were used in the graphical abstract.

Conflicts of Interest

The authors declare no conflicts of interest. The funders had no role in the design of the study; in the collection, analyses, or interpretation of data; in the writing of the manuscript; or in the decision to publish the results.

Abbreviations

The following abbreviations are used in this manuscript:
AFMatomic force microscope
CPcolloidal probe
DLVODerjaguin-Landau-Verwey-Overbeek–(theory)
EDLelectric double layer
HHFHogg–Healy–Fuerstenau
HOPGHighly Oriented Pyrolytic Graphite
IEPisoelectric point
LIBlithium-ion battery
NMCnickel manganese cobalt oxide
SGspherical graphite
SMDSauter mean diameter
SRYLStokes–Reynolds–Young–Laplace
TPCLthree-phase-contact-line
TOCtotal organic carbon
XRFX-ray fluorescence spectrometer

References

  1. Wilke, C.; Werner, D.M.; Kaas, A.; Peuker, U.A. Influence of the Crusher Settings and a Thermal Pre-Treatment on the Properties of the Fine Fraction (Black Mass) from Mechanical Lithium-Ion Battery Recycling. Batteries 2023, 9, 514. [Google Scholar] [CrossRef]
  2. Vanderbruggen, A.; Hayagan, N.; Bachmann, K.; Ferreira, A.; Werner, D.; Horn, D.; Peuker, U.; Serna-Guerrero, R.; Rudolph, M. Lithium-Ion Battery Recycling—Influence of Recycling Processes on Component Liberation and Flotation Separation Efficiency. ACS EST Eng. 2022, 2, 2130–2141. [Google Scholar] [CrossRef]
  3. Nazari, S.; Vakylabad, A.B.; Asgari, K.; Li, J.; Khoshdast, H.; He, Y.; Hassanzadeh, A. Bubbles to batteries: A review of froth flotation for sustainably recycling spent lithium-ion batteries. J. Energy Storage 2024, 84, 110702. [Google Scholar] [CrossRef]
  4. Gillies, G.; Kappl, M.; Butt, H.J. Direct measurements of particle-bubble interactions. Adv. Colloid Interface Sci. 2005, 114–115, 165–172. [Google Scholar] [CrossRef]
  5. Park, S.; Huang, K.; Yoon, R.-H. Predicting bubble coarsening in flotation froth: Effect of contact angle and particle size. Miner. Eng. 2018, 127, 256–264. [Google Scholar] [CrossRef]
  6. Chan, D.Y.; Klaseboer, E.; Manica, R. Theory of non-equilibrium force measurements involving deformable drops and bubbles. Adv. Colloid Interface Sci. 2011, 165, 70–90. [Google Scholar] [CrossRef]
  7. Nicklas, J.; Ditscherlein, L.; Peuker, U.A. Particle-Bubble Interactions: An Investigation of the Three-Phase Contact Line by Atomic Force Microscopy. Langmuir 2023, 39, 13630–13640. [Google Scholar] [CrossRef]
  8. Nicklas, J.; Peuker, U.A. Stability of bubble-particle hetero-coagulates accessed by atomic force microscopy to understand the froth flotation of agglomerating hydrophobic fines. Colloids Surf. A Physicochem. Eng. Asp. 2024, 699, 134660. [Google Scholar] [CrossRef]
  9. Ducker, W.A.; Xu, Z.; Israelachvili, J.N. Measurements of Hydrophobic and DLVO Forces in Bubble-Surface Interactions in Aqueous Solutions. Langmuir 1994, 10, 3279–3289. [Google Scholar] [CrossRef]
  10. Webber, G.B.; Manica, R.; Edwards, S.A.; Carnie, S.L.; Stevens, G.W.; Grieser, F.; Dagastine, R.R.; Chan, D.Y.C. Dynamic Forces between a Moving Particle and a Deformable Drop. J. Phys. Chem. C 2008, 112, 567–574. [Google Scholar] [CrossRef]
  11. Englert, A.H.; Ren, S.; Masliyah, J.H.; Xu, Z. Interaction forces between a deformable air bubble and a spherical particle of tuneable hydrophobicity and surface charge in aqueous solutions. J. Colloid Interface Sci. 2012, 379, 121–129. [Google Scholar] [CrossRef] [PubMed]
  12. Anachkov, S.E.; Lesov, I.; Zanini, M.; Kralchevsky, P.A.; Denkov, N.D.; Isa, L. Particle detachment from fluid interfaces: Theory vs. experiments. Soft Matter 2016, 12, 7632–7643. [Google Scholar] [CrossRef]
  13. Verrelli, D.I.; Koh, P.T.L.; Nguyen, A.V. Particle–bubble interaction and attachment in flotation. Chem. Eng. Sci. 2011, 66, 5910–5921. [Google Scholar] [CrossRef]
  14. Nguyen, A.V. Hydrodynamics of liquid flows around air bubbles in flotation: A review. Int. J. Miner. Process. 1999, 56, 165–205. [Google Scholar] [CrossRef]
  15. Derjaguin, B.V.; Dukhin, S.S. Theory of flotation of small and medium-size particles. Prog. Surf. Sci. 1993, 43, 241–266. [Google Scholar] [CrossRef]
  16. Schulze, H.J. New theoretical and experimental investigations on stability of bubble/particle aggregates in flotation: A theory on the upper particles size of floatability. Int. J. Miner. Process. 1977, 4, 241–259. [Google Scholar] [CrossRef]
  17. De, F.; Gontijo, C.; Fornasiero, D.; Ralston, J. The Limits of Fine and Coarse Particle Flotation. Can. J. Chem. Eng. 2008, 85, 739–747. [Google Scholar] [CrossRef]
  18. Andre, D.; Kim, S.-J.; Lamp, P.; Lux, S.F.; Maglia, F.; Paschos, O.; Stiaszny, B. Future generations of cathode materials: An automotive industry perspective. J. Mater. Chem. A 2015, 3, 6709–6732. [Google Scholar] [CrossRef]
  19. Moradi, B.; Botte, G.G. Recycling of graphite anodes for the next generation of lithium ion batteries. J. Appl. Electrochem. 2015, 46, 123–148. [Google Scholar] [CrossRef]
  20. Vanderbruggen, A.; Sygusch, J.; Rudolph, M.; Serna-Guerrero, R. A contribution to understanding the flotation behavior of lithium metal oxides and spheroidized graphite for lithium-ion battery recycling. Colloids Surf. A Physicochem. Eng. Asp. 2021, 626, 127111. [Google Scholar] [CrossRef]
  21. Zhan, R.; Yang, Z.; Bloom, I.; Pan, L. Significance of a Solid Electrolyte Interphase on Separation of Anode and Cathode Materials from Spent Li-Ion Batteries by Froth Flotation. ACS Sustain. Chem. Eng. 2020, 9, 531–540. [Google Scholar] [CrossRef]
  22. Schubert, H. On the turbulence-controlled microprocesses in flotation machines. Int. J. Miner. Process. 1999, 56, 257–276. [Google Scholar] [CrossRef]
  23. Tabor, R.F.; Grieser, F.; Dagastine, R.R.; Chan, D.Y. Measurement and analysis of forces in bubble and droplet systems using AFM. J. Colloid Interface Sci. 2012, 371, 1–14. [Google Scholar] [CrossRef]
  24. Neethling, S.J.; Cilliers, J.J. Modelling flotation froths. Int. J. Miner. Process. 2003, 72, 267–287. [Google Scholar] [CrossRef]
  25. Folayan, T.-O.; Lipson, A.L.; Durham, J.L.; Pinegar, H.; Liu, D.; Pan, L. Direct Recycling of Blended Cathode Materials by Froth Flotation. Energy Technol. 2021, 9, 2100468. [Google Scholar] [CrossRef]
  26. Li, W.; MCKinnan, W.R.; Dahn, J.R. Lithium Intercalation from Aqueous Solutions. J. Electrochem. Soc. 1994, 141, 2310–2316. [Google Scholar] [CrossRef]
  27. Verdugo, L.; Zhang, L.; Saito, K.; Bruckard, W.; Menacho, J.; Hoadley, A. Flotation behavior of the most common electrode materials in lithium ion batteries. Sep. Purif. Technol. 2022, 301, 121885. [Google Scholar] [CrossRef]
  28. Bauer, W.; Çetinel, F.A.; Müller, M.; Kaufmann, U. Effects of pH control by acid addition at the aqueous processing of cathodes for lithium ion batteries. Electrochim. Acta 2019, 317, 112–119. [Google Scholar] [CrossRef]
  29. Yoon, R.H.; Sabey, J.B. Coal Flotation in Inorganic Salt Solutions; Virginia Polytechnic Institute and State University: Blacksburg, VA, USA; Virginia Center for Coal and Energy Research: Blacksburg, VA, USA, 1982. [Google Scholar]
  30. Pegram, L.M.; Record, M.T. Hofmeister Salt Effects on Surface Tension Arise from Partitioning of Anions and Cations between Bulk Water and the Air—Water Interface. J. Phys. Chem. B 2007, 111, 5411–5417. [Google Scholar] [CrossRef] [PubMed]
  31. Fuerstenau, D.W.; Pradip. Zeta potentials in the flotation of oxide and silicate minerals. Adv. Colloid Interface Sci. 2005, 114–115, 9–26. [Google Scholar] [CrossRef] [PubMed]
  32. Battino, R.; Rettich, T.R.; Tominaga, T. The Solubility of Nitrogen and Air in Liquids. J. Phys. Chem. Ref. Data 1984, 13, 563–600. [Google Scholar] [CrossRef]
  33. Morrison, T.J.; Billett, F. The salting-out of non-electrolytes. Part II. The effect of variation in non-electrolyte. J. Chem. Soc. 1952, 3819–3822. [Google Scholar] [CrossRef]
  34. Paulson, O.; Pugh, R.J. Flotation of Inherently Hydrophobic Particles in Aqueous Solutions of Inorganic Electrolytes. Langmuir 1996, 12, 4808–4813. [Google Scholar] [CrossRef]
  35. Ditscherlein, L.; Knüpfer, P.; Peuker, U.A. The influence of nanobubbles on the interaction forces between alumina particles and ceramic foam filters. Powder Technol. 2019, 357, 408–416. [Google Scholar] [CrossRef]
  36. Knüpfer, P.; Ditscherlein, L.; Peuker, U.A. Nanobubble enhanced agglomeration of hydrophobic powders. Colloids Surf. A Physicochem. Eng. Asp. 2017, 530, 117–123. [Google Scholar] [CrossRef]
  37. Aziz, H.A.; Ghazali, M.F.; Yusoff, M.S.; Hung, Y.-T. Waste Treatment and Management in Chlor-Alkali Industries. In Handbook of Advanced Industrial and Hazardous Wastes Management; Wang, L.K., Wang, M.-H.S., Hung, Y.-T., Shammas, N.K., Chen, J.P., Eds.; CRC Press: Boca Raton, FL, USA, 2017; pp. 611–655. [Google Scholar]
  38. Warren, J.K. Solution Mining and Salt Cavern Usage. In Evaporites: A Geological Compendium; Warren, J.K., Ed.; Springer International Publishing: Cham, Switzerland, 2016; pp. 1303–1374. [Google Scholar]
  39. Jara, A.D.; Betemariam, A.; Woldetinsae, G.; Kim, J.Y. Purification, application and current market trend of natural graphite: A review. Int. J. Min. Sci. Technol. 2019, 29, 671–689. [Google Scholar] [CrossRef]
  40. Panagopoulos, A. Study and evaluation of the characteristics of saline wastewater (brine) produced by desalination and industrial plants. Environ. Sci. Pollut. Res. Int. 2022, 29, 23736–23749. [Google Scholar] [CrossRef] [PubMed]
  41. Guo, L.; Xie, Y.; Sun, W.; Xu, Y.; Sun, Y. Research Progress of High-Salinity Wastewater Treatment Technology. Water 2023, 15, 684. [Google Scholar] [CrossRef]
  42. Wang, B.; Peng, Y. The effect of saline water on mineral flotation—A critical review. Miner. Eng. 2014, 66–68, 13–24. [Google Scholar] [CrossRef]
  43. Cao, L.; Peng, Y.; Liu, Q. Interactions of NaCl with frother surfactants in producing microbubbles through modifying air/water interfacial energy and interfacial charge. J. Mol. Liq. 2023, 389, 122889. [Google Scholar] [CrossRef]
  44. Li, C.; Somasundaran, P. Reversal of bubble charge in multivalent inorganic salt solutions—Effect of magnesium. J. Colloid Interface Sci. 1991, 146, 215–218. [Google Scholar] [CrossRef]
  45. Liu, B.; Manica, R.; Zhang, X.; Bussonniere, A.; Xu, Z.; Xie, G.; Liu, Q. Dynamic Interaction between a Millimeter-Sized Bubble and Surface Microbubbles in Water. Langmuir 2018, 34, 11667–11675. [Google Scholar] [CrossRef] [PubMed]
  46. Vakarelski, I.U.; Manica, R.; Tang, X.; O’Shea, S.J.; Stevens, G.W.; Grieser, F.; Dagastine, R.R.; Chan, D.Y. Dynamic interactions between microbubbles in water. Proc. Natl. Acad. Sci. USA 2010, 107, 11177–11182. [Google Scholar] [CrossRef] [PubMed]
  47. Zhang, X.; Manica, R.; Tang, Y.; Liu, Q.; Xu, Z. Bubbles with tunable mobility of surfaces in ethanol-NaCl aqueous solutions. J. Colloid Interface Sci. 2019, 556, 345–351. [Google Scholar] [CrossRef]
  48. Carnie, S.L.C.; Derek, Y.C.; Lewis, C.; Manica, R.; Dagastine, R.R. Carnie_Dagastine_2005_Measurement of Dynamical Forces between Deformable Drops Using the Atomic Force Microscope. I. Theory. Langmuir 2005, 21, 2912–2922. [Google Scholar] [CrossRef]
  49. Dagastine, R.R.; Webber, G.B.; Manica, R.; Stevens, G.W.; Grieser, F.; Chan, D.Y.C. Viscosity Effects on Hydrodynamic Drainage Force Measurements Involving Deformable Bodies. Langmuir 2010, 26, 11921–11927. [Google Scholar] [CrossRef]
  50. Lin, C.Y.; Slattery, J.C. Thinning of a liquid film as a small drop or bubble approaches a solid plane. AIChE J. 1982, 28, 147–156. [Google Scholar] [CrossRef]
  51. Vinogradova, O.I. Drainage of a thin liquid film confined between hydrophobic surfaces. Langmuir 1995, 11, 2213–2220. [Google Scholar] [CrossRef]
  52. Zhang, X.; Manica, R.; Tang, Y.; Tchoukov, P.; Liu, Q.; Xu, Z. Probing Boundary Conditions at Hydrophobic Solid-Water Interfaces by Dynamic Film Drainage Measurement. Langmuir 2018, 34, 12025–12035. [Google Scholar] [CrossRef]
  53. Chan, D.Y.; Dagastine, R.R.; White, L.R. Forces between a Rigid Probe Particle and a Liquid Interface. J. Colloid Interface Sci. 2001, 236, 141–154. [Google Scholar] [CrossRef] [PubMed]
  54. Aston, D.E.; Berg, J.C. Thin-Film Hydrodynamics in Fluid Interface-Atomic Force Microscopy. Ind. Eng. Chem. Res. 2001, 41, 389–396. [Google Scholar] [CrossRef]
  55. Shi, C.; Chan, D.Y.C.; Liu, Q.; Zeng, H. Probing the Hydrophobic Interaction between Air Bubbles and Partially Hydrophobic Surfaces Using Atomic Force Microscopy. J. Phys. Chem. C 2014, 118, 25000–25008. [Google Scholar] [CrossRef]
  56. Xing, Y.; Gui, X.; Cao, Y. Effect of bubble size on bubble-particle attachment and film drainage kinetics—A theoretical study. Powder Technol. 2017, 322, 140–146. [Google Scholar] [CrossRef]
  57. Hogg, R.; Healy, T.W.; Fuerstenau, D.W. Mutual Coagulation of Colloidal Dispersions. Trans. Faraday Soc. 1966, 62, 1638–1651. [Google Scholar] [CrossRef]
  58. Pushkarova, R.A.; Horn, R.G. Bubble-Solid Interactions in Water and Electrolyte Solutions. Langmuir 2008, 24, 8726–8734. [Google Scholar] [CrossRef]
  59. Israelachvili, J.N. Intermolecular and Surface Forces, 3rd ed.; Academic Press: New York, NY, USA; Elsevier: Amsterdam, The Netherlands, 2011. [Google Scholar]
  60. Parsons, D.F.; Bostrom, M.; Lo Nostro, P.; Ninham, B.W. Hofmeister effects: Interplay of hydration, nonelectrostatic potentials, and ion size. Phys. Chem. Chem. Phys. 2011, 13, 12352–12367. [Google Scholar] [CrossRef] [PubMed]
  61. Li, H.; Liu, M.; Liu, Q. The effect of non-polar oil on fine hematite flocculation and flotation using sodium oleate or hydroxamic acids as a collector. Miner. Eng. 2018, 119, 105–115. [Google Scholar] [CrossRef]
  62. Huang, K.; Yoon, R.-H. Effect of ζ-Potentials on Bubble-Particle Interactions. Min. Metall. Explor. 2019, 36, 21–34. [Google Scholar] [CrossRef]
  63. Sunkel, J.M.; Berg, J.C. The Stability Behavior of Sol-Emulsion Systems. J. Colloid Interface Sci. 1996, 179, 618–624. [Google Scholar] [CrossRef]
  64. Duan, J.; Wang, J.; Guo, T.; Gregory, J. Zeta potentials and sizes of aluminum salt precipitates—Effect of anions and organics and implications for coagulation mechanisms. J. Water Process Eng. 2014, 4, 224–232. [Google Scholar] [CrossRef]
  65. Krasowska, M.; Carnie, S.L.; Fornasiero, D.; Ralston, J. Ultrathin Wetting Films on Hydrophilic Titania Surfaces: Equilibrium and Dynamic Behavior. J. Phys. Chem. C 2011, 115, 11065–11076. [Google Scholar] [CrossRef]
  66. Bowen, W.R.; Jenner, F. The calculation of dispersion forces for engineering applications. Adv. Colloid Interface Sci. 1995, 56, 201–243. [Google Scholar] [CrossRef]
  67. Tabor, D.; Winterton, R.H.S. The Direct Measurement of Normal and Retarded van der Waals Forces. Proc. R. Soc. Lond. Ser. A Math. Phys. Sci. 1969, 312, 435–450. [Google Scholar] [CrossRef]
  68. Hough, D.B.; White, L.R. The calculation of hamaker constants from liftshitz theory with applications to wetting phenomena. Adv. Colloid Interface Sci. 1980, 14, 3–41. [Google Scholar] [CrossRef]
  69. Owens, N.F.; Richmond, P. Hamaker Constants and Combining Rules. J. Chem. Soc. Faraday Trans. 2 Mol. Chem. Phys. 1978, 74, 691–695. [Google Scholar] [CrossRef]
  70. Parsegian, A.V. Van der Waals Forces: A Handbook for Biologists, Chemists, Engineers, and Physicists; Cambridge University Press: Cambridge, UK, 2005. [Google Scholar]
  71. Bergström, L. Hamaker constants of inorganic materials. Adv. Colloid Interface Sci. 1997, 70, 125–169. [Google Scholar] [CrossRef]
  72. Dagastine, R.R.; Prieve, D.C.; White, L.R. Calculations of van der Waals forces in 2-dimensionally anisotropic materials and its application to carbon black. J. Colloid Interface Sci. 2002, 249, 78–83. [Google Scholar] [CrossRef]
  73. Rubin, M.; von Rottkay, K.; Wen, S.-J.; Özer, N.; Slack, J. Optical indices of lithiated electrochromic oxides. Sol. Energy Mater. Sol. Cells 1998, 54, 49–57. [Google Scholar] [CrossRef]
  74. Draine, B.T. Graphite Revisited. Astrophys. J. 2016, 831, 109. [Google Scholar] [CrossRef]
  75. Tolias, P. Lifshitz calculations of Hamaker constants for fusion relevant materials. Fusion Eng. Des. 2018, 133, 110–116. [Google Scholar] [CrossRef]
  76. Nguyen, A.V.; Evans, G.M.; Schulze, H.J. Prediction of van der Waals interaction in bubble–particle attachment in flotation. Int. J. Miner. Process. 2001, 61, 155–169. [Google Scholar] [CrossRef]
  77. Sherman, H.; Nguyen, A.V.; Bruckard, W. An Analysis of Bubble Deformation by a Sphere Relevant to the Measurements of Bubble-Particle Contact Interaction and Detachment Forces. Langmuir 2016, 32, 12022–12030. [Google Scholar] [CrossRef]
  78. Nguyen, A.; Schulze, H.J. Colloidal Science of Flotation; CRC Press: Boca Raton, FL, USA, 2003; Volume 118. [Google Scholar]
  79. Shi, C.; Cui, X.; Xie, L.; Liu, Q.; Chan, D.Y.; Israelachvili, J.N.; Zeng, H. Measuring Forces and Spatiotemporal Evolution of Thin Water Films between an Air Bubble and Solid Surfaces of Different Hydrophobicity. ACS Nano 2015, 9, 95–104. [Google Scholar] [CrossRef]
  80. Liu, B.; Manica, R.; Liu, Q.; Klaseboer, E.; Xu, Z.; Xie, G. Coalescence of Bubbles with Mobile Interfaces in Water. Phys. Rev. Lett. 2019, 122, 194501. [Google Scholar] [CrossRef]
  81. Zhang, X.; Manica, R.; Tchoukov, P.; Liu, Q.; Xu, Z. Effect of Approach Velocity on Thin Liquid Film Drainage between an Air Bubble and a Flat Solid Surface. J. Phys. Chem. C 2017, 121, 5573–5584. [Google Scholar] [CrossRef]
  82. Lee, T.; Charrault, E.; Neto, C. Interfacial slip on rough, patterned and soft surfaces: A review of experiments and simulations. Adv. Colloid Interface Sci. 2014, 210, 21–38. [Google Scholar] [CrossRef]
  83. Guriyanova, S.; Semin, B.; Rodrigues, T.S.; Butt, H.J.; Bonaccurso, E. Hydrodynamic drainage force in a highly confined geometry: Role of surface roughness on different length scales. Microfluid. Nanofluidics 2009, 8, 653–663. [Google Scholar] [CrossRef]
  84. Miksis, M.J.; Davis, S.H. Slip over rough and coated surfaces. J. Fluid Mech. 1994, 273, 125–139. [Google Scholar] [CrossRef]
  85. Parkinson, L.; Ralston, J. The Interaction between a Very Small Rising Bubble and a Hydrophilic Titania Surface. J. Phys. Chem. C 2010, 114, 2273–2281. [Google Scholar] [CrossRef]
  86. Schulze, H.J. Hydrodynamics of Bubble-Mineral Particle Collisions. Miner. Process. Extr. Metall. Rev. 1989, 5, 43–76. [Google Scholar] [CrossRef]
Figure 1. AFM-topography scans of NMC (a,b) and spherical graphite (c,d). Overview scans of particles (a,c) and detail scans of particle surfaces (b,d).
Minerals 15 00809 g001
Figure 2. AFM configuration for particle–bubble interactions and SRYL model for film drainage (not to scale). Interaction zone r < rmax is marked in red. Inset shows schematic flow profiles for immobile (no-slip) and partially mobile (slip) interfaces with slip length bh and b0 on either side of the film.
Minerals 15 00809 g002
Figure 3. Three-phase contact line between spherical particle and gas bubble.
Minerals 15 00809 g003
Figure 4. Stirred tank setup for froth flotation and dynamic image analysis.
Minerals 15 00809 g004
Figure 5. Electric double layer interactions: (a) Zeta potential ζ of NMC and spherical graphite in salt solutions as a function of the pH value. The zeta potentials of gas bubbles for pH 2–12 in 10 mmol/L NaCl were taken from Li et al. [44]. Electric double layer disjoining pressure ΠEDL(h) between gas bubbles and NMC or spherical graphite in a 1:1 electrolyte solution with concentrations of (b) 1 mmol/L and (c) 0.75 mol/L. Note the different x-axis limits in (b,c).
Minerals 15 00809 g005
Figure 6. AFM force–position curves for a NMC particle interacting with gas bubbles at pH 3 (a), and at pH 10 (b) in 1 mmol/L sodium chloride solution. Experiment: Trace (red) and retrace (blue) median force–position curves with corresponding 80% confidence interval (CI). Simulation (black): Stokes–Reynolds–Young–Laplace model (SRYL).
Minerals 15 00809 g006
Figure 7. Pressure in the film between a NMC particle and a gas bubble calculated from the SRYL model at points A–D in Figure 6a: (a) A, (b) B, (c) C, (d) D. The total pressure in the film (p + Π) is the sum of the hydrodynamic pressure p and the disjoining pressure Π = ΠEDL + ΠvdW. ∆PL is the Laplace pressure. The center of the film corresponds to r = 0.
Minerals 15 00809 g007
Figure 8. AFM force–position curves for a NMC particle interacting with gas bubbles at pH 3 (a) and at pH 10 (b) in 0.75 mol/L sodium chloride solution. Experiment (red): Median force–position curves with corresponding 80% confidence interval (CI). Simulation (black): Stokes–Reynolds–Young–Laplace model (SRYL).
Minerals 15 00809 g008
Figure 9. CP-AFM measurements for spherical graphite interacting with gas bubbles in sodium chloride solutions. (a) pH 3 1 mmol/L, (b) pH 10 1 mmol/L, (c) pH 3 0.75 mol/L, and (d) pH 10 0.75 mol/L. RCP and Rb are the radii of particles and sessile bubbles in the experiments.
Minerals 15 00809 g009
Figure 10. Trace curves for NMC and spherical graphite interacting with sessile bubbles. The particles are forced into the gas bubble after film rupture (z = 0 µm), where they are repulsed from the bubble as soon as they reached the pseudo-equilibrium position at Feq,1.
Minerals 15 00809 g010
Figure 11. Particle retraction and detachment of NMC and spherical graphite from gas bubbles in acidic 1:1 electrolyte solutions (ac). For marker values, see Supplementary Material S2.4.
Minerals 15 00809 g011
Figure 12. The three-phase contact line (TPCL) of NMC (ac) and spherical graphite (df) during detachment from gas bubbles calculated from the capillary force model Equations (23) and (24): θ t three-phase contact angle (a,d), β inclination of the bubble interface at the TPCL (b,e), and α opening angle (c,f).
Minerals 15 00809 g012
Figure 13. The bubble interface profile (a) at the point of detachment Fdet for spherical graphite in 0.75 mol/L NaCl + 0.01 mol/L NaOAc buffer solution with pH 3.5. The green box indicates the close-up (b) of the region around the three-phase contact line (TPCL).
Minerals 15 00809 g013
Figure 14. (a) Graphite-stabilized froth at pH 3.5 for t < 2 min, (b) recovery of graphite and NMC in the concentrates C1 to C5. (c) Fuerstenau II plot. Graphite–bubble hetero-coagulates in 0.75 mol/L sodium chloride solution at (d) pH 3, (e) pH 10, and (f) at pH 3.5 with 0.01 mol/L NaOAc buffer added.
Minerals 15 00809 g014
Table 1. Surface tension from bubble pressure measurements.
Liquid PhaseSurface Tension γ in mN/m
1 mmol/L NaCl 71.39 ± 0.10
0.75 mol/L NaCl 73.43 ± 0.12
0.75 mol/L NaCl + 0.01 mol/L buffer 72.84 ± 0.03
Table 2. SRYL model parameters for NMC–bubble interactions at pH 3 and pH 10 in 1 mmol/L 1:1 electrolyte solution (SRYL 1 and SRYL 2) and at a concentration of 0.75 mol/L (SRYL 3 and SRYL 4).
ParameterSRYL 1SRYL 2SRYL 3SRYL 4Unit
pH value 310310-
salt concentration cNaCl0.0010.0010.7500.750mol/L
bubble surface potential ψ1−25−60−25−60mV
NMC surface potential ψ211−2511−25mV
Debye length κ−19.69.60.350.35nm
radius of bubble Rb8110856106µm
radius of Colloidal Probe RCP6117.56µm
effective Hamaker constant Aeff−5 × 10⁻²⁰−5 × 10⁻²⁰−5 × 10⁻²⁰−5 × 10⁻²⁰J
slip length b300300300300nm
overlap ΔXmax-101010nm
interfacial tension γ71.471.473.473.4mN/m
dynamic viscosity η0.790.790.790.79mPas
substrate contact angle θ090909090°
velocity v ∓30∓30∓30∓30µm/s
cantilever spring constant kc0.0550.0670.0540.055N/m
Table 3. The slope of the force curve Δ F / R C P Δ z during the final phase of film drainage and snap-in force F s n a p i n / R C P (Section 3.4) for the interaction of gas bubbles and NMC or spherical graphite particles. E a t t is the energy required for attachment of NMC particles to bubbles.
Liquid-PhaseNMCSpherical Graphite
E a t t / R C P 2   in   J m 2 Δ F / R C P Δ z
in   mN / m nm
F s n a p i n / R C P
in   mN m
Δ F / R C P Δ z in
mN / m nm
F s n a p i n / R C P
in   mN m
pH 3-1 mmol/L NaCl5.31 × 10−821.30.4764.68.35
pH 10-1 mmol/L NaCl4.91 × 10−8-0.5525.912.68
pH 3-0.75 mol/L NaCl9.94 × 10−929.32.55113.315.56
pH 10-0.75 mol/L NaCl1.17 × 10−728.14.2246.334.48
pH 3.5-0.75 mol/L NaCl
+ 0.01 mol/L NaOAc buffer
1.17 × 10−826.52.7376.327.02
Table 4. Maximum values of the angles θ t , β and α , which define the TPCL on black mass particles during retraction from gas bubbles. Detachment requires a particle displacement of z I away from the second pseudo-equilibrium position at F e q , 2 , a force above the pull-off force F a d h / R C P , and an energy input higher than the work for detachment Δ E m a x R C P 2 .
Liquid-PhaseParticle θ t , max in ° β max in ° α max in ° z I in µm F adh R C P   in mN/m Δ E max R C P 2   in J/m2
pH 3
1 mmol/L NaCl
NMC102.515.987.05.92243.80.011
graphite103.723.189.39.638139.30.108
pH 3
0.75 mol/L NaCl
NMC102.215.188.07.40558.50.020
graphite106.236.089.913.075209.70.228
pH 3.5-0.75 mol/L NaCl + 0.01 mol/L NaOAc bufferNMC103.717.087.89.32470.00.028
graphite106.360.690.014.548187.00.296
pH 10
1 mmol/L NaCl
NMC100.513.088.27.08948.40.014
graphite104.226.590.813.519158.10.180
pH 10
0.75 mol/L NaCl
NMC103.917.387.47.84260.60.022
graphite108.865.790.52.334234.70.294
Table 5. Parameters of first-order flotation kinetics of graphite and NMC in sodium chloride solution with a concentration of 0.75 mol/L. SMD is the Sauter mean diameter of bubbles from in-line probe measurements.
ParameterpH 3pH 10
kgraphite in s−18.1 × 10−35.2 × 10−3
kNMC in s−12.3 × 10−42.5 × 10−4
R∞,graphite0.980.98
R∞,NMC0.220.18
SMD in µm379390
V ˙ g a s in L/min1.10.9
Disclaimer/Publisher’s Note: The statements, opinions and data contained in all publications are solely those of the individual author(s) and contributor(s) and not of MDPI and/or the editor(s). MDPI and/or the editor(s) disclaim responsibility for any injury to people or property resulting from any ideas, methods, instructions or products referred to in the content.