
Genesis of Clastic Reservoirs in the First Member of Yaojia Formation, Northern Songliao Basin


Abstract
1. Introduction
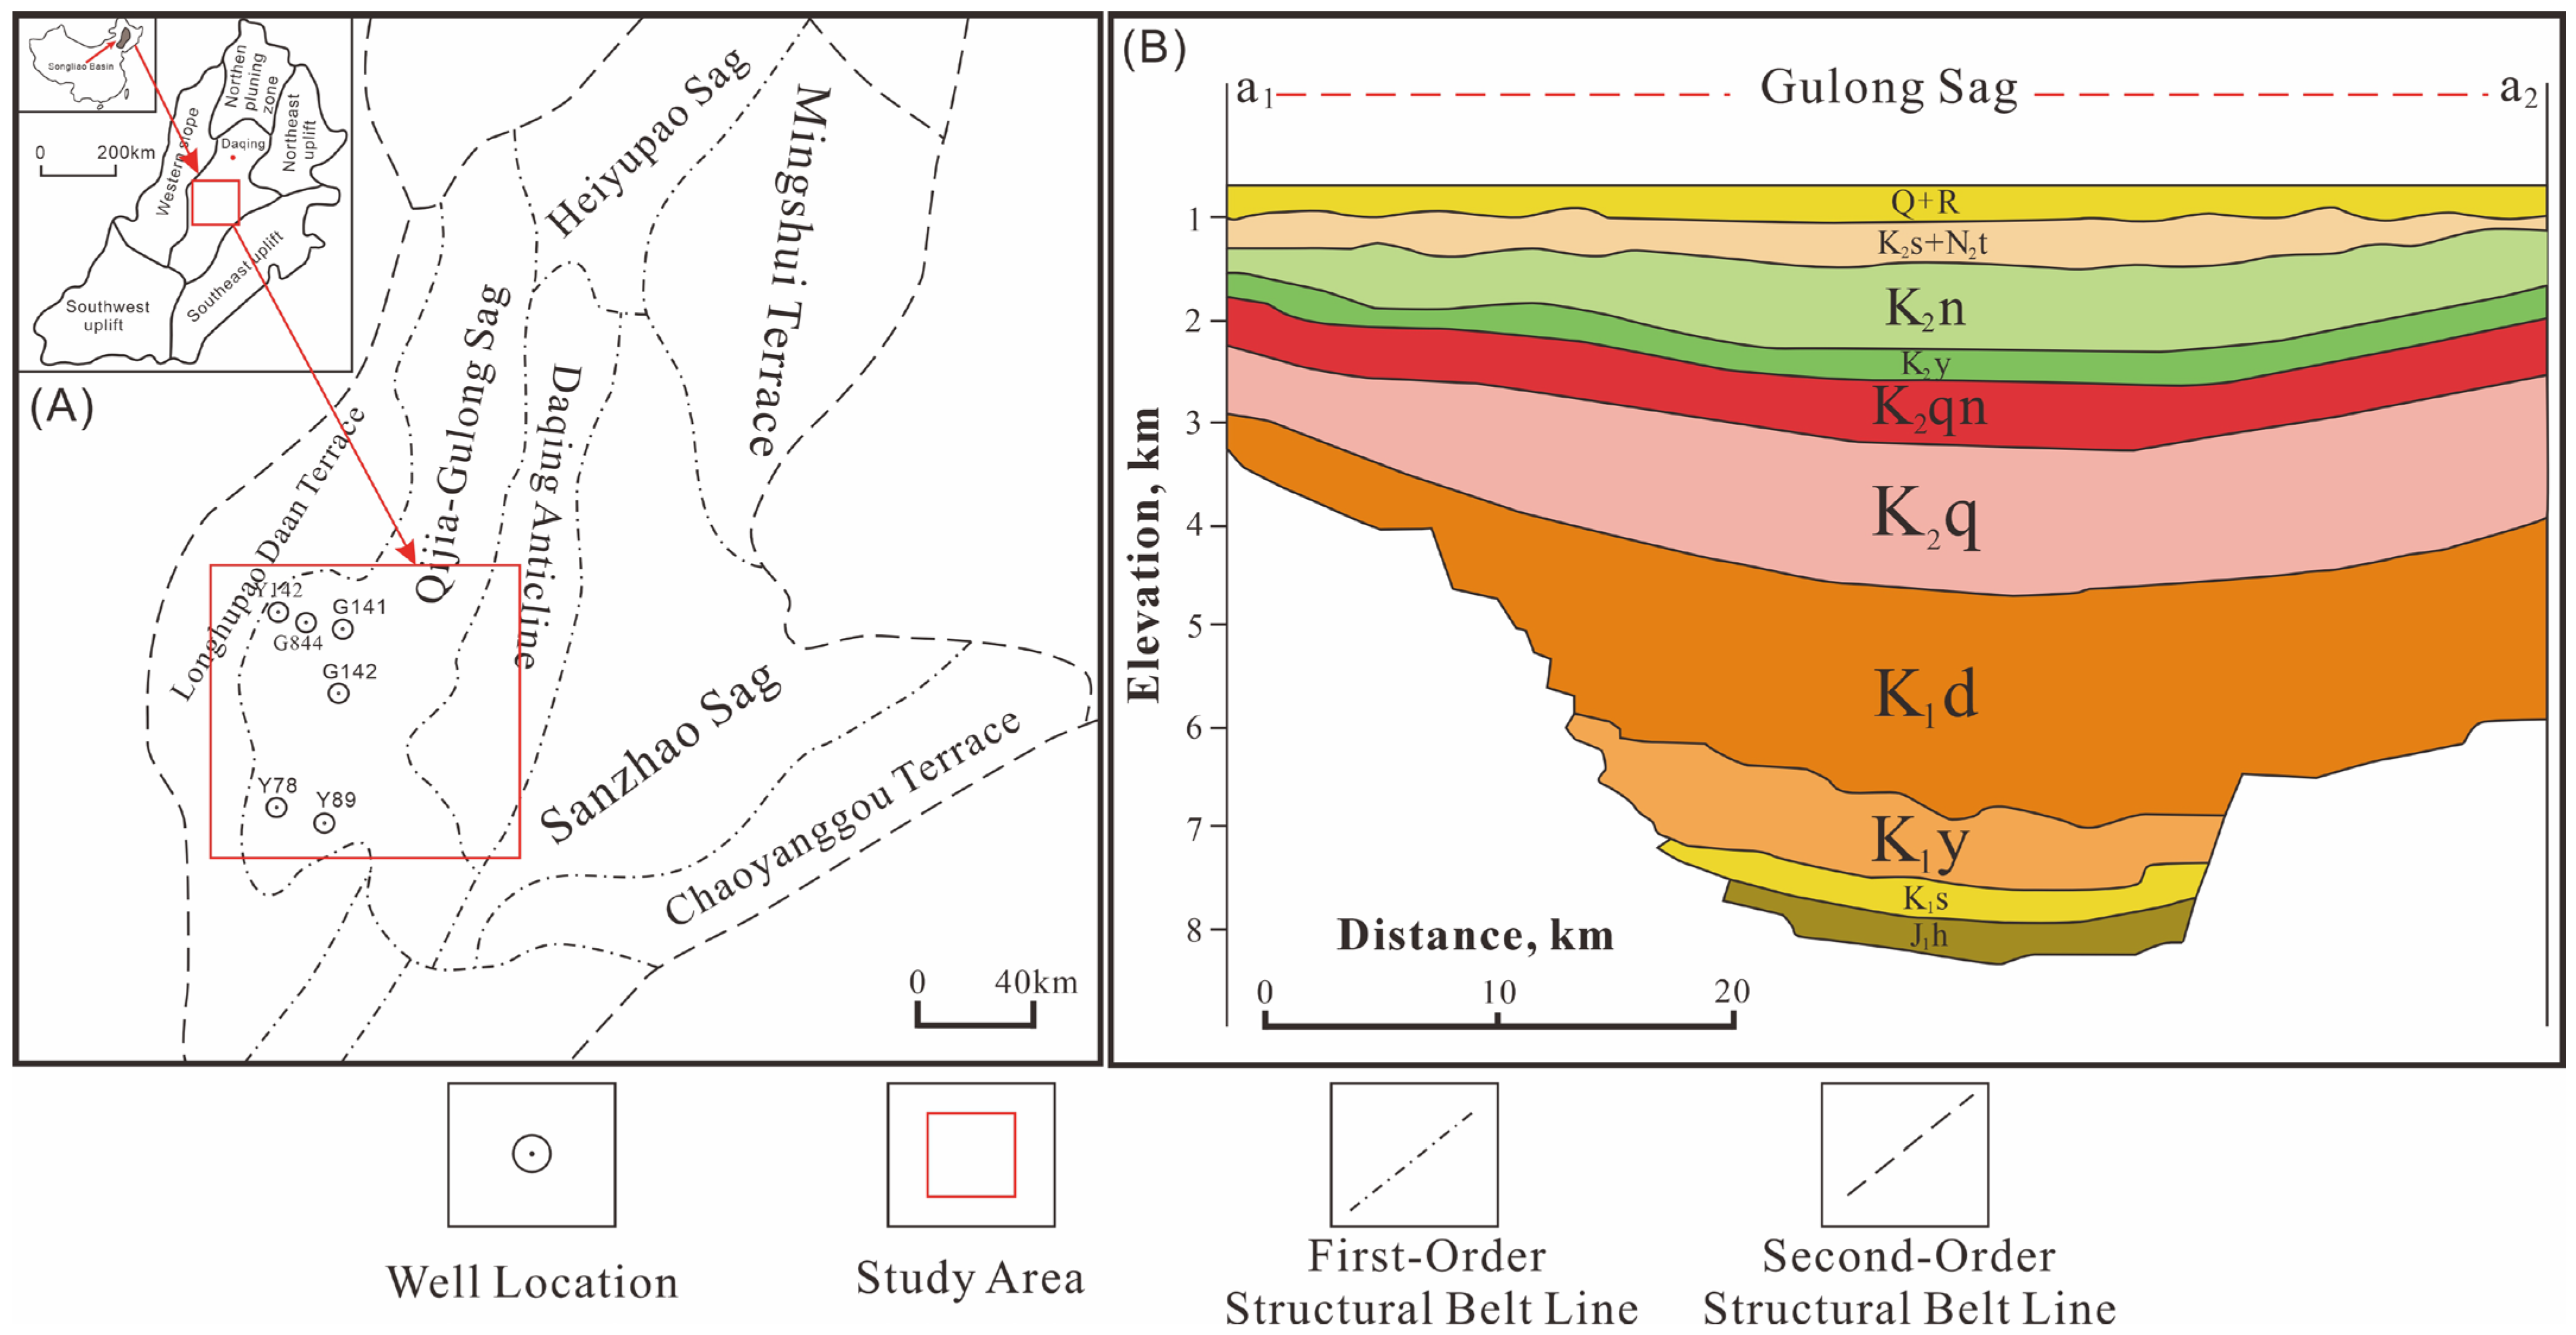
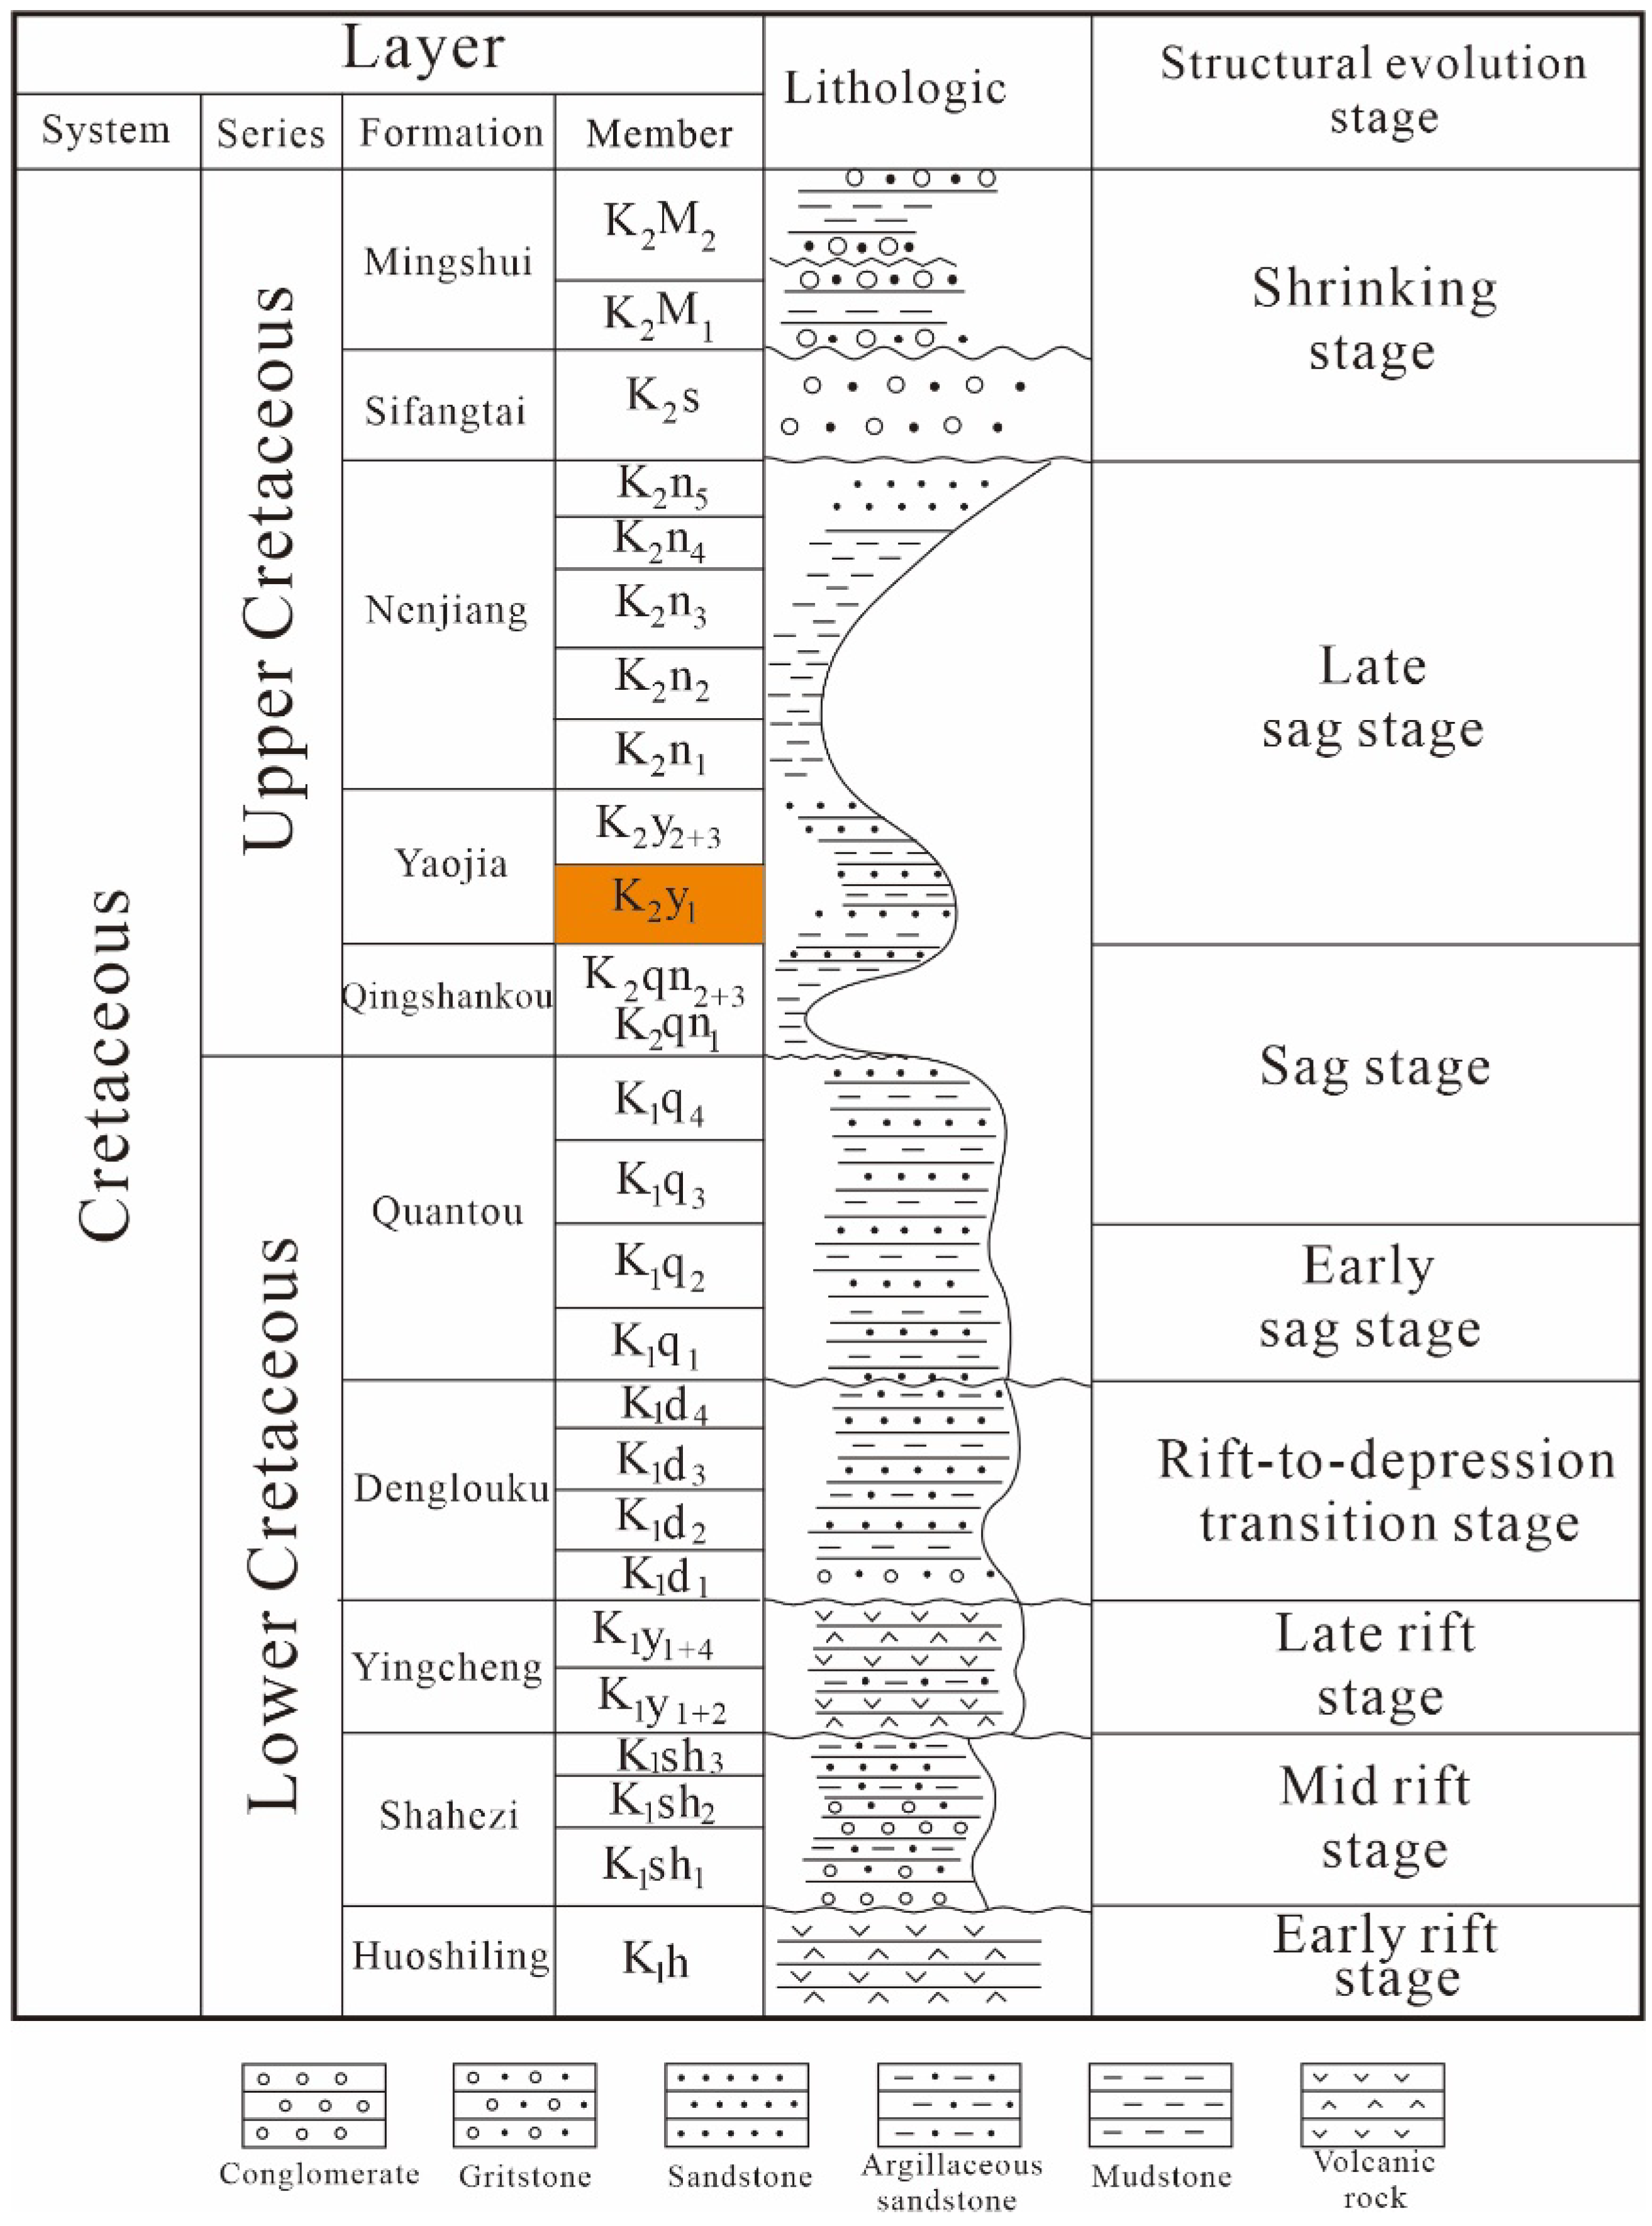
2. Geological Setting
3. Sample and Method
4. Results
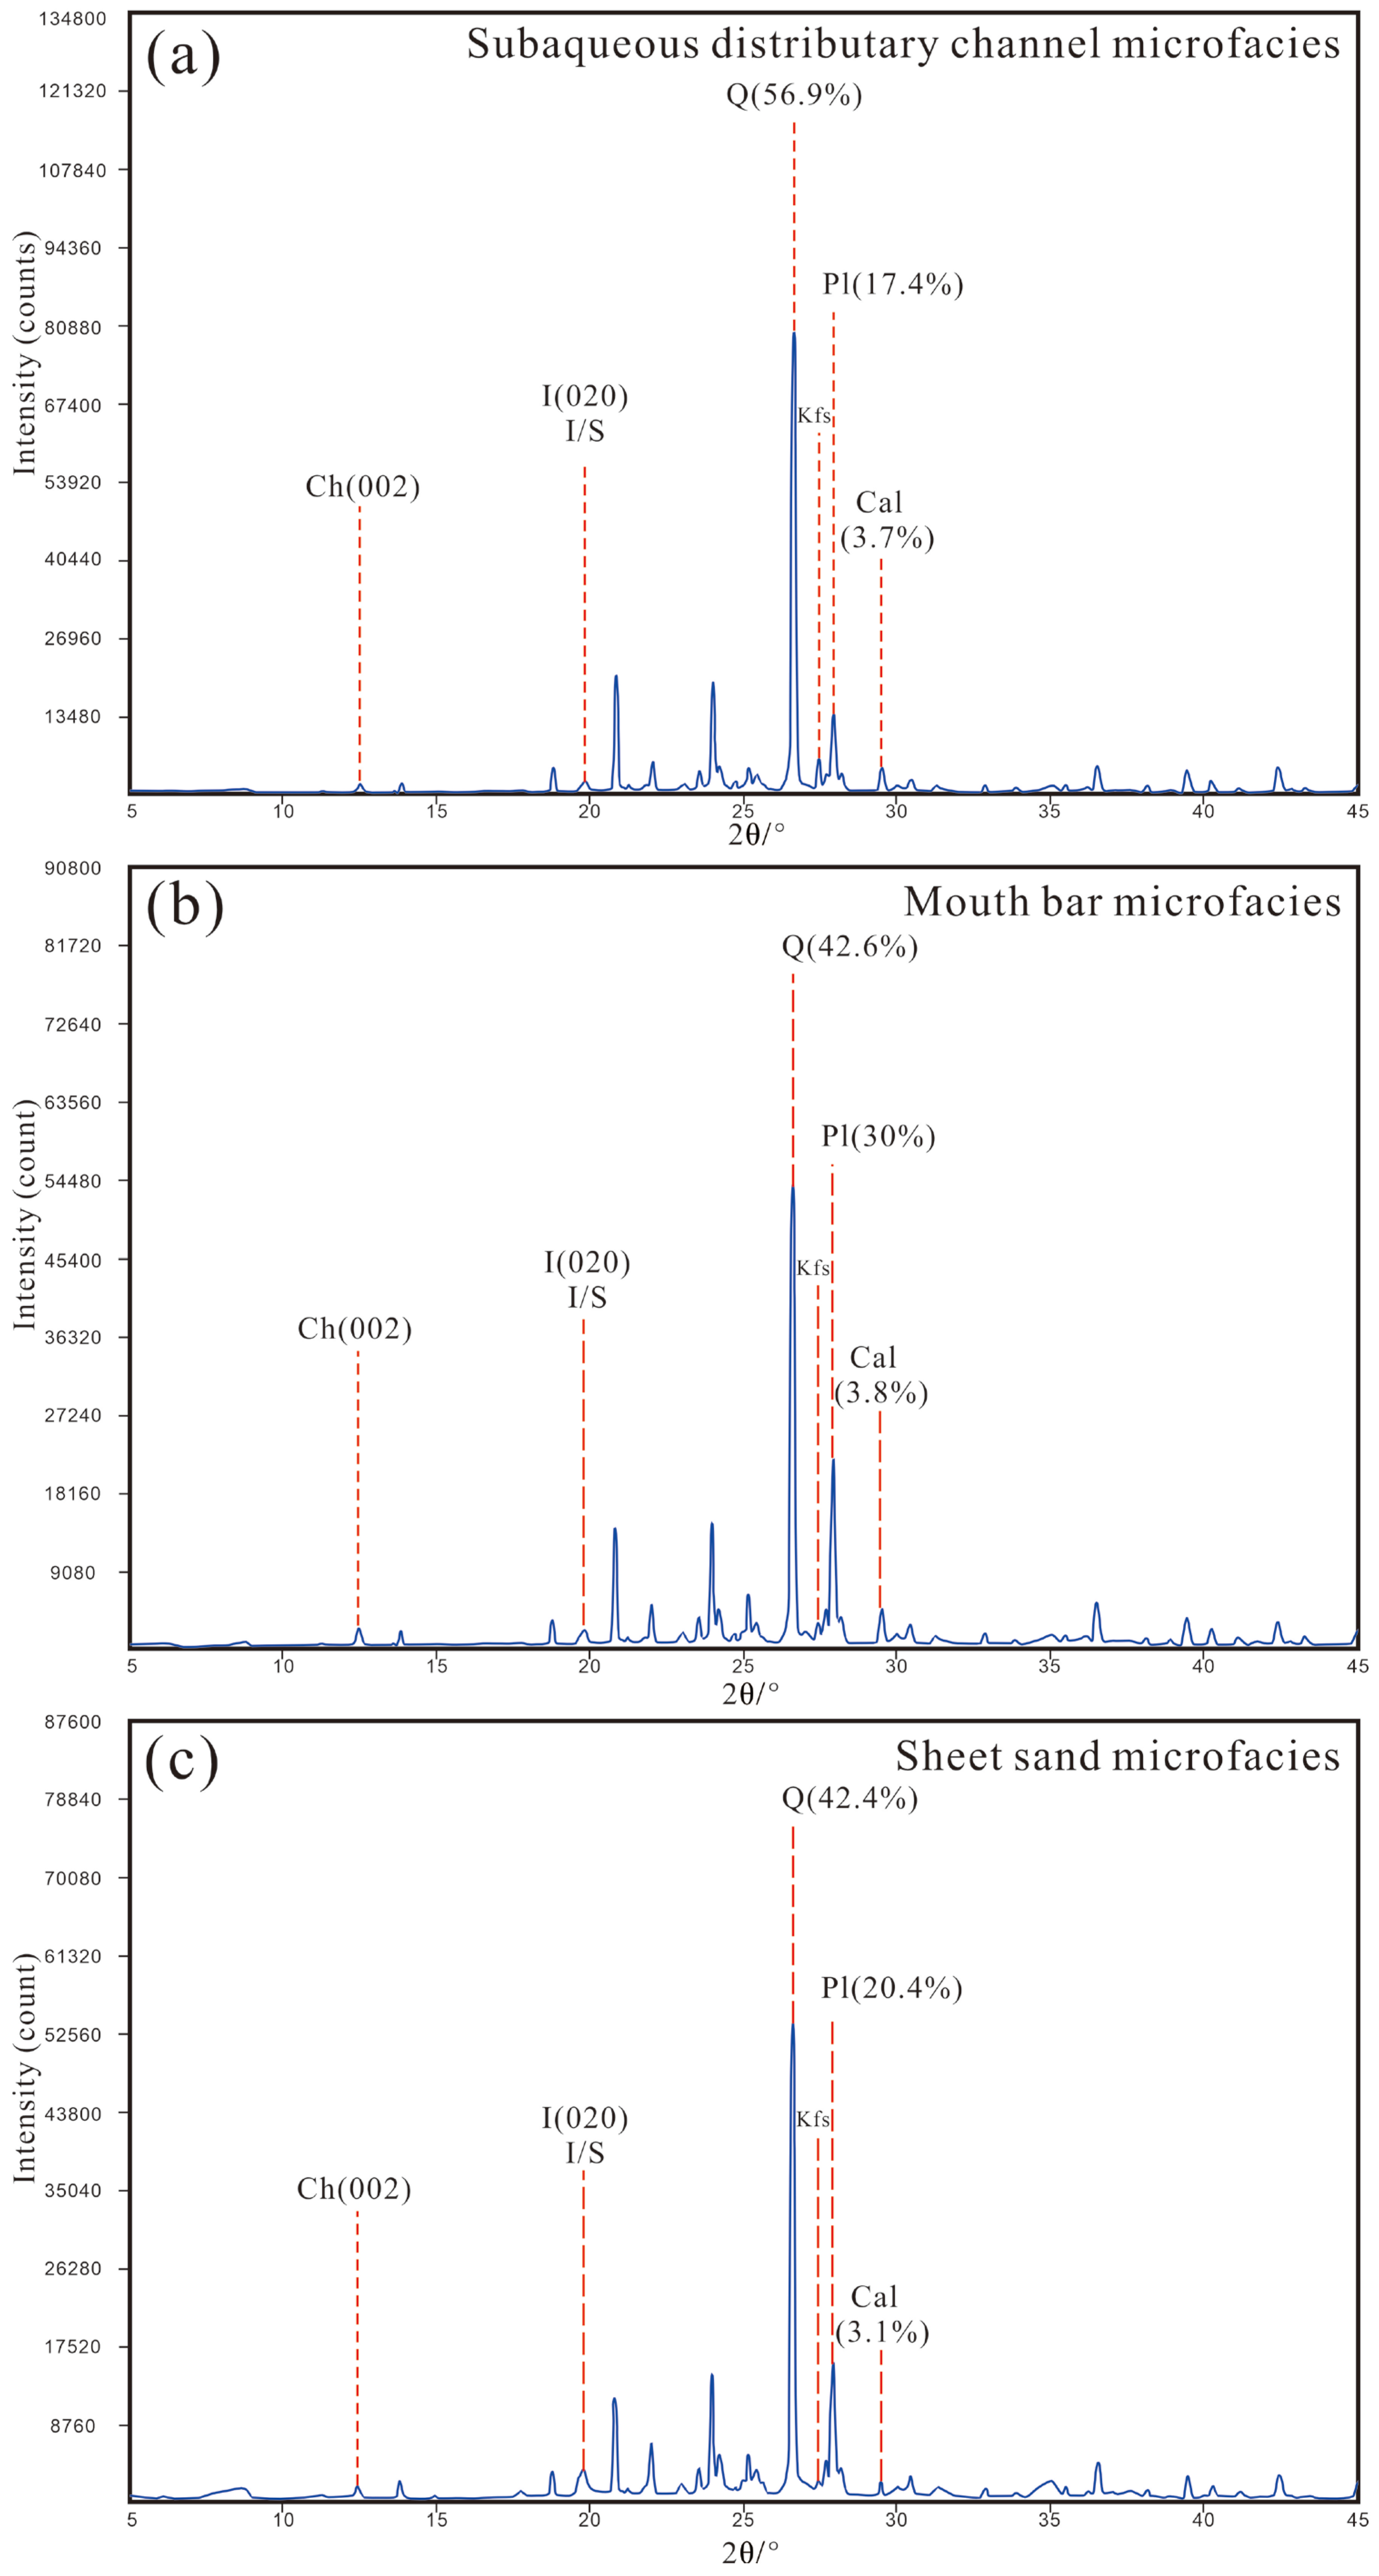
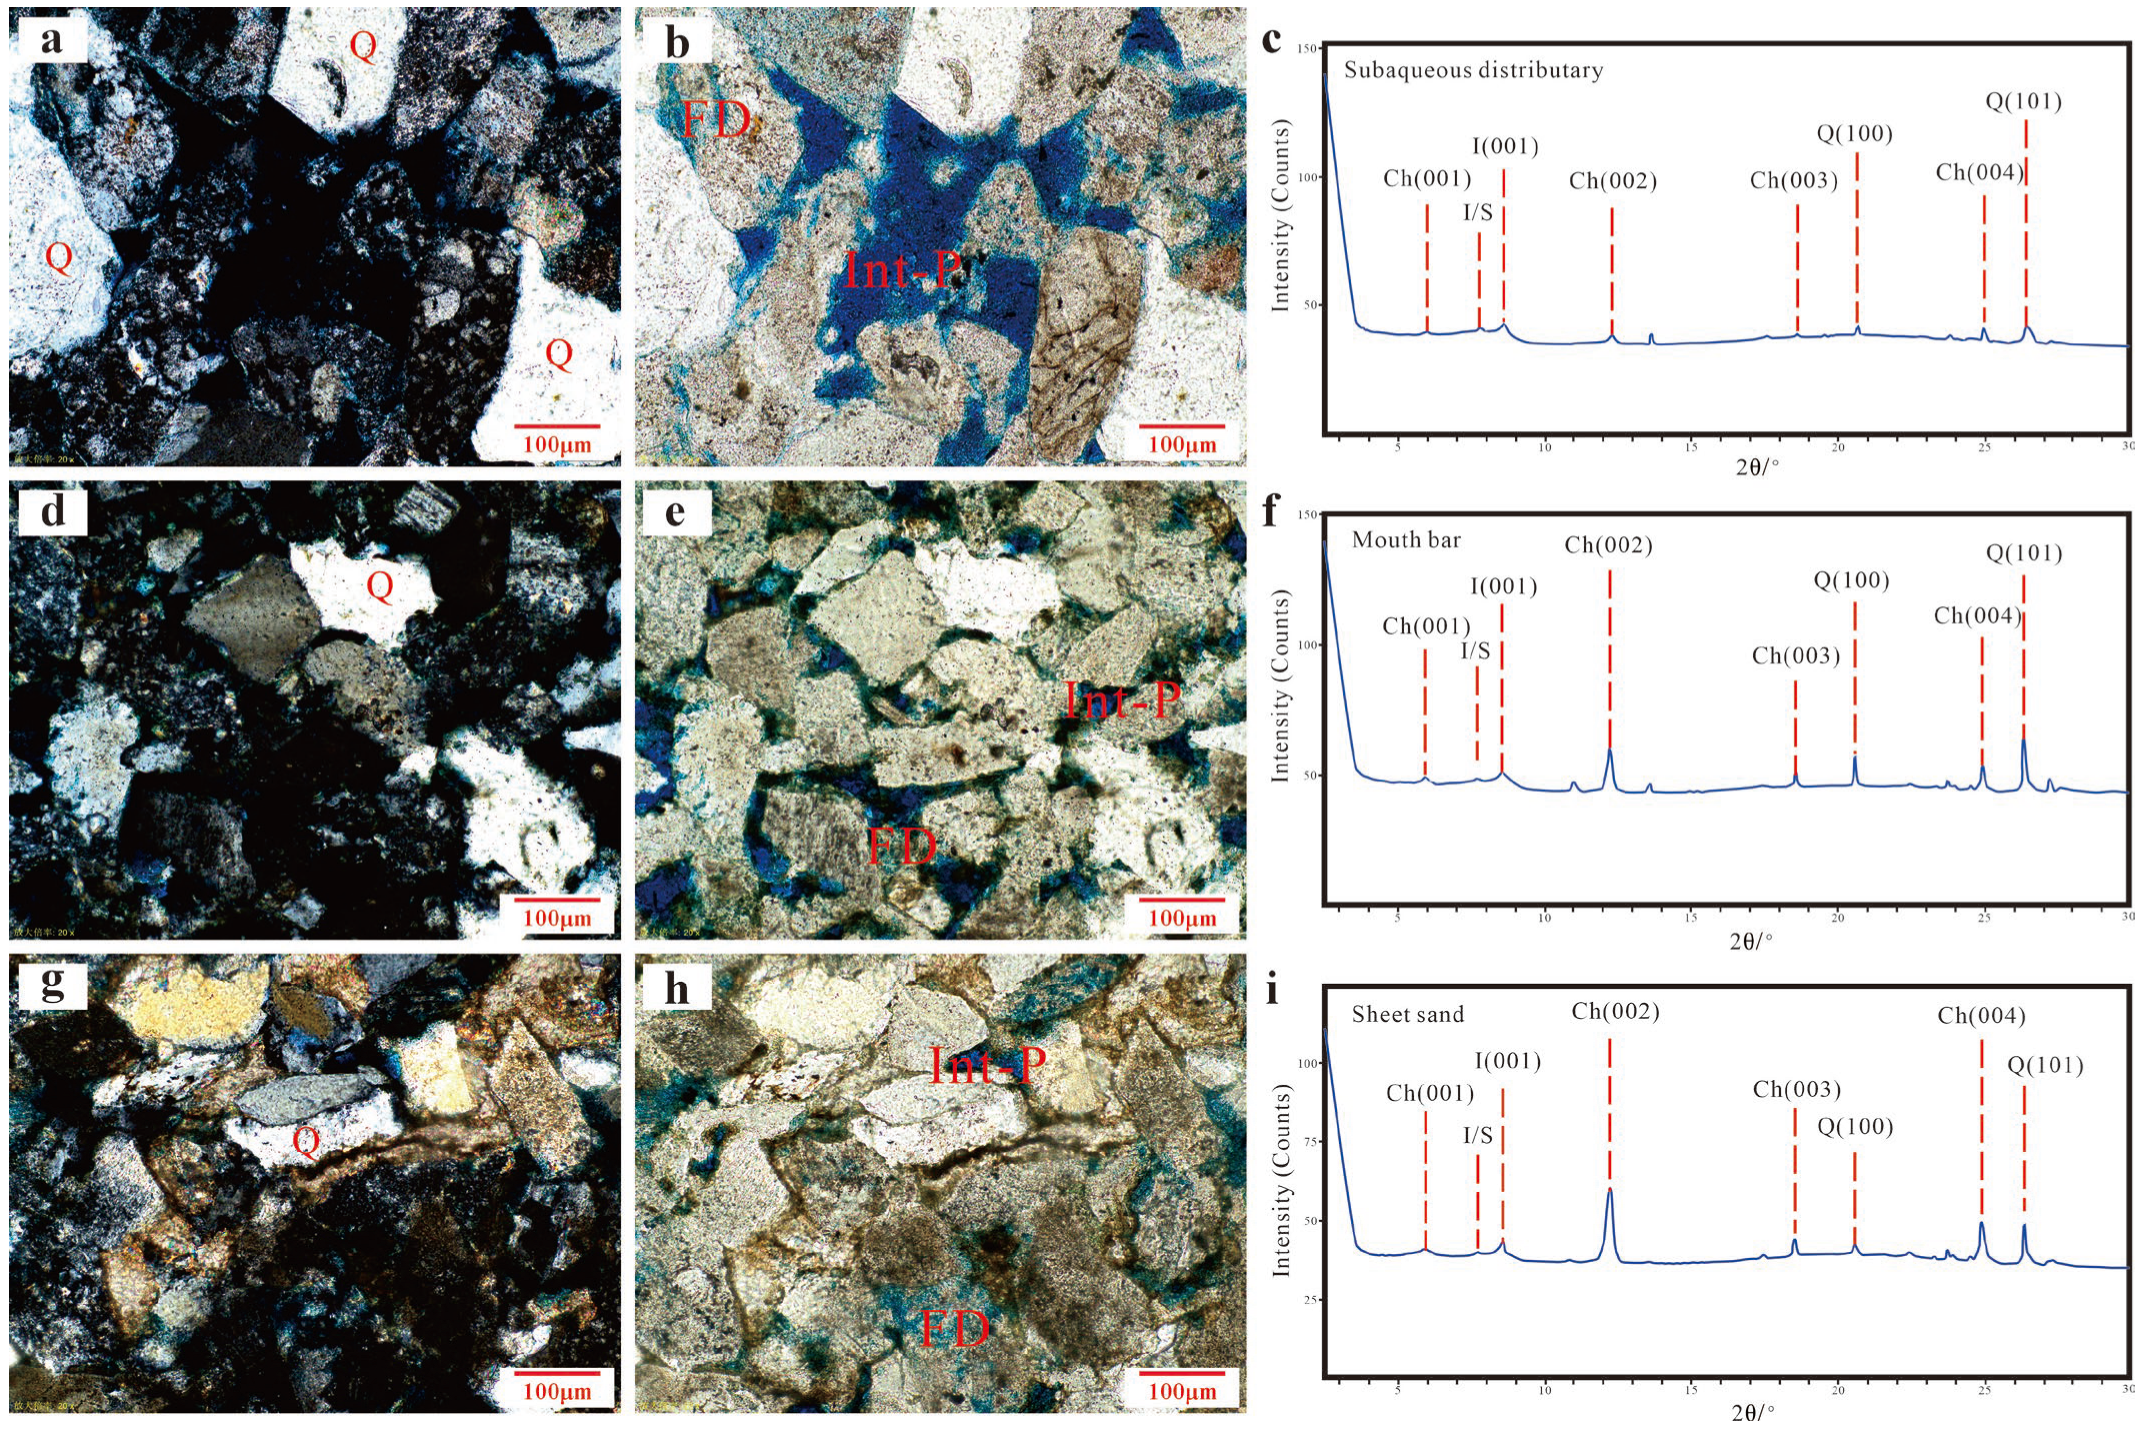
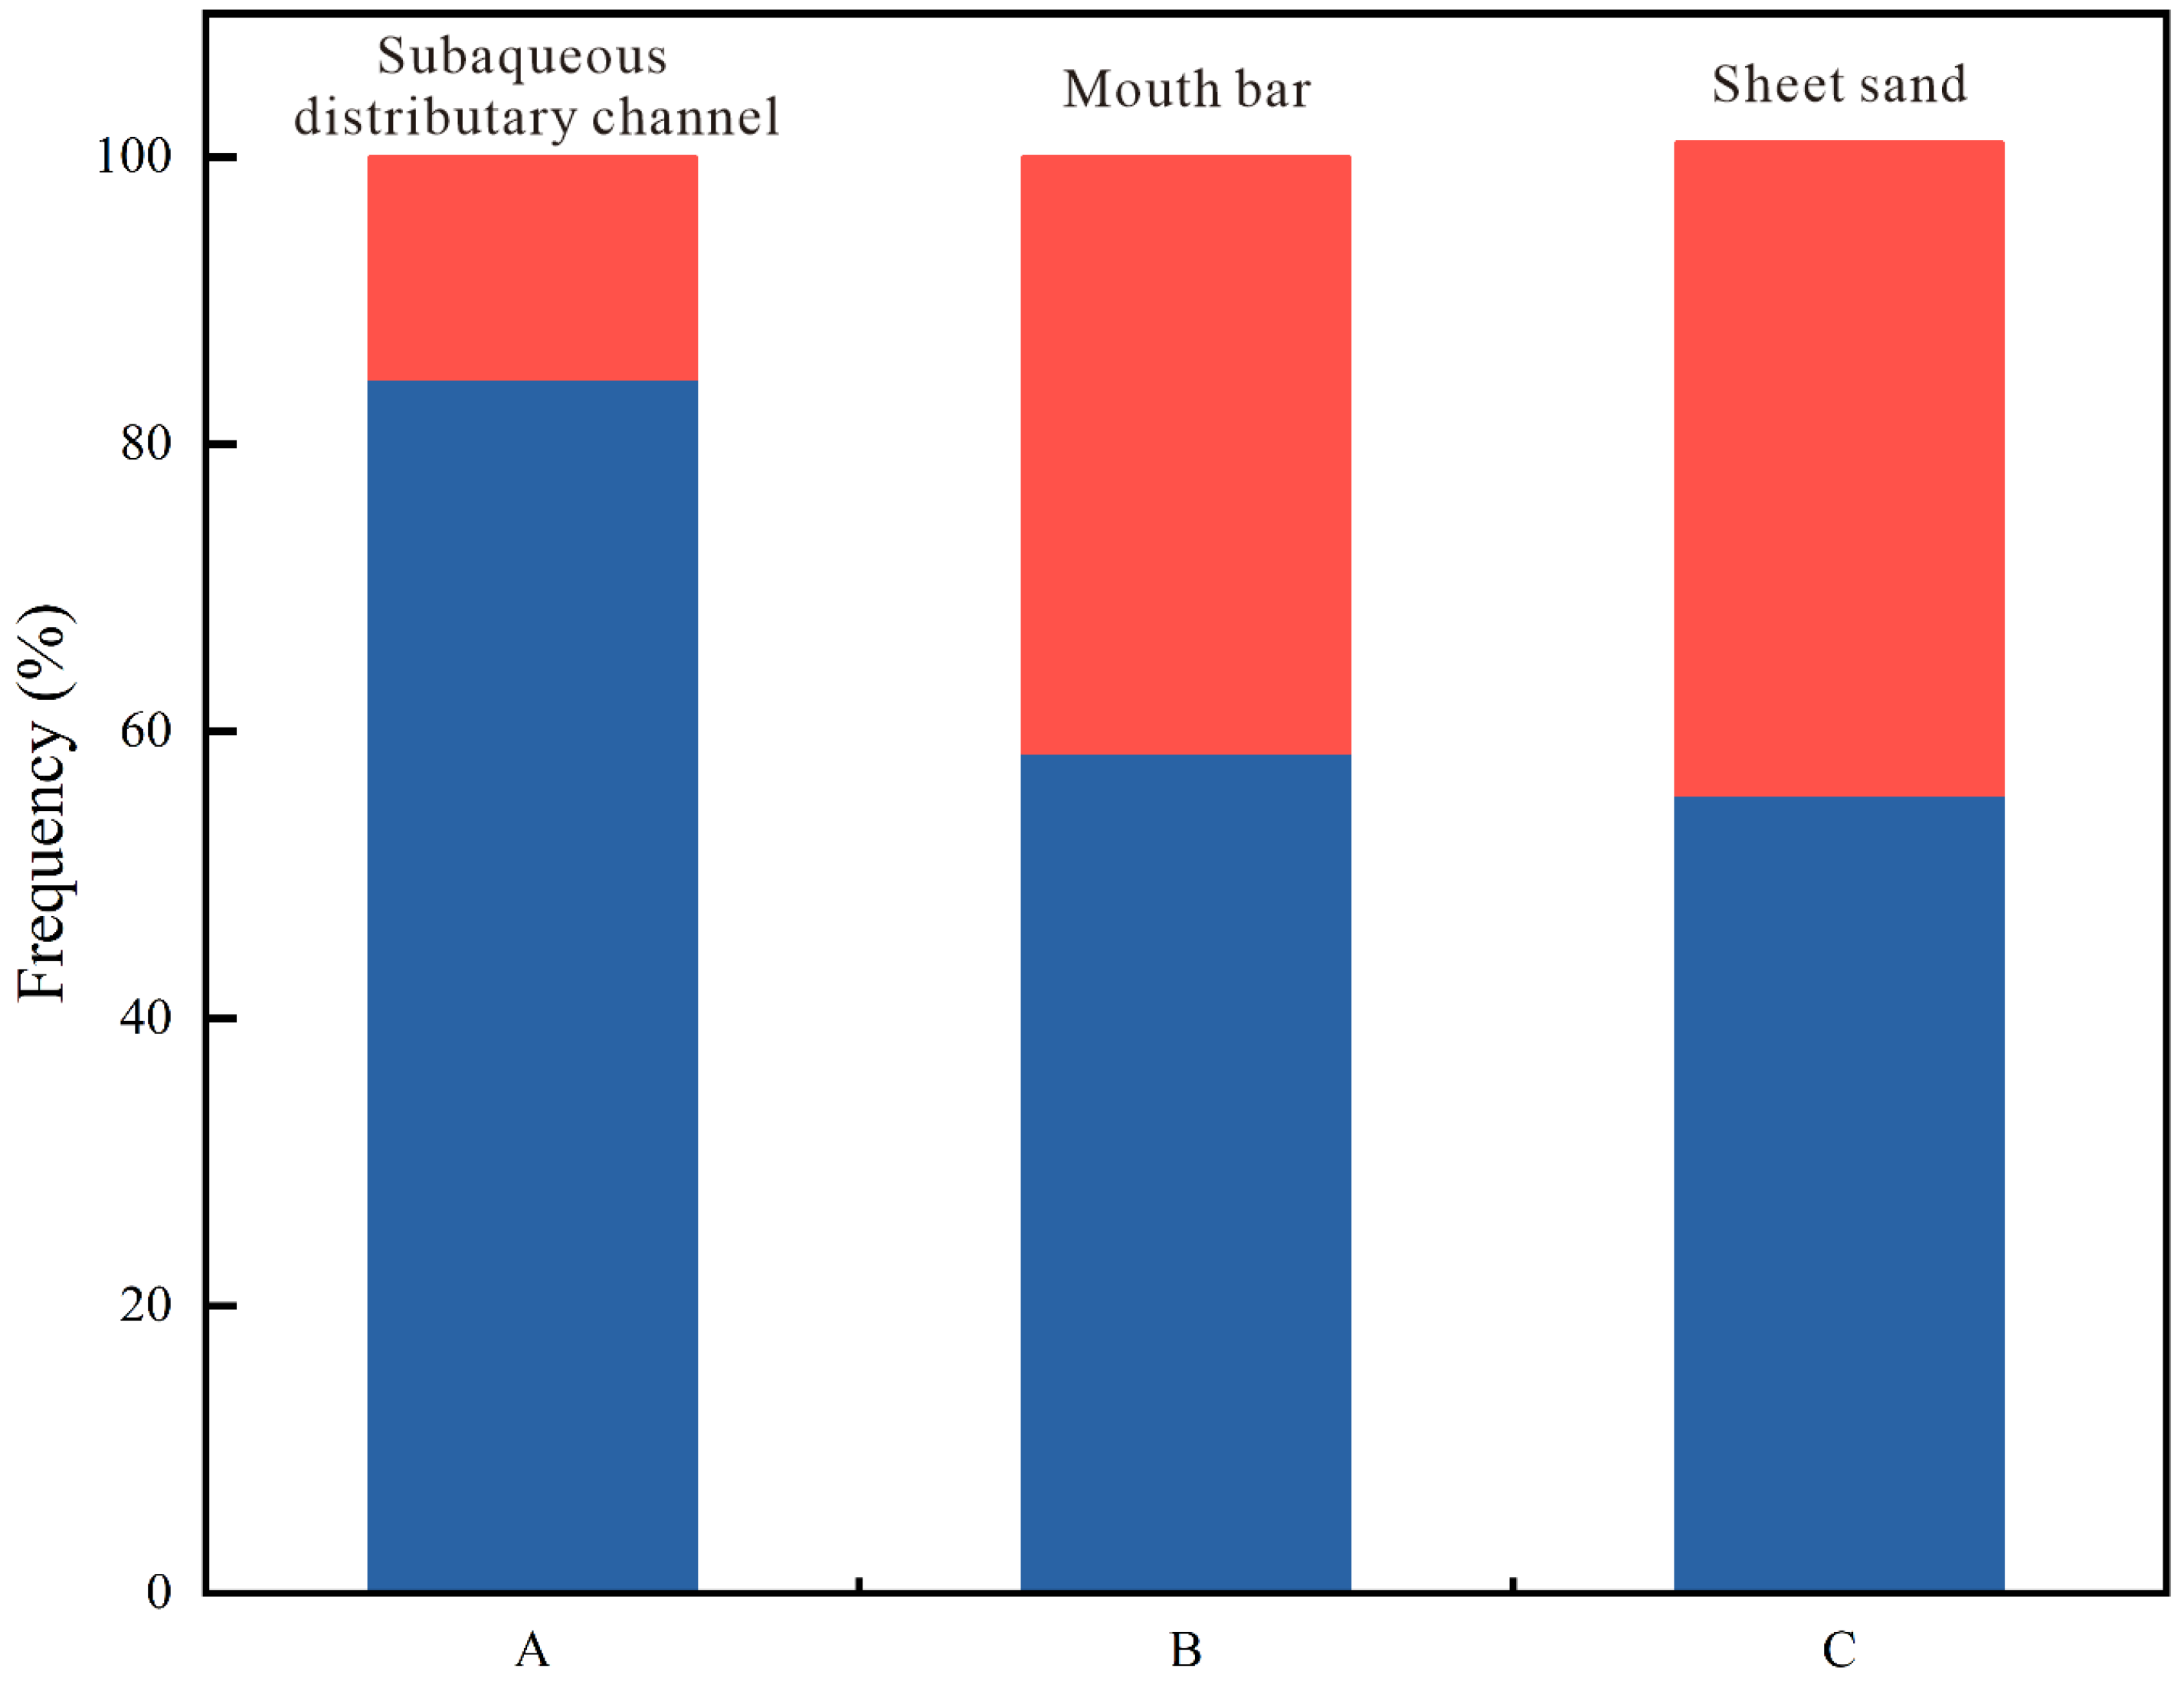
4.1. Lithofacies
4.2. Geochemical Characteristics
4.3. Characteristics of the Physical and Reservoir Space
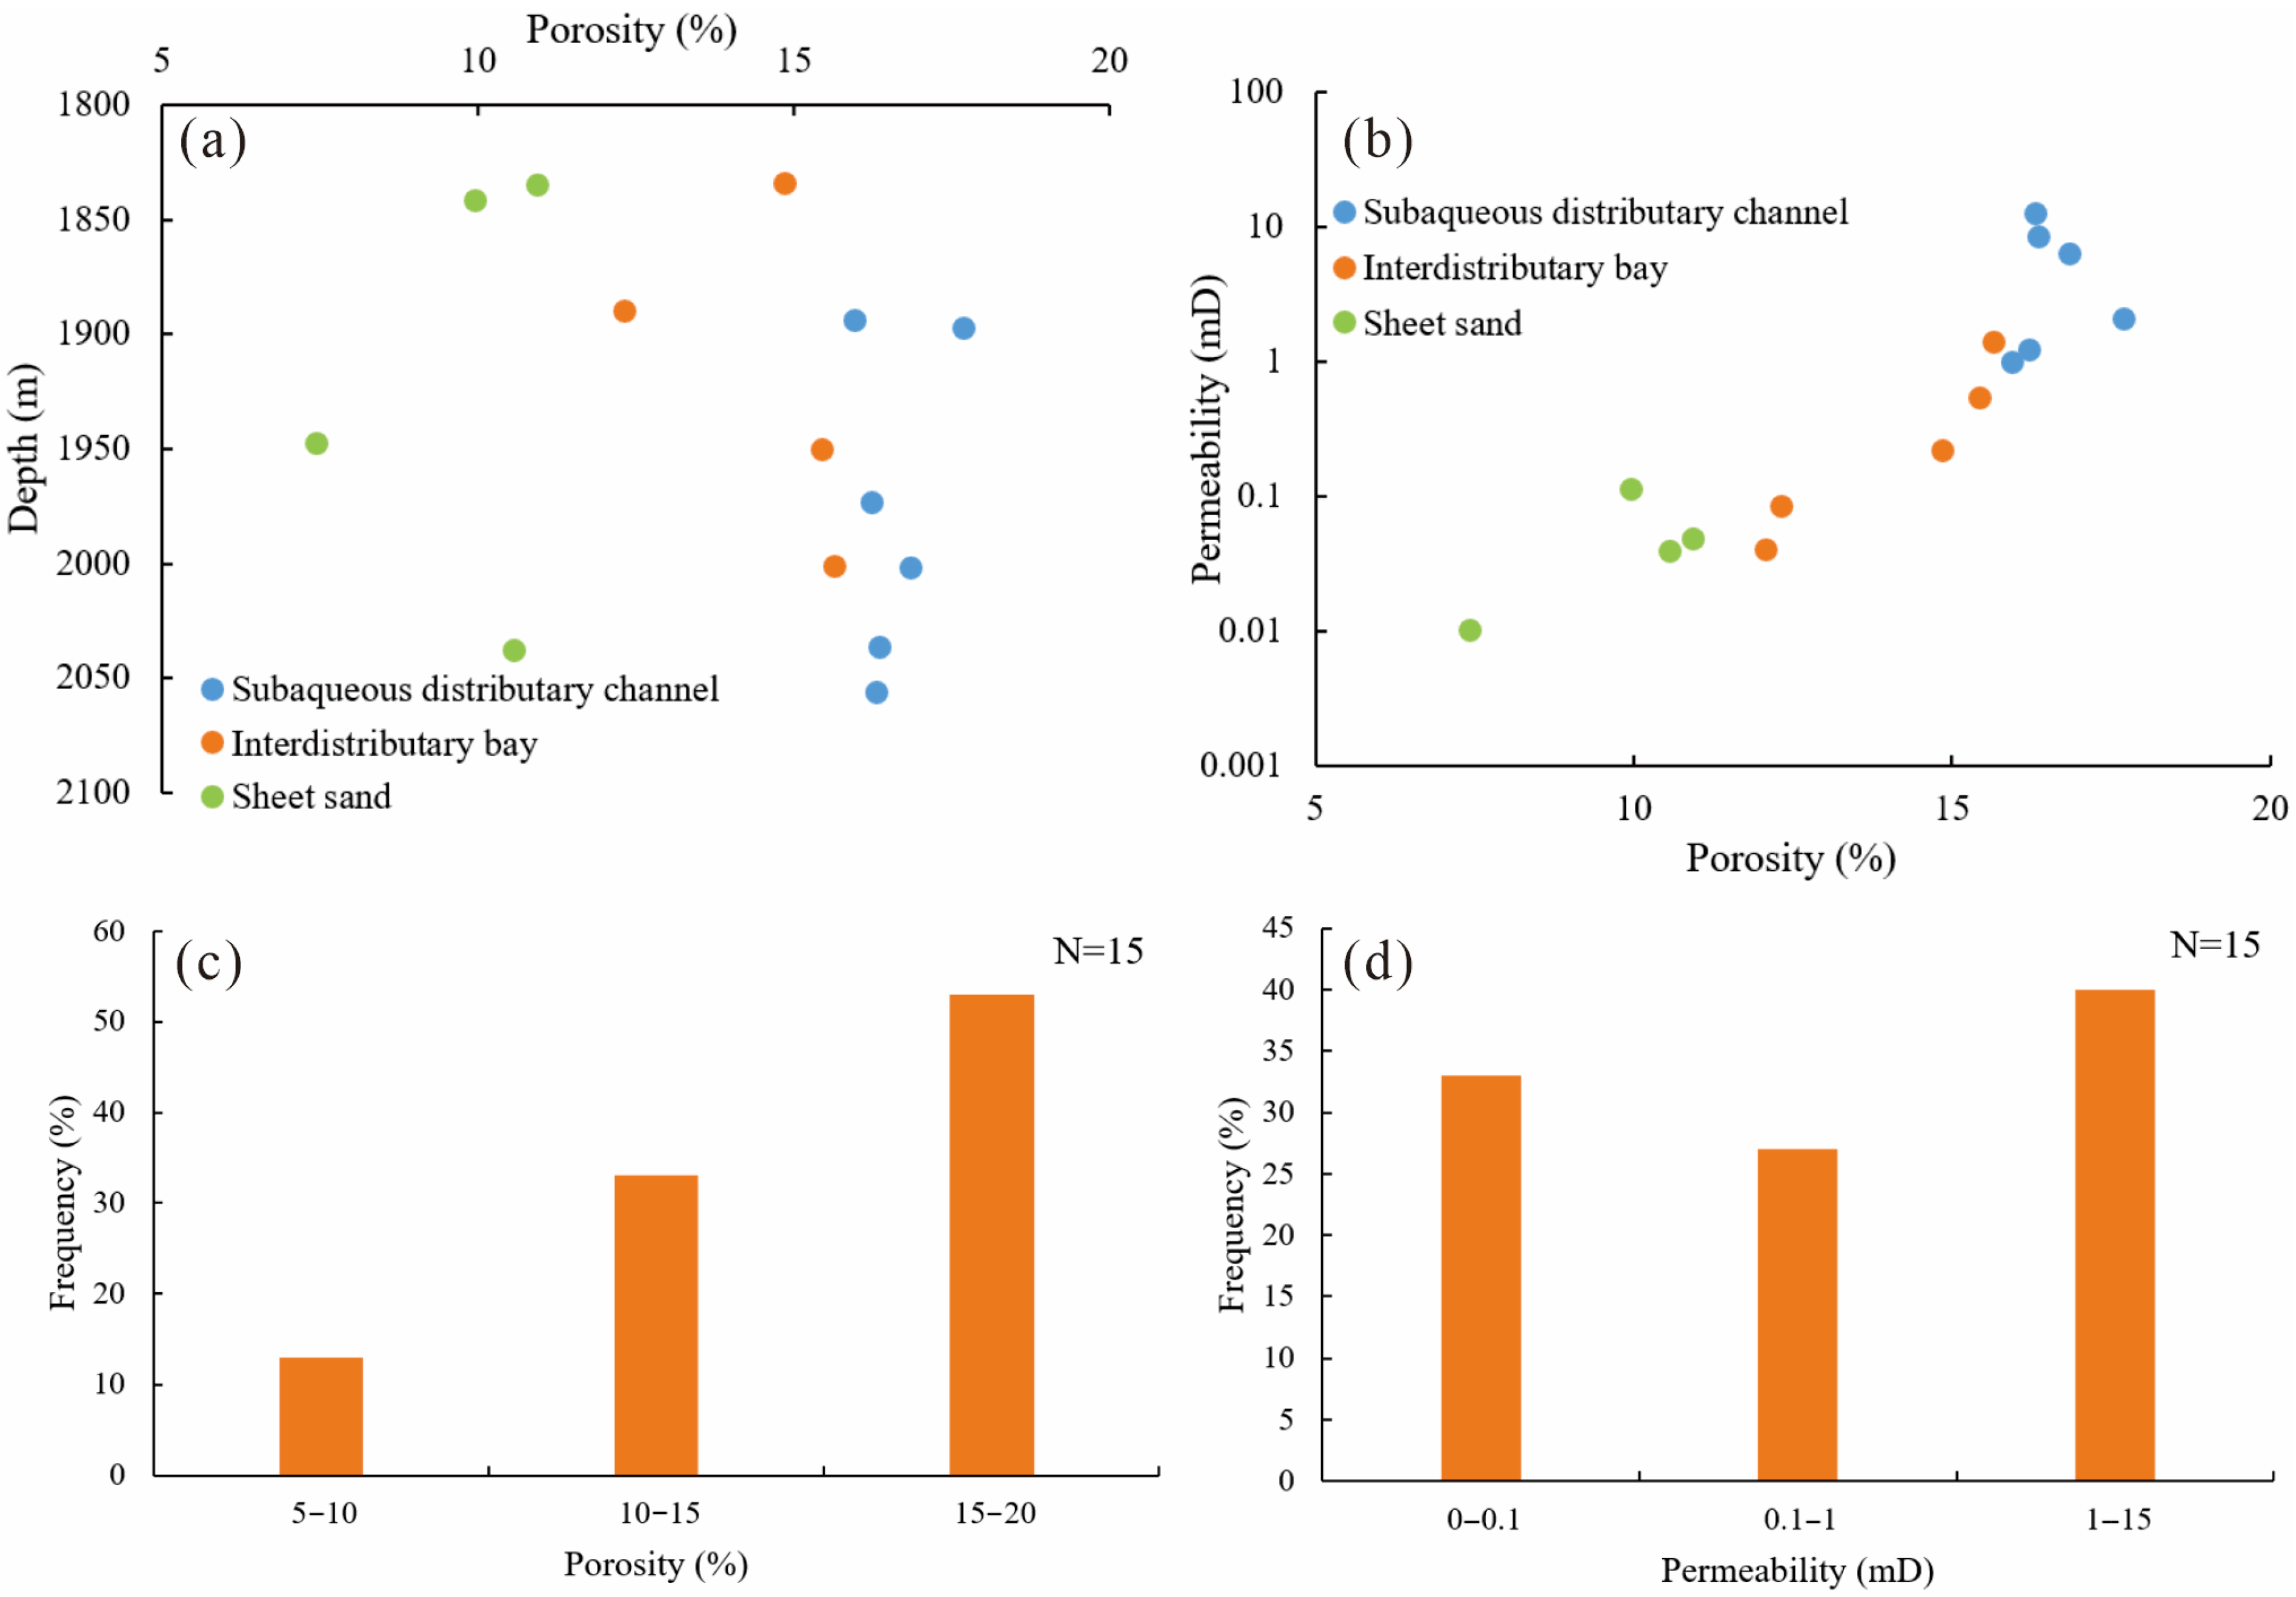
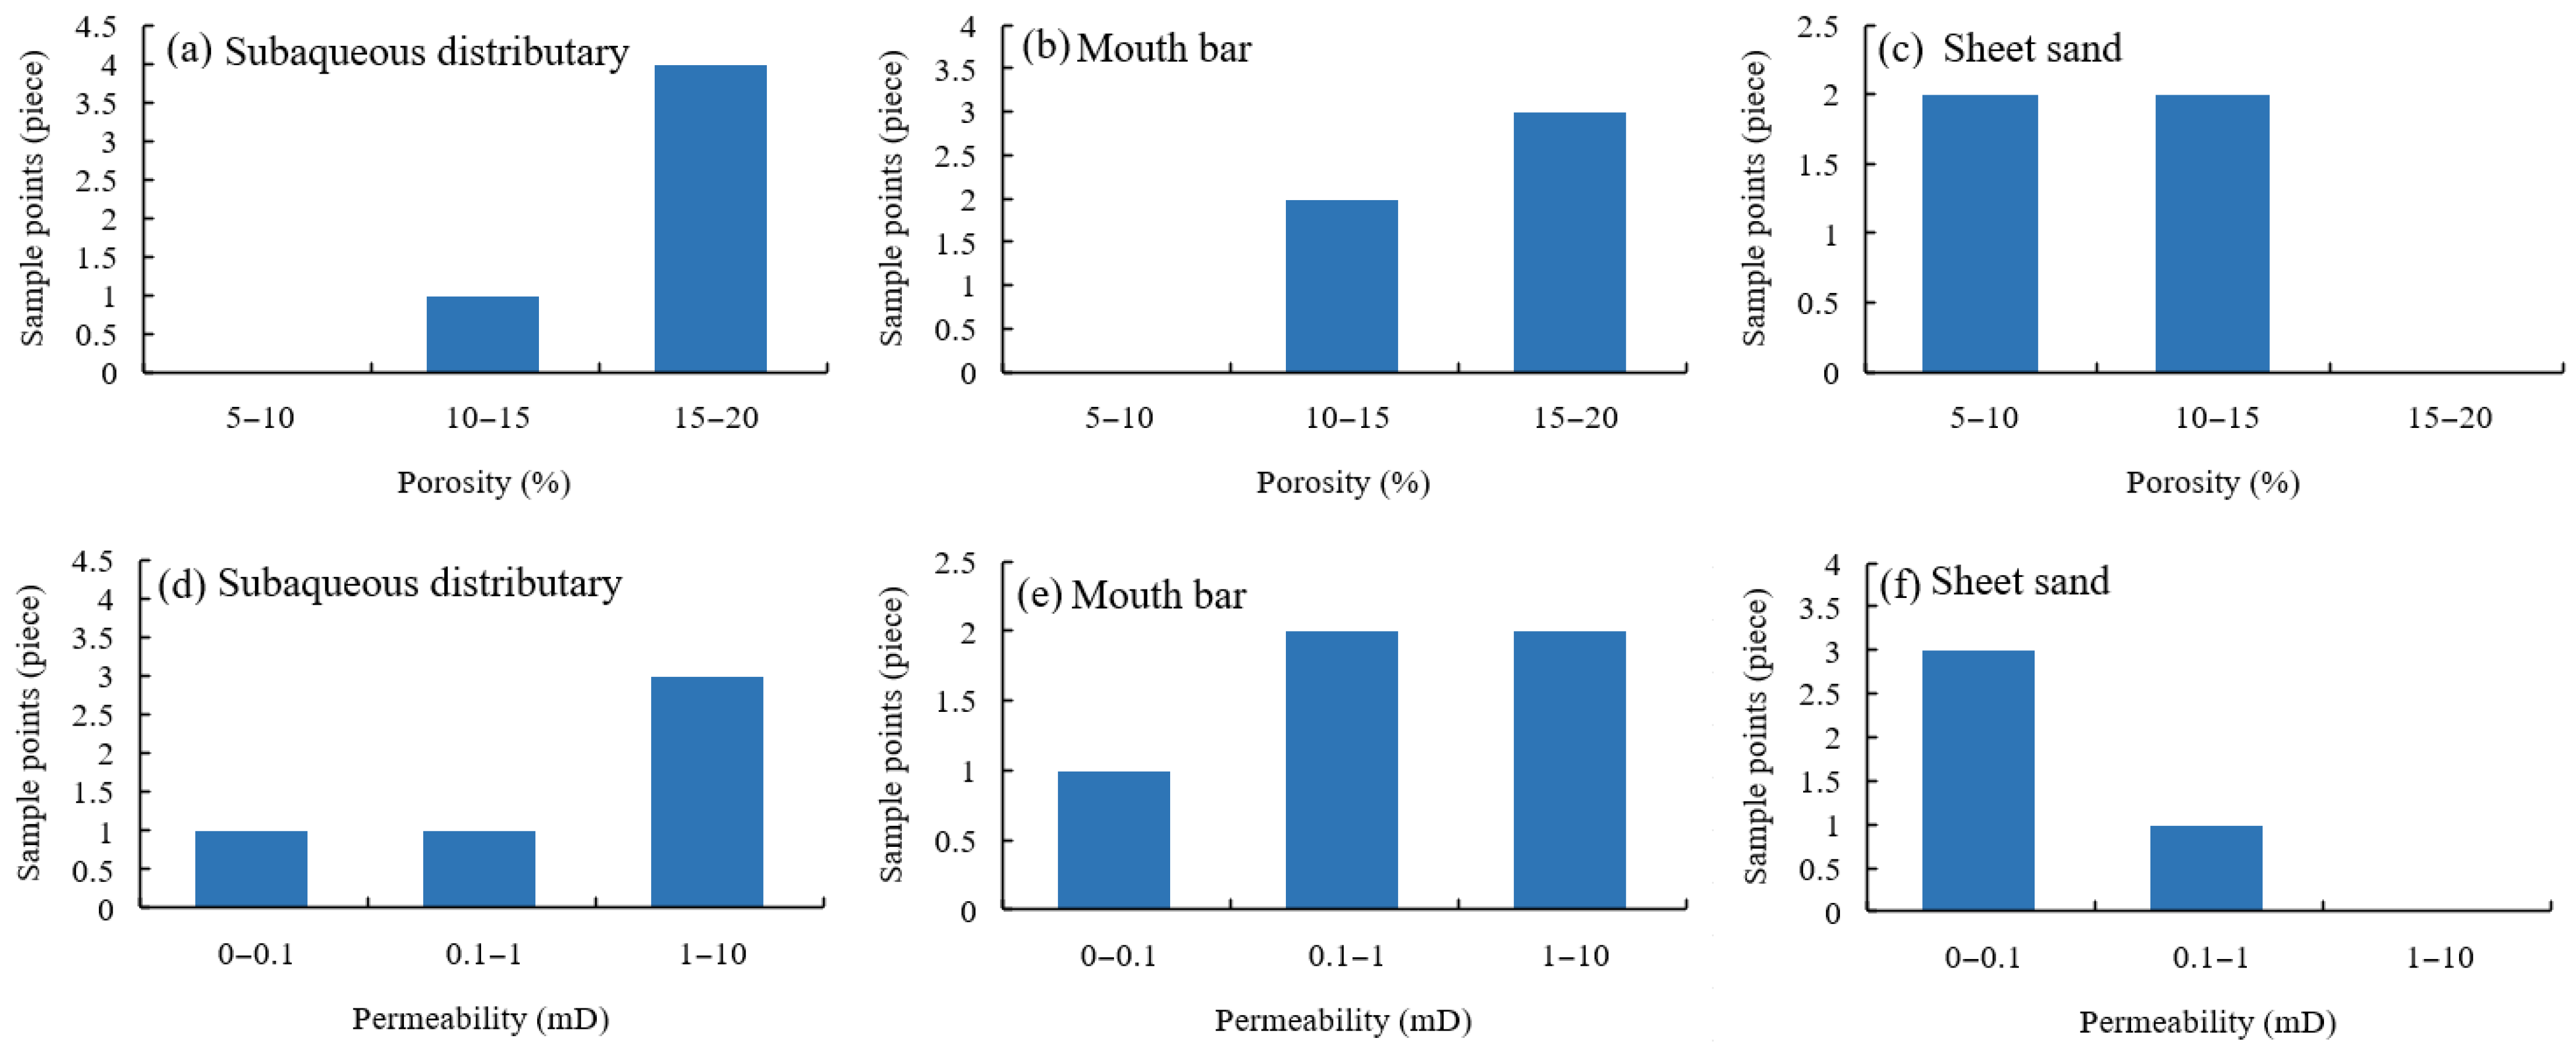
4.3.1. Reservoir Physical Properties
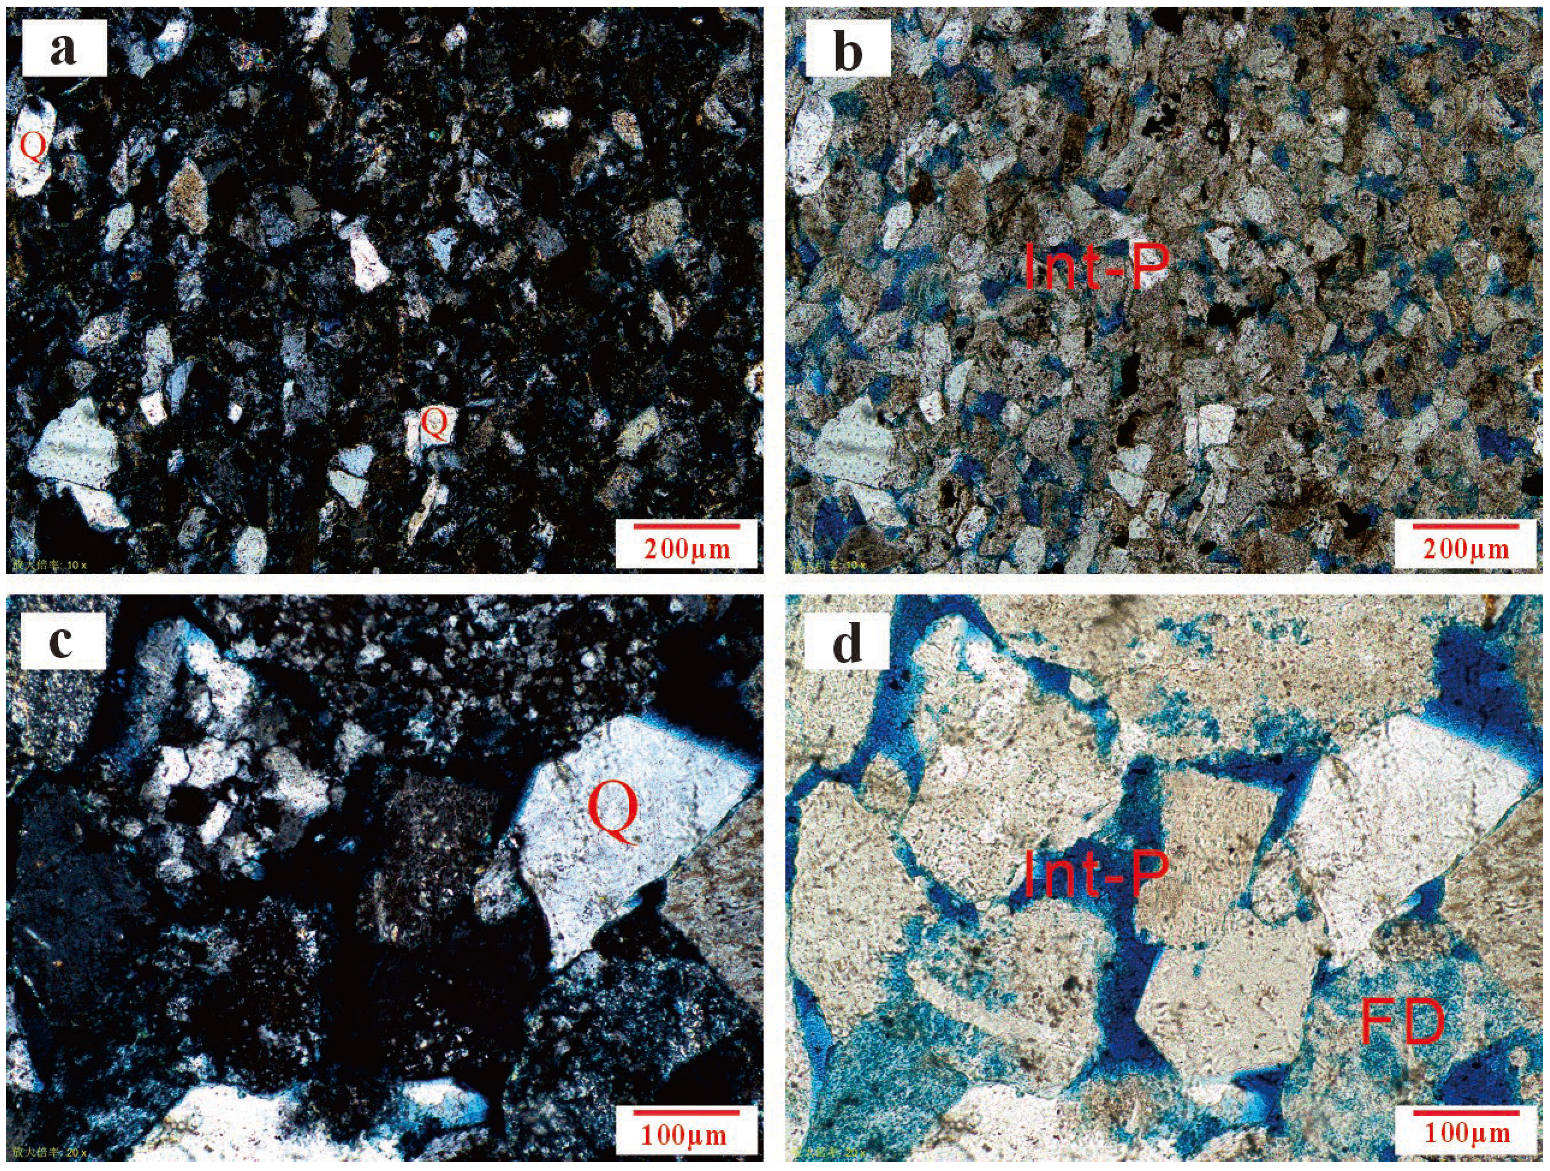
4.3.2. Reservoir Space Characteristics
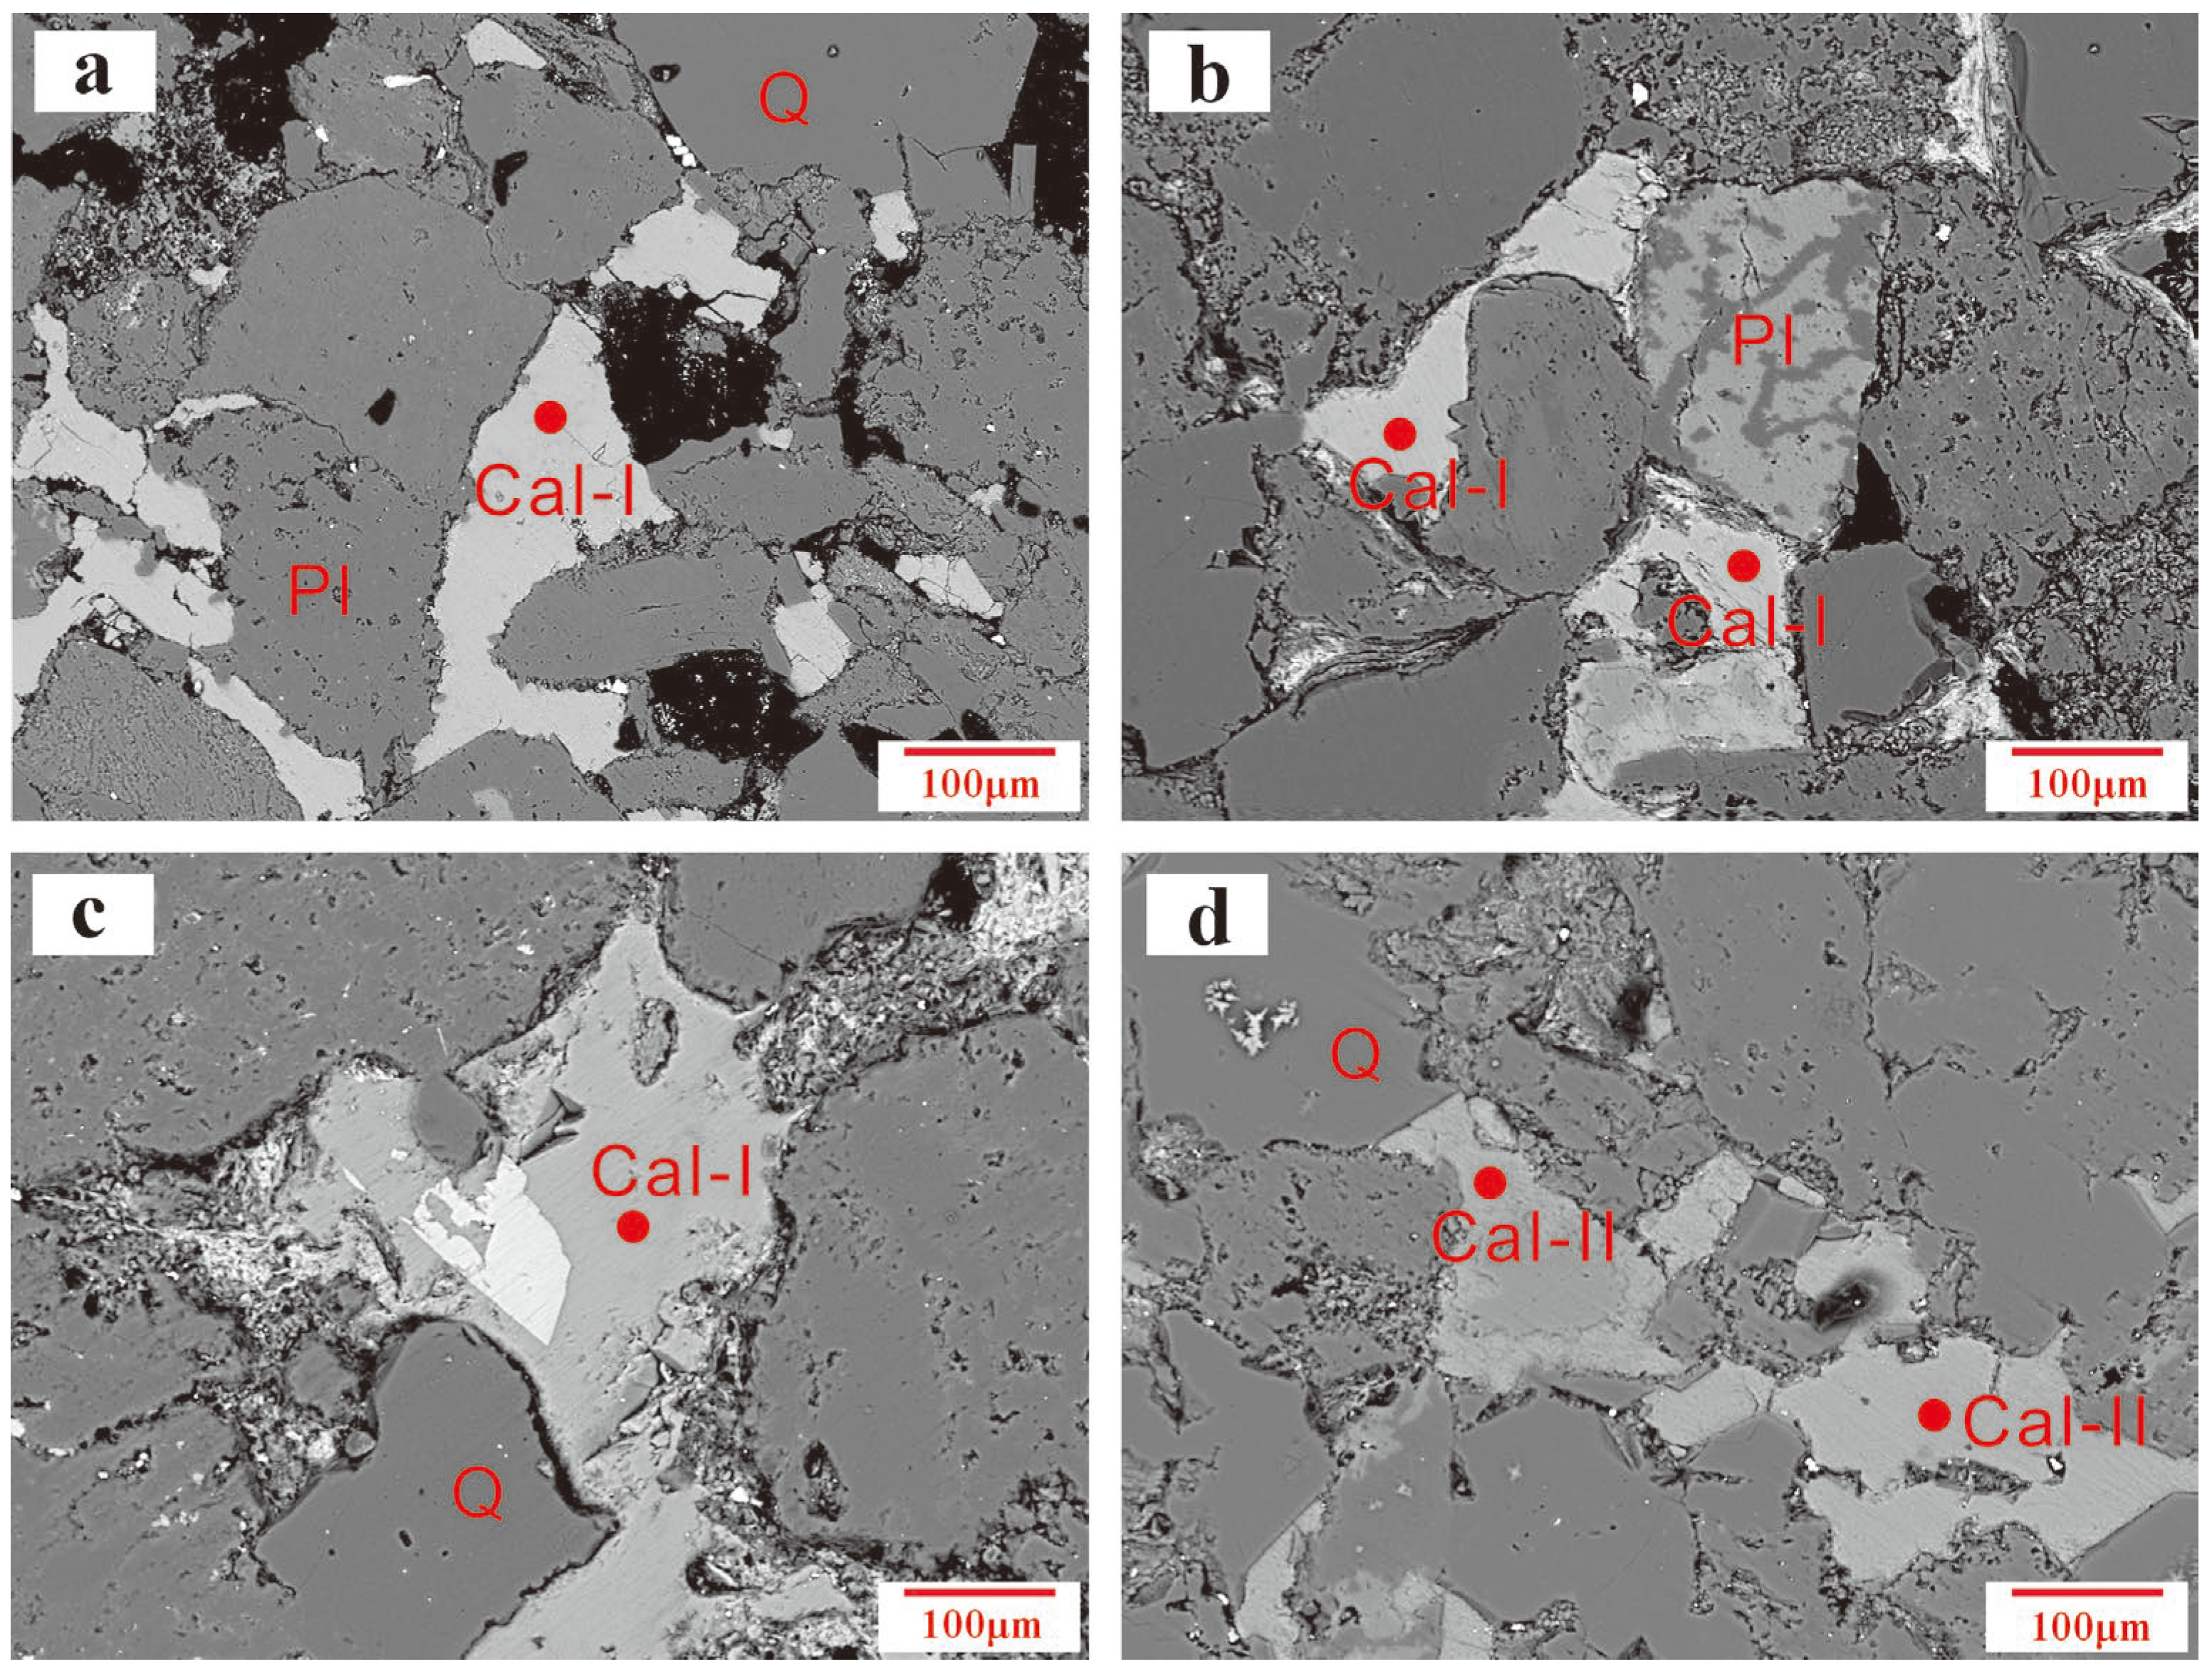
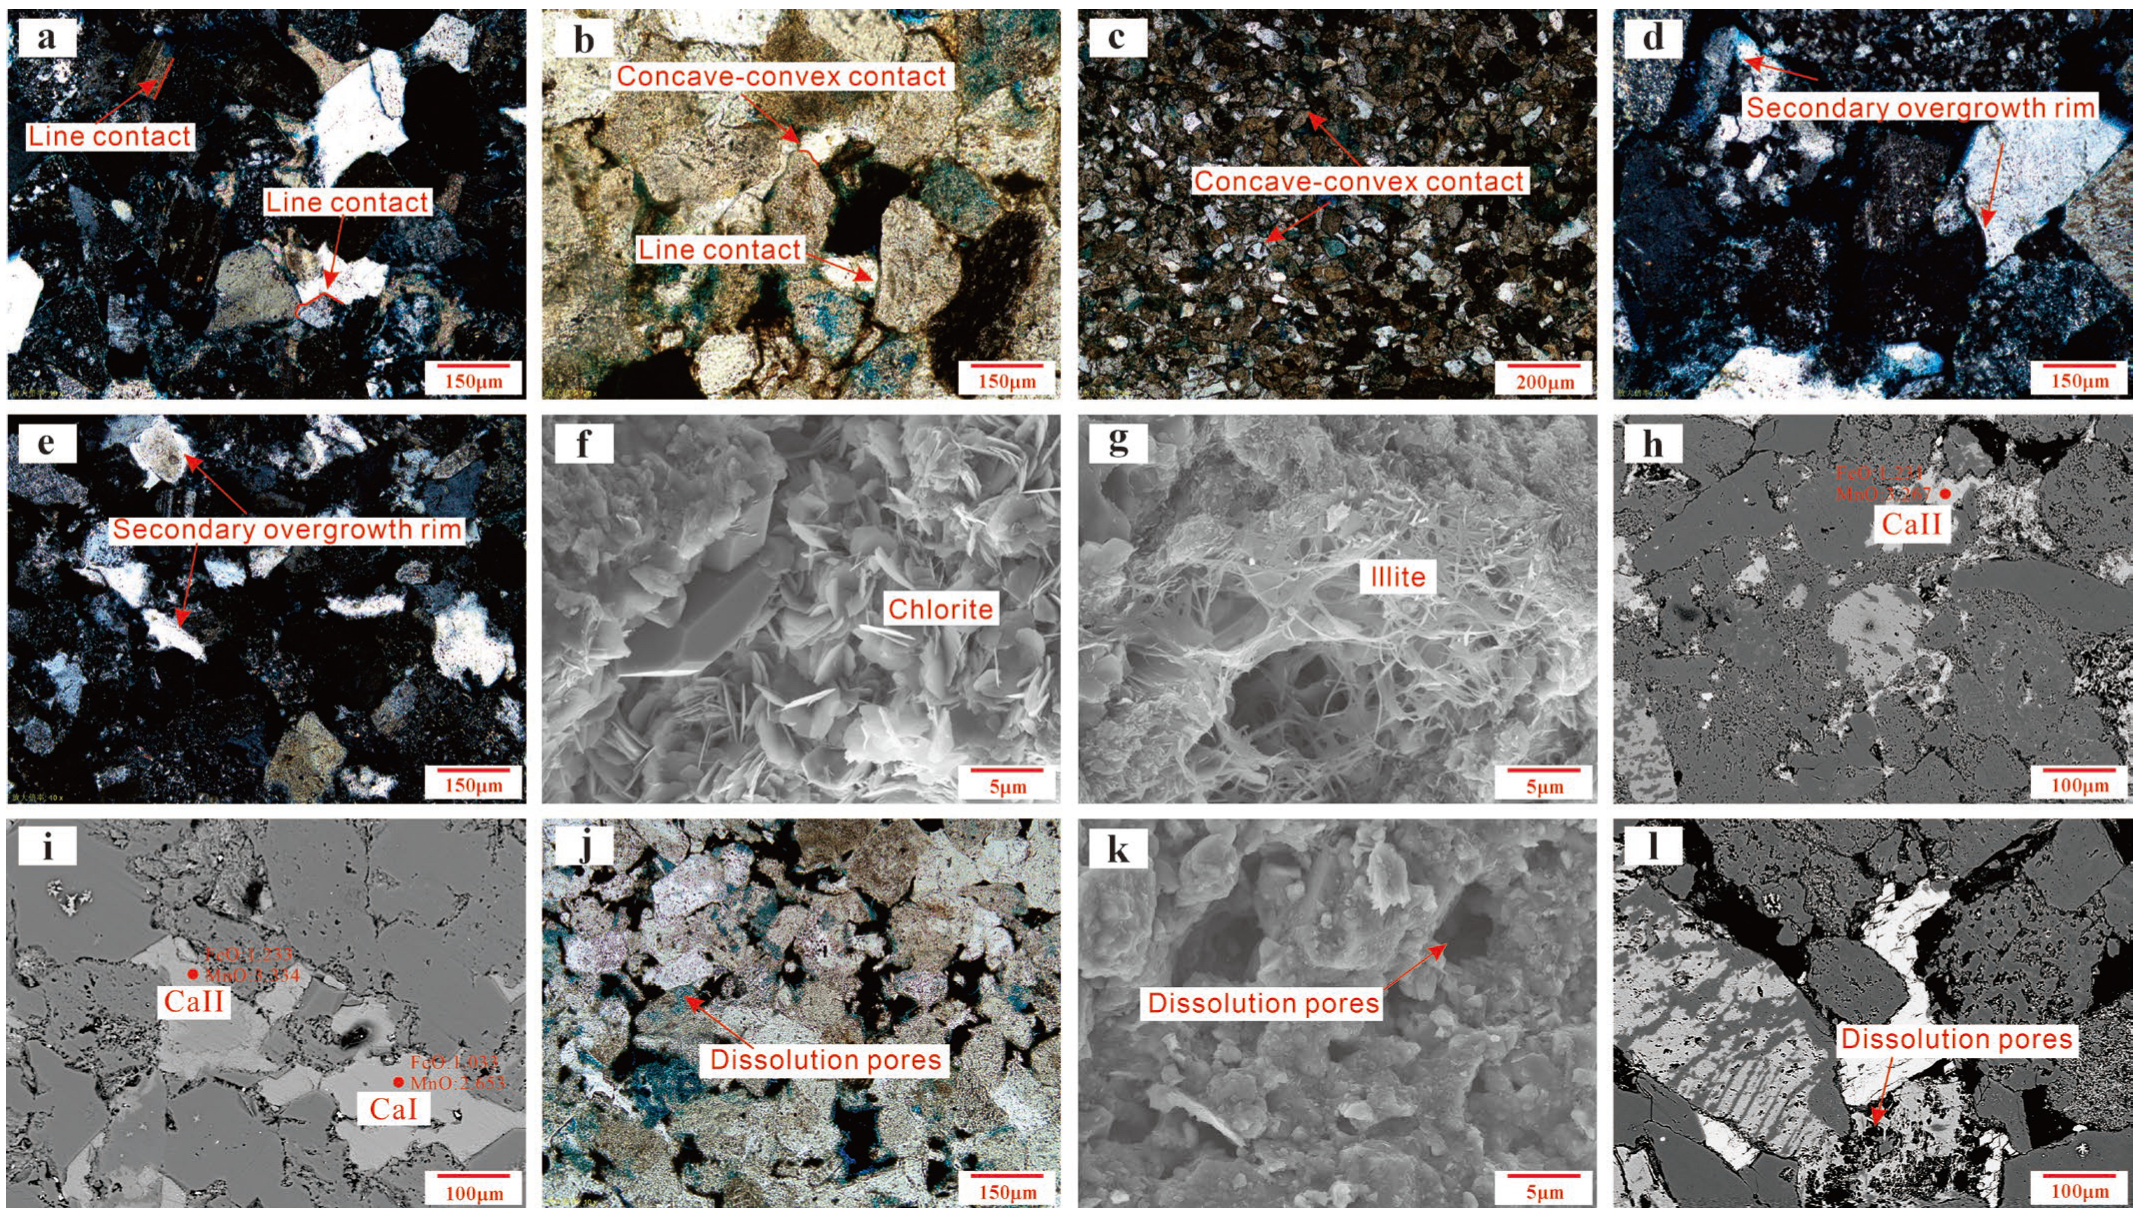
4.4. Diagenetic Processes
5. Discussion
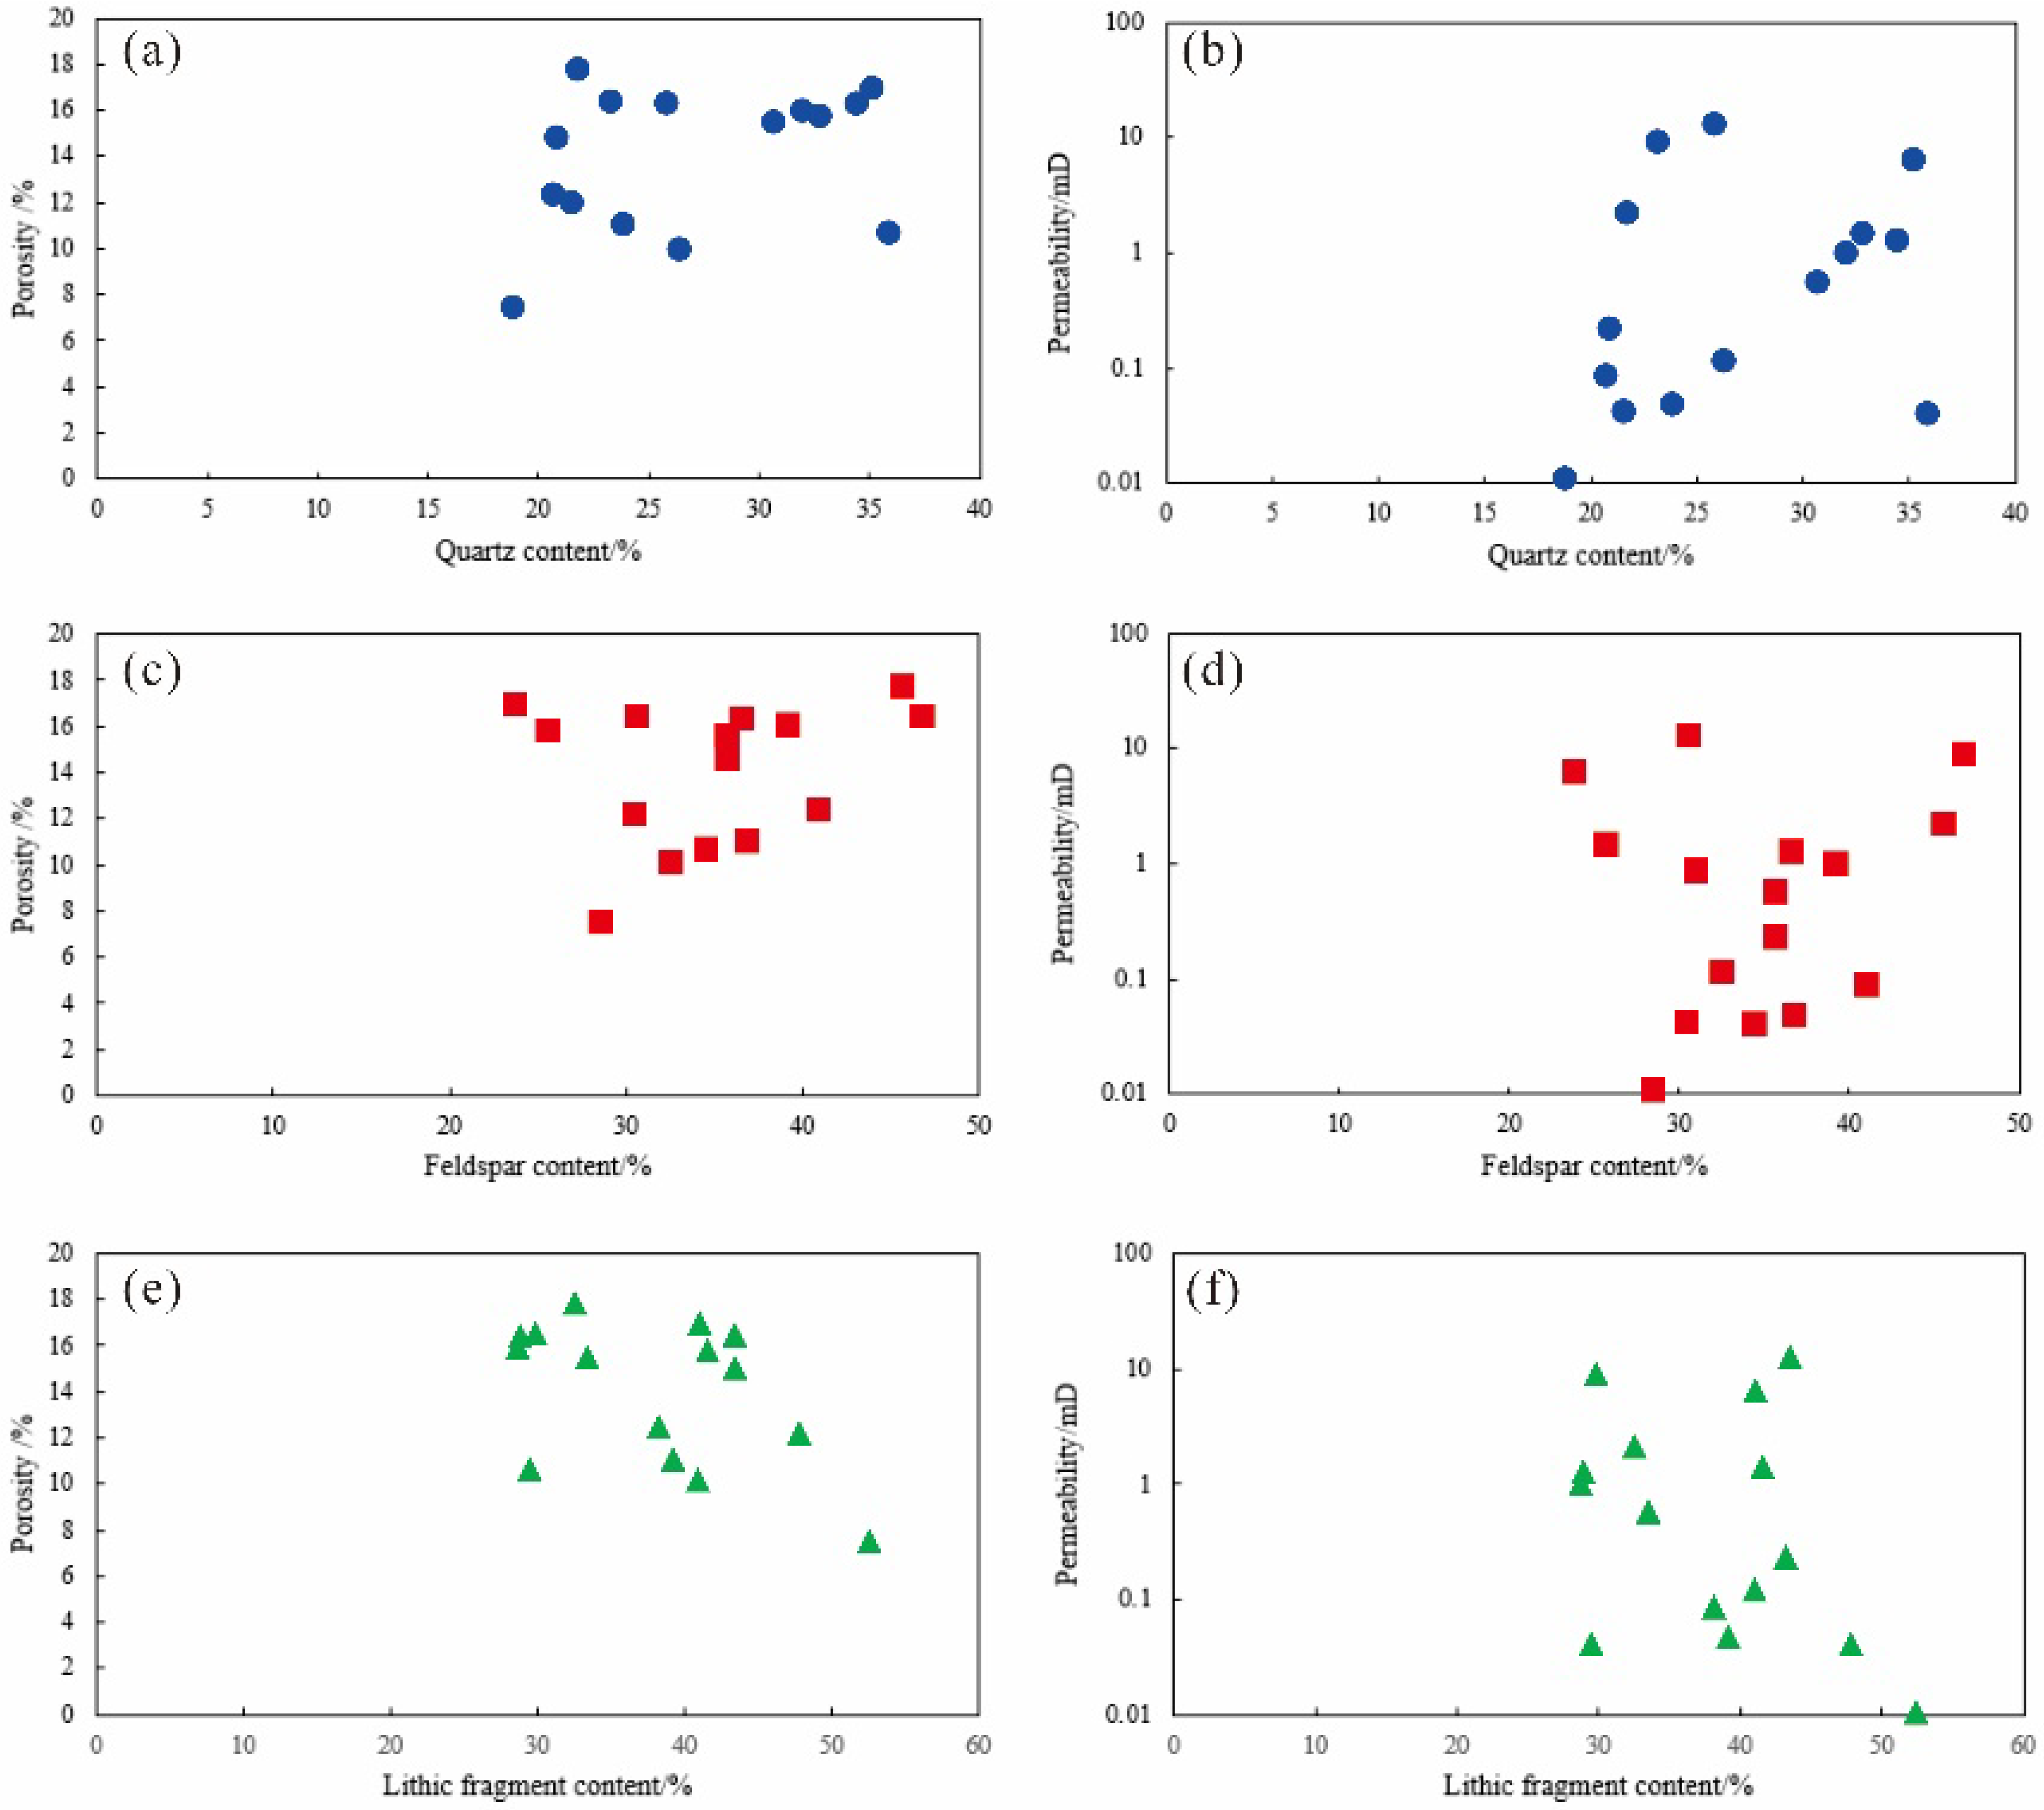
5.1. The Influence of Sedimentation on Porosity
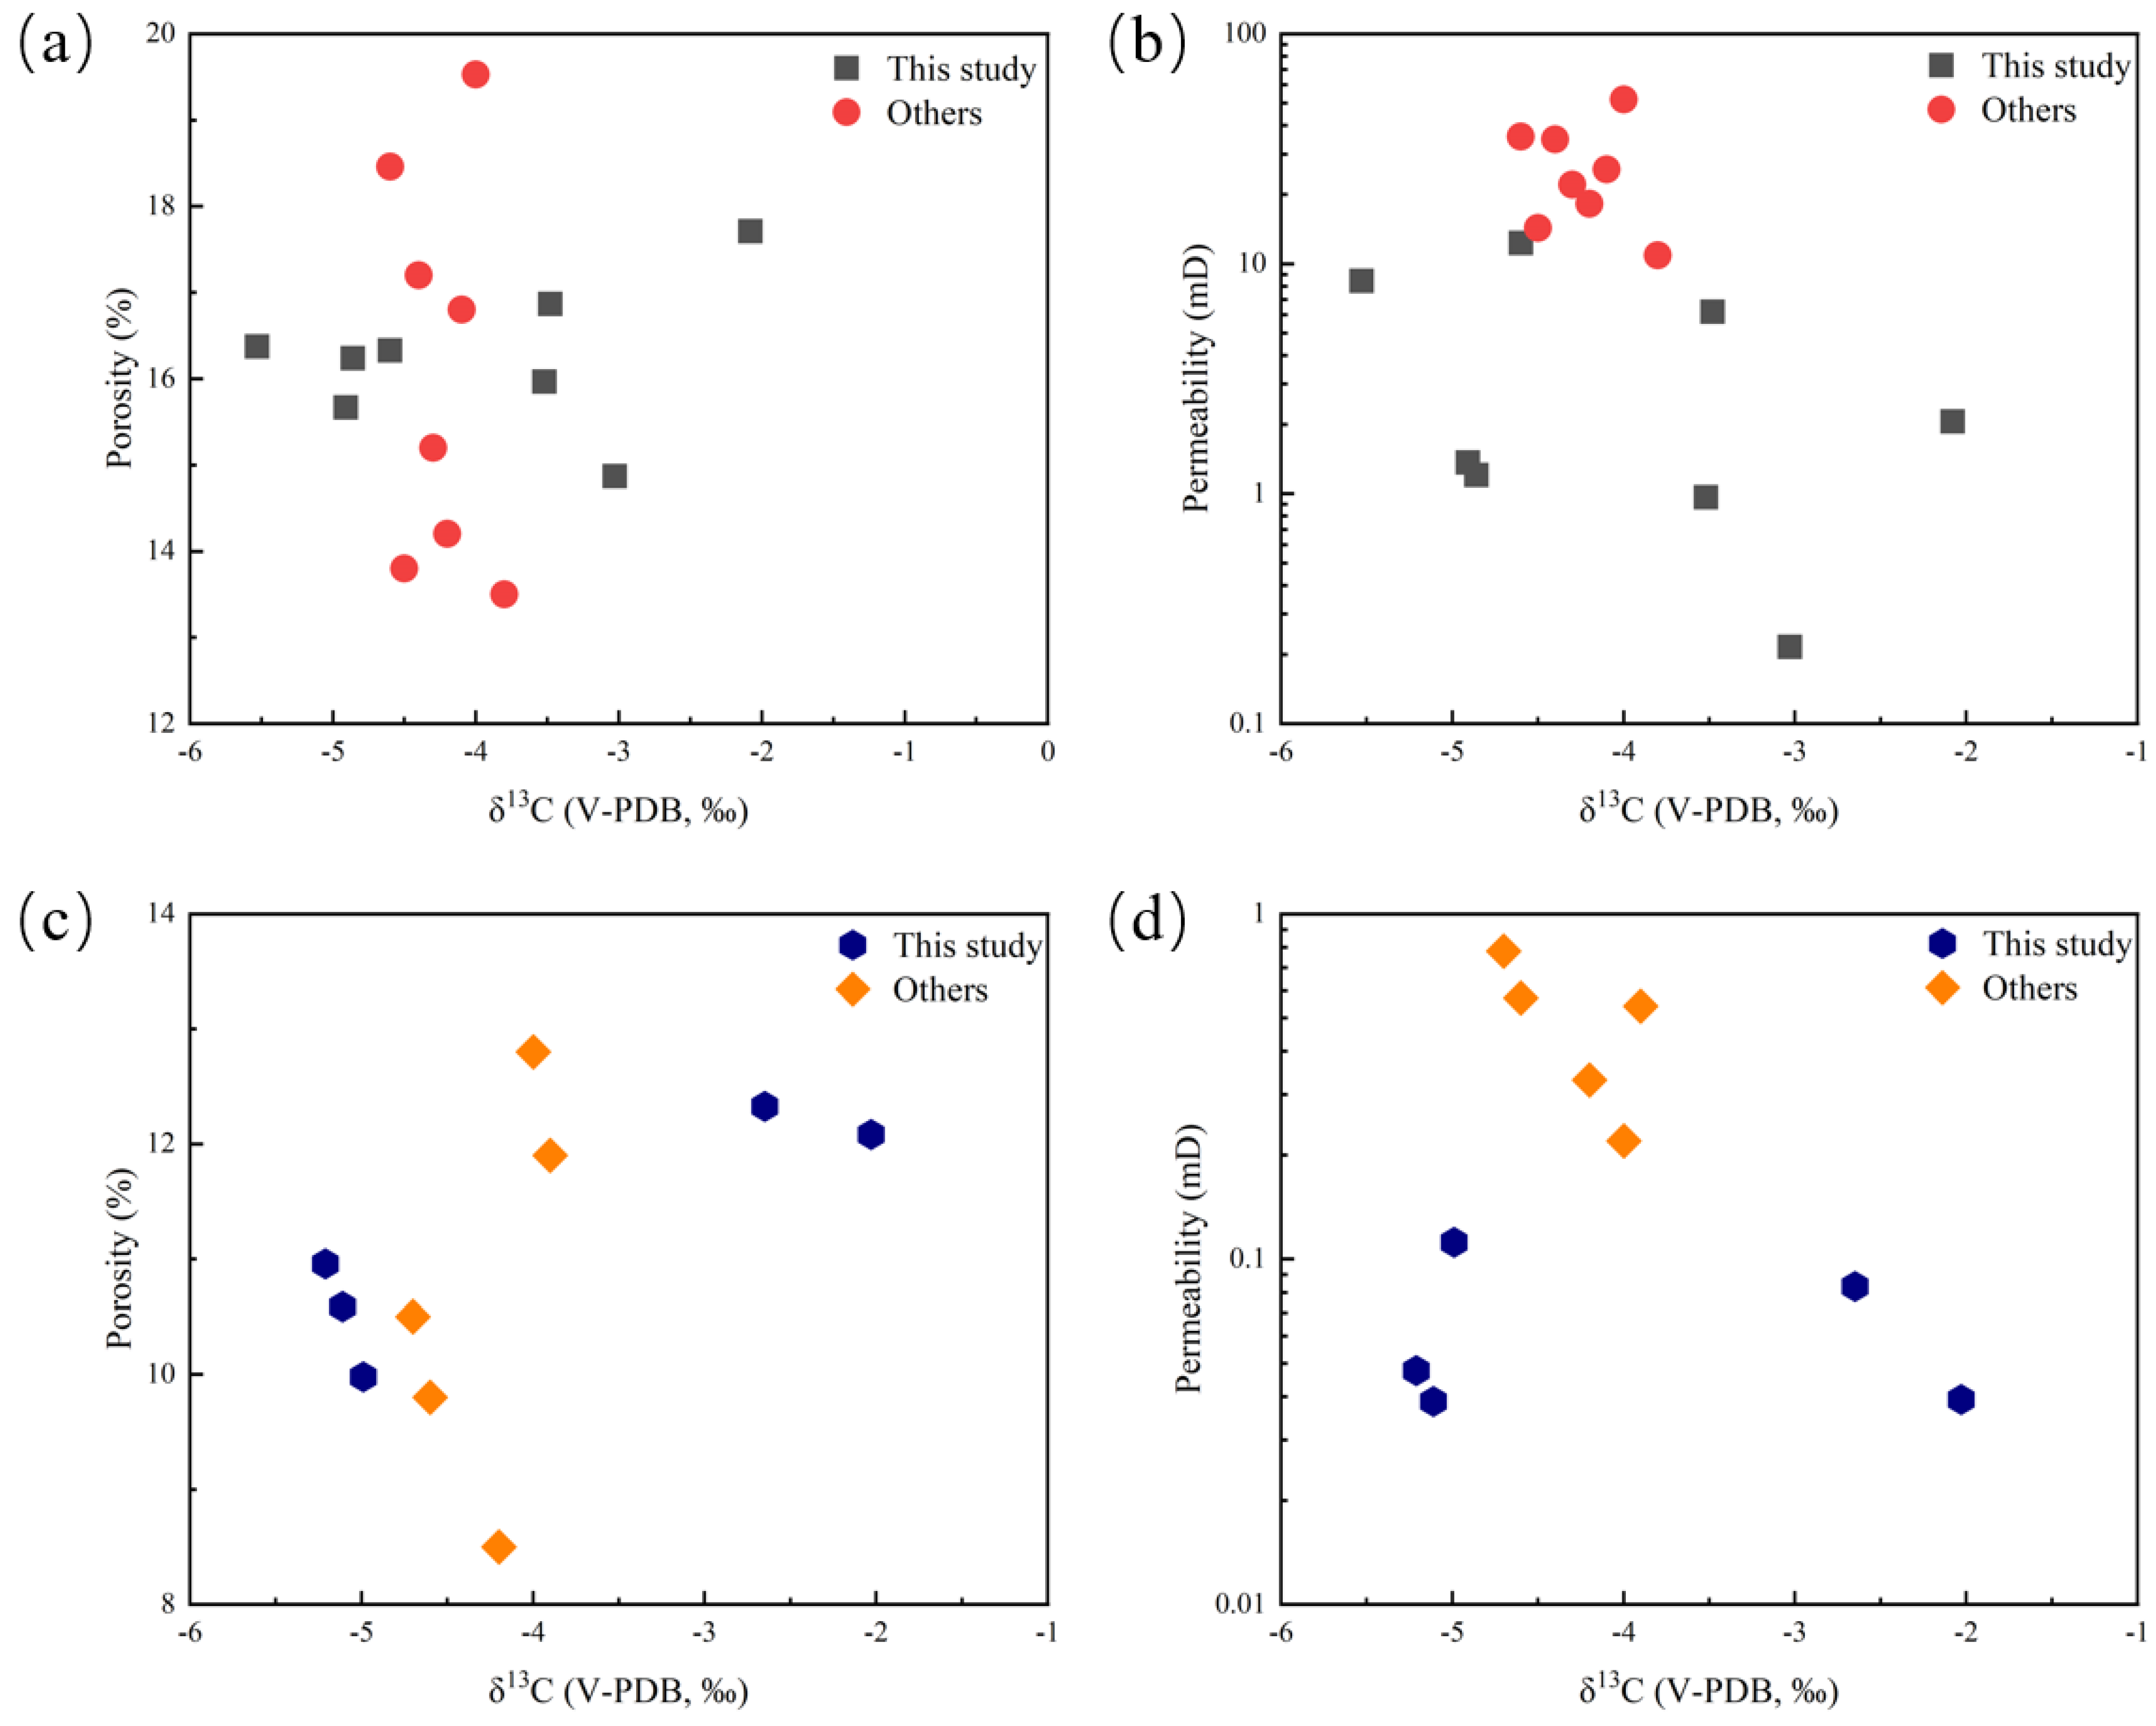
5.2. The Influence of Diagenesis on Porosity
5.3. Formation Model of High-Quality Reservoirs
6. Conclusions
- Clastic reservoir quality in Member 1 of the Yaojia Formation is under synergistic control of sedimentary environment and diagenesis. Reservoir properties exhibit marked variations across different sedimentary microfacies, with underwater distributary channel microfacies showing relatively superior reservoir properties.
- Clastic reservoir quality in Member 1 of the Yaojia Formation is significantly influenced by sedimentary environment and diagenesis. Compaction substantially reduces primary porosity through grain rearrangement, elastic grain deformation, and rigid grain crushing. Cementation, characterized by calcite cementation, quartz overgrowth, and clay mineral cementation, further exacerbates pore loss and constricts pore throats.
- Although dissolution can form secondary pores locally to improve reservoir porosity, the generated clay minerals easily block pore throats, leading to “effective pores becoming ineffective” and reducing reservoir permeability.
Author Contributions
Funding
Data Availability Statement
Conflicts of Interest
References
- Bagtash, R.F.; Goll, A.B.; Omidpour, A.; Kakemem, U. Reservoir quality drivers in the Oligo-Miocene Asmari Formation, Dezful Embayment, Iran: Facies, diagenesis, and tectonic controls. Mar. Pet. Geol. 2025, 173, 107279. [Google Scholar] [CrossRef]
- Sun, P.K.; Jiang, S.Y.; Zhang, L.; Jia, L.B.; Rao, H.W.; Fang, H.J.; Yi, Z.; He, T.H.; Zhu, S.C.; Bao, L.Y. Impacts of Sedimentation and Diagenesis on Deeply Buried Reservoir Quality of a Rift Basin: A Case Study of Wenchang Formation in the Lufeng Depression, Pearl River Mouth Basin, China. Geofluids 2022, 2022, 8625005. [Google Scholar] [CrossRef]
- Bello, A.M.; Usman, M.B.; Amao, A.O.; Ramadan, K.A.; Hashem, M.A.; Kachalla, A.; Abubakar, U.; Salisu, A.M.; Mukkafa, S.; Kwami, I.A.; et al. Diagenesis and reservoir quality evolution of estuarine sandstones: Insights from the Cenomanian-Turonian Yolde Formation, northern Benue Trough, NE Nigeria. Mar. Pet. Geol. 2024, 169, 107073. [Google Scholar] [CrossRef]
- Walderhaug, O. Kinetic modeling of quartz cementation and porosity loss in deeply buried sandstone reservoirs. AAPG Bull. 1996, 80, 731–745. [Google Scholar] [CrossRef]
- Walderhaug, O. Modeling Quartz Cementation and Porosity in Middle Jurassic Brent Group Sandstones of the Kvitebjørn Field, Northern North Sea. AAPG Bull. 2000, 84, 1325–1339. [Google Scholar] [CrossRef]
- Yue, D.L.; Wu, S.H.; Xu, Z.Y.; Xiong, L.; Chen, D.X.; Ji, Y.L.; Zhou, Y. Reservoir quality, natural fractures, and gas productivity of upper Triassic Xujiahe tight gas sandstones in western Sichuan Basin, China. Mar. Pet. Geol. 2018, 89, 370–386. [Google Scholar] [CrossRef]
- Cui, G.X.; Xu, S.Y.; Wei, Q.L.; Yang, Y.M.; Hu, J.; He, T.P. The influence of diagenesis on the quality of tight sandstone reservoirs in Longdong, Ordos Basin. J. Pet. Explor. Prod. Technol. 2024, 14, 3331–3348. [Google Scholar] [CrossRef]
- Zhang, F.Q.; Gingras, M.; Shan, C.D.; Lu, X.S.; Zhuo, Q.G.; Zhong, H.L. The effect of coupling of tectonic compression and overpressure on porosity of deep reservoirs: A case study of southern margin of Junggar Basin, northwest China. Front. Earth Sci. 2023, 11, 1220105. [Google Scholar] [CrossRef]
- Yang, R.F.; Wang, Y.C.; Cao, J. Cretaceous source rocks and associated oil and gas resources in the world and China: A review. Pet. Sci. 2014, 11, 331–345. [Google Scholar] [CrossRef]
- Bi, H.; Li, J.Z.; Tang, Z.J.; Li, P.; Wang, L.; Shang, X.Y. High-resolution sequence stratigraphy, sedimentology and reservoir quality evaluation of the Yaojia Formation in the Longxi area of the Western Slope, Songliao Basin, China. Mar. Pet. Geol. 2017, 88, 511–530. [Google Scholar] [CrossRef]
- Zhang, L.; Bao, Z.D.; Lin, Y.B.; Chen, Y.M.; Lin, X.H.; Dou, L.X.; Kong, B. Genetic types and sedimentary model of sandbodies in a shallow-water delta: A case study of the first Member of Cretaceous Yaojia Formation in Qian’an area, south of Songliao Basin, NE China. Pet. Explor. Dev. 2017, 44, 770–779. [Google Scholar] [CrossRef]
- Worden, R.H.; Morad, S. Quartz Cementation in Oil Field Sandstones: A Review of the Key Controversies. In Quartz Cementation in Sandstones; John Wiley & Sons, Inc.: Hoboken, NJ, USA, 2000; pp. 1–20. [Google Scholar]
- Worden, R.H.; Burley, S.D. Sandstone Diagenesis: The Evolution of Sand to Stone. In Sandstone Diagenesis: Recent and Ancient; John Wiley & Sons, Inc.: Hoboken, NJ, USA, 2003; pp. 1–44. [Google Scholar]
- Zhang, L.; Bao, Z.D.; Dou, L.X.; Xu, Q.H. Diagenetic alterations related to sedimentary architecture of deltaic distributary channels in red beds of the Cretaceous Yaojia Formation, Songliao Basin. J. Pet. Sci. Eng. 2021, 203, 108564. [Google Scholar] [CrossRef]
- Cao, Z.; Karem, A.; Lin, C.Y.; Dong, C.M.; Ren, L.H.; Qin, M.Y.; Li, Z.J.; Tan, X.F.; Zhang, L.; Li, X.G. Diagenetic evolution of the lower Yaojia Formation of Songliao Basin, China: Impact on reservoir quality. J. Pet. Sci. Eng. 2022, 213, 110415. [Google Scholar] [CrossRef]
- Taylor, T.R.; Giles, M.R.; Hathon, L.A. Sandstone diagenesis and reservoir quality prediction: Models, myths, and reality. AAPG Bull. 2010, 94, 1093–1132. [Google Scholar] [CrossRef]
- Yang, X.B.; Wang, H.Y.; Li, Z.Y.; Guan, C.; Wang, X. Tectonic-sedimentary evolution of a continental rift basin: A case study of the Early Cretaceous Changling and Lishu fault depressions, southern Songliao Basin, China. Mar. Pet. Geol. 2021, 128, 105068. [Google Scholar] [CrossRef]
- Cheng, J.M.; McIntosh, J.C.; Xie, X.O.; Jiao, J.J. Hydrochemistry of formation water with implication to diagenetic reactions in Sanzhao depression and Qijia-gulong depression of Songliao Basin, China. J. Geochem. Explor. 2006, 88, 86–90. [Google Scholar] [CrossRef]
- Liu, P. Main Controlling Factors and Accumulation Model of Tight Oil Reservoirs in the First Member of Yaoyi Formation in Gulong Sag. Xinjiang Pet. Geol. 2023, 44, 635–645. [Google Scholar]
- Liu, Y.; Li, W.; Yuan, J.; Li, P.; Ge, X.; Ge, X.; Liu, P.; Wu, H.; Yu, X.; Huang, B. Lithofacies Characteristics of the Lower Cretaceous Qing 1 Member in the Heiyupao Depression, Northern Binbei Area of the Songliao Basin. Minerals 2025, 15, 125. [Google Scholar] [CrossRef]
- Shao, C.; Fan, T.L.; Guo, Y.J.; Cheng, P.; Sun, Y.; Wang, H.R. Discovery of Seismites in the Upper Cretaceous Yaojia Formation of the Daqing Placanticline, Songliao Basin and Their Geological Significance. J. Palaeogeogr. 2012, 14, 719–726. [Google Scholar]
- Deng, Q.J.; Hu, M.Y.; Su, S.; Chen, W.; Shen, J.; Kane, O.I.; Cai, Q.S.; Hu, Z.G. Factors controlling reservoir quality of a retreating delta-front in shallow-water lacustrine in the Songliao Basin, Northeast China. J. Pet. Sci. Eng. 2022, 216, 110773. [Google Scholar] [CrossRef]
- Li, Z.; Bao, Z.D.; Dou, L.X.; Zang, D.S.; Mao, S.W.; Song, J.; Zhao, J.H.; Wang, Z.C. Sedimentary characteristics and pattern of distributary channels in shallow water deltaic red bed succession: A case from the Late Cretaceous Yaojia formation, southern Songliao Basin, NE China. J. Pet. Sci. Eng. 2018, 171, 1171–1190. [Google Scholar] [CrossRef]
- SY/T 5346-2005; Rock Capillary Pressure Measurement. China National Standards: Beijing, China, 2005.
- SY/T 5163-2018; Analysis Method for Clay Minerals and Ordinary Non-Clay Minerals in Sedimentary Rocks by the X-ray Diffraction. China National Standards: Beijing, China, 2018.
- Li, Z.D.; Zhang, L.S.; Were, P.; Wang, D.J. Sedimentary characteristics of 1st member of Yaojia Formation in Zhaoyuan-Taipingchuan region of Songliao Basin. J. Pet. Sci. Eng. 2017, 148, 52–63. [Google Scholar] [CrossRef]
- Wilson, L.; Wilson, M.J.; Green, J.; Patey, I. The influence of clay mineralogy on formation damage in North Sea reservoir sandstones: A review with illustrative examples. Earth-Sci. Rev. 2014, 134, 70–80. [Google Scholar] [CrossRef]
- Xin, R.C.; Li, G.F.; Feng, Z.Q.; Liang, J.P.; Lin, C.S. Depositional Characteristics of Lake-Floor Fan of Cretaceous Lower Yaojia Formation in Western Part of Central Depression Region, Songliao Basin. J. Earth Sci. 2009, 20, 731–745. [Google Scholar] [CrossRef]
- Sun, S.W.; Shu, L.S.; Zeng, Y.W.; Cao, H.; Feng, Z.Q. Porosity-permeability and textural heterogeneity of reservoir sandstones from the Lower Cretaceous Putaohua Member of Yaojia Formation, Weixing Oilfield, Songliao Basin, Northeast China. Mar. Pet. Geol. 2007, 24, 109–127. [Google Scholar] [CrossRef]
- Worden, R.H.; Griffiths, J.; Wooldridge, L.J.; Utley, J.E.P.; Lawan, A.Y.; Muhammed, D.D.; Simon, N.; Armitage, P.J. Chlorite in sandstones. Earth-Sci. Rev. 2020, 204, 103105. [Google Scholar] [CrossRef]
- Dowey, P.J.; Hodgson, D.M.; Worden, R.H. Pre-requisites, processes, and prediction of chlorite grain coatings in petroleum reservoirs: A review of subsurface examples. Mar. Pet. Geol. 2012, 32, 63–75. [Google Scholar] [CrossRef]
- Shaldybin, M.V.; Wilson, M.J.; Wilson, L.; Muslimova, A.V.; Cherdantseva, D.A.; Molokov, P.B. Jurassic and Cretaceous clastic petroleum reservoirs of the West Siberian sedimentary basin: Mineralogy of clays and influence on poro-perm properties. J. Asian Earth Sci. 2021, 222, 104964. [Google Scholar] [CrossRef]
- Wang, Q.T.; Liu, W.H.; Pei, L.X.; Cai, Z.G.; Luo, H.Y.; Wang, X.F.; Zhang, D.D.; Liu, J.Z. Hydrocarbon generation from calcium stearate: Insights from closed-system pyrolysis. Mar. Pet. Geol. 2021, 126, 104923. [Google Scholar] [CrossRef]
- Zhu, J.W.; Jiang, L.; Guo, D.J.; Yun, H.F.; Chen, X.X. Analysis of Reservoir Characteristics and Influencing Factors of the First Member of Yaoyi Formation in the Changjiaweizi Area, Northern Songliao Basin. J. Jilin Univ. Earth Sci. Ed. 2009, 39, 205–210. [Google Scholar]
- He, Q.B.; Zhang, J.H. Diagenesis and Diagenetic Facies of Ultra-Low Permeability Sandstone in the First Member of Yaoyi Formation in the Da’an Area, Southern Songliao Basin. J. Chengdu Univ. Technol. Nat. Sci. Ed. 2022, 49, 674–686. [Google Scholar]
- Yuan, K.; Liu, K.Q.; Zhu, R.K.; Yin, G.C.; Zhang, J.Y.; Zhang, S.R. The evolution of clay mineral and its indication of hydrocarbons under overpressure: An example from the shale of the Qingshankou formation in the Gulong Sag. Pet. Sci. 2024, 21, 3867–3883. [Google Scholar] [CrossRef]
- Yuan, G.H.; Cao, Y.C.; Gluyas, J.; Jia, Z.Z. Reactive transport modeling of coupled feldspar dissolution and secondary mineral precipitation and its implication for diagenetic interaction in sandstones. Geochim. Cosmochim. Acta 2017, 207, 232–255. [Google Scholar] [CrossRef]
- Ma, B.B.; Cao, Y.C.; Jia, Y.C. Feldspar dissolution with implications for reservoir quality in tight gas sandstones: Evidence from the Eocene Es4 interval, Dongying Depression, Bohai Bay Basin, China. J. Pet. Sci. Eng. 2017, 150, 74–84. [Google Scholar] [CrossRef]


| Well | Depth (m) | Elemental Composition (wt.%) | Total (%) | |||||||||
|---|---|---|---|---|---|---|---|---|---|---|---|---|
| Na2O | Al2O3 | MgO | SiO2 | CaO | MnO | FeO | SrO | BaO | CO2 | |||
| G141 | 1973.56 | 0.075 | 0.03 | 0.096 | 0.302 | 51.76 | 0.816 | 2.605 | 0.077 | 0.02 | 43.825 | 99.606 |
| 1973.56 | 0.079 | 0.007 | 0.027 | 0.35 | 52.37 | 1.001 | 2.897 | 0.015 | 0.015 | 43.582 | 100.343 | |
| 1973.56 | 0.075 | 0 | 0.082 | 0.171 | 54.667 | 0.472 | 1.293 | 0 | 0.015 | 43.706 | 100.481 | |
| 1973.56 | 0.12 | 0.035 | 0.027 | 0.375 | 52.333 | 1.011 | 2.652 | 0 | 0.012 | 43.668 | 100.233 | |
| 1973.56 | 0.112 | 0.006 | 0.055 | 0.596 | 51.606 | 1.233 | 3.334 | 0 | 0.01 | 43.536 | 100.488 | |
| 1973.56 | 0.169 | 0.03 | 0.055 | 0.411 | 53.101 | 1.033 | 2.653 | 0 | 0 | 43.487 | 100.939 | |
| 2001.37 | 0.088 | 0.002 | 0.076 | 0.238 | 50.794 | 0.757 | 3.744 | 0.124 | 0 | 43.725 | 99.548 | |
| 2001.37 | 0.047 | 0.007 | 0.103 | 0.243 | 51.845 | 0.993 | 2.772 | 0.139 | 0 | 43.689 | 99.838 | |
| 2001.37 | 0.086 | 0.002 | 0.117 | 0.266 | 51.751 | 0.973 | 3.557 | 0 | 0.035 | 43.517 | 100.304 | |
| 2001.37 | 0.061 | 0.002 | 0.021 | 0.264 | 51.418 | 0.836 | 2.867 | 0 | 0 | 43.88 | 99.349 | |
| 2001.37 | 0.116 | 0.645 | 0.055 | 0.279 | 51.177 | 0.964 | 3.238 | 0.062 | 0.007 | 43.746 | 100.289 | |
| 2001.37 | 0.062 | 0.006 | 0.103 | 0.282 | 51.549 | 0.794 | 3.253 | 0.031 | 0.022 | 43.701 | 99.803 | |
| 2001.37 | 0.059 | 0.031 | 0.034 | 0.27 | 50.299 | 0.963 | 4.092 | 0.108 | 0 | 43.683 | 99.539 | |
| 2001.37 | 0.086 | 0 | 0 | 0.234 | 50.876 | 0.706 | 3.78 | 0.077 | 0 | 43.749 | 99.508 | |
| 2001.37 | 0.053 | 0.003 | 0 | 0.224 | 50.641 | 1.017 | 3.65 | 0.015 | 0 | 43.771 | 99.374 | |
| G142 | 1835.39 | 0.073 | 0.042 | 0.089 | 0.358 | 53.762 | 0.973 | 2.063 | 0.077 | 0.025 | 43.48 | 100.942 |
| 1835.39 | 0.048 | 0.026 | 0.109 | 0.29 | 53 | 0.922 | 2.374 | 0.124 | 0.005 | 43.565 | 100.463 | |
| 1835.39 | 0.09 | 0.028 | 0.253 | 0.334 | 52.742 | 1.021 | 2.331 | 0 | 0.04 | 43.599 | 100.438 | |
| 1835.39 | 0.043 | 0.019 | 0.055 | 0.374 | 51.375 | 1.521 | 2.389 | 0.278 | 0.072 | 43.665 | 99.791 | |
| 1835.39 | 0.029 | 0 | 0.021 | 0.333 | 52.024 | 1.192 | 2.296 | 0 | 0 | 43.796 | 99.691 | |
| 1842.19 | 0.133 | 0.025 | 0.062 | 0.367 | 51.965 | 1.231 | 3.267 | 0.201 | 0.025 | 43.414 | 100.69 | |
| 1842.19 | 0.127 | 0.061 | 0.165 | 0.332 | 52.132 | 1.284 | 3.409 | 0.108 | 0.01 | 43.338 | 100.966 | |
| 1842.19 | 0.056 | 0.028 | 0.089 | 0.229 | 51.383 | 0.777 | 3.13 | 0 | 0.03 | 43.798 | 99.52 | |
| 1842.19 | 0.049 | 0 | 0.069 | 0.404 | 50.909 | 1.22 | 3.291 | 0 | 0 | 43.725 | 99.667 | |
| 1842.19 | 0.12 | 0.029 | 0.384 | 0.357 | 51.154 | 1.365 | 3.33 | 0.155 | 0.057 | 43.458 | 100.409 | |
| Well Number | Sample Number | Deepth, m | Stratigraphic Level | δ18OV-PDB, ‰ | δ13CV-PDB, ‰ |
|---|---|---|---|---|---|
| G141 | G141-1 | 1973.7 | K1y1 | −20.63 | −4.86 |
| G141-3 | 2001.4 | K1y1 | −20.56 | −4.91 | |
| G141-4 | 2002.4 | K1y1 | −19.45 | −3.48 | |
| G142 | G142-1 | 1834.4 | K1y1 | −18.7 | −3.03 |
| G142-2 | 1834.5 | K1y1 | −19.2 | −2.03 | |
| G142-3 | 1835.4 | K1y1 | −18.82 | −5.21 | |
| G142-4 | 1842.2 | K1y1 | −18.91 | −4.99 | |
| G844 | G844-2 | 2037.2 | K1y1 | −18.22 | −5.53 |
| G844-3 | 2038.2 | K1y1 | −12.84 | −5.11 | |
| G844-5 | 2056.6 | K1y1 | −15.14 | −4.6 | |
| Y142 | Y142-13 | 1898.0 | K1y1 | −18.3 | −2.08 |
| Y142-14 | 1894.6 | K1y1 | −16.78 | −3.52 | |
| Y142-15 | 1890.3 | K1y1 | −14.95 | −2.65 | |
| Y89 | Y89-2 | 1947.7 | K1y1 | −12.6 | −9.79 |
| Y89-3 | 1950.9 | K1y1 | −12.26 | −11.31 |
Disclaimer/Publisher’s Note: The statements, opinions and data contained in all publications are solely those of the individual author(s) and contributor(s) and not of MDPI and/or the editor(s). MDPI and/or the editor(s) disclaim responsibility for any injury to people or property resulting from any ideas, methods, instructions or products referred to in the content. |
© 2025 by the authors. Licensee MDPI, Basel, Switzerland. This article is an open access article distributed under the terms and conditions of the Creative Commons Attribution (CC BY) license (https://creativecommons.org/licenses/by/4.0/).
Share and Cite
Li, J.; Zheng, Q.; Cai, Y.; Liu, H.; Hu, T.; Wu, H. Genesis of Clastic Reservoirs in the First Member of Yaojia Formation, Northern Songliao Basin. Minerals 2025, 15, 795. https://doi.org/10.3390/min15080795
Li J, Zheng Q, Cai Y, Liu H, Hu T, Wu H. Genesis of Clastic Reservoirs in the First Member of Yaojia Formation, Northern Songliao Basin. Minerals. 2025; 15(8):795. https://doi.org/10.3390/min15080795
Chicago/Turabian StyleLi, Junhui, Qiang Zheng, Yu Cai, Huaye Liu, Tianxin Hu, and Haiguang Wu. 2025. "Genesis of Clastic Reservoirs in the First Member of Yaojia Formation, Northern Songliao Basin" Minerals 15, no. 8: 795. https://doi.org/10.3390/min15080795
APA StyleLi, J., Zheng, Q., Cai, Y., Liu, H., Hu, T., & Wu, H. (2025). Genesis of Clastic Reservoirs in the First Member of Yaojia Formation, Northern Songliao Basin. Minerals, 15(8), 795. https://doi.org/10.3390/min15080795