Article

Preparation and Performance Study of Alkali-Activated Conductive Mortar via Response Surface Methodology

1
School of Civil and Architecture Engineering, East China University of Technology, Nanchang 330013, China
2
State Key Laboratory of Disaster Prevention & Mitigation of Explosion & Impact, Army Engineering University of PLA, Nanjing 210001, China
*
Author to whom correspondence should be addressed.
Minerals 2025, 15(8), 787; https://doi.org/10.3390/min15080787
Submission received: 11 June 2025 / Revised: 18 July 2025 / Accepted: 24 July 2025 / Published: 26 July 2025
(This article belongs to the Special Issue Development in Alkali-Activated Materials and Applications)

Abstract

In this study, alkali-activated coal gangue-slag material (AACGS) was prepared using coal gangue and slag as precursors, and its feasibility as conductive mortar substrate material was preliminarily investigated. Firstly, this study employed Response Surface Methodology (RSM) to develop statistical models correlating the alkali equivalent, water-to-binder ratio, and slag content with the compressive strength, flexural strength, and resistivity of AACGS, aiming to identify the optimal mix proportions. Secondly, based on the optimal ratio identified above and using carbon fibers (CF) as the conductive phase, an alkali-activated conductive mortar (CF-AACGS) was prepared, and its compressive strength, flexural strength, and resistivity were tested. Lastly, XRD and SEM-EDS were conducted to characterize the mineral composition and microstructure of CF-AACGS. The results indicate that when the alkali equivalent, water-to-binder ratio, and slag content are 13.34%, 0.54, and 57.52%, respectively, the AACGS achieves compressive strength, flexural strength, and resistivity of 72.5 MPa, 7.0 MPa, and 62.41 Ω·m at 28 days. Under the action of the alkali activator, coal gangue and slag undergo hydration reactions, forming a denser N, C-(A)-S-H gel. This effectively improves the interface transition zone between the CF and AACGS, endowing the CF-AACGS with superior mechanical properties. Furthermore, the AACGS matrix enhances the conductive contact point density by optimizing CF dispersion, which significantly reduces the resistivity of the CF-AACGS.

1. Introduction

Conductive mortar is a special mortar that balances mechanical and electrical conductivity properties [1], showing broad application prospects in fields such as damage monitoring [2], de-icing and heating [3], electromagnetic shielding [4], and lightning protection [5]. It consists of a conductive phase and a substrate material [6]. Currently, cement stone is the most commonly used substrate material. However, the bonding at the cement paste interfaces is relatively poor. When combined with a large amount of conductive phase, this inevitably leads to the formation of many pores and weak interfaces within the matrix, resulting in a significant decline in mechanical properties and difficulty in meeting actual engineering requirements [7,8,9]. Therefore, finding a substrate material that is highly compatible with the conductive phase has been a key research focus in the development of conductive mortar [10].
Alkali-activated materials are inorganic cementitious materials with similar properties to cement. They are made from silicon–aluminum (calcium)-based minerals [11] and feature high strength, high-temperature resistance, alkali and acid corrosion resistance, and low CO2 emissions [12,13]. Notably, Na2SiO3 and high concentrations of (SiO4)4− in the pore solution of alkali-activated materials can form denser and more uniform interfacial transition zones, significantly improving compatibility with the conductive phase and thereby enhancing the mechanical properties of the conductive mortar [14]. Additionally, the rich ion content and nanoscale pores (<6 nm) within alkali-activated materials confer superior electrical conductivity [15,16].
Generally, the properties of alkali-activated materials are influenced by multiple factors [17,18]. Research by Lou Y et al. [19] revealed that the alkali equivalent has a significant impact on the mechanical properties of alkali-activated materials. The study showed that increasing the alkali equivalent from 4% to 6% led to a 33.4% increase in compressive strength. This is because the appropriate concentration of OH can dissolve the silicate and aluminate glass phases in the raw materials, releasing reactive SiO2 and Al2O3, which promotes the polycondensation of silicate and aluminate monomers to form a three-dimensional network structure, thereby enhancing the mechanical properties of the alkali-activated material [20,21]. Additionally, research by Hanjitsuwan et al. [22] found that increasing alkali equivalent raised the levels of OH and Na+ in the pore solution, resulting in a significant decrease in the matrix’s resistivity with higher alkali equivalent. Xie J et al. [23] found that increasing the water-to-binder ratio leads to a higher content of free water within the system. After the reaction and hardening, the evaporation of excess water results in the formation of more capillary and air pores, which reduces the density of the alkali-activated material, significantly increases porosity, and, thus, weakens the matrix strength. Zhen et al. [24] discovered that free water content is a key parameter affecting the resistivity of alkali-activated materials. Additionally, Wang et al. [25] indicated that the coal gangue generated during coal mining and washing processes is rich in aluminosilicate minerals, with SiO2 and Al2O3 contents reaching ~60%–95%, making it an excellent precursor for preparing alkali-activated materials. Ma et al. [26] reported that replacing 20% of coal gangue with slag resulted in a significant enhancement of the matrix’s compressive strength. It is evident that factors such as water-to-binder ratio, alkali equivalent, and precursor formulation have a significant impact on the mechanical and electrical properties of alkali-activated materials. However, most current studies predominantly focus on the effects of these factors on a single property of alkali-activated materials, such as mechanical or electrical properties, with limited research exploring their comprehensive impact on both mechanical and conductive performances. This research limitation not only restricts a deeper understanding of the regulation principles of alkali-activated material performance but also directly affects the optimization design and engineering application of their use in conductive mortar development.
In the field of construction materials research, orthogonal experiments and Response Surface Methodology (RSM) are commonly employed to analyze the overall effects of multiple factors on material properties [27]. Nevertheless, under scenarios demanding synergistic multi-factor optimization (e.g., balancing mechanical and functional properties), orthogonal designs face limitations in efficiently capturing interaction effects, often necessitating expansive experimental arrays [28]. In contrast, as an advanced branch of Design of Experiments (DOE), RSM overcomes these constraints by establishing multifactorial mathematical linkages with reduced experimental burden [29]. For example, Jiang et al. [30] employed the Box-Behnken Design (BBD) within RSM to develop quadratic polynomial regression models, comprehensively analyzing the impacts of three factors on three performance indices of geopolymers. Similarly, Wu et al. [31] utilized RSM to establish quadratic regression models investigating the effects of three factors on two performance levels of fly ash-ground granulated blast furnace slag (GGBS) geopolymers, successfully identifying their optimal mix design. These studies convincingly demonstrate the significant advantages of applying RSM in the multi-factor, multi-performance analysis of construction materials.
Therefore, this study employed response surface methodology (RSM) to develop statistical models correlating the alkali equivalent, water-to-binder ratio, and slag content with the compressive strength, flexural strength, and resistivity of alkali-activated materials (AACGS). This comprehensive analysis aims to understand the effects of various factors on the performance of alkali-activated materials and to determine the optimal mix proportions. Subsequently, based on the optimized formulation obtained above, and employing the currently most widely used carbon fiber (CF) as the conductive phase, an alkali-activated conductive mortar (CF-AACGS) was prepared to explore the feasibility of using AACGS as the substrate material for conductive mortar. Finally, XRD and SEM-EDS were employed to elucidate the interaction mechanism between AACGS and CF, providing a theoretical foundation for future research on alkali-activated conductive mortars.

2. Materials and Methods
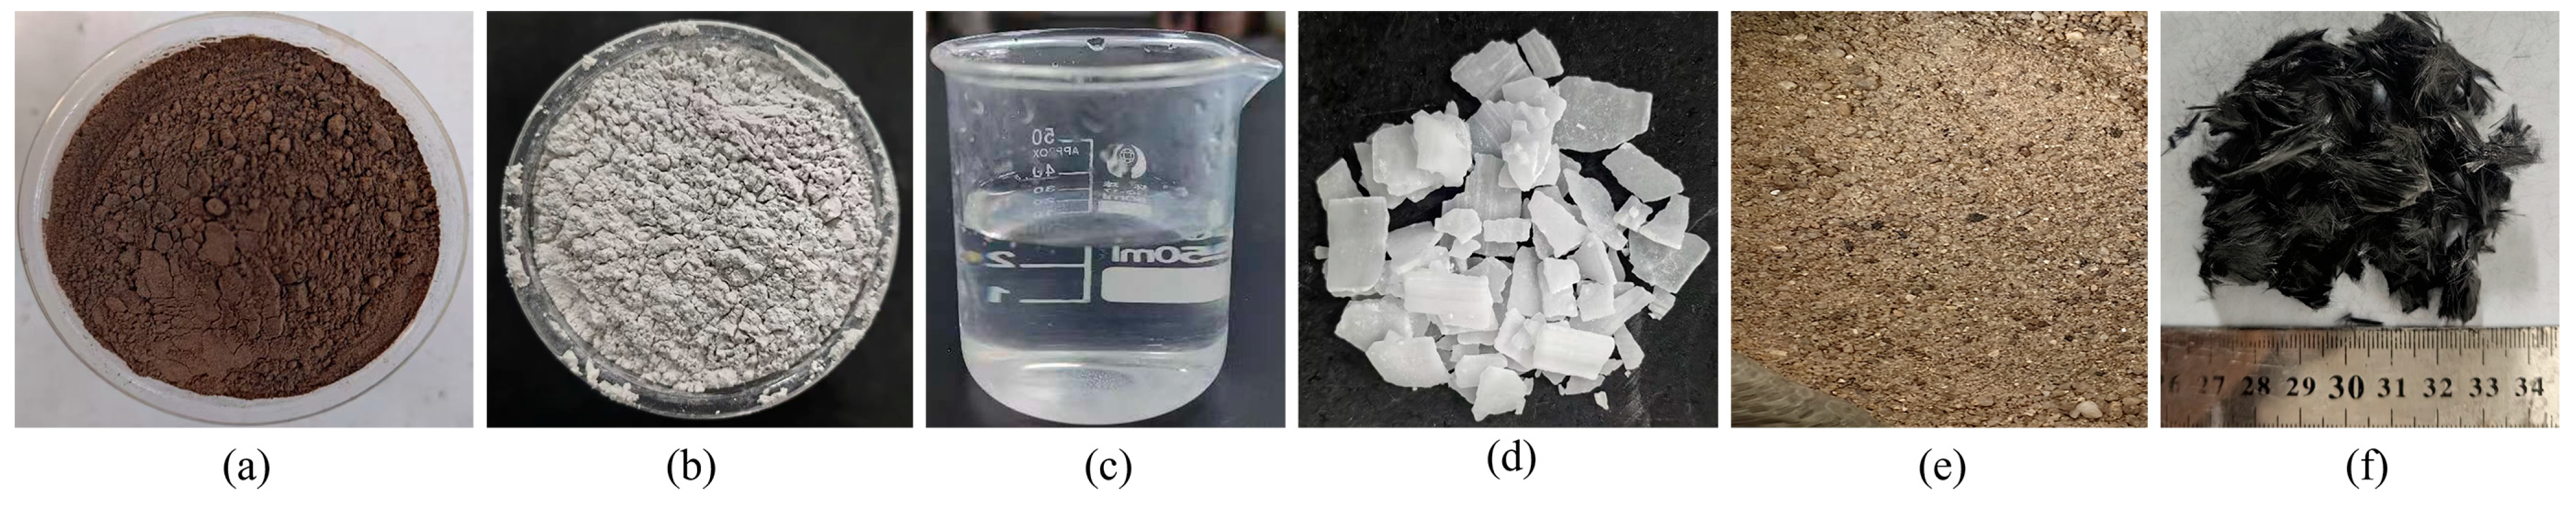
2.1. Materials

Alkali-activated conductive mortar (CF-AACGS) is prepared using alkali-activated materials (AACGS) as the substrate material and carbon fibers (CF) as the conductive phase. The apparent morphology of the main raw materials is shown in Figure 1. The raw coal gangue is sourced from Jiangxi Province and is processed through grinding followed by calcination at 800 °C for 4 h to produce the coal gangue powder (CG) used in the experiments. S95-grade slag powder (SG) is obtained from Henan Province. Figure 2 displays the particle size distributions of CG and SG, measured using a laser particle sizer. The average particle sizes and specific surface areas are 7.5 μm and 295 m2/kg for CG, and 5.2 μm and 430 m2/kg for SG, respectively. Figure 3 presents the mineral composition of CG and SG as determined by X-ray diffraction analysis (XRD). Figure 4 shows the microstructure morphology of CG and SG observed via scanning electron microscopy (SEM). The analysis indicates that the calcined CG is mainly composed of quartz, illite, and hematite, while SG predominantly includes Ca2MgSi2O7 and Ca2Al2SiO7. The chemical composition of CG and SG, measured by X-Ray fluorescence (XRF), is listed in Table 1, with SiO2 and Al2O3 contents in CG reaching 52.26% and 18.34%, respectively, and CaO content in SG reaching 39.29%. Considering the complementary chemical characteristics of CG and SG, they are combined as precursors for the AACGS.
Alkali activators were prepared using sodium silicate, NaOH, and water. The sodium silicate was purchased from Youruin Refractory Materials Co., Ltd. (Jiaxing, China), with a modulus of 2.2 and SiO2 and Na2O contents of 30% and 13.5%, respectively. NaOH was purchased from HengmaoChemical Reagents Co., Ltd. (Tianjin, China), of analytical purity with a purity exceeding 96%. The water used in the experiments was tap water purchased from Jiangxi Hongcheng Environmental Co., Ltd. (Nanchang, China).
River sand was used as fine aggregate, with a fineness modulus of 2.62, purchased from Ganchang Sand and Gravel Co., Ltd. (Nanchang, China). The size distribution and basic properties of river sand are presented in Table 2 and Table 3, respectively. CF produced by Toray Industries, Inc. (Tokyo, Japan), was used as the conductive phase, with basic properties listed in Table 4. Other supplementary materials included methyl cellulose (as a dispersant) and superplasticizers, purchased from Fuqiang Fine Chemical Co., Ltd. (Jinzhou, China), and Qichen Chemical Technology Co., Ltd. (Shanghai, China), respectively. For the control group, ordinary Portland cement (P.O. 42.5) was used, produced by Hailuo Cement Co., Ltd. (Wuhu, China), with basic properties listed in Table 5.

2.2. Experimental Design

2.2.1. Experimental Ratio

This study employed Response Surface Methodology (RSM) combined with Box-Behnken Design (BBD) to optimize the properties of AACGS. RSM is an effective approach that establishes statistical models to elucidate the relationships between independent variables (factors) and dependent variables (responses). As a common experimental design strategy within RSM, BBD is inherently a three-level response surface design [32]. Specifically, the BBD experimental points comprise two parts: the factorial points located at the midpoints of the edges of the factor space cube (coded levels ±1) and the center points (coded level 0), which are replicated multiple times. Furthermore, during the optimization process, RSM-BBD typically constructs quadratic polynomial models to predict responses. These models fit data using second-order polynomial equations, effectively capturing nonlinear relationships between factors and responses, ultimately enabling the determination of the optimal factor combinations.
This study designed three factors: alkali equivalent, water-to-binder ratio, and slag content. The response variables included 28-day compressive strength, 28-day flexural strength, and 28-day resistivity. An appropriate alkali activator content (represented by alkali equivalent) significantly enhances the compressive strength, flexural strength, and resistivity of AACGS. However, the value should not exceed 14%, as excessive alkali activator may disrupt the precursor structure and accelerate hydration product formation, adversely affecting mechanical properties [33,34,35]. The water-to-binder ratio markedly influences AACGS mortar’s strength and resistivity, with opposing effects: higher ratios substantially reduce strength but improve electrical conductivity. Previous studies confirmed that hardened AACGS exhibits insufficient strength for practical engineering applications when the water-to-binder ratio exceeds 0.55 [36,37,38]. Increased slag content notably improves AACGS strength but simultaneously reduces conductivity [39]. To balance adequate strength while maintaining acceptable resistivity, the slag content was constrained to 30%–60%. According to the Chinese Standard GB/T 17671-2021 [40], a binder-to-sand ratio of 1:3 was adopted. The content of superplasticizer was 2.9 kg/m3, and that of dispersant was 4.1 kg/m3 for all specimen groups. Detailed factor levels/ranges and coded values are shown in Table 6. Seventeen AACGS mixture schemes, randomly generated via RSM-BBD design, are listed in Table 7.

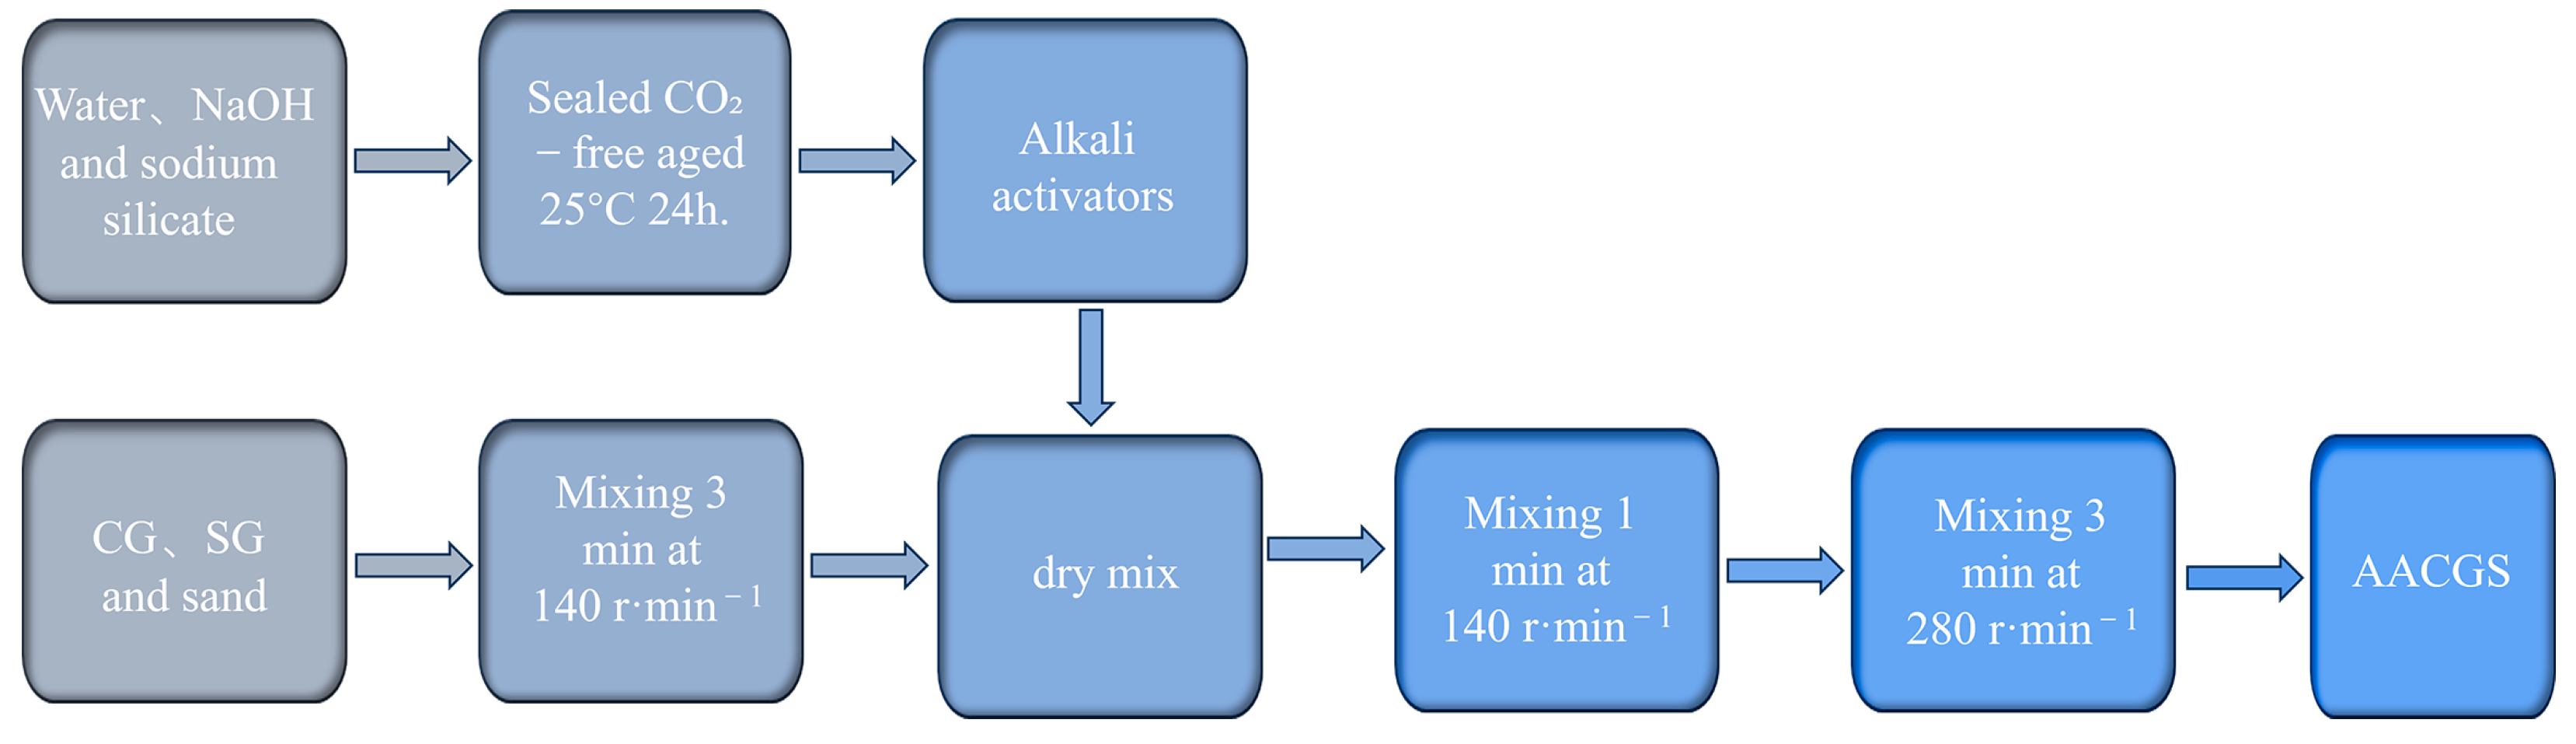
2.2.2. Preparation of Conductive Mortar

The alkali activator was prepared by mixing water, NaOH, and sodium silicate according to Table 5. Following thorough stirring, the mixture was placed in sealed containers to exclude CO2 and aged at 25 ± 1 °C for 24 h [41,42]. Second, the CG, SG, and river sand were dry-mixed in the JJ-5 type cement mortar mixer. Next, the aged alkali activator was poured into the mixer and stirred. (In the preparation of CF-AACGS, CF was first added to the aged alkali activator before being combined with the mixture in the mixer [43].) Finally, the freshly prepared slurry was poured into molds measuring 40 mm × 40 mm × 160 mm and 40 mm × 40 mm × 40 mm. The mixture was vibrated to promote compaction, then wrapped with plastic film on the surface, allowed to cure naturally for 24 h, after which the molds were removed. The specimens were then transferred to a water tank maintained at 20 ± 1 °C for curing until the required age. The method for preparing AACGS is shown in Figure 5.

2.3. Testing Methods

2.3.1. Flexural Strength Test and Compressive Strength Test

In accordance with the Chinese Standard GB/T 17671-2021, the flexural and compressive strengths of the specimens were tested using the SHT4305 electro-hydraulic servo universal testing machine manufactured by Meters Industrial Systems (China) Co., Ltd. (Shanghai, China). The loading rates were set to 50 N/s for the flexural strength test and 2400 N/s for the compressive strength test. In addition, three specimens were used for the flexural strength testing, while six specimens were employed for the compressive strength testing.

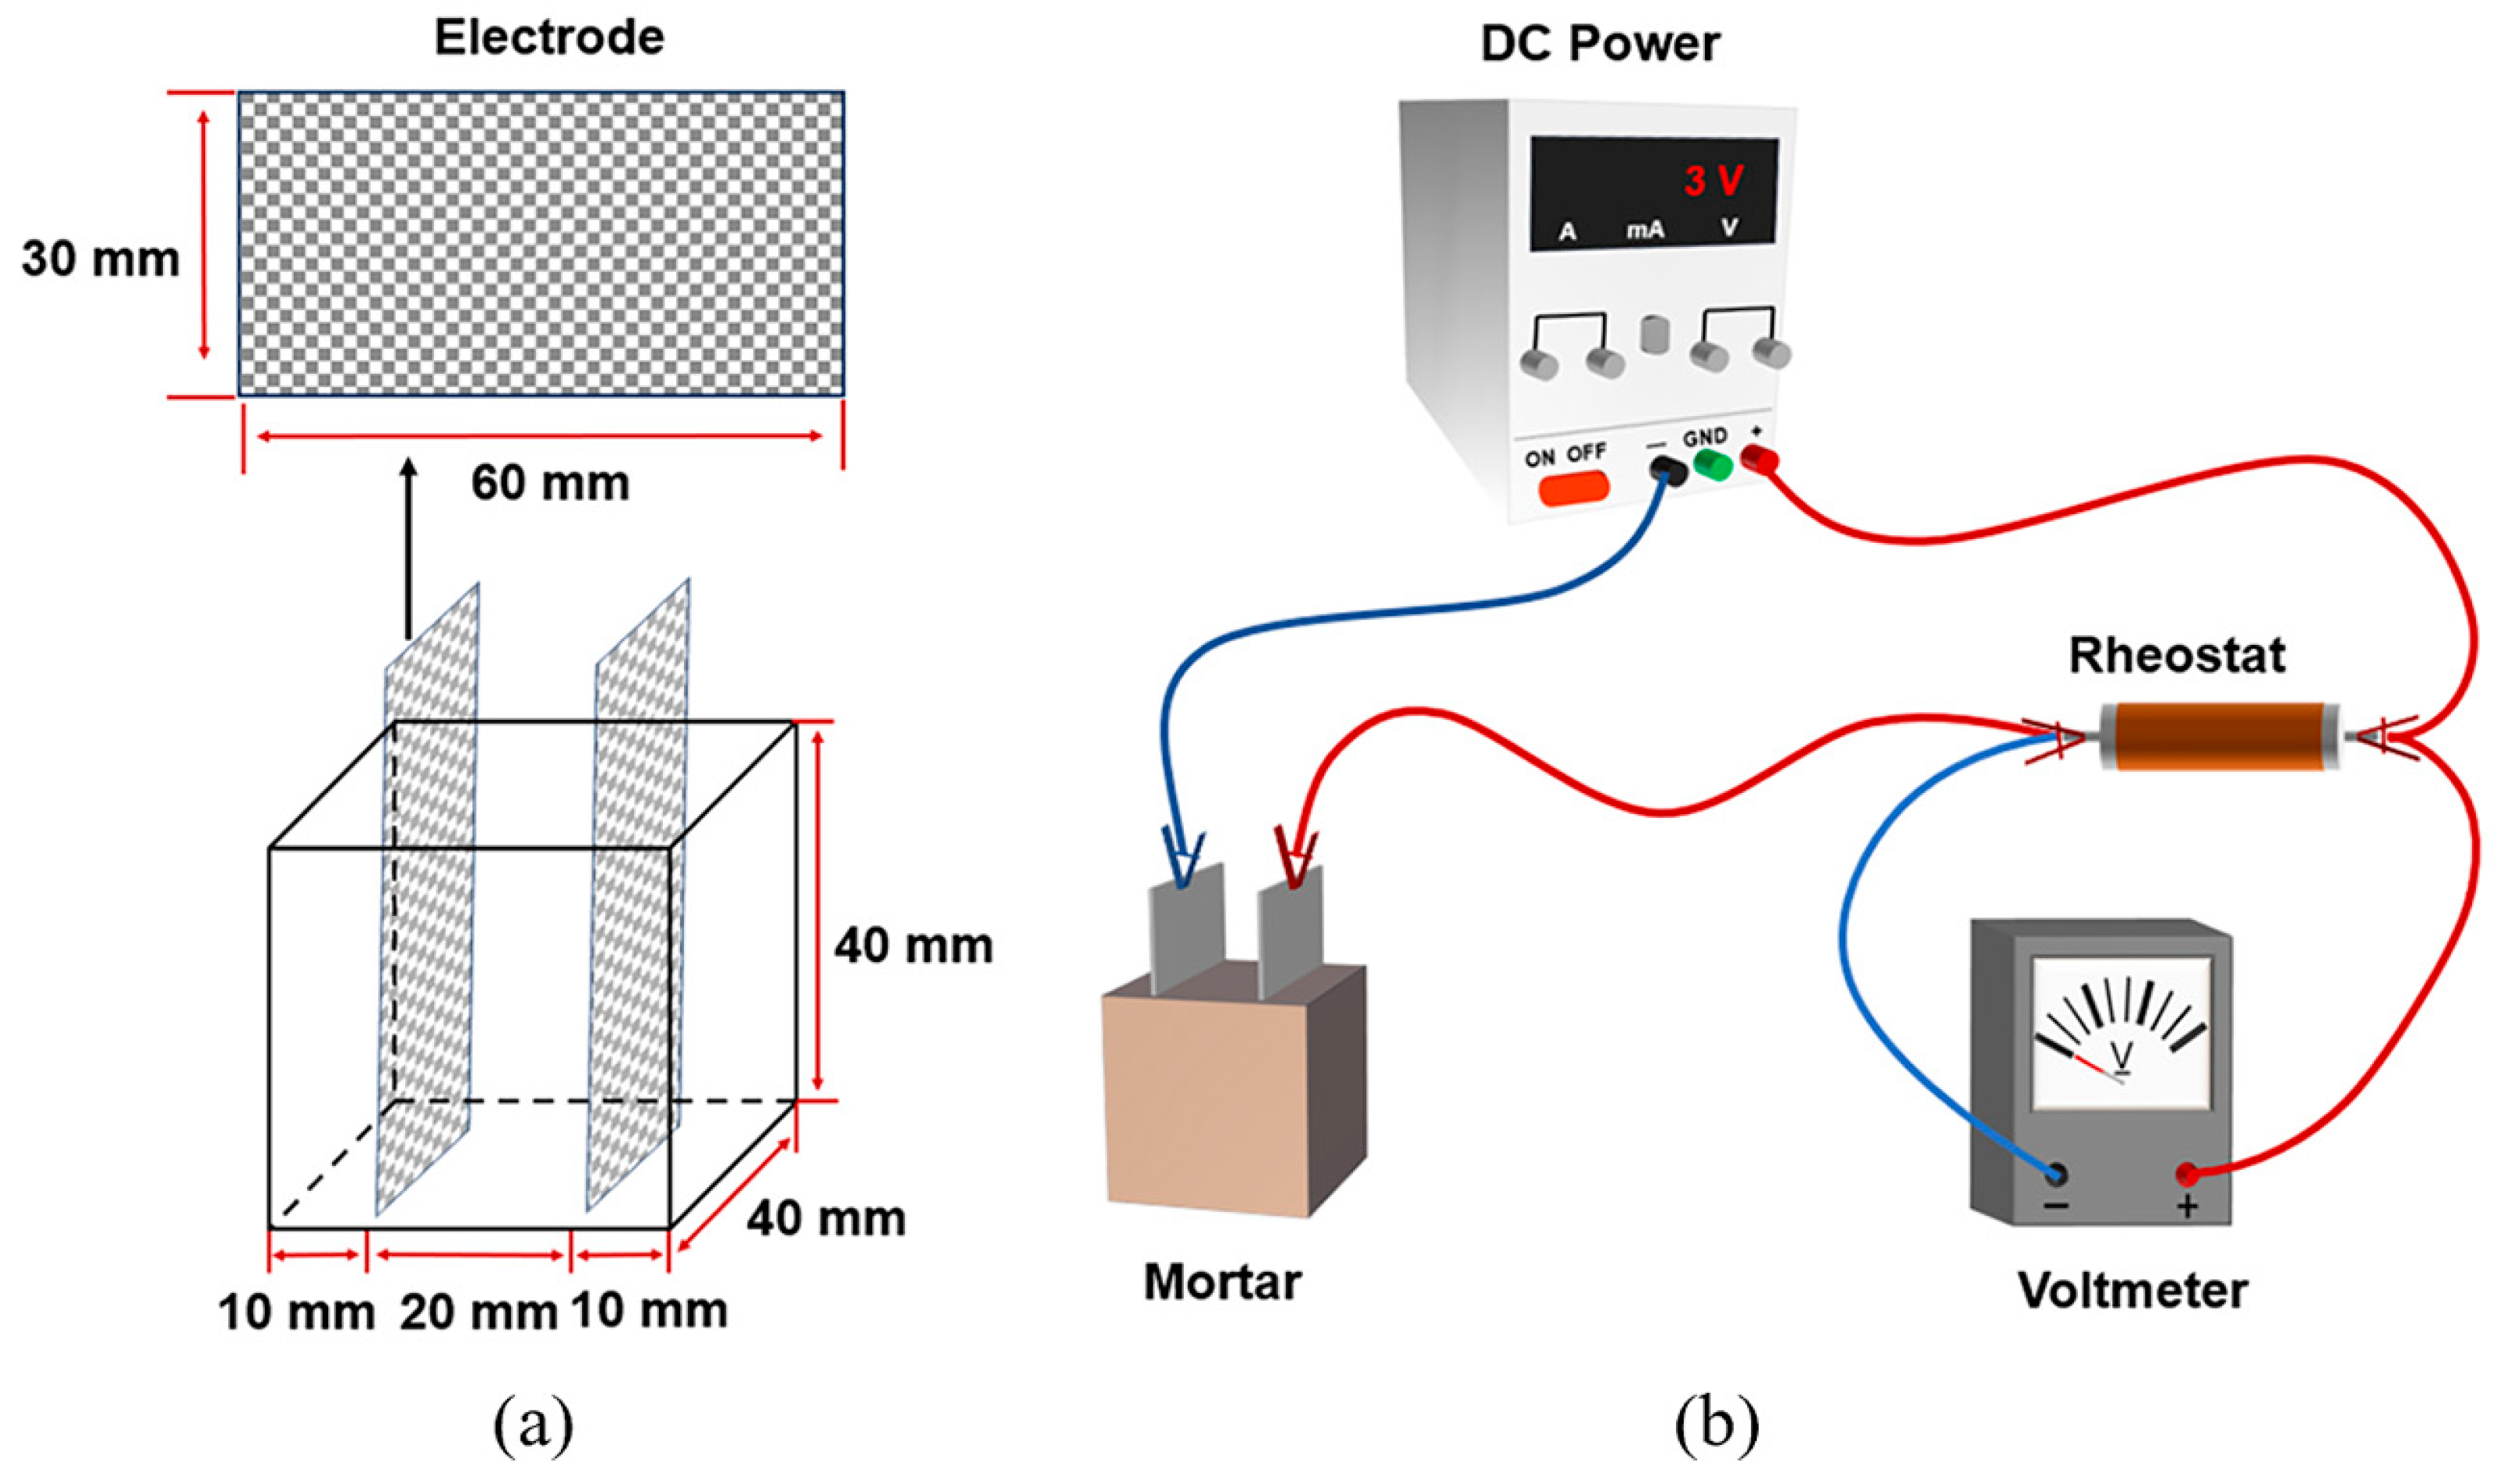
2.3.2. Conductivity Test

The specimens’ resistivity was measured using the two-electrode method [44], with specimen dimensions of 40 mm × 40 mm × 40 mm, and electrode plates (made of stainless steel) measuring 30 mm × 60 mm. The specific parameters are shown in Figure 6a. A 3 V DC power supply was used for the tests, and the detailed test circuit diagram is displayed in Figure 6b. To reduce experimental errors, three specimens were prepared for each set, and their average value was taken as the final result.
The resistance and resistivity were determined using Equations (1) and (2), respectively.
R = U U 1 U 1 / R 1
where R is the resistance of the test specimen (Ω); U is power supply voltage (V); R1 is the resistance of the rheostat (Ω); U1 is the voltage measured across the rheostat (V).
ρ = R × S L
where ρ is the resistivity of the test specimen (Ω·m); S is the cross-sectional area of the specimen (m2); L is the distance between the two electrodes of the mortar (m).

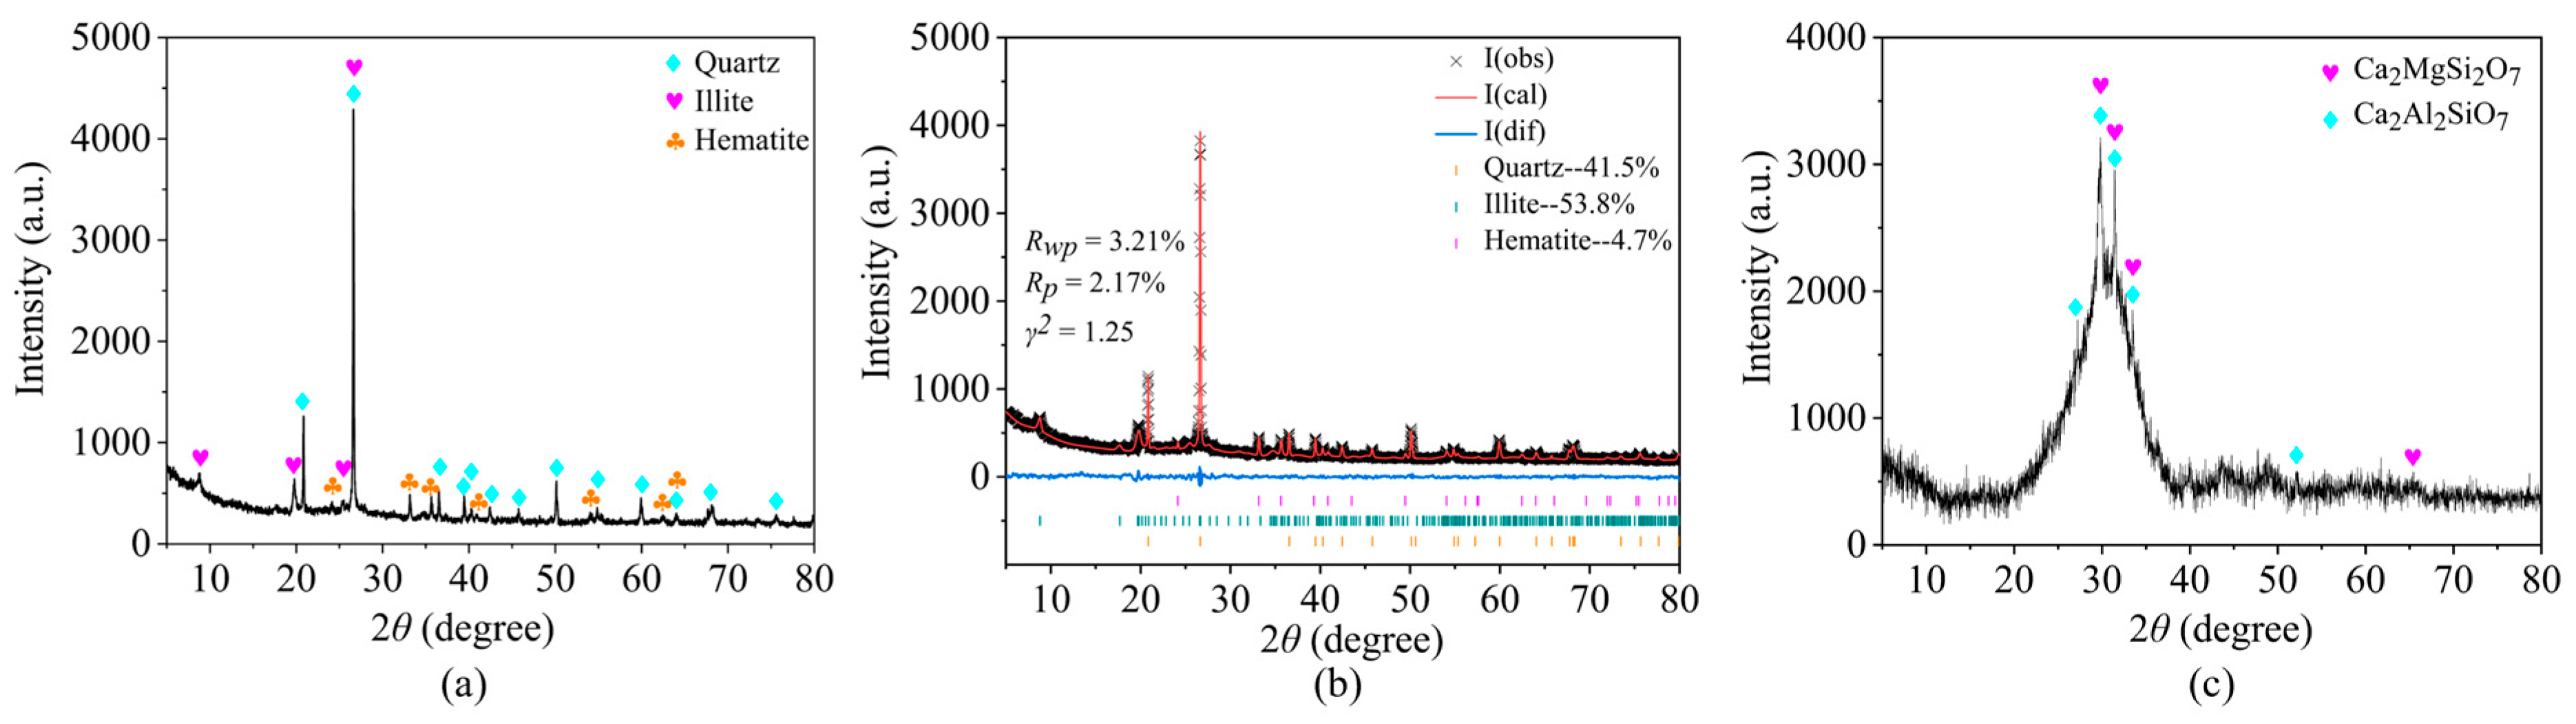
2.3.3. XRD and SEM-EDS Test

The mineral composition of CG, SG, and AACGS was analyzed using a Bruker D8 Advance X-ray diffractometer (XRD) (Bruker AXS GmbH, Karlsruhe, Germany) at 40 kV, with a 2θ scanning range of 5° to 80°, a step size of 0.02°, and a scanning speed of 5°/min. The microstructure morphology of AACGS and CF-AACGS was observed with an FEI Nova NanoSEM 450 field-emission scanning electron microscope (SEM) (FEI Czech Republic, Prague, Czech Republic).

3. Results and Discussion

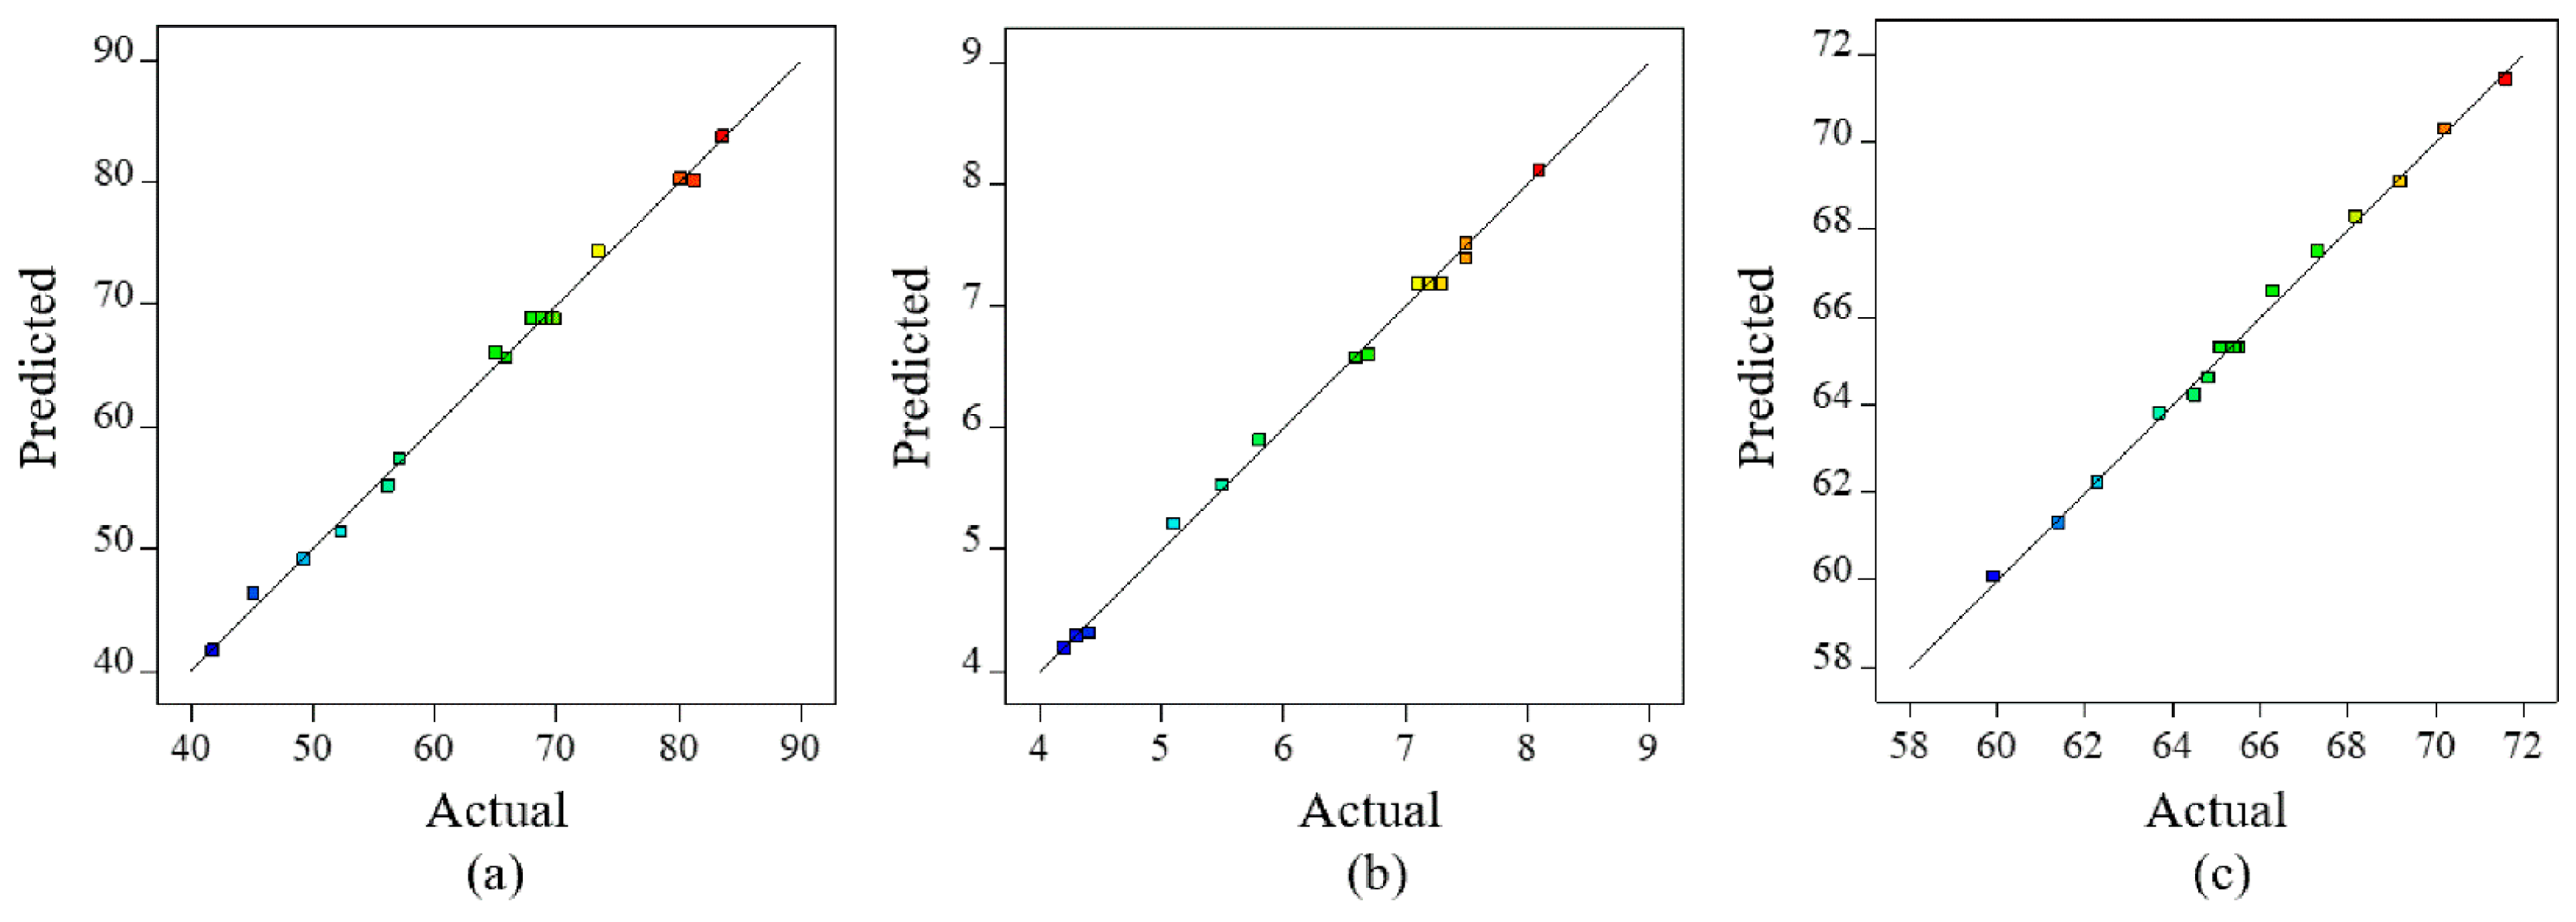
3.1. Model Validity Analysis

Using RSM, the experimental data (Table 8) were subjected to multivariate regression analysis to establish RSM models (Equations (3)–(5)) relating the three factors (water-to-binder ratio, alkali equivalent, and slag content) to the properties of AACGS, namely compressive strength (Y1), flexural strength (Y2), and resistivity (Y3). These models were developed to analyze and predict the influence of these factors on AACGS performance.
Y1 = 68.82 − 0.66W − 4.79A + 16.23S − 0.45WA + 0.73WS + 0.08AS − 3.29W2 − 4.48A2 − 1.56S2
Y2 = 7.18 − 0.09W − 0.44A + 1.53S − 0.10WA − 0.08WS + 0.08AS − 0.72W2 − 0.32A2 − 0.64S2
Y3 = 65.30 − 3.56W − 2.11A + 0.93S − 0.15WA + 0.33WS + 0.08AS + 0.70W2 − 0.10A2 + 0.13S2
where Y1, Y2, and Y3 are the compressive strength, flexural strength, and resistivity, respectively; W, A, and S are the coded values of water-to-binder ratio, alkali equivalent, and slag content, respectively.
Table 9 shows the analysis of variance (ANOVA) results for the RSM models. The p-value indicates the probability that the initial hypothesis is true; a lower p-value and a higher F-value suggest greater model significance. Typically, a p-value less than 0.05 indicates a highly significant model with reliable predictive capability [45,46]. In this study, the p-values for all RSM models were less than 0.001 (Table 9), demonstrating a very strong correlation between the factors and AACGS performance. Additionally, the F-values for the models were 220.00, 215.02, and 246.87, respectively, further confirming the high significance of the RSM models.
The correlation coefficient (R2), adjusted correlation coefficient (Adj. R2), predictive correlation coefficient (Pred. R2), coefficient of variation (C.V.), and signal-to-noise ratio (Adeq Precision) are important statistical metrics used to comprehensively evaluate the reliability of the RSM models. R2 indicates the degree of fit between the experimental data and the model; its value ranges from 0 to 1. A higher R2 signifies higher model reliability and accuracy. In this study (Table 10), the R2 for the Y1, Y2, and Y3 models were 0.9965, 0.9964, and 0.9969, respectively. The differences between each model’s Pred-R2 and Adj-R2 were less than 0.2, indicating a good fit between experimental data and the models. The C.V. value is the ratio of standard deviation to the mean, and it is generally recommended to be less than 10% [47]. Analysis of Table 8 shows that the C.V. values (1.73%, 1.78%, and 0.39%) for this study fall within this acceptable range. Similarly, Adeq Precision describes the ratio of the mean response to the standard deviation; a value greater than 4 indicates that the signal (variability of experimental results) exceeds the noise (experimental error), thus implying reliable results [48]. In this study, the models for Y1, Y2, and Y3 had Adeq Precision values of 49.26, 45.01, and 57.57, respectively—far exceeding 4, indicating high model reliability.
Figure 7 shows the distribution relationships between the actual and predicted values of AACGS’s compressive strength, flexural strength, and resistivity. The analysis shows that the scatter points are closely distributed along the 45-degree diagonal line, indicating a high level of agreement between predicted and actual values. This further validates the high reliability of the developed RSM models. In summary, all the statistical results for each model are within satisfactory ranges, confirming that the RSM models can reliably be used to analyze and predict AACGS performance.

3.2. Response Surface Analysis

Using RSM, 3D response surface plots and corresponding 2D contour maps were generated to visualize the effects of three factors on AACGS performance (Figure 8, Figure 9 and Figure 10). When analyzing the interaction between any two factors, the third factor was fixed at its central level to control for confounding variables. This approach ensures focused interpretation of bivariate effects while maintaining experimental validity [49,50].

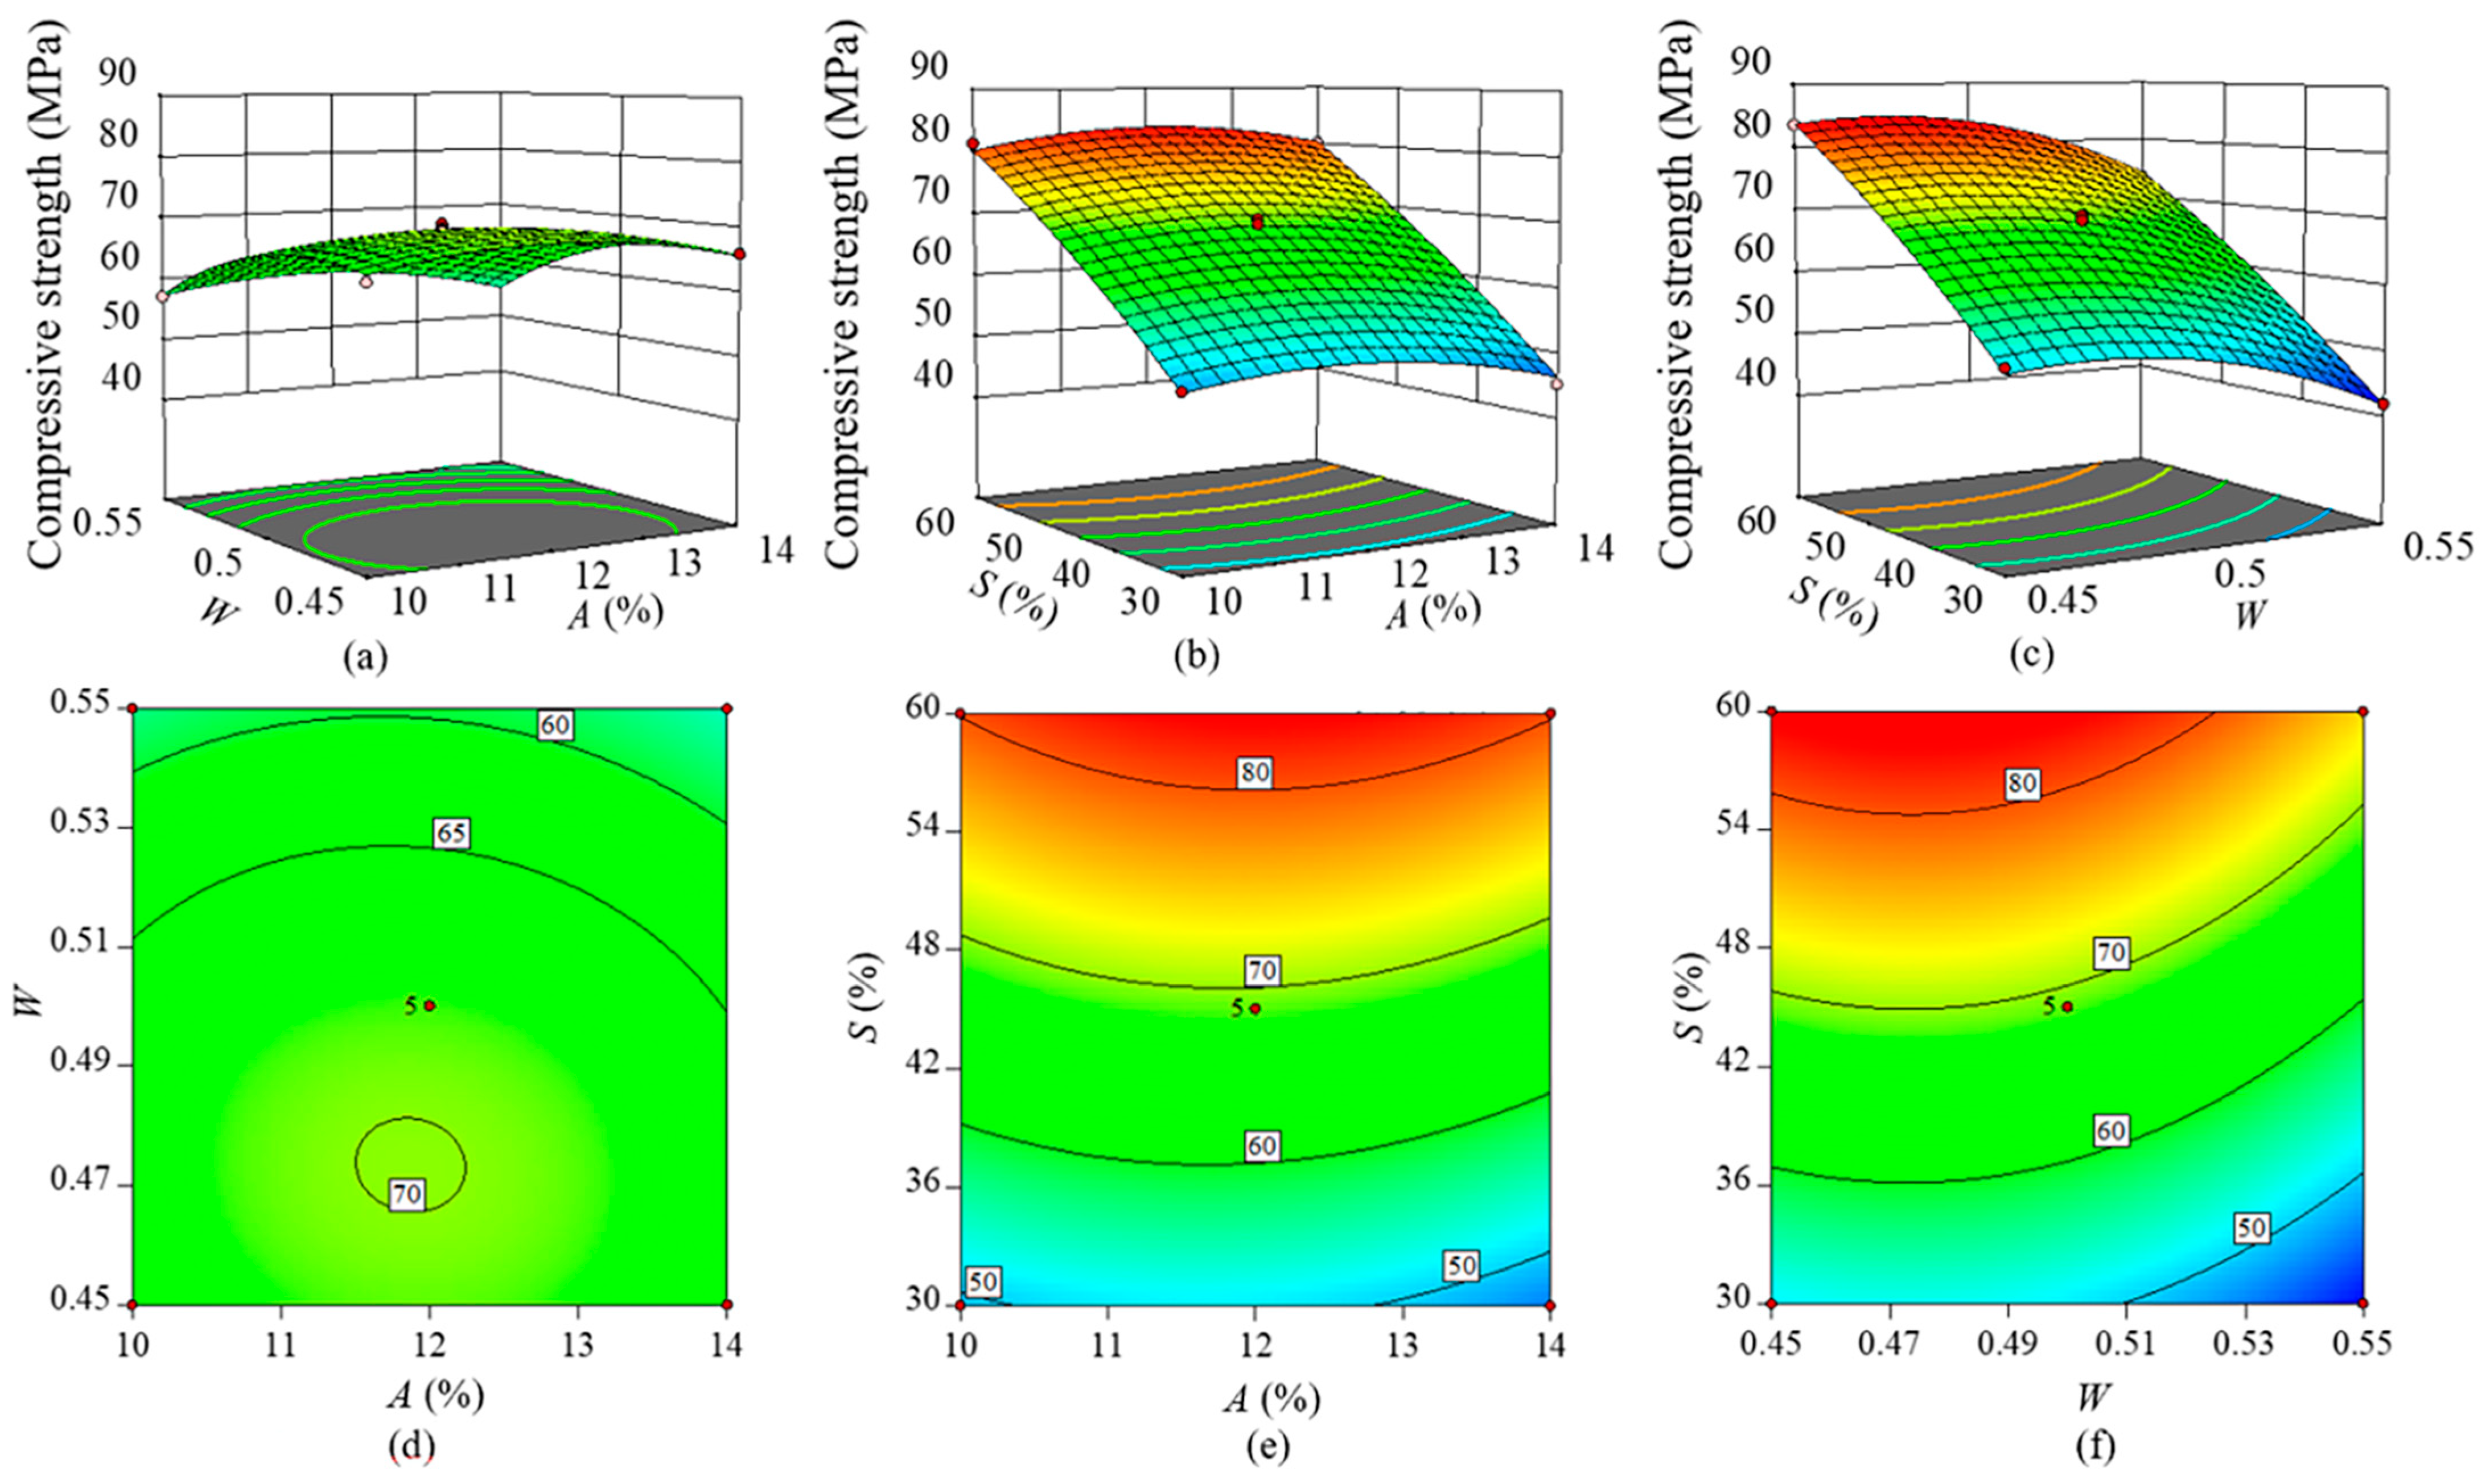
3.2.1. Compressive Strength

Figure 8a,d depicts the interaction effects of water-to-binder ratio and alkali equivalent on AACGS compressive strength when slag content is fixed at 45.0%. Within each factor level, the compressive strength initially increases and then decreases with increases in both water-to-binder ratio and alkali equivalent. However, the magnitude of these changes is modest, indicated by the slight distortion of the 3D response surfaces.
Figure 8b,e depicts the interaction effects of alkali equivalent and slag content on AACGS compressive strength when the water-to-binder ratio is fixed at 0.50. Figure 8b shows that, within each factor level, the compressive strength initially increases and then decreases with higher alkali equivalent while increasing significantly with higher slag content. Within the range of 11.0% to 13.0% for alkali equivalent and with slag content above 54.0%, higher compressive strengths can be achieved. Figure 8d indicates that the contour lines are more densely packed along the vertical axis than along the horizontal axis, suggesting that slag content exerts a more pronounced influence on the compressive strength of AACGS compared to alkali equivalent.
Figure 8c,f depicts the interaction effects of water-to-binder ratio and slag content on AACGS compressive strength when alkali equivalent is fixed at 12.0%. Figure 8e shows that within the respective factor levels, the compressive strength decreases with increasing water-to-binder ratio and significantly increases with higher slag content. Figure 8f indicates that the contour lines are more densely packed along the vertical axis than along the horizontal axis, suggesting that slag content has a more substantial effect on the compressive strength of AACGS compared to the water-to-binder ratio.
Integrating the above analysis with the ANOVA results shown in Table 9, the relative influence of water-to-binder ratio, alkali equivalent, and slag content on the compressive strength of AACGS is ranked as follows: slag content (p < 0.0001) > alkali equivalent (p < 0.0001) > water-to-binder ratio (p = 0.1359). This ranking clearly demonstrates that slag content and alkali equivalent exert highly significant effects on compressive strength, with slag content being the most influential. This is attributed to the fact that, under alkaline conditions, the glassy phase of slag releases large amounts of Ca2+ ions, which coordinate with [AlO4]5− and [SiO4]4− units within the pores to form abundant C-S-H and C-A-S-H gels. Subsequently, driven by the high charge density of Ca2+, these gels rapidly precipitate and develop into a three-dimensional disordered network structure, thereby markedly enhancing the strength of AACGS [51].

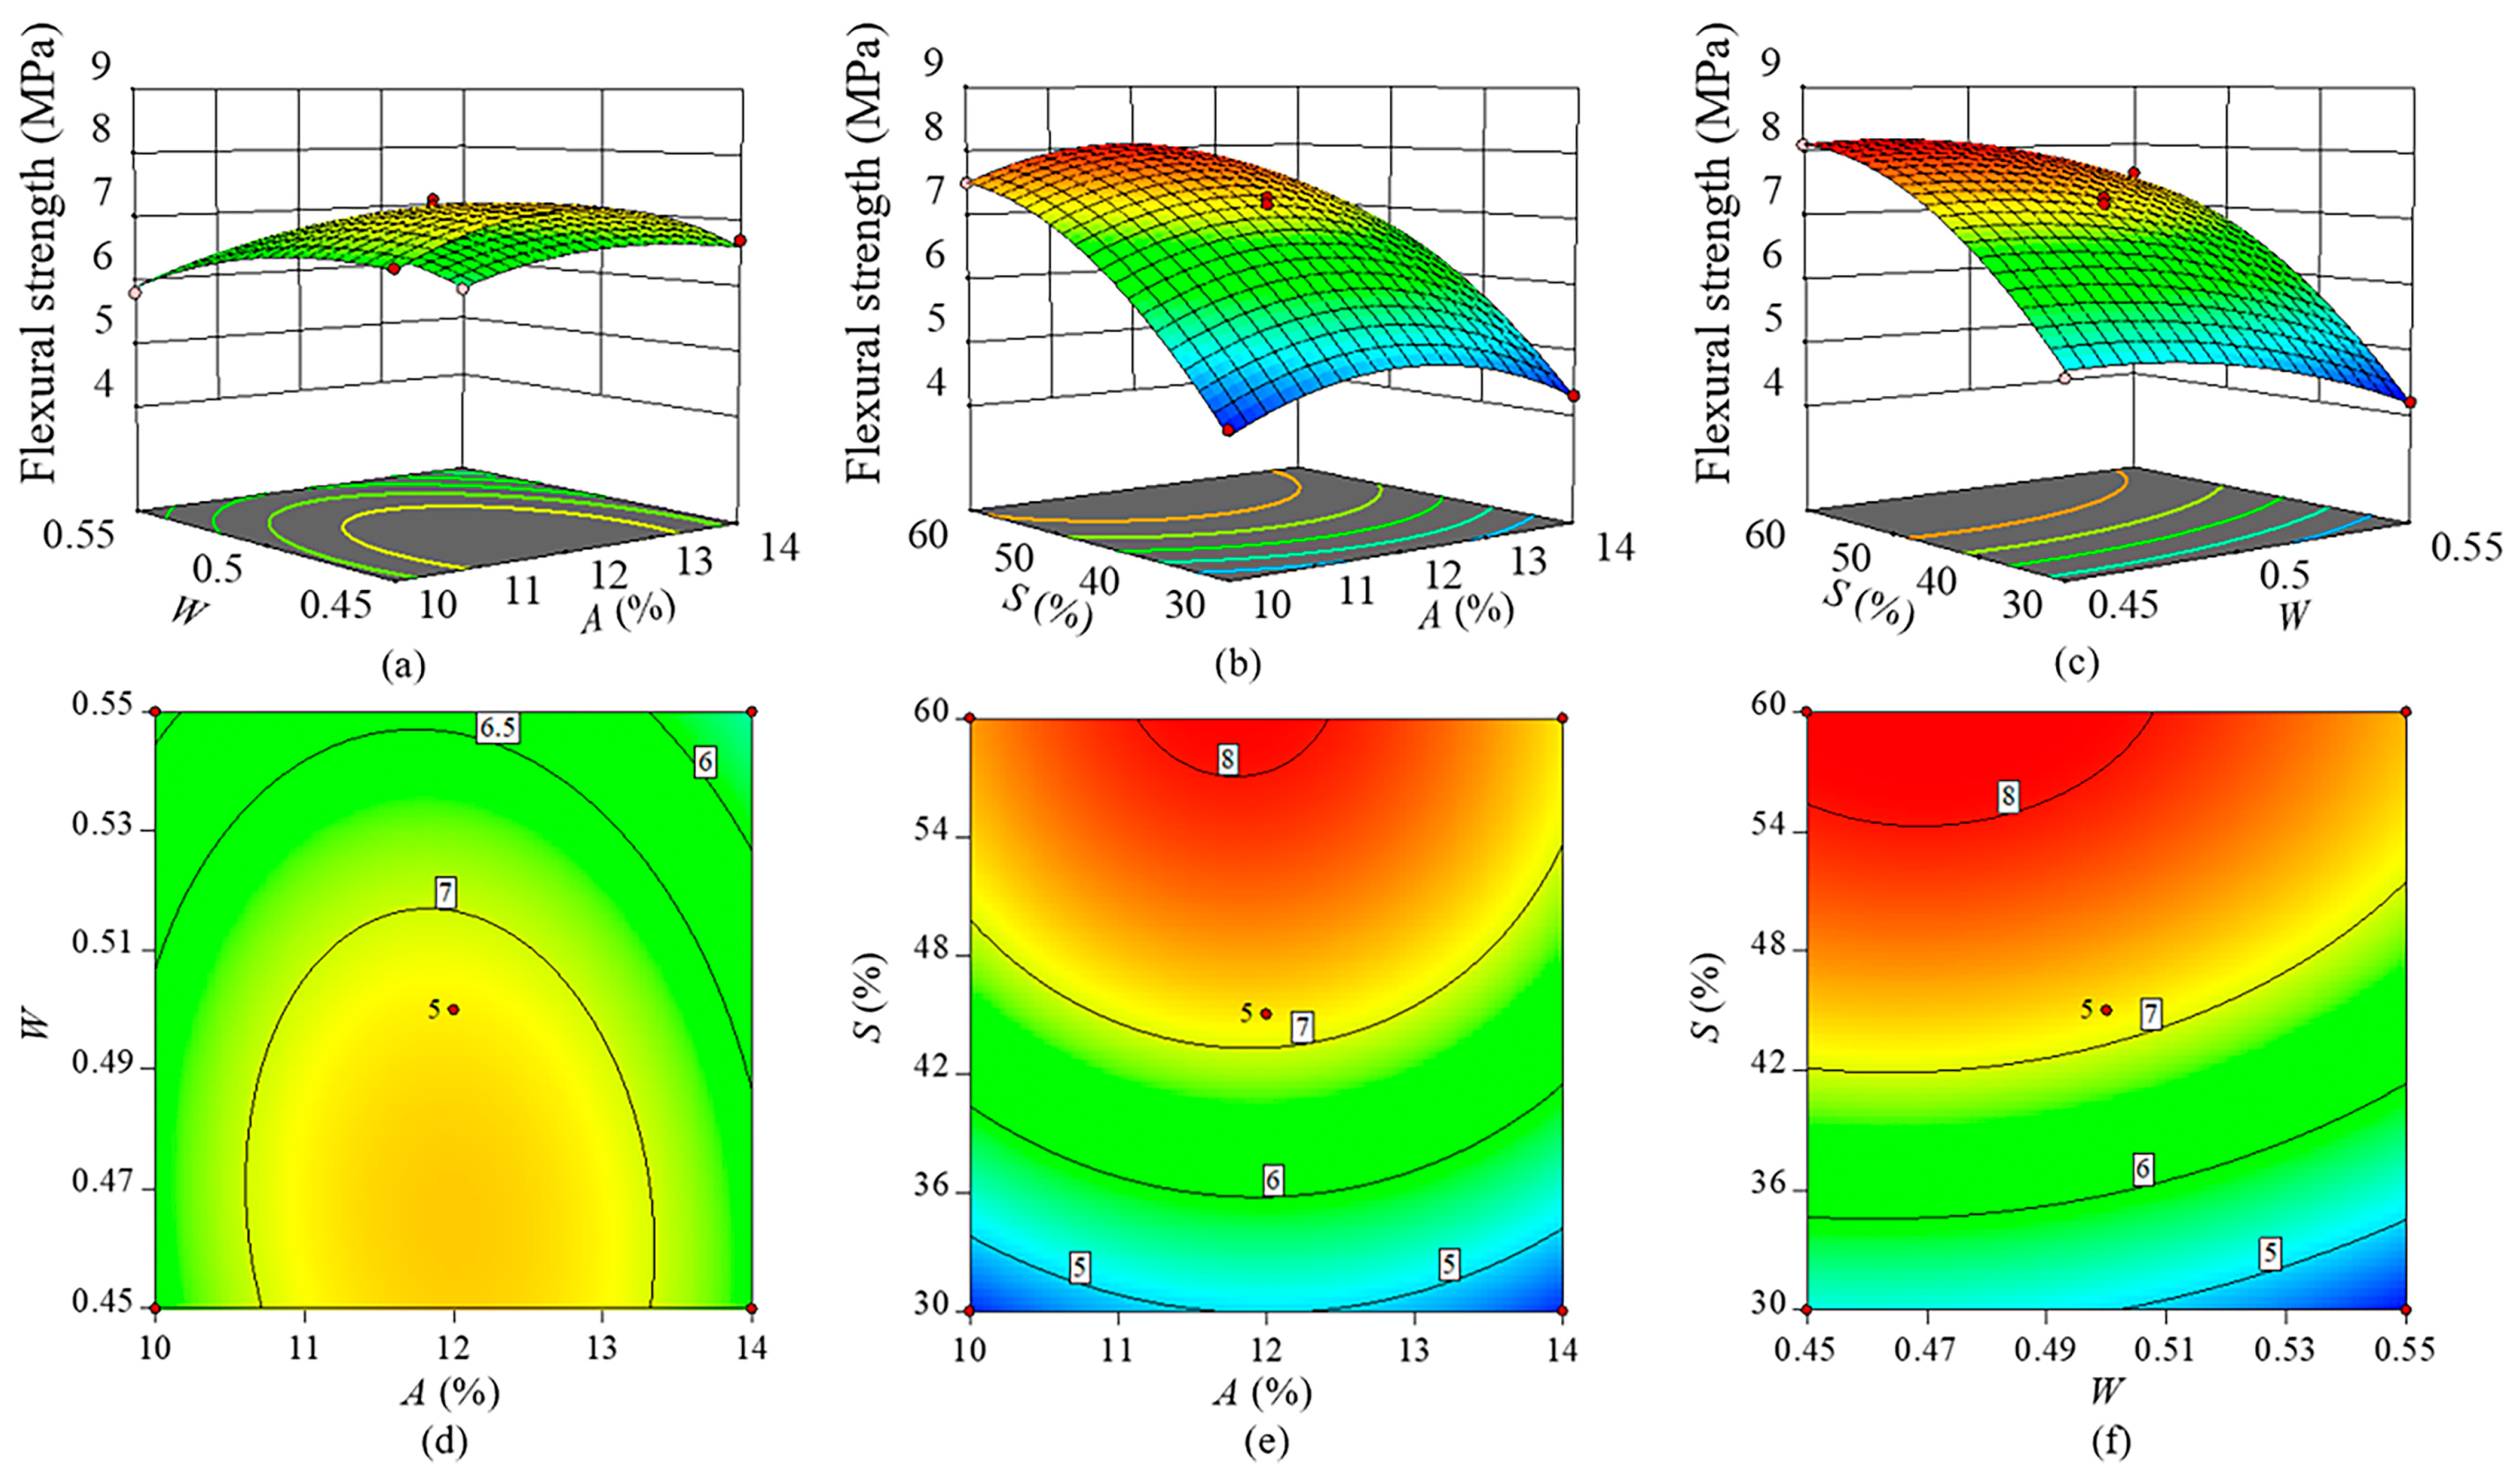
3.2.2. Flexural Strength
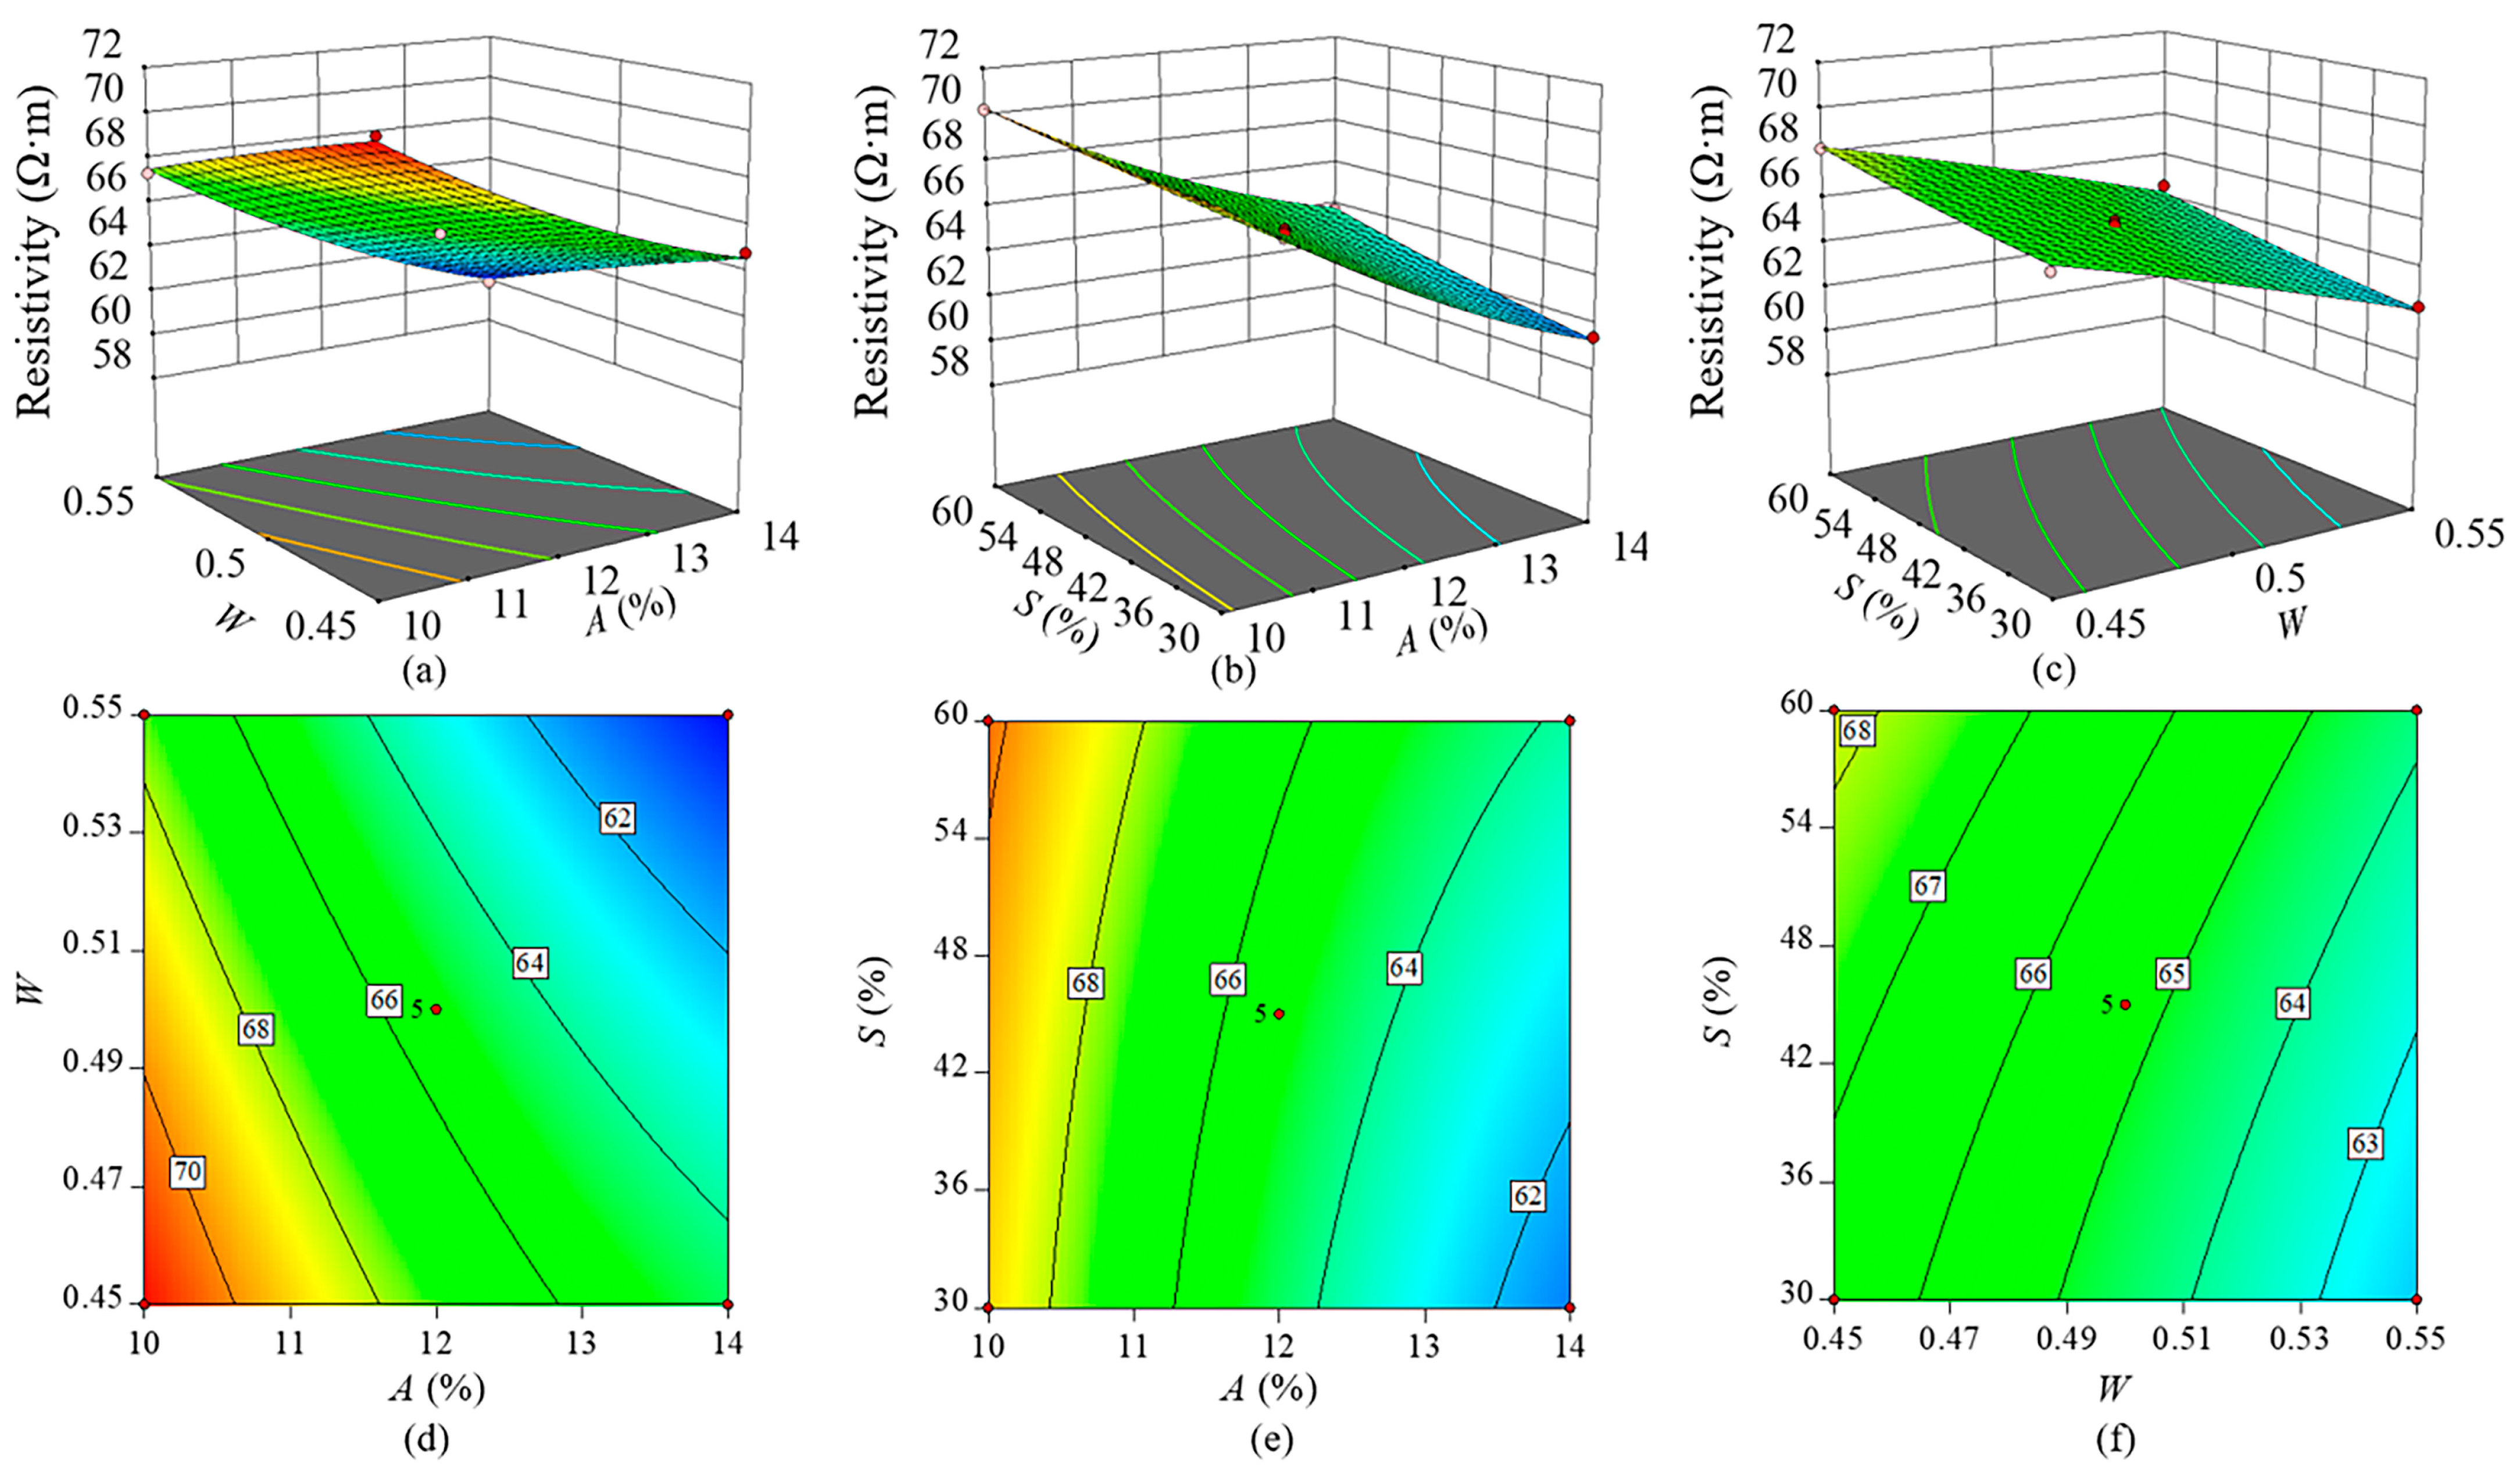
Figure 9a,d depicts the interaction effects of water-to-binder ratio and alkali equivalent on AACGS flexural strength when slag content is fixed at 45.0%. The analysis shows that, within each factor level, flexural strength initially increases and then decreases with increases in both water-to-binder ratio and alkali equivalent. The optimal synergistic effect and maximum flexural strength occur when the water-to-binder ratio is between 0.45 and 0.49, and the alkali equivalent is between 11.0% and 13.0%.
Figure 9b,e depicts the interaction effects of alkali equivalent and slag content on AACGS flexural strength when the water-to-binder ratio is fixed at 0.50. Figure 9b indicates that flexural strength first increases and then decreases with higher alkali equivalent while increasing significantly with higher slag content. Maintaining alkali equivalent within 11.0% to 13.0%, along with slag content above 54%, can achieve higher flexural strength. Figure 9e shows that the contour density along the vertical axis exceeds that along the horizontal axis, implying that slag content has a more substantial impact on flexural strength than alkali equivalent. Similarly, analysis of Figure 9f reveals that slag content’s influence on flexural strength is also greater than that of water-to-binder ratio. Based on the above analysis and the ANOVA results shown in Table 9, the statistical significance order of the factors affecting the flexural strength of AACGS is as follows: slag content (p < 0.0001) > alkali equivalent (p < 0.0001) > water-to-binder ratio (p = 0.0660). This ranking indicates that slag content and alkali equivalent have highly significant effects on the flexural strength of the material.

3.2.3. Resistivity

Figure 10a,d depicts the interaction effects of water-to-binder ratio and alkali equivalent on AACGS resistivity when slag content is fixed at 45.0%. Figure 10a indicates that, within each factor level, resistivity decreases with increases in both water-to-binder ratio and alkali equivalent. Figure 10d reveals that the contour density along the vertical axis is less than that along the horizontal, indicating that alkali equivalent has a more significant impact on resistivity than water-to-binder ratio.
Figure 10b,e depicts the interaction effects of alkali equivalent and slag content on AACGS resistivity when the water-to-binder ratio is fixed at 0.50. Figure 10b shows that resistivity increases with higher slag content and decreases with higher alkali equivalent within each factor level. Similarly, Figure 10e indicates that alkali equivalent has a more significant impact on resistivity than slag content.
Figure 10c,f depicts the interaction effects of water-to-binder ratio and slag content on AACGS resistivity when alkali equivalent is fixed at 12.0%. Figure 10c shows that resistivity increases with higher slag content and decreases with increased water-to-binder ratio. From Figure 10f, it is clear that the water-to-binder ratio exerts a more significant impact on resistivity than slag content. Based on the above analysis and the ANOVA results shown in Table 9, the statistical significance order of the factors affecting the resistivity of AACGS is as follows: alkali equivalent (p < 0.0001) > water-to-binder ratio (p < 0.0001) > slag content (p = 0.2814). Water is a good conductor, as dissolved ions such as calcium and hydrogen ions in water reduce the resistivity of mortar [52]. Similarly, when alkali activators undergo hydration reactions (Equation (6)), they generate ions like Na+ and OH, increasing the number of conductive ions in AACGS [22]. Therefore, both water-to-binder ratio and alkali equivalent have highly significant effects on the resistivity of AACGS.
2Na2O·nSiO2 + 2(n − 1) H2O4Na+ + 4OH + nSi(OH)4

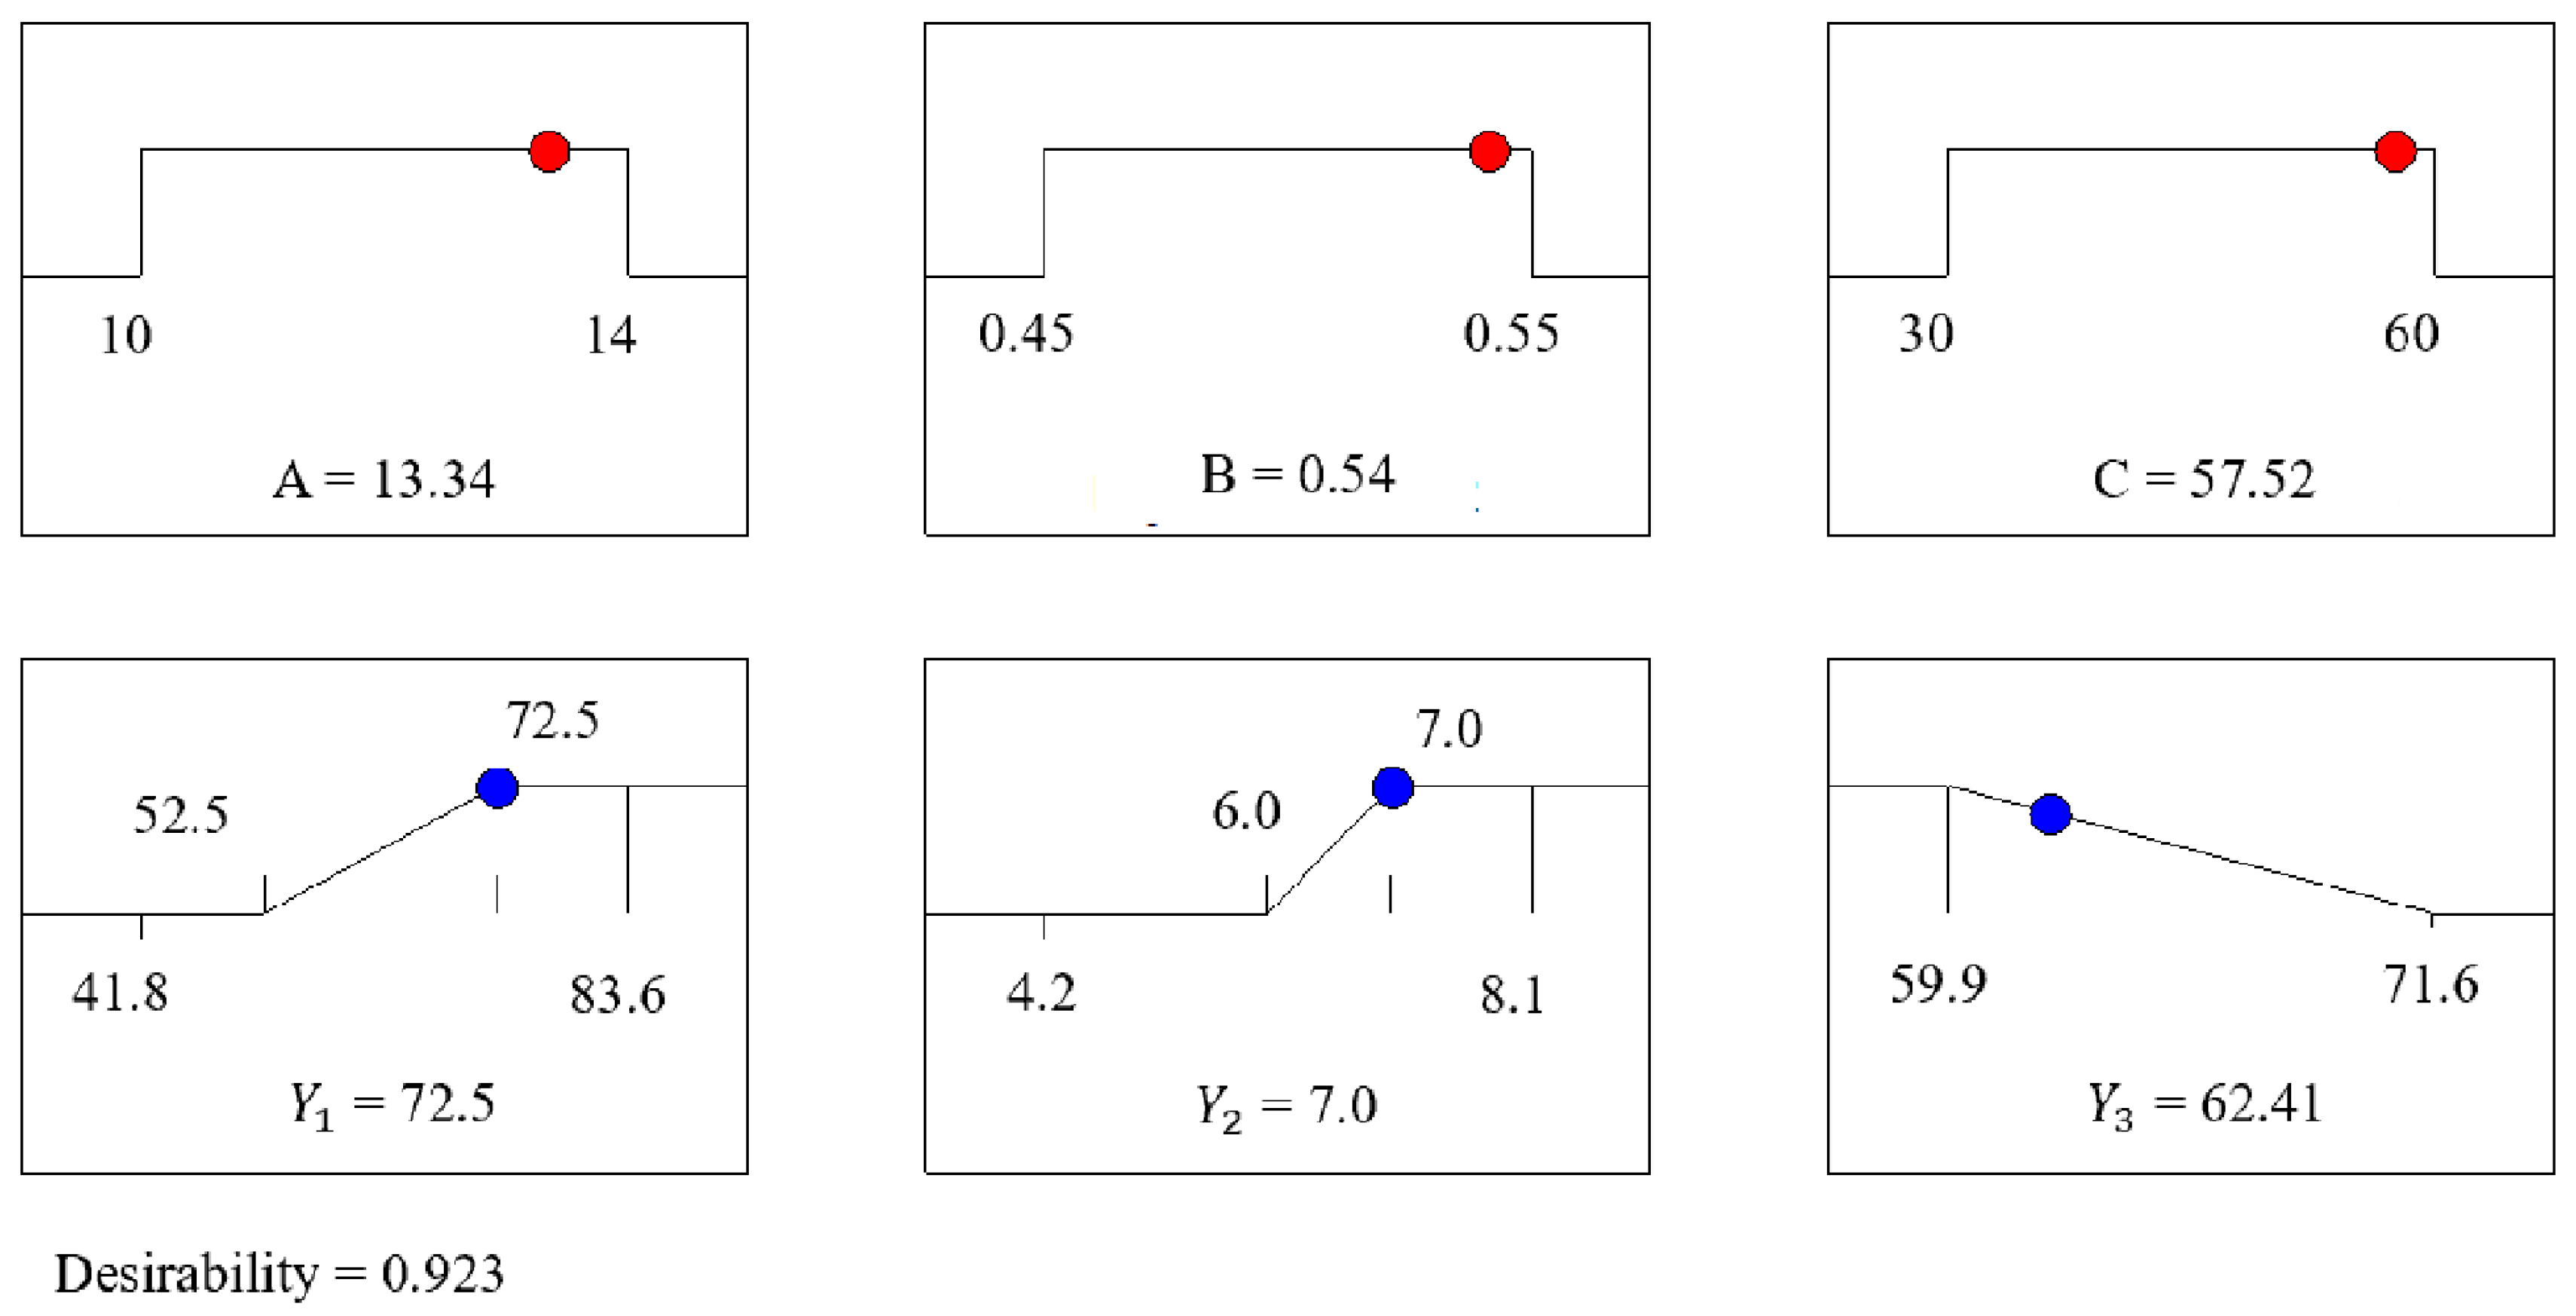
3.3. Response Surface Optimization Results and Validation

AACGS must meet multiple performance requirements (such as mechanical strength and electrical conductivity), making it challenging to find optimal solutions that satisfy all these criteria simultaneously. Therefore, this study adopts a multi-objective optimization approach to balance various performances. Specifically, all performances are considered equally important, and the comprehensive desirability index (D) is used to evaluate the overall performance of AACGS. As previously described, the independent factors—water-to-binder ratio (W), alkali equivalent (A), and slag content (S)—are selected based on the ranges listed in Table 4. Considering practical engineering needs and the response surface results, the target ranges for compressive strength (Y1), flexural strength (Y2), and resistivity (Y3) are set to 52.5–72.5 MPa, 6.0–7.0 MPa, and 59.9–71.6 Ω·m, respectively. Using RSM-based multi-objective optimization, a set of optimal solutions close to these target ranges was obtained, as shown in Figure 11. The D is an important indicator for assessing the reasonableness of the optimization results, and it was found to be 0.923, indicating good validity [53]. Further experimental validation was conducted on these results, and the experimental values are listed in Table 11. The deviation between predicted and experimental values is all within 5%, demonstrating good agreement. This confirms that RSM is an effective method for balancing the performance of AACGS. When the alkali equivalent, water-to-binder ratio, and slag content are set at 13.34%, 0.54, and 57.52%, respectively, the AACGS exhibits excellent overall performance, achieving compressive strength, flexural strength, and resistivity of 72.5 MPa, 7.0 MPa, and 62.41 Ω·m. These performances significantly surpass those of most current cementitious materials, highlighting the superior mechanical and electrical properties of AACGS [54,55,56].

3.4. Performance Analysis of CF-AACGS

To further explore the feasibility of using AACGS as the substrate material for conductive mortar, a composite was prepared based on the optimized formulation. It incorporated the widely adopted carbon fiber (CF) as the conductive phase [57,58,59], resulting in the alkali-activated conductive mortar (CF-AACGS). Its performance was compared with that of cement conductive mortar (CF-cement). Considering the dispersibility of CF, its content was limited to within 0.6 vol%, with gradients at 0.15 vol%. Additionally, to establish a universally applicable and comparable reference benchmark, the cement mix proportions were strictly formulated in accordance with the provisions of the Chinese Standard GB/T 17671-2021. The proportions of CF-AACGS and CF-cement are shown in Table 12.
Figure 12 shows the variations in compressive strength, flexural strength, and resistivity of CF-AACGS and CF-cement as CF content increases. Analysis of Figure 12a reveals that the compressive strength of CF-AACGS and CF-cement first increases and then decreases with increasing CF content, reaching a peak at 0.45 vol%. The peak compressive strength of CF-AACGS (80.1 MPa) is 28.4% higher than that of CF-cement (62.4 MPa). Additionally, at the same CF content, the compressive strengths of CF-AACGS are higher than those of CF-cement.
Analysis of Figure 12b shows that the flexural strength of CF-AACGS and CF-cement first increases and then decreases with increasing CF content, reaching peaks at 0.45 vol%. The maximum flexural strengths are 10.7 MPa and 9.4 MPa, respectively, representing increases of 48.6% and 19.0% compared to CA0 and CC0. This indicates that CF has a more significant improving effect on the flexural strength of AACGS. This is primarily attributed to the AACGS system significantly enhancing its bonding interface with CF, thereby enabling a more effective exertion of CF’s toughening effect [60,61].
Fitting the experimental data reveals that the resistivity of CF-AACGS and CF-cement relates to CF content through the ExpDec1 and Gauss functions (Figure 12c). The analysis shows that, as CF content increases, resistivity decreases continuously. When CF content reaches 0.3 vol%, the resistivity drops sharply, indicating the percolation threshold of CF-AACGS. At this stage, the resistivity of CF-AACGS is only 3.1 Ω·m, already meeting the requirements for de-icing and snow removal in road applications [62]. In contrast, the CF-cement within the experimental range does not reach this threshold, suggesting that more CF is required in CF-cement to meet conductivity needs. Moreover, at the same CF content, the resistivity of CF-AACGS is typically about one order of magnitude lower than that of CF-cement. This demonstrates that AACGS is more conducive to producing high-performance conductive mortar with excellent electrical properties.

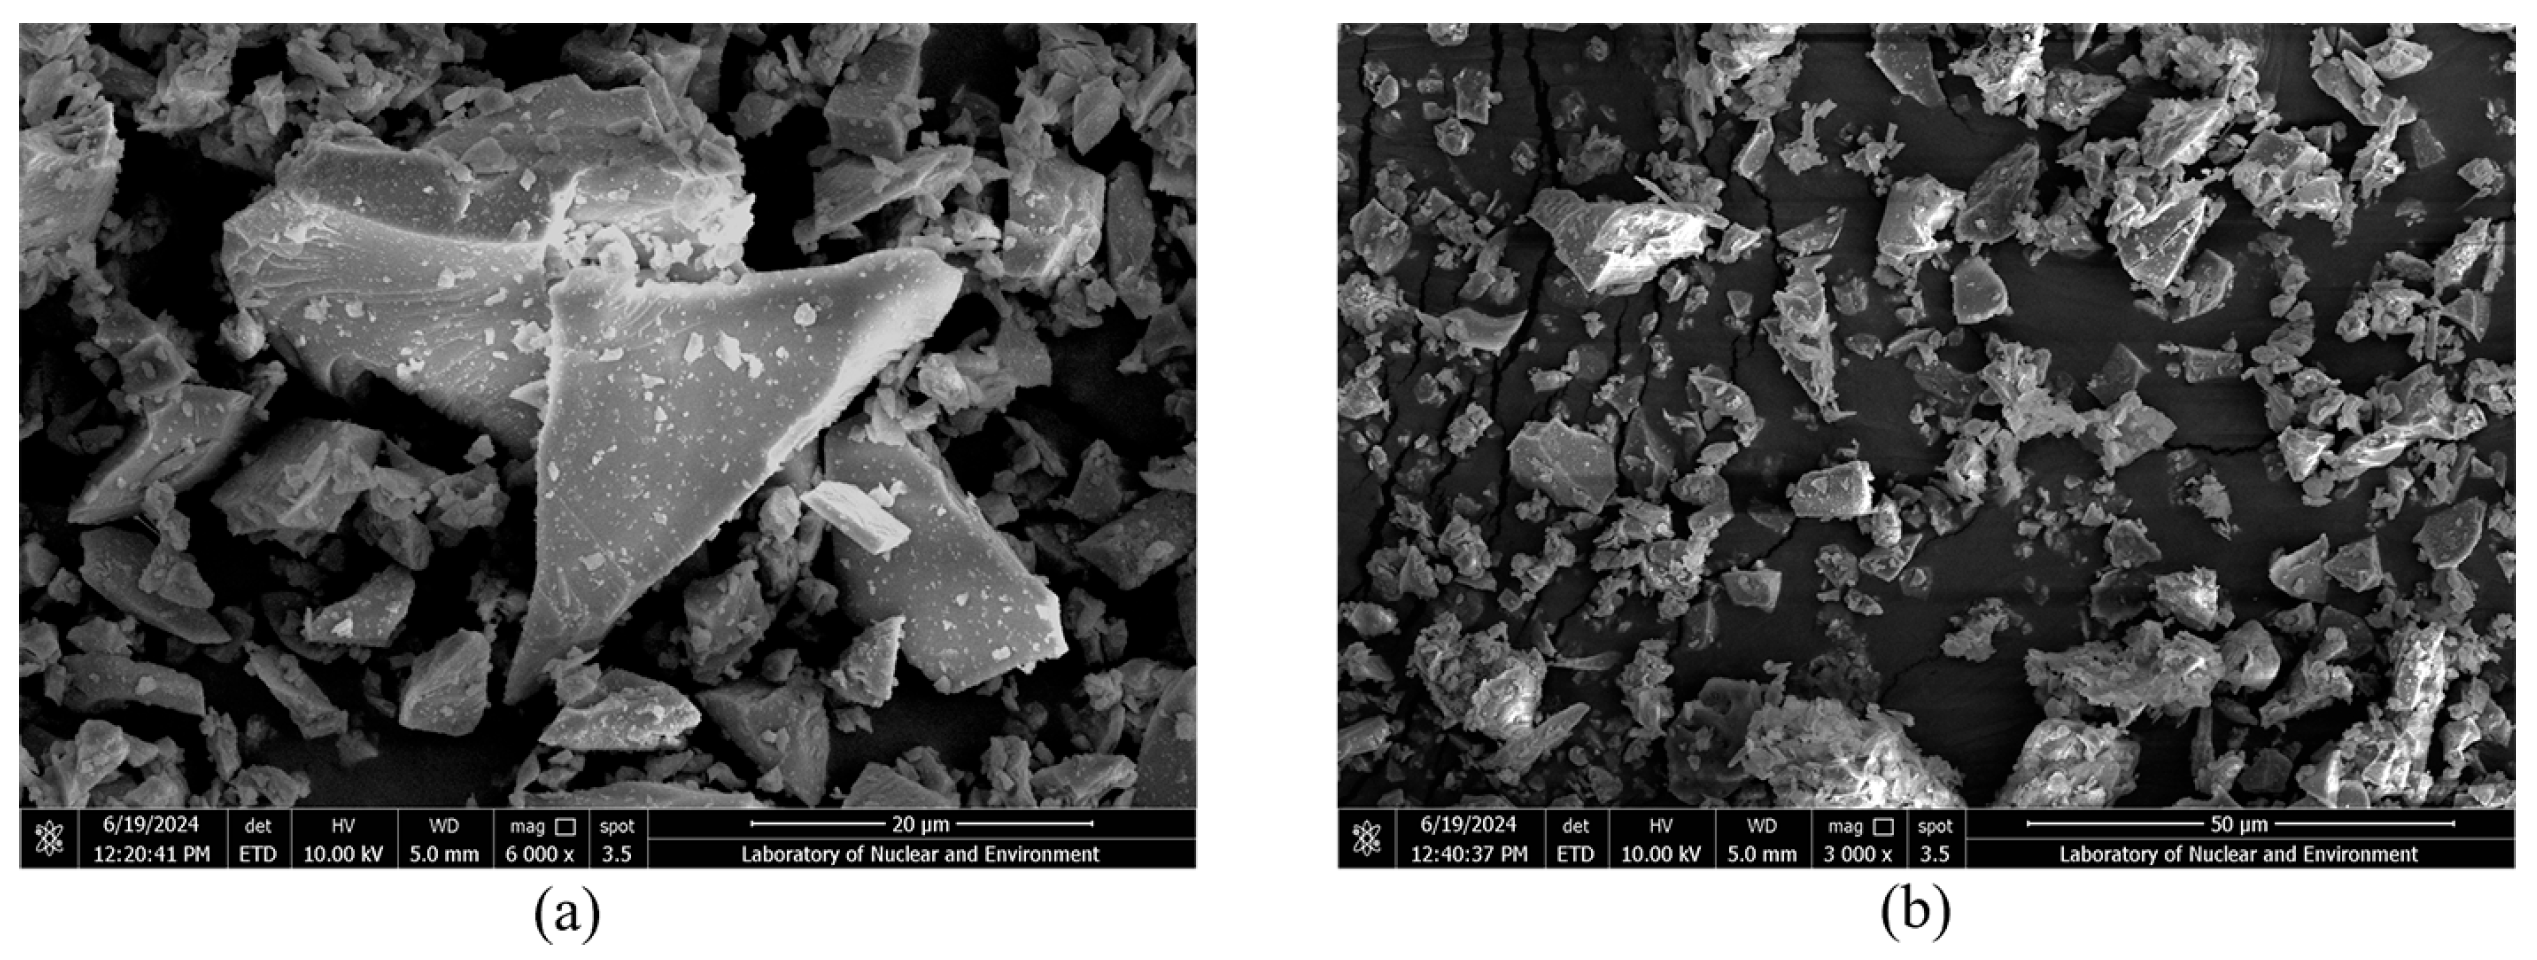
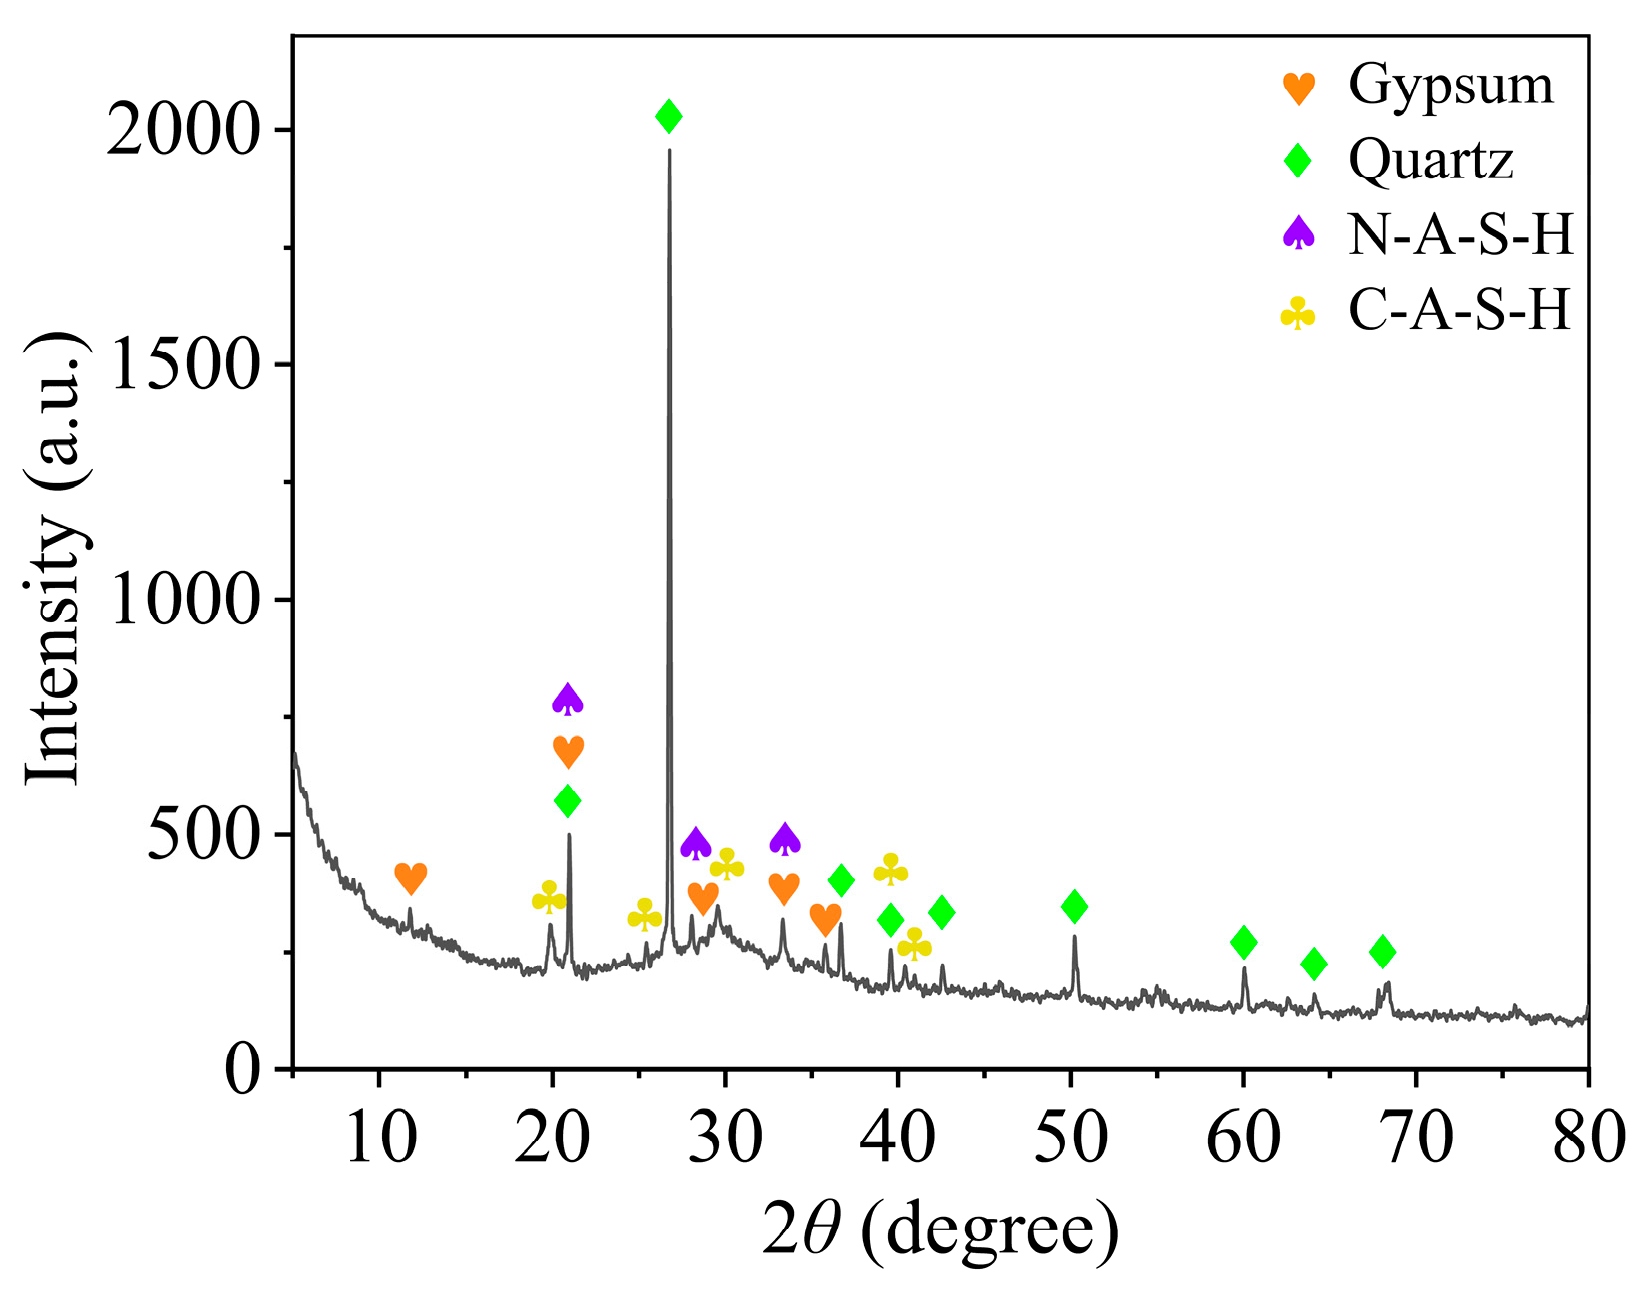
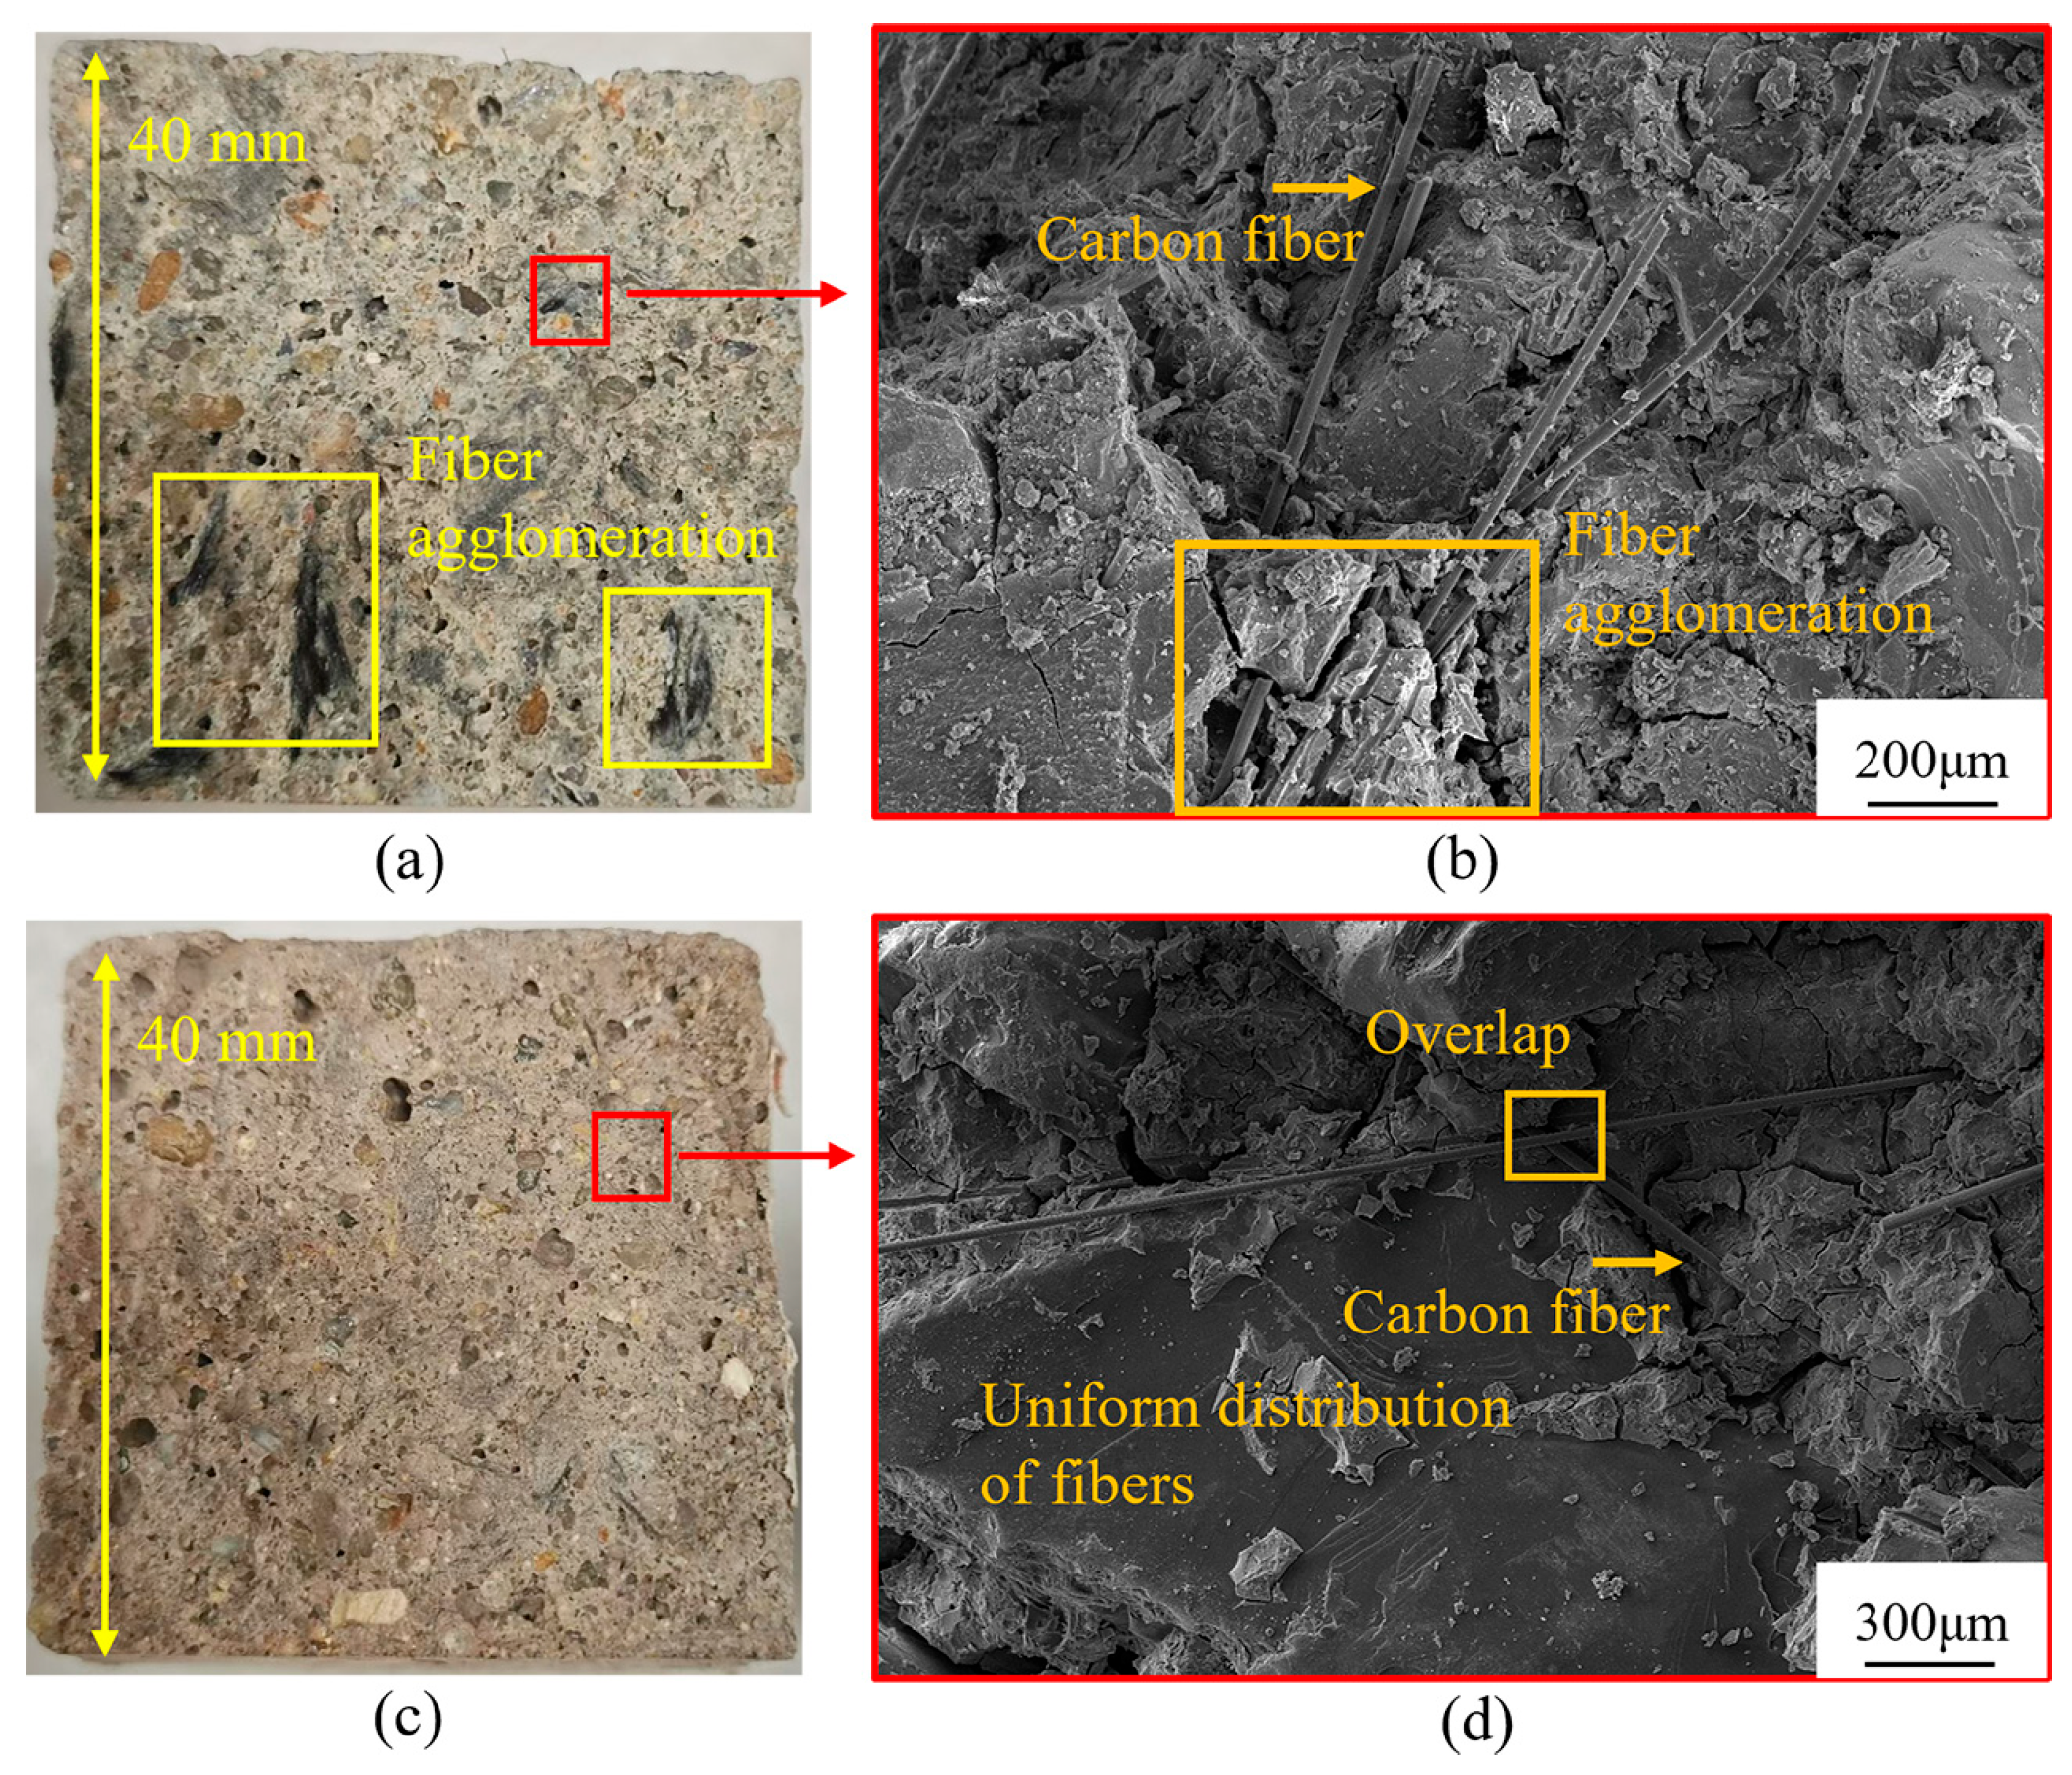
3.5. XRD and SEM-EDS Analysis

To elucidate the origin of the mechanical strength of the conductive mortar, the AACGS was characterized in terms of mineral composition and microstructure using XRD and SEM-EDS techniques [63]. Figure 13 shows the XRD pattern of AACGS under the optimal mix. The dilution effect [64] causes the XRD pattern of AACGS to resemble that of CG (Figure 3a). However, analysis reveals that the diffraction peak intensity of quartz in AACGS is significantly lower than in CG, indicating that quartz in CG participates in the hydration reaction. Additionally, the XRD pattern of AACGS shows that, besides the mineral composition from raw materials, characteristic peaks of amorphous N, C-(A)-S-H gel appear between ~25°–35°. These gels are the primary hydration products formed from calcium-rich raw materials reacting with sodium alkali activators and are key to the development of the mechanical strength of alkali-activated materials [65], using SEM-EDS to further evaluate the microscopic morphology and chemical composition of AACGS, as shown in Figure 14. In Figure 14a, two types of structures are observed: flocculent and block-like. Elemental analysis (Figure 14b) indicates that the selected area mainly contains O, Na, Al, Si, and Ca, which is highly consistent with the gel composition revealed by the XRD pattern, confirming the formation of N, C-(A)-S-H gel. Element mapping (Figure 14c–h) shows that these elements are primarily concentrated in the flocculent structures and are uniformly distributed. Thus, it is inferred that these structures are the microscopic manifestation of hydration products.
Furthermore, the strong interfacial bonding between the substrate material and the conductive phase is critical for imparting excellent mechanical properties to the conductive mortar [66]. Figure 15 illustrates the bonding between CF and the AACGS matrix. Observations show that the CF is tightly encapsulated by the gel (Figure 15a), and many gel products also fill the interfacial transition zone (ITZ) between the CF and the matrix (Figure 15b), creating a dense structure. The alkali solution in AACGS has an etching effect on the CF surface, increasing and deepening the grooves (Figure 15c,d), which enhances the mechanical interlock between the CF and the matrix. Consequently, this dual influence results in a strong interfacial bond, which is more beneficial for CF to dissipate external loads through pull-out or breakage mechanisms (Figure 15e,f) during mortar loading.
Comparing the distribution characteristics of CF in cement matrices and AACGS matrices in Figure 16 reveals that, at the same CF content, CF in cement matrices tends to form noticeable bundles (Figure 16a,b), whereas in AACGS matrices, CF exhibits better individual fiber dispersion (Figure 16c,d). The higher pH value of AACGS promotes improved hydrophilicity on the fiber surface, reducing van der Waals forces, thereby enabling more uniform three-dimensional dispersion of CF within the AACGS matrix [67,68]. This microscopic distribution analysis aligns with the resistivity test results of CF-AACGS and CF-cement composites: the enhanced fiber dispersion within AACGS increases the density of conductive contacts, resulting in the macroscopic behavior where the resistivity of CF-AACGS is significantly lower than that of CF-cement. This demonstrates the great potential of AACGS in optimizing the electrical performance of conductive mortars.

4. Conclusions

This study employed response surface methodology to establish statistical models connecting alkali equivalent, water-to-binder ratio, and slag content with the compressive strength, flexural strength, and resistivity of alkali-activated coal gangue-slag materials (AACGS), enabling the determination of optimal mix proportions. Subsequently, this optimal ratio was used to prepare an alkali-activated conductive mortar (CF-AACGS). The results demonstrated that, at the same carbon fiber content, CF-AACGS exhibited significantly higher 28-day mechanical strengths compared to cement conductive mortar (CF-Cement), with the resistivity reduced by one order of magnitude. However, further in-depth research is necessary in future studies to expand the parameter range, investigate the effects of fiber synergism, and assess the practical applications of the conductive mortar.
  • Using response surface methodology to develop statistical models correlating the alkali equivalent, water-to-binder ratio, and slag content with the compressive strength, flexural strength, and resistivity of alkali-activated materials. Statistical tests such as variance analysis and coefficient of variation indicated that the model possesses high reliability.
  • Based on RSM multi-objective optimization, the optimal performance of alkali-activated materials was achieved when the alkali equivalent, water-to-cement ratio, and slag content were 13.34%, 0.54, and 57.52%, respectively. Under these conditions, the alkali-activated materials achieve compressive strength, flexural strength, and resistivity of 72.5 MPa, 7.0 MPa, and 62.41 Ω·m at 28 days.
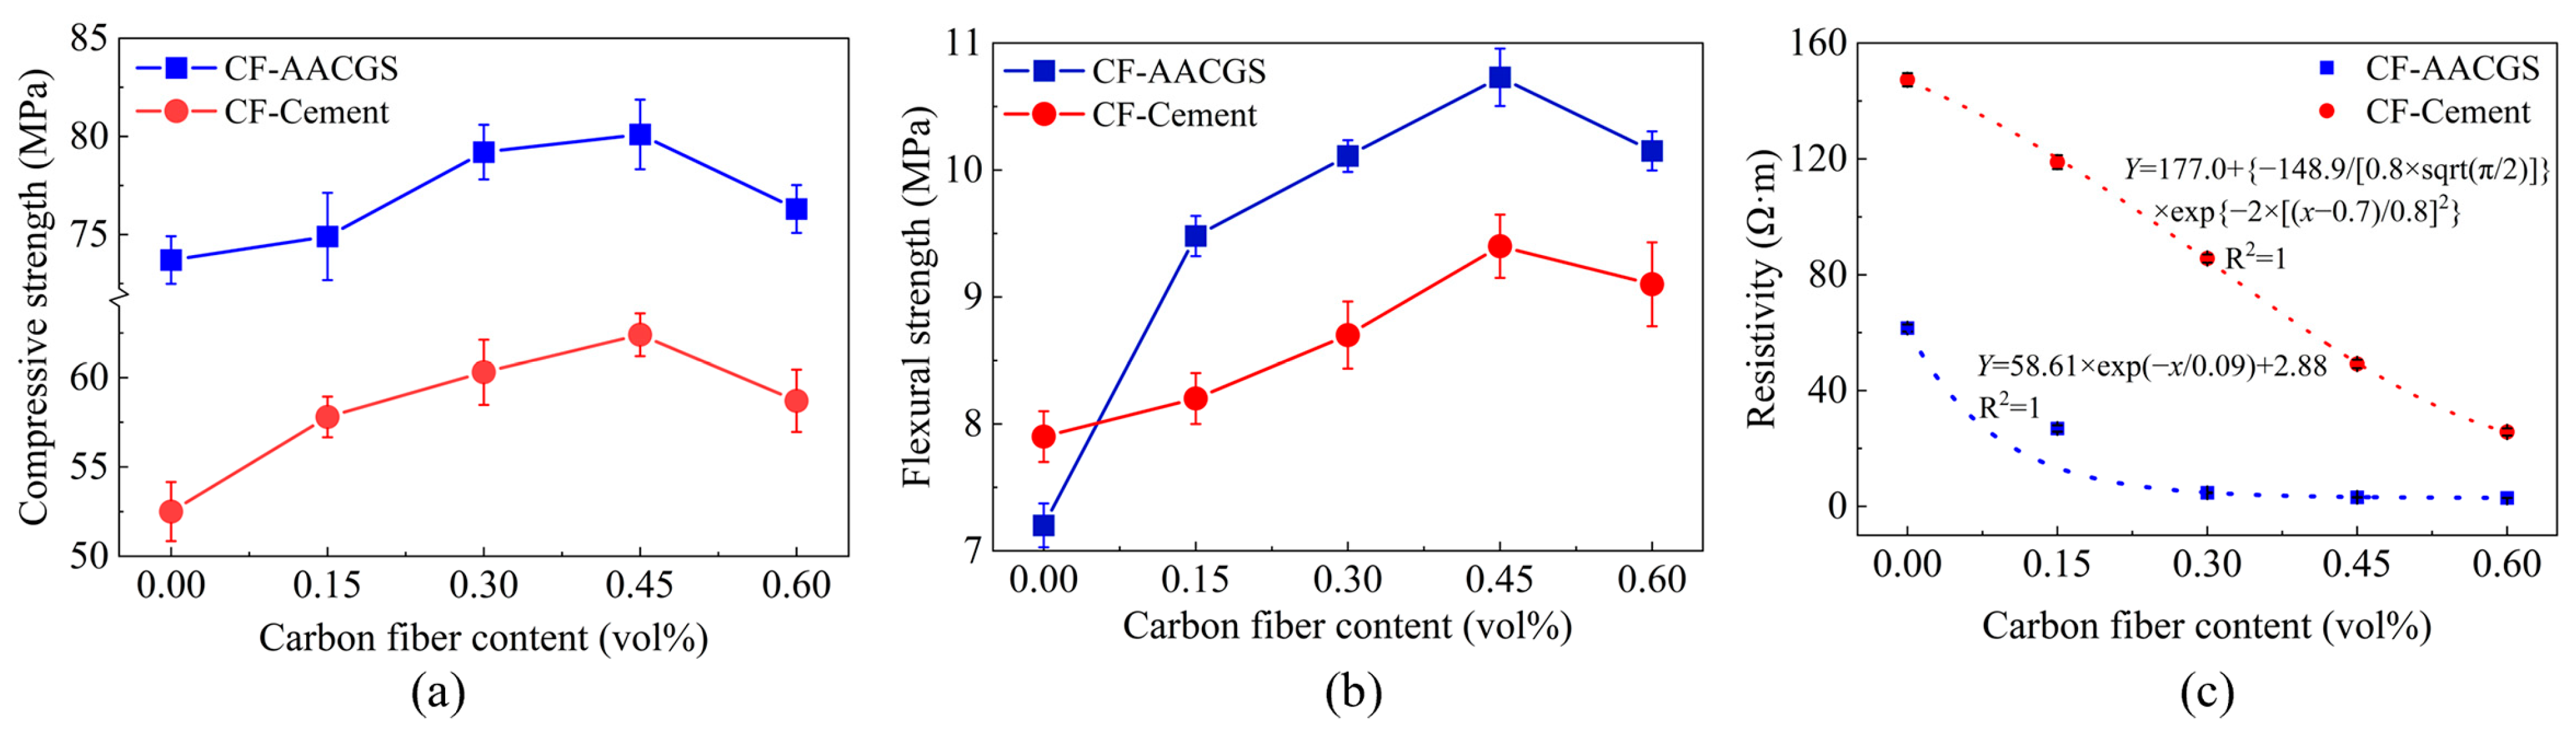
  • When the same amount of carbon fiber is added, the 28-day compressive and flexural strengths of alkali-activated conductive mortar are significantly higher than those of cement conductive mortar. This improvement is attributed to the reaction of coal gangue and slag with the alkali activator, which produces a denser N, C-(A)-S-H gel structure, thereby enhancing the interface transition zone between carbon fiber and alkali-activated materials.
  • By optimizing fiber dispersion, the alkali-activated materials increase the density of conductive contact points. Therefore, when the carbon fiber content reaches 0.3 vol%, alkali-activated conductive mortar can meet the performance requirements for de-icing and snow removal. Furthermore, at the same carbon fiber content, its resistivity is typically an order of magnitude lower than that of cement conductive mortar.

Author Contributions

Conceptualization and writing—original draft preparation, W.L.; project administration, W.Z. and T.X.; supervision, M.S.; methodology, W.L. and T.X. All authors have read and agreed to the published version of the manuscript.

Funding

Some components of this research were supported by the National Natural Science Foundation of China (Grant No. 52264003). Additionally, select aspects of this work received funding from the Jiangxi Province “Double Thousand Plan” supported project (Grant No. DHSQT22021002).

Data Availability Statement

Data are contained within the article.

Conflicts of Interest

The authors declare no conflict of interest.

References

  1. Wang, P.; Dong, B.; Wang, Y.; Hong, S.; Fang, G.; Zhang, Y. Electrical conductive mortar based on expanded graphite for auxiliary anode. Case Stud. Constr. Mater. 2024, 20, e03268. [Google Scholar] [CrossRef]
  2. Downey, A.; D’Alessandro, A.; Baquera, M.; García-Macías, E.; Rolfes, D.; Ubertini, F.; Laflamme, S.; Castro-Triguero, R. Damage detection, localization and quantification in conductive smart concrete structures using a resistor mesh model. Eng. Struct. 2017, 148, 924–935. [Google Scholar] [CrossRef]
  3. Gürer, C.; Fidan, U.; Korkmaz, B.E. Investigation of using conductive asphalt concrete with carbon fiber additives in intelligent anti-icing systems. Int. J. Pavement Eng. 2023, 24, 2077941. [Google Scholar] [CrossRef]
  4. Wanasinghe, D.; Aslani, F.; Ma, G. Effect of water to cement ratio, fly ash, and slag on the electromagnetic shielding effectiveness of mortar. Constr. Build. Mater. 2020, 256, 119409. [Google Scholar] [CrossRef]
  5. Hemalatha, T.; Sangoju, B.; Muthuramalingam, G. A study on copper slag as fine aggregate in improving the electrical conductivity of cement mortar. Sādhanā 2022, 47, 141. [Google Scholar] [CrossRef]
  6. Li, L.G.; Chen, S.-Y.; Ma, J.; Ng, P.-L. Synergistic effects of single-walled carbon nanotube and carbon fiber on performance of conductive mortar. J. Build. Eng. 2024, 92, 109784. [Google Scholar] [CrossRef]
  7. Donnini, J.; Bellezze, T.; Corinaldesi, V. Mechanical, electrical and self-sensing properties of cementitious mortars containing short carbon fibers. J. Build. Eng. 2018, 20, 8–14. [Google Scholar] [CrossRef]
  8. Wang, S.; Wang, X.; He, J.; Xin, M. Mechanical behavior and microstructure of graphene oxide electrodeposited carbon fiber reinforced cement-based materials. Crystals 2022, 12, 964. [Google Scholar] [CrossRef]
  9. Li, H.; Liebscher, M.; Yang, J.; Zhang, Y.; Mechtcherine, V. Influence of electrophoretic deposition of micro- or nanosized silica particles on the microstructure of carbon fibers and their bond behavior with cementitious matrices. Mater. Struct. 2024, 57, 107. [Google Scholar] [CrossRef]
  10. Li, H.; Schamel, E.; Liebscher, M.; Zhang, Y.; Fan, Q.; Schlachter, H.; Köberle, T.; Mechtcherine, V.; Wehnert, G.; Söthje, D. Recycled carbon fibers in cement-based composites: Influence of epoxide matrix depolymerization degree on interfacial interactions. J. Clean. Prod. 2023, 411, 137235. [Google Scholar] [CrossRef]
  11. Hussain, S.; Matthews, J.; Amritphale, S.; Edwards, R.; Matthews, E.; Paul, N.; Kraft, J. Influence of Steel and Poly Vinyl Alcohol Fibers on the Development of High-Strength Geopolymer Concrete. Minerals 2024, 14, 1007. [Google Scholar] [CrossRef]
  12. Jindal, B.B. Investigations on the properties of geopolymer mortar and concrete with mineral admixtures: A review. Constr. Build. Mater. 2019, 227, 116644. [Google Scholar] [CrossRef]
  13. Dathe, F.; Overmann, S.; Koenig, A.; Dehn, F. The Role of Water Content and Binder to Aggregate Ratio on the Performance of Metakaolin-Based Geopolymer Mortars. Minerals 2024, 14, 823. [Google Scholar] [CrossRef]
  14. Shi, C.; Xie, P. Interface between cement paste and quartz sand in alkali-activated slag mortars. Cem. Concr. Res. 1998, 28, 887–896. [Google Scholar] [CrossRef]
  15. Luo, T.; Wang, Q.; Fang, Z. Effect of graphite on the self-sensing properties of cement and alkali-activated fly ash/slag based composite cementitious materials. J. Build. Eng. 2023, 77, 107493. [Google Scholar] [CrossRef]
  16. Wang, L.; Aslani, F. Electrical resistivity and piezoresistivity of cement mortar containing ground granulated blast furnace slag. Constr. Build. Mater. 2020, 263, 120243. [Google Scholar] [CrossRef]
  17. Zhong, M.; Meng, J.; Ning, B.; Na, F.; Cui, T.; Shi, X.; Cui, T. Preparation and alkali excitation mechanism of coal gangue-iron ore tailings non-sintering ceramsite. Constr. Build. Mater. 2024, 426, 136209. [Google Scholar] [CrossRef]
  18. Wang, M.; Xu, J.; Zhang, X.; Tan, L.; Mei, Y. Mechanical Performance Optimization and Microstructural Mechanism Study of Alkali-Activated Steel Slag–Slag Cementitious Materials. Buildings 2024, 14, 1204. [Google Scholar] [CrossRef]
  19. Lou, Y.; Huang, M.; Kang, S.; Hu, M.; Wu, W.; Chen, S. Study on basic performance and drying shrinkage of binary solid waste geopolymer prepared with recycled powders and slag. Case Stud. Constr. Mater. 2024, 20, e03195. [Google Scholar] [CrossRef]
  20. Li, Z.; Du, P.; Zhou, Y.; Wang, J.; Cheng, X. Synchronous Hot-pressed Metakaolin-fly ash Based Geopolymer: Compressive strength and hydration products. J. Build. Eng. 2024, 97, 110997. [Google Scholar] [CrossRef]
  21. Yan, G.-M.; Yan, X.; Yan, H.-X.; Wang, H. Optimization and performance study of graphene oxide reinforced geopolymer. J. Build. Eng. 2025, 104, 112269. [Google Scholar] [CrossRef]
  22. Hanjitsuwan, S.; Hunpratub, S.; Thongbai, P.; Maensiri, S.; Sata, V.; Chindaprasirt, P. Effects of NaOH concentrations on physical and electrical properties of high calcium fly ash geopolymer paste. Cem. Concr. Compos. 2014, 45, 9–14. [Google Scholar] [CrossRef]
  23. Xie, J.; Wang, J.; Zhang, B.; Fang, C.; Li, L. Physicochemical properties of alkali activated GGBS and fly ash geopolymeric recycled concrete. Constr. Build. Mater. 2019, 204, 384–398. [Google Scholar] [CrossRef]
  24. Sun, Z.; Li, Y.; Su, L.; Niu, D.; Luo, D.; He, W.; Xie, S. Investigation of electrical resistivity for fiber-reinforced coral aggregate concrete. Constr. Build. Mater. 2024, 414, 135011. [Google Scholar] [CrossRef]
  25. Wang, X.; Liu, F.; Pan, Z.; Chen, W.; Muhammad, F.; Zhang, B.; Li, L. Geopolymerization of coal gangue via alkali-activation: Dependence of mechanical properties on alkali activators. Buildings 2024, 14, 787. [Google Scholar] [CrossRef]
  26. Ma, H.; Zhu, H.; Chen, H.; Ni, Y.; Wang, T.; Yang, S. Effects and mechanisms of slag reinforced coal gangue geopolymers. IOP Conf. Ser. Mater. Sci. Eng. 2019, 474, 012040. [Google Scholar] [CrossRef]
  27. Sun, Q.; Wei, X.; Cai, R.; Li, D. Study on the Properties of Alkali-Excited Concrete Modified by Nano-SiO2 Based on Response Surface Methodology. Materials 2025, 18, 2292. [Google Scholar] [CrossRef]
  28. Song, B.; Huang, J.; Yang, M.; Zheng, M.; Yang, L.; Wang, F. Study on high supplementary cementitious materials content cement: Design and analysis based on response surface method. Constr. Build. Mater. 2025, 467, 140398. [Google Scholar] [CrossRef]
  29. Aghajanzadeh, I.; Ramezanianpour, A.M.; Amani, A.; Habibi, A. Mixture optimization of alkali activated slag concrete containing recycled concrete aggregates and silica fume using response surface method. Constr. Build. Mater. 2024, 425, 135928. [Google Scholar] [CrossRef]
  30. Jiang, M.; Qian, Y.; Sun, Q. Preparation of controlled low-strength materials from alkali-excited red mud-slag-iron tailings sand and a study of the reaction mechanism. Environ. Sci. Pollut. Res. 2023, 30, 22232–22248. [Google Scholar] [CrossRef] [PubMed]
  31. Wu, D.; Wang, J.; Miao, T.; Chen, K.; Zhang, Z. Performance optimization of FA-GGBS geopolymer based on response surface methodology. Polymers 2023, 15, 1881. [Google Scholar] [CrossRef]
  32. Song, H.; Nam, K. Development of a potassium-based soil washing solution using response surface methodology for efficient removal of cesium contamination in soil. Chemosphere 2023, 332, 138854. [Google Scholar] [CrossRef]
  33. Altawil, H.; Olgun, M. Optimization of mechanical properties of geopolymer mortar based on Class C fly ash and silica fume: A Taguchi method approach. Case Stud. Constr. Mater. 2025, 22, e04332. [Google Scholar] [CrossRef]
  34. Rattanasak, U.; Chindaprasirt, P. Influence of NaOH solution on the synthesis of fly ash geopolymer. Miner. Eng. 2009, 22, 1073–1078. [Google Scholar] [CrossRef]
  35. Ramalingam, M.; Mohan, P.; Kathirvel, P.; Murali, G. Flexural performance and microstructural studies of trough-shaped geopolymer ferrocement panels. Materials 2022, 15, 5477. [Google Scholar] [CrossRef]
  36. Bala, A.; Gupta, S.; Matsagar, D.C.P.V. Performance Evaluation of Recron Fibre and Glass Wool Fibre Reinforced Self-Compacting Mortar at Elevated Temperature: A comparative study. Results Eng. 2025, 27, 105778. [Google Scholar] [CrossRef]
  37. He, H.; Wang, Y.; Wang, J. Compactness and hardened properties of machine-made sand mortar with aggregate micro fines. Constr. Build. Mater. 2020, 250, 118828. [Google Scholar] [CrossRef]
  38. Jin, L.; Wang, Z.; Wu, T.; Liu, P.; Zhou, P.; Zhu, D.; Wang, X. Mesoscale-based mechanical parameters determination and compressive properties of fully recycled coarse aggregate concrete. J. Build. Eng. 2024, 90, 109366. [Google Scholar] [CrossRef]
  39. Cai, J.; Pan, J.; Li, X.; Tan, J.; Li, J. Electrical resistivity of fly ash and metakaolin based geopolymers. Constr. Build. Mater. 2020, 234, 117868. [Google Scholar] [CrossRef]
  40. GB/T 17671-2021; Test Method of Cement Mortar Strength (ISO Method). State Administration for Market Regulation, Standardization Administration of the People’s Republic of China: Beijing, China, 2021.
  41. Salim, M.U.; Moro, C. Towards sustainable construction: Performance evaluation of slag-cenosphere geopolymers under different NaOH concentrations. J. Build. Eng. 2024, 91, 109605. [Google Scholar] [CrossRef]
  42. Ameri, F.; Zareei, S.A.; Behforouz, B. Zero-cement vs. cementitious mortars: An experimental comparative study on engineering and environmental properties. J. Build. Eng. 2020, 32, 101620. [Google Scholar] [CrossRef]
  43. Liu, S.; Ge, Y.; Wu, M.; Xiao, H.; Kong, Y. Properties and road engineering application of carbon fiber modified-electrically conductive concrete. Struct. Concr. 2021, 22, 410–421. [Google Scholar] [CrossRef]
  44. Han, B.; Zhang, L.; Zhang, C.; Wang, Y.; Yu, X.; Ou, J. Reinforcement effect and mechanism of carbon fibers to mechanical and electrically conductive properties of cement-based materials. Constr. Build. Mater. 2016, 125, 479–489. [Google Scholar] [CrossRef]
  45. Li, H.; Wu, Y.; Zhou, A.; Zhao, C.; Deng, L.; Lu, F. Experimental study on self-healing performance of tunnel lining concrete based on response surface methodology. Constr. Build. Mater. 2024, 425, 136105. [Google Scholar] [CrossRef]
  46. Su, C.; Zhang, J.; Ding, Y. Research on reactivity evaluation and micro-mechanism of various solid waste powders for alkali-activated cementitious materials. Constr. Build. Mater. 2024, 411, 134374. [Google Scholar] [CrossRef]
  47. Xu, C.; Jing, H.; Liu, F.; Zhang, Z. The multi-objective optimization and mix parameter evaluation of one-part alkali-activated grouting material. J. Clean. Prod. 2024, 448, 141638. [Google Scholar] [CrossRef]
  48. Zha, W.; Lv, W.; Li, J.; Xu, T.; Yang, K.; Hua, X.; Chen, D. Optimized the performance of conductive mortar with hybrid fiber and steel-slag via RSM and MOPSO. Constr. Build. Mater. 2025, 459, 139776. [Google Scholar] [CrossRef]
  49. Nakkeeran, G.; Krishnaraj, L.; Bahrami, A.; Almujibah, H.; Panchal, H.; Zahra, M.M.A. Machine learning application to predict the mechanical properties of glass fiber mortar. Adv. Eng. Softw. 2023, 180, 103454. [Google Scholar] [CrossRef]
  50. Shah, S.A.R.; Kahla, N.B.; Atig, M.; Anwar, M.K.; Azab, M.; Mahmood, A. Optimization of fresh and mechanical properties of sustainable concrete composite containing ARGF and fly ash: An application of response surface methodology. Constr. Build. Mater. 2023, 362, 129722. [Google Scholar] [CrossRef]
  51. Wang, T.; Fan, X.; Gao, C. Development of high-strength geopolymer mortar based on fly ash-slag: Correlational analysis of microstructural and mechanical properties and environmental assessment. Constr. Build. Mater. 2024, 441, 137515. [Google Scholar] [CrossRef]
  52. Zhou, Z.; Xie, N.; Cheng, X.; Feng, L.; Hou, P.; Huang, S.; Zhou, Z. Electrical properties of low dosage carbon nanofiber/cement composite: Percolation behavior and polarization effect. Cem. Concr. Compos. 2020, 109, 103539. [Google Scholar] [CrossRef]
  53. Liu, J.; Xie, H.; Wang, C. Optimization of compressive strength and sound absorption of foamed gypsum-cement composites based on response surface methodology. Case Stud. Constr. Mater. 2025, 22, e04566. [Google Scholar] [CrossRef]
  54. Zhou, Y.; Yu, P.; Yang, H.; Xia, X.; He, S.; Huang, X. Utilization of municipal solid waste incinerator fly ash under high temperature sintering and alkali excitation for use in cementitious material. J. Build. Eng. 2024, 94, 110005. [Google Scholar] [CrossRef]
  55. Feng, X.; Yao, J.; Wu, P.; Zhang, S.; Sunahara, G.; Ni, W. Effect of water quenched silicomanganese slag as fine aggregate on mechanical properties and microstructure characteristics of solid waste-based mortar and concrete. J. Build. Eng. 2024, 88, 109115. [Google Scholar] [CrossRef]
  56. Wang, A.; Liu, P.; Mo, L.; Liu, K.; Ma, R.; Guan, Y.; Sun, D. Mechanism of thermal activation on granular coal gangue and its impact on the performance of cement mortars. J. Build. Eng. 2022, 45, 103616. [Google Scholar] [CrossRef]
  57. Li, A.; Wang, Y.; Zhang, S.; Niu, D.; Guo, B. Study on the mechanical and electrical conductivity properties of waste short carbon fibers concrete and the establishment of conductivity models. J. Build. Eng. 2024, 95, 110296. [Google Scholar] [CrossRef]
  58. Cui, Q.; Feng, Z.-g.; Shen, R.; Li, X.; Wang, Z.; Yao, D.; Li, X. Piezoresistive response of self-sensing asphalt concrete containing carbon fiber. Constr. Build. Mater. 2024, 426, 136121. [Google Scholar] [CrossRef]
  59. Chung, D. Electrically conductive cement-based materials. Adv. Cem. Res. 2004, 16, 167–176. [Google Scholar] [CrossRef]
  60. Aydın, S.; Baradan, B. The effect of fiber properties on high performance alkali-activated slag/silica fume mortars. Compos. Part B Eng. 2013, 45, 63–69. [Google Scholar] [CrossRef]
  61. Hu, S.; Wang, H.; Zhang, G.; Ding, Q. Bonding and abrasion resistance of geopolymeric repair material made with steel slag. Cem. Concr. Compos. 2008, 30, 239–244. [Google Scholar] [CrossRef]
  62. Wang, Y.; Chen, X.; Lu, H.; Xiao, R.; Hu, W.; Jiang, X.; Zhou, H.; Huang, B. Laboratory investigation on electrical and mechanical properties of asphalt mixtures for potential snow-melting and deicing pavements. Constr. Build. Mater. 2024, 413, 134901. [Google Scholar] [CrossRef]
  63. Çelikten, S.; Sarıdemir, M.; Deneme, İ.Ö. Mechanical and microstructural properties of alkali-activated slag and slag+ fly ash mortars exposed to high temperature. Constr. Build. Mater. 2019, 217, 50–61. [Google Scholar] [CrossRef]
  64. Yang, Y.; Zhang, J.; Fu, Y.; Long, W.; Dong, B. Synthesis of one-part geopolymers from alkaline-activated molybdenum tailings: Mechanical properties and microstructural evolution. J. Clean. Prod. 2024, 443, 141129. [Google Scholar] [CrossRef]
  65. Qing, L.; Shaokang, S.; Zhen, J.; Junxiang, W.; Xianjun, L. Effect of CaO on hydration properties of one-part alkali-activated material prepared from tailings through alkaline hydrothermal activation. Constr. Build. Mater. 2021, 308, 124931. [Google Scholar] [CrossRef]
  66. Zhang, D.; Shahin, M.A.; Yang, Y.; Liu, H.; Cheng, L. Effect of microbially induced calcite precipitation treatment on the bonding properties of steel fiber in ultra-high performance concrete. J. Build. Eng. 2022, 50, 104132. [Google Scholar] [CrossRef]
  67. Wang, Y.; Sun, L.; Li, A.; Li, W.; Guo, B. Effect of modified recycled carbon fibers on the conductivity of cement-based materials. Constr. Build. Mater. 2024, 415, 135033. [Google Scholar] [CrossRef]
  68. Sambucci, M.; Al-Noaimat, Y.A.; Nouri, S.M.; Chougan, M.; Ghaffar, S.H.; Valente, M. Influence of Nanoceramic-Plated Waste Carbon Fibers on Alkali-Activated Mortar Performance. Ceramics 2024, 7, 821–839. [Google Scholar] [CrossRef]
Figure 1. The apparent morphology of raw materials: (a) CG; (b) SG; (c) sodium silicate; (d) NaOH; (e) river sand; (f) CF.
Minerals 15 00787 g001
Figure 2. Particle size distribution of CG and SG.
Minerals 15 00787 g002
Figure 3. Mineral composition of CG and SG: (a) and (b) CG; (c) SG.
Minerals 15 00787 g003
Figure 4. Microstructure morphology of CG and SG: (a) CG; (b) SG.
Minerals 15 00787 g004
Figure 5. Diagram of the method for preparing AACGS.
Minerals 15 00787 g005
Figure 6. (a) Dimension of the specimen and electrode arrangement; (b) a schematic diagram of the conductivity test set-up.
Minerals 15 00787 g006
Figure 7. Comparison of predicted results and actual results: (a) compressive strength; (b) flexural strength; (c) resistivity.
Minerals 15 00787 g007
Figure 8. Response surface plots of compressive strength: (a,d) W and A; (b,e) S and A; (c,f) S and W.
Minerals 15 00787 g008
Figure 9. Response surface plots of flexural strength: (a,d) W and A; (b,e) S and A; (c,f) S and W.
Minerals 15 00787 g009
Figure 10. Response surface plots of resistivity: (a,d) W and A; (b,e) S and A; (c,f) S and W.
Minerals 15 00787 g010
Figure 11. Input variables and predicted results.
Minerals 15 00787 g011
Figure 12. The variation of properties of CF-AACGS/Cement with the change in CF content: (a) compressive strength; (b) flexural strength; (c) resistivity.
Minerals 15 00787 g012
Figure 13. X-ray diffraction patterns of AACGS.
Minerals 15 00787 g013
Figure 14. Morphological analysis with SEM-EDS: (a) microstructure; (b) EDS; (c) O; (d) Al; (e) Si; (f) Ca; (g) Na; (h) C.
Minerals 15 00787 g014
Figure 15. CF distribution in the AACGS: (a,b) Carbon fiber-matrix adhesion in AACGS; (c) original carbon fibers; (d) carbon fibers in AACGS; (e,f) failure mode of fibers.
Minerals 15 00787 g015
Figure 16. The distribution of carbon fibers in CC45 and CA45: (a,b): distribution of CF in CC45; (c,d) distribution of CF in CA45.
Minerals 15 00787 g016
Table 1. Main chemical composition of CG and SG (w, %).
MaterialsSiO2Al2O3CaOMgOSO3K2OFe2O3Na2OP2O5Others
CG56.2618.340.525.58--6.745.744.420.891.51
SG33.0615.0439.299.961.90--------0.75
Table 2. The size distribution of river sand.
Nominal Sieve Opening (mm)Percentage Retained on Sieve (%)Cumulative Percentage Retained (%)Percentage Passing (%)
4.750.00.0100.0
2.369.89.890.2
1.1820.430.269.8
0.6020.350.549.5
0.3029.079.520.5
0.1512.592.08.0
<0.158.0100.00.0
Table 3. Basic properties of river sand.
Fineness ModulusApparent Density (kg/m3)Packing Density (kg/m3)Water Absorption (%)Maximum Particle Size (mm)
2.62260214751.54.75
Table 4. Basic properties of CF.
Length (mm)Fiber Diameter (μm)Density (g·cm−3)Tensile Strength (GPa)Tensile Modulus of Elasticity (GPa)
6.007.001.764.12245.00
Table 5. Basic properties of cement.
Ignition Loss (%)Specific Surface (m2·kg−1)Setting Time (min)Compressive Strength (MPa)Flexural Strength (MPa)
InitialFinal3d28d3d28d
3.8936420225927.448.26.47.5
Table 6. Response surface experimental design.
FactorVariantUnitLevel
−101
Water-to-binder ratioW--0.450.500.55
Alkali equivalentA%10.012.014.0
Slag contentS%30.045.060.0
Table 7. Proportions of AACGS.
Specimen No.FactorMix Proportions of Mortar (kg·m−3)Consistence
(mm)
Water-to-Binder RatioAlkali Equivalent (%)Slag Content (%)CGSGWaterNaOHSodium SilicateSand
W50A12S450.5012.045.0322.3263.7139.043.4272.51758.0262
W55A10S450.5510.045.0322.3263.7193.836.3227.41758.0278
W45A12S600.4512.060.0234.4315.8109.743.4272.51758.0241
W50A12S450.5012.045.0322.3263.7139.043.4272.51758.0262
W55A12S300.5512.030.0410.2175.8168.343.4272.51758.0279
W50A12S450.5012.045.0322.3263.7139.043.4272.51758.0262
W50A10S600.5010.060.0234.4315.8164.536.3227.41758.0287
W45A12S300.4512.030.0410.2175.8109.743.4272.51758.0235
W55A14S450.5514.045.0322.3263.7142.550.4318.21758.0237
W55A12S600.5512.060.0234.4315.8168.343.4272.51758.0284
W45A10S450.4510.045.0322.3263.7135.236.3227.41758.0254
W50A14S300.5014.030.0410.2175.8113.250.4318.21758.0209
W50A10S300.5010.030.0410.2175.8164.536.3227.41758.0271
W50A14S600.5014.060.0234.4315.8113.250.4318.21758.0215
W50A12S450.5012.045.0322.3263.7139.043.4272.51758.0262
W45A14S450.4514.045.0322.3263.783.950.4318.21758.0195
Notes: The actual water used in the experiments included the water present in the sodium silicate solution.
Table 8. Summary of test results.
Specimen No.Water-to-Binder RatioAlkali Equivalent (%)Slag Content (%)Compressive Strength (MPa)Flexural Strength (MPa)Resistivity (Ω·m)
Average ValueStandard DeviationAverage ValueStandard DeviationAverage ValueStandard Deviation
W50A12S450.5012.045.067.91.497.10.3465.11.11
W55A10S450.5510.045.057.11.145.80.3067.31.57
W45A12S600.4512.060.083.61.838.10.3968.21.65
W50A12S450.5012.045.068.61.747.20.3665.31.66
W50A12S450.5012.045.068.71.657.10.2865.21.32
W55A12S300.5512.030.041.81.874.20.3462.31.39
W50A12S450.5012.045.069.81.497.20.2665.52.10
W50A10S600.5010.060.081.31.767.50.4470.21.82
W45A12S300.4512.030.052.31.955.10.2366.31.11
W55A14S450.5514.045.056.21.845.50.2659.91.57
W55A12S600.5512.060.073.41.597.50.2964.52.34
W45A10S450.4510.045.065.01.696.60.2171.62.00
W50A14S300.5014.030.045.21.064.30.2361.42.23
W50A10S300.5010.030.049.31.214.40.3569.21.49
W50A14S600.5014.060.080.11.567.10.3163.71.39
W50A12S450.5012.045.069.11.257.30.2765.42.63
W45A14S450.4514.045.065.91.426.70.2664.81.87
Table 9. ANOVA results for response surface model.
SourceCompressive Strength (Y1, MPa)Flexural Strength (Y2, MPa)Resistivity (Y3, Ω·m)
F-Valuep-ValueSig.F-Valuep-ValueSig.F-Valuep-ValueSig.
Model220.00<0.0001Y215.02<0.0001Y246.87<0.0001Y
W2.480.1359Y4.740.0660Y1536.69<0.0001Y
A148.20<0.0001Y118.44<0.0001Y540.35<0.0001Y
S1702.22<0.0001Y1439.06<0.0001Y103.600.2814Y
WA0.650.4451Y3.090.1220Y1.360.0393Y
WS1.700.2336Y1.740.2286Y6.390.5779Y
AS0.020.8965Y1.740.2286Y0.340.0008Y
W236.730.0005Y166.49<0.0001Y31.230.4509Y
A268.46<0.0001Y32.320.0007Y0.640.3516Y
S28.280.0237Y133.40<0.0001Y0.100.2814Y
Lack of fit4.590.0874N2.980.1597N4.830.0811N
Table 10. Statistical measures to check RSM model accuracy and validity.
ModelR2Adj. R2Pred. R2C.V. Value (%)Adep Precision
Y10.99650.99190.95511.7349.26
Y20.99640.99180.95841.7845.01
Y30.99690.99280.95960.3957.57
Table 11. Confirmatory test for the predicted results.
ResponsePredicted ResultExperimental ResultsDeviation (%)
Compressive strength (Y1, MPa)72.573.71.7
Flexural strength (Y2, MPa)7.07.22.9
Resistivity (Y3, Ω·m)62.461.61.3
Table 12. Proportions of CF-AACGS/cement (kg·m−3).
Specimen No.CFCementCGSGNaOHSodium SilicateWaterSand
CA00--249.1336.956.6252.0174.01758.0
CA152.6--249.1336.956.6252.0174.01758.0
CA305.2--249.1336.956.6252.0174.01758.0
CA457.8--249.1336.956.6252.0174.01758.0
CA6010.5--249.1336.956.6252.0174.01758.0
CC00586.0--------316.41758.0
CC152.6586.0--------316.41758.0
CC305.2586.0--------316.41758.0
CC457.8586.0--------316.41758.0
CC6010.5586.0--------316.41758.0
Disclaimer/Publisher’s Note: The statements, opinions and data contained in all publications are solely those of the individual author(s) and contributor(s) and not of MDPI and/or the editor(s). MDPI and/or the editor(s) disclaim responsibility for any injury to people or property resulting from any ideas, methods, instructions or products referred to in the content.

